Article

The Impact of Supply Voltage Waveform Distortion on Non-Intentional Emission in the Frequency Range 2–150 kHz: An Experimental Study with Power-Line Communication and Selected End-User Equipment

1
Faculty of Electrical Engineering, Wroclaw University of Science and Technology, 50-370 Wrocław, Poland
2
TAURON Dystrybucja Pomiary Ltd., 33-100 Tarnow, Poland
*
Author to whom correspondence should be addressed.
Energies 2021, 14(3), 777; https://doi.org/10.3390/en14030777
Submission received: 28 December 2020 / Revised: 19 January 2021 / Accepted: 26 January 2021 / Published: 2 February 2021
(This article belongs to the Special Issue Machine Learning and Data Mining Applications in Power Systems)

Abstract

:
Knowledge of the conducted emissions in the frequency range 2–150 kHz contains some gaps related to the impact of the harmonics in the supply voltage on the nature of these emissions. It can be noticed that the conducted emissions from non-sinusoidal power supplies have not been studied sufficiently, and that the impact of this distortion may be greater than the generally known results of emission tests carried out under standardized test conditions. This paper is aimed at investigating experimental cases of the influence of supply voltage waveform distortion on non-intentional emission in the range 2–150 kHz and the efficiency of power line communication based on selected PRIME (PoweRline Intelligent Metering Evolution) power line communication (PLC) technology. A series of experimental laboratory studies were investigated, representing the operation of the investigated PLC system with different types of end-user equipment (LED—Light Emitting Diode, CFL—Compact Fluorescent Lamp, induction motor with frequency converter) working under a distorted supply voltage condition obtained by the programmable power supply for different scenarios of the admissible harmonics contribution in the range 0–2 kHz. The scenarios included limits defined in standards EN 50160 and IEC 61000-4-13. The researchers used spectral analysis with a notation to emission limits, compatibility levels, and mains signalling, as well as statistics of the PLC communication. The obtained results provide important conclusions, which may be applied both in the development of the design of the appliances in question and the higher frequency emission testing methods.

1. Introduction

Smart meters, which are now present in the majority of households in Europe, often use power line communication (PLC) over the low-voltage (LV) grid. In countries belonging to the European Union countries, 123 million electricity meters are read remotely using PLC transmission, which accounts for 43 percent of all meters installed in the member states. The most advanced in implementing smart metering are the Swedes, who have already replaced 100% of their meters with smart meters, Finns (99.8%), Estonians (98.9%), Italians (98.5% of ~37 million meters) and the Spanish (93.8% of ~28 million meters) [1]. Given that the member states will continue to update the installation of the smart meter in line with their new planning and target periods (see Figure 1), it is estimated that 223 million meters (77%) will be remotely read by 2024, and 266 million meters by 2030 (92%).
From the point of view of signal categorisation occurring in power networks, power line communication (hereinafter PLC transmission) is treated as mains signalling and is considered as intentional emission in the frequency range 2(3)–148.5 kHz [2,3]. However, intentional emission in LV networks is accompanied by the phenomenon of non-intentional emission, which is a growing problem in the operation of smart metering systems based on PLC transmission. All European Union (EU) members stated that, despite the formal separation of a dedicated 3–95 kHz frequency band for the transmission of metering data in low-voltage power networks, the phenomenon of harmful non-intentional emission in this band is increasing. This issue is confirmed by the experiences of power system operators and from many publications all over the world.
Several main issues have been formulated at this time, including:
  • Classification and identification of supraharmonics, signalling on low-voltage electrical installations in the frequency range 2(3) kHz to 148.5 kHz [2,3,4,5,6,7,8].
  • Accurate assessment of waveform distortion in the presence of supraharmonics [9,10,11,12,13,14,15].
  • Source of non-intentional emissions and propagation of supraharmonics, interaction between devices [16,17,18,19,20].
  • Potential problems with communication via the power grid [1,20,21,22,23,24,25].
The analysis of big data from smart electricity meters can contribute to significant results in terms of grid management. There are many alternative approaches to analysing data from such systems [26]. In the advanced analysis of the collected measurement data, there is potential for:
  • Improving the security of the system by increasing its observability.
  • The use of demand side management (DSM) tools, which is carried out by dynamic billing of electricity consumers and prosumers.
  • Forecasting the amount of energy released to the grid by micro-installations.
The primary motivation for this work is the relatively small number of research studies concerning the influence of power supply conditions on supraharmonics emissions. The direction of the investigation was formulated on the basis of observation of the different levels of non-intentional emission generated by the same class of devices in a different node of the low-voltage network, which may be characterized by the respective quality of the voltage or impedance condition. This study led to the formulation of two hypotheses: (a) the non-intentional emission generated by particular devices may depend on the condition of the supply voltage; and (b) non-intentional emission generated by particular devices may depend on the impedances of the supplying circuits in the point of the connection. This paper is focused on the first hypothesis related to voltage supply waveform distortion. Designated research directions can be initially confirmed by the results of similar investigations related to harmonic current emissions (0–2 kHz) under the flat-top supply waveform distortion [27], or detected differences in the performance between compact fluorescent lamps (CFLs) and light emitting diode (LED) light sources under different voltage distortions [17], as well as the effect of supply voltage harmonics on the input current of a single-phase diode bridge rectifier load [28]. However, although the above-mentioned works highlight the issue of harmonic current emissions, they do not provide information about emissions in the range of higher frequencies up to 150 kHz, nor do they express the influence of the supply voltage distortion on mains signalling (usually expressed in dBµV). The unit decibel microvolt (dBµV) is directly associated with volt (V) as twenty decimal logarithms of volt divided by one microvolt. Since the subject of the research is the phenomenon of primary emission, the observation results can be expressed in volts or dBµV. It might be interpreted as a coupling coefficient in the point of the connection as a result of current emission flowing by the network impedances.
Technical measures to improve transmission—that are more software-based than hardware-based—should also be considered. It is worth paying attention to the context of using machine learning techniques to solve data transmission problems. For example, in [29], the authors designed the mechanism based on the matching rule, and further traffic collision avoidance, channel occupancy, power consumption, and delay in wireless networks.
This paper aims to extend the current state-of-the-art by investigating experimental cases of the influence of supply voltage waveform distortion on non-intentional emission in the range 2–150 kHz and the efficiency of selected power line communication systems. In order to achieve the proposed aim, in Section 2, the gap in the current studies related to the influence of the supply voltage distortion on supraharmonics emission and efficiency of power line communications is identified. Furthermore, in order to characterize the background of the investigation, a critical review of the emission limits, compatibility levels, and immunity tests for conducted disturbances and mains signalling in the frequency range 2–150 kHz was performed. Section 3 describes in detail the laboratory setup implemented for the experimental studies including electrical connections, the performance of programmable alternating current (AC) supply, selected devices, applied power-line communication technology as well as measurement setup for supraharmonics. Additionally, the software for frequency spectrum analysis is described in relation to current testing and measurement techniques. Section 4 presents a collection of the experimental results. First, the methodology of the investigation is presented and then the set of results of non-intentional emission for a different range of supply waveform distortion and different end-user equipment in the presence of selected power-line communications is analysed. The results describe the spectra of intentional and non-intentional emissions and the evaluation of the quality of operation of the PRIME PLC system. Distorted supply voltage conditions consist of different scenarios of the admissible harmonics contribution, in the range 0–2 kHz, including limits defined in standards EN 50160:2010 [3] and IEC 61000-4-13 [30]. Section 5 highlights crucial results and constitutes elements of the discussion.

2. Literature Review

2.1. Gap in the Research Related to Influence of Supply Voltage Distortion on Supraharmonics Emission

The phenomenon of electromagnetic emission occurring in the frequency range 2–150 kHz was termed “supraharmonics” in the literature (hereinafter SH) [2,3,4,5,6,7,8]. The lower limit of the SH range (2 kHz) is taken as the upper limit of traditional energy quality standards covering emission up to 40th harmonic order. The upper limit of the SH (150 kHz) range is the lower limit of the electromagnetic compatibility (EMC). This division indicates that there is an area of insufficiently regulated standards. Hence, several standardisation committees are currently working on a description of emission and immunity limits and methods for emission testing in this frequency range.
The scientific reports on the SH problem show that there are three lines of research in this area. The first concerns research into the impact of emissions generated by different types of loads on the level of current emissions [8,22,25], which should be considered as primary emissions. This group of research provides an overview of the types of noises that affect smart metering using power line communications, including noises coming from common electronic devices (compact fluorescent lamp (CFL) and light emitting diode (LED) light sources) and noises coming from photovoltaic inverters or electric vehicle charging spots, measured in a controlled environment. The previously mentioned studies, however, ignore the secondary emission in load currents, which is understood as the part of the current of a tested load that does not originate from its primary emission, but is transferred through parallel connections from another load. In order to describe the primary and secondary emission, a simplified model in a system of two loads is presented in Figure 2. Load 1 is represented by a constant current source Ih1 and impedance z1. The primary emission from load 1 is denoted as I1. Impedances z1 and z2 are the internal impedances of load 1 and 2 respectively, and zg is the network impedance. The primary emission (I1) flows partially into the grid and partially through the impedance of load 2. Thus, the total emission of load 2 consists of its primary emission I2 superimposed on the secondary emission caused by load 1 (I1,2). Described relations are true, assuming the sinusoidal rated voltage. In practice, such conditions are hard to achieve.
It is worth noting that, in [24], the authors noticed the influence of harmonics on the operating of electrical energy meters in a network with nonlinear loads. It is shown that electronic static meters of active energy are tested in the presence of distortions, and electronic static meters of reactive energy accuracy requirements do not take into account the possible presence of harmonics.
The second line of research focuses on the so-called resultant emission of loads, resulting from the simultaneous primary emission of multiple appliances connected to the same subnetwork. In paper [16], among others, the authors presented interesting results of research on the effect of gradual incorporating of 1, 10, and 48 compact fluorescent lamps into one connection point, which shows that the level of current emission at the connection point does not increase linearly with the growth of loads of the same type. The authors observed the effect of decreasing the share of low frequencies 0–2 kHz in the total current while increasing the number of fluorescent lamps. It was observed that in the case of SH emissions above 2 kHz, some frequency components of currents close through input circuits of adjacent loads and some frequency components of currents close through supply circuits and neutral wires. However, these tests also ignore the issue of low-frequency emissions from the distorted supply voltage.
In turn, in article [24], the authors outlined the third line of considerations. Based on tests carried out with the use of LED light sources and compact fluorescent lamps, the authors confirmed that the share of non-intentional emission introduced into the network by these loads might be greater than the results of emission tests carried out under the conditions of emission tests of loads following EN 61000-3-2 standard. Although the authors observed emission in the frequency band 2–40 kHz, it should be assumed that this phenomenon might also apply to other frequency ranges.
In each of the three lines of the problem consideration presented above, it can be shown that the aspect of the harmonic content in the supply voltage, in the range 0–2 kHz, as the potential origin of the increased level of non-intentional emission of the electrical devices, in the range 2–150 kHz, has not been (as of yet) sufficiently investigated. Many works investigate the impact of selected supply voltage parameters on current harmonics up to 2 kHz. Many works also present current supraharmonic emissions of different electrical devices, but are usually investigated under sinusoidal supply voltage. This work is focused on the non-intentional emission of the selected electrical devices under non-sinusoidal supply voltage conditions and their impact on power line communications.
In [27,31], authors attempted to assess the influence of the voltage curve distortion in the form of a flattening of the peak of a sine wave, which corresponds to an increase in the harmonic content factor. The authors of these works, using the example of lighting devices, assessed the harmonic content during parallel operating the devices. The authors demonstrated, among other findings, that new electronic equipment based on active power factor correction (PFC) shows a qualitatively different dependence of harmonic emissions on the degree of distortion (flattening) of the supply voltage concerning loads without PFC.
The influence of voltage distortion on the differences in work efficiency between compact fluorescent lamps (CFL) and light emitting diode (LED) light sources in the low and high-frequency range was described in [17]. The tests were carried out for three scenarios: sinusoidal voltage, flat-top distorted voltage (total harmonic distortion in voltage THDV about 3%), and pointed-top distorted voltage (overswing) (THDV about 4% in accordance with IEC 61000-4-13), which were used to power a group of 142 lamps manufactured in 2009–2016 (69 CFL sources and 73 LED sources). These lamps worked in various ranges of rated power (CFL range up to 46 W, LED range up to 17 W).
A frequent phenomenon is also the secondary emission of the load, which is understood as the part of the current of the tested load that is not derived from its primary emission, but is transferred by parallel connections from another load. The research results presented in [9,17,18,21] indicate that, due to the use of various input systems of loads, including EMC filters, and due to the phenomenon of secondary emission from the parallel operation of loads, the share of higher frequencies in the supply current at the point of common coupling (PCC) point might be smaller than would result from the emission of individual loads. It has been observed that in the case of supraharmonic emissions above 2 kHz, some frequency components of the currents are closed by the input circuits of neighbouring loads and some of the frequency components of the currents are closed by the supply and neutral circuits. The issue of secondary emission is also present in the considerations concerning the influence of loads’ operation on the narrowband PLC transmission. In [23], authors indicate selected disturbances originating from loads connected to the LV network, which may affect the transmission efficiency in the range of 0–2 kHz and 2–150 kHz. The frequency range of these disturbances coincides with the PLC transmission frequencies; as a result, the useful signal of PLC transmission is “covered” by the spectrum of unintentional disturbances.
The authors of [17] also analysed the operation of light sources in the band above 2 kHz. The analyses were performed in three frequency sub-ranges: 9–30 kHz, 30–95 kHz, and 95–150 kHz. Tests of a representative set of lamps, both compact fluorescent lamps and LED lamps, showed clear differences in the current emission not only between the two types of lamps, but also between lamps within the same type. The discussed results indicate the influence of the quality of the supply voltage on the content of higher frequencies in the current of LED lamps in the wide 30–95 kHz range, used by some narrowband and broadband PLC technologies. Hence, the conclusion that in the case of operation of these loads in conditions of supply other than sinusoidal, the share of unintentional disturbances introduced to the network by these loads may be greater than the results of emissivity obtained during standardized tests.
This paper presents the results of the research devoted to the issue of the impact of harmonic content in the supply voltage, or more generally, the degree of distortion of the supply voltage waveform on non-intentional emission in the 2–150 kHz band by loads, which, according to literature, are responsible for most of the emission of the intentional PLC transmission. The methodology of the investigation is aimed to cover two issues: characterisation of the non-intentional emission under the different quality of the supply voltage as well as the assessment of its influence on continuity of the transmission in the selected PLC system.

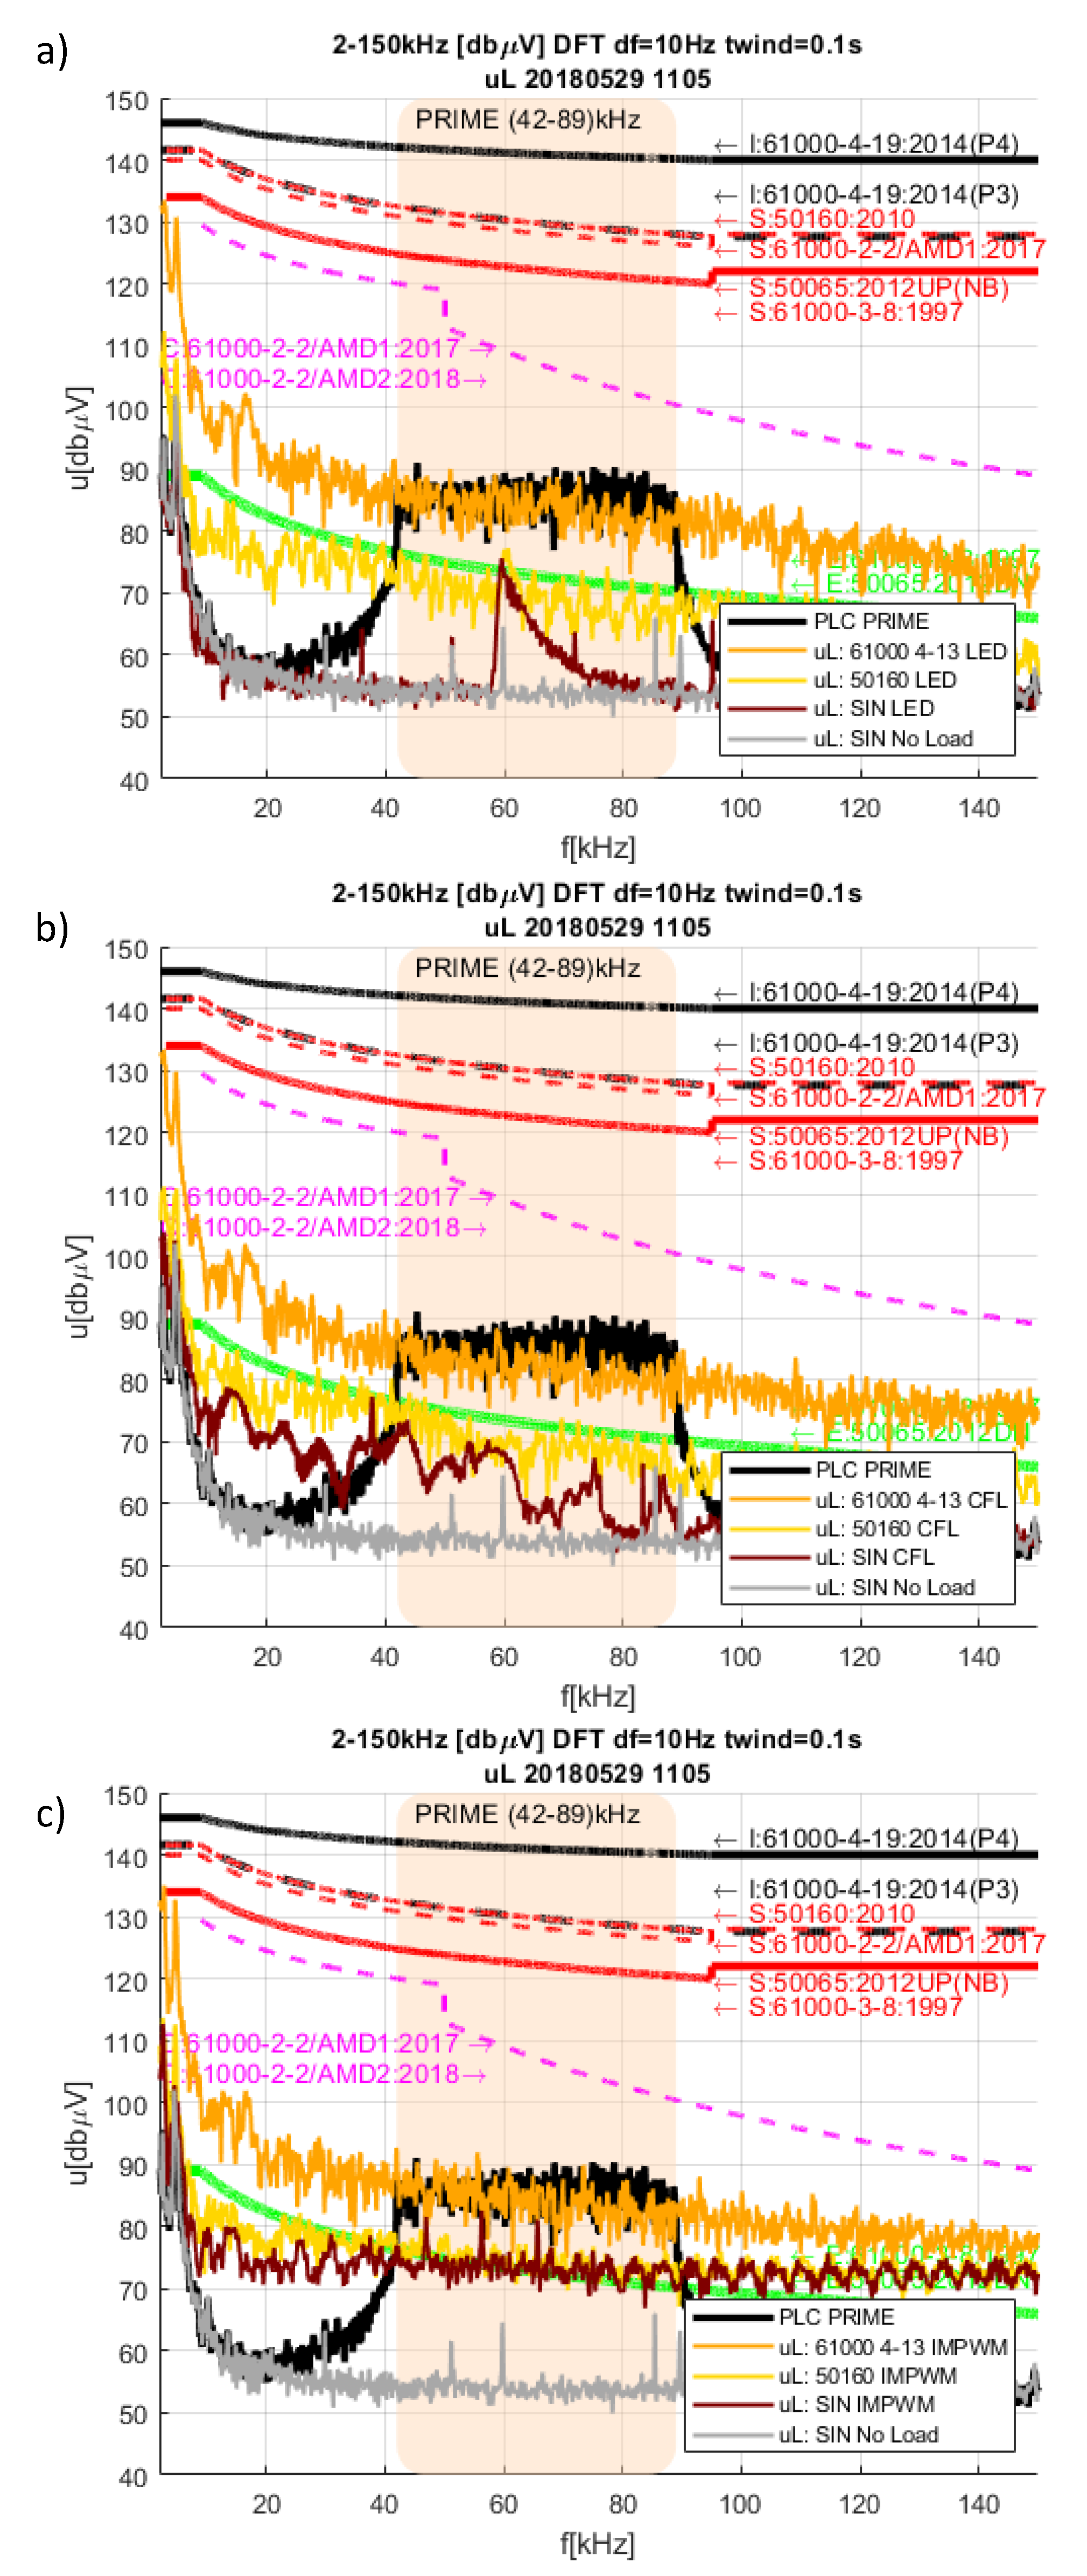
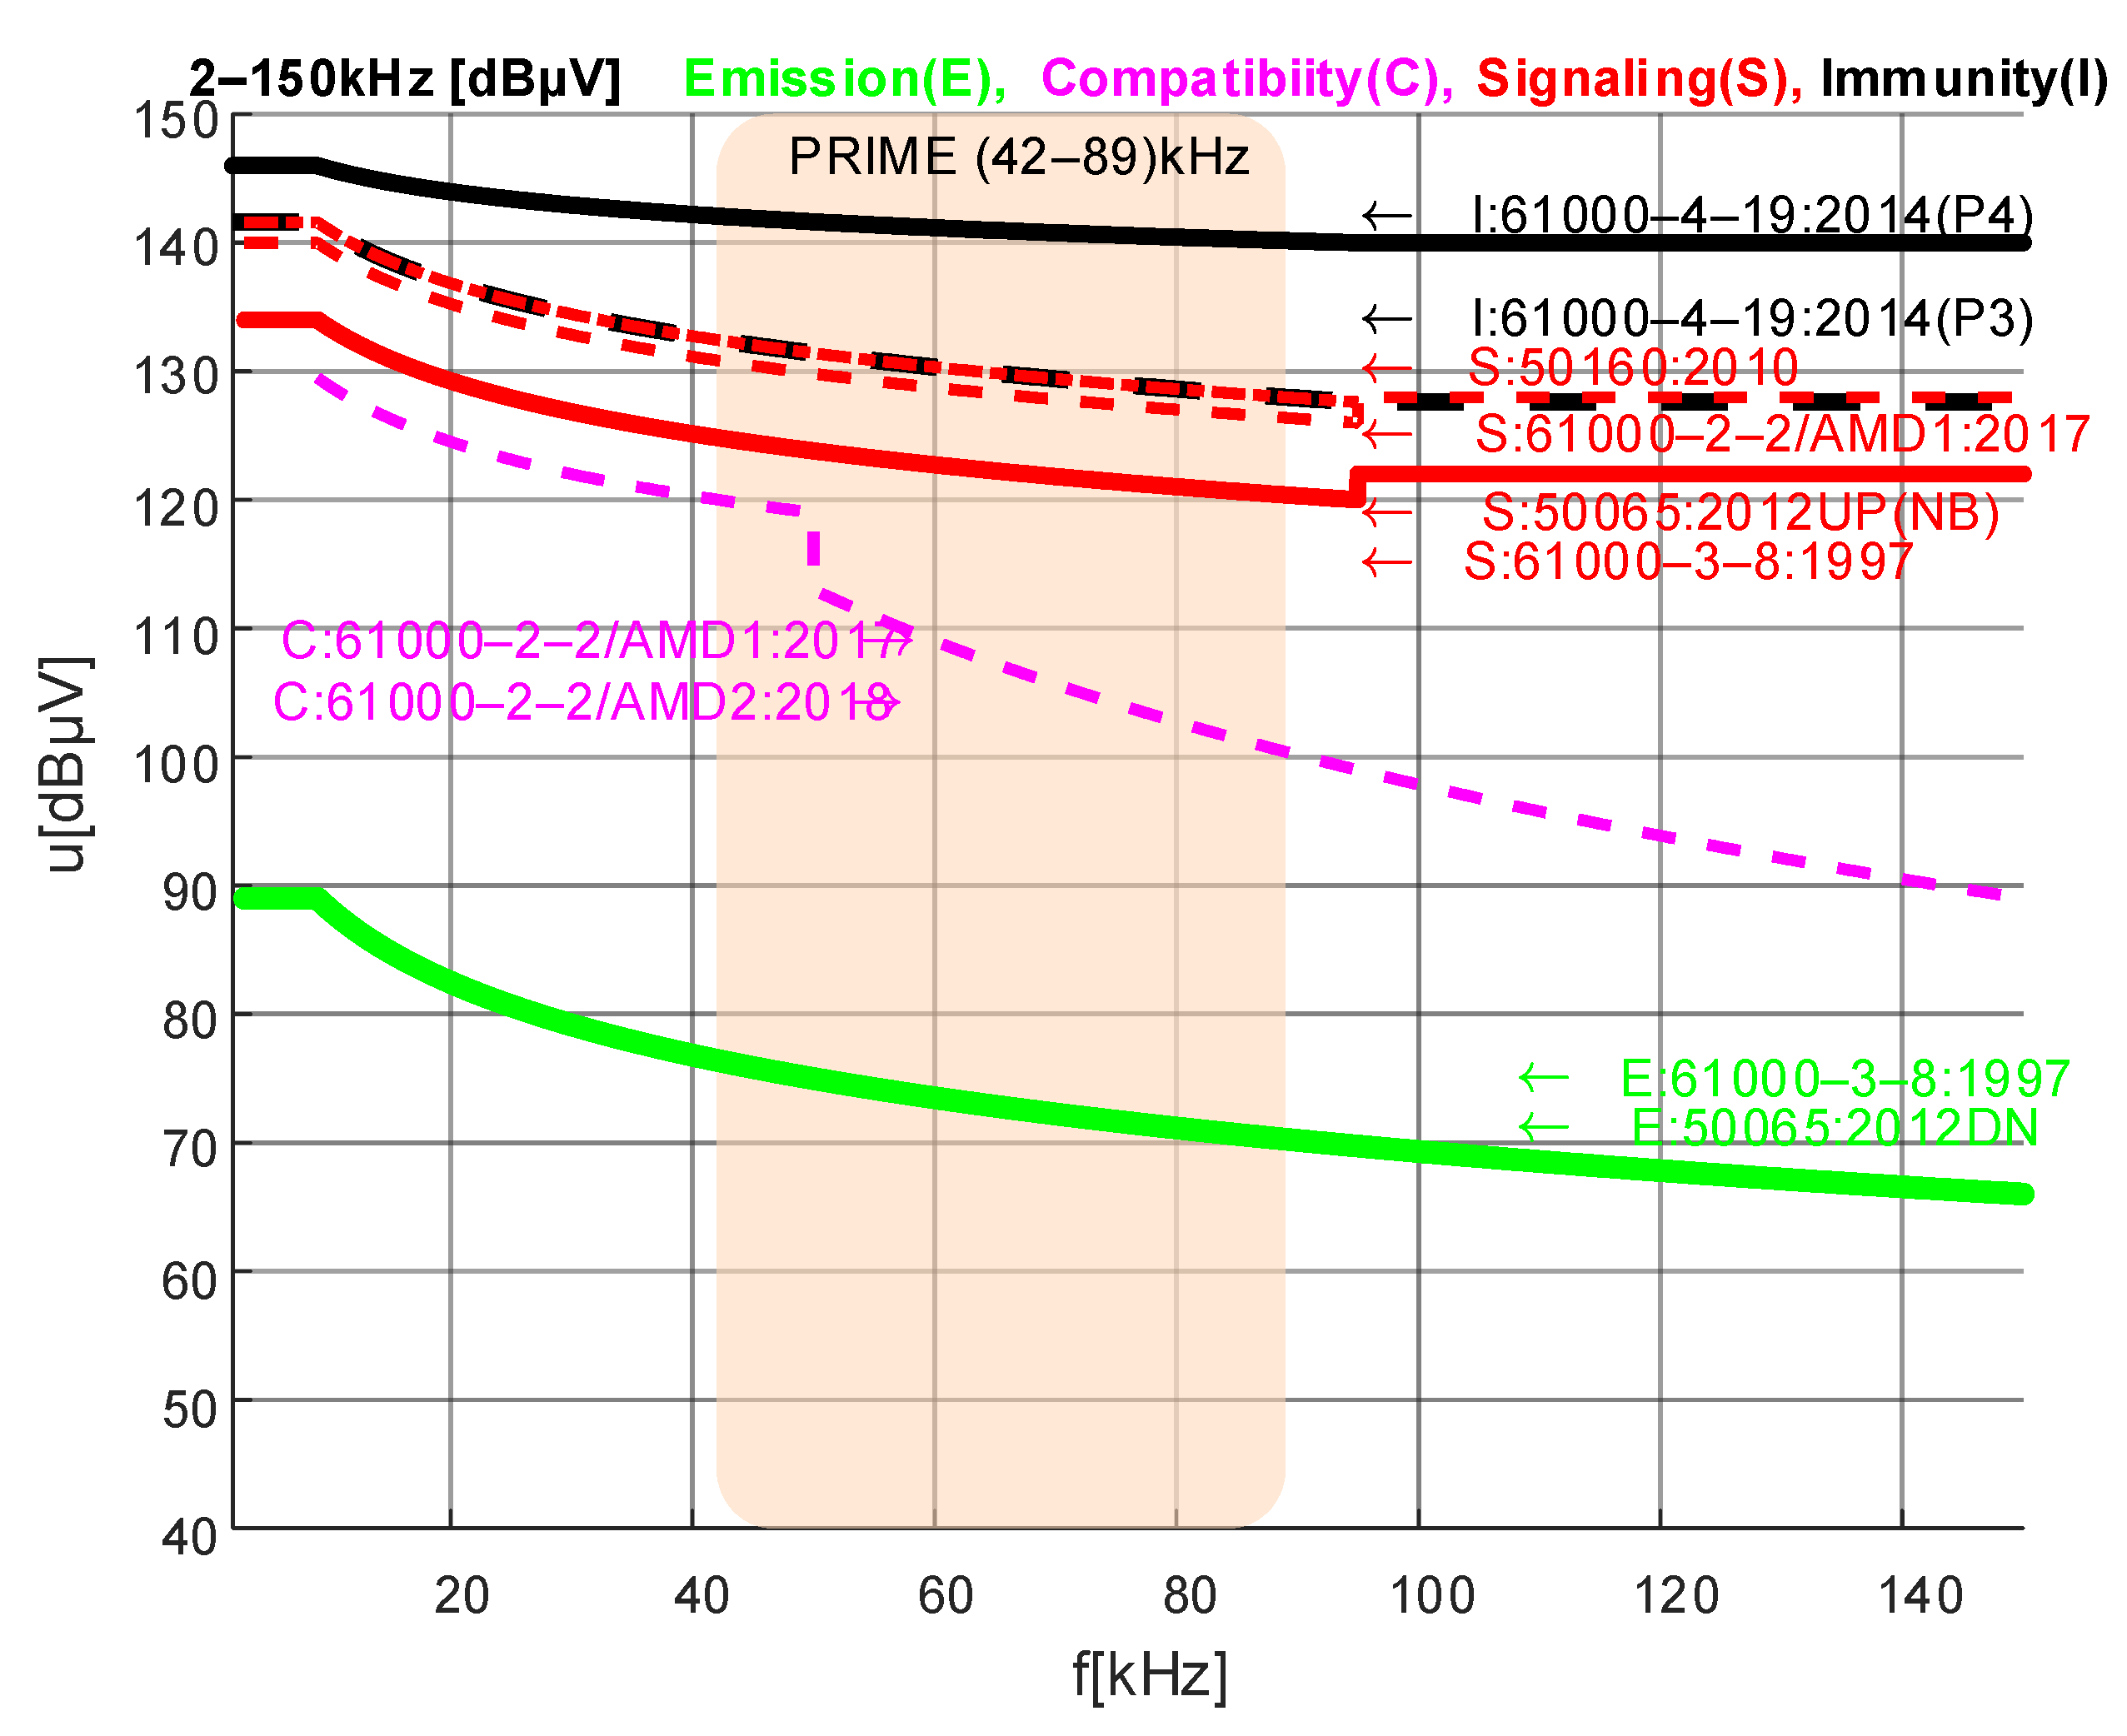
2.2. The Background of the Investigations—Identification of the Emission Limits, Compatibility Levels, and Immunity Levels for Conducted Disturbances and Signalling in the Frequency Range 2–150 kHz

Due to the manner of interaction between the transmission systems (intentional emission, mains signalling) and the power grid including loads (non-intentional emission), it is worth analysing the contents of the standards in terms of permissible levels relating to:
  • Levels of non-intentional emission referring to individual equipment and the power grid (non-intentional emission).
  • Compatibility levels in the power grids (compatibility levels, environment characteristics).
  • Intentional emission (transmission levels and mains signalling).
  • Immunity test levels.
For this reason, in Figure 3, several characteristics in the range 2–150 kHz were collected. Presented curves express limits defined in applicable standards. Details of selected standards are given in the legend of the figure. The prominent curve is related to intentional emission (i.e., mains signalling and power-line communication denoted in the figure by the lines described using the letter “S”) and non-intentional emission (i.e., network distortions, denoted in the figure by the line described using the letter “E”). Additionally the compatibility level in an electrical network is also represented (denoted in the figure, using letter “C”). The boundary conditions are represented by the curve related to the immunity test of the communication systems in the range 2–150 kHz (denoted in the figure by the line described using the letter “I”). Additionally, the figure shows the frequency area 42–89 kHz, which represents the PRIME broadband power-line communication technology used in the research.
Legend of the curves in Figure 3:
Non-intentional emission referring to IEC 61000-3-8:1997 [4] adopted in the standard for PLC transmission EN 50065:2012 [2]—it can be treated as background emission, potentially affecting the communication by the power grid (solid line, green colour, letter “E”).
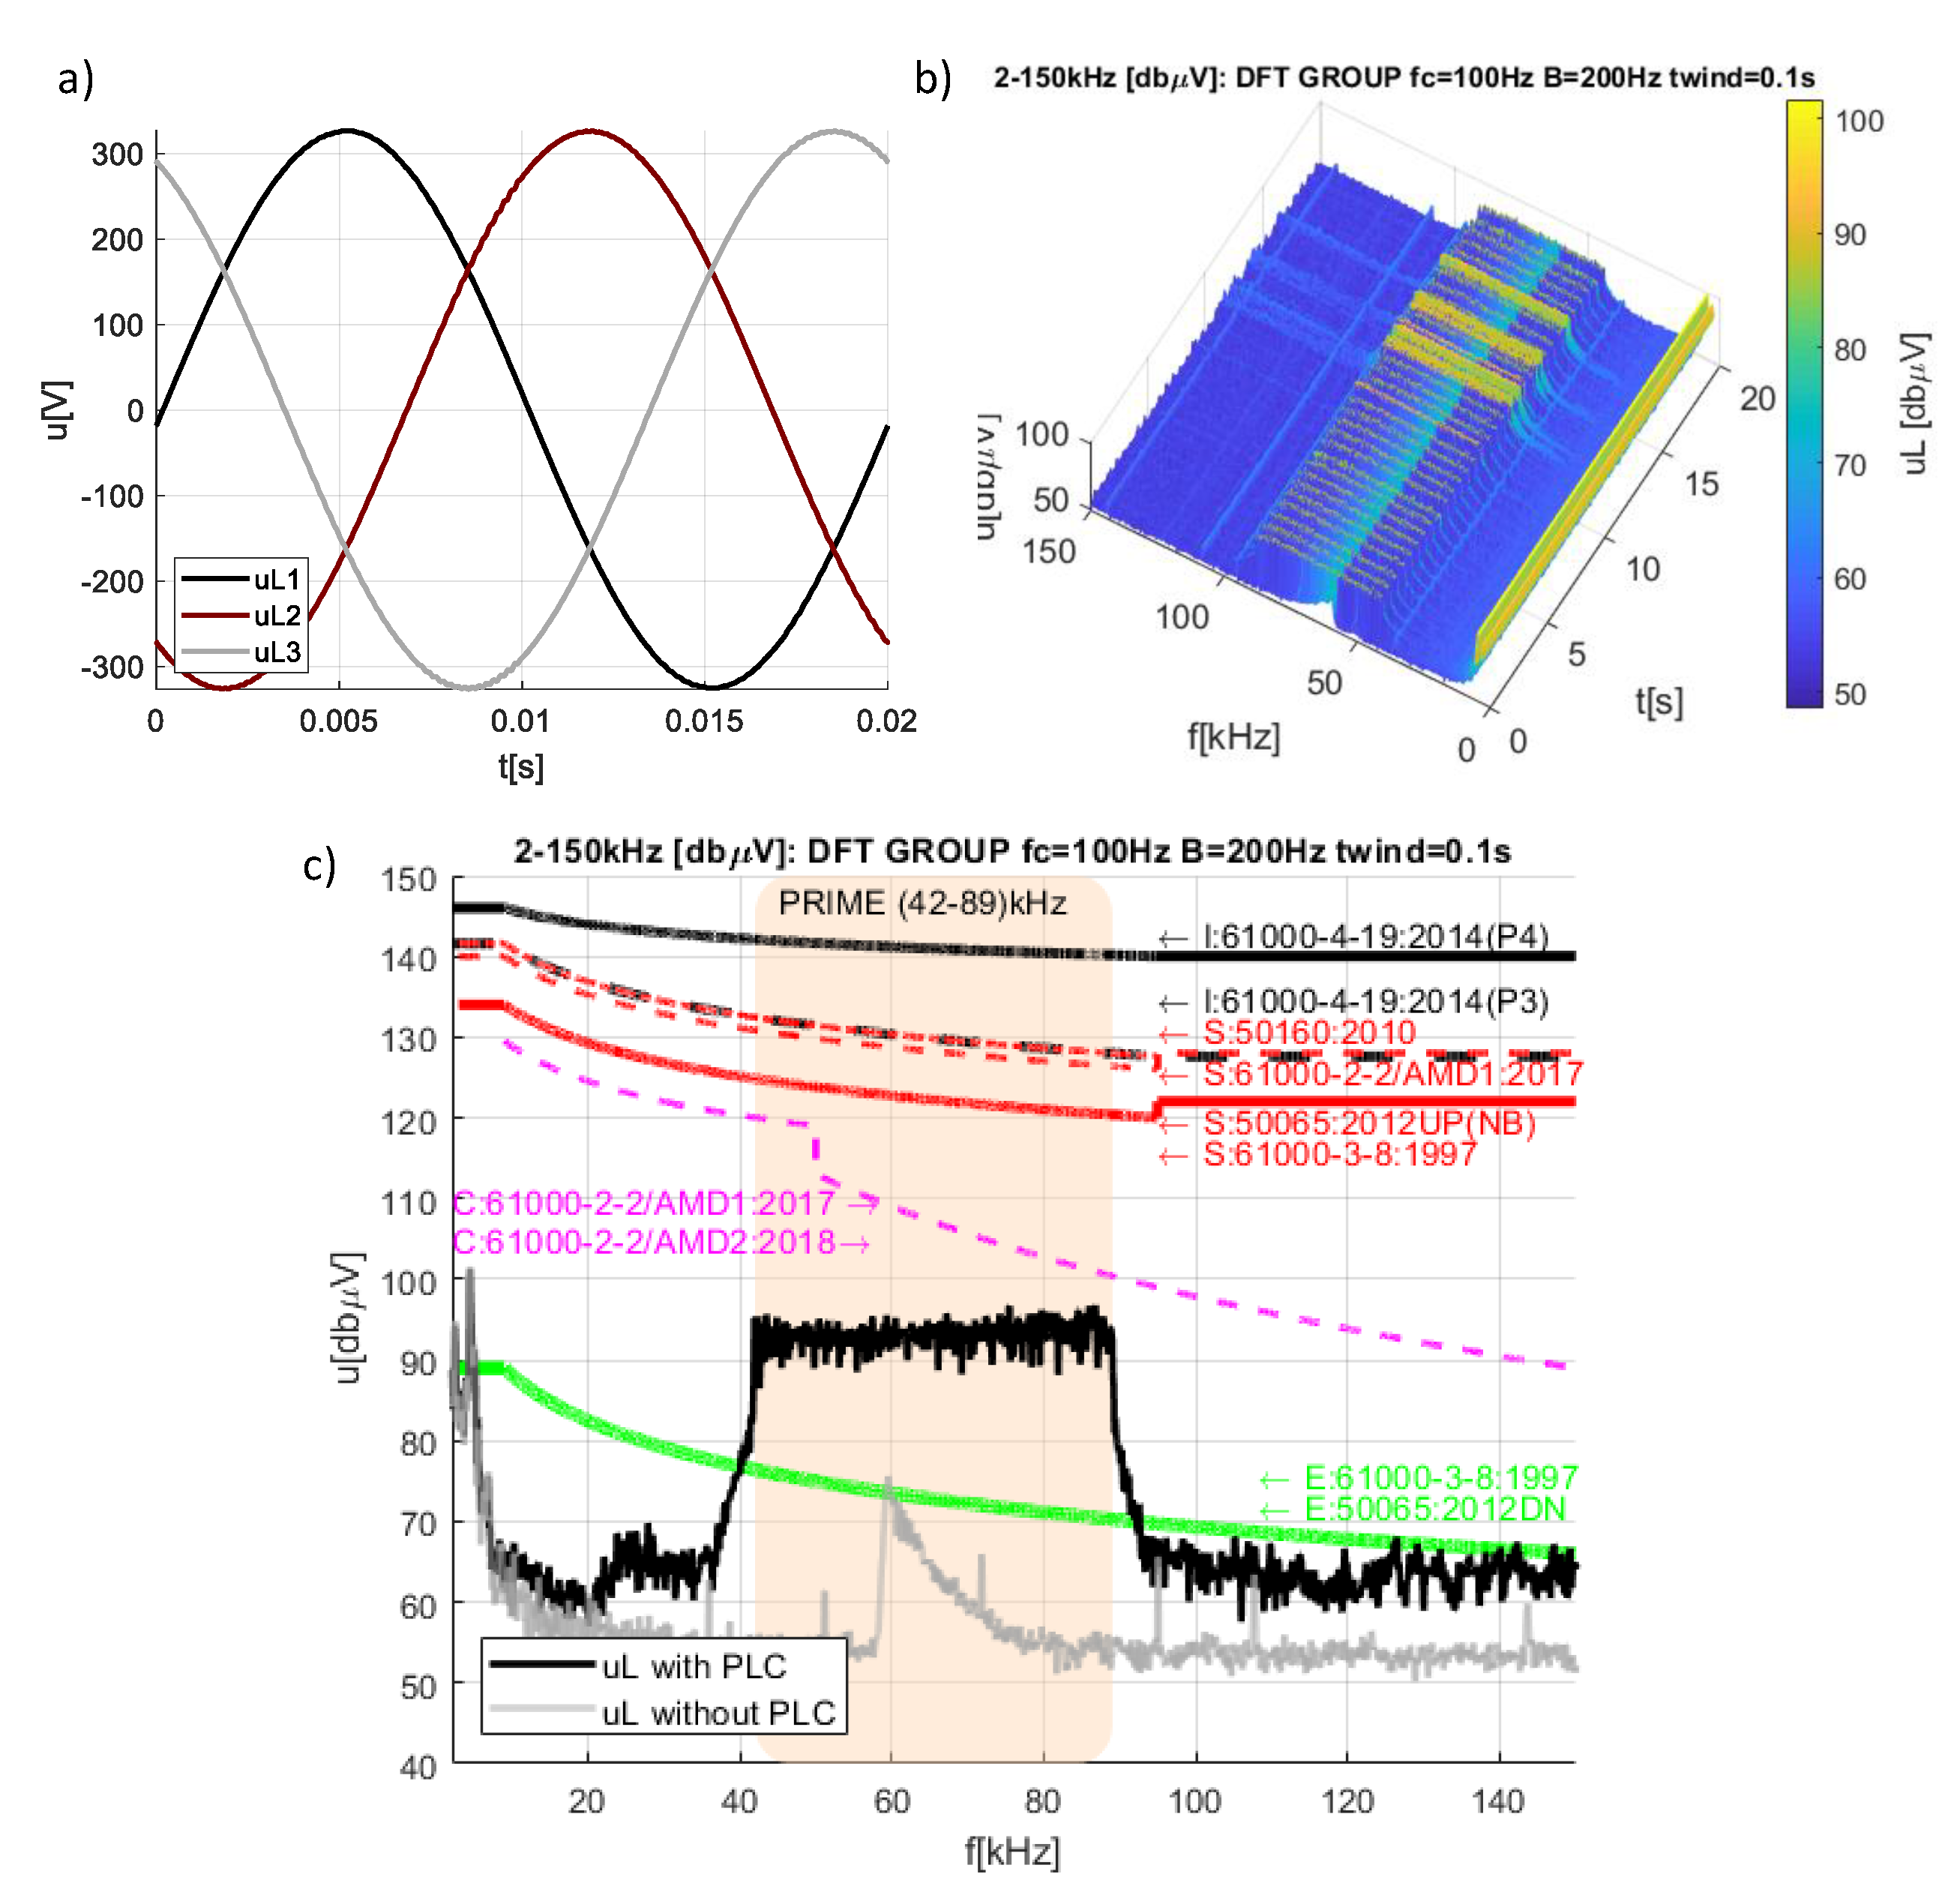
  • Compatibility levels referring to IEC 61000-2-2: AMD1:2017 [5] and AMD2:2018 (dashed line, pink colour, letter “C”).
  • Permissible level of intentional emission, mains signalling, referring to IEC 61000-3-8:1997 [4] interpreted as the permissible level of transmission in power line communication systems adopted in EN 50065:2012 [2] (solid line, red colour, letter “S”).
  • Permissible level of intentional emission, mains signalling, referring to IEC 61000-2-2: AMD1:2017 [5] (dashed line, red colour, letter “S”) and referring to EN 50160:2012 [3] (dashed-dot line, red colour, letter “S”).
  • Levels of tests for immunity to conducted, differential mode disturbances, and signalling in the frequency range 2 kHz to 150 kHz at AC power ports referring to PN–EN 61000-4–19:2014 [6] (solid line, black colour, notation “P4”—test level with the reference to environment class 4: severe industrial environment; dashed line, colour black—notation “P3”—test level with the reference to environment class 3: typical residential, commercial, and light industrial environment).

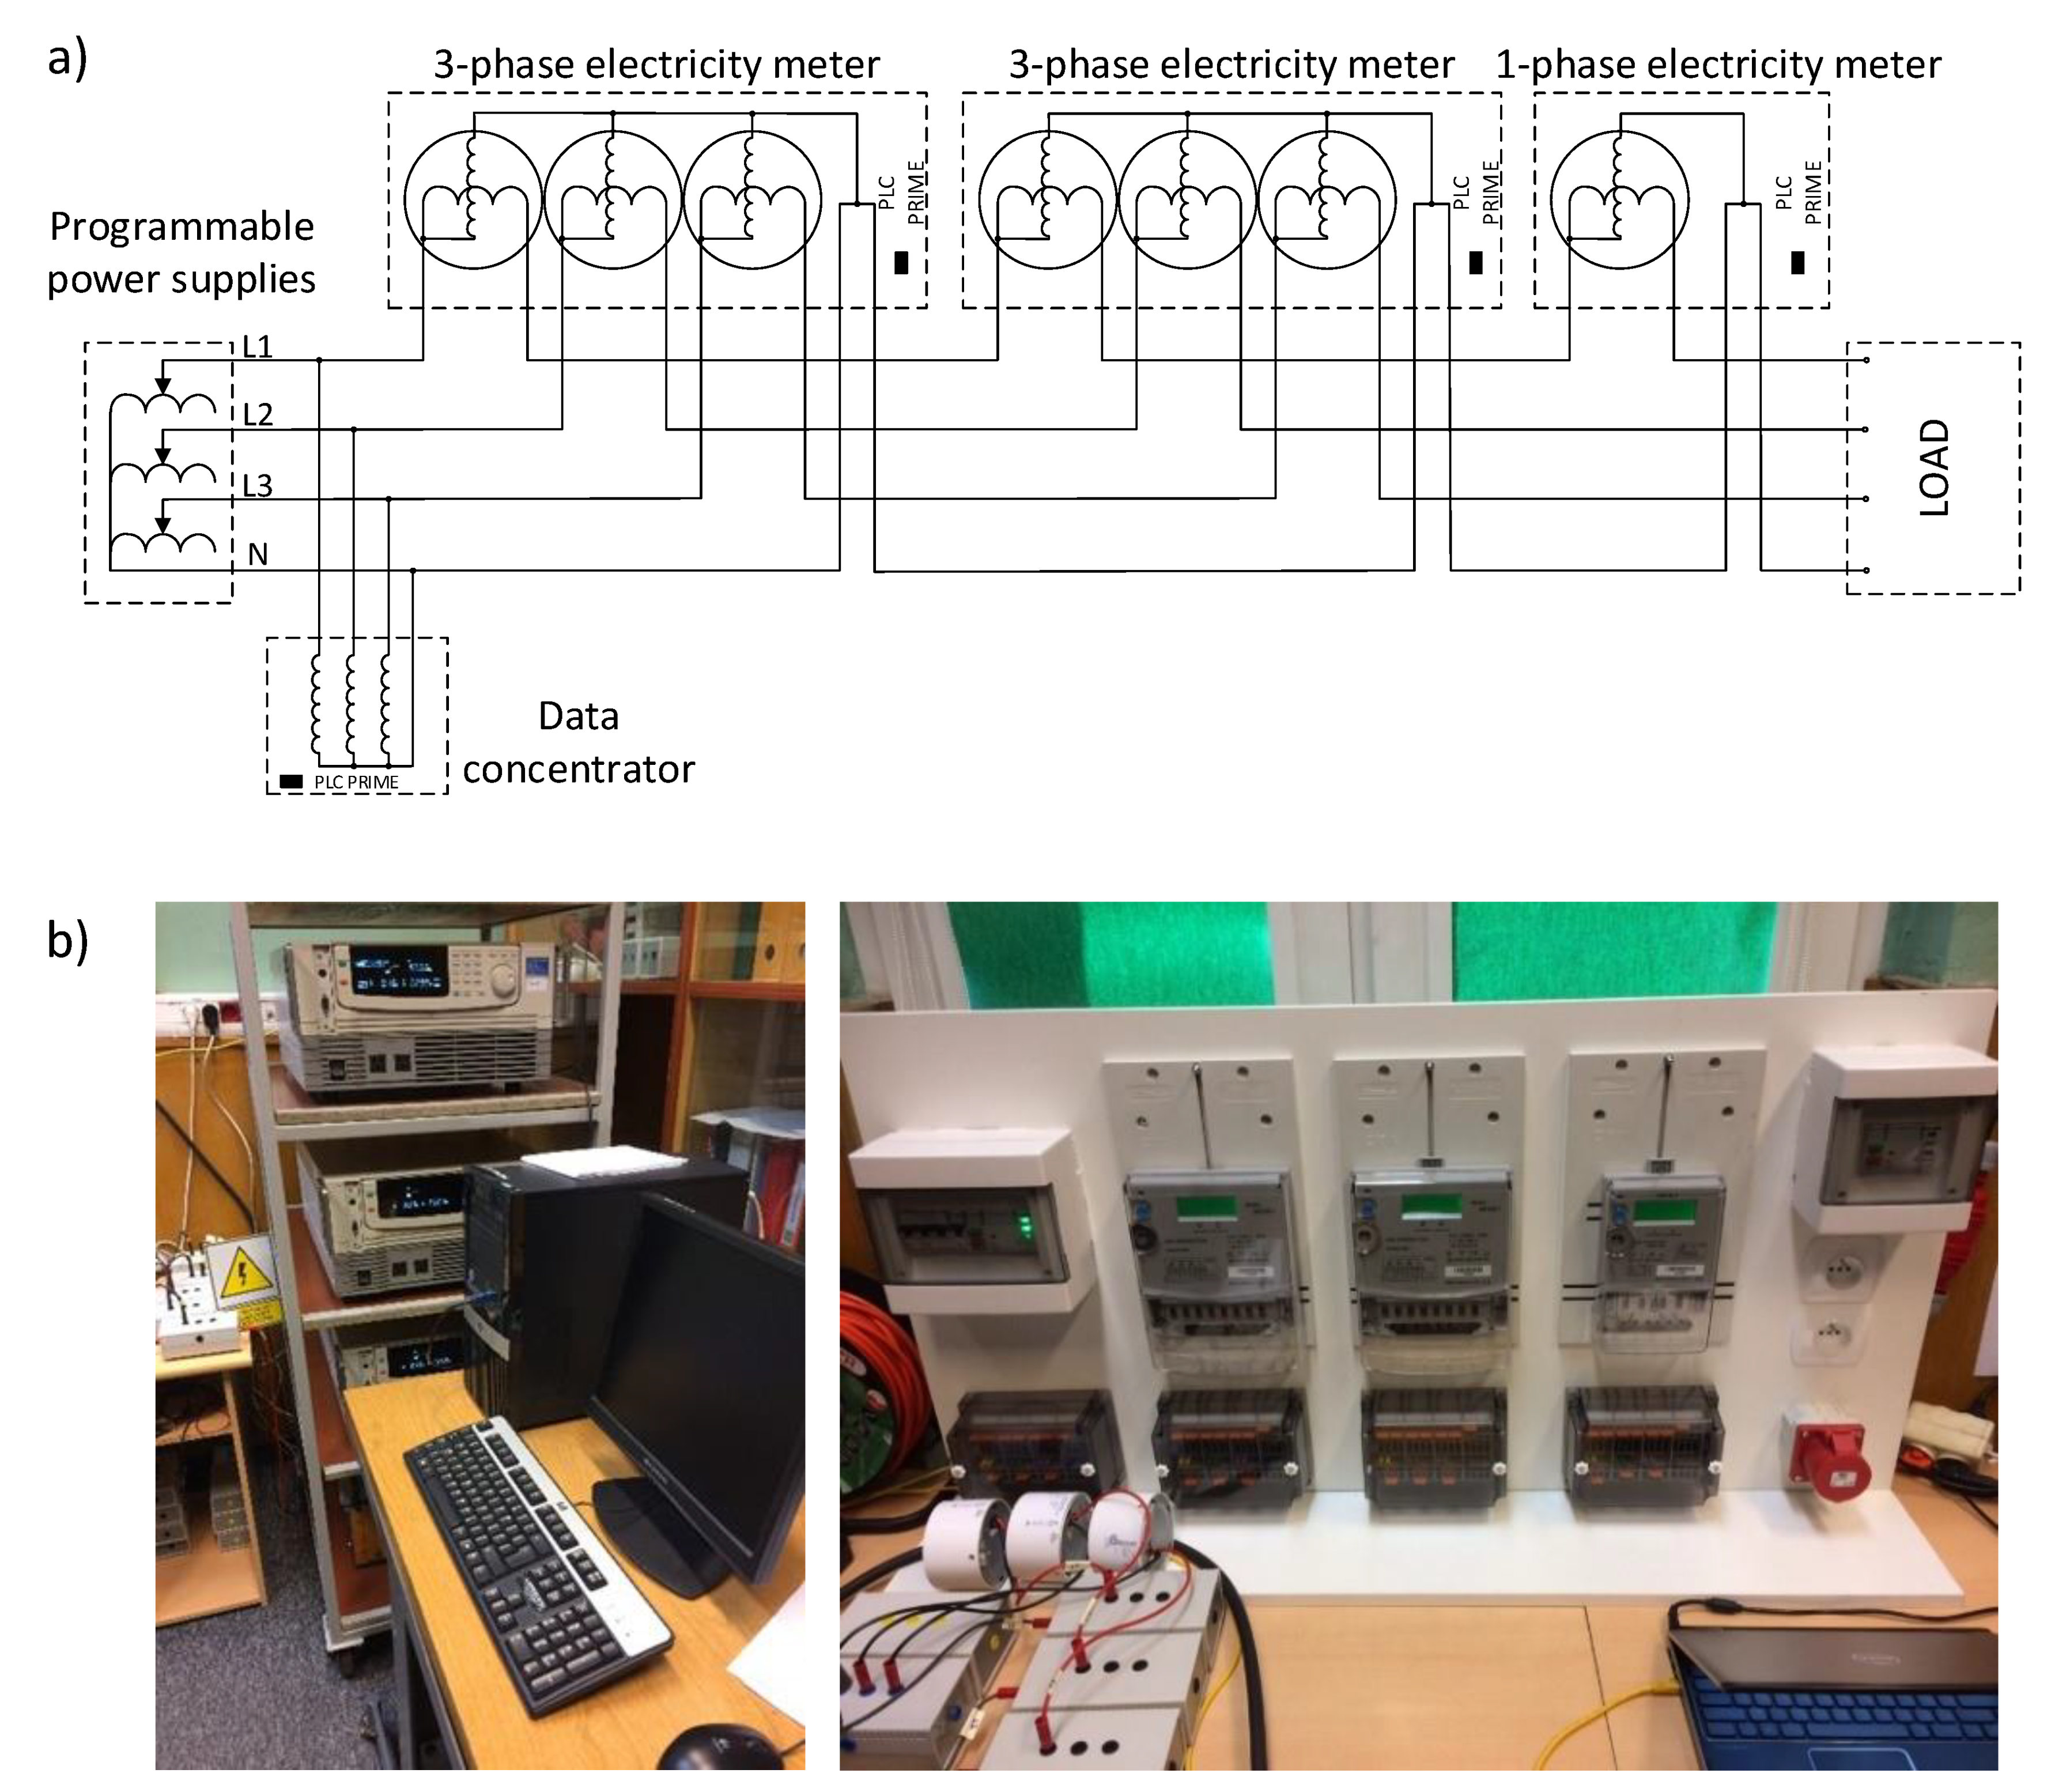
3. Characteristic of the Laboratory Hardware and Software Setup

The laboratory setup for the analysis of the direct impact of harmonic content in the supply voltage on the emission of supraharmonics consists of three 3-phase programmable power supplies KIKUSUI PCR500LA [32], which, together with the standardised reference impedances (for the phase wire zA = (0.24 + j0.15) Ω and the neutral wire zN = (0.16 + j0.1) Ω) formed the equivalent of a standard low-voltage grid connection point (Figure 4a). The reference impedances follow the standard IEC 61000-3-3 [33] and are recommended to realize the equivalent of the power grid used in the calculation and measurement of the directly measured parameters of voltage changes, voltage fluctuations, and flicker. The materials used in constructions of the impedances preserve the reference value of the impedances in a 50Hz system with a nominal current up to 5A. The operation of power supplies in the three-phase source mode was obtained using 3P03-PCR-LA three-phase output driver cards [34]. The programmable power supplies were controlled by the Quick Immunity Sequencer [35] installed on a PC that was used to define power supply voltage waveform and subsequent test series. Communication between PC and the programmable AC supply used general purpose interface bus (GPIB interface IB03-PCR-LA) [36]. Using the authorised software different scenarios were created for the input signal with pre-sets of harmonics contribution in the range 0–2 kHz. This application realized communication with the programmable power supply and configuration sets for the harmonics contribution in the supply voltage. It used a waveform bank and the sequence operation function, which is responsible for transfer, execution, and output control of the waveform. In this paper, some selected pre-sets of harmonic contributions were considered: (a) pure sinusoid, (b) limits of harmonics in the low-voltage public network formulated in EN 50160:2010 [3], (c) low-frequency immunity test levels of the equipment defined in IEC 61000-4-13 [30]. These pre-sets were defined in the waveform bank.
The PLC transmission was provided by a compact model containing three electricity meters equipped with PRIME PLC communication modules (two 3-phase and one 1-phase meter) and a data concentrator working in the same technology. PRIME is a specification for narrowband power line communication. The PRIME physical layer is based on Orthogonal Frequency Division Multiplexing (OFDM). The transmission band is 42–89 kHz. In the course of individual research steps, using functions and reports implemented in the PLC concentrator software, the statistics of PLC transmission between the concentrator and the meters were observed and recorded. The view of the constructed laboratory setup is presented in (Figure 4b).
In terms of information and communication technologies, the test stand was separate, both physically and logically, local area network (LAN) computer network connecting computers (in this case, meters, concentrator and the controlling computer). The functional diagram of the test stand as a local area network (LAN) is presented in Figure 5.
The recording of measurement data was carried out by the authorised university hardware setup based on National Instrument cRIO technology (Figure 6). In detail, the voltage measurement acquisition is realized by National Instrument C series ±10V voltage input module with 1 MS/s sampling rate and 16-Bit resolution [37]. In order to adapt the range of the measured voltage to the voltage input module a voltage transducer provided by Life Energy Motion Company (LEM) model CV 3-1000 was implemented with a voltage ratio of 1000:10 and frequency bandwidth to 500 kHz [38]. The obtained measurement setup allows recording simultaneously four voltage and four current waveforms with a maximum frequency of 1 MHz per channel. The investigations were focused on voltage measurements. For the measurements in the frequency range 2–150 kHz, the voltage units (instead of volts) are expressed in dBµV. Thanks to the use of cables between the concentrator and individual meters, with a cross-section of 2.5 mm2 and their small length (1–2 m), the impact of power supply cables on the attenuation of the PLC signal in the voltage line should be considered insignificant. The accuracy of measurements was validated using commercial spectrum analysers used in the power line communication investigation: MFA 500 Spectrum Analyser 3–500 kHz by Swemet [39] and USB-SA44B Spectrum Analyser 1 Hz–4.4 GHz by Signal Hound [40]. The validation was mainly based on the comparison of the spectrum of the simultaneously recorded signal. The frequencies and magnitudes of spectrum components were compared. The obtained results were comparable. The advantage of using an authorized solution based on the cRIO platform is the open possibility to define the acquisition process e.g., time recording of the waveform.
Specification of the hardware components of the laboratory test circuits is collected in Table 1.
Recently, a wide discussion has taken place in literature referring to the measurements method for the frequency range 2–150 kHz [9,12,13]. Some consideration is also provided by the informative annex in IEC 61000-4-30 [15]. One of the suggested approaches is to implement a discrete Fourier transform (DFT) defined in IEC 61000-4-7 [14] for the frequency range of 2 kHz and extend it above 2 kHz. Traditionally DFT implementation uses a rectangle data acquisition window with a width of 200 ms, corresponding to approximately 10 (12) periods of power system frequency 50 Hz (60 Hz). Consequently, spectrum resolution is 5 Hz. Before 2009, the informative annex of this standard suggested implementation of DFT in the range 2–9 kHz using DFT technique with 10 Hz resolution, realized by a time windowed signal with a window width equals to 100 ms. The current form of the annex recommends preserving 5 Hz spectrum resolution also in the range 2–9 kHz, obtained by using a 200 ms window. Additionally, a grouping concept is also proposed. For the frequency range 2–9 kHz, it is realized using 200 Hz band centred at frequencies being a multiplication of 100 Hz. The first group is centred at 2100 Hz. The grouped spectrum has a final resolution of 100 Hz.
The intentional transmission signal used by the power line communication systems has usually time-variant nature. The narrow or broadband signals are transmitted in time packages. In order to investigate the coexistence of these time-variant spectrum components and non-intentional emission of the equipment, the short-Fourier transform (STFT) in the range 2–150 kHz was implemented. The rectangle data acquisition window without overlapping was used. The window width was 100 ms and the DFT output was grouped using a 200 Hz band centralized at frequencies being a multiplication of 100 Hz starting from 2000 Hz. The selection of the shorter window width was dictated by two conditions. First, the time resolution of the STFT is enhanced by using a short window. Second, one of the commercial spectrum analyser used for the validation used a 10 Hz resolution spectrum. Additionally, the inherent effect of short window width is smoothed by grouping concept with 100 Hz resolution. The recording time was 20 s. Therefore, it was possible to observe changes in the spectrum and capture the voltage spectra on the load both with and with communication represented by intentional emission in the 42–89 kHz frequency band used by the PRIME PLC system.
A set of loads representing end-user equipment was based on:
  • LED light sources (the three-phase circuit was made using three single-phase LED with a power of 8 W connected in a star, the LED have implemented active power factor correction by an active power filter (APF) in order to keep cosφ = 0.9).
  • CFL compact fluorescent lamps (the three-phase circuit was made of three single-phase compact fluorescent lamps with the power of 11 W, 18 W and 20 W connected in a star).
  • Three-phase asynchronous induction motor 300 W/400 V/50 Hz rated speed 1390 rpm, powered by a single-phase frequency converter with input voltage 230 V, output voltage 3 × 230 V, power 400 W.

4. Results of an Experimental Study with Power-Line Communication and Selected End-User Equipment

In the conducted experiments, the waveform of supply voltage was shaped by the superposition of harmonics with set amplitudes. Using programmable power supplies and dedicated software, the supply voltage was shaped in three scenarios as follows:
  • Supply voltage scenario 1: pure sinusoidal voltage.
  • Supply voltage scenario 2: distorted voltage with harmonics according to permissible limits for public networks defined in EN 50160 [3].
  • Supply voltage scenario 3: distorted voltage with harmonics used for immunity tests of load according to IEC 61000-4-13 [30]—equipment with the third class of immunity.
Selected harmonics contributions represent margin waveform distortion. The total harmonic distortion index (THD) achieved as a sum of permissible harmonics levels defined in EN 50160 equals 11.62%; however, the normal operating condition of the public grid is usually 2–8%.The study aimed to assess the impact of supply voltage distortion on the operation of a commercial PRIME PLC system with the simultaneous presence of non-intentional emission generated by the loads. In point of the load contribution, several load conditions were considered:
  • Load condition 0: no load.
  • Load condition 1: LED light source.
  • Load condition 2: compact fluorescent lamp (CFL) light source.
  • Load condition 3: induction motor powered by a frequency converter.
The PRIME PLC system is based on recommendation G.9904 [41,42]. The technology represents narrowband orthogonal frequency division multiplexing power line communication that uses 97 subcarriers, 96 of which are used for data transmission, where: first carrier frequency is 41.99 kHz (41,992.18750 Hz), last carrier frequency is 88.87 kHz (88,867.18750 Hz), the distance between carriers—0.488 kHz (488.28125 Hz). For each scenario of the supply waveform distortion and each group of loads, the investigation cases were performed in order to express the variability of non-intentional emission affecting intentional emission of the PRIME PLC transmission system. First, characteristic spectra of the background signal and the transmission signal obtained among 20 s of the STFT observation were compared with the normative curves identified in Section 2.2 referring to standards [2,3,4,5,6]. Second, selected spectrum signal parameters were derived. Over the given frequency interval in the frequency range of the investigated PRIME PLC system, a single local maximum magnitude of a frequency component of the background signal was identified. It can be treated as a maximum noise contribution (Nmax). Then, corresponding to the Nmax a magnitude of the transmission signal (S(Nmax)) related to Nmax was selected. The parameters are used to derive a local signal-to-noise ratio (SNRlocal), which expresses the local minimum SNR in the transmission band due to reference to the maximum noise frequency component:
S N R l o c a l [ d B ] = 20 l o g S ( N m a x ) [ V ] N m a x [ V ] = 20 l o g S ( N m a x ) [ V ] 20 l o g N max [ V ] = S ( N m a x ) [ d B ] N max [ d B ] = S ( N m a x ) [ d B µ V ] N max [ d B µ V ]
Additionally, the classical signal-to-noise ratio in the full frequency range of the PRIME PLC band (SNRband) was calculated using the power of the transmission signal (Psingal) and power of the background signal (Pnoise) calculated based on M frequency components belonging to the transmission band:
S N R b a n d [ d B ] = 10 l o g P s i g n a l P n o i s e = 10 l o g 1 M m = 1 M s m [ V ] 2 1 M m = 1 M N m [ V ] 2 = P s i g n a l [ d B ] P n o i s e [ d B ]
Proposed parametrization using the local and broadband SNR aims to represent the variability of transmission conditions in the transmission band.
In order to extend the assessment of the communication conditions, the communication statistics were also analysed, considering the intensification of the connection attempts. In detail, for particular scenarios of the investigation, the statistics were monitored based on the total number of the connections, the number of failed connections, the number of successful connections, and the duration of failed connections in one hour. The statistics represent 2 h of continuous work of the PLC system. The data were reported using a dedicated ADDAX software solution for residential metering [43]. Following interpretations of the connection statistics may be defined:
  • Increasing the number of attempted connections is the preventive action of the PLC system to keep the transmission successful and can be interpreted as a symptom of deteriorated transmission condition.
  • Percentage contribution of the number of failed connections is not directly representative quantity indicating the deterioration of the transmission condition due to increasing number of attempted connections.
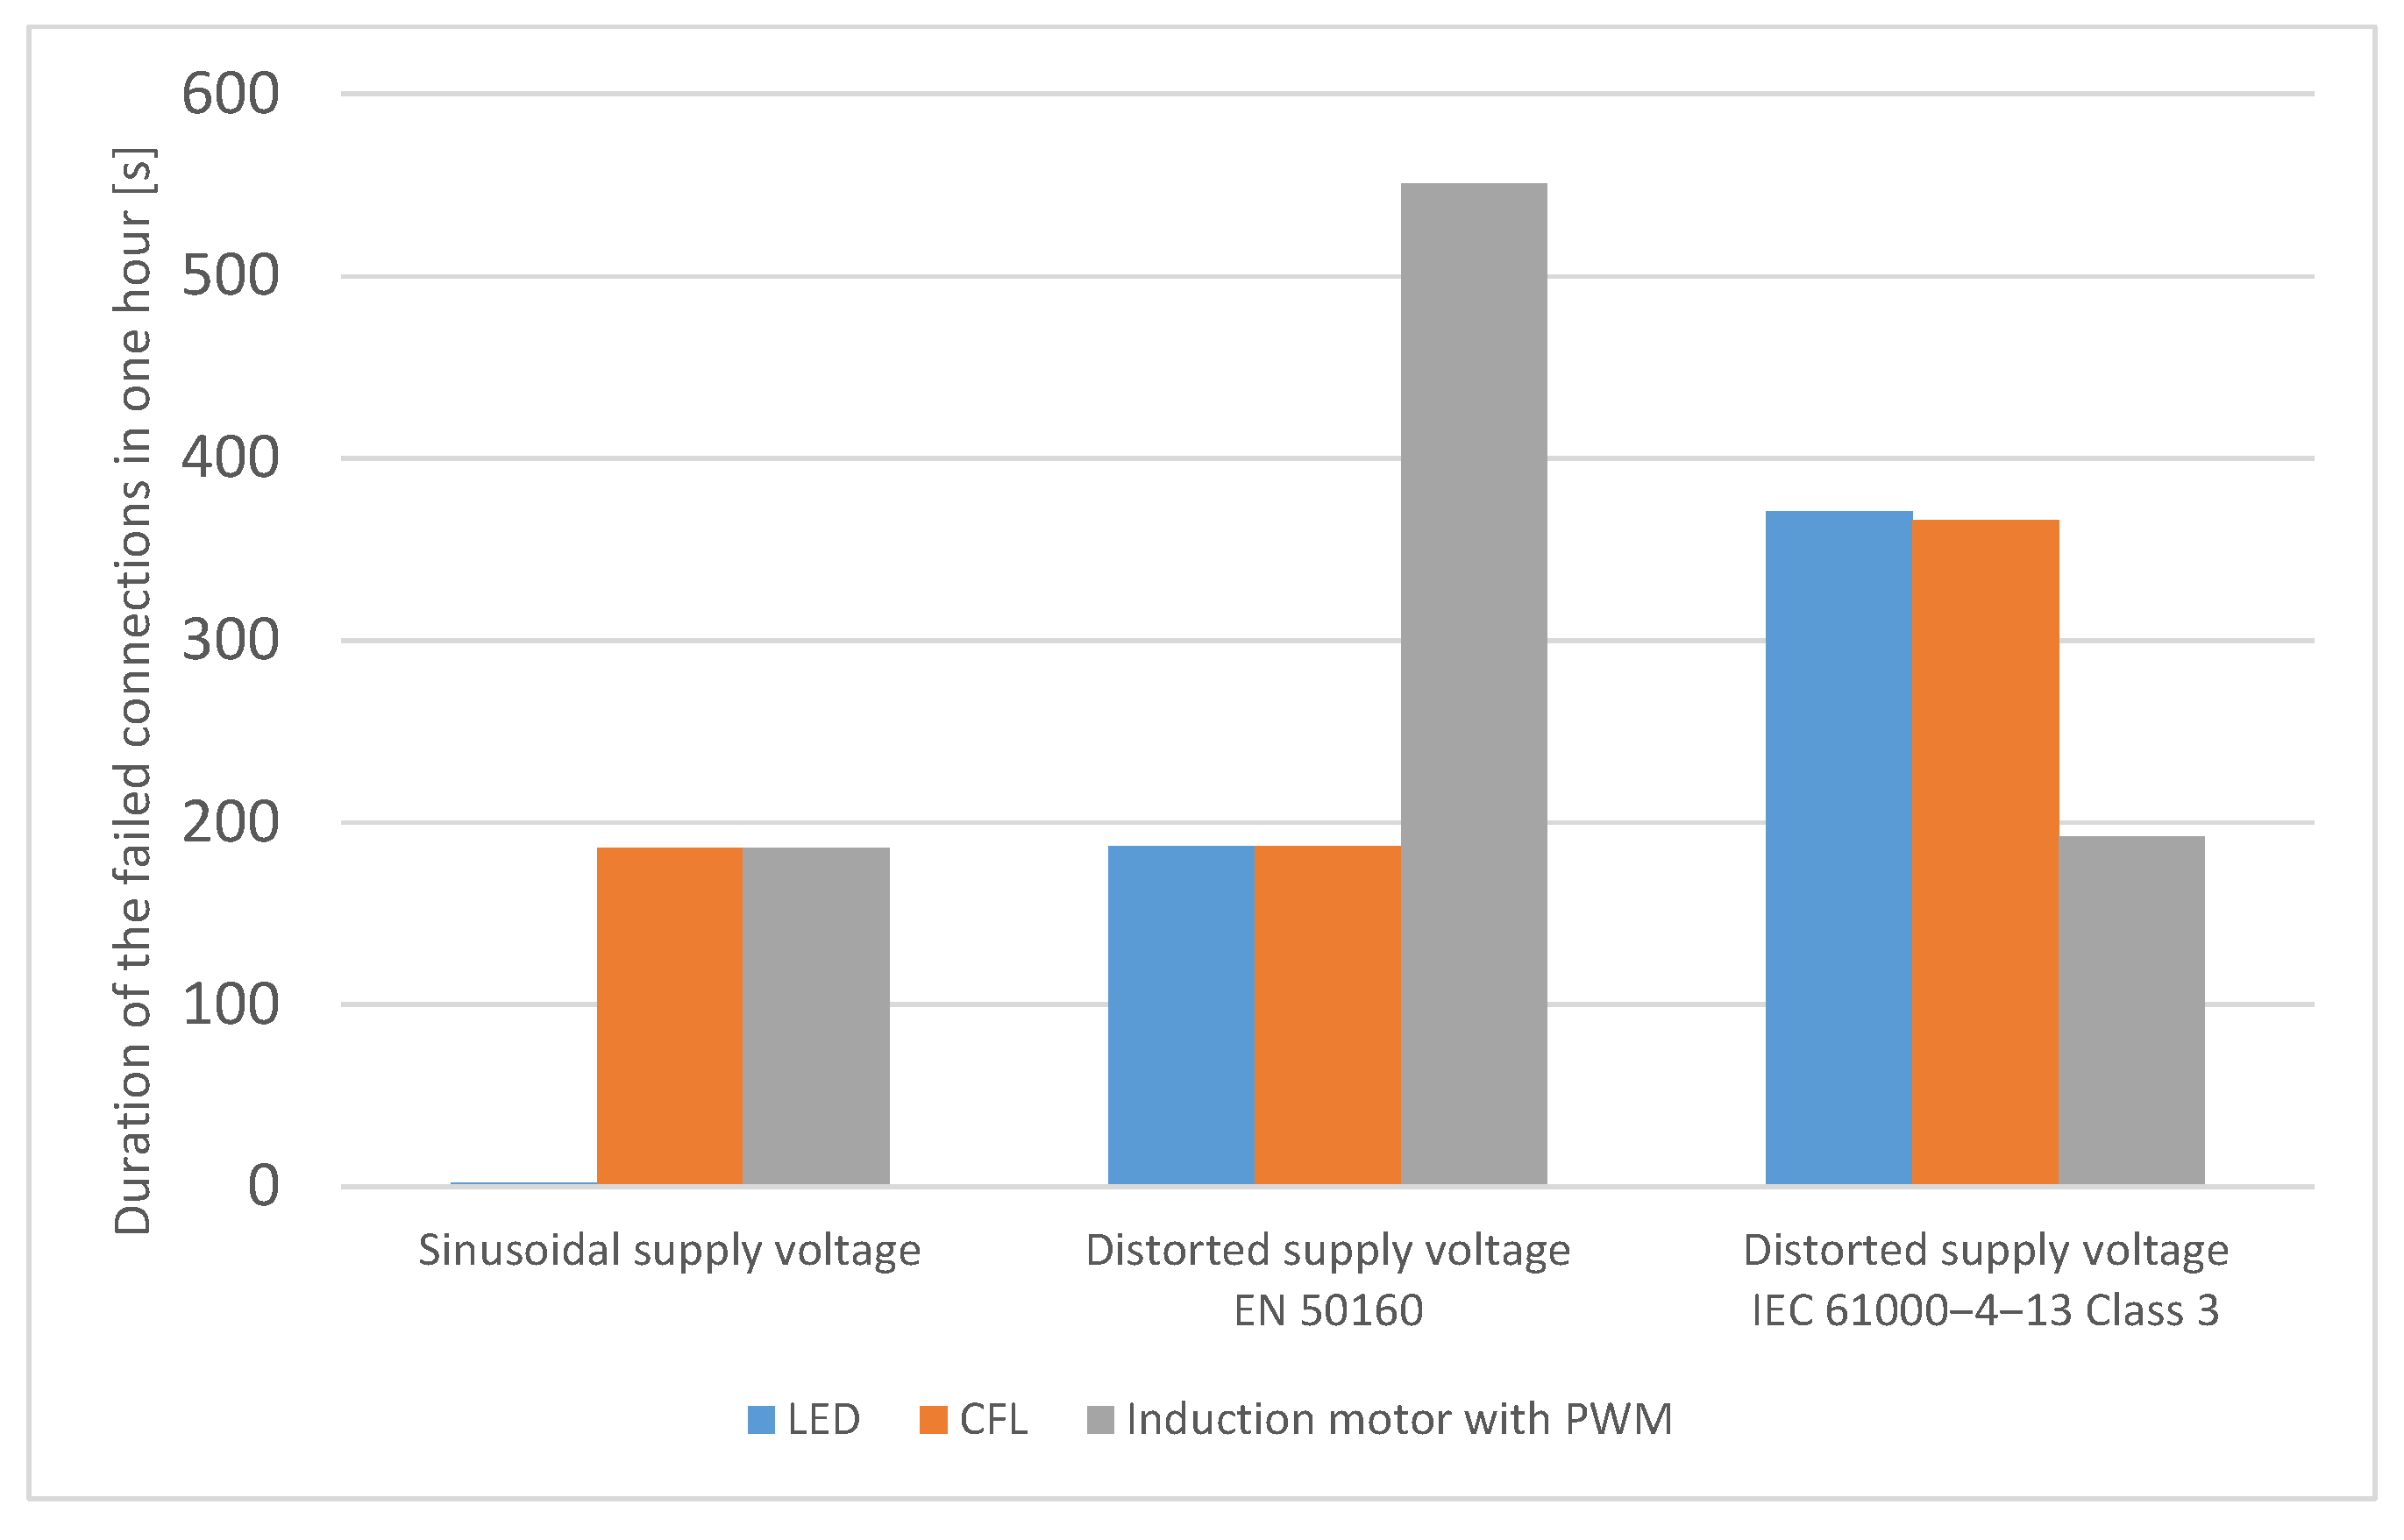
  • Increasing the duration of failed connections is the direct symptom of the problems with continuity of the communication (referring to ADDAX recommendation the threshold value for the duration of failed connections indicating communication problem is 180 s in one hour).

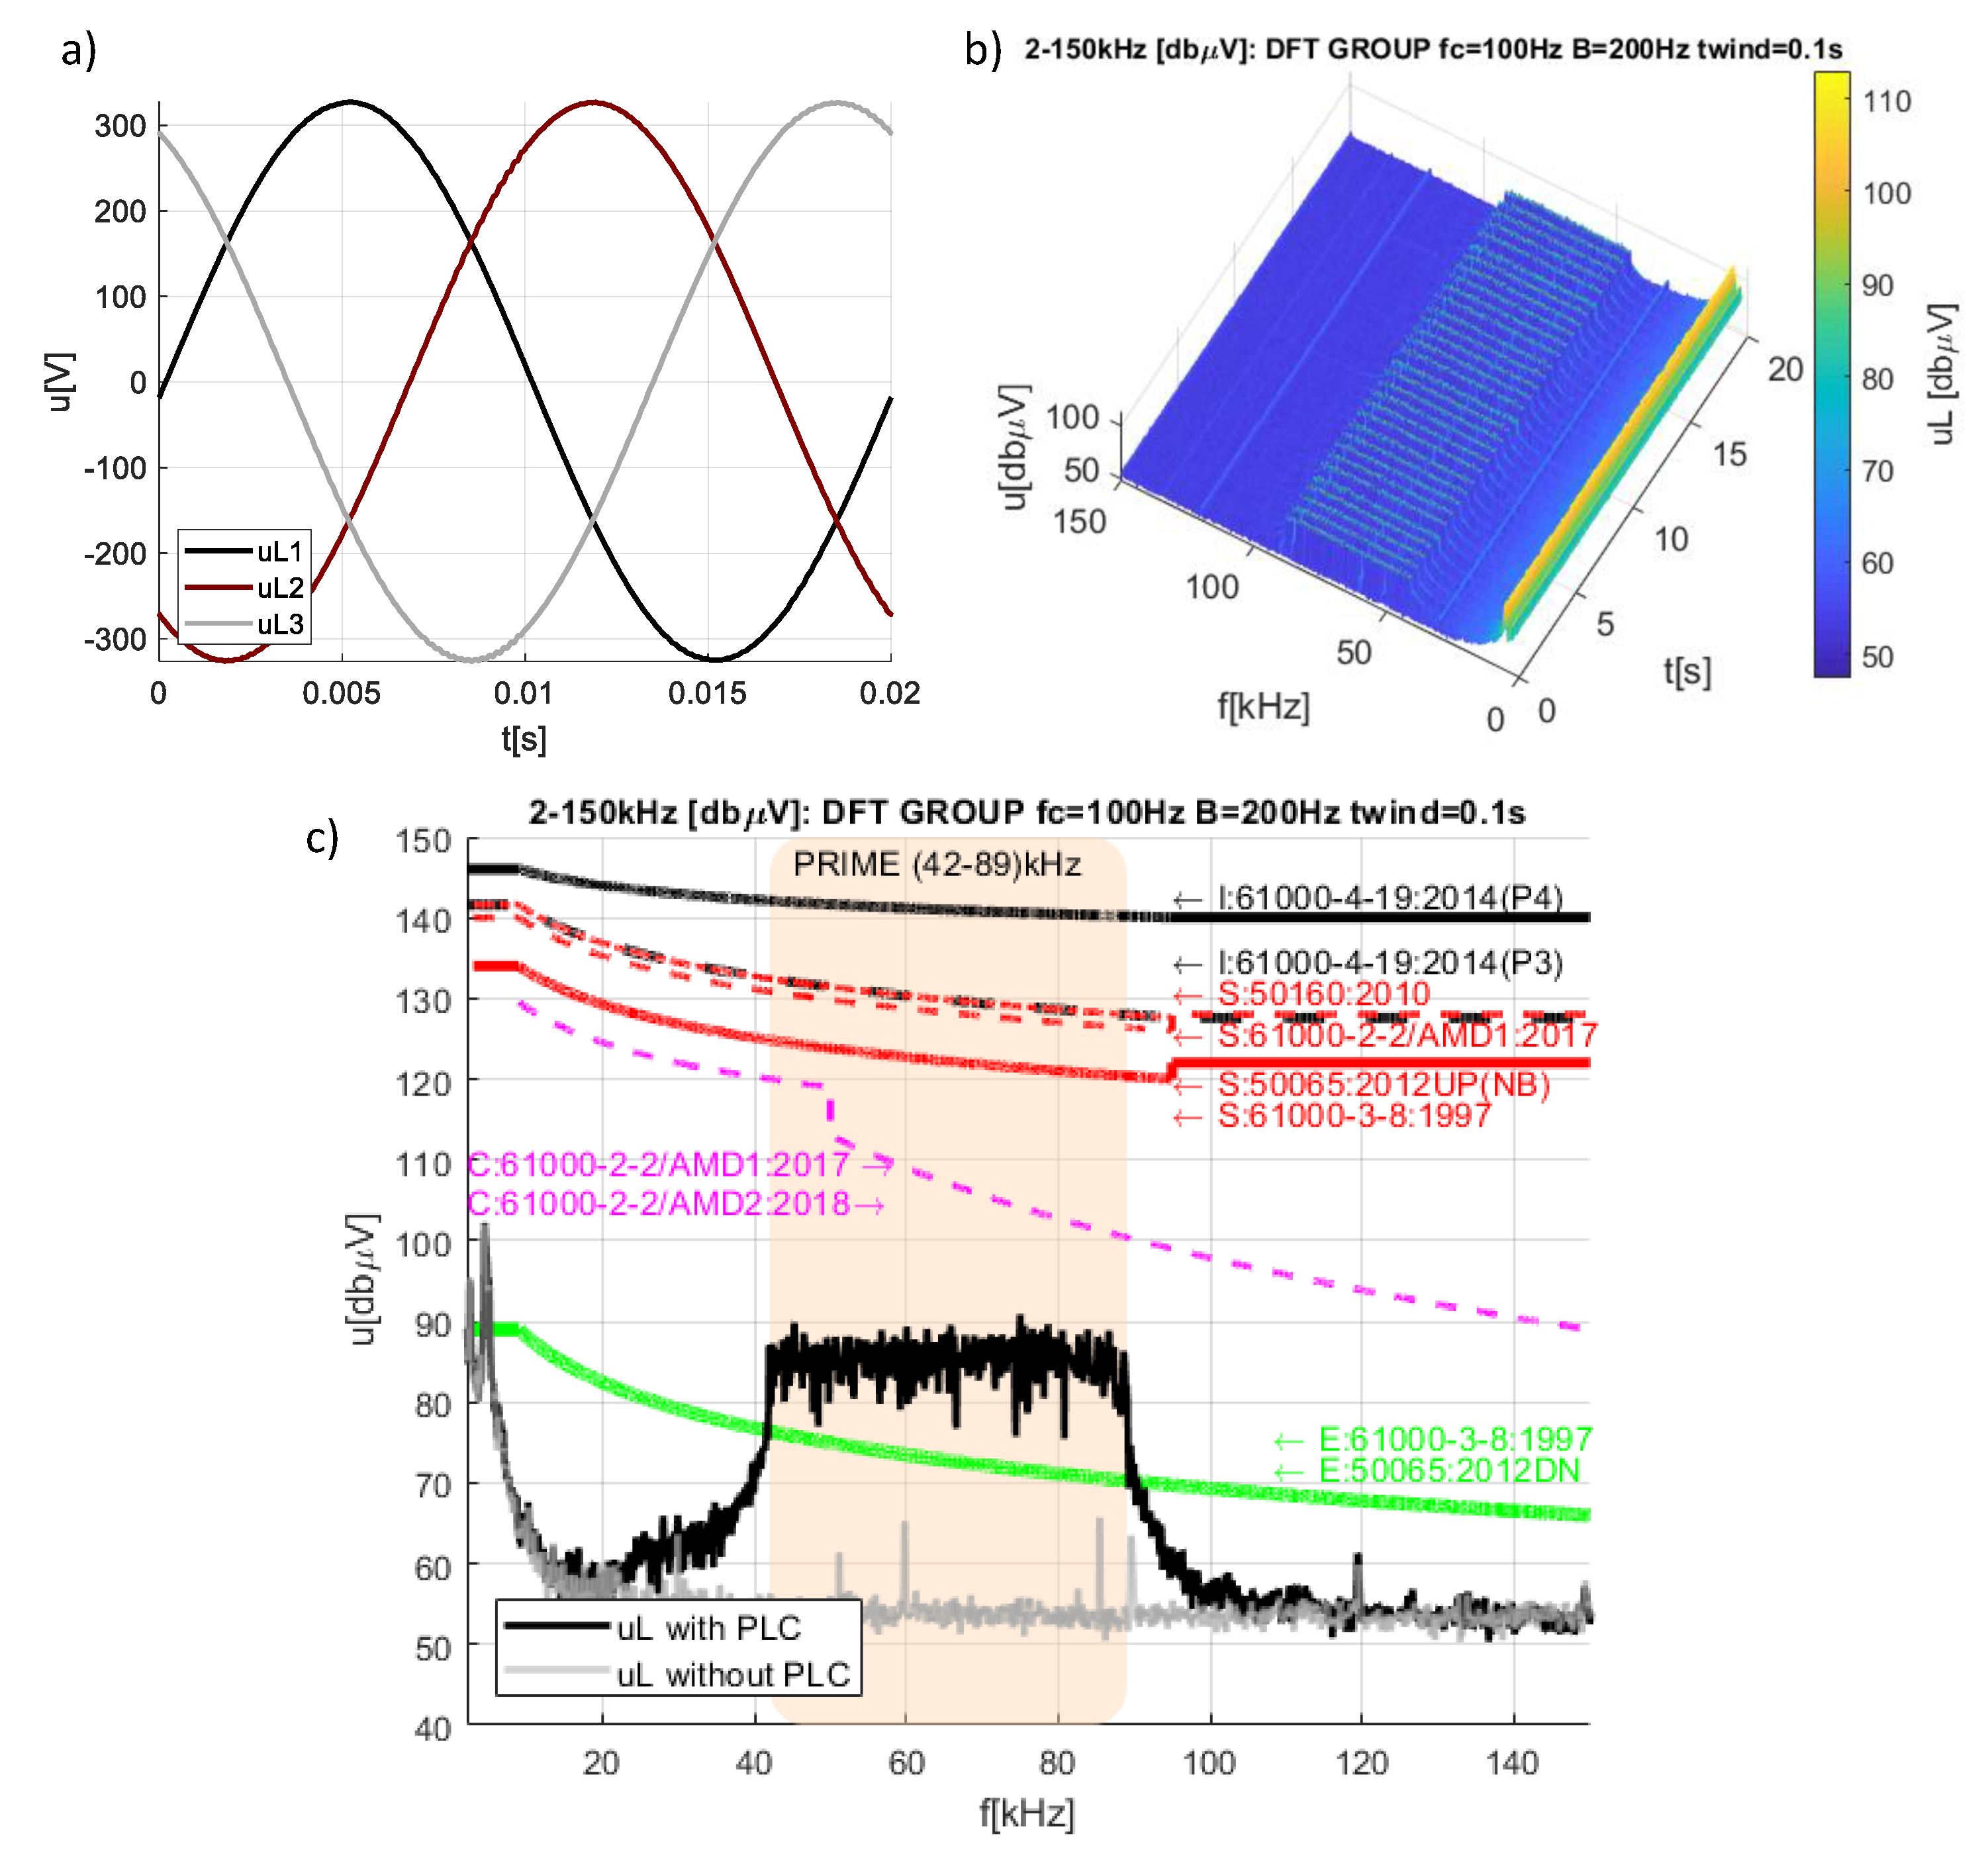
4.1. Case 1 (Supply Voltage Scenario 1, Load Condition 0): Operation of the Tested PRIME PLC System without Loads during Sinusoidal Supply Voltage—Reference Analysis

As the system itself makes use of the supply voltage (power supplies for meters, meter displays, concentrator, etc.), it was decided to initially study the impact of voltage distortion without the loads, first of all. This testing stage serves, in a way, as an immunity test of transmission efficiency at a different degree of distortion of the supply voltage, but without the participation of higher frequencies introduced by the loads. At this level of testing, the transmission efficiency statistics available in the master system of the tested PLC are mainly used. With the use of PCR-LA-500 generators, a perfectly sinusoidal waveform of the supply voltage was defined and the first cycle of observation of the operation of the tested PLC system was performed. The results of spectral analysis for the considered case of PRIME PLC system operation in scenario 1 (pure sinusoid supply voltage) without loads are shown in Figure 7. Figure 7a. presents voltage in the point of the equipment connection, which is also the point of energy meter connection with PRIME PLC receiver (denoted in figures as line voltage “uL”). The only impact on the primary voltage distortion, i.e., before the PLC communication is switched on, are the currents of the power supplies of the concentrator and the power supplies of the systems and the meter displays. It should be noted that the power supply itself is not an ideal appliance. According to the technical specification, the error of the forced waveform could be up to 0.3%. Figure 7b presents the time-varying nature of the PRIME PLC communication during 20 s of observation. The figure was obtained using a sliding 100 ms window of DFT analysis using grouping in the 200 Hz band in 100 Hz central frequency. It can be visible that the investigated technology uses several packages of broadband signal in the range of 42–89 kHz. In order to identify details of the communication signal and the frequency spectrum of the reference analysis (pure sinusoid supply voltage and no load), the maximum and minimum spectra from the 200 local spectra (20 s of observation with 100 ms window) have been selected. Figure 7c identifies spectra representing voltage, with and without PRIME PLC communication. As shown in Figure 7c, a supply voltage spectrum in investigated cases is characterised by a practically constant value (grey colour in the diagram) not exceeding 60 dBµV with narrow-band components of higher frequencies. This waveform was obtained under the conditions of supplying the system with a nominal voltage of 400 V, 50 Hz, THDU ≈ 0%. This characteristic can be treated as a background for the transmission system (noise). The green line in Figure 7c represents the non-intentional emission limit values, according to EN 50065 [3]. It can be noted that using the proposed laboratory setup, it is possible to obtain conditions representing the permissible range of non-intentional emission in the public grid. The black line in Figure 7c represents the identified spectrum of intentional emission introduced by PRIME PLC transmission. From the graph, the following PLC transmission parameters in the 42–89 kHz band can be identified:
  • Local maximum of the non-intentional emission level (noise, background): Nmax = 65.72 dBµV.
  • The intentional transmission signal level related to Nmax: S(Nmax) = 87.51 dBµV.
  • Local minimum signal-to-noise ratio: SNRlocal = 21.79 dB.
  • Signal-to-noise ratio in the full transmission band: SNRband = 31.21 dB.
Such conditions guarantee the correct operation of the PRIME PLC system in the 42–89 kHz band, which has been confirmed by the observation of meter-concentrator communication PLC statistics. Communication statistics have been also checked during a continuous system operation for 2 h. The correct transmission between the concentrator and the energy meters was confirmed.

4.2. Case 2 (Supply Voltage Scenario 1, Load Condition 1): Operation of the Tested PRIME PLC System with LED Light Sources during Sinusoidal Supply Voltage

The measurements were then repeated for the condition when the sinusoidal voltage supplied the LED light sources. Figure 8 represents: (a) investigated voltage, (b) time-frequency plane of 20 s observation of the transmission including non-intentional component, (c) comparison of the spectrum of the transmission and non-intentional emission signals (noise, background for the transmission). In comparison to the no-load condition, the spectrum of voltage measured in the connection point of the LED and the energy meter is characterised by an additional narrowband non-intentional component around 60–80 kHz. However, the magnitude of this component did not affect the transmission signal. Details of the characteristic parameters of the spectrum component in the PRIME PLC transmission band 42–89 kHz are as follows:
  • Local maximum of the non-intentional emission level (noise, background): Nmax = 75.63 dBµV.
  • The intentional transmission signal level related to Nmax: S(Nmax) = 92.67 dBµV.
  • Local minimum signal-to-noise ratio: SNRlocal = 17.04 dB.
  • Signal-to-noise ratio in the full transmission band: SNRband = 30.63 dB.
Communication statistics have been also simultaneously checked. During a continuous system operation for 2 h, correct transmission between the concentrator and the energy meters was confirmed.
  • Statistics of the connection in the presented case are expressed by:
  • Total number of the connections: 53 (including 44 successful and 9 failed connections).
  • Duration of failed connections in one hour: 2 s.

4.3. Case 3 (Supply Voltage Scenario 2, Load Condition 1): Operation of the Tested PRIME PLC System with LED Light Sources during Distorted Supply Voltage Referring to Permissible Limits for Public Grid EN 50160

The tests presented in the previous section have been repeated under operating conditions with a distorted supply voltage with the maximum harmonic content allowed by EN 50160:2015 [3] (see Table 2). The supply voltage waveform distortion was achieved using the programmable AC source and authorised software for harmonic superposition. The created waveform of the distorted supply voltage is illustrated in Figure 9a. The waveform is characterised by the total harmonic distortion index equals to 11.62%.
Spectrum analysis using 200 of 100 ms windows (Figure 9b) allowed identifying the characteristic spectra of non-intentional emission and PRIME PLC transmission. Observing Figure 9c it can be concluded that as it results from the distorted voltage supply waveform the voltage spectrum of the non-intentional emission in the connection point of the load and energy meter resulting from the distorted voltage supply waveform is higher than in the case of operation under reference conditions (sinusoidal rated voltage). From the graph in Figure 9c, one can read the following signal parameters in the point of the 42–89 kHz transmission band are expressed by:
  • Local maximum of the non-intentional emission level (noise, background): Nmax = 77.08 dBµV.
  • The intentional transmission signal level related to Nmax: S(Nmax) = 93.55 dBµV.
  • Local minimum signal-to-noise ratio: SNRlocal = 16.47 dB.
  • Signal-to-noise ratio in the full transmission band: SNRband = 23.57 dB.
The SNR value in the PRIME PLC communication band proved to be sufficient for the transmission of signals in the majority of trials to be effective, as evidenced by the PLC system statistics. However, going into the details of the statistics it has to be emphasized that in order protect against the potential loss of the transmission the investigated PRIME PLC system increased the number of the connection two times in comparison to reference conditions. The magnitude of the transmission signal was also adapted to worse connection conditions and increased from 90 dBµV (reference condition) to 95–97 dBµV.
Statistics of the connection in the presented case are expressed by:
  • Total number of the connections: 103 (including 83 successful and 20 failed connections).
  • Duration of failed connections in one hour: 187 s.

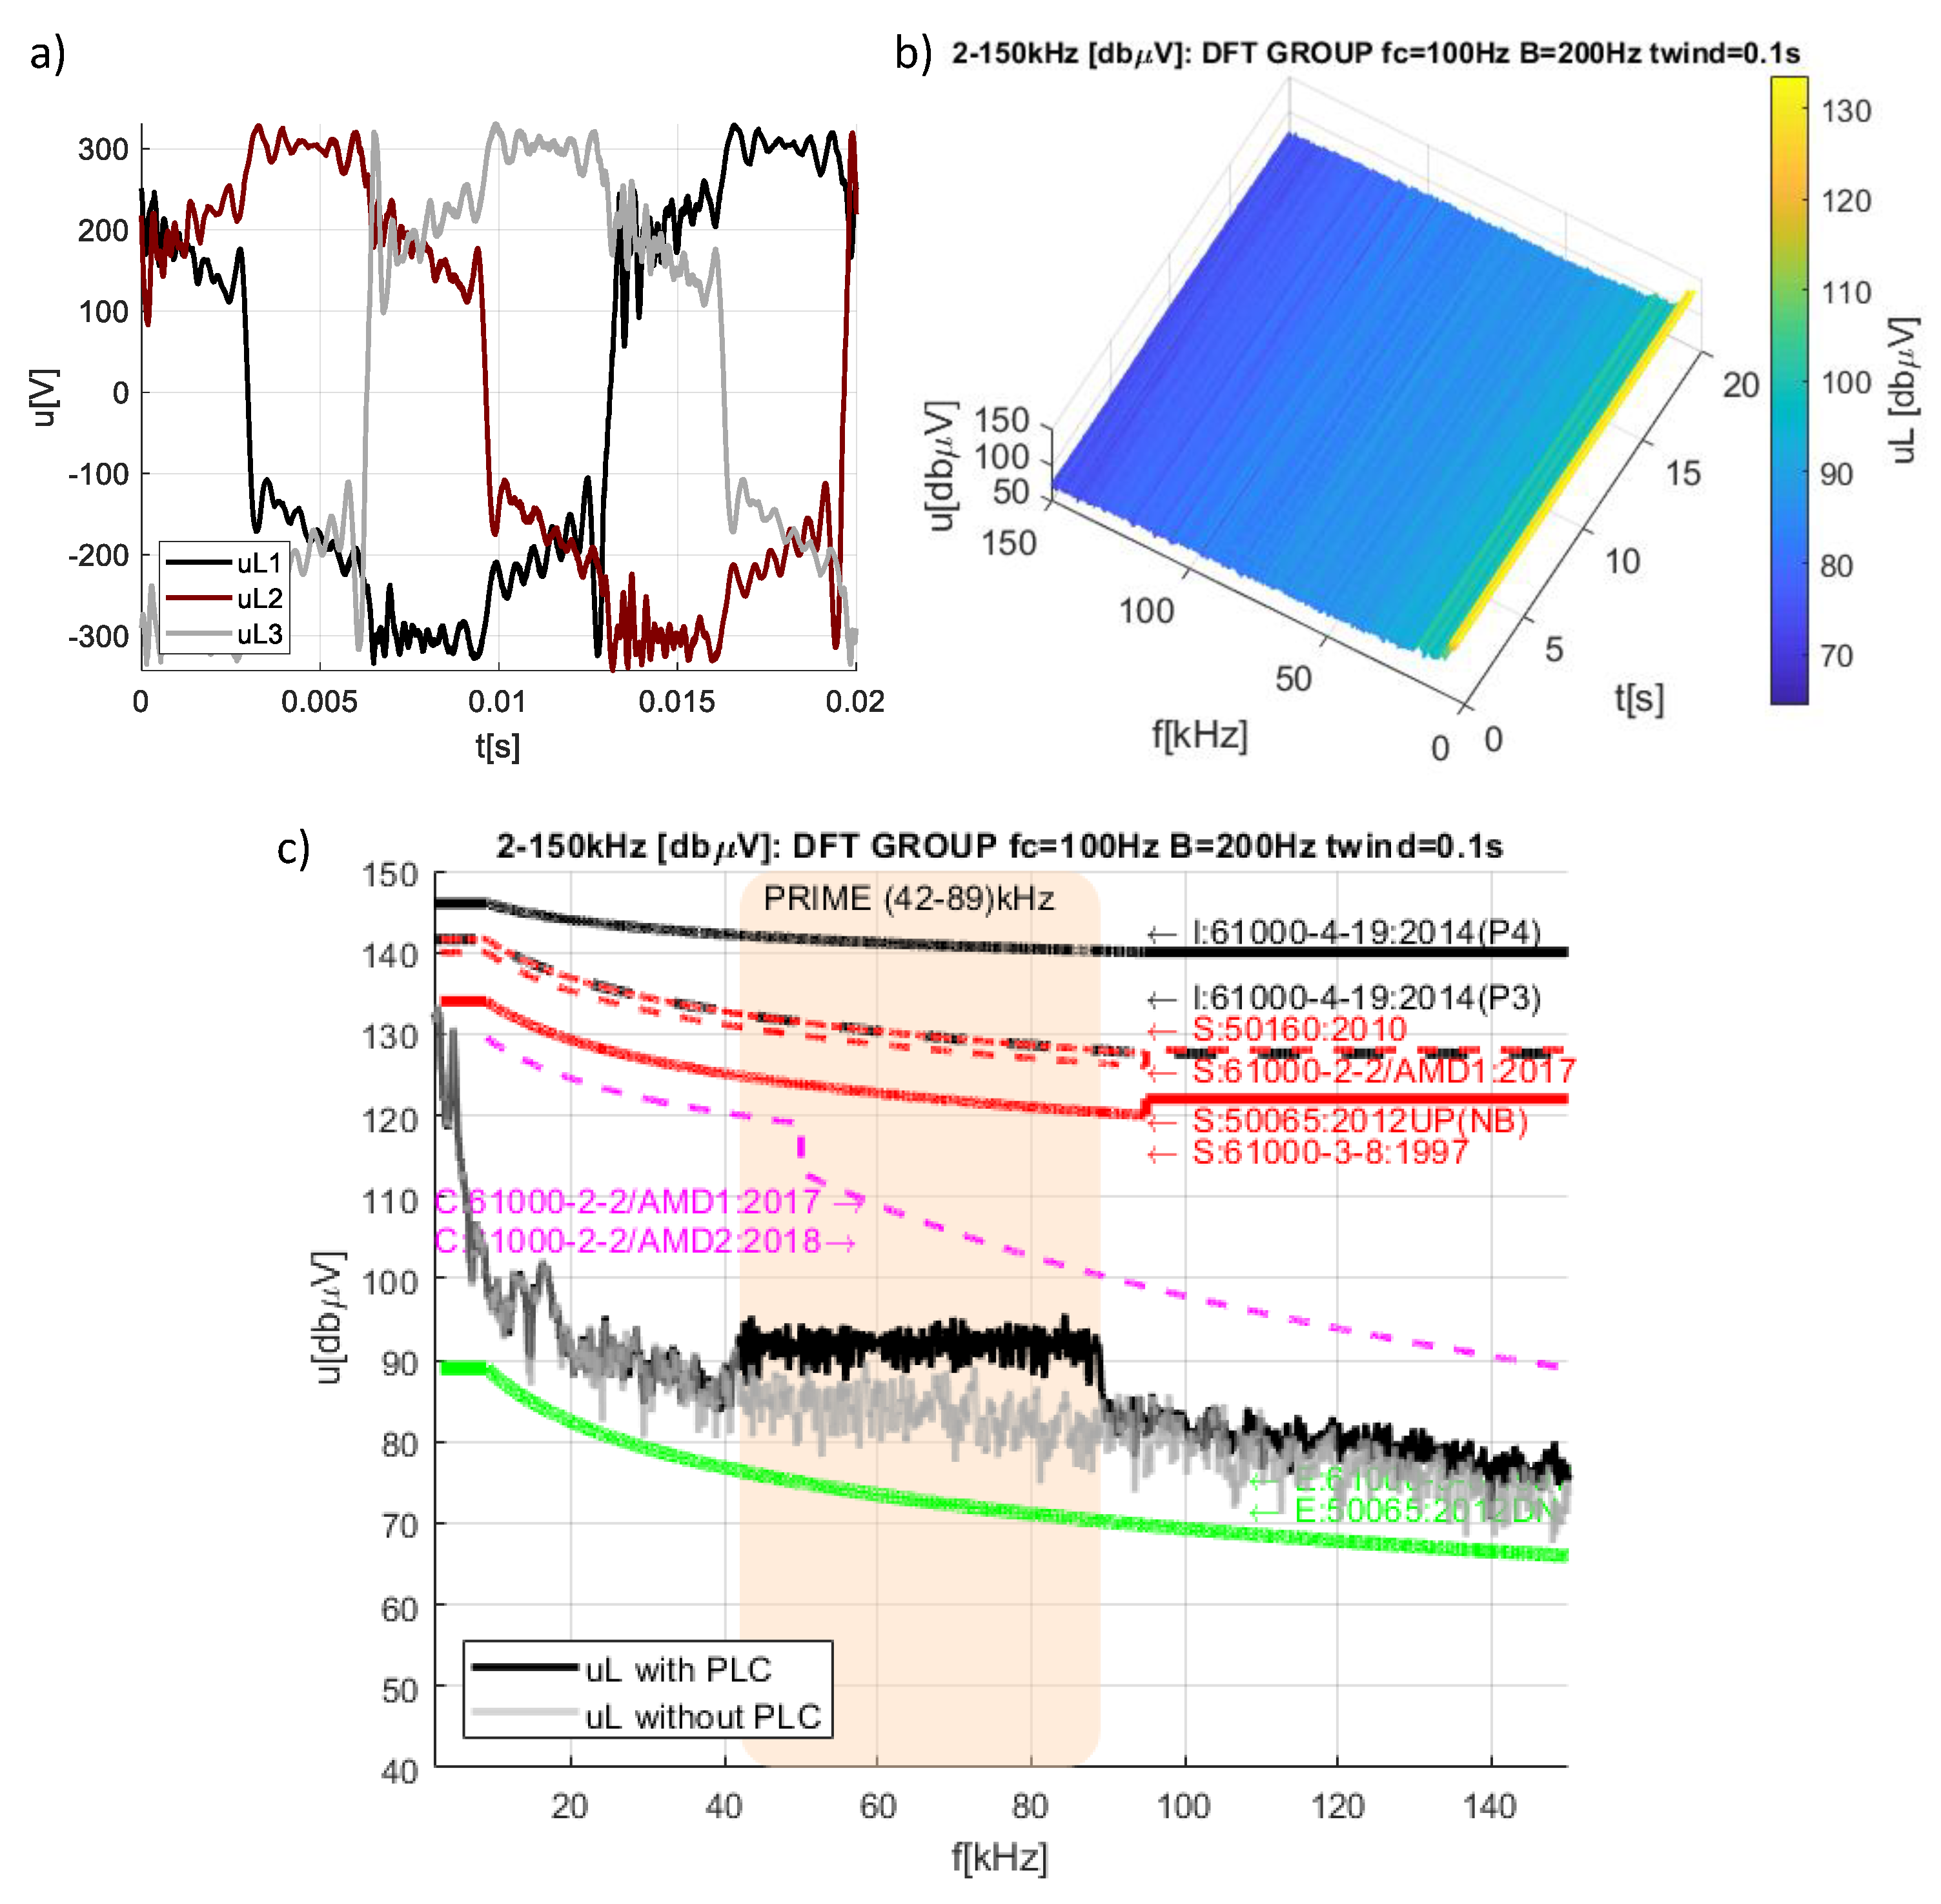
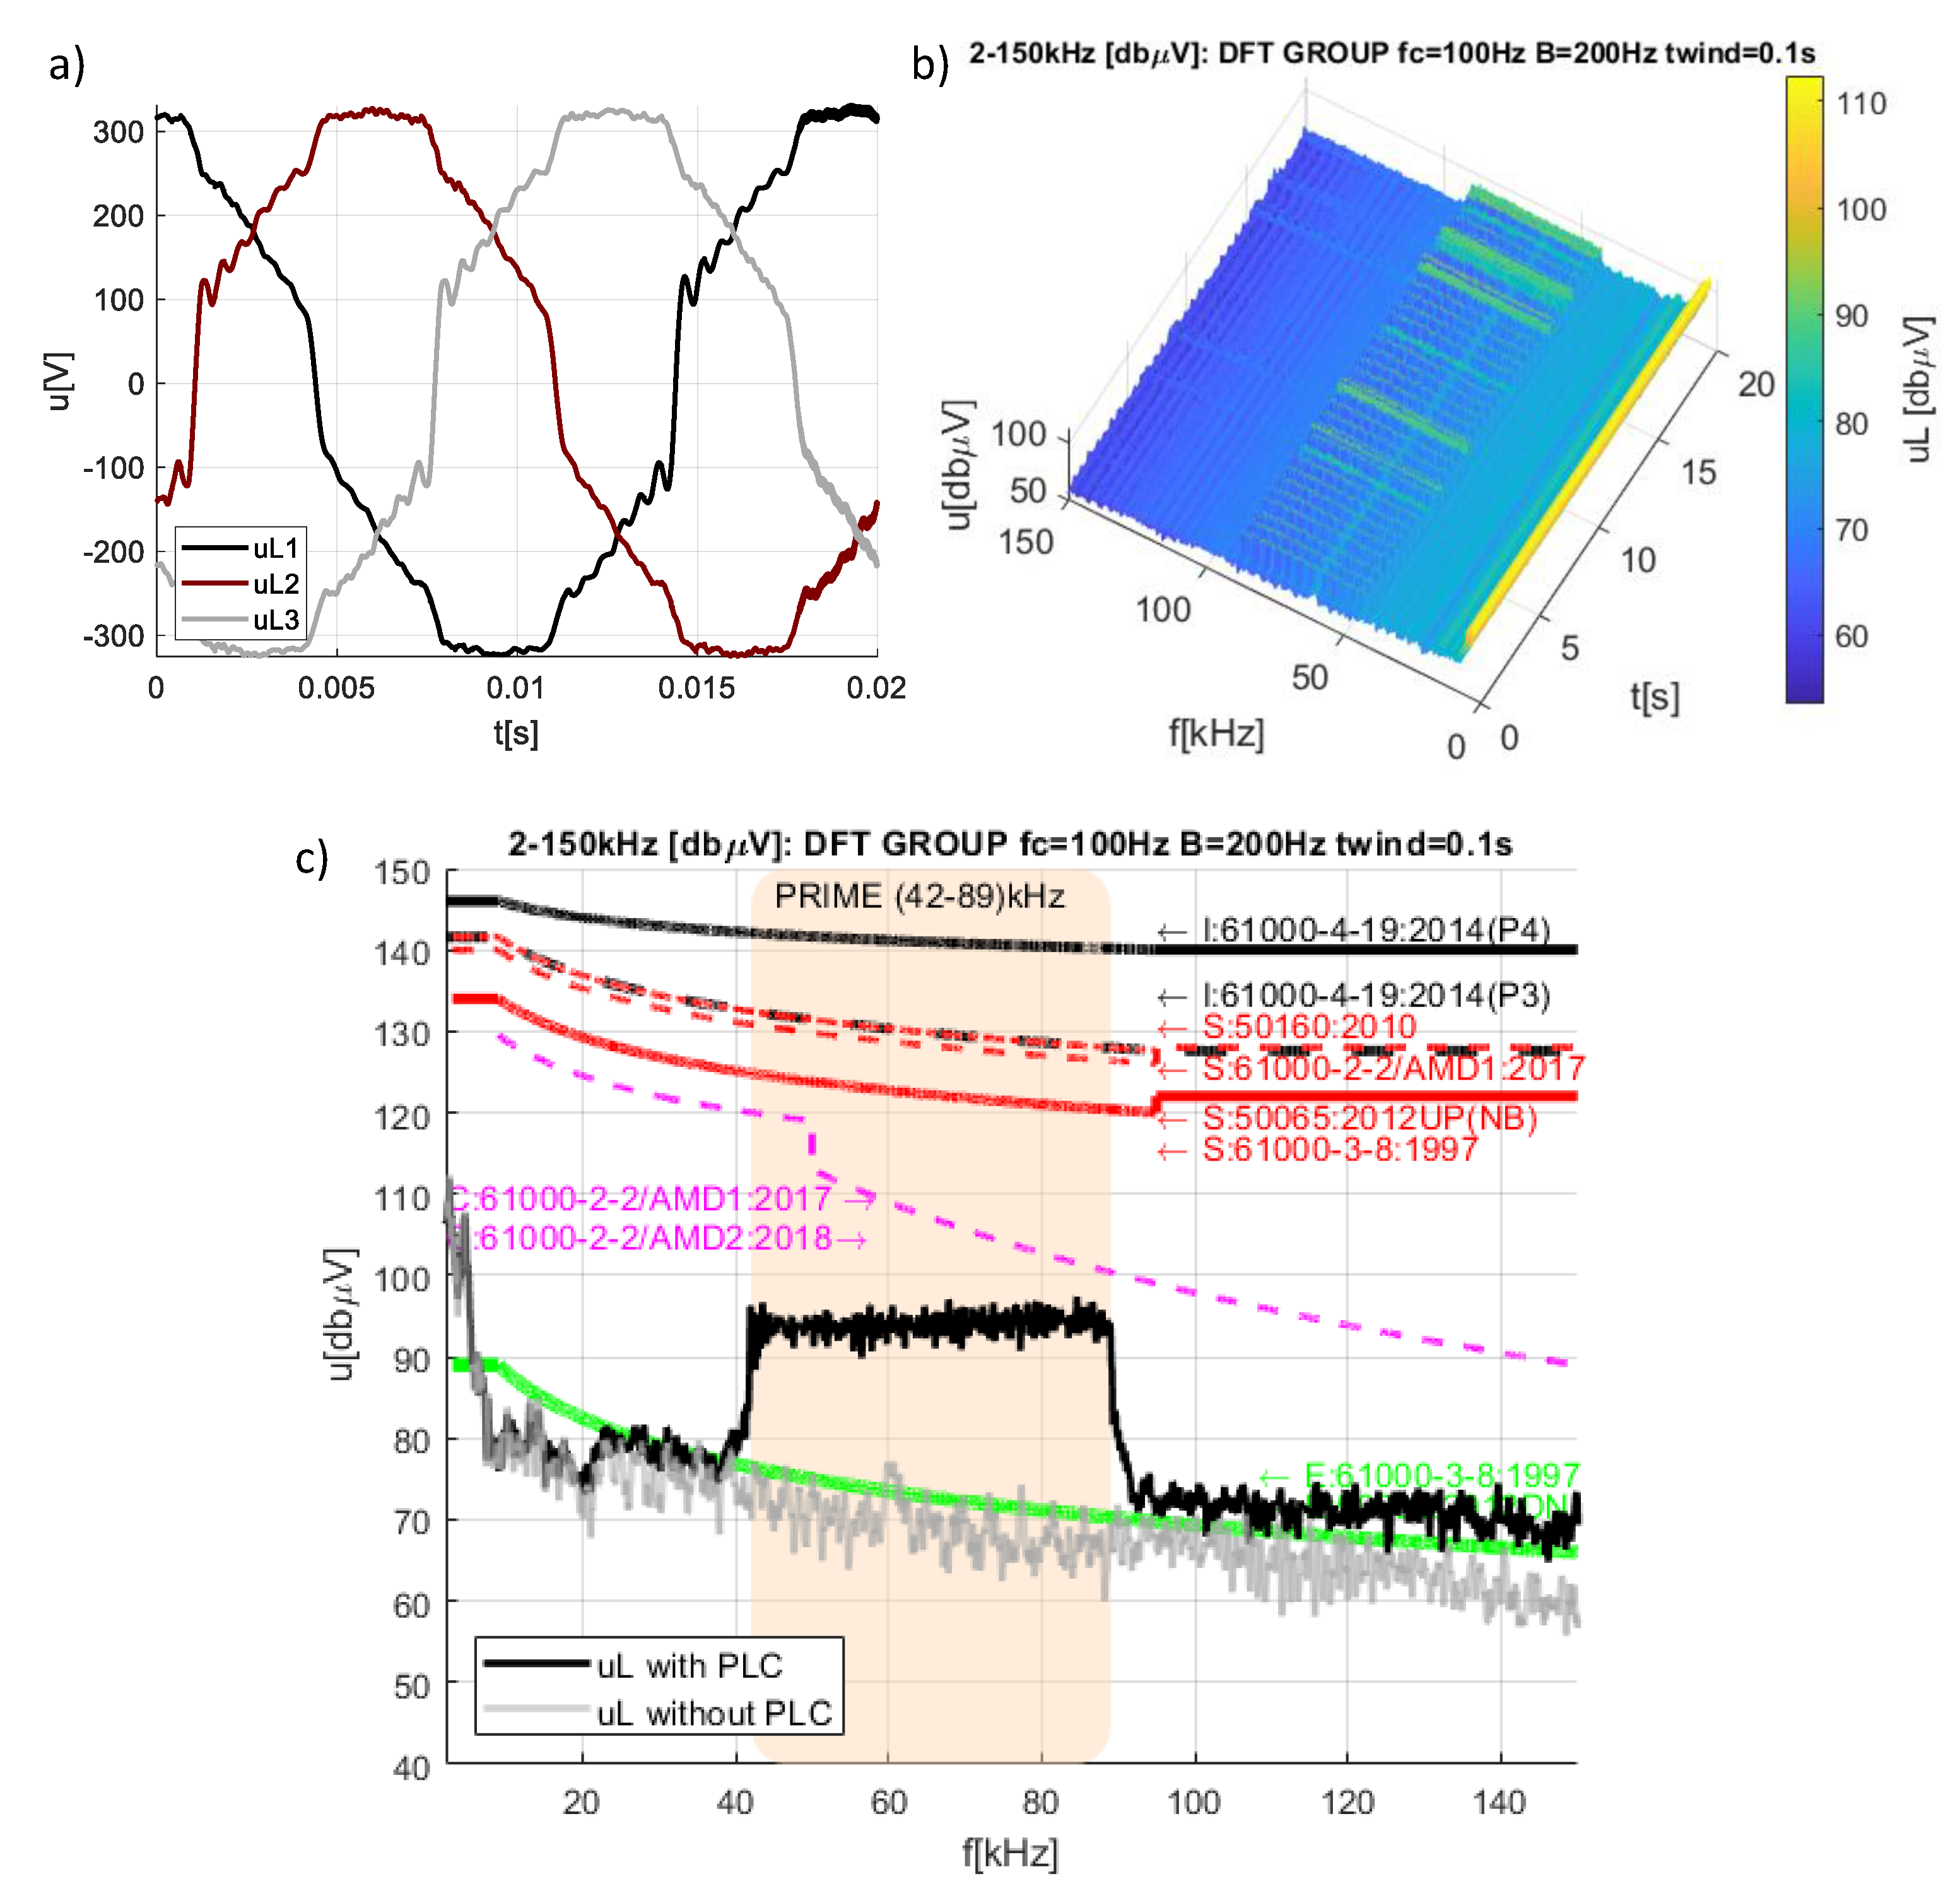
4.4. Case 4 (Supply Voltage Scenario 4, Load Condition 1) Operation of the Tested PRIME PLC System with LED Light Sources during Distorted Supply Voltage Referring to Immunity Test Limits

The final scenario of the supply voltage distortion represents harmonic contribution used in low-frequency immunity tests, according to IEC 61000-4-13 [30] addressed to the equipment of the third class of the immunity. Details of the harmonic contents are presented in Table 3. The distorted supply voltage waveform obtained using the programmable source is depicted in Figure 10a. The waveform is characterised by the total harmonic distortion index equals 25.69%. This scenario can be treated as a case that exceeds the normal operating condition of the equipment significantly.
In contrast to the previously described scenarios, Figure 10b shows a significant impact of the distorted supply voltage on the non-intentional emission at the point of the connection of the LED and energy meter. The characteristic time packages of the broadband transmission signal in the range 42–89 kHz are not recognized now. It can be generally concluded that the non-intentional emission “covered” the intentional transmission signal. A comparison of the characteristic spectra of the intentional and non-intentional emission is presented in Figure 10c. Following signal parameters in the point of the 42–89 kHz transmission band can be identified as:
  • Local maximum of the non-intentional emission level (noise, background): Nmax = 89.82 dBµV.
  • The intentional transmission signal level related to Nmax: S(Nmax) = 92.96 dBµV.
  • Local minimum signal-to-noise ratio: SNRlocal = 3.14 dB.
  • Signal-to-noise ratio in the full transmission band: SNRband = 7.61 dB.
In point of the transmission statistics, the transmission was effective in the majority of trials. However, similar to the previous case, when the distorted supply voltage referring to permissible levels of harmonics in a public grid was considered, using supply waveform distortion basing on IEC 61000-4-13 kept increasing number of the connection between concentrator and energy meters. The maximum time of failed connection extends the acceptable 180 s in one hour.
Statistics of the connection in the presented case are expressed by:
  • Total number of the connections: 106 (including 86 successful and 20 failed connections).
  • Duration of failed connections in one hour: 371 s.

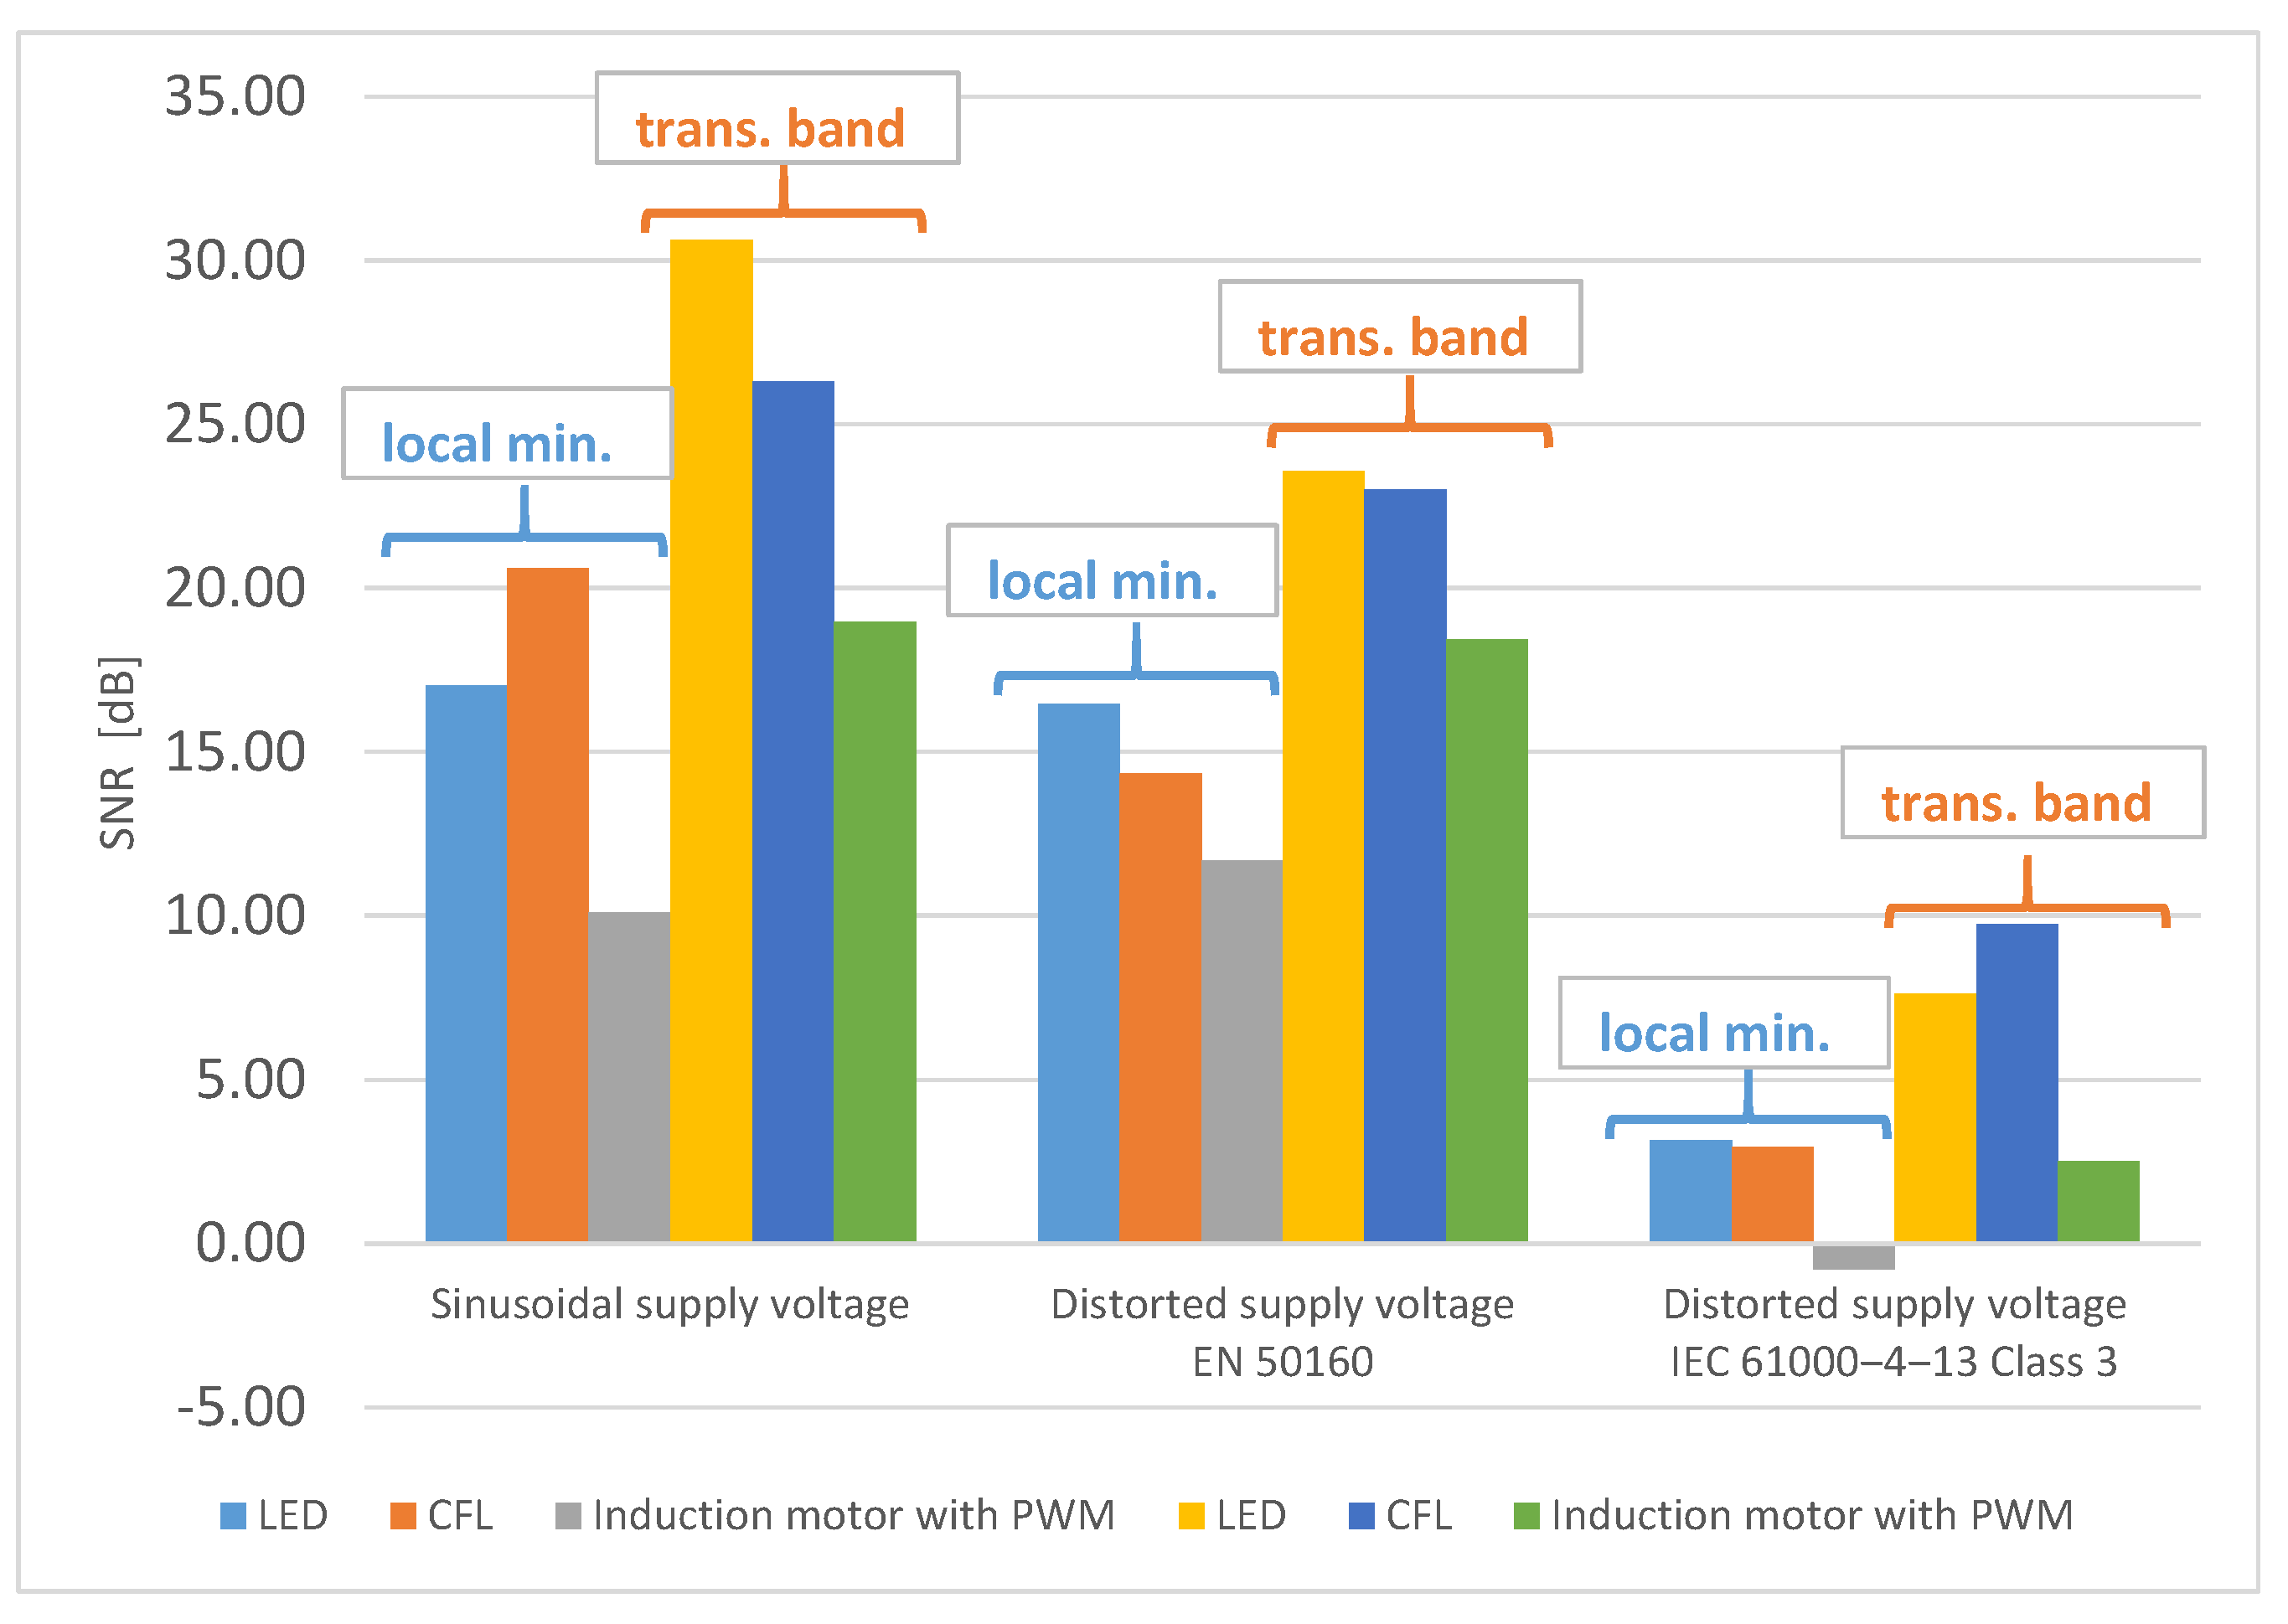
4.5. Comparative Analysis: Operation of the Tested PRIME PLC System under the Different Scenario of Supply Voltage Distortion and Variant Types of Loads

Previously presented results described in detail cases with LED light sources and consequently increased level of supply voltage distortion. The presented results aimed to express the methodology of the investigation with special consideration of the identification and analysis of the characteristic spectra of voltage in the point of the connection of the load and energy meter. As already mentioned, the loads responsible for the majority of data transmission interference in systems based on PLC transmission are LED and CFL light sources and induction motors powered by a pulse width modulation (PWM) frequency inverter. Therefore, in order to assess the impact of the power supply voltage distortion on the operation of the tested PRIME PLC system, with the simultaneous presence of emissions of these loads, extended investigations were performed using several cases formulated as mixtures of the different scenario of supply voltage distortion and variant types of load. It resulted in ten investigation cases for deliberate comparative analysis:
  • No-load and sinusoidal supply voltage (reference condition)—1 case.
  • LED light sources (sinusoidal, EN 50160, IEC 61000 4-13)—3 cases.
  • CFL light sources (sinusoidal, EN 50160, IEC 61000 4-13)—3 cases.
  • Induction motor powered by PWM (sinusoidal, EN 50160, IEC 61000 4-13)—3 cases.
Spectral analysis in the range of 2–150 kHz was carried out for the mentioned ten investigation cases. Figure 11 presents spectra of the investigated voltage in the point of the connection of the load and energy meter with PRIME PLC communication for: (a) LED, (b) CFL, and (c) induction motor with PWM converter, respectively. For better representation, every figure consists of margin characteristic spectra reflecting the background of the transmission obtained for the sinusoidal supply and no-load denoted as reference condition (grey) as well as spectrum of the signal with PRIME PLC transmission (black). The next three curves express the investigated voltage spectra for the consequently deteriorating supply voltage condition (brown—sinusoidal, yellow—EN 50160, orange—IEC 61000-4-13).
The first comment to the obtained results presented in Figure 11 might be addressed to the comparison of the non-intentional emission of the investigated loads for the sinusoidal supply voltage (brown) and normative curves representing emission in a power grid. It can be noticed that, for normative supply conditions, the spectra differ significantly and are characterised by different frequency components in the observed range 2–150 kHz. Moreover, temporarily the obtained spectra exceed the curves representing the normative level of non-intentional emission in the public grid defined in IEC 61000-3-8 [4] adopted in EN 50065:2012 [2] (green normative curve).
The second comment might be addressed to the influence of the distorted voltage condition on non-intentional emission in the range 2–150 kHz. As it was shown in Figure 11, increasing the level of the contribution of the low-frequency component 0–2 kHz in the supply voltage affected the non-intentional emission in the observed range 2–150 kHz in the connection point of the loads and energy meter with PRIME PLC transmission (yellow and orange lines). For the margin condition representing low-frequency contribution used in the immunity test, according to IEC 61000-4-13, the investigated spectra were very close to the intentional transmission signal of the PRIME PLC system (black).
Details of the representative parameters of the transmission signal and the non-intentional emission in the transmission band 42–89 kHz of the investigated PRIME PLC system were collected in Table 4. It can be noticed that the condition of the transmission was consequently worse when the distortion of the supply voltage was increased.
The impact of the supply voltage distortion on the signal-to-noise ratio (SNR) in the transmission band 42–89 kHz of the investigated PRIME PLC system is presented in Table 4 and illustrated in Figure 12. In particular:
  • With LED load the SNR coefficient decreased from 30.06 dB (SNRband)/17.04 dB (SNRlocal) for the sinusoidal normal condition to 7.61 dB(SNRband)/3.14 dB (SNRlocal) for margin distorted condition, which made PLC transmission more difficult;
  • With CFL load the SNR coefficient decreased from 26.31 dB (SNRband)/20.61 dB (SNRlocal) for the sinusoidal normal condition to 9.73 dB (SNRband)/2.94 dB (SNRlocal) for margin distorted condition, which made PLC transmission more difficult;
  • With induction motor powered by PWM converter, the SNR coefficient decreased from 18.97 dB (SNRband)/10.11 dB (SNRlocal) for the sinusoidal normal condition to 2.49 dB (SNRband)/−0.79dB (SNRlocal) for margin distorted condition, which made PLC transmissions impossible.
Direct investigation of a bit error rate (BER) was not performed in the presented study. However, based on [44,45] it can be roughly estimated that for the achieved range of SNR reduction from 30.63 dB to 2.94 dB possible increase of BER could be in the range from 10−5 to 10−1.
Details of the connections statistics in the investigated cases are collected in Table 5. It can be generally noticed that increasing the level of the supply voltage distortion resulted in increasing the total number of the attempted connections as well as a long duration of the failed connections during one hour. Figure 13 depicts the impact of the supply voltage distortion on the duration of the failed connections in one hour of the investigated PRIME PLC system concerning the different types of the investigated equipment. A prominent case is represented by waveform distortion used in the immunity test of the equipment. This case indicates the duration of the failed connections in one hour longer than level 180 s specified by the producer as a margin condition for proper connection. In particular:
  • With LED load the number of attempted connections increased two times and the duration of failed connections increased from 2 s to 371 s when the distortion of the supply voltage was increasing;
  • With CFL load the number of attempted connections were relatively higher than in the case of LED load and the duration of failed connections increased from 186 s to 366 s;
  • With induction motor powered by PWM converter the duration of the failed connections obtained the highest value of 551 s noticed under the distorted supply condition. Additionally, in the case of the margin-investigated supply voltage distortion, the PLC system was not able to retry the connections and the number of the attempted connection was relatively small.

5. Discussion

Taking into account the results of the research presented in this paper, it can be stated that the harmonic content of the supply voltage can be considered as one of the origins of the increasing level of supraharmonics non-intentional emission. As it was shown in the paper, successively increased deterioration grade of the supply voltage waveform, representing respectively harmonic content of permissible level defined for the public grid as well as for the immunity test, had a direct influence on non-intentional emission in the range 2–150 kHz, that in consequence affected the transmission of the investigated PRIME PLC system.
The obtained results allow us to draw several conclusions, namely:
  • For all investigated loads (CFL, LED, the motor with PWM) it was observed that increasing the content of higher harmonics in the supply voltage from the sinusoidal condition, by the waveform distortion representing permissible content of harmonic in a public grid, to the waveform distortion defined in the immunity test of the equipment, resulted in a higher level of non-intentional emission in the range 2–150 kHz. As a consequence, the SNR derived from the local maximum magnitude of the background signal and associated with it the local magnitude of the transmission signal of the investigated PRIME PLC system was consistently decreasing, from 17.04 dB to 3.14 dB (for LED), from 20.61 dB to 2.94 dB (for CFL) and from 10.11 dB to −0.79 dB (for the motor with PWM). The SNR calculated on the basis of power of the transmission signal and power of the background signal in the transmission band was also decreasing, from 30.06 dB to 7.61 dB (for LED), from 26.31 dB to 9.73 dB (for CFL), and from 18.97 dB to 2.49 dB (for the motor with PWM), respectively.
  • An indirect result of the supply voltage distortion is an increasing number of the connections activated by the investigated PLC system in order to prevent loss of the connection. However, in case of a high level of supply voltage distortions, the duration of the failed connections increased significantly. The duration of failed connections decreased from 2 s to 371 s for the LED load, and from 186 s to 366 s for the CFL load. The highest value of the duration of failed connections, 551 s, was achieved in the case of the induction motor powered by PWM.
  • The scenarios of the supply voltage distortion used in the investigation represent a relatively high level of deterioration (direct sum of harmonics permissible harmonic for public grid is represented by THD equals 11.62%; voltage distortion used in the immunity test equipment of the third class of immunity is represented by THD equals 25.69%). However, the formulated relation between the condition of the supply voltage and non-intentional emission suggests extending the discussion about the condition of the tests of non-intentional emissions, which currently are performed under sinusoidal conditions. A proposition for an extended test using deteriorated supply voltage, referring to the permissible level of THD in a low-voltage public network, gradually increasing from a few percentage points to 8%, can be considered.
  • The proposition of extended testing of non-intentional emissions under a distorted supply voltage might also be valuable for a more effective filter specification and selection for particular power line communication technologies.

Author Contributions

Conceptualization: M.W., T.S., M.H.; methodology: M.W., T.S., M.H.; software: T.S., J.S. (Jaroslaw Szymanda), G.W.; validation: M.H., P.K., L.G., J.S. (Jaroslaw Sokol), M.J.; formal analysis: M.W., T.S., M.H., P.K., L.G., J.S. (Jaroslaw Sokol), M.J.; investigation: M.W., T.S., P.K.; resources: M.H., P.K., L.G., J.S. (Jaroslaw Sokol), M.J.; data curation: P.K., J.S. (Jaroslaw Szymanda), G.W.; writing—original draft: M.W., T.S.; writing—review and editing: M.H., P.K., G.W.; visualization: M.W., T.S., G.W., P.K.; supervision: T.S., M.H. All authors have read and agreed to the published version of the manuscript.

Funding

This research was founded by a subsidy of the Polish Ministry of Science and Higher Education for research activities at the Faculty of Electrical Engineering, Wrocław University of Science and Technology.

Data Availability Statement

The data presented in this study are available on request from the corresponding author.

Acknowledgments

In the research, commercial measurement equipment and software for supraharmonics analysis was used to validate the university laboratory setup. This part of the investigations was supported by TAURON Dystrybucja Pomiary Ltd., Poland.

Conflicts of Interest

The authors declare no conflict of interest.

References

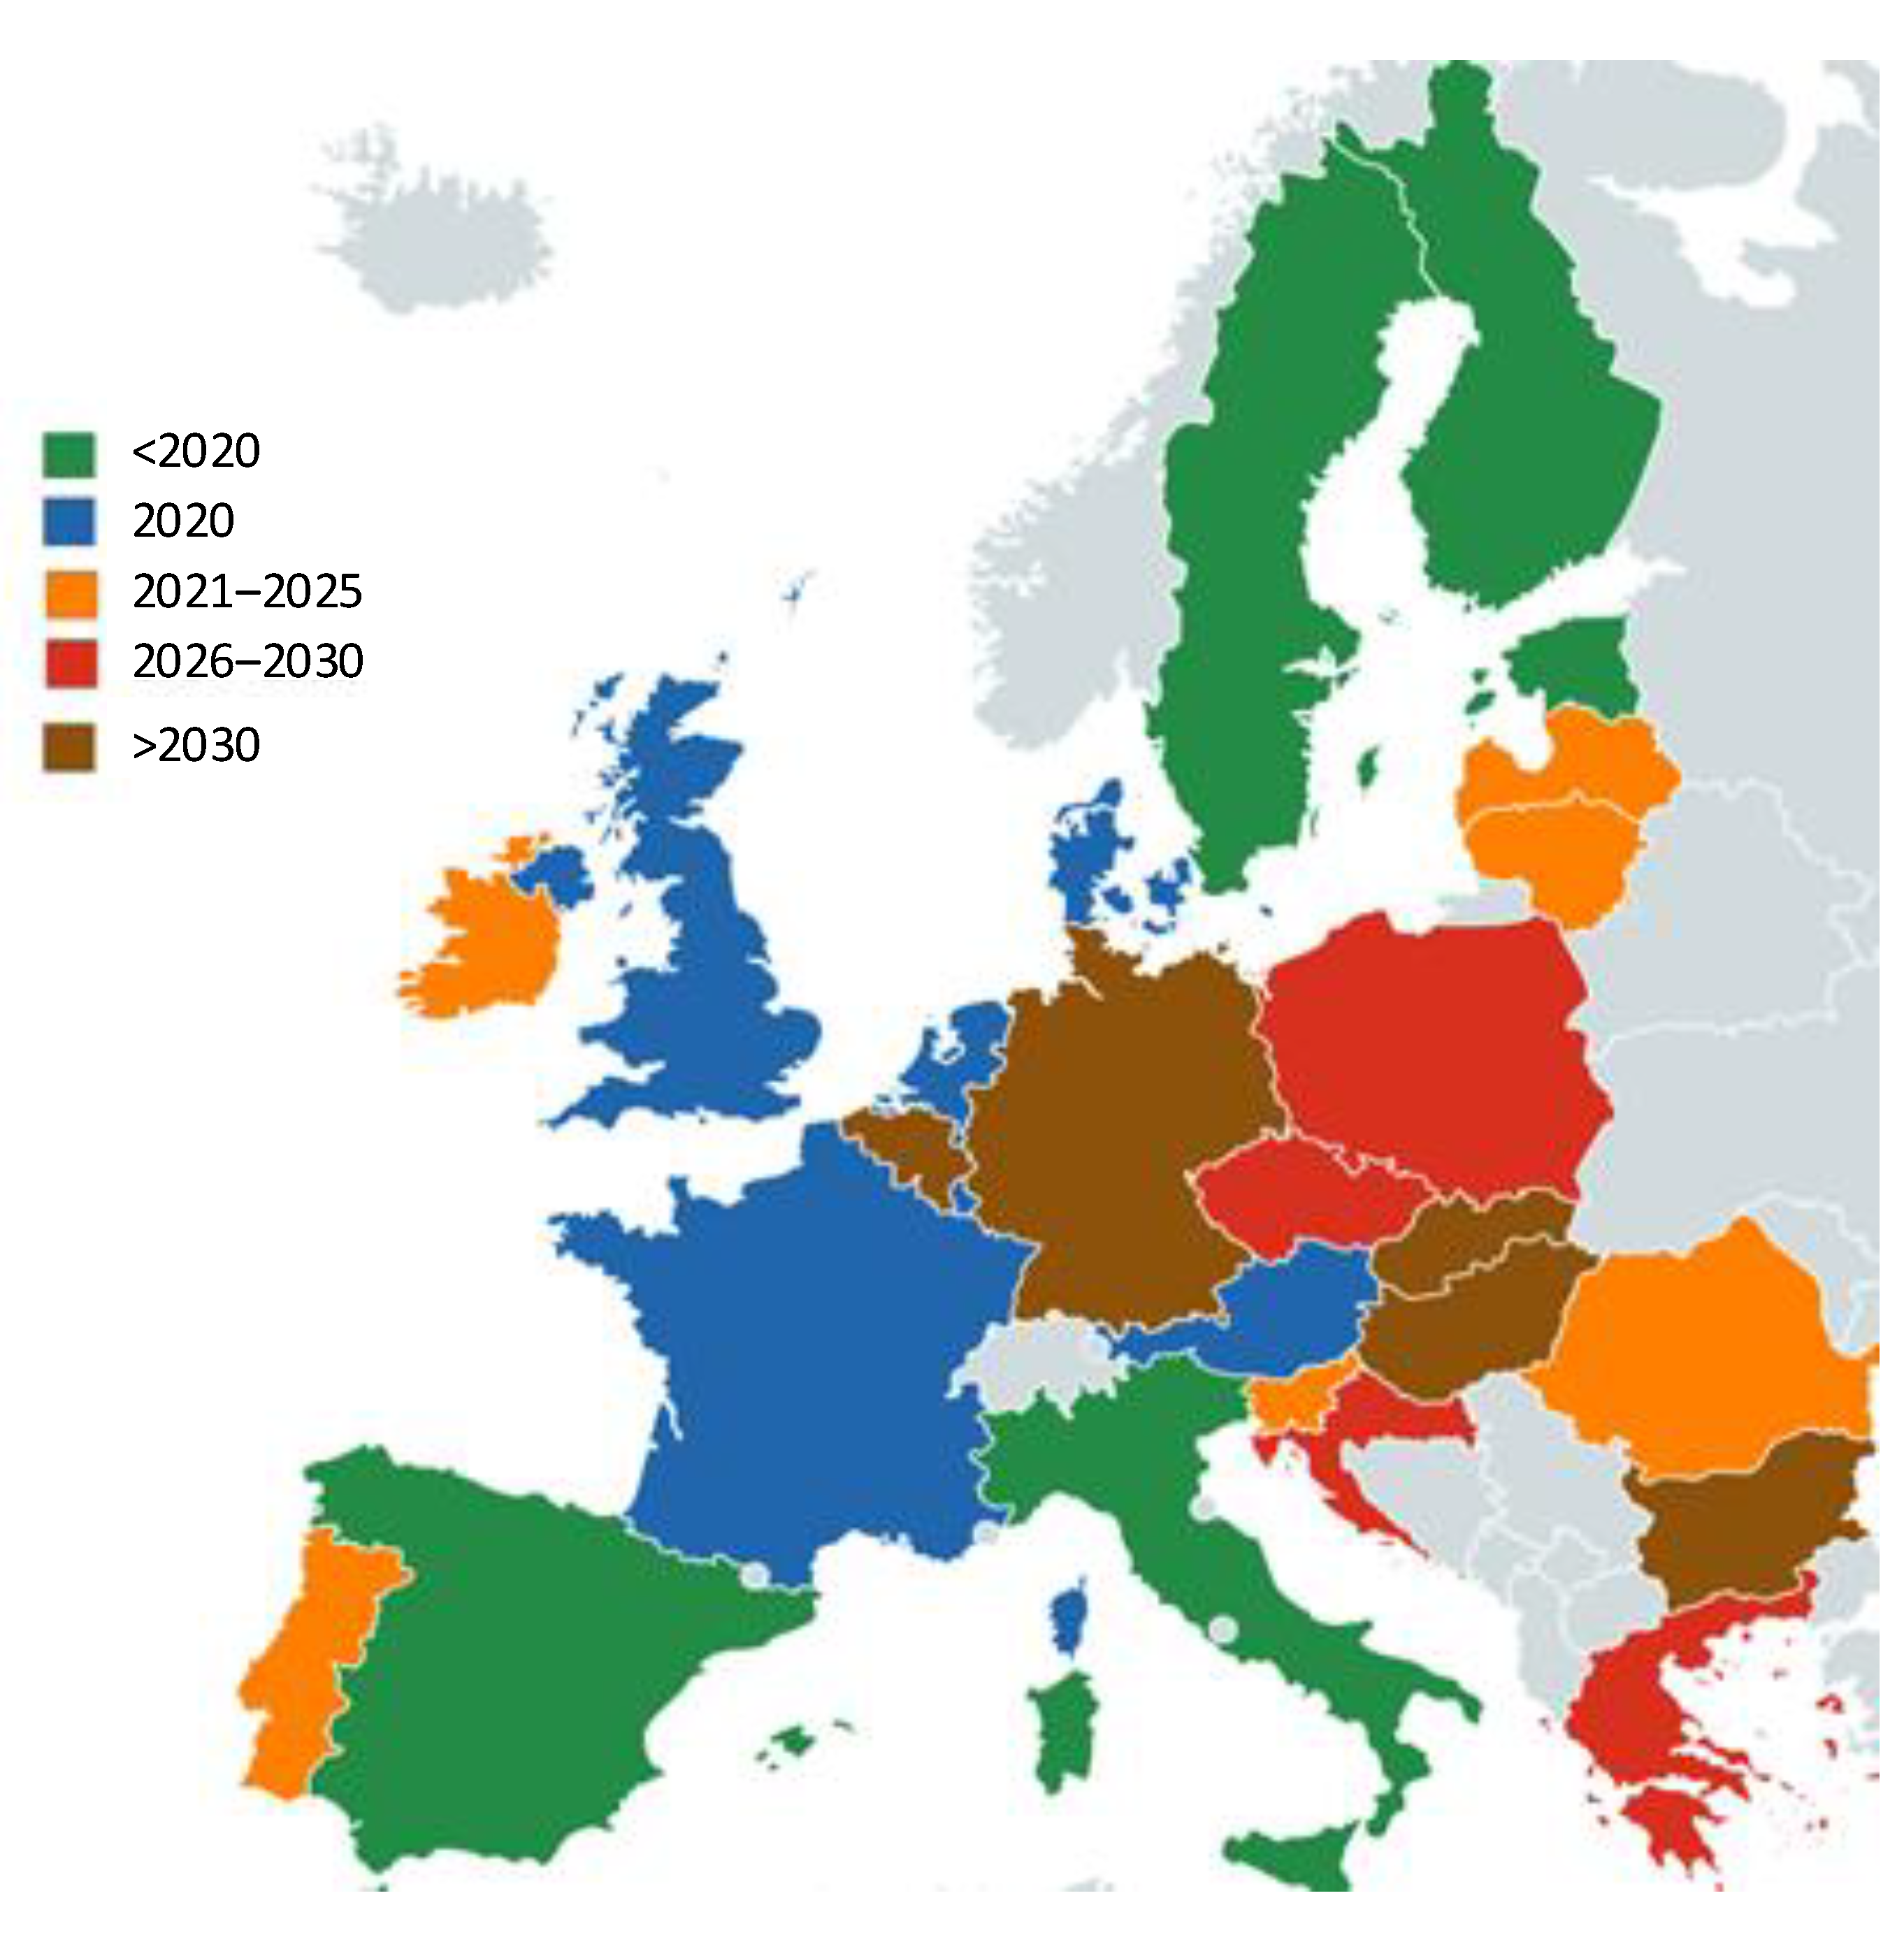
  1. Benchmarking smart metering deployment in the EU-28. In Final Report, European Commission, Directorate-General for Energy, Directorate B—Internal Energy Market Unit B.3—Retail Markets; Coal & Oil; Publications Office of the European Union: Luxembourg, Luxembourg, 2020. [CrossRef]
  2. EN 50065-1:2012. Signalling on Low-Voltage Electrical Installations in the Frequency Range 3 kHz to 148.5 kHz—Part 1: General Requirements; Frequency Bands and Electromagnetic Disturbances; CEN-CENELEC Management Centre: Brussels, Belgium; BSI: London, UK, 2011. [Google Scholar]
  3. EN 50160: 2010. Voltage Characteristics of Electricity Supplied by Public Distribution Systems; CEN-CENELEC Management Centre: Brussels, Belgium, 2010. [Google Scholar]
  4. IEC 61000-3-8: 1997. Part 3: Limits—Section 8: Signalling on Low-Voltage Electrical Installations—Emission Levels, Frequency Bands and Electromagnetic Disturbance Levels; International Electrotechnical Commission: Geneva, Switzerland; BSI: London, UK, 1997. [Google Scholar]
  5. IEC 61000-2-2: AMD1:2017. Part 2-2: Environment—Compatibility Levels for Low-Frequency Conducted Disturbances and Signalling in Public Low-Voltage Power Supply Systems; International Electrotechnical Commission: Geneva, Switzerland, 2017. [Google Scholar]
  6. IEC 61000-4-19:2014. Part 4-19: Testing and Measurement Techniques—Test for Immunity to Conducted, Differential Mode Disturbances and Signalling in the Frequency Range 2 kHz to 150 kHz at a.c. Power Ports; International Electrotechnical Commission: Geneva, Switzerland, 2014. [Google Scholar]
  7. Meyer, J.; Khokhlov, V.; Klatt, M.; Blum, J.; Waniek, C.; Wohlfahrt, T.; Myrzik, J. Overview and Classification of Interferences in the Frequency Range 2–150 kHz (Supraharmonics). In Proceedings of the International Symposium on Power Electronics; Electrical Drives; Automation and Motion (SPEEDAM), Amalfi, Italy, 20–22 June 2018; pp. 165–170. [Google Scholar]
  8. Rönnberg, S.K.; Bollen, M.H.; Amaris, H.; Chang, G.W.; Gu, I.Y.; Kocewiak, Ł.H.; Meyer, J.; Olofsson, M.; Ribeiro, P.F.; Desmet, J. On waveform distortion in the frequency range of 2–150 kHz. Review and research challenges. Electr. Power Syst. Res. 2017, 150, 1–10. [Google Scholar] [CrossRef]
  9. Alfieri, L.; Bracale, A.; Carpinelli, G.; Larsson, A. Accurate assessment of waveform distortions up to 150 kHz due to fluorescent lamps. In Proceedings of the 6th International Conference on Clean Electrical Power (ICCEP), Santa Margherita Ligure, Italy, 27–29 June 2017. [Google Scholar]
  10. Alfieri, L.; Bracale, A.; Varilone, P.; Leonowicz, Z.; Kostyla, P.; Sikorski, T.; Wasowski, M. Methods for Assessment of Supraharmonics in Power Systems. Part I: Theoretical Issues. In Proceedings of the 7th International Conference on Clean Electrical Power (ICCEP), Otranto, Italy, 2–4 July 2019; pp. 117–122. [Google Scholar]
  11. Alfieri, L.; Bracale, A.; Varilone, P.; Leonowicz, Z.; Kostyla, P.; Sikorski, T.; Wasowski, M. Methods for Assessment of Supraharmonics in Power Systems. Part II: Numerical Applications. In Proceedings of the 7th International Conference on Clean Electrical Power (ICCEP), Otranto, Italy, 2–4 July 2019; pp. 123–128. [Google Scholar]
  12. Angulo, I.; Arrinda, A.; Fernandez, I.; Uribe-Perez, N.; Arehalde, I.; Hernandez, L. A review of measurement technique for non-intentional emissions above 2 kHz. In Proceedings of the IEEE International Energy Conference, Leuven, Belgium, 4–8 April 2016.
  13. Grevener, A.; Meyer, J.; Ronberg, S. Comparison of measurement methods for the frequency range 2–150 kHz (Supraharmonics). In Proceedings of the IEEE 9th International Workshop on Applied Measurements for Power Systems, Bologna, Italy, 26–28 September 2018. [Google Scholar]
  14. IEC 61000-4-7/A1:2009. General Guide on Harmonics and Interharmonics Measurements and Instrumentation; International Electrotechnical Commission: Geneva, Switzerland, 2009. [Google Scholar]
  15. IEC 61000-4-30:2015. Part 4-30: Testing and Measurement Techniques—Power Quality Measurement Methods; International Electrotechnical Commission: Geneva, Switzerland, 2015. [Google Scholar]
  16. Bollen, M.; Rönnberg, S. Propagation of Supraharmonics in the Low Voltage Grid. In Proceedings of the Energiforsk, Stockholm, Sweden, 25 January 2017. [Google Scholar]
  17. Gil-de-Castro, A.; Medina-Gracia, R.; Rönnberg, S.K.; Blanco, A.M.; Meyer, J. Differences in the performance between CFL and LED lamps under different voltage distortions. In Proceedings of the 18th International Conference on Harmonics and Quality of Power (ICHQP), Ljubljana, Slovenia, 13–16 May 2018. [Google Scholar] [CrossRef] [Green Version]
  18. Gil-de-Castro, A.; Rönnberg, S.K.; Bollen, M.H.J. Harmonic interaction between an electric vehicle and different domestic equipment. In Proceedings of the International Symposium on Electromagnetic Compatibility, Chiyoda, Tokyo, Japan, 12–16 May 2014. [Google Scholar]
  19. Gil-de-Castro, A.; Rönnberg, S.K.; Bollen, M.H.J. A study about harmonic interaction between devices. In Proceedings of the 16th International Conference on Harmonics and Quality of Power (ICHQP), Bucharest, Romania, 25–28 May 2014. [Google Scholar]
  20. IEC CLC/TR 50669:2017. Technical Report. Investigation Results on Electromagnetic Interference in the Frequency Range below 150 kHz; CEN-CENELEC Management Centre: Brussels, Belgium, 2017. [Google Scholar]
  21. Andersson, M.O.J.; Rönnberg, S.K.; Lundmark, C.M.; Larsson, E.O.A.; Wahlberg, M.; Bollen, M.H.J. Interfering signals and attenuation—potential problems with communication via the power grid. In Proceedings of the 19th International Conference on Electricity Distribution, Vienna, Austria, 21–24 May 2007. [Google Scholar]
  22. López, G.; Moreno, J.I.; Sánchez, E.; Martínez, C.; Martín, F. Noise Sources, Effects and Countermeasures in Narrowband Power-Line Communications Networks: A Practical Approach. Energies 2017, 10, 1238. [Google Scholar] [CrossRef] [Green Version]
  23. Rönnberg, S.K.; Bollen, H.H.J.; Wahlberg, M. Interaction between Narrowband Power-Line Communication and End-User Equipment. IEEE Trans. Power Deliv. 2011, 26, 20134–22039. [Google Scholar] [CrossRef]
  24. Shklyarskiy, Y.; Hanzelka, Z.; Skamyin, A. Experimental Study of Harmonic Influence on Electrical Energy Metering. Energies 2020, 13, 5536. [Google Scholar] [CrossRef]
  25. Uribe-Pérez, N.; Angulo, I.; Hernández-Callejo, L.; Arzuaga, T.; De la Vega, D.; Arrinda, A. Study of Unwanted Emissions in the CENELEC-A Band Generated by Distributed Energy Resources and Their Influence over Narrow Band Power Line Communications. Energies 2016, 9, 1007. [Google Scholar] [CrossRef] [Green Version]
  26. Thai, M.T.; Wu, W.; Xiong, H. (Eds.) Big Data in Complex and Social Networks, 1st ed.; CRC Press: Boca Raton, FL, USA, 2016. [Google Scholar]
  27. Blanco, A.M.; Gupta, M.; de Castro, A.G.; Rönnberg, S.K.; Meyer, J. Impact of flat-top voltage waveform distortion on harmonic current emission and summation of electronic household appliances. In Proceedings of the International Conference on Renewable Energies and Power Quality ICREPQ’18, Salamanca, Spain, 21–23 March 2018. [Google Scholar]
  28. Mansoor, A.; Grady, W.M.; Thallam, R.S.; Doyle, M.T.; Krein, S.S.; Samotyj, M.J. Effect of Supply Voltage Harmonics on the Input Current of Single-phase Diode Bridge Rectifier Loads. IEEE Trans. Power Deliv 1995, 10, 1416–1422. [Google Scholar] [CrossRef]
  29. Huang, X.-L.; Ma, X.; Hu, F. Machine learning and intelligent communications. Mob. Netw. Appl. 2018, 23, 68–70. [Google Scholar] [CrossRef] [Green Version]
  30. IEC 61000-4-13:2002 & A1:2009 & A2:2015. Electromagnetic Compatibility (EMC): Testing and Measurement Techniques. Harmonics and Interharmonics Including Mains Signalling at a.c. Power Port; Low-Frequency Immunity Tests; International Electrotechnical Commission: Geneva, Switzerland, 2002. [Google Scholar]
  31. Yanchenko, S.; Meyer, J. Harmonic Emission of Household Devices in Presence of Typical Voltage Distortions. In Proceedings of the 2015 IEEE PowerTech Conference, Eindhoven, The Netherlands, 29 June 2015. [Google Scholar]
  32. KIKUSUI AC Power Supply PRC-LA-Series. Available online: https://www.kikusui.co.jp/common/product/pdf/pcr-la.pdf (accessed on 20 March 2020).
  33. IEC 61000-3-3:2013. Part 3: Limits—Section 3: Limitation of Voltage Changes, Voltage Fluctuations and Flicker in Public Low-Voltage Supply Systems, for Equipment with Rated Current ≤ 16 A per Phase and Not Subject to Conditional Connection; International Electrotechnical Commission: Geneva, Switzerland; BSI: London, UK, 2013. [Google Scholar]
  34. KIKUSUI Three-phase Output Driver for PCR-LA Series. Available online: https://https://manual.kikusui.co.jp/I/IB03_PCR_LA_E2.pdf (accessed on 5 January 2021).
  35. KIKUSUI Quick Immunity Testing Software. Available online: https://www.kikusui.co.jp/en/download/en/?fn=sd003-pcrla_AP (accessed on 5 January 2021).
  36. KIKUSUI GPIB Interface for PCR-LA Series. Available online: https://manual.kikusui.co.jp/NUMERIC/3P03_PCR_LA_E3.pdf (accessed on 5 January 2021).
  37. National Instruments NI 9223 Voltage Input Module Datasheet. Available online: https://www.ni.com/pdf/manuals/374223a_02.pdf (accessed on 5 January 2021).
  38. LEM Voltage Transducer CV 3-1000 Datasheet. Available online: https://www.lem.com/sites/default/files/products_datasheets/cv_3-1000.pdf (accessed on 5 January 2021).
  39. Swemet MFA 500, Spectrum Analyser for PLC 3–500 kHz. Available online: http://en.swemet.se/files/Produkter/produktblad_mfa500_ver1.pdf (accessed on 5 January 2021).
  40. Signal Hound USB-SA44B Spectrum Analyser Measuring Receiver 1 Hz–4.4 GHz Datasheet. Available online: https://signalhound.com/products/usb-sa44b/ (accessed on 5 January 2021).
  41. ITU-T G.9904 (10/2012) Narrowband Orthogonal Frequency Division Multiplexing Power Line Communication Transceivers for PRIME Networks, International Telecommunication Union. Available online: https://www.itu.int/rec/T-REC-G.9904/en (accessed on 17 January 2020).
  42. PRIME Alliance Specification for PoweRline Intelligent Metering Evolution, PRIME Alliance Technical Working Group. Available online: https://www.prime-alliance.org/wp-content/uploads/2020/04/PRIME-Spec_v1.4-20141031.pdf (accessed on 17 January 2021).
  43. SIMS—Smart Integrated Metering System—ADDAX Software Solution Based on up-to-Date Addax Technology for Residential Metering—Datasheet. Available online: www.addgrup.com (accessed on 18 January 2021).
  44. Korki, M.; Hosseinzadeh, N.; Moazzeni, T. Performance Evaluation of a Narrowband Power Line Communication for Smart Grid with Noise Reduction. IEEE Trans. Consum. Electron. 2011, 57, 4. [Google Scholar] [CrossRef]
  45. Seijo, M.; López, G.; Matanza, J.; Moreno, J.I. Planning and Performance Challenges in Power Line Communications Networks for Smart Grids. Int. J. Distrib. Sens. Netw. 2016, 2016, 17. [Google Scholar] [CrossRef] [Green Version]
Figure 1. Review of the target completion date for smart electricity meters installation covering at least 80% of all consumers based on the plans of the European Union (EU) member states (based on [1]).
Energies 14 00777 g001
Figure 2. A simplified model, describing primary and secondary emissions in a system of two loads, assuming a sinusoidal rated voltage.
Energies 14 00777 g002
Figure 3. Comparison of the emission (E), compatibility (C), mains signalling (S), and immunity (I) levels for conducted disturbances and signalling in the frequency range 2–150 kHz (based on standards [16,17,18,19,20,21].
Energies 14 00777 g003
Figure 4. The laboratory setup: (a) electrical diagram of the test stand, (b) view of the power supply system in the form of programmable AC power supplies and model with power line communication (PLC) meters.
Energies 14 00777 g004
Figure 5. Information and communications technology (ICT) functional diagram of the test stand as a local area network (LAN).
Energies 14 00777 g005
Figure 6. View of 1 MHz voltage and current recorder components.
Energies 14 00777 g006
Figure 7. Case 1: Results of the analysis of PRIME PLC system operation without loads at pure sinusoidal supply voltage (reference case); (a) supply voltage waveform; (b) time-frequency representation in the range 2–150 kHz band using 100 ms window during the 20 s observation; (c) comparison of the spectrum of the corresponding PRIME PLC transmission (black) and the spectrum of the voltage in the connection point of the load and energy meter (grey) with relation to the normative curves (uL—line voltage in the point of the equipment connection, which is also the point of energy meter connection with PRIME PLC).
Energies 14 00777 g007
Figure 8. Case 2: results of the analysis of PRIME PLC system operation with LED light sources at pure sinusoidal voltage supply; (a) supply voltage waveform; (b) time-frequency representation in the range 2–150 kHz using 100 ms window during the 20 s observation; (c) comparison of the spectrum of the corresponding PRIME PLC transmission (black) and the spectrum of the voltage in the connection point of the load and energy meter (grey) with the relation to the normative curves (uL—line voltage in the point of the equipment connection, which is also the point of energy meter connection with PRIME PLC).
Energies 14 00777 g008
Figure 9. Case 3: results of the analysis of PRIME PLC system operation with LED light sources at distorted supply voltage referring to permissible limits for public grid defined in EN 50160:2015 [3]; (a) supply voltage waveform; (b) time-frequency representation in the range 2–150 kHz using 100 ms window during the 20 s observation; (c) comparison of the spectrum of the corresponding PRIME PLC transmission (black) and the spectrum of the voltage in the connection point of the load (grey) with the relation to the normative curves (uL—line voltage in the point of the equipment connection, which is also the point of energy meter connection with PRIME PLC).
Energies 14 00777 g009
Figure 10. Case 4: results of the analysis of PRIME PLC system operation with LED light sources at distorted supply voltage referring to permissible limits for low-frequency immunity tests defined in IEC 61000-4-13 [30]; (a) supply voltage waveform; (b) time-frequency representation in the range 2–150 kHz using 100 ms window during the 20 s observation; (c) comparison of the spectrum of the corresponding PRIME PLC transmission (black) and the spectrum of the voltage in the connection point of the load (grey) with the relation to the normative curves (uL—line voltage in the point of the equipment connection, which is also the point of energy meter connection with PRIME PLC).
Energies 14 00777 g010
Figure 11. Summary: spectra of the voltage in the connection point of the load and energy meter for mixture cases representing results of the analysis of PRIME PLC system operation with (a) LED; (b) CFL; and (c) induction motor with PWM converter; under the different contribution of low-frequency distortion in the supply voltage (pure sinusoid (brown), EN 50160:2015 [3] (yellow), IEC 61000-4-13 [30] (orange)) with relation to no-load condition (grey) and PRIME transmission (black) (uL—line voltage in the point of the equipment connection, which is also the point of energy meter connection with PRIME PLC).
Energies 14 00777 g011
Figure 12. Impact of the supply voltage distortion grade on the signal to noise ratio (SNR) in the transmission band 42–89 kHz of the investigated PRIME PLC system.
Energies 14 00777 g012
Figure 13. Impact of the supply voltage distortion grade on the duration of the failed connections in one hour of the investigated PRIME PLC system.
Energies 14 00777 g013
Table 1. Specification of the hardware components of the laboratory test circuits.
Programmable AC Source/Kikusui PCR500LASpecification
Power capacity500 VA
Input voltage variation (with respect to changes in the rated range)±0.1%
Output current variation (with respect to 0% to 100% changes in the rating)Within ±0.1 V/±0.2 V
(output voltage range 100 V/200 V)
Output frequency variation in AC mode (40–999.9 Hz)Within ±0.3%
Ripple noise: DC mode (5 Hz to 1 MHz component)0.1 Vrms or less
Output frequency stability (with respect to changes in the rated range)Within ±5 × 10⁻⁵
Output voltage waveform distortion 0.3% or less
Output voltage response speed30 µs
Compliant standardsEMC Directive 89/336/EEC
EN61326:1997/A2:2001 Emission Class A
IEC 61000-3-2:2000
IEC 61000-3-3:1995/A:2001
Reference impedances/authorised university solutionSpecification
Nominal frequency50 Hz
Nominal RMS current5 A
Nominal impedancePhase wire zA = (0.24 + j0.15)Ω for 50 Hz RA = 240 mΩ ± 0.2%, LA = 477.5 µH ± 1%
Neutral wire zN = (0.16 + j0.10) Ω for 50 Hz
RN = 160 mΩ ± 0.2%, LN = 318.3 µH ± 1%
Signal recorder/authorised university solutionSpecification
FPGA platformNational Instrument cRIO FPGA 1 MS/s
Voltage input moduleNational Instrument NI-9223 C Series
±10 V, 1 MS/s, 16-Bit, Simultaneous Input, 4-Differential Channel
Voltage TransducerLEM CV 3–1000
Primary voltage ±1000 V
Secondary voltage ±10 V
Frequency bandwidth DC ÷ 500 kHz
Accuracy 0.2%
cRIO–compact reconfigurable input output platform, CV–voltage transducer, product of LEM, DC–direct current, EMC–electromagnetic compatibility, FPGA–field-programmable gate array, IEC–International Electrotechnical Commission, LEM–Life Energy Motion Company, NI–National Instruments, PCR–programmable power supply, product of Kikusui, RMS–root mean square.
Table 2. The magnitude of particular harmonics of the supply voltage according to the permissible values of EN 50160:2015 [3].
Odd Harmonics Even Harmonics
Undividable by 3Dividable by 3
Order AmplitudeOrderAmplitudeOrderAmplitude
56.0%35.0%22.0%
75.0%91.5%41.0%
113.5%150.5%6… 240.5%
133.0%210.5%>240.5%
172.0%>210.5%
191.5%
231.5%
251.5%
>251%
Table 3. The magnitude of particular harmonics of the supply voltage used in low-frequency immunity tests according to IEC 61000-4-13 [30] addressed to the equipment of third class of the immunity.
The Harmonic Order
h = 3n + 1
Class 3The Harmonic Order
h = 3n
Class 3
Test Levels in %U1Test Levels in %U1
51239
71094
117153
137212
176272
196332
236392
256
295
313
353
373
Table 4. Characteristic parameters of the signal in the transmission band 42–89 kHz of PRIME PLC during the different scenarios of supply voltage distortion and variant types of loads.
Sinusoidal Supply VoltageNo-LoadLEDCFLInduction Motor with PWM
S(Nmax)(dBµV)87.5192.6794.0993.43
Nmax(dBµV)65.7275.6373.4783.32
SNRlocal(dB)21.7917.0420.6110.11
Psignal(dB)−31.22−23.63−25.37−24.38
Pnoise(dB)−62.42−54.26−51.68−43.35
SNRband(dB)31.2130.6326.3118.97
Distorted Supply Voltage
EN 50160 (Table 2)
No-LoadLEDCFLInduction Motor with PWM
S(Nmax)(dBµV)87.5193.5592.4692.92
Nmax(dBµV)65.7277.0878.1281.22
SNRlocal(dB)21.7916.4714.3511.70
Psignal(dB)−31.22−22.84−23.53−23.99
Pnoise(dB)−62.42−46.41−46.55−42.42
SNRband(dB)31.2123.5723.0218.43
Distorted Supply Voltage
IEC 61000-4-13 Class 3 (Table 3)
No-LoadLEDCFLInduction Motor with PWM
S(Nmax)(dBµV)87.5192.9691.8091.11
Nmax(dBµV)65.7289.8288.8691.90
SNRlocal(dB)21.793.142.94−0.79
Psignal(dB)−31.22−24.92−24.48−29.45
Pnoise(dB)−62.42−32.53−34.22−31.94
SNRband(dB)31.217.619.732.49
Nmax—local maximum magnitude of the frequency component of the background signal; S(Nmax)—local magnitude of the frequency component of the transmission signal related to Nmax; SNRlocal—signal-to-noise ratio derived on the basis of local values of S(Nmax) and Nmax; Psignal—power of the transmission signal in the transmission band; Pnoise—power of the background signal (noise) in the transmission band; SNRband—signal-to-noise ration derived on the basis of Psignal and Pnoise.
Table 5. The statistics of the transmission of the investigated PRIME PLC during the different scenarios of supply voltage distortion and variant types of loads (2 h continuous work).
Sinusoidal Supply VoltageLEDCFLInduction Motor with PWM
total number of attempted connections5395110
number of successful connections447690
number of failed connections 91920
duration of failed connections in one hour (s)2186186
Distorted supply voltage
EN 50160 (Table 2)
LEDCFLInduction motor with PWM
total number of connections1035493
number of successful connections834483
number of failed connections 201010
duration of failed connections in one hour (s)187187551
Distorted supply voltage
IEC 61000-4-13 Class 3 (Table 3)
LEDCFLInduction motor with PWM
total number of connections10610428
number of successful connections808424
number of failed connections 20204
duration of failed connections in one hour (s)371366192
Publisher’s Note: MDPI stays neutral with regard to jurisdictional claims in published maps and institutional affiliations.

