Article

An Ultra-Efficient Lightweight Electric Vehicle—Power Demand Analysis to Enable Lightweight Construction

Department of Mechanical Engineering, Politecnico di Milano, 20156 Milan, Italy
*
Author to whom correspondence should be addressed.
Energies 2021, 14(3), 766; https://doi.org/10.3390/en14030766
Submission received: 31 December 2020 / Revised: 23 January 2021 / Accepted: 28 January 2021 / Published: 1 February 2021

Abstract

:
A detailed analysis of the power demand of an ultraefficient lightweight-battery electric vehicle is performed. The aim is to overcome the problem of lightweight electric vehicles that may have a relatively bad environmental impact if their power demand is not extremely reduced. In particular, electric vehicles have a higher environmental impact during the production phase, which should be balanced by a lower impact during the service life by means of a lightweight design. As an example of an ultraefficient electric vehicle, a prototype for the Shell Eco-marathon competition is considered. A “tank-to-wheel” multiphysics model (thermo-electro-mechanical) of the vehicle was developed in “Matlab-Simscape”. The model includes the battery, the DC motors, the motor controller and the vehicle drag forces. A preliminary model validation was performed by considering experimental data acquisitions completed during the 2019 Shell Eco-marathon European competition at the Brooklands Circuit (UK). Numerical simulations are employed to assess the sharing of the energy consumption among the main dissipation sources. From the analysis, we found that the main sources of mechanical dissipation (i.e., rolling resistance, gravitational/inertial force and aerodynamic drag) have the same role in the defining the power consumption of such kind of vehicles. Moreover, the effect of the main vehicle parameters (i.e., mass, aerodynamic coefficient and tire rolling resistance coefficient) on the energy consumption was analyzed through a sensitivity analysis. Results showed a linear correlation between the variation of the parameters and the power demand, with mass exhibiting the highest influence. The results of this study provide fundamental information to address critical decisions for designing new and more efficient lightweight vehicles, as they allow the designer to clearly identify which are the main parameters to keep under control during the design phase and which are the most promising areas of action.

1. Introduction

Electric vehicles (EVs) are a key technology to achieve the objectives of improving energy diversification and of reducing air pollution and greenhouse gas emission in densely populated areas. According to the International Energy Agency (IEA), in the best-case scenario, the global electric vehicle stock will reach 245 million in 2030, more than 30 times today’s level, with an estimated annual growth of 36% [1]. Battery electric vehicles (BEVs) represent the largest share of the entire electric vehicle fleet.
A key point—still under discussion—is whether or not lightweight electric vehicles outperform other conventional vehicles in terms of environmental impact on a cradle-to-grave life cycle assessment (LCA) [2,3]. An LCA involves the entire life cycle of the vehicle, i.e., raw materials extraction, production, service life and end-of-life-treatment, to assess its environmental impact [3]. Concerning greenhouse gas emissions for instance, the weak point of lightweight EVs is the high negative environmental impact during the production phase. The strong point may be the low environmental impact in the use phase thanks to zero tailpipe emissions, to the possibility of using electricity generated from renewable sources and to a reduced energy required to cover the traversed distance during service life (mainly thanks to the lightweight construction). Figure 1 shows the environmental impact of conventional and lightweight EVs. Lightweight design of EVs, achieved through the use of optimization techniques [4] and lightweight materials, could represent a promising solution to reduce the environmental impact during service life. Despite this, the use of lightweight materials generally results in higher environmental impact in the production phase [3,5]. If lightweight EVs waste energy during service life, their environmental impact can be therefore worse than the one of conventional vehicles. The solution is envisaged in this paper, ultraefficient lightweight EVs use a much reduced amount of energy and thus overcome the initial environmental gap.
The paper is focused on the study of a prototype of ultra-efficient EV that could manage to provide a reduced environmental impact of the personal/private passenger transportation sector.
The development and deployment of EVs is encouraged by supporting policies. The European Commission, on 9 December 2020 has forwarded to the European Parliament an agenda to reduce to zero the emissions of the transport sector by 2050 [6]. To date, 17 countries have set the target of 100% zero-emission vehicles by 2050, or the complete phase-out of internal combustion engine vehicles [1]. As a consequence, the infrastructures for electric vehicle charging are continuously empowered and the research related to battery technologies is fostered, with the aim of producing BEVs with wider range.
The transition from fossil-fuel-based mobility to electric mobility is linked to intensive research activities aimed at improving the energy efficiency of vehicles. Shell Eco-marathon (SEM) [7] is an international engineering competition addressed to teams of students. The competition represents a showcase for new solutions in designing highly efficient vehicles. The aim is to complete a valid race stint using the least amount of energy, within a given time. Vehicles are classified according to their architecture (prototype and urban concept) and to three different energy classes (internal combustion engine vehicles, battery electric vehicles and hydrogen fuel cell vehicles) [7].
A team of students from Polytechnic University of Milan has taken part in the competition since 2005. During these years, several lightweight vehicles were produced, namely a hydrogen fuel cell powered prototype [8], a solar prototype [9] and two battery electric urban concepts [10,11,12]. Such vehicles were designed focusing on drag force reduction and on the maximization of the powertrain efficiency.
Multiphysics models are required to evaluate the vehicle energy consumption, examine the effect of different factors influencing the energy consumption, improve the vehicle efficiency.
In the literature, several model-based design approaches applied to Shell Eco-marathon vehicles have been proposed. In [13], a model of an electric vehicle (prototype class) has been developed in Simulink. In the model, the vehicle, the electric motor and the motor controller are simulated. The efficiency of the electric motor, the motor controller and the vehicle transmission are introduced in the form of efficiency maps derived from experimental measurements. In this way, an overall efficiency of the whole electro-mechanical power system is considered, however, any change in one of the subsystems should be experimentally assessed. The tire additional rolling resistance introduced during cornering phases is neglected. The model also includes the driver control system, which sets either the reference vehicle speed or the throttle activation in the different sectors of the circuit. In the paper, the developed model is used for finding the optimal race driving strategy that allows for the minimum energy consumption. A genetic optimization algorithm was employed for the purpose.
In [14], a model of a fuel cell vehicle was made leveraging the commercial software AMESim. In the model, the full vehicle powertrain is included, i.e., the fuel cell, the electric motor, the motor controller and the transmission. The main sources of driving resistance have been included, namely the tire rolling resistances, uphill climbing and aerodynamic drag. Even in this case, the additional resistances occurring during cornering have been neglected in order to simplify the model. The developed model has been used for deriving the optimal driving strategy to be adopted for achieving the minimum energy consumption during the race.
In [15], a similar study was conducted on an internal combustion engine-powered urban concept vehicle. A numerical model of the vehicle powertrain has been presented. The model describes the vehicle motion and computes its fuel consumption. To reduce the simulation time, the model neglects the inertia of rotational parts and the losses during cornering phases.
Olivier et al. [16] presented a multiphysics model of a fuel cell vehicle (urban concept) and its powertrain. The model provides a highly detailed description of the power losses occurring at each power system. Even in this paper, the additional drag forces during cornering phases have been neglected. Given the motor current profile, the characteristics of the track and the environmental conditions, the model computes the energy consumption of the vehicle.
The design and realization of ultraefficient lightweight vehicles is widely discussed in [8,9,10,12], with particular reference to prototype class vehicles ([8,9]) and urban concepts ([10,12]). In these papers, Simulink-based numerical models of the vehicle energy demand were developed. The additional resistant force arising during cornering was modelled through a simplified single-track model.
Numerical models are often used in the early stages of the design process and in the planning phase. The concept design of an energy efficient vehicle should start from a sensitivity analysis to assess which are the design parameters that mostly affect the overall energy demand.
Despite the large number of papers on the design and modelling of ultra-efficient lightweight vehicles, no references dealing with the study of the effect of the vehicle design parameters on the power demand have been found. This paper aims to provide a quantitative analysis of the effect of the main vehicle design parameters on the energy consumption. Actually, this is a fundamental information for the design engineers, allowing for a clear and well-defined identification of key vehicle parameters to keep under control in the design phase and of the most promising areas of action.
Some applications of sensitivity analysis to conventional road vehicles are actually present in the literature. The sensitivity analysis of the power demand of EVs is presented in [17], where the effect of environmental factors such as wind speed, rolling resistance and temperature is analyzed for different types of vehicles. In [18], a sensitivity analysis of the energy consumption of a BEV is performed, aimed at identifying the parameters with the highest impact on the energy demand. The analysis conducted in [19] reports the variation of the energy required to complete the NEDC (New European Driving Cycle) due to the variation of some design parameters (i.e., mass, rolling resistance and aerodynamic drag) for vehicles of different sizes. According to this study, the influence of the design parameters can slightly vary according to the type of vehicle. If, for instance, the vehicle mass is considered, a 10% variation of this parameter can lead to a variation of the energy consumption which ranges from 8% for compact class vehicles, up to 9% for sports cars and SUVs (sport utility vehicles). In [20], the energy consumption and performance analysis for a wide range of ICE vehicles and BEVs is performed. The main components of each vehicle subsystem are numerically modelled to estimate the physical behavior. Results show that for conventional ICE vehicles, the combustion engine losses account for the largest share of the total energy consumption, while for BEVs the energy share is more equally distributed by the road loads (tire rolling resistance and aerodynamic drag).
This paper presents a detailed analysis of the energy demand of a lightweight battery electric vehicle (urban concept) for the Shell Eco-marathon competition. The influence of the aerodynamic drag, tire rolling resistance and vehicle mass on the energy consumption is examined. The analysis is carried out for three race tracks with different characteristics, namely length, altitude, target lap time and “aggressiveness” of the track. For this purpose, a multiphysics thermo-electro-mechanical model of the vehicle has been developed.
The paper is structured as follows. In Section 2 the considered vehicle is presented; in Section 3 the developed model of the vehicle is described. Section 4 details the sensitivity analysis carried out and, finally, in Section 5 the results of the analysis are discussed.

2. Vehicle Architecture

The vehicle designed and manufactured by the Shell Eco-marathon team at the Polytechnic University of Milan is called “Leto” (Figure 2) and belongs to the urban concept class, which includes vehicles with architecture inspired by small city cars.
The vehicle body is entirely made from carbon-fiber-based composite materials and the body shape has been designed to minimize the aerodynamic drag [11]. Driver safety is the primary issue in the design of such kind of lightweight vehicles. In fact, before the on-track competition, the vehicle undergoes strict safety inspections, that are intended to certify the compliance of the vehicle with the competition rules and with safety requirements. As extensively described in [11], the vehicle frame is made from a solid floor and an upper frame connected together by an epoxy-based adhesive. The floor is a sandwich structure with an expanded polypropylene (EPP) core and carbon fiber reinforcements. The upper frame, on the other hand, features a honeycomb-based sandwich structure. The whole frame ensures protection of the driver from rollover and external collisions. A rigid bulkhead separates the driver compartment from the power compartment (i.e., battery, power system and transmission). A fireproof protection is installed on the rigid bulkhead to protect the driver compartment in case of fire.
The electric drivetrain is powered by a 48 V lithium-ion battery pack. Lithium-ion batteries are to date considered the most promising solution to power BEVs due to their high energy density, high efficiency and long lifespan [21]. Two 200 W brushed DC motors are connected to the two rear wheels, the overall nominal power of the vehicle is 400 W. In contrast to the extensive use of AC motors in conventional EVs [21], DC motors are generally preferred for such kind of vehicles [16,22], thanks to the low required power and to their simpler construction and control electronics. The transmission is realized by two gear pairs that connect each motor to the rear wheel. The gear pair features a 13-tooth pinion mounted on the motor shaft and a 192-tooth crown connected to the rear hub. A freewheel located in the wheel hub allows to transmit power only in one direction.
The vehicle speed is controlled by modulating the voltage across the motors through a PWM (pulse width modulation) signal. The PWM signal is directly controlled by the throttle. The signal controls the switching of two low-side MOSFETs (metal-oxide-semiconductor field-effect transistor) that are used to modulate the voltage across each motor.
The vehicle is equipped with a set of 95/80 R16 radial tires, specifically designed for the competition with the aim to minimize the rolling resistance.
The main parameters of the vehicle are given in Table 1.
The vehicle mass was measured on a weight scale during the official technical inspections at SEM 2019 competition. The aerodynamic drag coefficient Cx and the rolling resistance coefficient f0 were experimentally identified by means of a coastdown test on a proving ground. The obtained coefficients are consistent with those of similar urban concept vehicles competing to the Shell Eco-marathon [15,16,22] reported in Table 2 for comparison purposes.
Competition rules impose a minimum driver mass of 70 kg.
In the Shell Eco-marathon competition, urban concept vehicles must complete a predefined number of laps on the race track within a given maximum time. A stop is mandatory at the end of each lap.

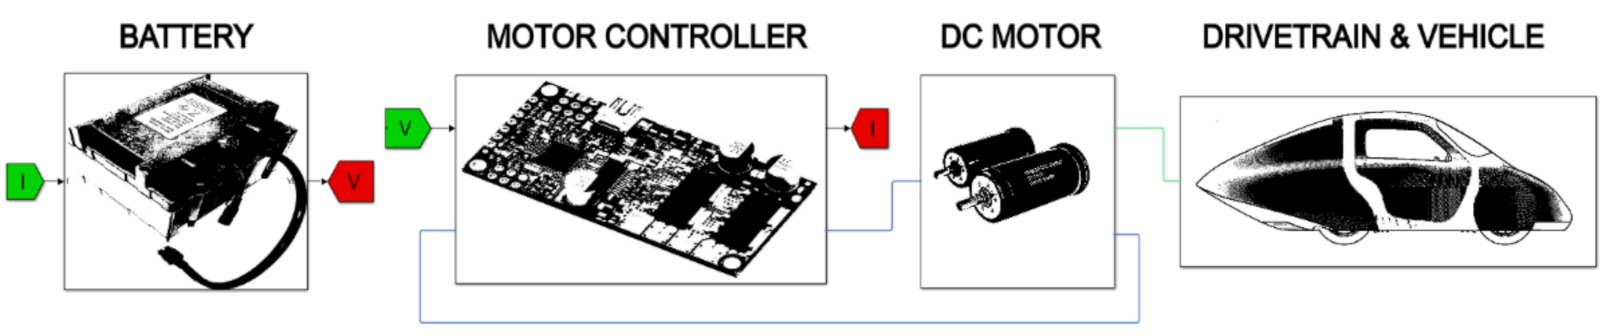
3. Multiphysics Model

A multiphysics model of the entire vehicle power system is developed in MATLAB/Simscape environment. The model consists of four main subsystems, namely the battery, the motor controller, the DC motor, the drivetrain and vehicle block. A simplified block diagram of the model is shown in Figure 3.
Given the map, the altimetry of the circuit and the time history of the throttle signal, the model computes the power demand of the vehicle.
The model allows us to:
  • evaluate the energy consumption of the vehicle;
  • assess the influence of the design parameters on the energy consumption;
  • simulate different race strategies and find the optimal one that minimizes the energy consumption.
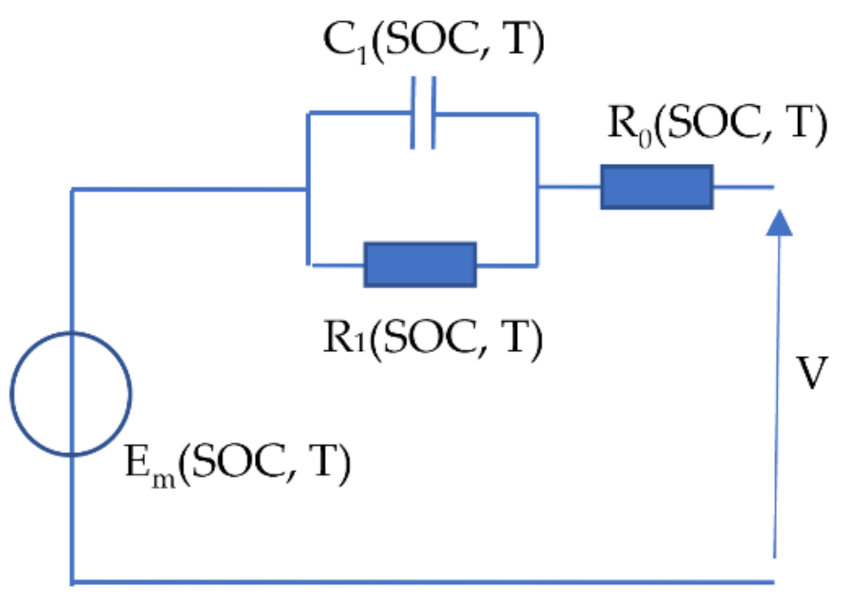
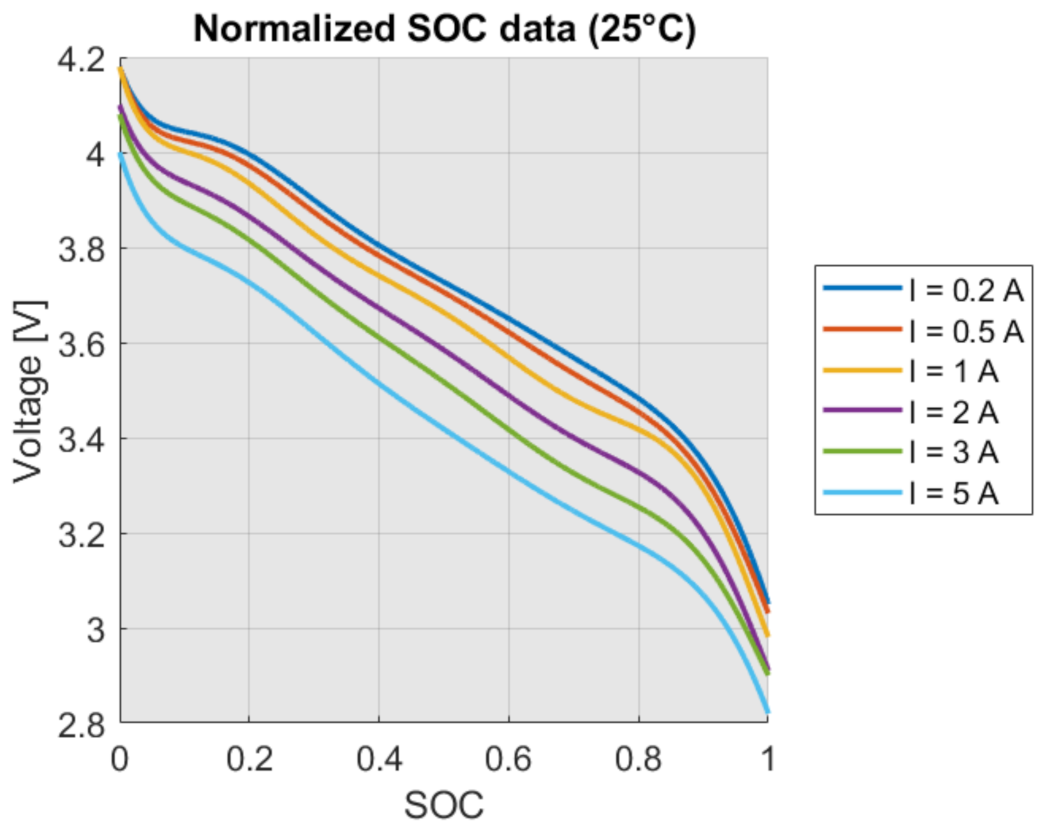
3.1. Battery Model

The lithium-ion battery pack has a 13S4P configuration of four modules connected in parallel, each one composed by the series of 13 cells. The specifications of the cell and the battery pack are summarized in Table 3.
The model of the battery pack has been implemented using the Simulink “Datasheet Battery Block” [23]. The block is based on an equivalent circuit model (ECM) of the lithium-ion cell [24,25]. The model is based on the first-order RC (resistor-capacitor) circuit of Figure 4. Each element of the equivalent circuit depends on the battery state of charge (SOC) and temperature.
As explained in [23,24], the circuit parameters are identified starting from the cell discharge curves of Figure 5 [26]. The inputs of the battery model are the instantaneous load current, the operating temperature and the initial SOC. The block outputs the effective discharge voltage of the battery pack during the vehicle operating conditions. The employed model does not account for the aging process the battery undergoes during repeated charge and discharge cycles [27]. Actually, as the vehicle is for competition purposes, the lifespan of the battery is limited and such an effect is of minor importance.

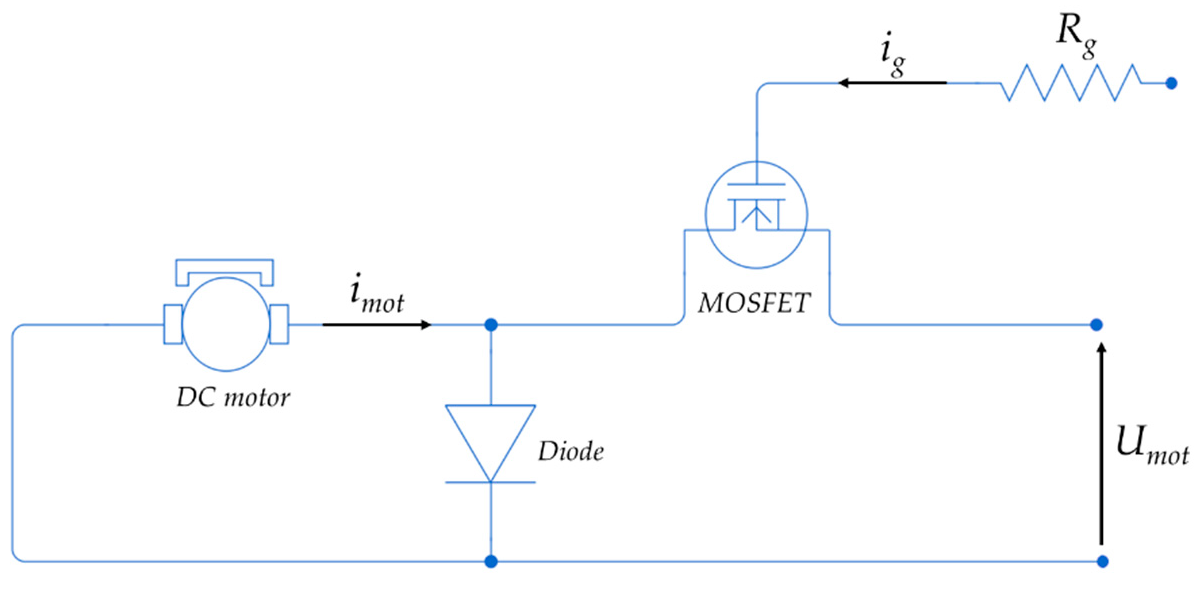
3.2. Motor Controller

The motor controller is based on a pulse width modulation (PWM) signal. The motor voltage is turned on and off at high frequency by the PWM control logic. The duty cycle, i.e., the ratio between the on time and the total PWM pulse period, determines the average level of the voltage across the motor terminals and is directly controlled by the throttle position. The resulting motor voltage varies between 0 V up to the voltage supplied by the battery. The electrical diagram of the motor controller is shown in Figure 6 and features an N-channel MOSFET connected on the negative side of the DC motor acting as a switching device. The MOSFET is activated by the gate circuit (gate resistance Rg and current ig), directly controlled by the vehicle control logic.
The motor controller (Figure 6) can be modelled as a classical nonsynchronous buck converter as explained in [16,28]. The model employs the DC-DC Simscape converter block [29] that modulates the voltage between the input and the output side, given the duty cycle. The efficiency of the DC-DC converter is defined as
η c =   P o u t P o u t + P l o s s
where Pout is the output power, while Ploss represents the power losses in the converter, which can be roughly estimated by applying the simplified equations described in [16,30].
The efficiency of the DC-DC converter depends both on the load current and the duty cycle, as shown by the map reported in Figure 7. In particular, as the current increases, the Joule losses in both the MOSFET and the freewheeling diode increase, thus causing a reduction of the efficiency. On the other hand, as the duty cycle increases, the efficiency decreases as well, mainly due to the increase of the MOSFET conduction losses [30].

3.3. DC Motor Model

The vehicle runs on two DC motors with permanent magnets and ironless core. Coreless DC motors have no iron losses, as a result, the power losses are smaller, the efficiency is higher and the no-load current is lower than conventional iron core DC motors.
Technical specifications of the DC motors used are listed in Table 4.
The DC motors are modelled using the “DC Motor Block” available in Simscape Electrical [31]. The motor block simulates the electrical and torque characteristics of the DC motor according to the equivalent circuit model in Figure 8.
According to Kirchhoff’s voltage law, the electrical equation that describes the operation of the DC motor is
U m o t = L m o t d i d t + R m o t i m o t + E M F
The thermal characteristics of the DC motor are included by simulating the effects of the copper resistance losses that convert electrical power to heat. These losses are referred as Joule power losses. Motor temperature increase affects the terminal resistance, which increases linearly according to Equation (3)
R t w = R m o t · 1 + α C u · T w 25   ° C
where Rtw is the terminal resistance at the current temperature Tw (expressed in Celsius degrees), αCu is the resistance coefficient of copper.

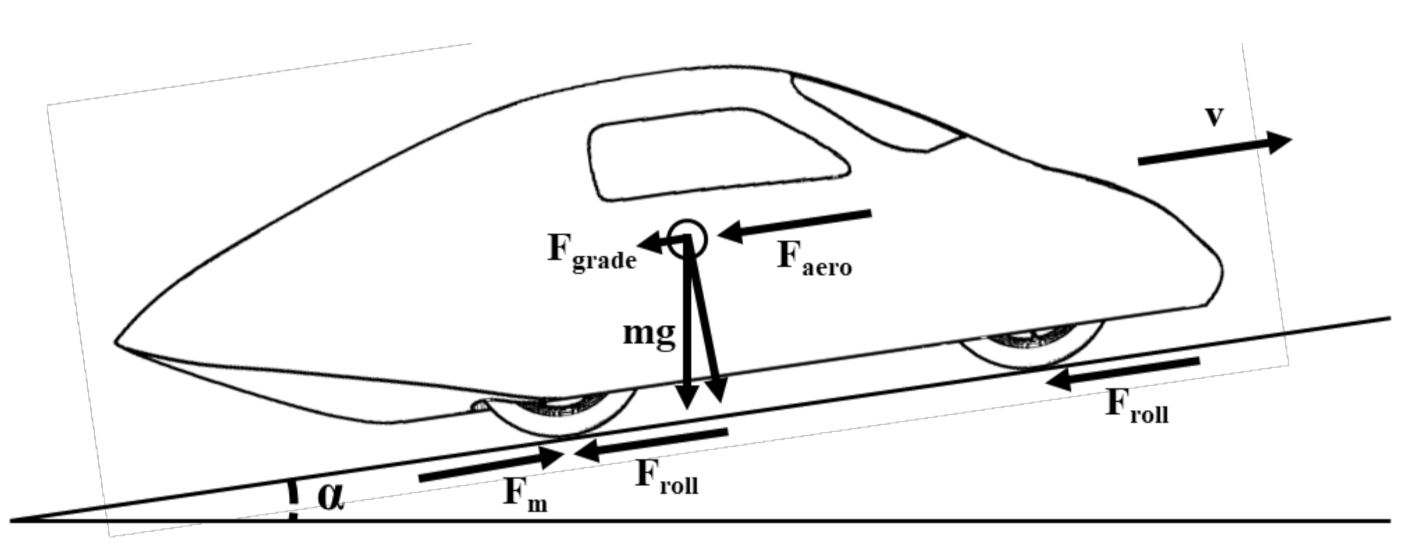
3.4. Drivetrain and Vehicle Model

The transmission consists of a “Fixed Gear Block” [32] and a “Unidirectional Clutch” [33] based on the Simscape Driveline toolbox. A global transmission efficiency (Table 1) is introduced, which accounts for friction losses in gears, hub bearings and freewheel. The efficiency of the transmission is computed by Equation (4) [34]
η t r = η b f 1 π f 1 z 1 + 1 z 2
where ηb-f accounts for the bearings and freewheel efficiencies, f is the friction coefficient between the gears and z1 and z2 are the number of teeth of pinion and crown.
The vehicle motion is described by the longitudinal vehicle model shown in Figure 9, where the traction force Fm must overcome the inertia and resistance forces acting on the vehicle. The resistance forces are the aerodynamic drag Faero, the rolling resistance Froll and the grade resistance Fgrade due to the road inclination.
The longitudinal motion of the vehicle is described by Equation (5).
m e q d v d t = F m F a e r o F r o l l F t u r n F g r a d e
The term meq considers inertial contributions due to the total vehicle mass (m = mv + mdriver) and the equivalent moment of inertia of all the rotating parts
m e q = m + 4 J w h e e l R w h e e l 2
where Rwheel is the wheels radius and Jwheel is the moment of inertia of a single wheel.
The traction force Fm reads
F m = 2 · η t r · T m τ · R w h e e l
where ηtr is the global transmission efficiency, τ is the transmission ratio, Tm is the single motor torque and the factor 2 accounts for the two driving motors. The aerodynamic drag resistance is given by Equation (8)
F a e r o =   1 2   ρ S C x v 2
where ρ is the air density at 25 °C, S is the front cross section of the vehicle and Cx is the drag coefficient. Faero is considered to be applied in the center of gravity of the vehicle as shown in Figure 9.
The rolling resistance is computed by Equation (9)
F r o l l = m g · c o s α g r a d e · f r
where the global rolling resistance coefficient fr is computed with the polynomial expression of Equation (10) [19].
f r = f 0 + f 2 v 2
During the cornering phase, an increase of the rolling resistance is expected. The lateral force has a component in the direction of forward motion of the vehicle that adds to the rolling resistance. Such a resistance can be expressed as [19]
F t u r n = m v 2 R t u r n l l F α r e a r + l R α f r o n t
where Rturn is the curve radius, αfront and αrear are the side slip angles of the front and rear axles, l is the wheelbase and lf and lr are the front and rear wheelbase respectively.
Considering small values of the side slip angles, the following equation can be employed to calculate the side slip angles of the front and rear axles
F t u r n , i = C α α i   i = f r o n t , r e a r
where Cα is the axle cornering stiffness and Fturn,i the lateral force at the front or rear axle.
Due to the quite low traction force exerted, power losses due to slippage between tire and ground are negligible.
The expression of the resistance while traveling on an uphill road is given by Equation (13)
F g r a d e =   m g · s i n α g r a d e

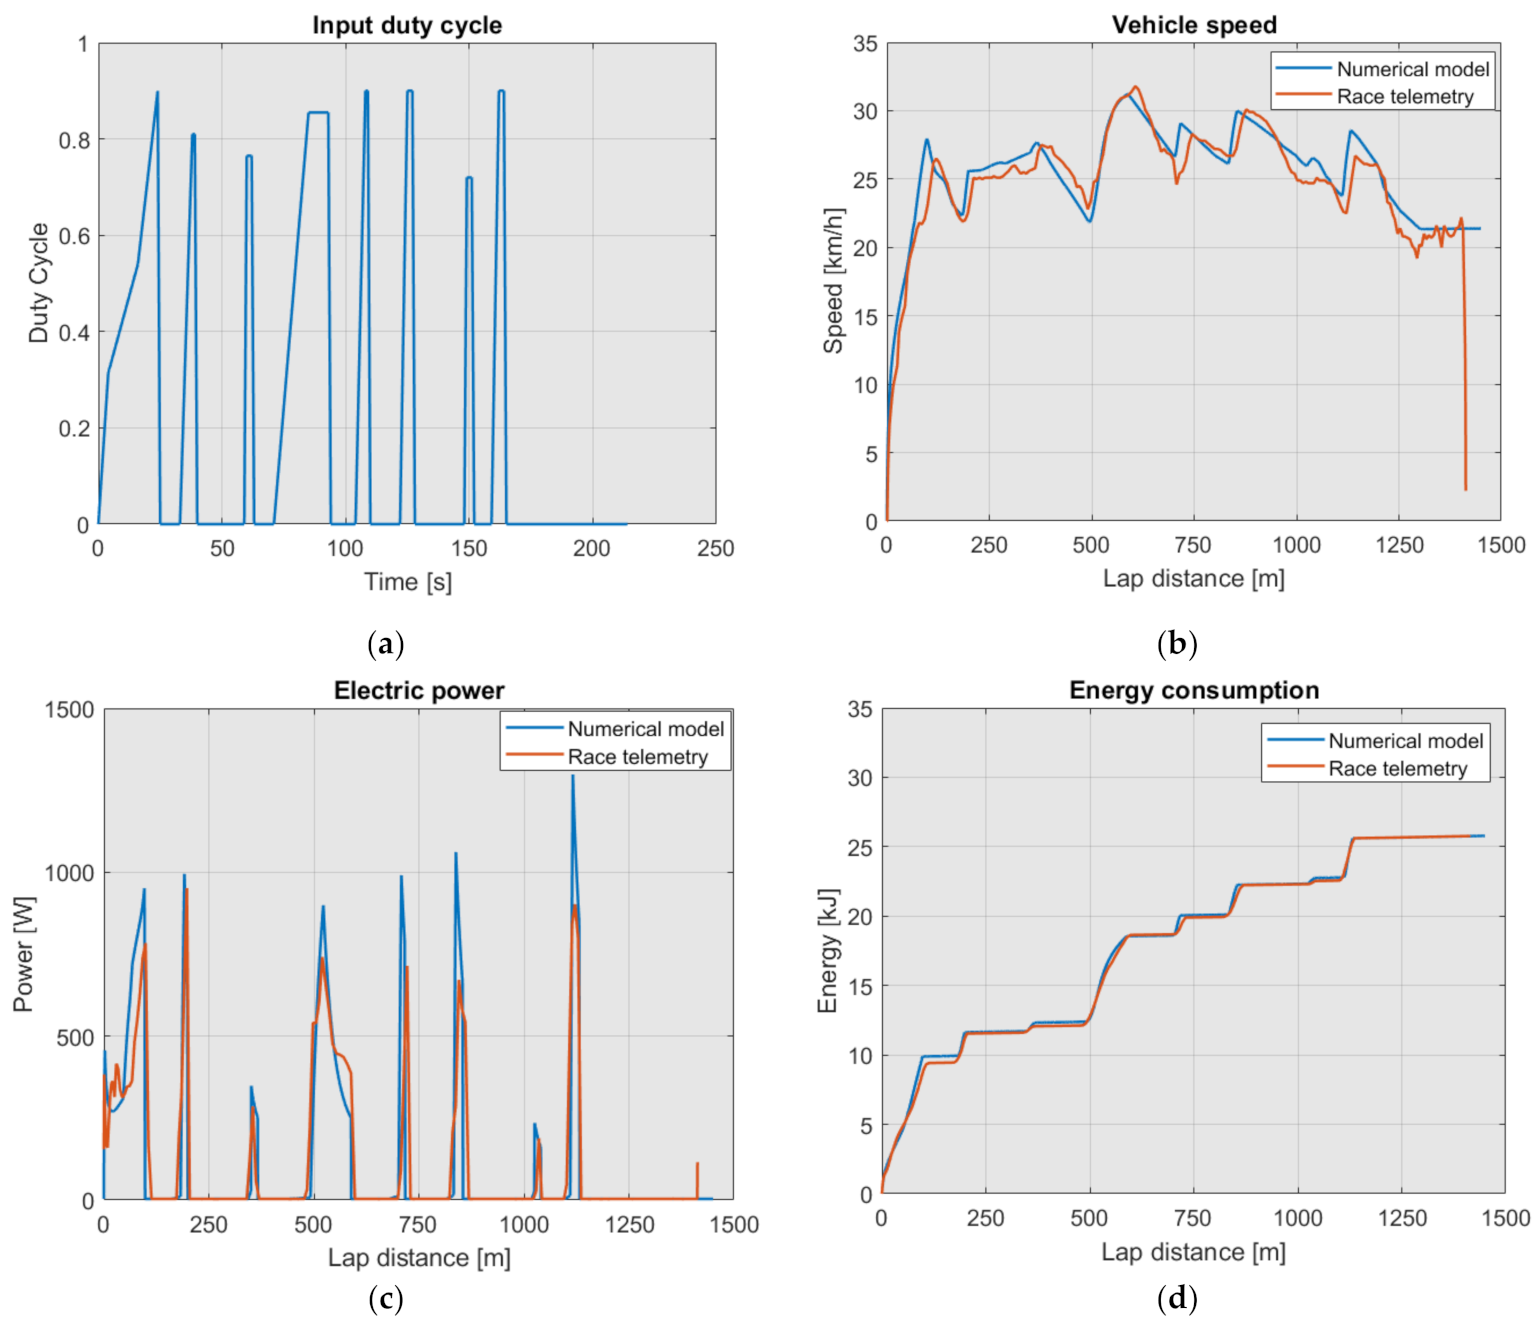
3.5. Preliminary Validation

A preliminary validation of the developed numerical model is carried out by simulating the track route of the 2019 Shell Eco-marathon competition and comparing the simulation results with the data measured during the race. During the race, each vehicle is equipped with a telemetry system provided by the competition organizers. A GPS (global positioning system) device gives information on the position, speed and acceleration of the vehicle, while the current and the voltage provided by the battery are measured by means of a joulemeter. Signals are sampled at a frequency equal to 1 Hz. From the GPS raw data, the vehicle trajectory on the track is derived (Figure 10), which is used to calculate the actual turn radii used in Equation (11).
Since the throttle signal was not acquired during the race, the time history of the input duty cycle is a posteriori reconstructed. Figure 11a shows the throttle profile (i.e., the PWM duty cycle) during a single lap of the circuit; the time history shows eight different accelerations and in the last part of the lap (approximately after 160 s) a coasting strategy is adopted. Moreover, as highlighted by the graph of Figure 11a, the maximum attainable PWM duty cycle was limited to 90% for technical reasons.
Figure 11b–d show the comparison between the numerical simulation and the experimental data acquired during a single race lap in terms of vehicle speed, power and energy consumption respectively.
Figure 11b shows the vehicle speed as function of the lap distance; in the initial phase, the vehicle accelerates up to a speed of about 25 km/h, followed by a central sector where the driver maintains an average speed of 26 km/h by means of a series of short accelerations and coasting periods. In the last sector (after approximately 1100 m), the vehicle is left in a final coastdown phase up to the finish line. In the very last few meters, the driver activates the brakes to execute the final stop (not modelled in the simulation). From the comparison between modelled and measured speed (blue and red lines of Figure 11b), a good correlation is outlined, with less than 10% variation.
The power consumption is shown in Figure 11c, and is calculated by multiplying the voltage and current provided by the battery. Even in this case, the correlation between numerical (blue line) and experimental (red line) data is satisfactory, with the numerical model slightly overestimating the power peaks. In the model, a constant power consumption equal to 3.5 W is added, to account for the overall power demand of the vehicle electrical and auxiliary system.
Finally, Figure 11d shows the comparison of the energy consumption during the whole lap, calculated by integrating the power profile over time. The difference between the numerical and experimental values on the total energy consumption on the considered lap is less than 0.3%.

4. Sensitivity Analysis

To assess the influence of the main vehicle parameters on the energy consumption, a sensitivity analysis was performed by means of the validated model described in Section 3.
Three main vehicle parameters were considered, namely the coefficient S∙Cx that reflects the aerodynamic resistance, the tire rolling resistance coefficient f0 and the total mass m, sum of the vehicle mass and the mass of the driver. Each parameter was varied while keeping all the others fixed and its effect on the energy required to complete a single lap was analyzed. After modifying the selected vehicle parameter, the input throttle profile was slightly adjusted to maintain the reference speed profile, i.e., the sensitivity analysis was done by maintaining the same reference vehicle speed over the entire lap.
The sensitivity analyses were carried out on three different circuits, namely
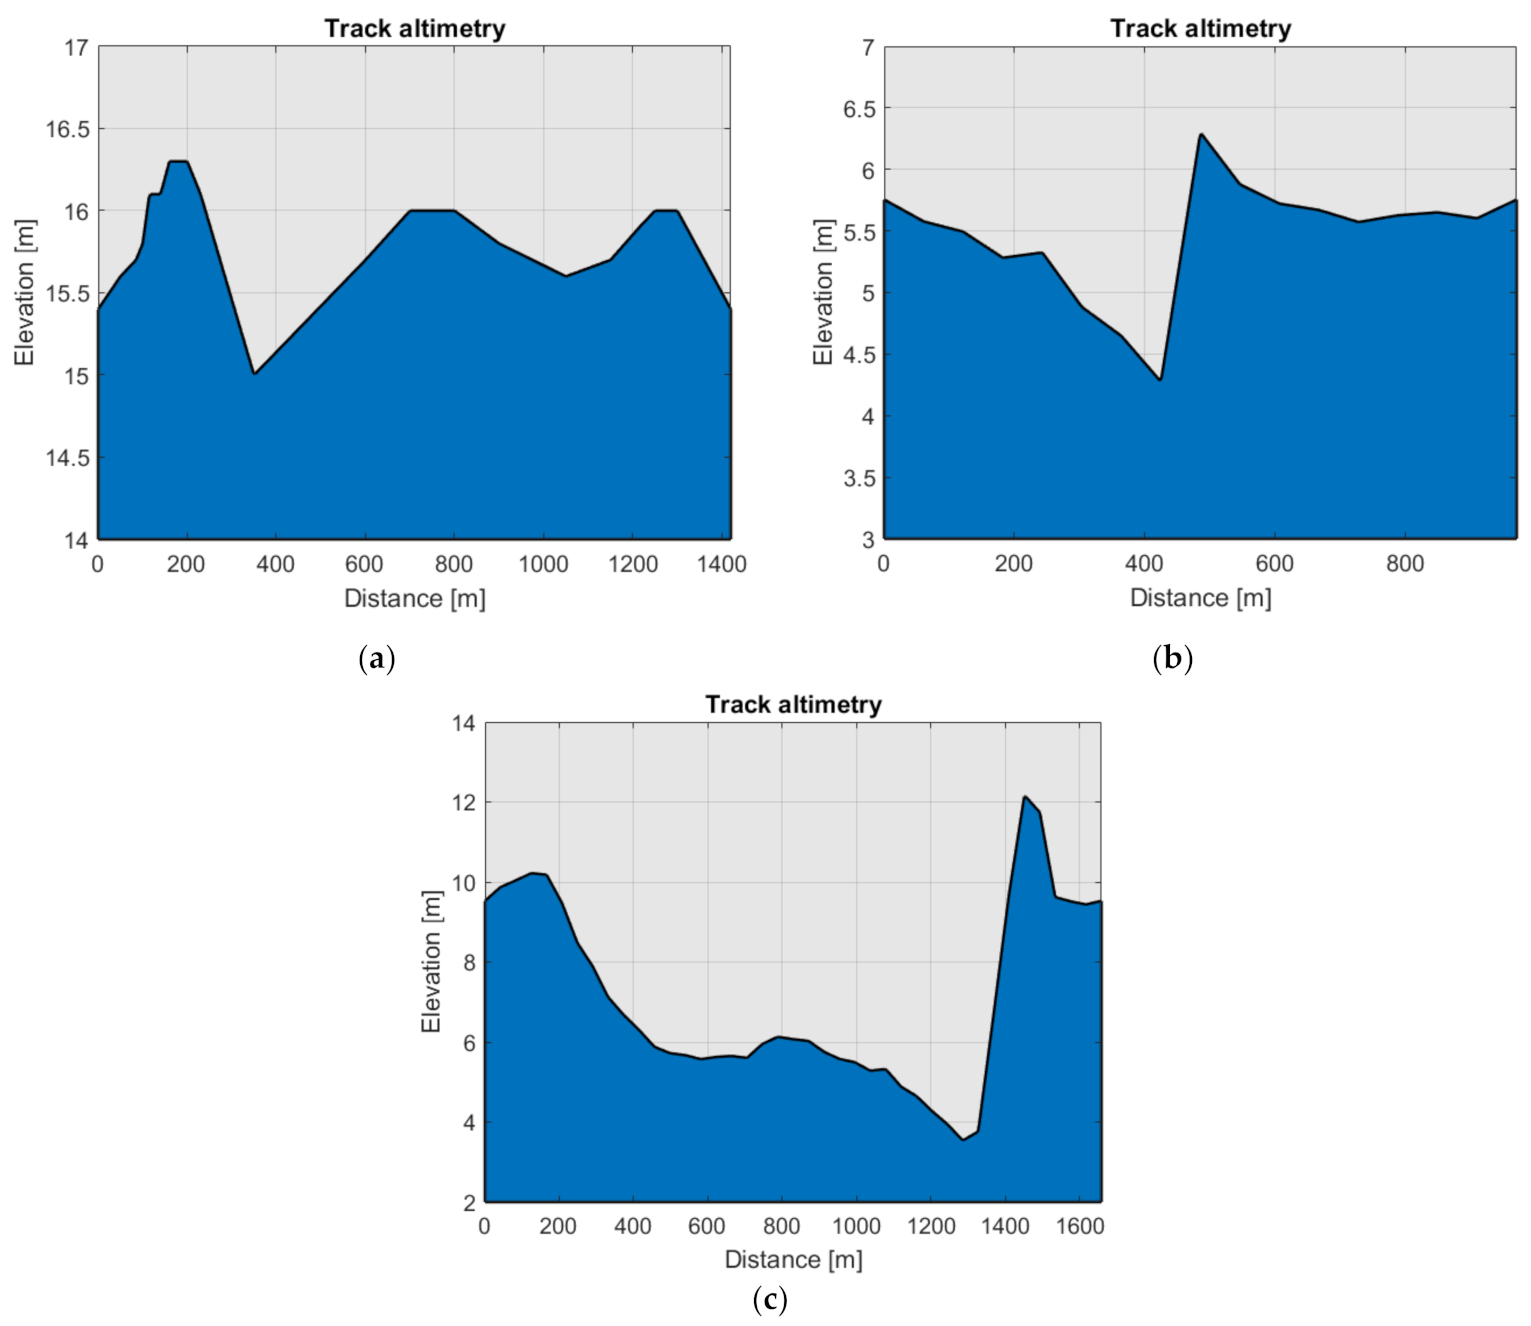
  • Brooklands Circuit (UK)—Shell Eco-marathon Europe 2019 (Circuit 1);
  • Queen Elizabeth Park, London (UK)—Shell Eco-marathon Europe 2018 (Circuit 2);
  • Queen Elizabeth Park, London (UK)—Shell Eco-marathon Europe 2017 (Circuit 3).
The different tracks were classified according to several parameters, such as the distance and the target time to complete a lap, which define the average travel speed. As shown in Figure 12, the considered circuits differed also in terms of elevation variation. Moreover, track routes were classified according to the aggressiveness parameter A, computed as shown in Equation (14) [35]
A = i = 1 n t i , 1 t i , 2 a · v d t s
where a is the forward acceleration, v the speed of the vehicle, n is the number of acceleration periods, ti,1 and ti,2 are the start and end time of the i-th acceleration period and s is the distance of an entire track lap. The aggressiveness parameter is a measure of the severity of the track route, based on the magnitude and duration of the acceleration periods required to speed up the vehicle.
The characteristics of a single lap for the simulated circuits are summarized in Table 5.

5. Results and Discussion

The contribution of each source of energy dissipation to the total energy consumption is shown in Figure 13a–c for the three different circuits analyzed (Circuit 1, Circuit 2 and Circuit 3, respectively). From the graphs it turns out that the three main sources of mechanical dissipations (i.e., rolling resistance, aerodynamic drag and vehicle gravitational/inertial effects) have comparable roles in the definition of the whole energy consumption of an urban concept class vehicle. For Circuit 1 and Circuit 2, the greatest impact on the energy consumption was given by the aerodynamic drag and the rolling resistance. Together, they provided more than half of the total energy consumption. Considering Circuit 3, the highest share was represented by the slope resistance, mainly because of its higher elevation variation with respect to the other circuits. The contribution of the inertia of the vehicle correlates to the aggressiveness factor of the track, with Circuit 2 showing a slightly higher share. Finally, it is worth underlining that for all the considered circuits, the additional rolling resistance during cornering phases played a small, but not negligible, role in the overall energy consumption.
The effect of the vehicle parameters variation on the energy consumption on Circuit 1 is shown in Figure 14, where the results refer to a range of variation of ±15% of each parameter with respect to the nominal value. The energy variation shows a linear trend for all the analyzed parameters. The different slopes demonstrate that the highest sensitivity is related to the vehicle mass. Mass reduction is therefore the most effective way to reduce the energy consumption.
Numerical simulations exhibit a similar trend also for the other analyzed tracks. Actually, it is possible to appreciate a higher sensitivity to the mass for Circuit 3 as shown in Figure 15. This can be explained by the large elevation variation of this track compared to the others.
The sensitivity on the rolling resistance coefficient does not show a significant dependency on the track. The aerodynamic coefficient, on the other hand shows a higher influence on Circuit 3, which can be explained by the higher average speed on Circuit 3 with respect to the others (Table 5).

6. Conclusions

In this paper, a detailed analysis of the power demand of an urban concept lightweight BEV for the Shell Eco-marathon competition is performed.
A “tank to wheel” model of the vehicle power system has been developed in order to compute the energy consumption. Such an analysis is propaedeutic to a subsequent cradle-to-grave life cycle analysis. Since the problem of lightweight electric vehicles is to reduce the power demand at the least extent, the paper has focused on modelling each source of energy dissipation during service life.
The main drag forces are considered, namely rolling resistance, grade resistance and aerodynamic drag. Additionally, the increase in rolling resistance during cornering is considered by means of a simplified equation derived for a single-track vehicle model.
A simple thermo-electro-mechanical model of the DC motors, motor controller and of the lithium-ion battery pack has been developed. A preliminary validation of the model is presented, by comparing numerical results with data measured during the 2019 Shell Eco-marathon competition. The experimental validation shows a good level of accuracy of the developed model.
Numerical simulations performed on three different race tracks show that:
  • the rolling resistance, the aerodynamic drag and the inertial/grade effect have comparable roles in defining the overall energy consumption of the vehicle;
  • unless the track has consistent uphill parts, rolling resistance and aerodynamic drag are the major contributors to the energy consumption. Together they give from 44% to 53% of the total energy consumption;
  • the power losses due to vehicle inertia are related to the aggressiveness parameter of the track, ranging from 10% to 15%; additional resistances during the cornering phases show a non-negligible contribution, ranging from 5% to 12%, depending on the track.
A sensitivity analysis of the energy consumption with respect to the main vehicle design parameters is performed on the same three tracks. The analyzed parameters are the vehicle mass, the tire rolling coefficient and the drag aerodynamic coefficient. Results show that:
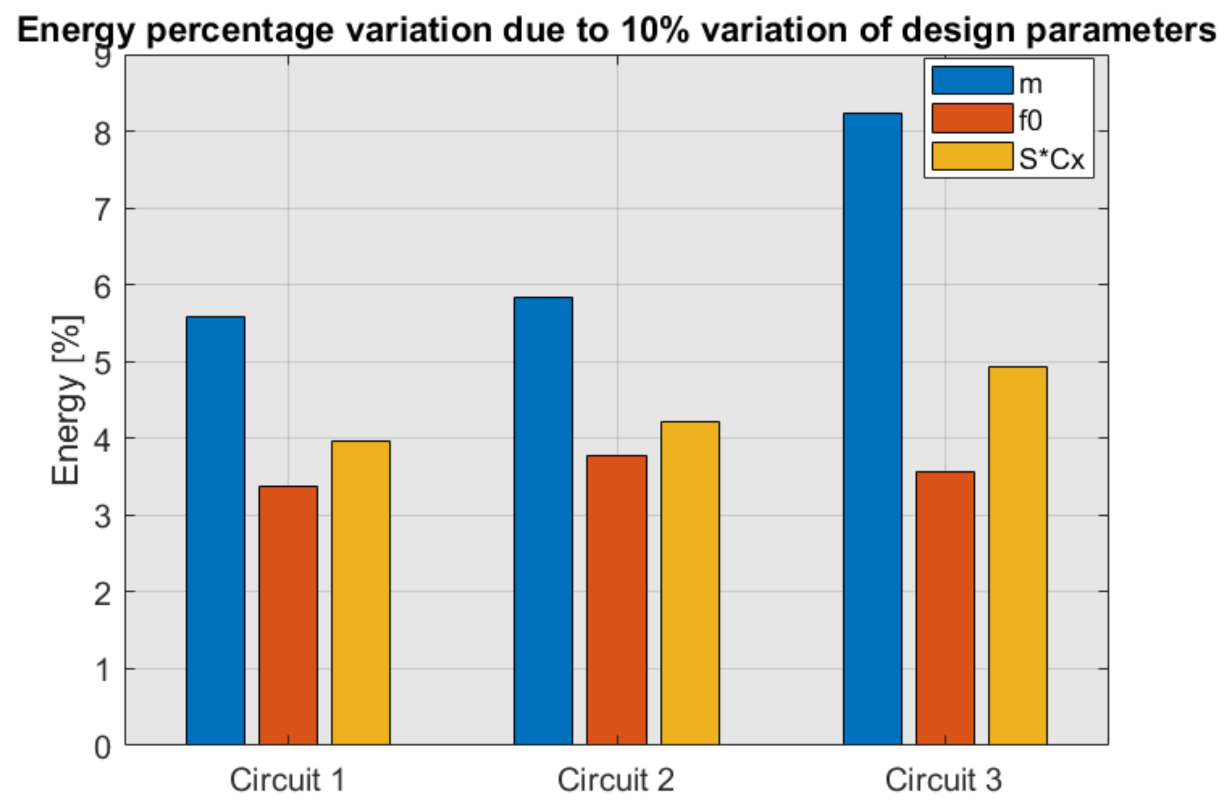
  • the energy variation exhibits a linear trend for all the analyzed parameters;
  • for all the three considered tracks, a reduction of the vehicle mass provides the highest benefits in terms of energy reduction. In particular, a 10% reduction of the vehicle mass leads to an energy consumption reduction ranging from 5.5% to 8%, depending on the track;
  • tire rolling coefficient and aerodynamic drag coefficient provide comparable effects on the energy consumption, with contributions ranging from 3% to 5%.
As result, the paper provides a clear outline of the energy demand of a lightweight urban concept electric vehicle designed for the Shell Eco-marathon competition. Moreover, the outcomes of this study provide a fundamental support to designers in addressing critical design decisions for the actual deployment of new lightweight electric vehicles. Actually, such vehicles need very low energy demand during service life to offer a reduced environmental impact with respect to conventional vehicles, the paper has contributed to covering this gap.

Author Contributions

Conceptualization, methodology, validation, formal analysis, writing—draft preparation, P.S. and F.B.; visualization, supervision, writing—review and editing, project administration, G.M. and M.G. All authors have read and agreed to the published version of the manuscript.

Funding

This research received no external funding.

Acknowledgments

The authors wish to acknowledge Daniele Bertucco and all the students of Team “MeccE” (http://sem.mecc.polimi.it/) of Politecnico di Milano for the support provided during the experimental tests.

Conflicts of Interest

The authors declare no conflict of interest.

References

  1. IEA. Global EV Outlook 2020; IEA: Paris, France, 2020; Available online: https://www.iea.org/reports/global-ev-outlook-2020 (accessed on 1 December 2020).
  2. Hawkins, T.R.; Gausen, O.M.; Strømman, A.H. Environmental impacts of hybrid and electric vehicles-a review. Int. J. Life Cycle Assess. 2012, 17, 997–1014. [Google Scholar] [CrossRef]
  3. Egede, P. Electric Vehicles, Lightweight Design and Environmental Impacts. In Environmental Assessment of Lightweight Electric Vehicles; Springer International Publishing: Berlin, Germany, 2017; ISBN 978-3-319-40277-2. [Google Scholar] [CrossRef]
  4. Ballo, F.M.; Gobbi, M.; Mastinu, G.; Previati, G. Optimal Lightweight Construction Principles; Springer International Publishing: Berlin, Germany, 2021. [Google Scholar]
  5. Mayyas, A.; Omar, M.; Hayajneh, M.; Mayyas, A.R. Vehicle’s lightweight design vs. electrification from life cycle assessment perspective. J. Clean. Prod. 2017, 167, 687–701. [Google Scholar] [CrossRef]
  6. European Commission: DG Mobility and Transport. Sustainable and Smart Mobility Strategy—Putting European Transport on Track for the Future. 2020. Available online: https://ec.europa.eu/transport/sites/transport/files/legislation/com20200789.pdf (accessed on 1 December 2020).
  7. Shell Eco-marathon. Shell Eco-Marathon 2021 Official Rules Chapter 1. 2020. Available online: https://www.makethefuture.shell/en-gb/shell-eco-marathon/global-rules (accessed on 1 December 2020).
  8. Carmeli, M.S.; Castelli-Dezza, F.; Galmarini, G.; Mauri, M.; Piegari, L. A vehicle with very low fuel consumption: Realization, analysis and optimization. In Proceedings of the The IX International Conference on Electrical Machines—ICEM 2010, Monte-Carlo, Monaco, 25–27 March 2014; IEEE: Rome, Italy, 2010. [Google Scholar]
  9. Galmarini, G.; Dell’Agostino, S.; Gobbi, M.; Mastinu, G. Solar prototype for shell-eco marathon race. SAE Technical Paper. 28 March 2017. Available online: https://www.sae.org/publications/technical-papers/content/2017-01-1260/?PC=DL2BUY (accessed on 1 December 2020). [CrossRef]
  10. Galmarini, G.; Gobbi, M.; Mastinu, G. Design, construction and employment of a sustainable “urban concept” race vehicle. Proc. ASME Des. Eng. Tech. Conf. 2012, 6, 459–468. [Google Scholar]
  11. Stabile, P.; Ballo, F.; Gobbi, M.; Mastinu, G. Innovative chassis made from EPP and CFRP of an urban-concept vehicle. In Proceedings of the ASME 2020 International Design Engineering Technical Conferences and Computers and Information in Engineering Conference, 17–19 August 2020. Virtual, Online. [Google Scholar]
  12. Carmeli, M.S.; Castelli-Dezza, F.; Galmarini, G.; Mastinu, G.; Mauri, M. A urban vehicle with very low fuel consumption: Realization, analysis and optimization. In Proceedings of the 2014 9th International Conference on Ecological Vehicles and Renewable Energies, EVER 2014, Monte-Carlo, Monaco, 25–27 March 2014; IEEE: Monte Carlo, Monaco, 2014; pp. 5–10. [Google Scholar]
  13. Targosz, M.; Skarka, W.; Przystałka, P. Model-based optimization of velocity strategy for lightweight electric racing cars. J. Adv. Transp. 2018, 2018, 1–20. [Google Scholar] [CrossRef] [Green Version]
  14. Carello, M.; Bertipaglia, A.; Messana, A.; Airale, A.G.; Sisca, L. Modeling and optimization of the consumption of a three-wheeled vehicle. SAE Technical Papers. 2 April 2019, pp. 1–9. Available online: https://www.sae.org/publications/technical-papers/content/2019-01-0164/ (accessed on 1 December 2020). [CrossRef]
  15. Sawulski, J.; Ławryńczuk, M. Optimization of control strategy for a low fuel consumption vehicle engine. Inf. Sci. 2019, 493, 192–216. [Google Scholar] [CrossRef]
  16. Olivier, J.C.; Wasselynck, G.; Chevalier, S.; Auvity, B.; Josset, C.; Trichet, D.; Squadrito, G.; Bernard, N. Multiphysics modeling and optimization of the driving strategy of a light duty fuel cell vehicle. Int. J. Hydrog. Energy 2017, 42, 26943–26955. [Google Scholar] [CrossRef]
  17. Yi, Z.; Bauer, P.H. Sensitivity analysis of environmental factors for electric vehicles energy consumption. In Proceedings of the 2015 IEEE Vehicle Power and Propulsion Conference (VPPC), Montreal, QC, Canada, 19–22 October 2015. [Google Scholar]
  18. Asamer, J.; Graser, A.; Heilmann, B.; Ruthmair, M. Sensitivity analysis for energy demand estimation of electric vehicles. Transp. Res. Part D Transp. Environ. 2016, 46, 182–199. [Google Scholar] [CrossRef]
  19. Mastinu, G. Road and Off-Road Vehicle System Dynamic Handbook; Mastinu, G., Plöchl, M., Eds.; CRC Press: Boca Raton, FL, USA, 2014. [Google Scholar]
  20. Holjevac, N.; Cheli, F.; Gobbi, M. A simulation-based concept design approach for combustion engine and battery electric vehicles. Proc. Inst. Mech. Eng. Part D J. Automob. Eng. 2019, 233, 1950–1967. [Google Scholar] [CrossRef]
  21. Mahmoudzadeh Andwari, A.; Pesiridis, A.; Rajoo, S.; Martinez-Botas, R.; Esfahanian, V. A review of battery electric vehicle technology and readiness levels. Renew. Sustain. Energy Rev. 2017, 78, 414–430. [Google Scholar] [CrossRef]
  22. Gechev, T.; Punov, P. Driving strategy for minimal energy consumption of an ultra-energy-efficient vehicle in Shell Eco-marathon competition. IOP Conf. Ser. Mater. Sci. Eng. 2020, 1002, 012018. [Google Scholar] [CrossRef]
  23. Datasheet Battery. Available online: https://it.mathworks.com/help/autoblks/ref/datasheetbattery.html (accessed on 1 December 2020).
  24. Huria, T.; Ceraolo, M.; Gazzarri, J.; Jackey, R. High fidelity electrical model with thermal dependence for characterization and simulation of high power lithium battery cells. In Proceedings of the 2012 IEEE International Electric Vehicle Conference, IEVC, Greenville, SC, USA, 4–8 March 2012; IEEE: Greenville, SC, USA, 2012. [Google Scholar]
  25. Wei, Z.; Dong, G.; Zhang, X.; Pou, J.; Quan, Z.; He, H. Noise-immune model identification and state-of-charge estimation for lithium-ion battery using bilinear parameterization. IEEE Trans. Ind. Electron. 2021, 68, 312–323. [Google Scholar] [CrossRef]
  26. Samsung INR18650-35E Datasheet. Available online: https://lygte-info.dk/review/batteries2012/SamsungINR18650-35E 3500mAh (Pink) UK.html (accessed on 1 December 2020).
  27. Wu, J.; Wei, Z.; Li, W.; Wang, Y.; Li, Y.; Sauer, D. Battery thermal- and health-constrained energy management for hybrid electric bus based on soft actor-critic drl algorithm. IEEE Trans. Ind. Inform. 2020, 3203, 1. [Google Scholar] [CrossRef]
  28. Olivier, J.C.; Wasselynck, G.; Ireena, D.T.; Auvity, B.; Josset, C.; Le-Bozec, C.; Maindru, P. Power source to wheel model of a high efficiency fuel cell based vehicle. In Proceedings of the IEEE Vehicle Power and Propulsion Conference, Lille, France, 1–3 September 2010; IEEE: Lille, France, 2010; pp. 1–6. [Google Scholar]
  29. Average-Value Chopper. Available online: https://it.mathworks.com/help/physmod/sps/ref/averagevaluechopper.html (accessed on 1 December 2020).
  30. Olivier, J.C.; Wasselynck, G.; Trichet, D.; Auvity, B.; Josset, C.; Maindru, P.; Machmoum, M. Light-duty fuel-cell vehicle designed for energetic races. Eur. J. Electr. Eng. 2011, 14, 215–236. [Google Scholar]
  31. DC Motor. Available online: https://it.mathworks.com/help/physmod/sps/ref/dcmotor.html (accessed on 1 December 2020).
  32. Simple Gear. Available online: https://it.mathworks.com/help/physmod/sdl/ref/simplegear.html (accessed on 1 December 2020).
  33. Unidirectional Clutch. Available online: https://it.mathworks.com/help/physmod/sdl/ref/unidirectionalclutch.html (accessed on 1 December 2020).
  34. Galmarini, G. Costruzione ed Impiego di un Veicolo per la Competizione Shell Eco-Marathon; Politecnico di Milano: Milan, Italy, 2010. [Google Scholar]
  35. Kivekäs, K.; Lajunen, A.; Vepsäläinen, J.; Tammi, K. City bus powertrain comparison: Driving cycle variation and passenger load sensitivity analysis. Energies 2018, 11, 1755. [Google Scholar] [CrossRef] [Green Version]
Figure 1. The key problem of lightweight electric vehicles (EVs). High environmental impact during construction and possible too high energy consumption during service life. The solution is an ultraefficient lightweight EV which has extremely low drag. Adapted from [3].
Energies 14 00766 g001
Figure 2. The urban concept class vehicle studied in this paper.
Energies 14 00766 g002
Figure 3. Numerical model block diagram.
Energies 14 00766 g003
Figure 4. Battery equivalent RC circuit.
Energies 14 00766 g004
Figure 5. Samsung INR18650-35E normalized discharge curves at constant temperature (25 °C).
Energies 14 00766 g005
Figure 6. Scheme of the motor controller.
Energies 14 00766 g006
Figure 7. Efficiency of the power converter with respect to current and duty cycle values.
Energies 14 00766 g007
Figure 8. DC motor equivalent circuit.
Energies 14 00766 g008
Figure 9. Forces acting on the vehicle.
Energies 14 00766 g009
Figure 10. Vehicle trajectory.
Energies 14 00766 g010
Figure 11. Preliminary validation of the numerical model: (a) time history of the input throttle; (b) speed profile; (c) electric power profile; (d) energy consumption during the whole lap.
Energies 14 00766 g011
Figure 12. Elevation of (a) Circuit 1; (b) Circuit 2; (c) Circuit 3.
Energies 14 00766 g012
Figure 13. Total energy consumption share for (a) Circuit 1; (b) Circuit 2; (c) Circuit 3.
Energies 14 00766 g013aEnergies 14 00766 g013b
Figure 14. Energy percentage variation due to percentage variation of the design parameters for the Circuit 1. Circles: numerical simulations. Dashed lines: linear trend.
Energies 14 00766 g014
Figure 15. Energy percentage variation for the three tracks due to percentage variation of (a) vehicle mass; (b) tire rolling coefficient; (c) aerodynamic drag coefficient.
Energies 14 00766 g015
Table 1. Parameters of the vehicle.
ParameterSymbolValue
Vehicle mass (without driver) mv92 kg
Front section areaS0.95 m2
Aerodynamic drag coefficientCx0.102
Rolling resistance coefficientf00.0026
Transmission ratioτ192/13
Transmission efficiencyηtr0.96
Table 2. Parameters of similar urban concept vehicles made for Shell Eco-marathon (SEM).
ParameterCityjoule [16] PAKS [15]TUS Team Vehicle [22]
mv150 kg121 kg170 kg
S0.88 m21.008 m20.795 m2
Cx0.10.3020.136
f00.00210.001330.004
Table 3. Battery pack specifications.
ParameterValue
Number of modules in parallel 4
Number of cells in series per module13
Cell nominal capacity3500 mAh
Cell nominal voltage3.6–3.7 V
Cell maximum discharge current13 A
Cell discharge voltage2.65 V
Cell weight48 g
Table 4. DC motor specifications.
ParameterValue
Nominal voltage 48 V
No load speed4900 rpm
No load current88.4 mA
Stall torque7370 mNm
Stall current78.9 A
Maximum efficiency0.94
Terminal resistance0.698 Ω
Terminal inductance0.423 mH
Torque constant93.4 mNm/A
Speed constant102 rpm/V
Rotor inertia 542 gcm2
Weight1100 g
Table 5. Parameters of the tracks.
ParameterCircuit 1Circuit 2Circuit 3
Distance [m] 14209701659
Target time [s]215141235
Average speed [km/h]23.824.825.4
Difference in altitude [m]2.32.110.4
Aggressiveness [m/s2]0.02750.08420.0339
Publisher’s Note: MDPI stays neutral with regard to jurisdictional claims in published maps and institutional affiliations.

