Abstract
This paper, for the first time, investigates the possibility of exploiting a nonlinear bistable snap-through buckling structure employing piezoelectric transducers, to implement an autonomous sensor of mechanical vibrations, with an embedded energy harvesting functionality. The device is operated in the presence of noisy vibrations superimposed on a subthreshold deterministic (sinusoidal) input signal. While the capability of the device to harvest a significant amount of energy has been demonstrated in previous works, here, we focus on the signal processing methodology aimed to extract from the sensor output the information about the noise level (in terms of the standard deviation) and the root mean square amplitude of the deterministic component. The developed methodology, supported by experimental evidence, removes the contribution to the overall piezoelectric output voltage ascribable to the deterministic component using a thresholding and windowing algorithm. The contribution to the output voltage due to the noise can be used to unambiguously estimate the noise level. Moreover, an analytical model to estimate, from the measurement of the output voltage, the RMS amplitude of the deterministic input and the noise-related component is proposed.
1. Introduction
A large body of work on the possibility of implementing novel autonomous (or self-powered) sensors has been produced in the past decade. Thanks to the development of new low power demanding electronics, such as wireless transceivers and power management electronics specifically designed for energy harvesting applications, new autonomous measurement systems, for use as standalone devices or nodes of a distributed wireless sensor network, are being developed. Such solutions are of high interest in many fields, including robotics, where it could allow to power sensor nodes by scavenging energy from the environment, such as vibrations during locomotion, temperature gradient, or other sources [1,2,3], instead of using external batteries.
Typically, the architecture of the autonomous measurement system exploits a traditional sensor, dedicated conditioning electronics, and a processing unit with data communication capabilities. The system is usually powered by batteries, whose charge can be sustained through energy harvesting techniques. In some cases, the electronics are directly powered by the harvester [4]. Recent reviews of energy harvesting technologies for self-powered sensors are presented in [5,6]. Other examples of autonomous sensor nodes are discussed in [7,8,9,10].
A concept of a battery-less accelerometer without any additional power source has been proposed in [7]. The implemented concept exploited a piezoelectric cantilever as a sensing element (accelerometer) capable of generating electric charges from vibrations to drive a light-emitting diode (LED) providing information on the input acceleration by the period of the pulsed light. The generated charges were accumulated in a low-leakage storage capacitor up to a switching threshold and then discharged into the LED through a low-leakage switch constructed with cascading metal-oxide-semiconductor field-effect transistors (MOSFETs).
The measurement of vibrations, aimed at the monitoring of a rotating shaft health, is the main purpose of the energy-autonomous wireless sensor presented in [8]. The vibrations are measured with a battery-powered wireless sensor node including an accelerometer, a microcontroller unit, a radio transmitter, and a flash memory. An annular thermoelectric generator (TEG) exploiting the Seebeck effect to produce electrical power from the heat flux caused by the temperature gradient between the shaft and the surrounding air is proposed to recharge the battery.
An autonomous wireless wind sensor aimed at providing information about the wind speed for the sake of wildfire spread monitoring has been discussed in [9]. The sensor node consists of a wind turbine generator acting as both wind energy harvester and wind speed sensor and dedicated electronics for data processing and communication. Experiments have shown that at a low wind speed of around 3 m/s, the power harvested (around 7.7 mW), using a maximum power point tracking strategy, is sufficient to sustain the operation of the sensor node. Information about the wind speed is sensed by measuring the equivalent electrical output voltage of the wind turbine generator.
In [10], the design and implementation of a self-sustainable wireless sensor node with an accelerometer-based algorithm for wear detection of a band saw have been presented. The node uses a very low power accelerometer and a microcontroller architecture implementing also data communication. To provide energy to the system, a TEG-based energy harvester has been adopted together with a dedicated power management unit [11]. The thermoelectric generator operated in real conditions has been observed to provide an average power of 1–2 mW.
In [12], the authors proposed a wireless condition monitoring sensor system powered by ambient vibrations specifically designed to monitor vibrations on office air conditioning and industrial air compressor units. The autonomous sensor employs an electromagnetic generator able to harvest a sufficient amount of energy to power a microelectromechanical systems (MEMS) accelerometer [13] linked to a microcontroller platform [14,15]. A charge-pump circuit (voltage multiplier) has been adopted to increase the level of the voltage produced by the electromagnetic generator. The generated power was stored in a supercapacitor. The electromagnetic generator was able to produce an average power of 58 μW with a root mean square (RMS) acceleration of 0.6 m/s2 at a frequency of 52 Hz.
Many techniques for scavenging energy dispersed in the environment by sources with different characteristics have been presented in [4,16]. In particular, mechanical vibrations have largely attracted the attention of researchers because of their ubiquity. Because environmental vibrations have a wide frequency spectrum [16] and, sometimes, a time-dependent amplitude, recent efforts have been focused on the design of nonlinear mechanical structures whose response is more suitable for scavenging energy in a range of frequencies as large as possible [17,18,19,20,21].
An example of such kind of structure is the beam in the Snap Through Buckling (STB) configuration, characterized by a bistable dynamical behavior in a relatively broad range of frequencies. Examples of Energy Harvesters (EH) exploiting the buckled beam are presented in [22] and [23] to scavenge energy from a rotating machine and to implement a wind energy harvester, respectively.
The main recognizable advantage of the STB mechanism arises from its nonlinear behavior, which allows the beam and an inertial mass added to the beam (if present), to switch between the two stable positions of the beam under external wideband mechanical vibrations. However, to switch the beam between its stable positions, the input acceleration (or force) must overcome a minimum threshold value determined by different factors among which is the energy barrier of the (bistable) potential energy function [24]. The latter can be stated as the main drawback of the STB configuration.
Recently, the authors have dedicated significant efforts to the investigation and development of analytical models for EHs exploiting the STB mechanism [25,26]. The proposed devices have been characterized and demonstrated to be able to generate powers in the order of hundreds of microwatts with average efficiencies of about 12%. The first developed prototype, exploiting a polyethylene terephthalate (PET) beam in the STB configuration with two piezoelectric transducers placed at the two beam’s stable position, has been demonstrated as capable of generating a power sufficient to periodically operate a 2.4 GHz wireless transceiver [27].
Moreover, investigations have been accomplished to better understand the behavior of such nonlinear architectures and the possibility to develop dedicated electronics for energy management [28,29,30].
This paper investigates the possibility of exploiting the nonlinear harvester presented in [31], to implement an autonomous sensor for the measurement of target vibrations, with embedded energy harvesting features. The main idea addressed through this work is to use the same device as a vibration sensor and as an energy harvester to extract energy from the target mechanical source. The latter can be exploited to power downstream electronics.
The device functionality has been assessed in the presence of noise (band-limited random vibrations) superimposed on a subthreshold deterministic input signal. The sinusoidal signal has an amplitude lower than the switching threshold of the STB beam, i.e., the signal alone is not sufficient to activate the switching between the two stable states of the beam. While the capability of the device to harvest a significant amount of energy has been already demonstrated in previous works [27,31], this work focuses on the methodology developed to extract the information about the noise level and the amplitude of the deterministic input from the sensor output.
The above-depicted operating conditions can be found in real scenarios like, e.g., everyday appliances, cars, flying vehicles, machinery, etc.
The main novelty of this work is represented by the possibility to exploit the same device as a nonlinear harvester and as a sensor to detect mechanical vibrations, thus labeling the system as a fully autonomous sensor that does not require an external power source. The possibility to exploit the nonlinear switching mechanism of the STB architecture for the implementation of a suitable methodology able to detect and separate the information related to the noise level from the strength of the deterministic components of the mechanical source confers to the system a unique sensing feature. Moreover, the choice of using an STB configuration provides the system with the valuable capability to scavenge energy from wideband mechanical vibrations, which is quite common in a real scenario.
The paper is organized as follows: a schematization of the autonomous sensor and a description of the nonlinear bistable energy harvester is given in Section 2. Section 3 is dedicated to the experimental results and the description of the signal processing strategy. Finally, conclusive remarks are given in Section 4.
2. Materials and Methods
As stated in Section 1, this work is mainly focused on the signal processing methodology aimed to detect and separate the information related to the random vibration from the subthreshold deterministic components of the mechanical source. For the sake of completeness, a schematization of the proposed autonomous sensor is shown in Figure 1. It consists of an STB structure implementing the sensing/harvesting functions, generating a voltage signal Vpiezo, a power management unit storing the energy produced by the EH device and powering, through Vsupply, an ultralow-power (ULP) microcontroller unit (MCU), incorporating a wireless transmitter (RF TX).
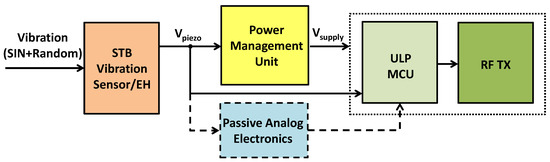
Figure 1.
Schematization of the autonomous vibration sensor.
The operation of this architecture has been already investigated [31] and will not be further considered through this paper. Anyway, it must be observed that the MCU is in charge of acquiring the output signal from the device and implementing the signal processing aimed to estimate the quantity of interest (the noise level, σn, and the amplitude of the deterministic input). Such information can then be transmitted by the RF TX. Of course, most of the signal elaboration described in Section 3 can be implemented also by dedicated electronics, thus minimizing the computation demand of the MCU with a consequent reduction in the power budget.
2.1. The Device Description
The STB Nonlinear Harvester (STB-NLH) has been already described in previous works [31]. Nevertheless, for the sake of completeness, an overview of the structure of the harvester is provided in the following paragraphs. A top view of the real device is shown in Figure 2. It consists of a flexible PET beam, specifically TartanTM 801 by Hewlett-Packard, whose dimension is 6 cm × 1 cm and a thickness is of 140 µm. The STB configuration has been obtained by applying a precompression of 1 mm along the main dimension, which leads to two possible stable positions 9 mm apart from each other. A 5.3 g proof mass is attached to the middle of the beam.
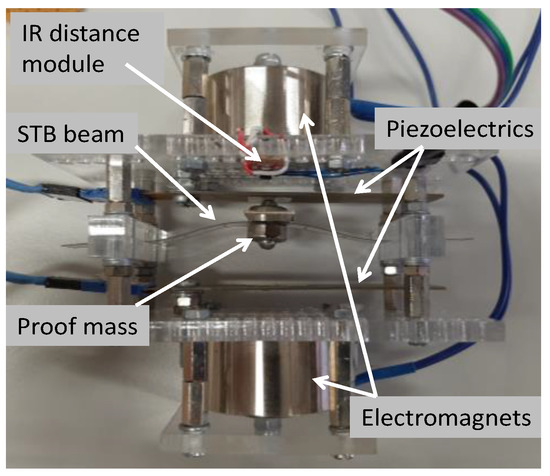
Figure 2.
A top view of the Energy Harvesters (EH) with the electromagnets used to investigate the device behavior.
The beam precompression, the proof mass, and other factors such as the deterministic signal and noise characteristics and system parameters, e.g., dissipation define the switching threshold, below which the beam under the effect of (solely) a subthreshold signal will not exhibit switching. The precompression and the added proof mass can be fixed to fit the frequency “bandwidth” and the switching threshold (minimum acceleration), required for the particular addressed application [31].
Two piezoelectric transducers Midè Volture V21BL have been placed at the stable positions of the beam, to realize the mechanical-to-electrical conversion mechanism exploited to implement the readout strategy of the vibration sensor, as well as the EH operation.
An InfraRed (IR) distance module, Pololu QTR-1A, has been used during the investigation of the device behavior to observe the beam deflection and the number of switching events in a fixed time interval. To investigate the device behavior as a function of the input signal (deterministic and stochastic) characteristics, an electromagnetic shaking system was used. The shaker uses two electromagnets WF-P34/18, shown in Figure 2, driven by counter phase current signals. The shaker generates a magnetic force on the proof mass thus miming the target vibrations. To this aim, the proof mass consists of a permanent magnet. It is important to note that the electromagnetic shaker is not part of the sensor/EH system but is a tool used only for the sake of the device characterization.
The two signals used to investigate the device, sinusoidal and band-limited (at 100 Hz) noise, are generated by two function generators Agilent 33120A and summed using a dedicated electronic. The resulting signal used to drive the electromagnets, the IR module’s output voltage, and the two voltage signals generated by the piezoelectric transducers are acquired by a data acquisition board NI USB6341 with a sampling frequency of 2 kHz. The board was managed through a virtual instrument developed in NI LabVIEW®. To maximize the power transfer, a resistive load of 15 kΩ, has been connected to the piezoelectric transducers [31].
3. Results and Discussion
A set of experiments have been performed to investigate the possibility to adopt the STB structure to measure wideband vibrations superimposed to a subthreshold (with respect to the system threshold) deterministic input. The device has been investigated for different frequencies and amplitudes of the sinusoidal input and increasing values of the standard deviation, σn, of the superimposed noise. The vibrations (deterministic and superimposed noise) have been applied through the electromagnetic shaker introduced in Section 2.1.
It is worth noting that, in the results reported in the following, the deterministic input and the superimposed noise generating the input vibration, are represented in terms of amplitude and standard deviation, respectively, of the signal generated by the waveform generator (expressed in Volts). Anyway, to provide information about the order of accelerations required by the beam investigated in this work, the results of the investigation reported in [31] can be referred. In particular, in the case of a sinusoidal input at 1 Hz, a minimum acceleration of about 14 m/s2 has been observed.
As already discussed in Section 1, the adopted sinusoidal signal has an amplitude lower than the switching threshold of the STB beam, i.e., equivalently, increasing the amplitude of the signal alone does not lead to the switching between the two stable states of the beam. The beam switching threshold, Sth, is defined as the minimum dynamical acceleration required to switch the beam from one stable state to the other in the opposite position. In particular, three levels of the sinusoidal input have been considered, i.e., A1, A2, and A3, being 10%, 20%, and 30% lower than the threshold, respectively.
The quantity ∆V defined as:
represents, the gap to be “filled” by the superimposed noise vibration, to activate the switching dynamics of the beam.
Figure 3a shows a segment of 5 s of the three subthreshold sinusoidal input at 1 Hz. The beam threshold level and the gap ∆V are also reported. The beam threshold level here represents the minimum amplitude of the deterministic signal causing the beam to switch at the same frequency as the input signal. The main characteristics of the pseudorandom Gaussian noise limited at 100 Hz are shown through the frequency spectrum and the histogram plot reported in Figure 3b,c, respectively.
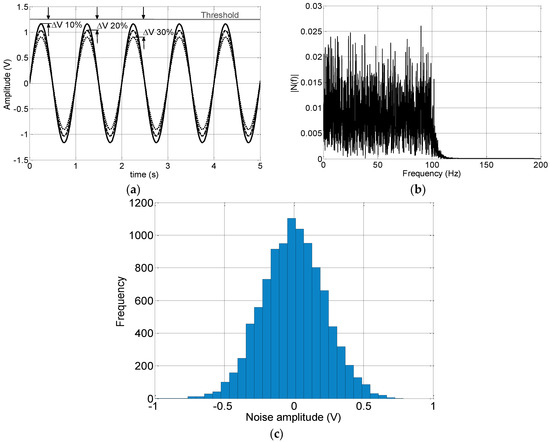
Figure 3.
(a) The three subthreshold sinusoidal input at 1 Hz. The beam threshold level (in V) and the gap ∆V are also reported. (b) The frequency spectrum and (c) the histogram plot of the pseudorandom Gaussian noise input.
Examples of real signals measured during experiments are reported in Figure 4.
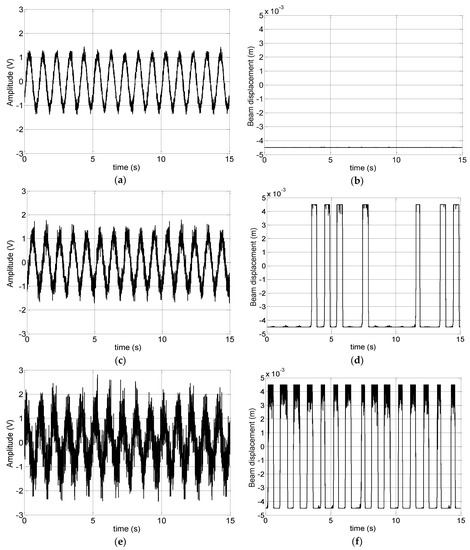
Figure 4.
Examples of real signals in the case of a sinusoidal input at 1 Hz and an amplitude of 0.903 V, 30% lower than the switching threshold and three different levels of the superimposed noise. (a,c,e) the input signal and (b,d,f) the measured beam displacement in the case of noise with a standard deviation, σn, of 0.12, 0.24, and 0.56 V, respectively. In (b), the level of noise is not sufficient to activate the beam switching, in (d) the noise level is sufficient to activate some beam switching events, while in (f), it has the optimal value making the beam switching with the same frequency of the deterministic input.
In particular, Figure 4a,c,e shows the subthreshold sinusoidal input at 1 Hz with an amplitude of 0.903 V corresponding to the case of ∆V = 30% and three different levels of superimposed noise, with a standard deviation, σn, of 0.12, 0.24, and 0.56 V, respectively.
The related beam displacement between the two stable states (observed by the IR distance sensor) is reported in Figure 4b,d,f. As it easily emerges, the first noise level (σn = 0.12 V) is not sufficient to fill the gap ∆V defined in (1) and overpass the beam switching threshold Sth thus activating the beam switching. In fact, as shown in Figure 4b, the beam remains in one of its stable states (specifically at −4.5 mm in the case reported in the figure).
Conversely, the beam switching is observable in Figure 4d,f related to the cases of σn = 0.24 V and σn = 0.56 V, respectively. In particular, in the intermediate case, the noise level is sufficient to randomly activate the beam switching each time the input signal (subthreshold sinusoidal with superimposed noise) overpasses the beam threshold for a sufficient time to win the beam’s inertia or, in other terms, to overpass the energy barrier of the potential described in Section 2. Finally, in the case of σn = 0.56 V shown in Figure 4f, the noise is sufficient to start the beam switching at the same frequency of the deterministic input.
3.1. The Estimation of the Noise Level
According to the main target of this work, this subsection focuses on the procedure developed to estimate the level of noise, more precisely the standard deviation, σn, from the device’s output voltage signal (the piezoelectric output voltage), V_piezo.
It is worth remembering that, through this work, the (very low) noise level, taken as the only input of the system, is not able to activate the beam switching. Then the output voltage peaks generated by the beam (the proof mass on the beam) hitting the piezoelectric transducers can be ascribed to the deterministic input (leading, thanks to the effect of the superimposed noise, to interwell switching events), while the remaining part of the voltage signal is generated by the intrawell beam vibrations generated by the noise.
Just as a reference example, Figure 5 shows the observed piezoelectric RMS output voltage, VRMS, as a function of the superimposed noise level (σn is the standard deviation of the noise signal) in the case of the three amplitudes of the subthreshold sinusoidal input at 1 Hz. The VRMS is calculated as the sum of the RMS voltages from the two piezoelectric transducers. Clearly, the RMS value of the output voltage increases with the noise level. Moreover, as expected, for a fixed noise level, the output voltage increases while decreasing the gap ΔV or, equivalently, increasing the amplitude of the deterministic component. Furthermore, as it can be observed, for fixed VRMS, the vibration level σn cannot be univocally defined, since it depends on the amplitude of the deterministic input.
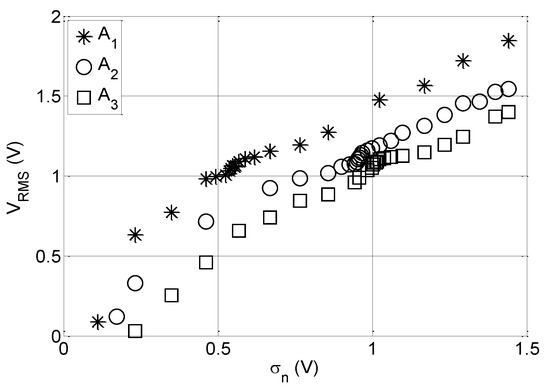
Figure 5.
The root mean square (RMS) output voltage as a function of the noise level superimposed to the subthreshold deterministic sinusoidal input at 1 Hz.
To estimate the strength of the component due to only the noisy vibration, , a dedicated methodology of signal processing has been developed. A schematization of the developed methodology is shown in Figure 6. The procedure removes the contribution to the overall piezoelectric output voltage, , due to the proof mass impact on the piezoelectric transducers using a thresholding and windowing algorithm. The remaining part, is then used to estimate the noise level as discussed below.
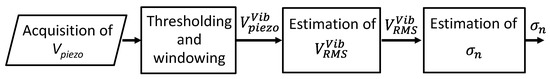
Figure 6.
Schematization of the signal processing procedure to estimate the standard deviation of the noise.
For the sake of the algorithm explanation, it is convenient to refer to Figure 7a,b, which shows the two observed output voltage signals from the two piezoelectric transducers and the beam displacement in the case of a subthreshold sinusoidal input at 1 Hz, with an amplitude of 30% lower than the beam switching threshold and a superimposed noisy vibration with = 0.47 V.
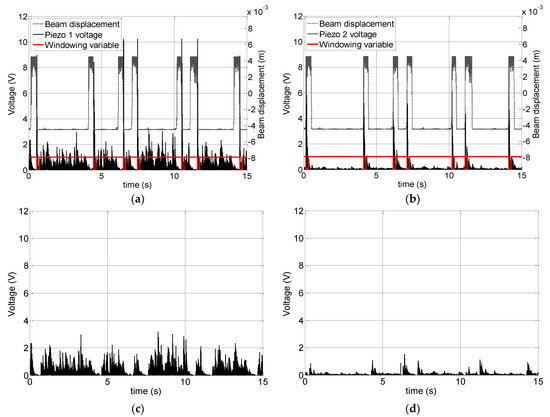
Figure 7.
(a,b) The observed output voltage signal from the two piezoelectric transducers and the beam displacement in the case of a subthreshold sinusoidal input at 1 Hz with an amplitude of 30% lower than the beam switching threshold and a superimposed noisy vibration with σn = 0.47 V. The binary variable used by the windowing algorithm is also shown; (c,d) the obtained from the signals shown in (a,b) with the developed signal processing methodology.
The two figures show how each time the beam switches from one stable state to the opposite one and the proof mass hits the piezoelectric transducer, a peak on the piezoelectric output voltage appears.
To filter out these peaks (which are mainly related to the deterministic input component), as a first processing step, a thresholding of the signal has been performed. The threshold value has been set empirically by observing the complete set of voltage signals obtained for different values of the superimposed noise. The comparison of the voltage signal with the threshold value has been used to set the value of a binary time sequence used in the subsequent windowing step. More specifically, the value of the binary time sequence has been set to 0 each time the voltage signal overpasses the threshold value and to 1 otherwise. The binary time sequence is also shown in Figure 7a,b. The output voltage windowing aimed at removing the voltage peaks due to the beam switching has been performed by multiplying the voltage signal by the binary time sequence. The processed signals, representing the contribution to due to only the noise, , are shown in Figure 7c,d.
It should also be noted that the apparent different amplitude of the piezoelectric output voltage signal, due to the vibration during the time intervals where the beam is not switching, is actually due to the intrawell vibrations of the mass on the piezoelectric transducer.
In fact, it can be observed that the output voltages in Figure 7a are large in the time intervals when the beam mainly resides in the place of the piezoelectric transducer 1 (the lower stable state in the beam displacement time series). It can be observed from Figure 7b that during the time intervals where the beam resides in the opposite stable state (the top state in the beam displacement time series) the output voltage from the piezoelectric transducers 2 due to the noisy vibrations is comparable with the one observed in Figure 7a.
The RMS value, , of , is then estimated. Figure 8 shows the quantity as a function of the noise level for the three subthreshold sinusoidal inputs at 1 Hz. The results show that the increases with the noise level (as expected) and, at least in a large part of the noise range considered in this work, it is independent of the amplitude of the sinusoidal input. A dependency on the amplitude of the deterministic input (A1, A2, and A3) emerges only for high values of the input noise vibrations ().
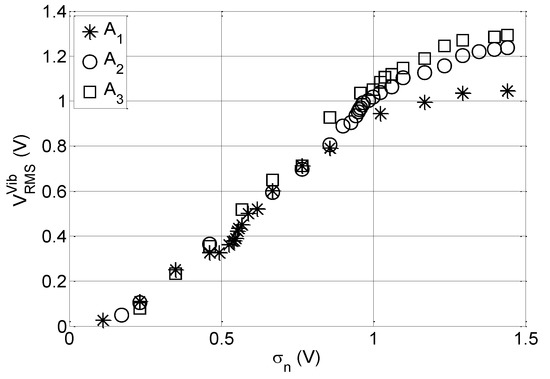
Figure 8.
The RMS output voltage, , generated by only the noise superimposed to the subthreshold deterministic sinusoidal input at 1 Hz as a function of the noise level.
Moreover, for higher values of the input vibrations, a form of saturation appears. The saturation phenomenon could be explained by observing that above a given level of noise, the beam intrawell vibrations (vibrations of the beam while remaining in one of its stable position) remain statistically quite constant and the piezoelectric transducers generate the same amount of energy. This phenomenon is more evident for the highest value of the deterministic signal, A1, which favorites the saturation mechanism.
The inverse dependence on the sinusoidal input suggests that for higher amplitudes of the noise, the contribution of the noise to the overall output decreases by increasing the sinusoidal input amplitude, i.e., the contribution of the deterministic component predominates over the one produced by the noise.
It should be observed that, as demonstrated in [31], for higher values of the superimposed (to the deterministic input) noise, the beam starts switching randomly leading to fast beam switching and a higher number of beam bumps on the transducers; the beam’s residence time in the stable states decreases thus reducing the intrawell vibrations. This behavior could be used to explain the observed reduction in the . Nevertheless, the first part of the curve could be used to estimate the noise level. In fact, once we extract the from the overall output voltage, the noise level, , can be unambiguously estimated. These results demonstrate the possibility of exploiting the EH as a vibration sensor.
Moreover, it should be observed that the energy scavenged from the target vibrations can be used to power (ultra) low-power electronics, which can implement the windowing algorithm used to extract the generated by the noise and transmit information about the estimated noise level. In fact, powers up to about 100 µW have been observed with the subthreshold sinusoidal input at 1 Hz considered in this work.
3.2. The Estimation of the Deterministic Component
Finally, in this subsection, the possibility to estimate the amplitude of the subthreshold sinusoidal input is addressed. It should be also observed that in the case the level of noise has been estimated as discussed in Section 3.1 using the relation between the and shown in Figure 8, the amplitude of the deterministic input can be estimated from the curves on Figure 5 relating the overall to the noise level.
Anyway, in the following paragraphs, a different approach, schematized in Figure 9, is presented.
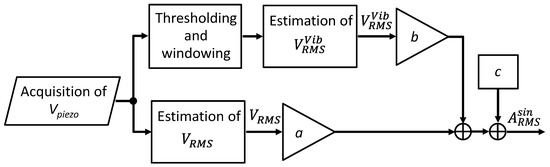
Figure 9.
Schematization of the methodology for the estimation of the RMS amplitude of the deterministic component.
The main idea is to adopt an analytical model to estimate the RMS amplitude of the deterministic input, , from the measurement of the and . To this aim, the following model has been adopted:
where the parameters a = 0.372, b = −0.243, and c = 0.536 V have been identified by fitting the model (2) on the experimental data using the Nelder-Mead optimization algorithm [32]. The algorithm, implemented in MathWorks® MATLAB, uses a simplex minimization method to estimate a set of values of the parameters, which minimize a given functional. The following functional, J%, which estimates the percentage root mean square error (PRMSE) between the experimentally measured RMS amplitude of the subthreshold deterministic input, , and the amplitude predicted by the model, Ai,pred, has been adopted:
where the index i = 1,2,3 refers to the three amplitudes of the subthreshold sinusoidal input, while ni is the number of different noise levels, , used for the fitting. Taking into account the dependency on the deterministic input observed in Figure 8 for the higher values () of the input noise vibrations, for the model fitting, only the range of values of has been used. Moreover, the first lower values, not sufficient to overcome the beam switching threshold (then not generating beam switching events), have not been used.
Table 1 shows the performance of model (2) for the three subthreshold sinusoidal input at 1 Hz in terms of mean value and standard deviation, , of the residuals between the experimental measured RMS amplitude of the sinusoidal input and the value predicted by the model. The results demonstrate a good performance of the proposed model to estimate the RMS amplitude of the subthreshold sinusoidal input.

Table 1.
Performance of the model (2) in terms of average error and standard deviation of the error values, σe, for the three subthreshold sinusoidal input at 1 Hz.
4. Conclusions
In this work, the possibility of exploiting a nonlinear bistable snap-through buckling beam to implement a self-powered sensor for measurements of target vibrations, with embedded capabilities of energy harvesting has been investigated. As far as we know, this is the first example of an autonomous vibrational sensor exploiting the advantages of the nonlinear STB configuration.
While the feature of the device to harvest a significant amount of energy has been already demonstrated [31], this work focuses on a methodology to extract the information about the noise level and the amplitude of the deterministic input from the (piezoelectric) output voltage of the device.
The device is operated in the presence of noisy vibrations superimposed on a subthreshold deterministic (sinusoidal) input signal. These are cases related, e.g., to everyday appliances, cars, flying vehicles, home appliances, machinery, etc.
A dedicated methodology of signal processing to estimate the strength of the noise-related component has been presented and demonstrated by experimental evidence. The developed procedure removes the contribution to the overall piezoelectric output voltage due to the proof mass impact on the piezoelectric transducers, ascribable to the subthreshold deterministic component, using a thresholding and windowing algorithm. As demonstrated, once the contribution to the output voltage due to the noise has been extracted, the noise level can be unambiguously estimated.
Moreover, an analytical model to estimate the RMS amplitude of the deterministic input, from the measurement of the output voltage and the estimation of the noise-related component as described before, has been proposed. The model has been assessed using experimental signals. The performances have been evaluated in terms of mean value and standard deviation, of the residuals between the experimental measured RMS amplitude of the sinusoidal input and the value predicted by the model.
Experiments, reported in this paper, demonstrate the viability of the proposed approach of exploiting the EH as a vibration sensor. It should be observed that the energy scavenged from the target vibrations can be used to power (ultra) low-power electronics which can implement the windowing algorithm used to extract the noise-related component from the generated output voltage and transmit information about the estimated noise level.
Future efforts will be dedicated toward a deep investigation of the proposed methodology and to the implementation of the measurement node embedding the power management unit, as well as the electronics with processing and data transmission capabilities.
Author Contributions
Conceptualization, B.A., A.R.B., and V.M.; methodology, V.M. and S.B.; validation V.M.; writing—original draft preparation, V.M.; revision, B.A. All authors have read and agreed to the published version of the manuscript.
Funding
This research received no external funding.
Data Availability Statement
The data presented in this study are available on request. Please, contact the corresponding author to access data.
Conflicts of Interest
The authors declare no conflict of interest.
References
- Katiyar, S.A.; Iida, F.; Nurzaman, S.G. Energy Harvesting in Soft Robot Locomotion with Complex Dynamics. In Proceedings of the 2019 IEEE International Conference on Cybernetics and Intelligent Systems (CIS) and IEEE Conference on Robotics, Automation and Mechatronics (RAM), Bangkok, Thailand, 18–20 November 2019; pp. 475–480. [Google Scholar] [CrossRef]
- Han, M.; Wang, H.; Yang, Y.; Liang, C.; Bai, W.; Yan, Z.; Li, H.; Xue, Y.; Wang, X.; Akar, B.; et al. Three-dimensional piezoelectric polymer microsystems for vibrational energy harvesting, robotic interfaces and biomedical implants. Nat. Electron. 2019, 2, 26–35. [Google Scholar] [CrossRef]
- El Zein, B. Self-Sufficient Energy Harvesting in Robots using Nanotechnology. Adv. Robot. Autom. 2013, 2, 113. [Google Scholar] [CrossRef]
- Energy Harvesting Technologies for IoT Edge Devices, IEA 4E Report. July 2018. Available online: https://www.iea-4e.org/publications (accessed on 19 November 2019).
- Covaci, C.; Gontean, A. Piezoelectric Energy Harvesting Solutions: A Review. Sensors 2020, 20, 3512. [Google Scholar] [CrossRef] [PubMed]
- Tang, X.; Wang, X.; Cattley, R.; Gu, F.; Ball, A.D. Energy Harvesting Technologies for Achieving Self-Powered Wireless Sensor Networks in Machine Condition Monitoring: A Review. Sensors 2018, 18, 4113. [Google Scholar] [CrossRef] [PubMed]
- Lai, S.C.; Yao, K. A Battery-Less Sensor Concept Outputting Perceivable Signal Demonstrated with an Accelerometer. IEEE Sens. J. 2016, 16, 7841–7842. [Google Scholar] [CrossRef]
- Wang, Z.; Bouwens, F.; Vullers, R.; Petré, F.; Devos, S. Energy-autonomous wireless vibration sensor for condition-based maintenance of machinery. In Proceedings of the 2011 IEEE Sensors Conference, Limerick, Ireland, 28–31 October 2011. [Google Scholar]
- Tan, Y.K.; Panda, S.K. Self-Autonomous Wireless Sensor Nodes with Wind Energy Harvesting for Remote Sensing of Wind-Driven Wildfire Spread. IEEE Trans. Instrum. Meas. 2011, 60, 1367–1377. [Google Scholar] [CrossRef]
- Magno, M.; Sigrist, L.; Gomez, A.; Cavigelli, L.; Libri, A.; Popovici, E.; Benini, L. SmarTEG: An Autonomous Wireless Sensor Node for High Accuracy Accelerometer-Based Monitoring. Sensors 2019, 19, 2747. [Google Scholar] [CrossRef]
- Analog Devices LTC3107. Available online: www.analog.com/en/products/ltc3107 (accessed on 12 December 2020).
- Torah, R.; Glynne-Jones, P.; Tudor, M.; O’Donnell, T.; Roy, S.; Beeby, S. Self-powered autonomous wireless sensor node using vibration energy harvesting. Meas. Sci. Technol. 2008, 19, 125202. [Google Scholar] [CrossRef]
- Analog Devices ADXL330. Available online: www.analog.com/en/products/adxl330 (accessed on 12 December 2020).
- Microchip PIC16F676. Available online: www.microchip.com/wwwproducts/en/PIC16F676 (accessed on 12 December 2020).
- RF Solutions AM-RT4. Available online: www.rfsolutions.co.uk/downloads/1458229843DS-AM-RT4.pdf (accessed on 12 December 2020).
- Cao, S.; Li, J. A survey on ambient energy sources and harvesting methods for structural health monitoring applications. Adv. Mech. Eng. 2017, 9. [Google Scholar] [CrossRef]
- Dechant, E.; Fedulov, F.; Fetisov, L.Y.; Shamonin, M. Bandwidth Widening of Piezoelectric Cantilever Beam Arrays by Mass-Tip Tuning for Low-Frequency Vibration Energy Harvesting. Appl. Sci. 2017, 7, 1324. [Google Scholar] [CrossRef]
- Harne, R.L.; Wang, K.W. A review of the recent research on vibration energy harvesting via bistable systems. Smart Mater. Struct. 2013, 22, 023001. [Google Scholar] [CrossRef]
- Cottone, F.; Gammaitoni, L.; Vocca, H.; Ferrari, M.; Ferrari, V. Piezoelectric buckled beams for random vibration energy harvesting. Smart Mater. Struct. 2012, 21, 035021. [Google Scholar] [CrossRef]
- Bhatia, D.; Kim, W.; Lee, S.; Kim, S.W.; Choi, D. Tandem triboelectric nanogenerators for optimally scavenging mechanical energy with broadband vibration frequencies. Nano Energy 2017, 33, 515–521. [Google Scholar] [CrossRef]
- Bhatia, D.; Hwang, H.J.; Huynh, N.D.; Lee, S.; Lee, C.; Nam, Y.; Kim, J.-G.; Choi, D. Continuous scavenging of broadband vibrations via omnipotent tandem triboelectric nanogenerators with cascade impact structure. Sci. Rep. 2019, 9, 8223. [Google Scholar] [CrossRef] [PubMed]
- Xie, Z.; Kwuimy, C.A.K.; Wang, Z.; Huang, W. A piezoelectric energy harvester for broadband rotational excitation using buckled beam. AIP Adv. 2018, 8, 015125. [Google Scholar] [CrossRef]
- Zhang, J.; Zhang, J.; Shu, C.; Fang, Z. Enhanced piezoelectric wind energy harvesting based on a buckled beam. Appl. Phys. Lett. 2017, 110, 183903. [Google Scholar] [CrossRef]
- Masana, R.; Daqaq, M.F. Response of duffing-type harvesters to band-limited noise. J. Sound Vib. 2013, 332, 6755–6767. [Google Scholar] [CrossRef]
- Andò, B.; Baglio, S.; Marletta, V.; Bulsara, A.R. Modeling a Nonlinear Harvester for Low Energy Vibrations. IEEE Trans. Instrum. Meas. 2019, 68, 1619–1627. [Google Scholar] [CrossRef]
- Andò, B.; Baglio, S.; Bulsara, A.R.; Marletta, V.; Pistorio, A. Experimental and Theoretical Investigation of a Nonlinear Vibrational Energy Harvester. Procedia Eng. 2015, 120, 1024–1027. [Google Scholar] [CrossRef]
- Andò, B.; Baglio, S.; Marletta, V.; Bulsara, A.R. A Wireless Sensor Node Powered by NonLinear Energy Harvester. In Proceedings of the 13th IEEE Sensors Conference, Sensors 2014, Valencia, Spain, 2–5 November 2014; pp. 1583–1586. [Google Scholar]
- Ando, B.; Graziani, S. Adding noise to improve measurement. IEEE Instrum. Meas. Mag. 2001, 4, 24–31. [Google Scholar] [CrossRef]
- In, V.; Palacios, A.; Bulsara, A.R.; Longhini, P.; Kho, A.; Neff, J.D.; Baglio, S.; Ando, B. Complex behavior in driven unidirectionally coupled overdamped Duffing elements. Phys. Rev. E 2006, 73, 066121. [Google Scholar] [CrossRef] [PubMed]
- Maiorca, F.; Giusa, F.; Trigona, C.; Andò, B.; Bulsara, A.R.; Baglio, S. Diode-less mechanical H-bridge rectifier for “zero threshold” vibration energy harvesters. Sens. Actuators A Phys. 2013, 201, 246–253. [Google Scholar] [CrossRef]
- Andò, B.; Baglio, S.; Bulsara, A.R.; Marletta, V.; Pistorio, A. Performance Investigation of a Nonlinear Energy Harvester with Random Vibrations and Sub-Threshold Deterministic Signals. IEEE Trans. Instrum. Meas. 2017, 66, 992–1001. [Google Scholar] [CrossRef]
- Lagarias, J.C.; Reeds, J.A.; Wright, M.H.; Wright, P.E. Convergence properties of the Nelder–Mead simplex method in low dimensions. SIAM J. Optim. 1998, 9, 112–147. [Google Scholar] [CrossRef]
Publisher’s Note: MDPI stays neutral with regard to jurisdictional claims in published maps and institutional affiliations. |
© 2021 by the authors. Licensee MDPI, Basel, Switzerland. This article is an open access article distributed under the terms and conditions of the Creative Commons Attribution (CC BY) license (http://creativecommons.org/licenses/by/4.0/).