Article

On the Sizing of the DC-Link Capacitor to Increase the Power Transfer in a Series-Series Inductive Resonant Wireless Charging Station

Dipartimento Ingegneria dell’Informazione, University of Pisa, Via Caruso 16, 56122 Pisa, Italy
*
Author to whom correspondence should be addressed.
Energies 2021, 14(3), 743; https://doi.org/10.3390/en14030743
Submission received: 21 December 2020 / Revised: 25 January 2021 / Accepted: 27 January 2021 / Published: 31 January 2021
(This article belongs to the Collection Invited Papers on Electric Vehicles)

Abstract

:
Wireless inductive-coupled power transfer is a very appealing technique for the battery recharge of autonomous devices like surveillance drones. The charger design mainly focuses on lightness and fast-charging to improve the drone mission times and reduce the no-flight gaps. The charger secondary circuit mounted on the drone generally consists of a full-bridge rectifier and a second-order filter. The filter cut-off frequency is usually chosen to make the rectifier output voltage constant and so that the battery is charged with continuous quantities. Previous works showed that an increase in power transfer is achieved, if compared to the traditional case, when the second-order filter resonant frequency is close to the double of the wireless charger excitation and the filter works in resonance. This work demonstrates that the condition of resonance is necessary but not sufficient to achieve the power increment. The bridge rectifier diodes must work in discontinuous-mode to improve the power transfer. The paper also investigates the dependence of the power transfer increase on the wireless excitation frequency. It is found the minimum frequency value below which the power transfer gain is not possible. This frequency transition point is calculated, and it is shown that the gain in power transfer is obtained for any battery when its equivalent circuit parameters are known. LTSpice simulations demonstrate that the transferred power can be incremented of around 30%, if compared to the case in which the rectifier works in continuous mode. This achievement is obtained by following the design recommendations proposed at the end of the paper, which trade off the gain in power transfer and the amplitude of the oscillating components of the wireless charger output.

1. Introduction

Wireless power transfer (WPT) systems based on inductive resonance are appealing solutions to recharge devices without connectors or cables [1,2,3]. Generally, self-driving applications like surveillance drones use a WPT station to automatize the charging process [4,5]; no operator or sophisticated connectors and platforms are required. Typically, a drone WPT charging system raises many issues, including the drone alignment with the landing platform [6,7,8], the charging time reduction to minimize no-operation intervals [9], and the reduced weight to improve the flight endurance [10]. A WPT system is usually composed of two inductive-coupled circuits. The primary circuit is located in the landing platform on the ground, and it is composed of the power supply, the inverter, the compensation capacitor and the coil. Instead, the secondary circuit is installed on-board the drone. It is characterized by the coil, the compensation capacitor, the rectifier, the low-pass filter and the battery. Besides, the position of the compensation capacitor with respect to the coils determines the kind of WPT architecture: Series-Series (SS), Series-Parallel (SP), Parallel-Series (PS) and Parallel-Parallel (PP) [11]. Figure 1 shows the equivalent scheme of a SS WPT system [1,6,12]. The SS architecture is a very attractive configuration, and it is often used in this kind of application [6,12,13]. In fact, the reflected reactance from the primary to the secondary is null, so the WPT resonance frequency depends neither on the load condition nor on the coil alignment [11,14]. Furthermore, the SS WPT charging system behaves as a current generator [15], which is a good feature to realize a battery charger. Hence, the battery can directly be charged without dedicated regulation circuits and the charging current is established from the primary side [16]. Generally, the weight of the charger section on board the drone can be diminished by increasing the WPT excitation frequency or reducing the number of components. The use of higher excitation frequencies decreases the coil and compensation capacitor dimensions [17], but the electrical design complexity and the Electro-Magnetic Interference (EMI) emissions rise at the same time [18]. The best trade-off between operating frequency and EMI emission for a drone application is found to be in the range of hundreds of kilohertz, as indicated in [6,13,19].
A DC-DC converter useful to control the power flow to the battery is often not added to save on-board weight. Therefore, the secondary-side DC-link circuit only consists of a second-order low-pass filter in several literature works [6,10]. Moreover, the main assumption usually taken to characterize the load is to consider the battery as an ideal voltage generator and the LC-filter cut-off frequency low enough to keep the filter output voltage constant [20]. This design choice permits the battery to be charged with DC quantities, but it requires a bulky filter capacitor, and it does not reduce the on-board weight. Ref. [21] proposed the idea of exploiting the battery parasitic series-inductance L B as LC-filter inductor instead of using an external component, saving further space. Furthermore, it was shown that the power transfer and efficiency depend on the value of the LC-filter capacitor C 0 . Specifically, a peak in the power transfer is found sizing C 0 = C * so that the LC-filter cut-off frequency is fixed to the double of the WPT excitation frequency f S S , as expressed in (1). The drawback is the reduction of the system efficiency and the onset of current and voltage ripples on the battery terminals.
C * = 1 4 π f S S 2 L B
These concepts are applied to develop and test a 150 kHz SS-WPT architecture in [12]. The power transfer to the battery was experimentally measured for several values of the LC-filter capacitor. The experimental results confirm the simulation prediction with good agreement. Indeed, a power increment of about 25% is obtained by keeping the same WPT system parameters and using the value C * expressed in (1) instead of a larger capacitor. This power increment is very appealing, particularly for the autonomous drone applications, because it leads to a faster charging and to the improvement of the ratio between service and recharge times. However, the experiment in [12] refers to a WPT system excited with a fixed frequency of 150 kHz and a particular Li-ion battery, lacking the generality of application. Furthermore, the possible effects of the root-mean-square (rms) current in the output capacitor and the battery are not addressed in detail.
A capacitor subjected to large rms current values can be damaged for two reasons [22]. The large rms voltage may start the corona discharge phenomena that irreversibly damages the dielectric layer, and the power dissipation on the connection parasitic resistance may be too high. Another very important issue regards the effects on the lithium-ion battery aging of the high-frequency sinusoidal ripples in the battery current. Unfortunately, the question is still open and the answer is not clear yet, as Brand et al. show in [23]. They compare literature papers published between 2003 and 2017, highlighting the discrepancies in the results. For instance, Uno et al. and Prasad et al. support the hypothesis that the high-frequency ripple component is not involved in the battery aging processes [24,25]. On the contrary, Uddin et al. assert the opposite conclusion in [26,27]. In the first case, the authors indicate that the slow internal battery processes, such as the charge transfer and diffusion, are only activated by ripple currents with a frequency lower than the battery corner frequency. The definition of corner frequency is out of the scope of this paper, but it is carefully described in [23]. On the other hand, the authors hypothesize the battery heating caused by the ripple currents as explanation of the faster aging. However, the temperature variations and the battery capacity fade found in [26,27] are rather limited (1 °C and capacity fade around 3%). Therefore, the benefits introduced by a faster charging may be worth the slight increment of aging in applications where the time spent in charging is much larger than the operative time.
The aim of this paper is to give generality to the approach proposed in [12] and to determine if the design of a WPT system based on the application of the constraint in (1) is sufficient to increase the power transfer to a generic battery. In other words, is the beneficial power transfer increment found with the WPT circuit described in [12] achievable with other different batteries? If not, is it possible to achieve the power transfer growth again by changing some other parameters of the WPT design? The paper studies the battery load frequency response to answer the two questions and demonstrates that the design constraint in (1) is not sufficient to guarantee a power transfer increment. Specifically, this paper introduces three main innovations to the state of the art:
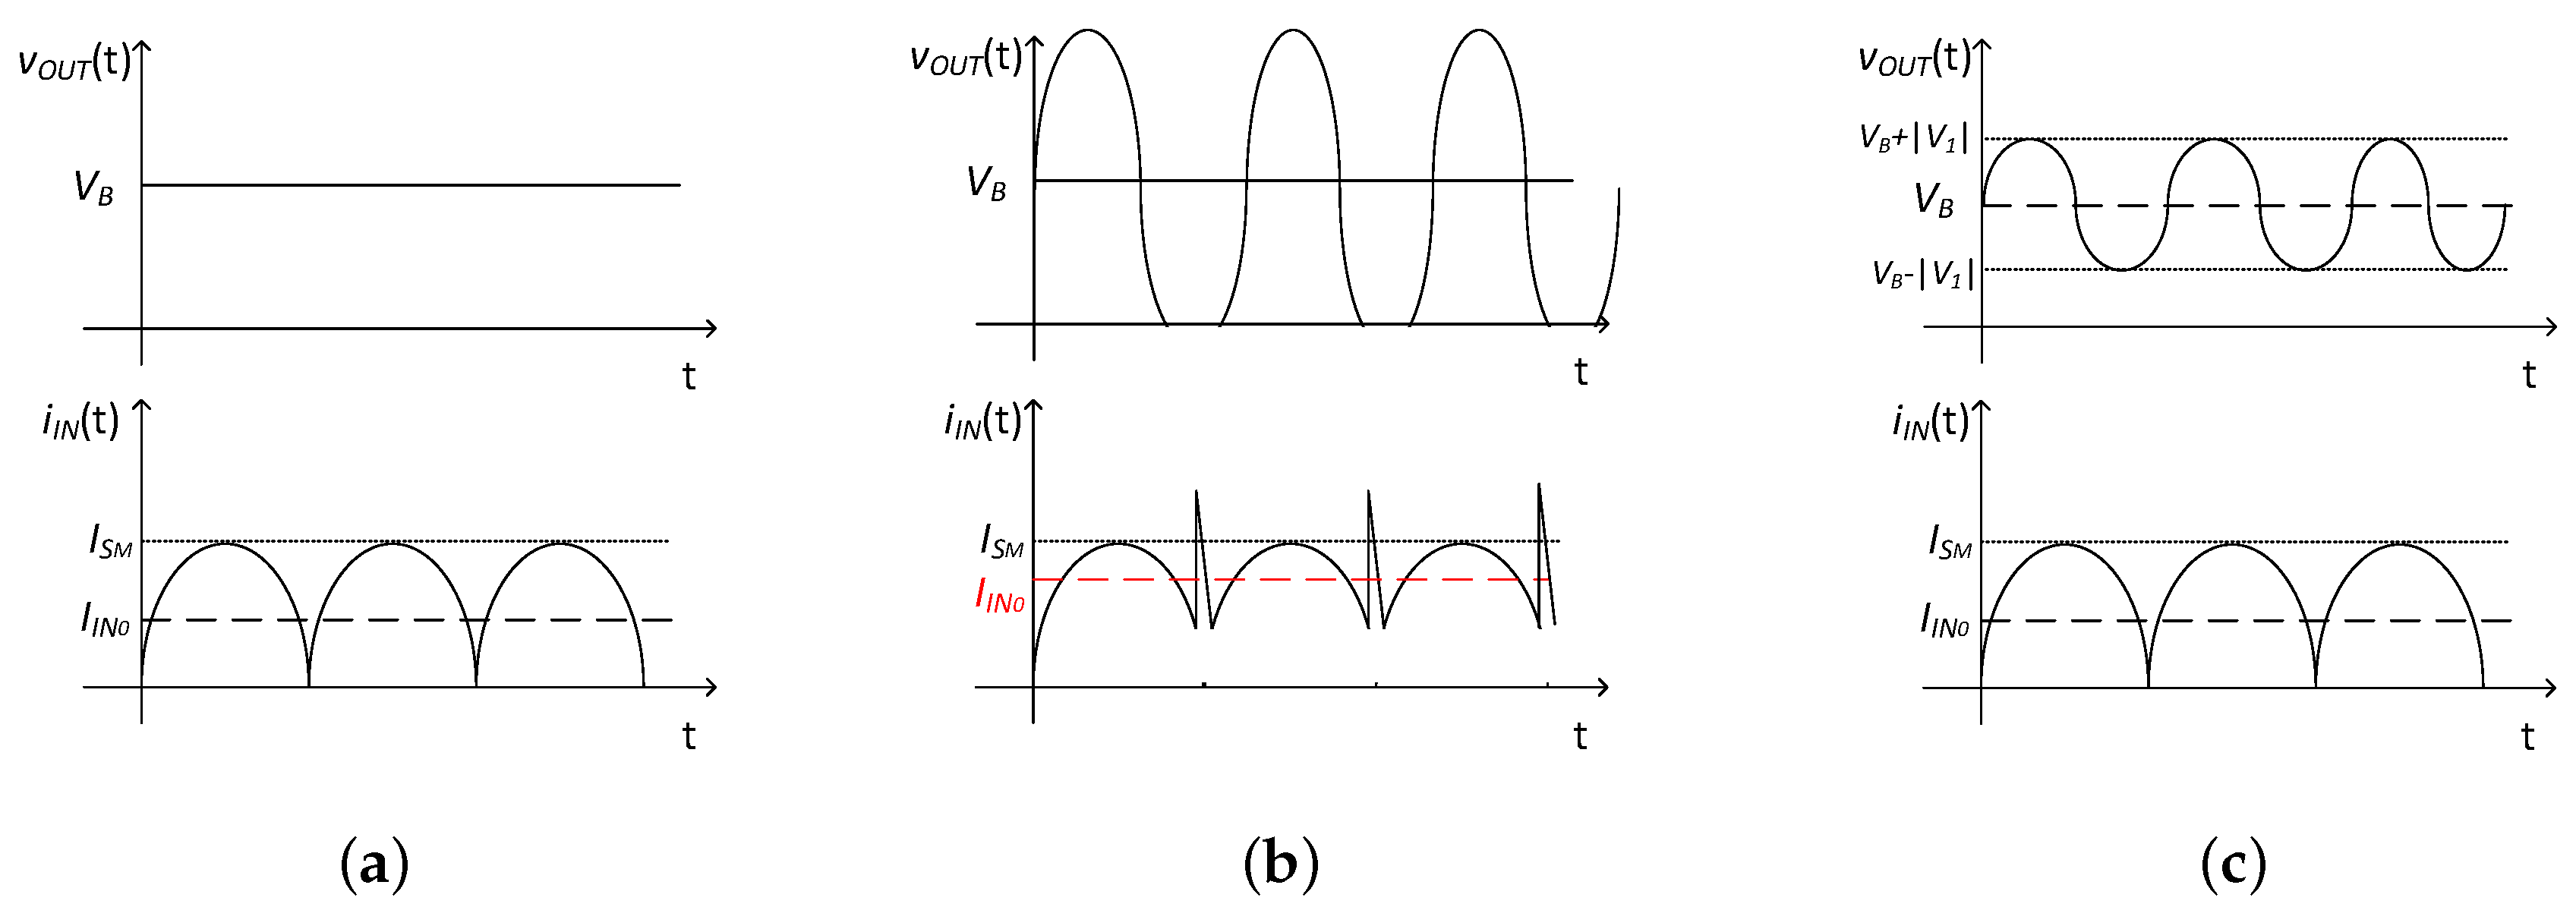
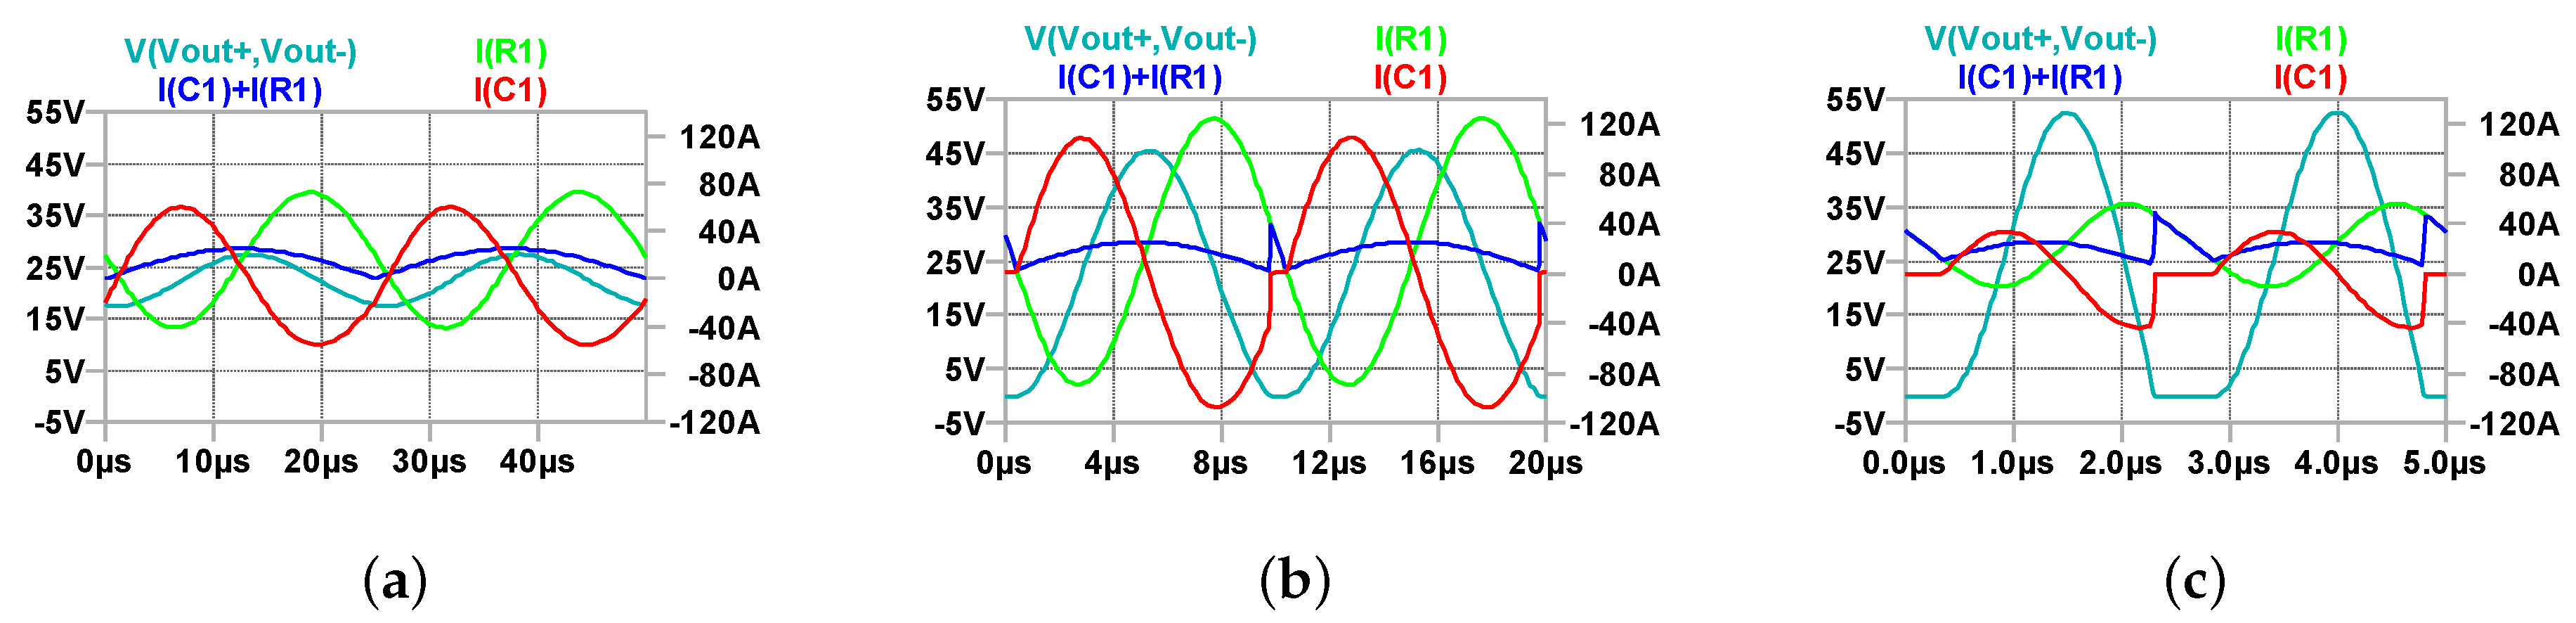
  • it is shown that the passage from continuous to discontinuous mode of the rectifier improves the average battery current in a series-series wireless power transfer charger;
  • the battery parameters play an important role in determining the load impedance value that leads the rectifier to work in discontinuous mode;
  • the mathematical analysis carried out in the paper shows that the increase of the power transfer may be achieved for any battery by acting on the WPT excitation frequency at design time.
Furthermore, a design recommendation to follow is proposed to the WPT designers. Specifically, the trade-off between the higher power transfer and sustainable rms output current values is achievable starting from the knowledge of the battery parameters and taking into account their variations with the battery status. The final outcome is the realization of an improved wireless fast-charging system.
The rest of the paper is organized as follows. Section 2 studies the frequency response of a generic battery load, recalls the theoretical background about the bridge rectifier working mode and shows the procedure to find the minimum WPT switching frequency that guarantees the power transfer peak on the battery. Section 3 shows the simulation procedure adopted to verify the analytical results found above and the comparison of the simulation results to the analytical model predictions. Finally, Section 4 discusses the results obtained, and Section 5 draws the conclusions.

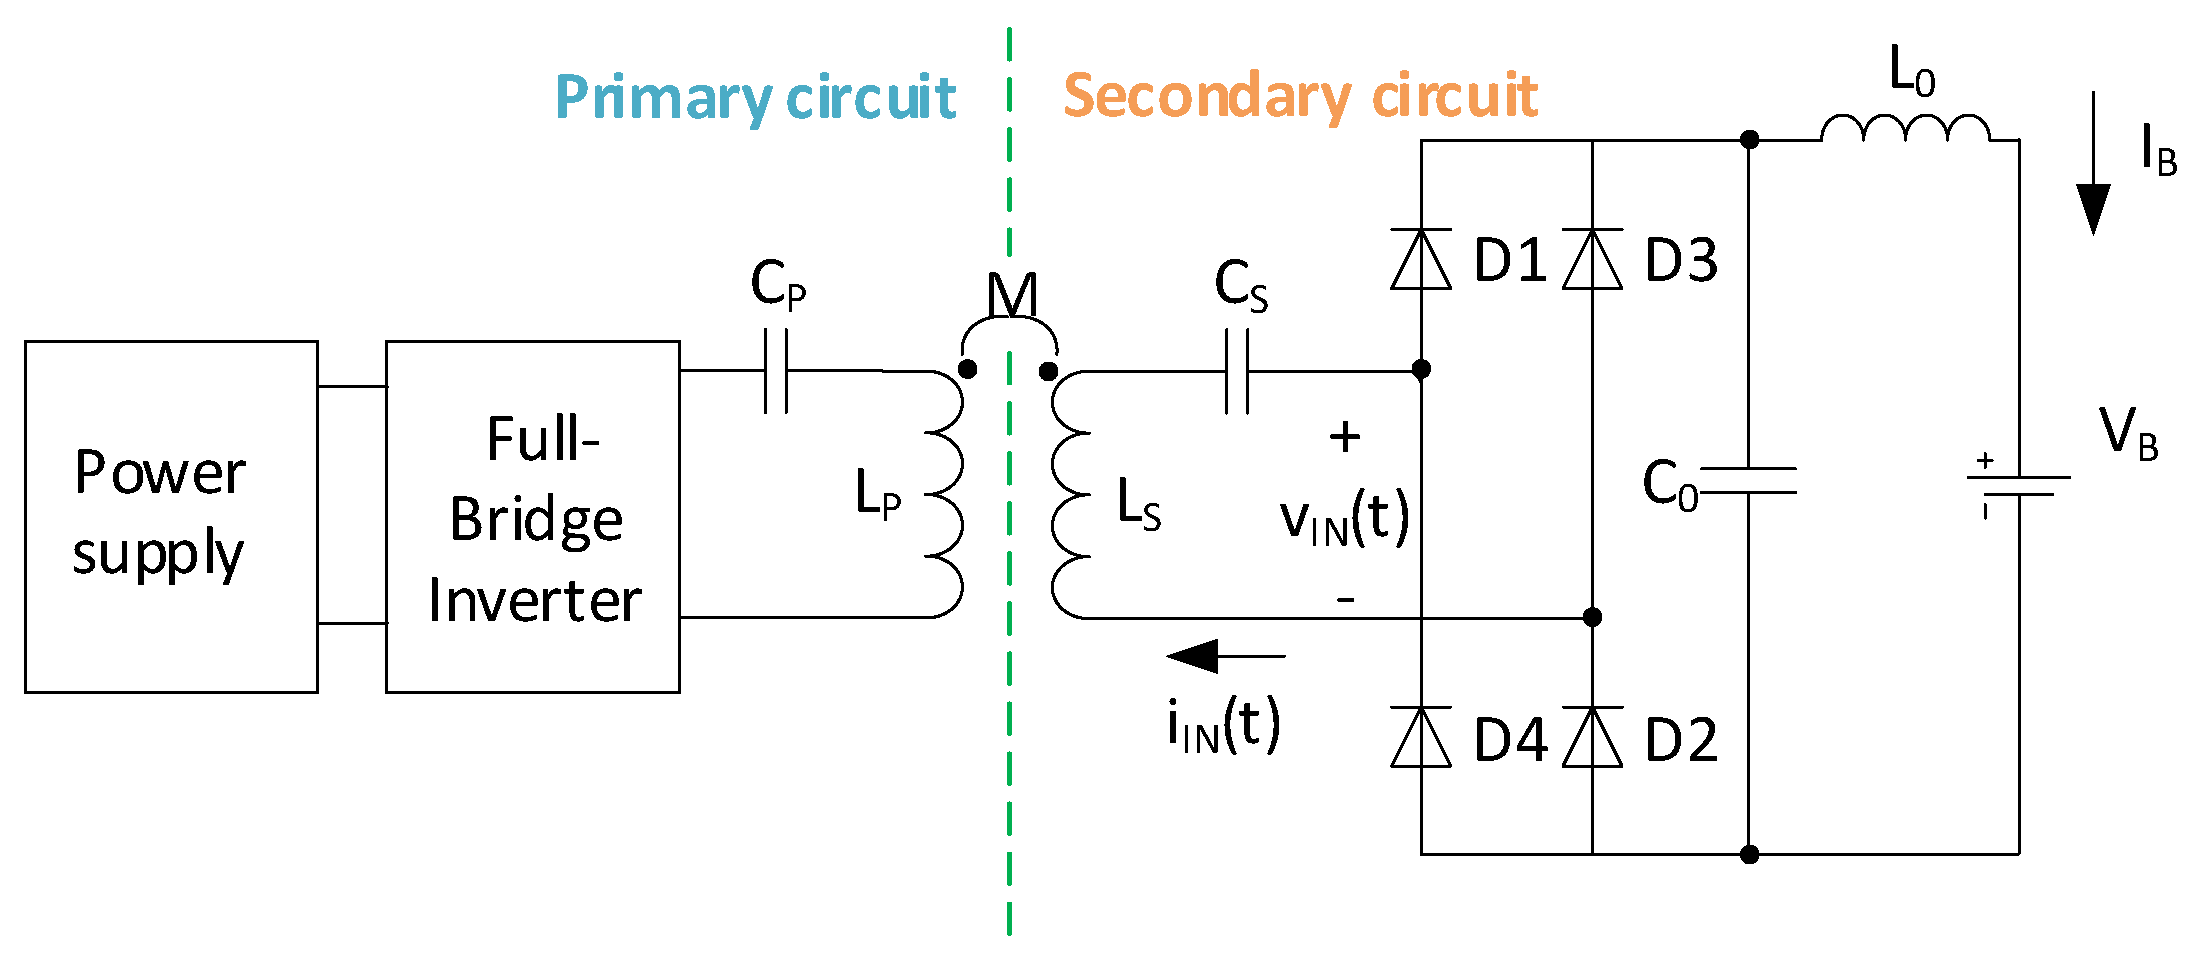
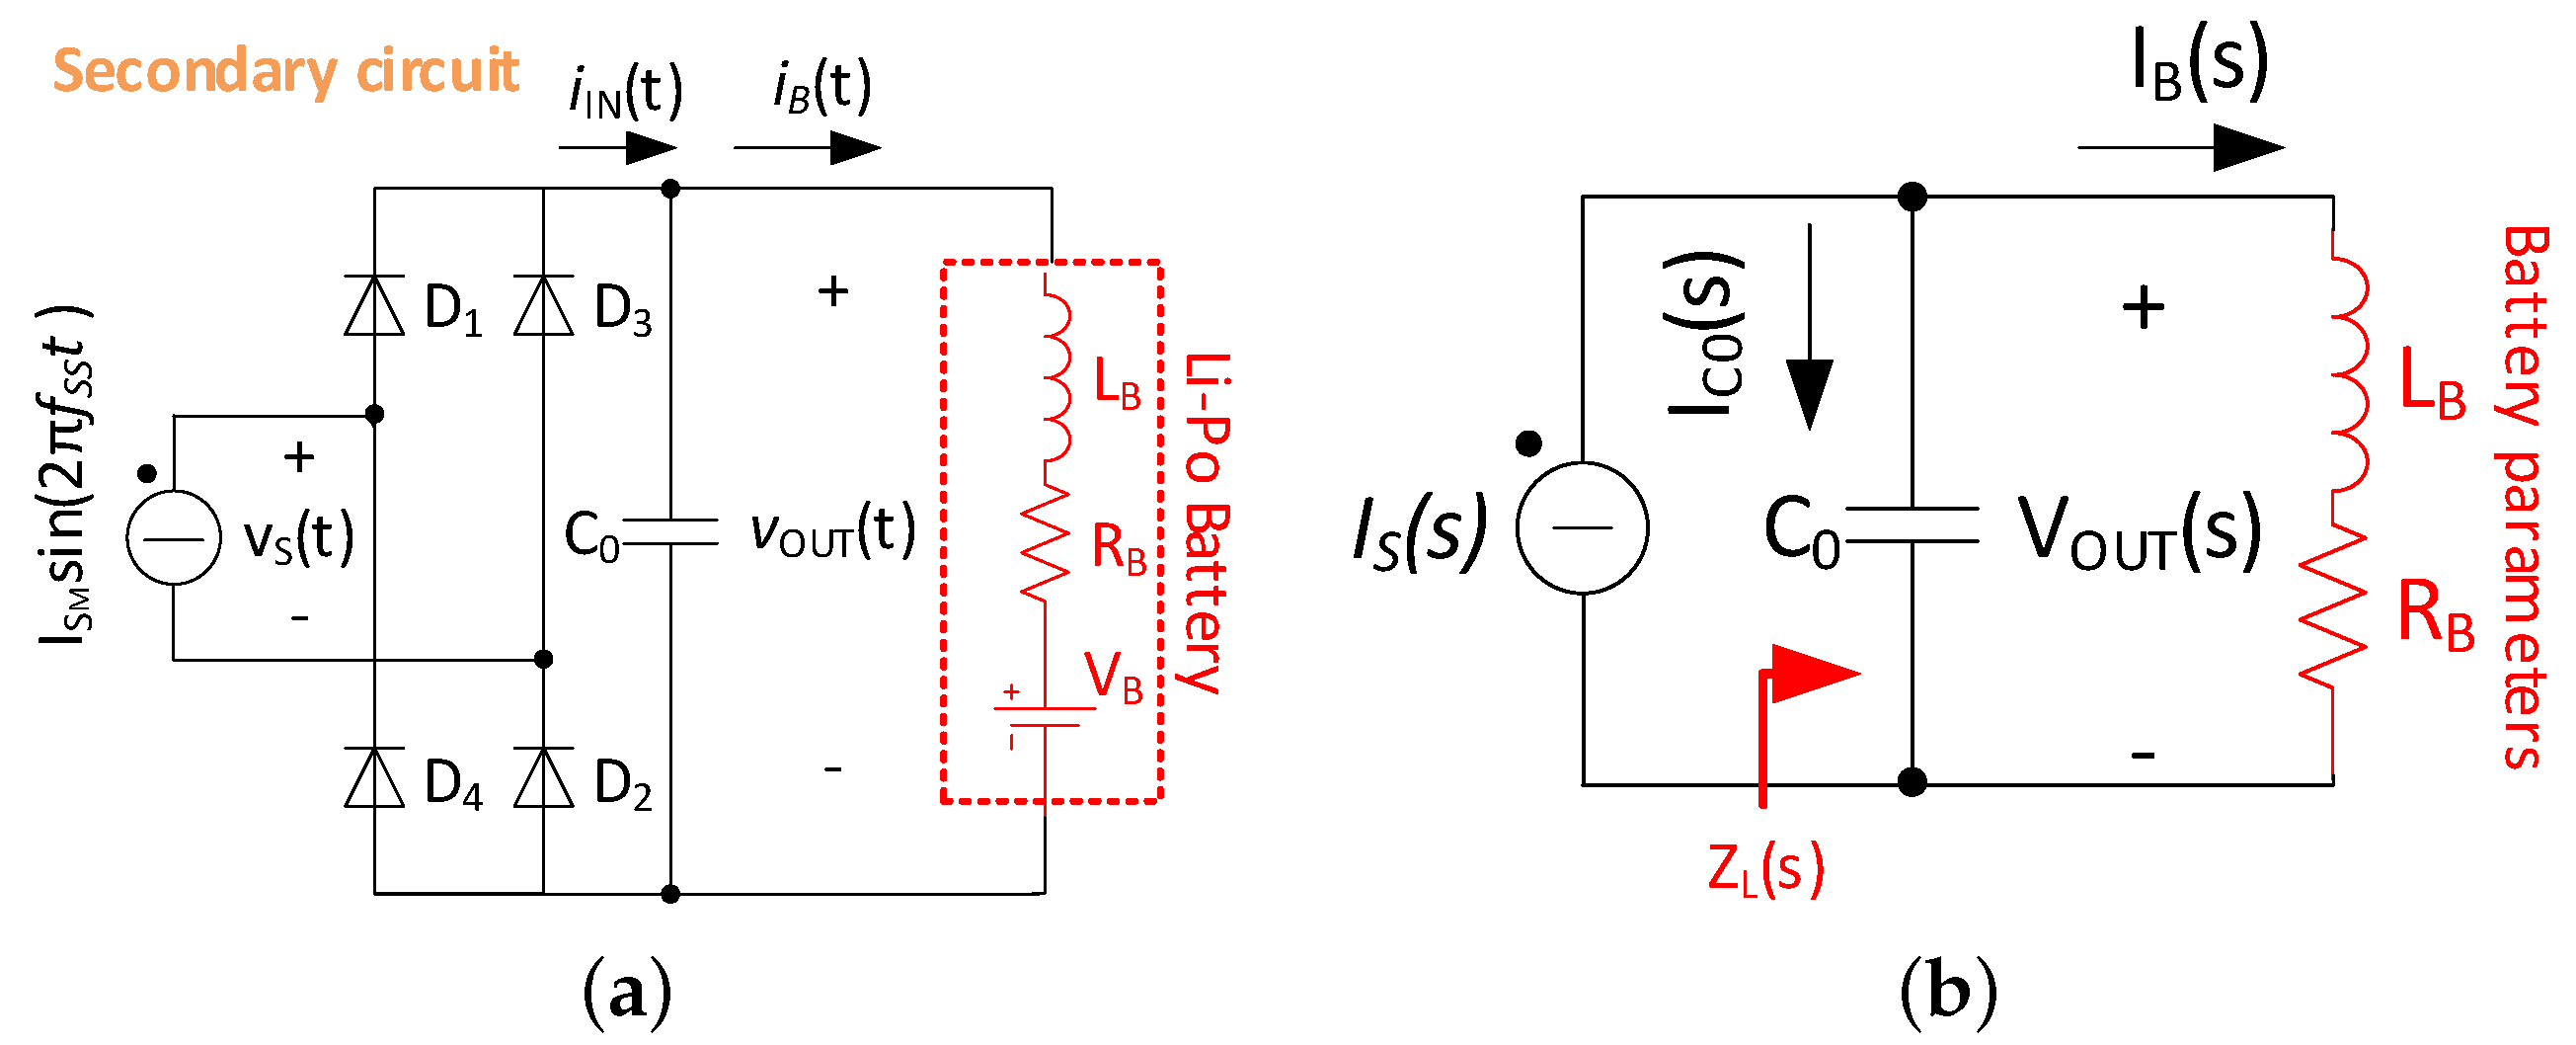
2. Secondary Load Characterization

The study carried out in this section is necessary to focus on the main scope of the paper: it consists of determining if the power transfer increment, obtained in [12] by adopting (1), is generally achievable with any battery. Let us first introduce the main assumptions taken to simplify the electrical problem and make the investigation independent of the WPT parameters. Figure 2a shows the circuit under investigation, where:
  • the SS architecture sets the sinusoidal current amplitude I S M to the secondary side when the primary circuit is supplied with a sinusoidal voltage source at its natural resonance frequency f s s , as indicated in [16]. Therefore, the WPT system is seen from the secondary side as an ideal sinusoidal current generator [15];
  • the bridge rectifier diodes are ideal with no voltage drop and series-resistance.
  • the typical high-frequency Li-ion battery model is adopted [28], which is composed of a constant voltage generator V B , a series-resistance R B , and a stray-inductance L B . The battery inductance L B is used as the LC-filter inductor, in place of an external component, to save size and weight on-board, as proposed in [12].
Instead, Figure 2b shows the circuit used to characterize the AC response of the load.

2.1. Load Frequency Response

The Laplace domain circuit analysis of the current-fed circuit in Figure 2b is well known. Assuming the second-order filter with complex conjugate poles [12], the load impedance Z L is shown in (2). At the same time, the transfer functions of the battery and capacitor C 0 currents, G I B and G I C 0 , are shown in (3) and (4), respectively. The expressions are calculated at the LC-filter resonance frequency ω L , where I B ( j ω L ) , I C 0 ( j ω L ) and I I N ( j ω L ) are the AC-currents of the battery, the capacitor, and the low-pass filter input, respectively. If C 0 is set to C * , as indicated in (1), the LC-filter cut-off angular frequency is two times the WPT excitation, i.e., ω L = 4 π f S S .
Z L ( j ω L ) = R B ( 1 + L B R B j ω L ) j 2 ξ C 0 = C * = j 4 π L B f S S ( 1 + j 4 π L B R B f S S )
G I B ( j ω L ) = I B ( j ω L ) I I N ( j ω L ) = 1 j 2 ξ C 0 = C * = j 4 π L B R B f S S
G I C 0 ( j ω L ) = I C 0 ( j ω L ) I I N ( j ω L ) = 1 G I B ( j ω L )
The expressions of ω L and ξ that represent the LC-filter resonance frequency and the load damping factor are reported in (5), like in [21].
ξ = R B 2 C 0 L B = R B 2 ω L L B , ω L = 1 L B C 0
It is clear that the load frequency response strictly depends on the battery parameters. Different battery types will thus produce different electrical behaviors.

2.2. Analysis with Large Values of C 0

The rule of thumb commonly used in the design of a WPT system consists of choosing C 0 large enough to consider constant the voltage on it [20]. Thus, the rectifier output voltage and current waveforms are sketched in Figure 3a. As pointed out in [29], the bridge rectifier diodes work as independent couples D 1 , D 2 and D 3 , D 4 (see Figure 2a). The current is a rectified sine-wave with I S M amplitude. According to the Fourier’s series decomposition, it can be expressed, as in (6).
i I N ( t ) = I I N 0 + 2 n = 1 + I I N n cos ( n ω I N t + θ I N n )
Here, the amplitude I I N n and phase θ I N n of the n-th component of the Fourier decomposition are well known and represented in (7) and (8).
I I N n = 2 I S M π 1 4 n 2 1 for n 0
θ I N n = π for n 1
Choosing a large value of C 0 leads to a very low LC-filter cut-off angular frequency ω L . Thus, all the sinusoidal components in (6) are filtered, and the battery is charged with the constant current I B a v g = I I N 0 given in (7). Moreover, the harmonic components of v O U T ( t ) are eliminated by the low pass filtering effect. Hence, assuming the voltage on C 0 constant is a very good approximation.

2.3. Analysis with C 0 = C *

Using the value C * of (1) in the LC-filter capacitor means setting the low-pass filter cut-off angular frequency equal to the fundamental component of the bridge rectifier output current ( ω L = ω I N 1 ), as previously occurred in [12,21]. Now, the secondary load works as a narrow-band selective filter near its resonance frequency ω L . The battery current and voltage waveforms consist of an average value, to which an AC-component at ω I N 1 is superimposed. At the same time, the current flowing in C 0 shows only the ripple component at ω I N 1 . For the sake of clarity, the battery current and voltage and the LC-filter capacitor current are reported in (9)–(11), respectively, where A and A represents the module and phase of the complex number A.
i B ( t ) = I I N 0 + 2 G I B ( j ω I N 1 ) · I I N 1 sin ω I N 1 t + θ I N 1 + G I B ( j ω I N 1 )
v O U T ( t ) = V B + 2 Z L ( j ω I N 1 ) · I I N 1 sin ω I N 1 t + θ I N 1 + Z L ( j ω I N 1 )
i C 0 ( t ) = 2 G I C 0 ( j ω I N 1 ) · I I N 1 sin ω I N 1 t + θ I N 1 + G I C 0 ( j ω I N 1 )
The corresponding waveforms are shown in Figure 3c.
The battery current and voltage waveforms obtained in previous works [12,21] are sketched in Figure 3b. They are rather different from what is expected from the above theory, as reported in (9) and (10) and shown in Figure 3c. The battery voltage AC-component V 1 , expressed in (12), is sufficient to bring v O U T ( t ) to reach zero over an interval in each oscillating period, in the cases referenced.
| V 1 | = 2 Z L ( j ω I N 1 ) I I N 1 = Z L ( j ω I N 1 ) 2 3 I B a v g
The bridge works with rectifying diode couples when v O U T t > 0 , and the output current is a rectified sine-wave. Instead, all the diodes are switched-on when v O U T ( t ) = 0 . The capacitor and the battery terminals are short-circuited, and a discontinuity is introduced in the current waveform. Here, the current in the battery starts to decrease with the typical exponential behavior of an RL-network, with the time constant τ = L B R B . The current profile in Figure 3b is thus justified if the short-circuit interval is lower than τ . This working modality of the rectifier is known as discontinuous-mode, and it is carefully described in [29] for a current-fed rectifier. The discontinuous-mode increases the battery average current I B a v g , producing a significant battery power increase, as found in [12,21]. The discontinuous-mode is maintained until the bridge rectifier output voltage in (10) remains zero and resumes in every period of the output waveform. Thus, we can conclude that the discontinuous-mode is activated when the voltage oscillation is larger than the average value, as indicated in (13), i.e., the module of the load impedance is large enough to determine large oscillations and to satisfy (13). The condition on the load impedance module that guarantees the discontinuous modality is found in (14), by substituting (12) in (13).
V B | V 1 | 0
| Z L ( j ω I N 1 ) | 3 2 V B I B a v g
However, Z L ( j ω I N 1 ) depends on the battery average current I B a v g , and the parameters L B , R B , and V B . Therefore, a WPT system may not work in discontinuous-mode for any battery if the load impedance is not sufficiently high. The waveforms are those reported in Figure 3c, if (14) is not satisfied, where the rectifier input current is still a rectified sine. The battery average current does not show any increment, and no benefits on the power transfer are obtained. The important conclusion and the main contribution derived from this analysis is that the design constraint in (1) is necessary but not sufficient to achieve a power transfer increment for any battery. Instead, the power transfer improvement is only obtained if the battery parameters satisfy (14).

2.4. Effects of the WPT Excitation Frequency on the Load Impedance

The conclusions of Section 2.3 show that the wireless power transfer increase experimentally demonstrated in [12] is not a general phenomenon always occurring when the WPT output filter is designed according to (1). Assuming that the battery is characterized and its parameters are known, the question is if the power transfer increase may be achieved by varying other parameters of the WPT system. The key is the increase of the secondary circuit load impedance that leads the diode bridge to work in discontinuous-mode. The impedance can be varied acting on the WPT excitation frequency, as expressed in (2). Indeed, the excitation frequency f S S and C * are related by (1). Thus, increasing f S S means decreasing C * and the LC-filter damping factor, thus enhancing the circuit oscillatory response. This section aims at finding the minimum WPT excitation frequency in which the bridge still works in discontinuous-mode, starting from the knowledge of the battery parameters. The biquadratic equation in (15) is obtained by substituting (2) in (14). The roots ω 1 , 2 of the equation are reported in (16).
L B 4 R B 2 ω L 4 + L B 2 ω L 2 9 V B 2 4 I B a v g 2 0
ω 1 , 2 = R B 2 L B 1 ± 1 + 9 V B 2 R B 2 I B a v g 2
The positive root ω 1 represents the minimum angular frequency for the discontinuous-mode operation of the rectifier. Since C 0 = C * , the angular frequency ω 1 is two times the WPT excitation frequency f S S , which can finally be expressed as in (17).
f S S M I N = R B 2 5 2 π L B 1 + 9 V B 2 R B 2 I B a v g 2 1
Then, the maximum LC-filter capacitor C M A X * that guarantees the discontinuous-mode operation can be obtained by substituting (17) in (1). It is finally concluded that knowing the equivalent electrical parameters of a generic battery makes it possible to find a WPT excitation frequency at which the increase of the power transfer is achieved. It is worth highlighting that this concept represents another contribution introduced by this work.

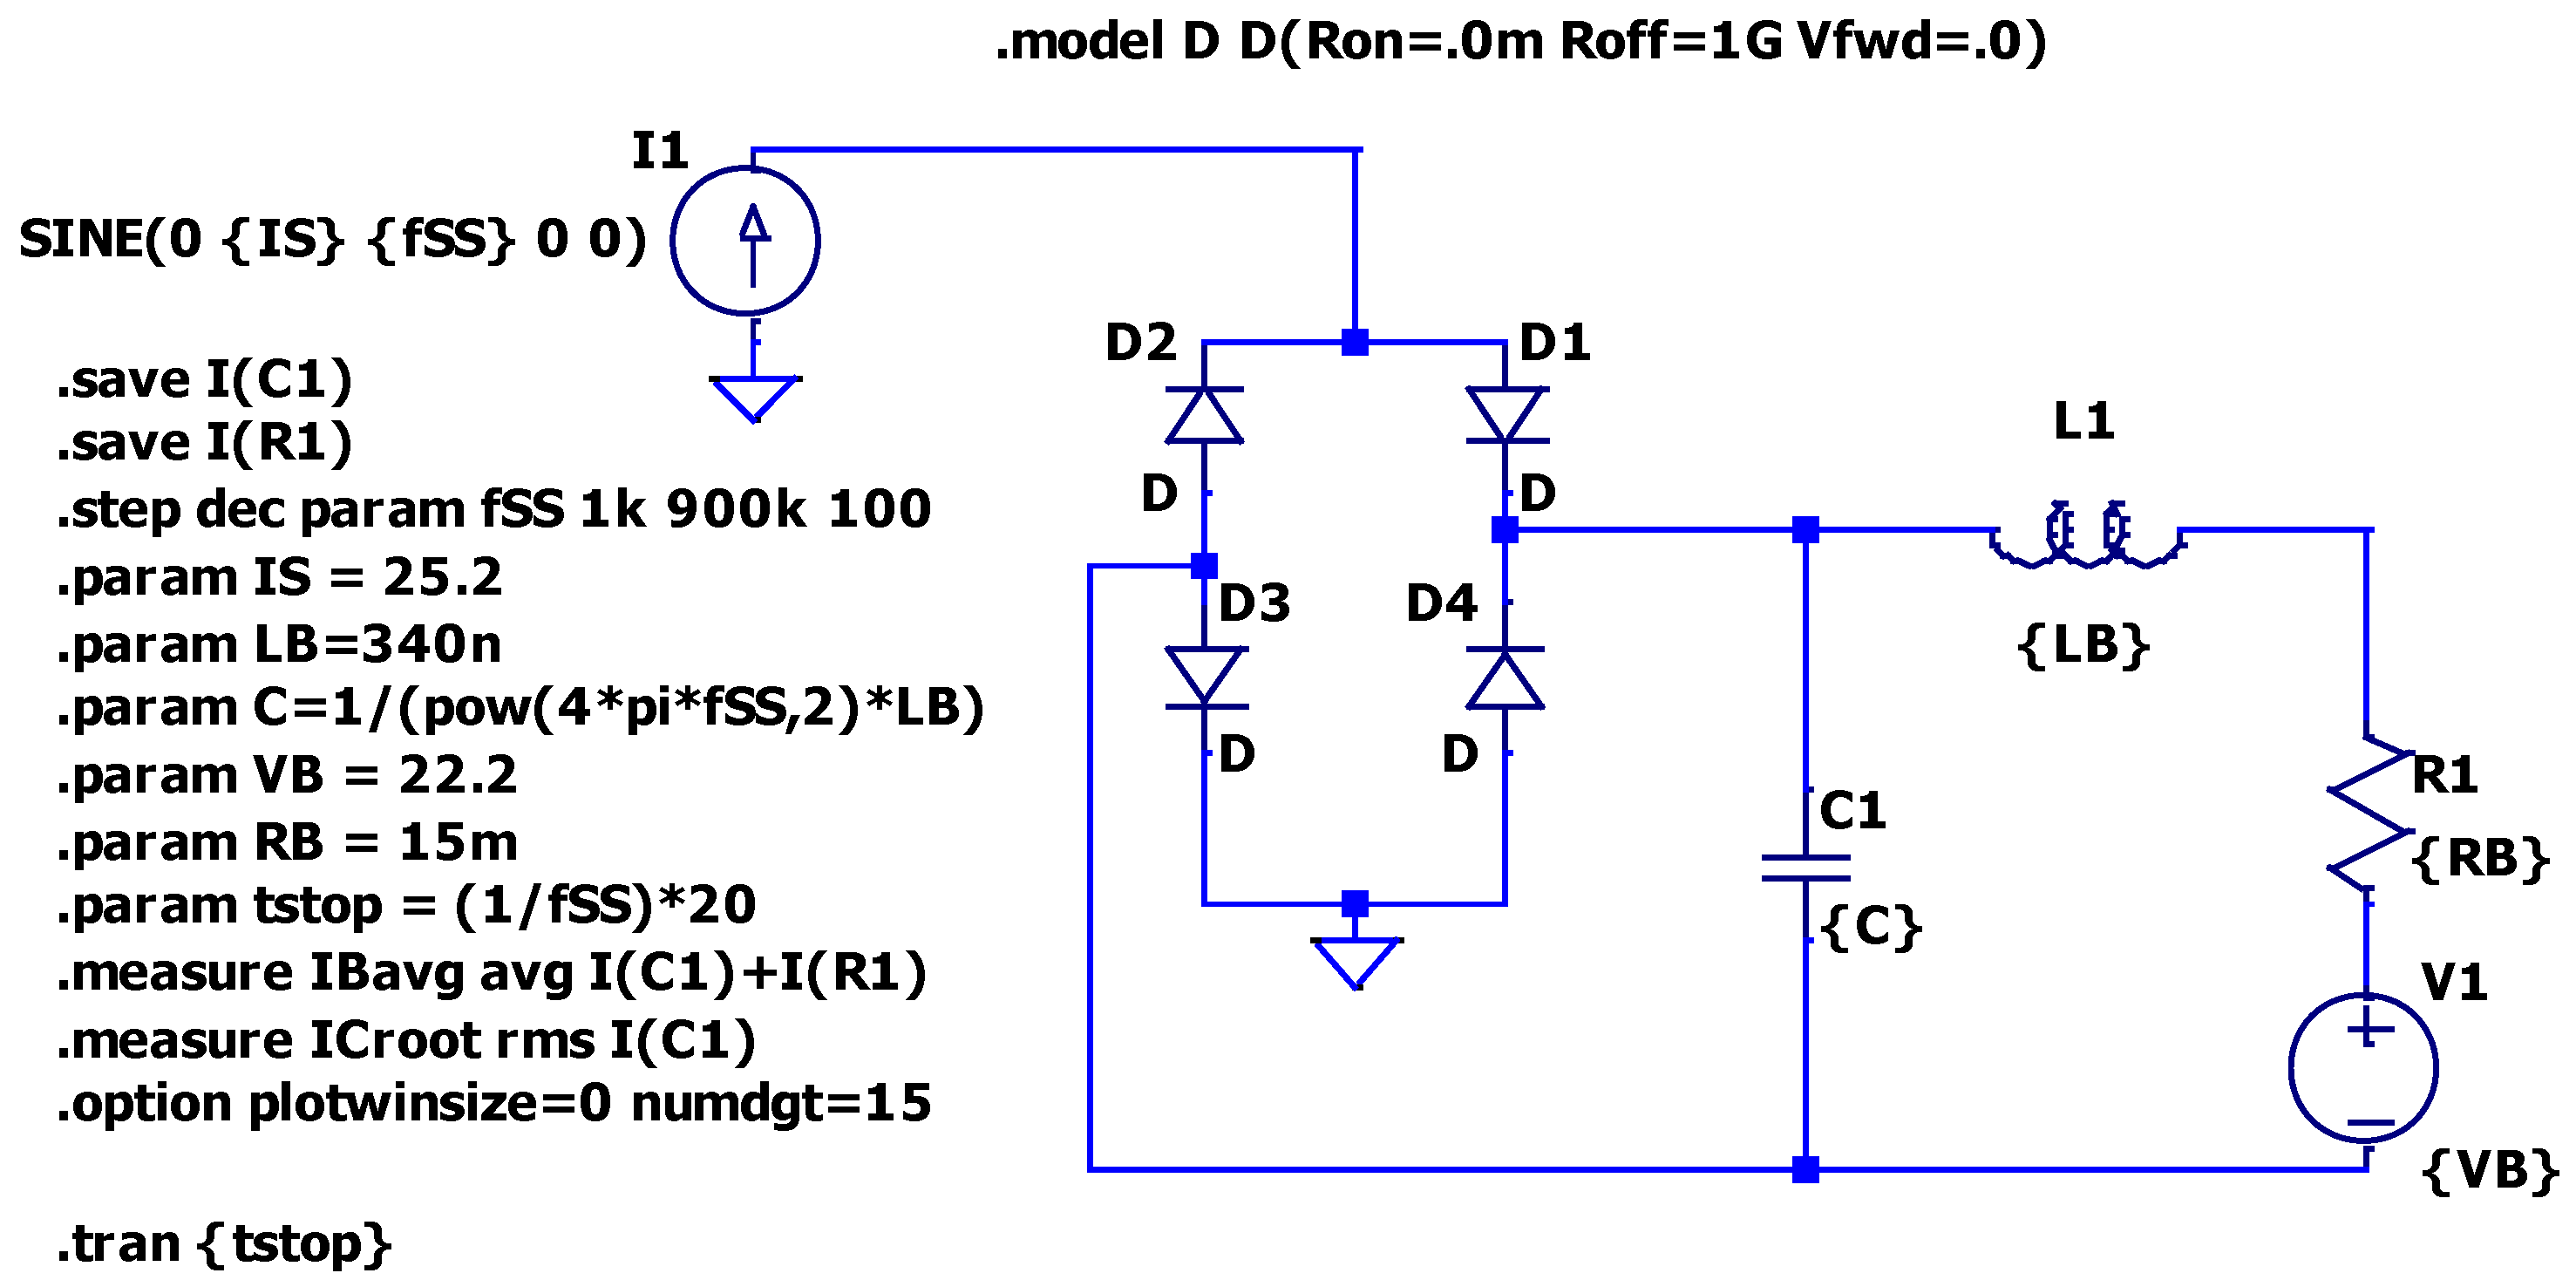
3. Simulation Analysis

The analytical investigation carried out in the previous section is validated with LTSpice time-domain simulations. Figure 4 shows the equivalent circuit and the LTSpice directives adopted in the simulations. Specifically, the command “.step” performs a parametric simulation on f S S , varying its value in steps from f start to f stop , as reported in Table 1. A time simulation is performed for each frequency step. The command “.measure” saves for each simulation the average and rms currents of the battery and the rms current of the LC-filter capacitor, when the circuit reaches the steady-state.
The directive “.param” is needed to recalculate the value of C 1 as indicated in (1) for each simulation point. Two case studies are investigated [12,30]. They are described as Test 1 and Test 2 in Table 2. The parametric simulation is performed, and the results are plotted versus the WPT excitation frequency. The battery parameters are extracted from the relevant papers and summarized in Table 2. The two batteries are very different one from the other in terms of the number of cells, capacity, and target application. The battery voltage is set to the nominal value. The current generator amplitude is set to produce a battery average current of 1 C, i.e., the value needed to charge the battery in one-hour when the bridge works in continuous-mode. The amplitude is 25.13 A and 1.26 A for Test 1 and Test 2, respectively.

Results

Figure 5a,b show the battery average current i b a v g , the LC-filter capacitor rms current i c r m s , and the battery rms current i b r m s , in Test 1 and Test 2, respectively. The diagrams show a clear dependency on the WPT excitation frequency f S S , and two zones are identified. The first zone is for f S S < f S S M I N L T and the other for f S S > f S S M I N L T , where f S S M I N L T is the frequency value at which the peak in the rms currents is found and the average battery current starts to increase. The battery average current i b a v g shows a rather constant plateau with the lowest value in the first zone. The plateau values coincide with the battery charging current of 1 C, i.e., 16 A and 0.8 A for Test 1 and Test 2, respectively. Instead, the average current significantly increases in the second zone and tends to saturate to a value approximately around 40% higher than the plateau. Most of the increase is reached after around two octaves above f S S M I N L T . Since the battery charging power only depends on i b a v g , the higher average current corresponds to higher power transfer and shorter charging time.
The rms currents i c r m s and i b r m s reach the maximum value in f S S M I N L T . Here, they are approximately ten times higher than the starting point at 1 kHz. Then, they decrease in the second zone. The values return close to the starting point after around two octaves above f S S M I N L T also in this case. However, the AC-ripple components do not contribute to the battery charging. Rather, they are dissipated in the series-resistance decreasing the WPT efficiency. Finally, the transition frequency between the two zones is shown in Table 3 by comparing the value extracted from simulation and that analytically obtained with (17). The agreement is good in both the investigated cases. It should be noted that the separation frequency f S S M I N L T is very different from one case to the other.
Figure 6 shows the results of three time-domain simulations carried out with excitation frequencies of 20 kHz, 50 kHz and 200 kHz for Test 1, in which f S S M I N L T is found to be 42.65 kHz. They were used to extract three points of the current plots in Figure 5a. The frequency values are chosen below and above f S S M I N L T , with the aim of verifying the rectifier behavior reported in Figure 3. The battery voltage and current waveforms, the LC-filter capacitor current, and the rectifier output current are indicated as V ( vout + , vout ) , I ( R 1 ) , I ( C 1 ) and I ( C 1 ) + I ( R 1 ) , respectively. Figure 6a shows the case for f S S < f S S M I N L T . Here, the battery voltage never reaches zero and the rectifier always works in continuous-mode. The rectifier output current is a rectified sine wave with an average value of 16 A. Figure 6b describes the case when f S S is slightly higher than f S S M I N L T . The battery voltage reaches zero for a short time interval. The bridge is working in discontinuous-mode, and a small saw-tooth like piece is added to the rectified sine wave. The value of i b a v g increases, but the increment is rather little yet (7.5% higher than the plateau), as i b a v g = 17.2 A . Instead, Figure 6c illustrates the rectifier behavior for f S S f S S M I N L T . Here, the rectifier works in discontinuous-mode for a time interval larger than the previous case. The saw-tooth like portion of the current is larger, and the average battery current shows a considerable increment (32.5% higher than the plateau), as i b a v g = 21.2 A .
The output voltage amplitude V ( vout + , vout ) that sets the maximum sustainable voltage of the output capacitor is another point to be addressed to fully characterize the rectifier behavior. Figure 6 shows that the maximum amplitude of the output voltage grows passing from 20 kHz to 50 kHz, but it remains rather stable from 50 kHz to 200 kHz when the bridge works in discontinuous-mode.

4. Discussion

The results reported in this paper add knowledge to the works presented in [12,21] for a series-series WPT architecture. An unexpected power transfer increment was found in those papers by sizing the LC-filter capacitor to set the filter resonance frequency to the double of the WPT excitation. This paper demonstrates that the design constraint on C 0 indicated in (1) is necessary to obtain the power transfer increment, but it is not sufficient for any kind of battery. Indeed, the load impedance described in (2) strictly depends on the battery parameters. Thus, if the battery does not show a load impedance sufficiently high at the resonance frequency, the rectifier output voltage will never nullify, the diode bridge will work in continuous-mode, and the power gain is not obtained. However, the WPT excitation frequency can be used as an adjustable design parameter to achieve the power increment in any case. Indeed, a higher f S S means reducing the C * value for the same battery parameters, which reduces the filter damping factor. The second-order LC-filter behavior is more oscillatory, and the impedance at the resonance frequency is improved, as indicated in (2).
The analysis carried out in Section 2.4 allowed the calculation of the minimum frequency at which the system works in discontinuous-mode, given the battery parameters. It is found that the minimum frequency necessary to bring the rectifier in discontinuous-mode is higher in batteries with higher nominal voltage, higher series-resistance and lower stray inductance, as indicated in (17) and shown in Figure 5.
The current profiles reported in Figure 5 suggest choosing the highest possible value for f S S , because the power transfer rises monotonically and the rms current components tend to decrease. Nevertheless, increasing the excitation frequency of the WPT system up to the megahertz range complicates the design for many reasons and shows several drawbacks. The device parasitic parameters are not negligible [31], so the assumption of ideal diodes is no longer valid. Moreover, Electro-Magnetic Interference issues must properly be addressed at higher frequencies [18]. On the other hand, choosing a working frequency too close to f S S M I N only allows a small improvement of the power transfer to the battery and produces very high current and voltage oscillations that may damage the output capacitor. Furthermore, the saturation effects on the diagrams in Figure 5 suggest finding a trade-off. Our proposal reported in (18) recommends setting the WPT excitation frequency around two-octaves above f S S M I N . A battery power increment of 32.5% compared to the plateau is obtained in this paper example by following the recommendations.
f S S 4 f S S M I N C 0 = 1 4 π f S S 2 L B
If f S S M I N resulted too high making the WPT design not feasible, the insertion of an external inductor in series to the battery would reduce it, at the expense of additional weight and size on-board the drone.
Although the effects of the sinusoidal high-frequency ripple current components on the battery aging are not clear in the scientific literature yet [23], it is important to discuss the design choices reported in (18). The values of f S S M I N and C 0 strictly depend on the battery lumped parameters. Therefore, the effect of their variations on the WPT operation has to be dealt with. The battery series-inductance L B mainly depends on the length and the geometry of the electrodes inside the battery case [32]. Thus, it is not expected to show significant variations. Therefore, the LC-filter resonant frequency is supposed to be almost invariant with battery aging, and the WPT charger is not required to adjust C 0 or tune f S S during the entire battery life. Instead, the battery series-resistance R B and voltage V B change as a function of the battery state of charge [33]. Moreover, the R B increase is one of the most evident signs of battery aging [34]. Thus, f S S M I N depends on the variations of R B and V B . It varies proportionally with the R B L B ratio and V B , as shown in (17). Specifically, a larger R B moves f S S M I N to higher frequencies, getting closer to the suggested WPT excitation frequency f S S . The net effect is the reduction of the power transfer increase and larger output current oscillations, with possible dangerous effects on the LC-filter capacitor. f S S M I N also depends on the amplitude I S M of the current before the rectifier, as a function of 1 I S M . I S M is depends on the voltage amplitude at the primary side. The value of f S S M I N is determined at design time in the worst case, i.e., for the minimum battery voltage V B M I N , the maximum R B expected, and the average current rate desired.
This work has showed the conditions to improve the power transfer of a wireless series-series architecture by exploiting the rectifier discontinuous mode. The charging power transfer increment is achieved by properly sizing the DC-link filter capacitor and the WPT excitation frequency. It is found an increment around 30% compared to the traditional DC-link capacitor sizing method, which is obtained without changing other WPT parameters, such as the voltage amplitude at the primary circuit. This finding leads to the development of a wireless fast charger that may found general application, particularly when a shorter charging time reduces the out-of-service intervals, such as in electric scooters adopted in city sharing services and the autonomous electric vehicles used with surveillance scopes.
Finally, it is worth remarking on the main outcomes of the investigation:
  • the WPT design choice specified in (1) is not sufficient to achieve the increment of the power transferred to the battery because the rectifier can still work in continuous-mode if the load impedance is not high enough;
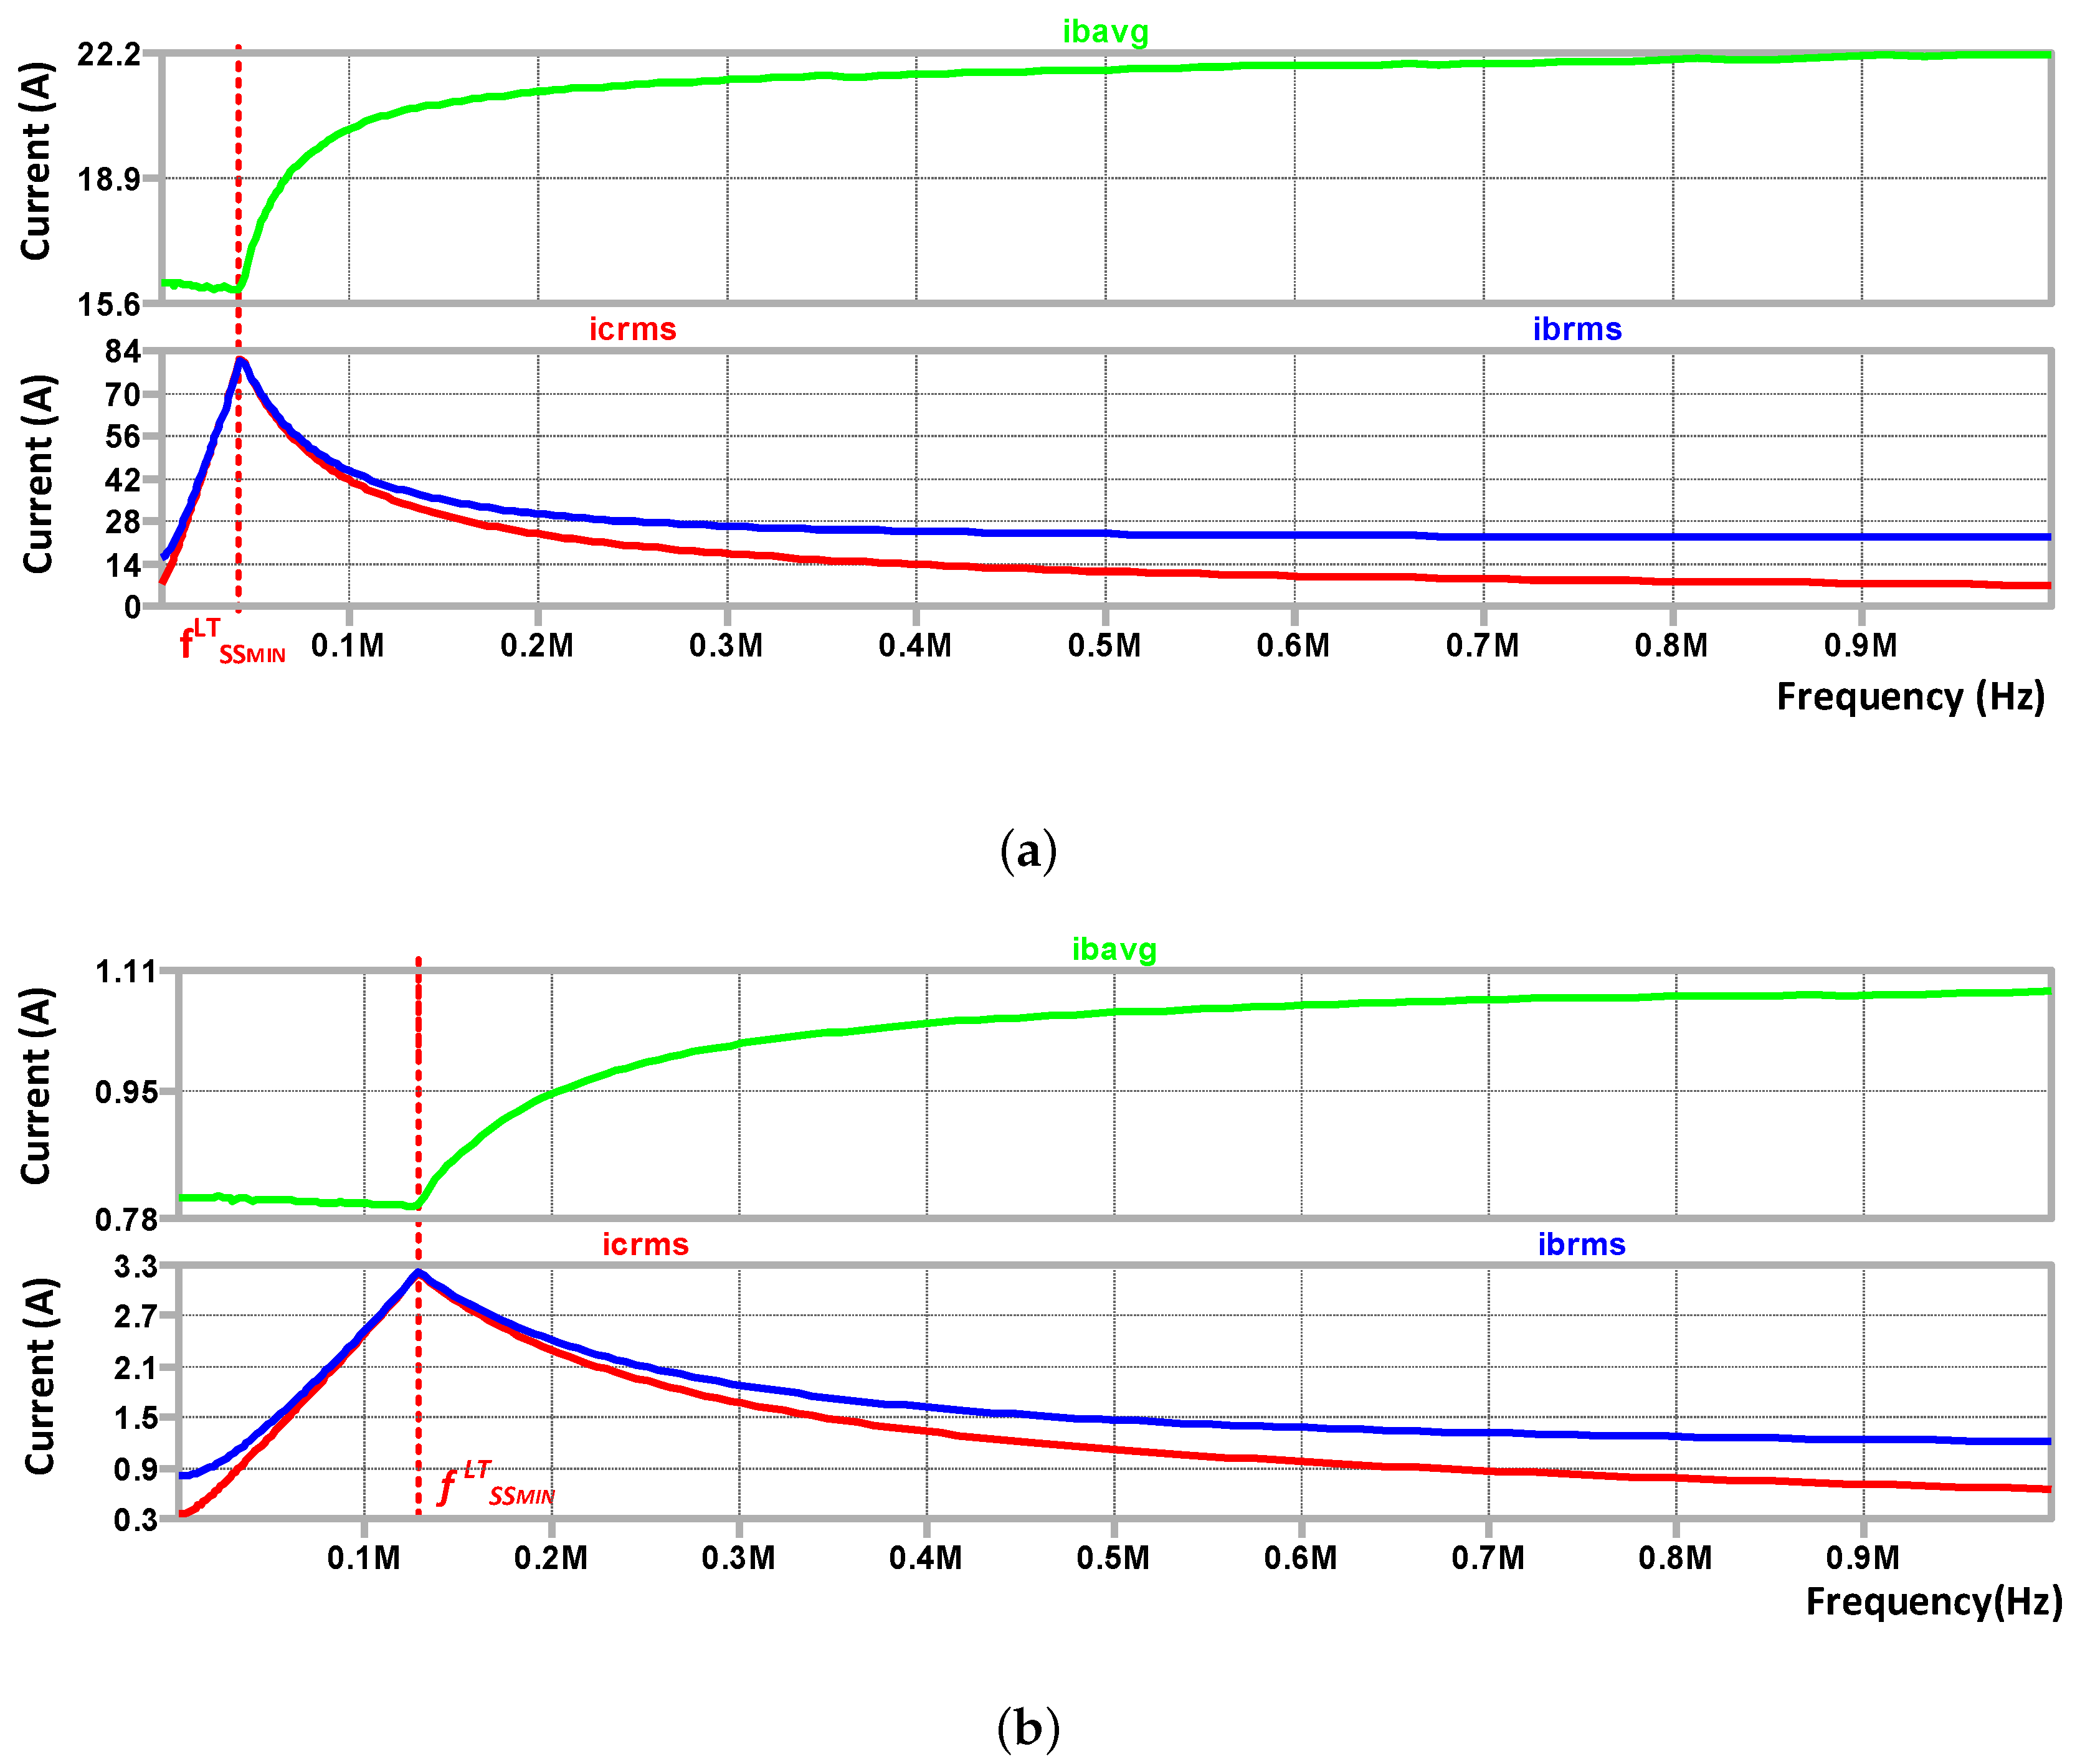
  • the analytical determination of f S S M I N is confirmed by the simulation results with good agreement, highlighting that batteries with higher R B L B ratio and V B have greater f S S M I N ;
  • the WPT excitation frequency can be used as a design parameter to increase the load impedance for a given battery and force the rectifier to work in discontinuous-mode, achieving the power transfer increase;
  • the design recommendation proposed in [12] should be complemented by a recommendation about the choice of the WPT excitation frequency to enjoy the benefit of the improved power transfer. The proper choice determines the increment of the average battery current still maintaining affordable output rms currents. The WPT excitation frequency should be at least a couple of octaves above f S S M I N , as expressed in (18).

5. Conclusions

The work presented in this paper confirms that the wireless power transfer can be increased to reduce the battery charging times, as it would be welcome in many applications. The power transfer improvement is obtainable if the secondary circuit works in resonance, by setting the output filter resonance frequency equal to the double of the wireless excitation. The paper shows both analytically and by circuit simulations that the above condition is necessary but not sufficient to obtain the power transfer improvement with any kind of battery. The key factor is leading the diode rectifier bridge to work in discontinuous-mode. If this happens, the average value of the battery recharging current increases, determining a larger power transfer. The drawback is the onset of oscillations in the output waveforms. The analytical procedure confirmed by the simulations started from the knowledge of the parameters of a generic battery and led to find the minimum frequency at which the bridge works in discontinuous-mode. The power transfer is found to increase, but it tends to saturate when the wireless excitation frequency rises. Therefore, a design recommendation is suggested to achieve a power transfer increment of about 30% with any battery. Specifically, we suggest using a wireless excitation frequency four times higher than the limit to obtain significant power transfer increments and acceptable battery and output filter capacitor rms currents. Finally, the effect of the battery parameter variations with state of charge and aging on the wireless power transfer system are discussed.

Author Contributions

Conceptualization, A.C. and R.R.; methodology, A.C. and R.D.R.; validation, A.C., and R.D.R.; writing—original draft preparation, A.C.; writing—review and editing, F.B., R.D.R. and R.S.; supervision, R.R., R.S.; funding acquisition, F.B., R.R. and R.S. All authors have read and agreed to the published version of the manuscript.

Funding

This research was partially funded by PAR FAS Toscana 2007–2013 (Bando FAR FAS 2014), under agreement n. 4421.02102014.072000022 Project SUMA, and supported by CrossLab project, University of Pisa, funded by MIUR “Department of Excellence” program.

Institutional Review Board Statement

Not applicable.

Informed Consent Statement

Not applicable.

Data Availability Statement

Not applicable.

Acknowledgments

The authors wish to thank Antonio Colicelli for his administrative support.

Conflicts of Interest

The authors declare no conflict of interest.

References

  1. Mouli, G.R.C.; Duijsen, P.V.; Grazian, F.; Jamodkar, A.; Bauer, P.; Isabella, O. Sustainable E-Bike Charging Station That Enables AC, DC and Wireless Charging from Solar Energy. Energies 2020, 13, 3549. [Google Scholar] [CrossRef]
  2. Khan, S.R.; Pavuluri, S.K.; Cummins, G.; Desmulliez, M.P.Y. Wireless Power Transfer Techniques for Implantable Medical Devices: A Review. Sensors 2020, 20, 3487. [Google Scholar] [CrossRef] [PubMed]
  3. Hui, S.R. Technical and safety challenges in emerging trends of near-field wireless power transfer industrial guidelines. IEEE Electromagn. Compat. Mag. 2018, 7, 78–86. [Google Scholar] [CrossRef]
  4. Junaid, A.B.; Lee, Y.; Kim, Y. Design and implementation of autonomous wireless charging station for rotary-wing UAVs. Aerosp. Sci. Technol. 2016, 54, 253–266. [Google Scholar] [CrossRef]
  5. Rohan, A.; Rabah, M.; Talha, M.; Kim, S.H. Development of Intelligent Drone Battery Charging System Based on Wireless Power Transmission Using Hill Climbing Algorithm. Appl. Syst. Innov. 2018, 1, 44. [Google Scholar] [CrossRef] [Green Version]
  6. Campi, T.; Cruciani, S.; Feliziani, M. Wireless Power Transfer Technology Applied to an Autonomous Electric UAV with a Small Secondary Coil. Energies 2018, 11, 352. [Google Scholar] [CrossRef] [Green Version]
  7. Choi, C.H.; Jang, H.J.; Lim, S.G.; Lim, H.C.; Cho, S.H.; Gaponov, I. Automatic wireless drone charging station creating essential environment for continuous drone operation. In Proceedings of the 2016 International Conference on Control, Automation and Information Sciences (ICCAIS), Ansan, Korea, 27–29 October 2016; IEEE: New York, NY, USA, 2016. [Google Scholar] [CrossRef]
  8. Junaid, A.; Konoiko, A.; Zweiri, Y.; Sahinkaya, M.; Seneviratne, L. Autonomous Wireless Self-Charging for Multi-Rotor Unmanned Aerial Vehicles. Energies 2017, 10, 803. [Google Scholar] [CrossRef]
  9. Kim, S.; Lim, G. A Hybrid Battery Charging Approach for Drone-Aided Border Surveillance Scheduling. Drones 2018, 2, 38. [Google Scholar] [CrossRef] [Green Version]
  10. Campi, T.; Cruciani, S.; Maradei, F.; Feliziani, M. Innovative Design of Drone Landing Gear Used as a Receiving Coil in Wireless Charging Application. Energies 2019, 12, 3483. [Google Scholar] [CrossRef] [Green Version]
  11. Wang, C.S.; Stielau, O.; Covic, G. Design Considerations for a Contactless Electric Vehicle Battery Charger. IEEE Trans. Ind. Electron. 2005, 52, 1308–1314. [Google Scholar] [CrossRef]
  12. Carloni, A.; Baronti, F.; Rienzo, R.D.; Roncella, R.; Saletti, R. Effect of the DC-Link Capacitor Size on the Wireless Inductive-Coupled Opportunity-Charging of a Drone Battery. Energies 2020, 13, 2621. [Google Scholar] [CrossRef]
  13. Campi, T.; Cruciani, S.; Feliziani, M.; Maradei, F. High efficiency and lightweight wireless charging system for drone batteries. In Proceedings of the 2017 AEIT International Annual Conference, Cagliari, Italy, 20–22 September 2017. [Google Scholar] [CrossRef]
  14. Wang, C.S.; Covic, G.; Stielau, O. Power Transfer Capability and Bifurcation Phenomena of Loosely Coupled Inductive Power Transfer Systems. IEEE Trans. Ind. Electron. 2004, 51, 148–157. [Google Scholar] [CrossRef]
  15. Zhang, W.; Mi, C.C. Compensation Topologies of High-Power Wireless Power Transfer Systems. IEEE Trans. Veh. Technol. 2016, 65, 4768–4778. [Google Scholar] [CrossRef]
  16. Lee, W.S.; Kim, J.H.; Cho, S.Y.; Lee, I.O. An Improved Wireless Battery Charging System. Energies 2018, 11, 791. [Google Scholar] [CrossRef] [Green Version]
  17. Fu, M.; Tang, Z.; Ma, C. Analysis and Optimized Design of Compensation Capacitors for a Megahertz WPT System Using Full-Bridge Rectifier. IEEE Trans. Ind. Inform. 2019, 15, 95–104. [Google Scholar] [CrossRef]
  18. Song, C.; Kim, H.; Kim, Y.; Kim, D.; Jeong, S.; Cho, Y.; Lee, S.; Ahn, S.; Kim, J. EMI Reduction Methods in Wireless Power Transfer System for Drone Electrical Charger Using Tightly Coupled Three-Phase Resonant Magnetic Field. IEEE Trans. Ind. Electron. 2018, 65, 6839–6849. [Google Scholar] [CrossRef]
  19. Campi, T.; Cruciani, S.; Palandrani, F.; De Santis, V.; Hirata, A.; Feliziani, M. Wireless Power Transfer Charging System for AIMDs and Pacemakers. IEEE Trans. Microw. Theory Tech. 2016, 64, 633–642. [Google Scholar] [CrossRef]
  20. Liu, X.; Wang, T.; Yang, X.; Jin, N.; Tang, H. Analysis and Design of a Wireless Power Transfer System with Dual Active Bridges. Energies 2017, 10, 1588. [Google Scholar] [CrossRef] [Green Version]
  21. Carloni, A.; Baronti, F.; Rienzo, R.D.; Roncella, R.; Saletti, R. DC-Link Capacitor Sizing Method for a Wireless Power Transfer Circuit to Be Used in Drone Opportunity Charging. In Lecture Notes in Electrical Engineering; Springer International Publishing: Cham, Switzerland, 2020; pp. 397–403. [Google Scholar] [CrossRef]
  22. TDK Group Company. Film CapacitorsGeneral Technical Information. Available online: https://www.tdk-electronics.tdk.com/download/530754/480aeb04c789e45ef5bb9681513474ba/pdf-generaltechnicalinformation.pdf (accessed on 27 January 2021).
  23. Brand, M.J.; Hofmann, M.H.; Schuster, S.S.; Keil, P.; Jossen, A. The Influence of Current Ripples on the Lifetime of Lithium-Ion Batteries. IEEE Trans. Veh. Technol. 2018, 67, 10438–10445. [Google Scholar] [CrossRef]
  24. Uno, M.; Tanaka, K. Influence of High-Frequency Charge–Discharge Cycling Induced by Cell Voltage Equalizers on the Life Performance of Lithium-Ion Cells. IEEE Trans. Veh. Technol. 2011, 60, 1505–1515. [Google Scholar] [CrossRef]
  25. Prasad, R.; Namuduri, C.; Kollmeyer, P. Onboard unidirectional automotive G2V battery charger using sine charging and its effect on li-ion batteries. In Proceedings of the 2015 IEEE Energy Conversion Congress and Exposition (ECCE), Montreal, QC, Canada, 20–24 September 2015; pp. 6299–6305. [Google Scholar] [CrossRef]
  26. Uddin, K.; Somerville, L.; Barai, A.; Lain, M.; Ashwin, T.; Jennings, P.; Marco, J. The impact of high-frequency-high-current perturbations on film formation at the negative electrode-electrolyte interface. Electrochim. Acta 2017, 233, 1–12. [Google Scholar] [CrossRef]
  27. Uddin, K.; Moore, A.D.; Barai, A.; Marco, J. The effects of high frequency current ripple on electric vehicle battery performance. Appl. Energy 2016, 178, 142–154. [Google Scholar] [CrossRef] [Green Version]
  28. Cho, S.Y.; Lee, I.O.; Baek, J.I.; Moon, G.W. Battery Impedance Analysis Considering DC Component in Sinusoidal Ripple-Current Charging. IEEE Trans. Ind. Electron. 2016, 63, 1561–1573. [Google Scholar] [CrossRef]
  29. Smith, I.R.; Nisar, P.A. Bridge-Rectifier Operation with a Constant-Current Source. Int. J. Electr. Eng. Educ. 1972, 10, 15–20. [Google Scholar] [CrossRef]
  30. Gomez, J.; Nelson, R.; Kalu, E.E.; Weatherspoon, M.H.; Zheng, J.P. Equivalent circuit model parameters of a high-power Li-ion battery: Thermal and state of charge effects. J. Power Sources 2011, 196, 4826–4831. [Google Scholar] [CrossRef]
  31. Chen, K.; Zhao, Z.; Yuan, L.; Lu, T.; He, F. The Impact of Nonlinear Junction Capacitance on Switching Transient and Its Modeling for SiC MOSFET. IEEE Trans. Electron. Devices 2015, 62, 333–338. [Google Scholar] [CrossRef]
  32. Osswald, P.; Erhard, S.; Noel, A.; Keil, P.; Kindermann, F.; Hoster, H.; Jossen, A. Current density distribution in cylindrical Li-Ion cells during impedance measurements. J. Power Sources 2016, 314, 93–101. [Google Scholar] [CrossRef] [Green Version]
  33. Nejad, S.; Gladwin, D.; Stone, D. A systematic review of lumped-parameter equivalent circuit models for real-time estimation of lithium-ion battery states. J. Power Sources 2016, 316, 183–196. [Google Scholar] [CrossRef] [Green Version]
  34. Chen, L.; Lü, Z.; Lin, W.; Li, J.; Pan, H. A new state-of-health estimation method for lithium-ion batteries through the intrinsic relationship between ohmic internal resistance and capacity. Measurement 2018, 116, 586–595. [Google Scholar] [CrossRef]
Figure 1. Series-series architecture of a wireless charger used in drone applications. C p and C s are the compensation capacitors, L p , L s and M are the self and mutual inductances of the coupled coils. D1, D2, D3 and D4 are the rectifier diodes, L 0 and C 0 constitute the second-order filter.
Energies 14 00743 g001
Figure 2. Equivalent circuit under investigation (a); current-fed linear circuit studied to extract the load frequency response (b).
Energies 14 00743 g002
Figure 3. Secondary filter waveforms. Battery voltage v O U T and filter current i I N working in: continuous-mode with no voltage ripple (large C 0 ) (a); discontinuous-mode ( C 0 = C * ) (b); continuous-mode ( C 0 = C * ) (c).
Energies 14 00743 g003
Figure 4. Equivalent circuit and LTSpice directives used in the circuit parametric simulation.
Energies 14 00743 g004
Figure 5. Battery average current i b a v g , capacitor C 0 rms current i c r m s , and battery rms current i b r m s as a function of the WPT excitation frequency f S S , for Test 1 (a) and Test 2 (b).
Energies 14 00743 g005
Figure 6. Rectifier output voltage V ( vout + , vout ) , current flowing in C 0 I ( C 1 ) , battery current I ( R 1 ) , and rectifier output current I ( C 1 ) + I ( R 1 ) in Test 1. Continuous-mode operation for f S S = 20 kHz (a). Discontinuous-mode for f S S = 50 kHz (b) and f S S = 200 kHz (c).
Energies 14 00743 g006
Table 1. WPT excitation frequency interval in which the parametric simulation is carried out.
f start [kHz] f stop [kHz]Points Per Decade
11000100
Table 2. Battery electrical parameters used in the circuit simulations.
TestBattery Model# of CellsCap. [Ah] L B [nH] R B [mΩ] V B [V] I S [A]
1 [12]TA-15C-16000-6S1P-EC56163401522.225.13
2 [30]Sony UP3935610.847485.13.61.26
Table 3. Transition frequency value comparison ( f S S M I N from analysis, f S S M I N L T from simulation).
Test f SS MIN [kHz] C * f SS MIN [μF] f SS MIN LT [kHz] C * f SS MIN LT [μF]
141.2810.9342.6510.24
2126.841.16128.821.12
Publisher’s Note: MDPI stays neutral with regard to jurisdictional claims in published maps and institutional affiliations.

