Article

A Data-Driven and Data-Based Framework for Online Voltage Stability Assessment Using Partial Mutual Information and Iterated Random Forest

1
College of Electrical Engineering and New Energy, China Three Gorges University, Yichang 443002, China
2
Hubei Provincial Collaborative Innovation Center for New Energy Microgrid, China Three Gorges University, Yichang 443002, China
3
School of Electrical Engineering, Wuhan University, Wuhan 430072, China
4
School of Electrical and Electronic Engineering, Huazhong University of Science and Technology, Wuhan 430074, China
*
Author to whom correspondence should be addressed.
Energies 2021, 14(3), 715; https://doi.org/10.3390/en14030715
Submission received: 16 November 2020 / Revised: 17 January 2021 / Accepted: 25 January 2021 / Published: 30 January 2021

Abstract

:
Due to the rapid development of phasor measurement units (PMUs) and the wide area of interconnection of modern power systems, the security of power systems is confronted with severe challenges. A novel framework based on data for static voltage stability margin (VSM) assessment of power systems is presented. The proposed framework can select the key operation variables as input features for the assessment based on partial mutual information (PMI). Before the feature selection procedure is completed by PMI, a feature preprocessing approach is applied to remove redundant and irrelevant features to improve computational efficiency. Using the selected key variables, a voltage stability assessment (VSA) model based on iterated random forest (IRF) can rapidly provide the relative VSM results. The proposed framework is examined on the IEEE 30-bus system and a practical 1648-bus system, and a desirable assessment performance is demonstrated. In addition, the robustness and computational speed of the proposed framework are also verified. Some impact factors for power system operation are studied in a robustness examination, such as topology change, variation of peak/minimum load, and variation of generator/load power distribution.

1. Introduction

Static voltage stability is a crucial issue for the secure operation of power systems, since major power outage incidents around the world have been associated with it [1,2,3]. This issue not only causes huge economic losses but also has an unpredictable impact on the lives of people and on industrial production. For these reasons, an accurate and rapid assessment tool to assess whether a current operation point is prone to voltage collapse is essential for power system operators.
Static voltage stability analysis aims to find the distance from the current operation point to the voltage collapse point when the generation and load are increased slowly [4,5]. The conventional technique of researching the static voltage stability margin (VSM) is the model-based method that solves the power flow iteratively from a basic operation point to the voltage stability limit. For this technique, there are different kinds of methods for VSM assessment, such as continuation power flow (CPF) [6,7], singular value decomposition [8], and sensitivity analysis [9]. However, these model-based methods may not be suitable for online applications in practice because of the difficulties of accommodating complex operation conditions and the massive time consumption.
With the development of wide area measurement systems (WAMS) and the widespread adoption of phasor measurement units (PMUs) in power systems, determining how to make full use of rapidly accumulated PMU data has become an important topic [10,11,12]. Compared with the asynchronism and slowness of supervisory control and data acquisition (SCADA), the application of synchronized data from PMUs can facilitate decision-making and system operation. To efficiently utilize PMU data, the application of data-driven and data-based methods in online voltage stability assessment (VSA) has attracted widespread attention in recent years. In the literature, support vector machines (SVMs) [13], decision trees (DTs) [14], artificial neural networks (ANNs) [15], and extreme learning machines (ELMs) [16] have been employed for online static VSA. By extracting and formulating a mapping relation between the operation data and VSM based on the training process, the data-driven tools can provide assessment results when real-time PMU data are received. However, the above data-driven methods still have some shortcomings in online applications for large-scale power systems, including the complexity of decision-making rules, the difficulty of processing large-scale samples, and the inconvenience of dealing with missing data.
In this paper, to make VSA more efficient for the practical operation of power systems, a data-driven and data-based framework is proposed that can achieve online VSA with low computational complexity, rapid processing speed, and considerable prediction performance in modern power systems. In the proposed framework, feature preprocessing, feature selection, and regression prediction are applied. First, a feature preprocessing approach is used to remove redundant and irrelevant features from the collected PMU data to improve computational efficiency. Second, partial mutual information (PMI) [17] is used in the feature selection procedure to screen out the key variables, which can conveniently explore connotative correlations. Finally, the key variables are sent to the VSA model based on iterated random forest (IRF) [18] to complete the VSM prediction. The desirable performance of the framework is demonstrated by tests on the IEEE 30-bus system and a practical 1648-bus system.
Compared with previous studies, the contributions of this paper can be summarized as follows:
(1)
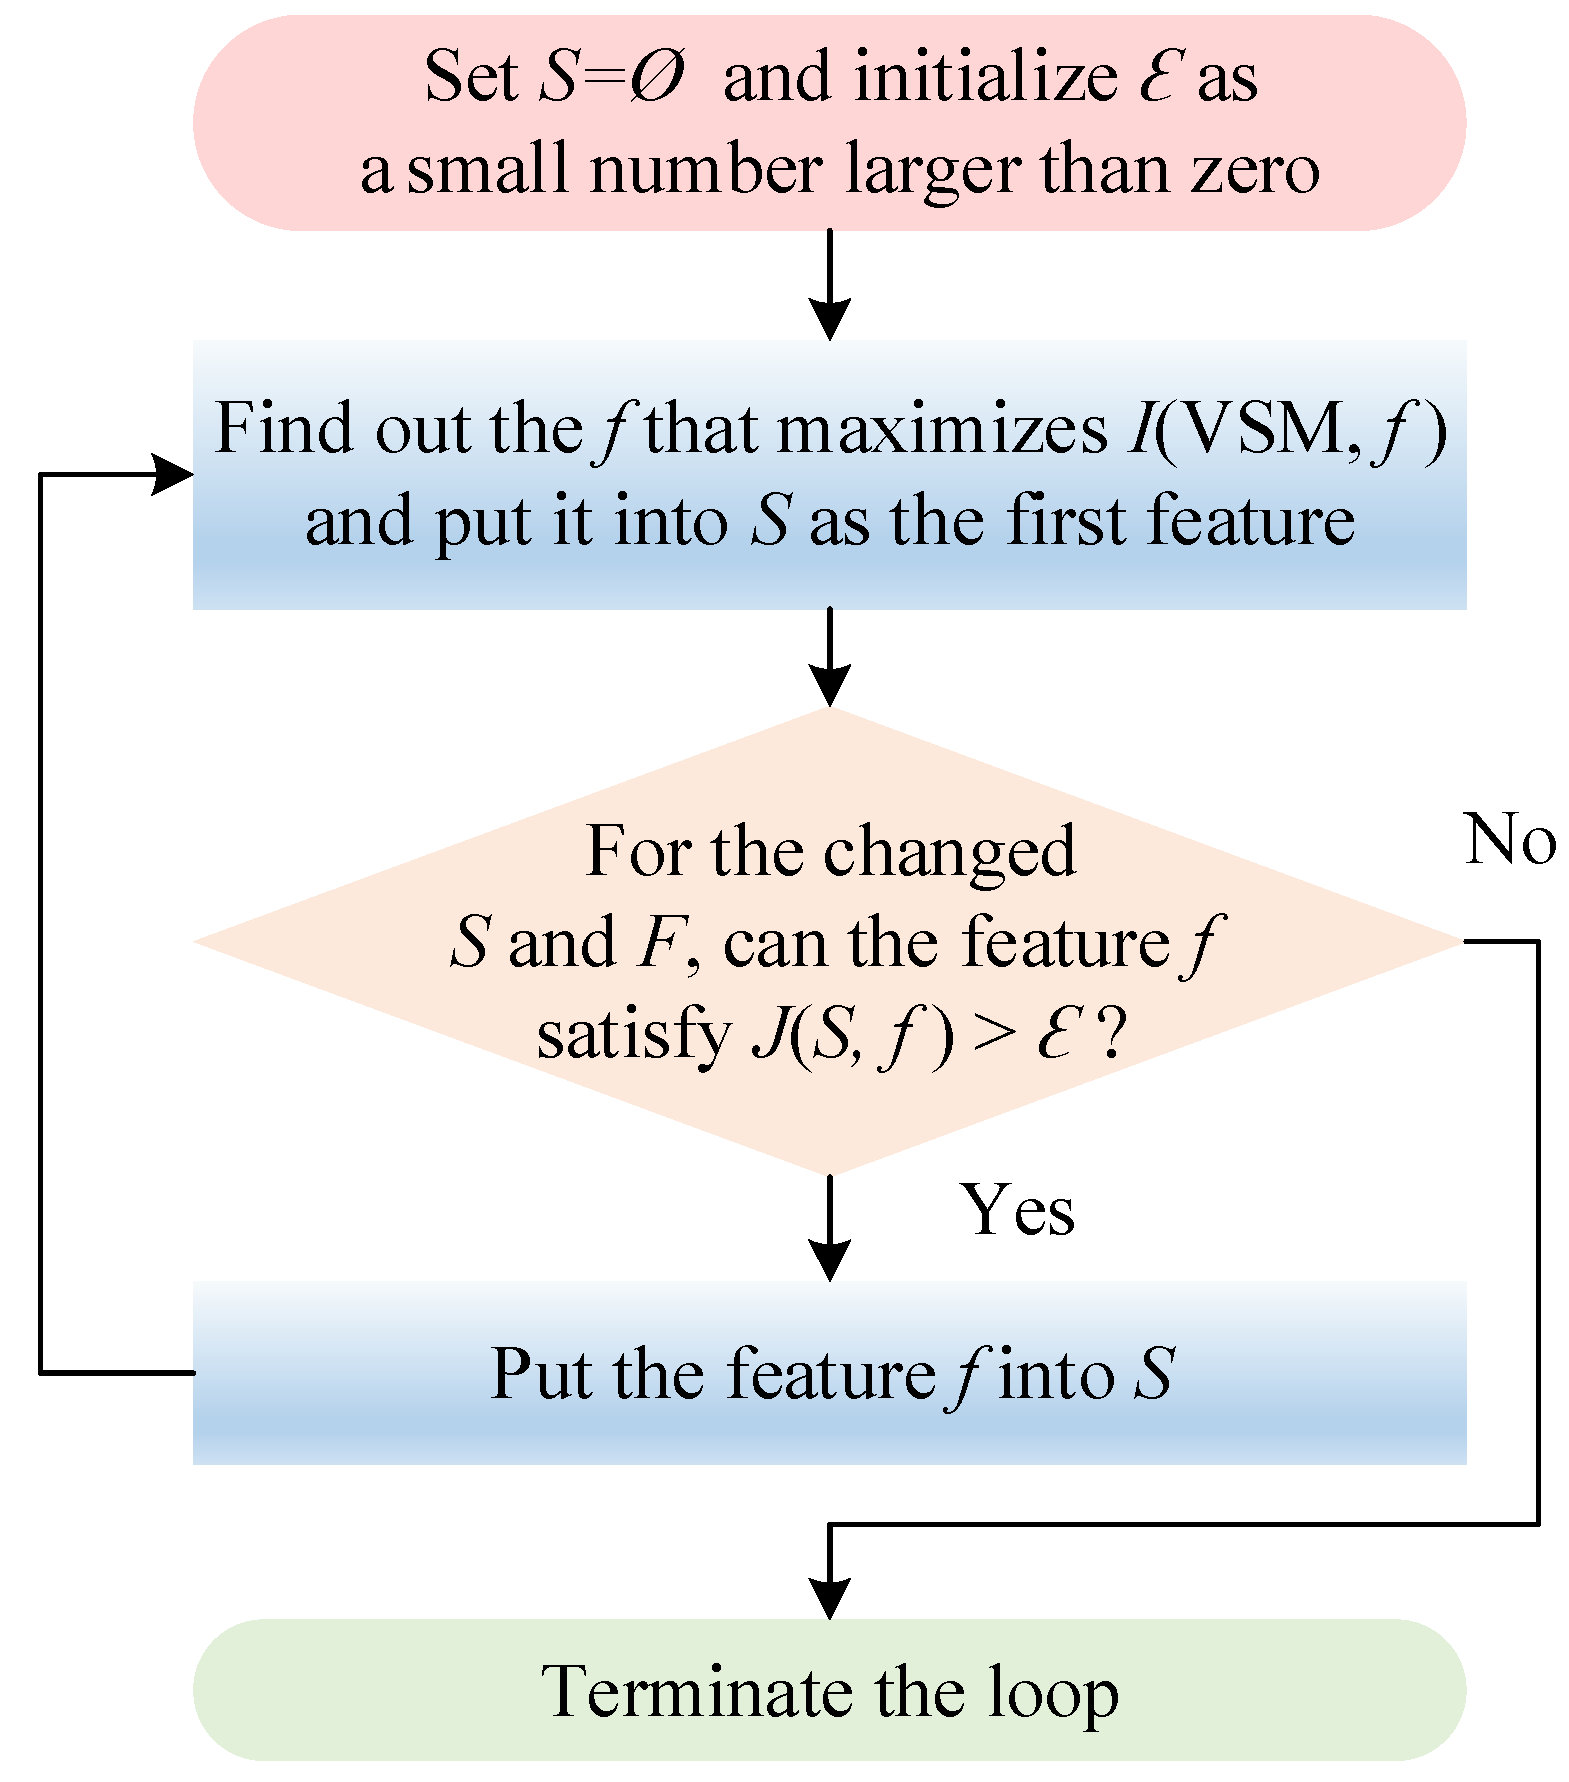
In this paper, a feature preprocessing approach and a feature selection procedure are designed. The approach can remove redundant and irrelevant features from the collected PMU data and aims to improve computational efficiency. The procedure can significantly reduce the dimension of the sample set in preparation for the subsequent prediction. Specifically, PMI is applied in the feature selection procedure to select key variables by detecting connotative correlations, which can overcome the problems of underestimation and overestimation in conventional feature selection methods.
(2)
In view of large-scale operation data, the partially missing PMU data, and the real-time requirement of VSA in power systems, a VSA model based on IRF is presented. IRF has the following advantages: accommodating large-scale data sets, dealing with partially missing data, and reducing the computational burden. In addition, a model update mechanism is designed for VSA models, which can adapt to unforeseen changes of practical power system conditions.
(3)
Some impact factors in the practical operation of systems are taken into consideration in this paper, including topology change, variation of peak/minimum load, and variation of generator/load power distribution. A desirable assessment performance and the robustness of the VSA model are verified.
The rest of this paper is organized as follows: Section 2 contains the problem statement and introduction of supporting methods. Section 3 introduces the proposed framework for online VSA in detail. Section 4 presents the performance test of the proposed framework in the IEEE 30-bus system. Section 5 applies the framework to a practical 1648-bus system. Section 6 concludes the paper.

2. Problem Statement and Methodology Description
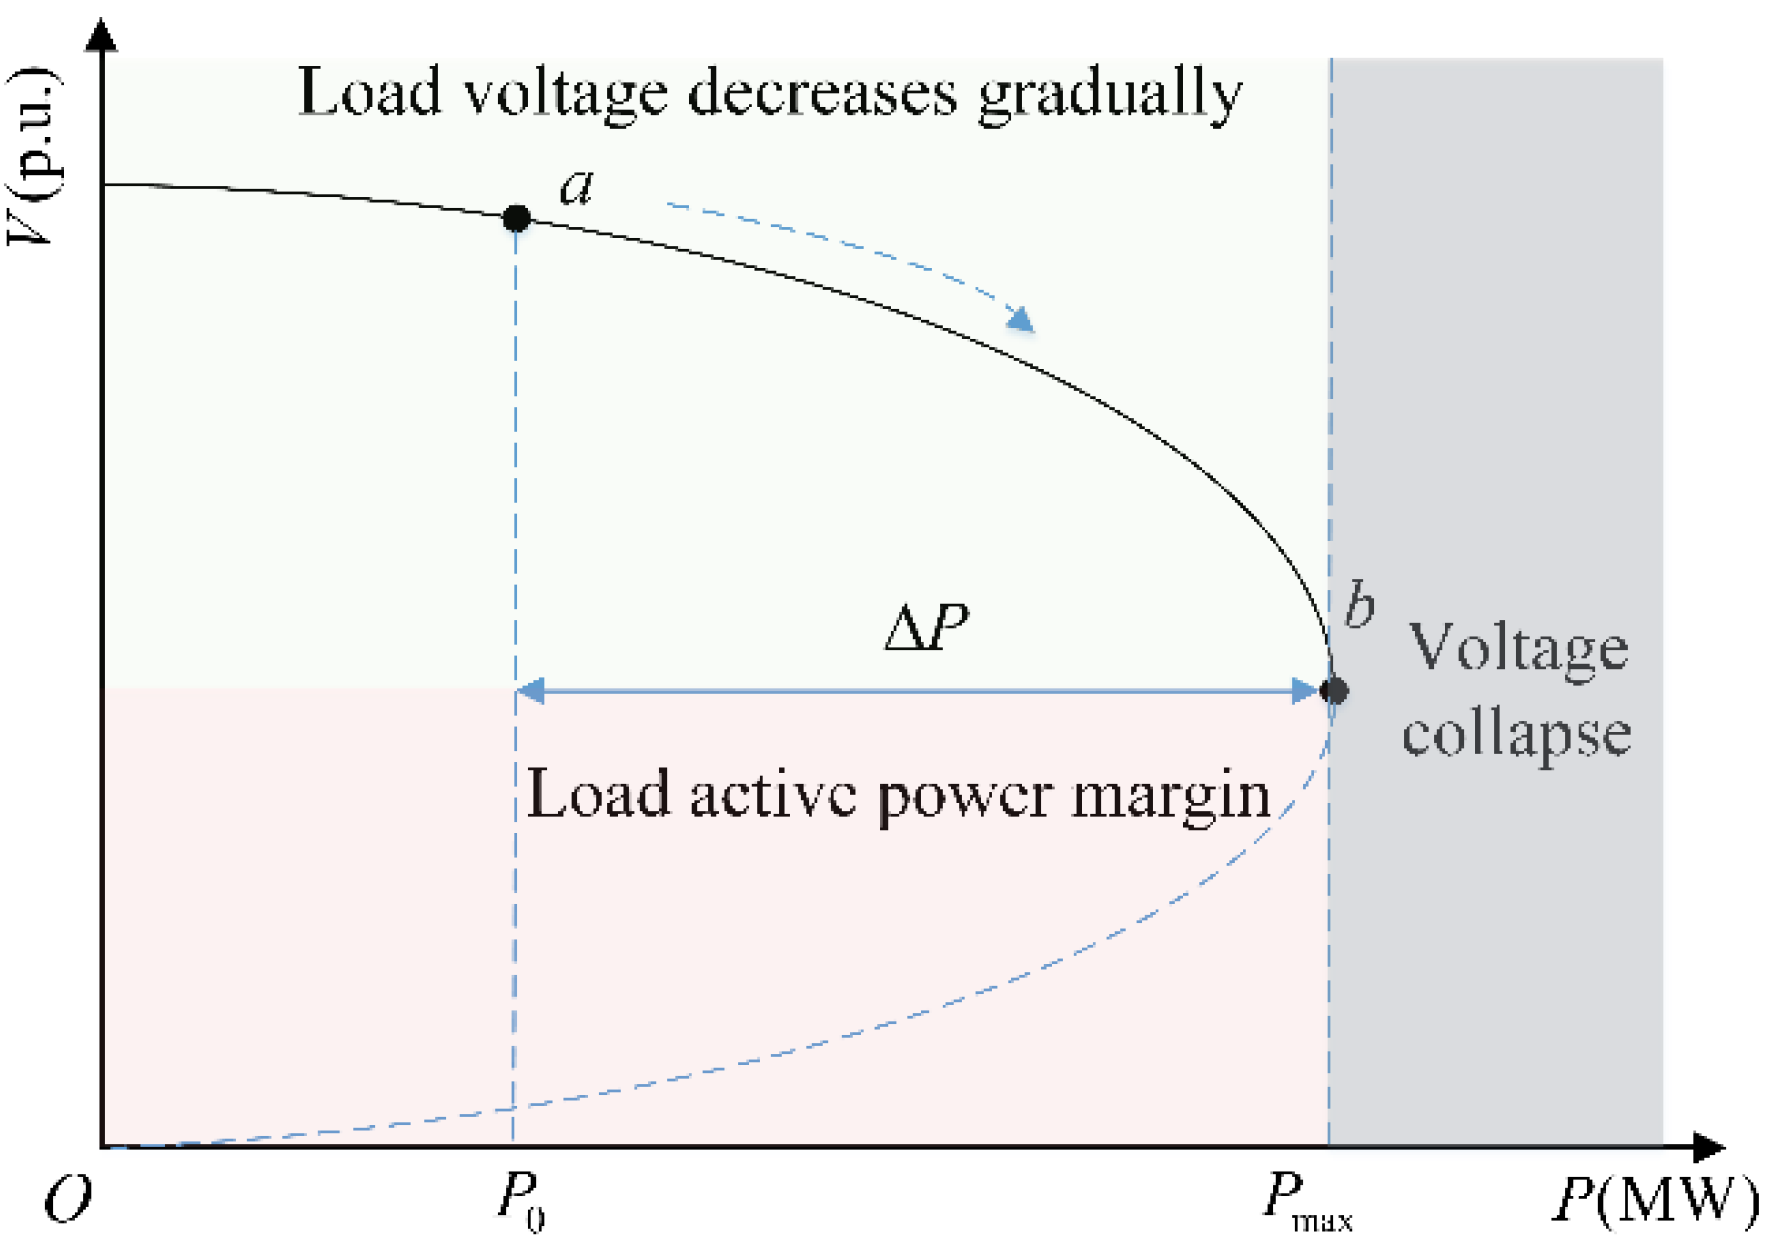
2.1. VSM

In this paper, the CPF method is used to draw the P-V curve of the system. The P-V curve is commonly used to describe the correlation between the voltage of the load bus and the active power delivered to the load [19], as shown in Figure 1. Point a represents the initial operation point, which indicates that the system is operating in a state of light load. With an increase in the load level, the operation point gradually approaches point b.
In practice, the operation point of a power system is located on curve ab, and the load voltage decreases with a continuous increase in the active power of the load. When the load continues to increase, the operation point will finally reach point b, where the system is in a critical state of static stability. If the load is increased at this point, the voltage will collapse and cause system instability [20]. The load active power margin and the relative VSM are defined as Equations (1) and (2), respectively.
Δ P = P max P 0
VSM = Δ P P max × 100 %
The idea of CPF is utilized to determine the collapse point and complete the VSM calculation. n different operation points are generated from the system, and the maximum deliverable power for each operation point is determined. The load active power margin directly reflects the capacity of the current system to maintain voltage stability, and it is helpful for operators to acquire the degree of security of the system intuitively and correctly.

2.2. PMI

The detection of associations between variables is an important challenge in large data sets. PMI is a method to measure the degree of association dependence between variables based on information theory, which can accurately quantify the connotative associations between measured variables. PMI is used to infer direct dependencies in the field of biology, which has exhibited superior performance compared with some conventional methods. In practical tests, conventional methods usually have problems of underestimation and overestimation [21,22]. PMI can not only overcome the above problems but also retain quantitative characteristics [17]. In this paper, PMI is introduced into the field of power systems for feature selection to address the curse of dimension for system operation variables. By utilizing PMI to explore the associations between the operation variables and the relative VSM, the associations can be measured with the given scores. Therefore, a variable weakly related to the VSM will be given a low score and removed by the feature selection based on PMI, and the dimension of the data set can be reduced. The considered features are the system steady-state operation variables, such as branch active/reactive power flow, bus voltage amplitude and phase angle, load active/reactive power, and generator active/reactive power output.
For random variables x, y, and z, x and y are one-dimensional variables and z is an n-2 dimensional vector (n > 2 is a positive integer), where n is the dimension of vector (x, y, z) [17]. p ( x , y | z ) is the joint probability distribution of x and y with the condition z, which is defined as Equation (3):
p ( x , y | z ) = p ( x | z ) p ( y | z )
where p ( x | z ) and p ( y | z ) are defined as Equations (4) and (5), respectively [23]:
p ( x | z ) = y p ( x | z , y ) p ( y )
p ( y | z ) = x p ( y | z , x ) p ( x )
where p(x) and p(y) are the marginal distributions of x and y, respectively. p ( x | z , y ) is the joint probability distribution of x with the condition z and y. p ( y | z , x ) is the joint probability distribution of y with the condition z and x.
p ( x | z ) is the average value of p ( x | z , y ) over y, and p ( y | z ) is the average value of p ( y | z , x ) over x. The property for p ( x | z ) and p ( y | z ) is p ( x | z ) = p ( x | z ) and p ( y | z ) = p ( y | z ) if x and y are independent with the condition z. p ( x | z ) is the condition probability distribution of x with the condition z, and p ( y | z ) is the condition probability distribution of y with the condition z.
Then the PMI value between variables x and y the condition z is defined as Equation (6):
P PMI = x , y , z p log p p ( x | z ) p ( y | z ) p ( z )
where p is the joint probability distribution of x, y, and z. p(z) is the marginal distribution of z.
The value of PMI falls between 0 and 1. Some characteristics of PMI are as follows.
(1)
A larger value of P PMI means that a stronger association exists between x and y.
(2)
P PMI = 0 means that there is a statistically independent association between x and y.
(3)
A value of P PMI that is close to 1 means that there is a close association between x and y.
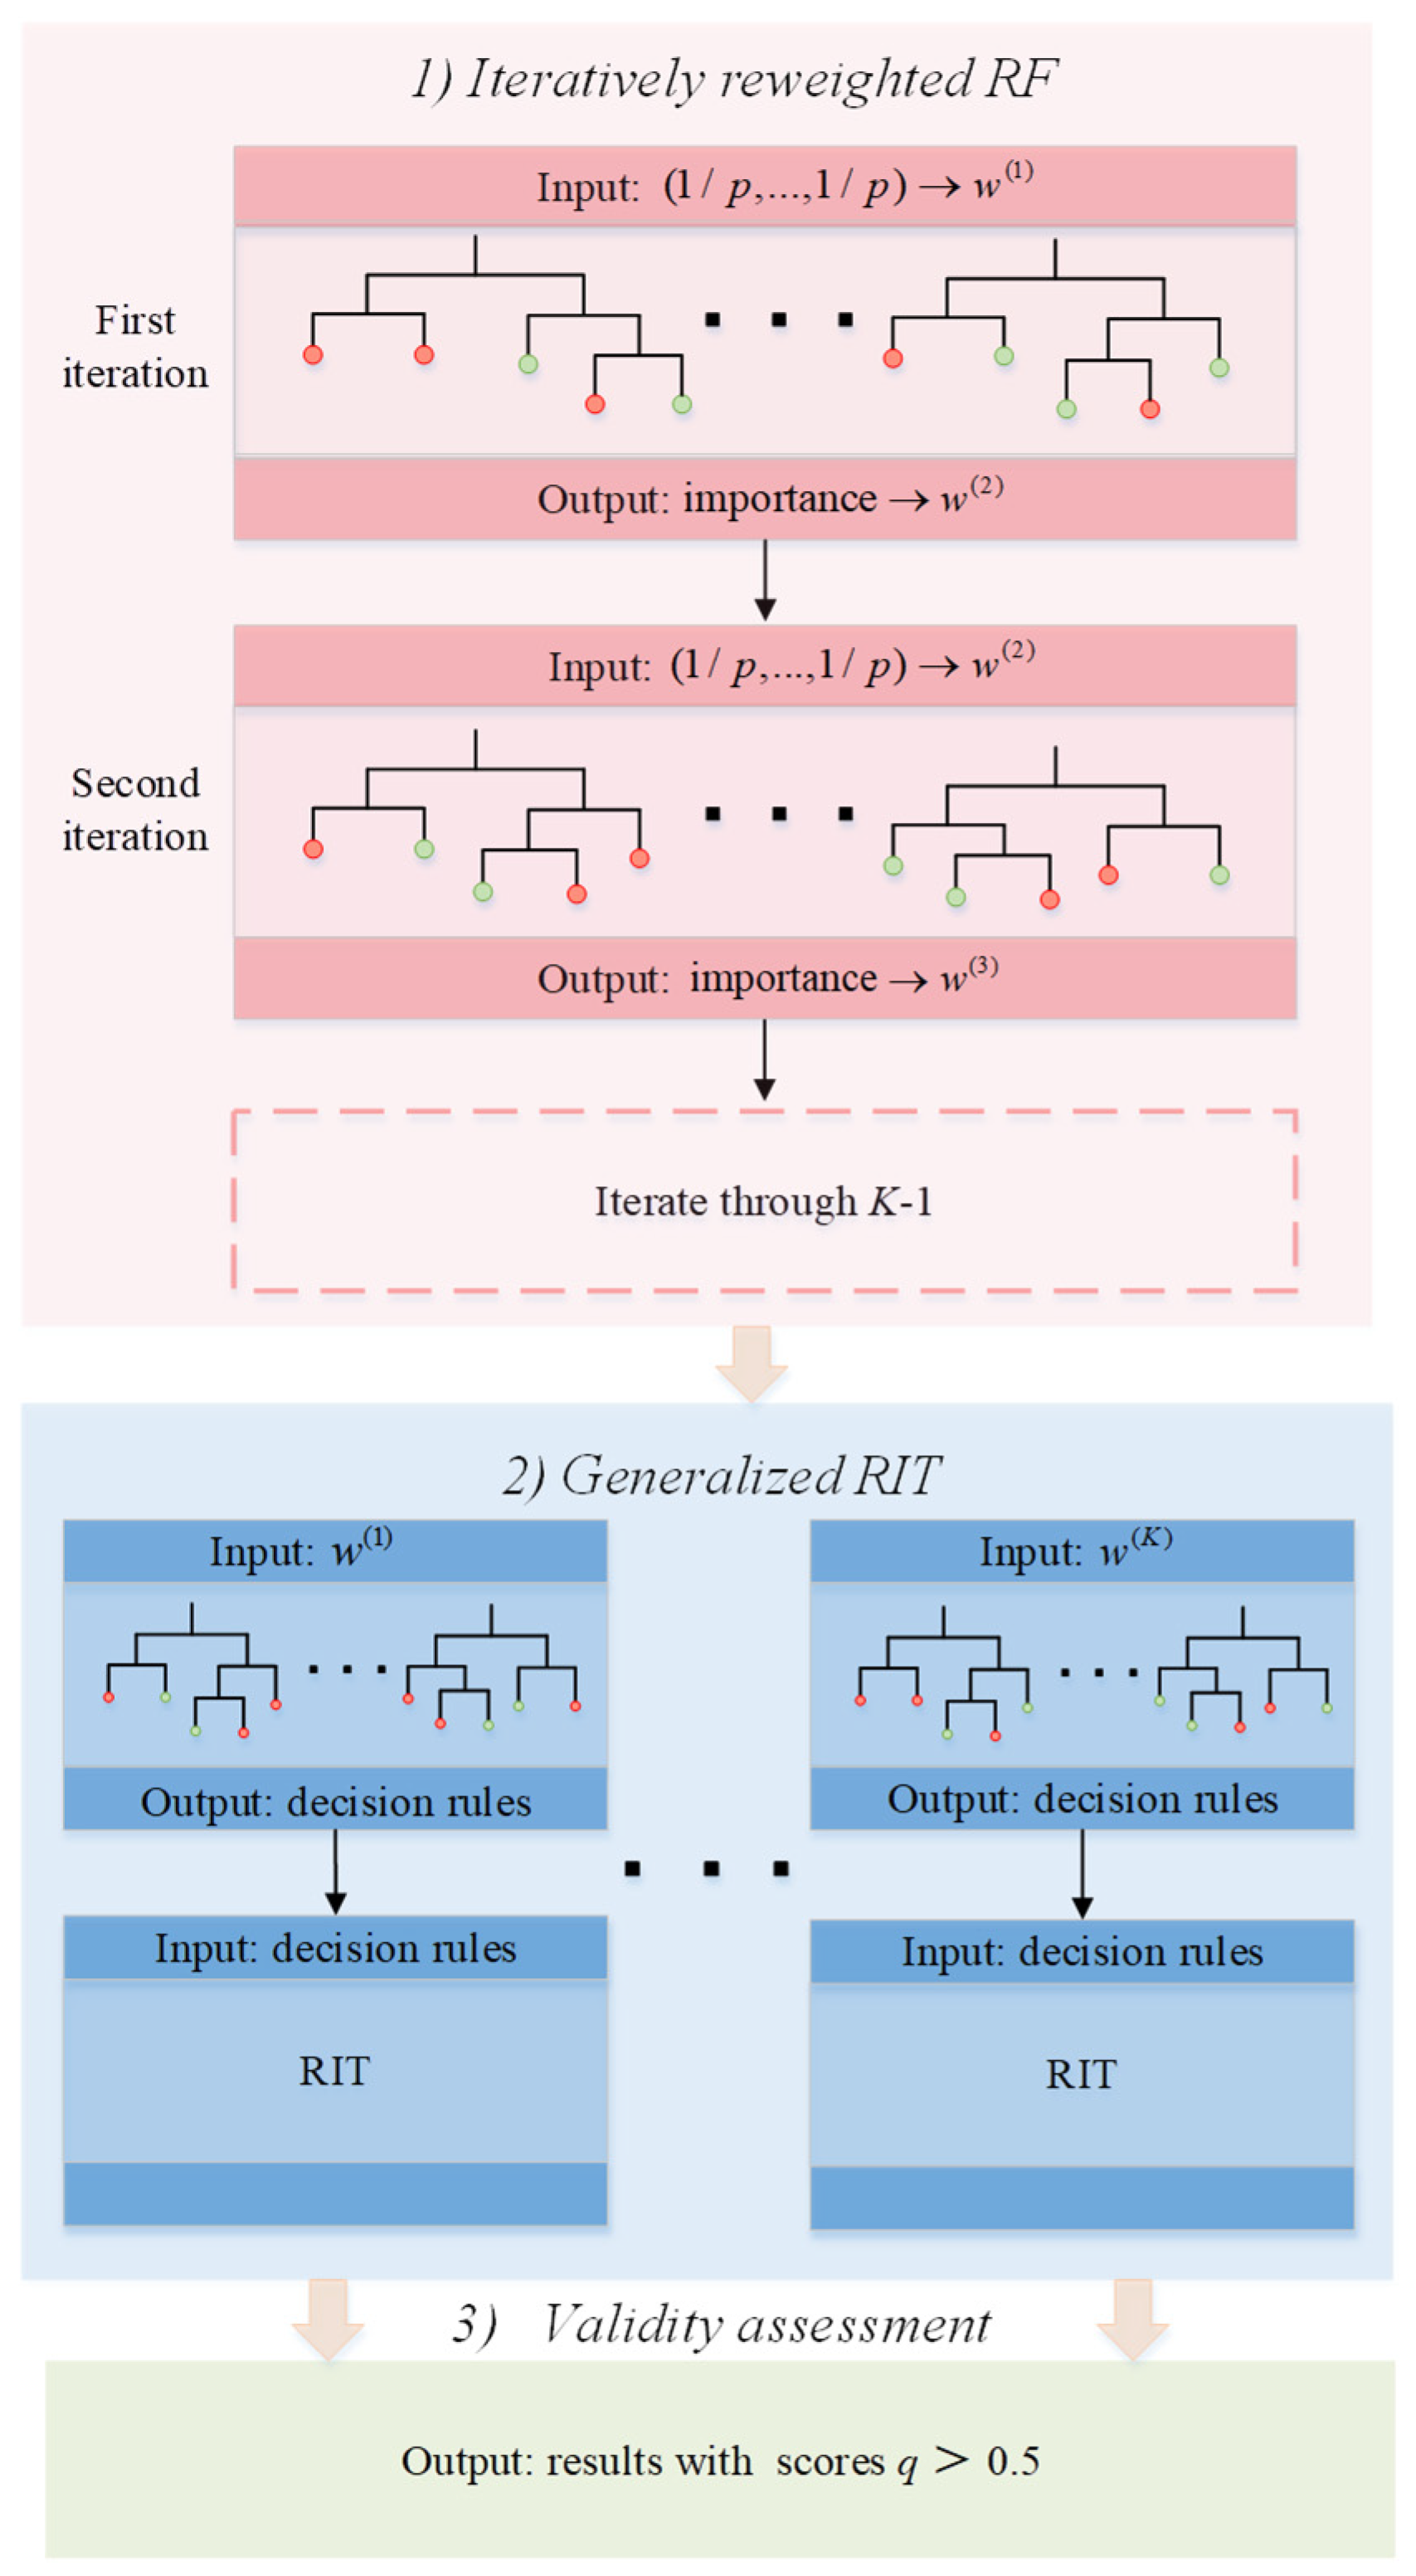
2.3. IRF

IRF is an ensemble learning technique for classification and prediction. Based on the classic random forest (RF) algorithm, IRF trains a feature-weighted ensemble of decision trees to handle prediction problems with the same order of computational cost as RF [18]. Compared with some conventional prediction tools, IRF has a relatively high predictive accuracy with a low computational cost. In this paper, IRF is introduced into the field of power system stability assessment and is applied to VSM prediction.
As shown in Figure 2, the IRF algorithm consists of the following procedures.

2.3.1. Iteratively Reweighted RF

Given a number of iterations K, IRF iteratively grows K feature-weighted RFs based on the data set. The iterative process is represented by R F = ( w ( k ) ) , where w is a non-negative weight, w = ( w 1 , , w p ) , and k = ( 1 , , K ) . The first iteration of IRF (k = 1) starts with w ( 1 ) = ( 1 / p , , 1 / p ) and stores the importance (mean decrease in impurity) of the p features as v ( 1 ) = ( v 1 ( 1 ) , , v p ( 1 ) ) . For iterations k = ( 2 , , K ) , the feature importance from the previous iteration is used as the new weight [24].

2.3.2. Generalized RIT

The generalized random intersection tree (RIT) is applied to the last feature-weighted RF grown in iteration K [25], and this process indicates that decision rules generated in the process of fitting R F = ( w ( k ) ) provide the mapping from continuous features required for the RIT.

2.3.3. Validity Assessment

The validity of the final output should be assessed. The generalized RIT is applied to grade the output results, and a result with a score q greater than 0.5 is retained (the score falls between 0 and 1). In this paper, IRF is used as a regressor to build the VSA model for the efficient VSM prediction.

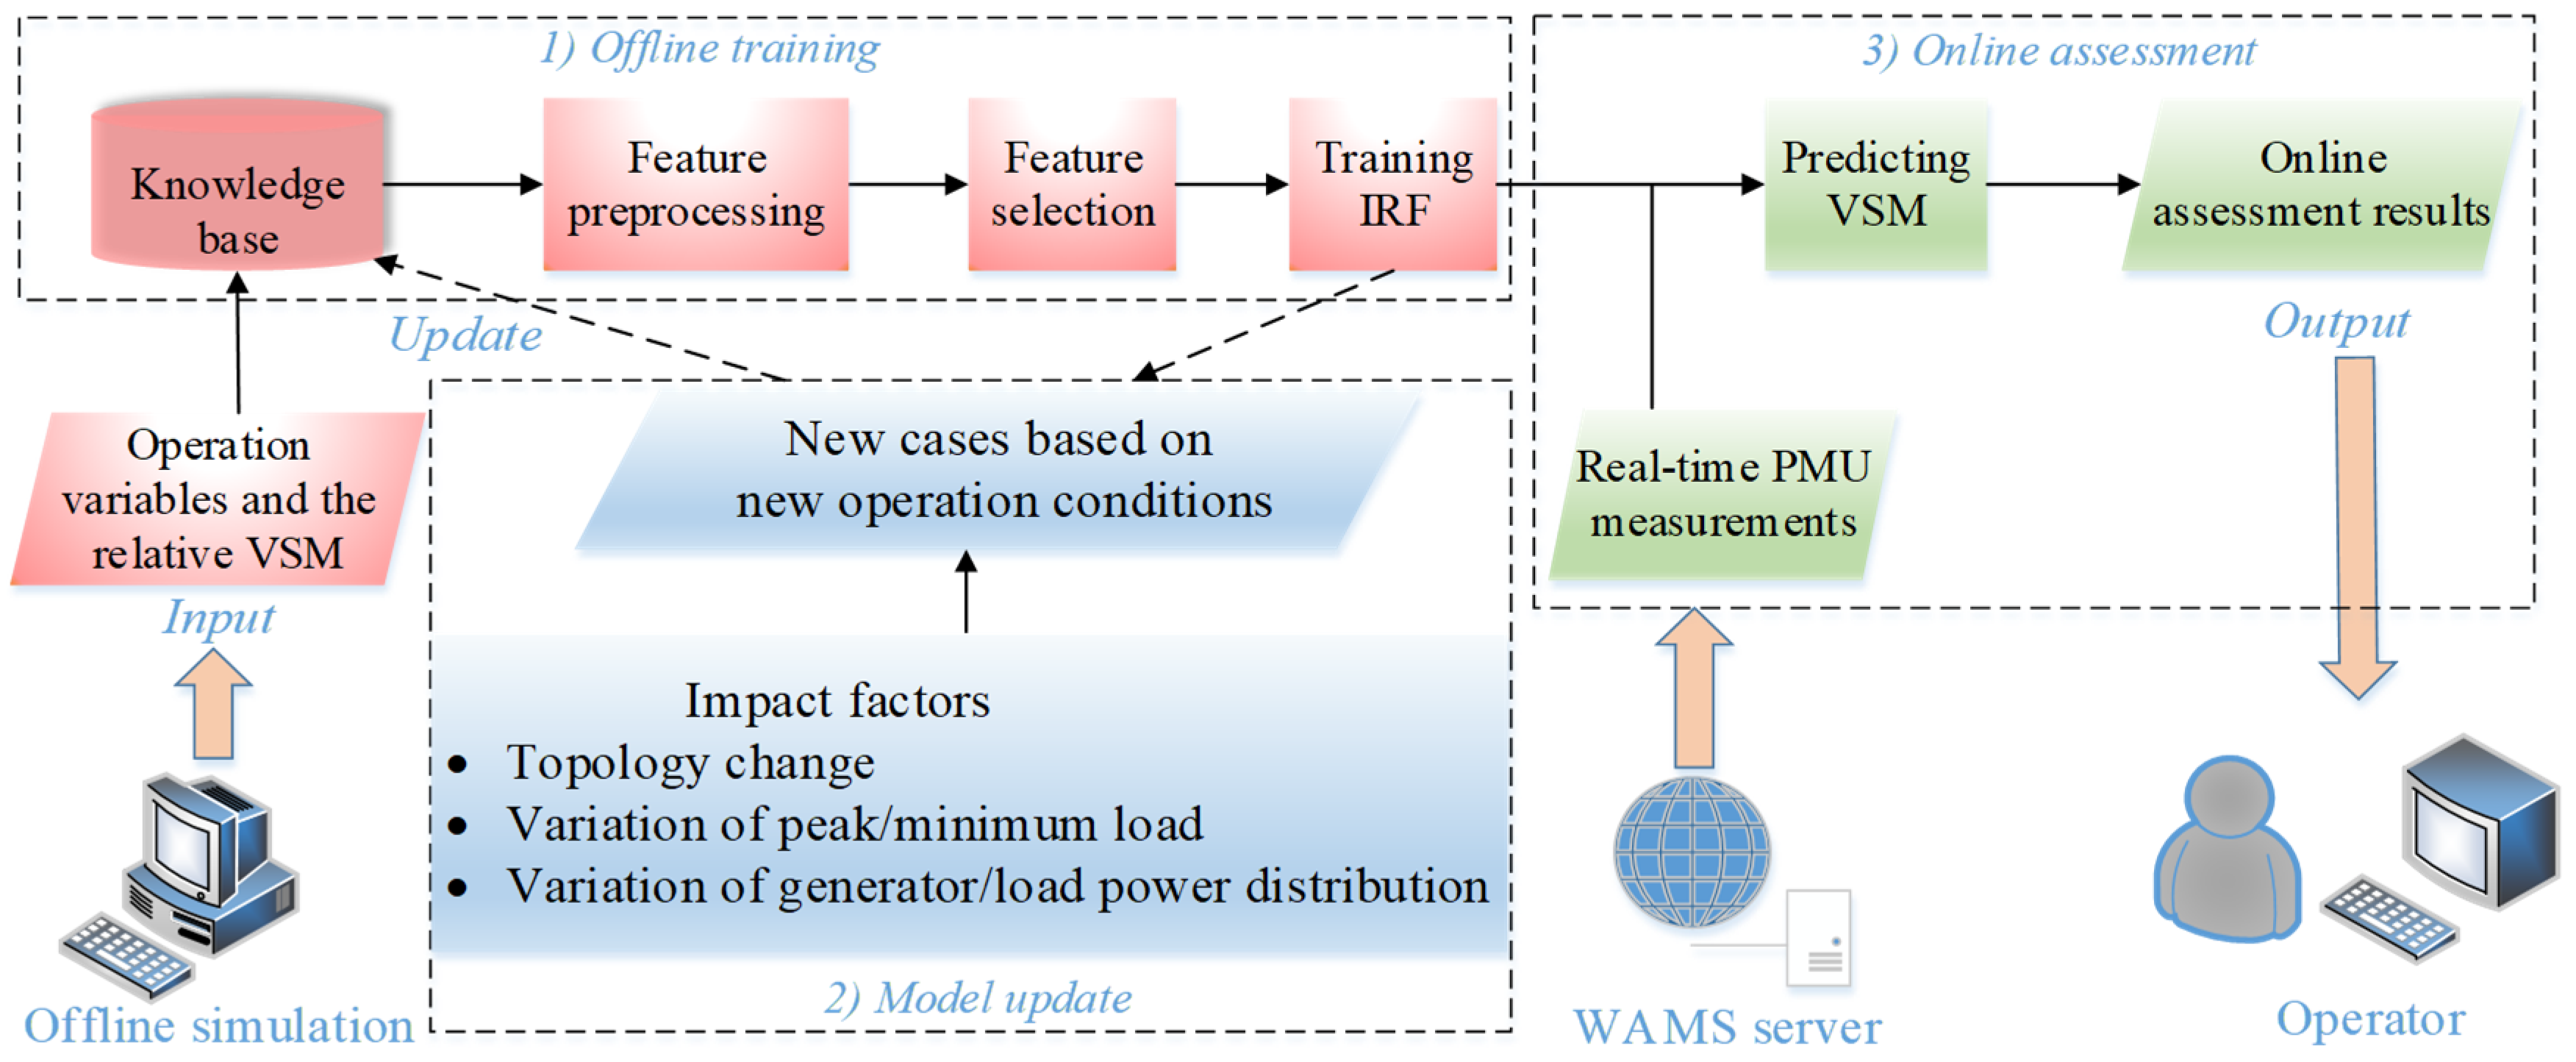
3. Proposed Framework for Online VSM Assessment

In this paper, the proposed framework for online VSM assessment is shown in Figure 3. The framework includes three stages: offline training, model update, and online assessment.
The data of system operation variables are obtained by the collection of PMUs, and a knowledge base including a large number of variables and the relative VSM can be established. Before training the VSA model, the feature preprocessing approach and the feature selection procedure are applied to remove redundant features and reduce the dimension of the knowledge base. In contrast to conventional data collection, PMUs can quickly and precisely measure the voltage phasor at a bus and the current phasor of lines connected to the bus [26]. Therefore, based on the real-time PMU data from WAMS, online VSM assessment can be executed. In practical applications, the offline trained model needs to be updated to effectively deal with the unforeseen operation conditions of the system. Therefore, a model update mechanism is introduced to increase the generalization ability of the VSA model and achieve seamless online assessment.

3.1. Offline Training

3.1.1. Knowledge Base Construction

In the offline training stage, it is important to generate a reliable and abundant knowledge base that is consistent with the practical operation of power systems. The construction of the knowledge base can provide empirical data to build accurate mapping relations between operation data and the VSM.
Based on the historical statistical data of system operations and offline simulations, a knowledge base containing a massive number of operation variables and the relative VSM can be obtained. In general, the historical operation data of power systems can be collected by PMUs and SCADA. Nevertheless, since some potential system operation behaviors may not be recorded, it is insufficient to consider only historical statistical data. To establish a larger operation space and a more abundant knowledge base, linear interpolation between two close historical operation points can be used to capture additional points that are consistent with the practical operation of power systems [27]. Additionally, some reasonable fluctuations can be added to practical operation points, and the considered fluctuations include topology change, variation of peak/minimum load, and variation of generator/load power distribution. In offline simulations, the system operation variables are obtained by solving the power flow on operation points generated by the above methods. Then, the VSM related to each operation point can be acquired based on the CPF concept discussed in Section 2.1. Since the obtained abundant knowledge base covers sufficient and reliable operation scenarios, the generality and adaptability of the VSA model can be ensured.

3.1.2. Feature Preprocessing

Since the scale of the modern power system has become larger and the fluctuation of system operation has become more frequent, the dimensionality of the data set may grow to an unacceptable level. In this paper, a feature preprocessing approach is used to remove the redundant and irrelevant features to overcome this problem. The basic process is executed in the following three steps:
Step 1: Some subsets are generated from the knowledge base through a division strategy.
The division strategy is shown in Figure 4. The original input feature set I N P is divided into K subsets ( I N P 1 , , I N P K ) . The division principle dictates that the correlation R ( I N P i , I N P j ) between features within the same subset should be larger, while the correlation between features of different subsets should be smaller. R ( I N P i , I N P j ) represents the correlation between input features i and j. The correlation calculation is based on Spearman’s correlation coefficient (SCC), which is a measure of studying the correlation between two variables.
The divided subset I N P K is defined as Equation (7):
I N P K = ( i n p 1 , i n p l , i n p n )
where i n p l ( l = 1 , 2 , , n ) denotes the features of system operation, including branch active and reactive power flow, voltage magnitude, phase, etc.
Step 2: The divided subset F is used for a loop flow for the subset processing, as shown in Figure 5. An assessment function is used to assess the subset and provide decisional information for the loop stopping criterion. The loop is terminated when the stopping criterion is satisfied and the final feature subset is obtained. The assessment function is defined as Equation (8):
J ( S , f ) = I ( VSM , f ) α s S I ( s , f )
where f is a feature in subset F obtained from step 1, S is the newly generated subset consisting of selected features from F, I represents the mutual information, and s is a feature selected from F to S, and α is a user-defined parameter for adjusting the number of finally selected features. In accordance with experiments, a value of α between 0.5 and 1 is recommended.
Step 3: After subset processing, the feature subsets are merged into a large data set, which is used in the subsequent feature selection procedure.

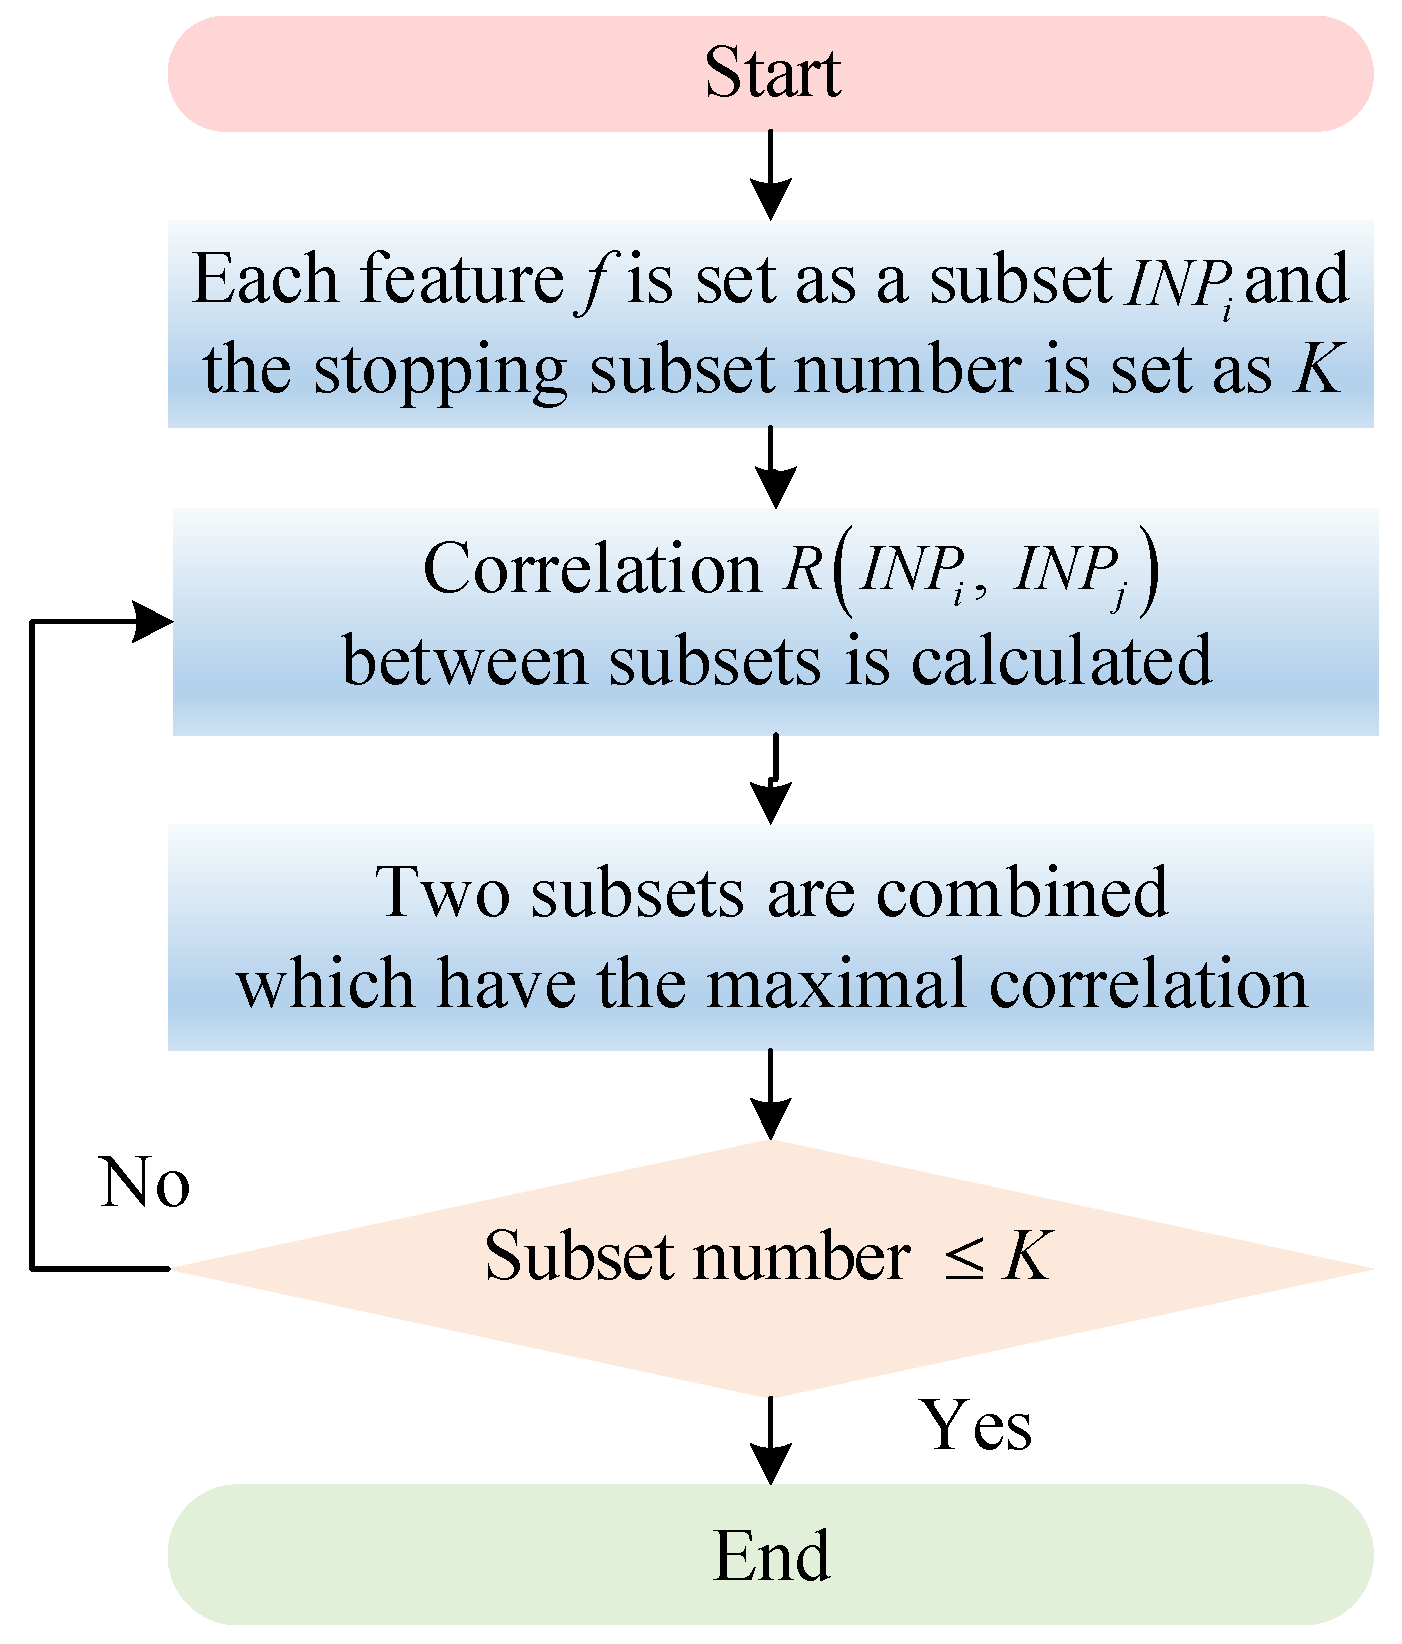
3.1.3. Feature Selection Procedure

In this stage, PMI is applied to perform the feature selection procedure. The purpose of the feature selection from the data set is to select the key features significantly related to the VSM, which can further reduce the dimension of the features.
First, a series of features after feature preprocessing in the knowledge base are used as the input. Second, PMI is used to explore the connotative correlations between operation variables and the relative VSM, which are assigned scores and ranked. Finally, the operation variables with highly ranked correlations are selected as the output for building the sample set, which is an optimal sample set consisting of the key variables. The ultimate sample set is sent to the IRF regressor to execute offline training.

3.2. Model Update

The model update stage cannot be neglected on account of the variable operation environments of power systems. Therefore, some impact factors of power system operation are considered for driving the model update mechanism, which is designed with the following details.
As shown in Figure 3, the impact factors including topology change, variation of peak/minimum load, and variation of generator/load power distribution are considered in this work. For the first factor, the system network topology often changes due to possible operation requirements, such as contingencies, economic dispatch, and scheduled maintenance. For the second factor, the load demand level tends to change over time and it may be different in winter and summer. For the last factor, the variation of generator/load power distribution may be caused by the fluctuation of renewable energy and distributed generation with high penetration. Generally, a list of credible operation conditions is available from utility companies in practice. Hence, a series of models trained for credible operation conditions is prepared and included in the offline knowledge base to achieve a rapid response to operation condition changes.
When operation conditions change due to the above factors in the application of the proposed framework, the corresponding handling method is as follows:
(1)
If the changed operation condition has been recorded in the knowledge base, the corresponding VSA model will be immediately selected out to replace the original one.
(2)
If the match cannot be found, the assessment accuracies of readily available trained models will be checked based on the changed operation condition. (1) If some models can provide acceptable accuracies, the model with the highest accuracy of such candidates will be used to accomplish VSA for the system with the changed operation condition. (2) If the existing models cannot provide acceptable accuracies for the changed operation condition, the construction process of a new VSA model will be activated. Then, the changed operation condition will be recorded, and the corresponding new model will be absorbed in the knowledge base. By continuously executing the model update, fewer unseen operation conditions will be encountered and seamless online VSA can be gradually achieved.

3.3. Online Assessment

As shown in Figure 3, once real-time PMU measurements are received from the WAMS server, the data of selected features will be sent to the VSA model, and the model can provide the synchronous assessment results instantly.

4. Performance Examination

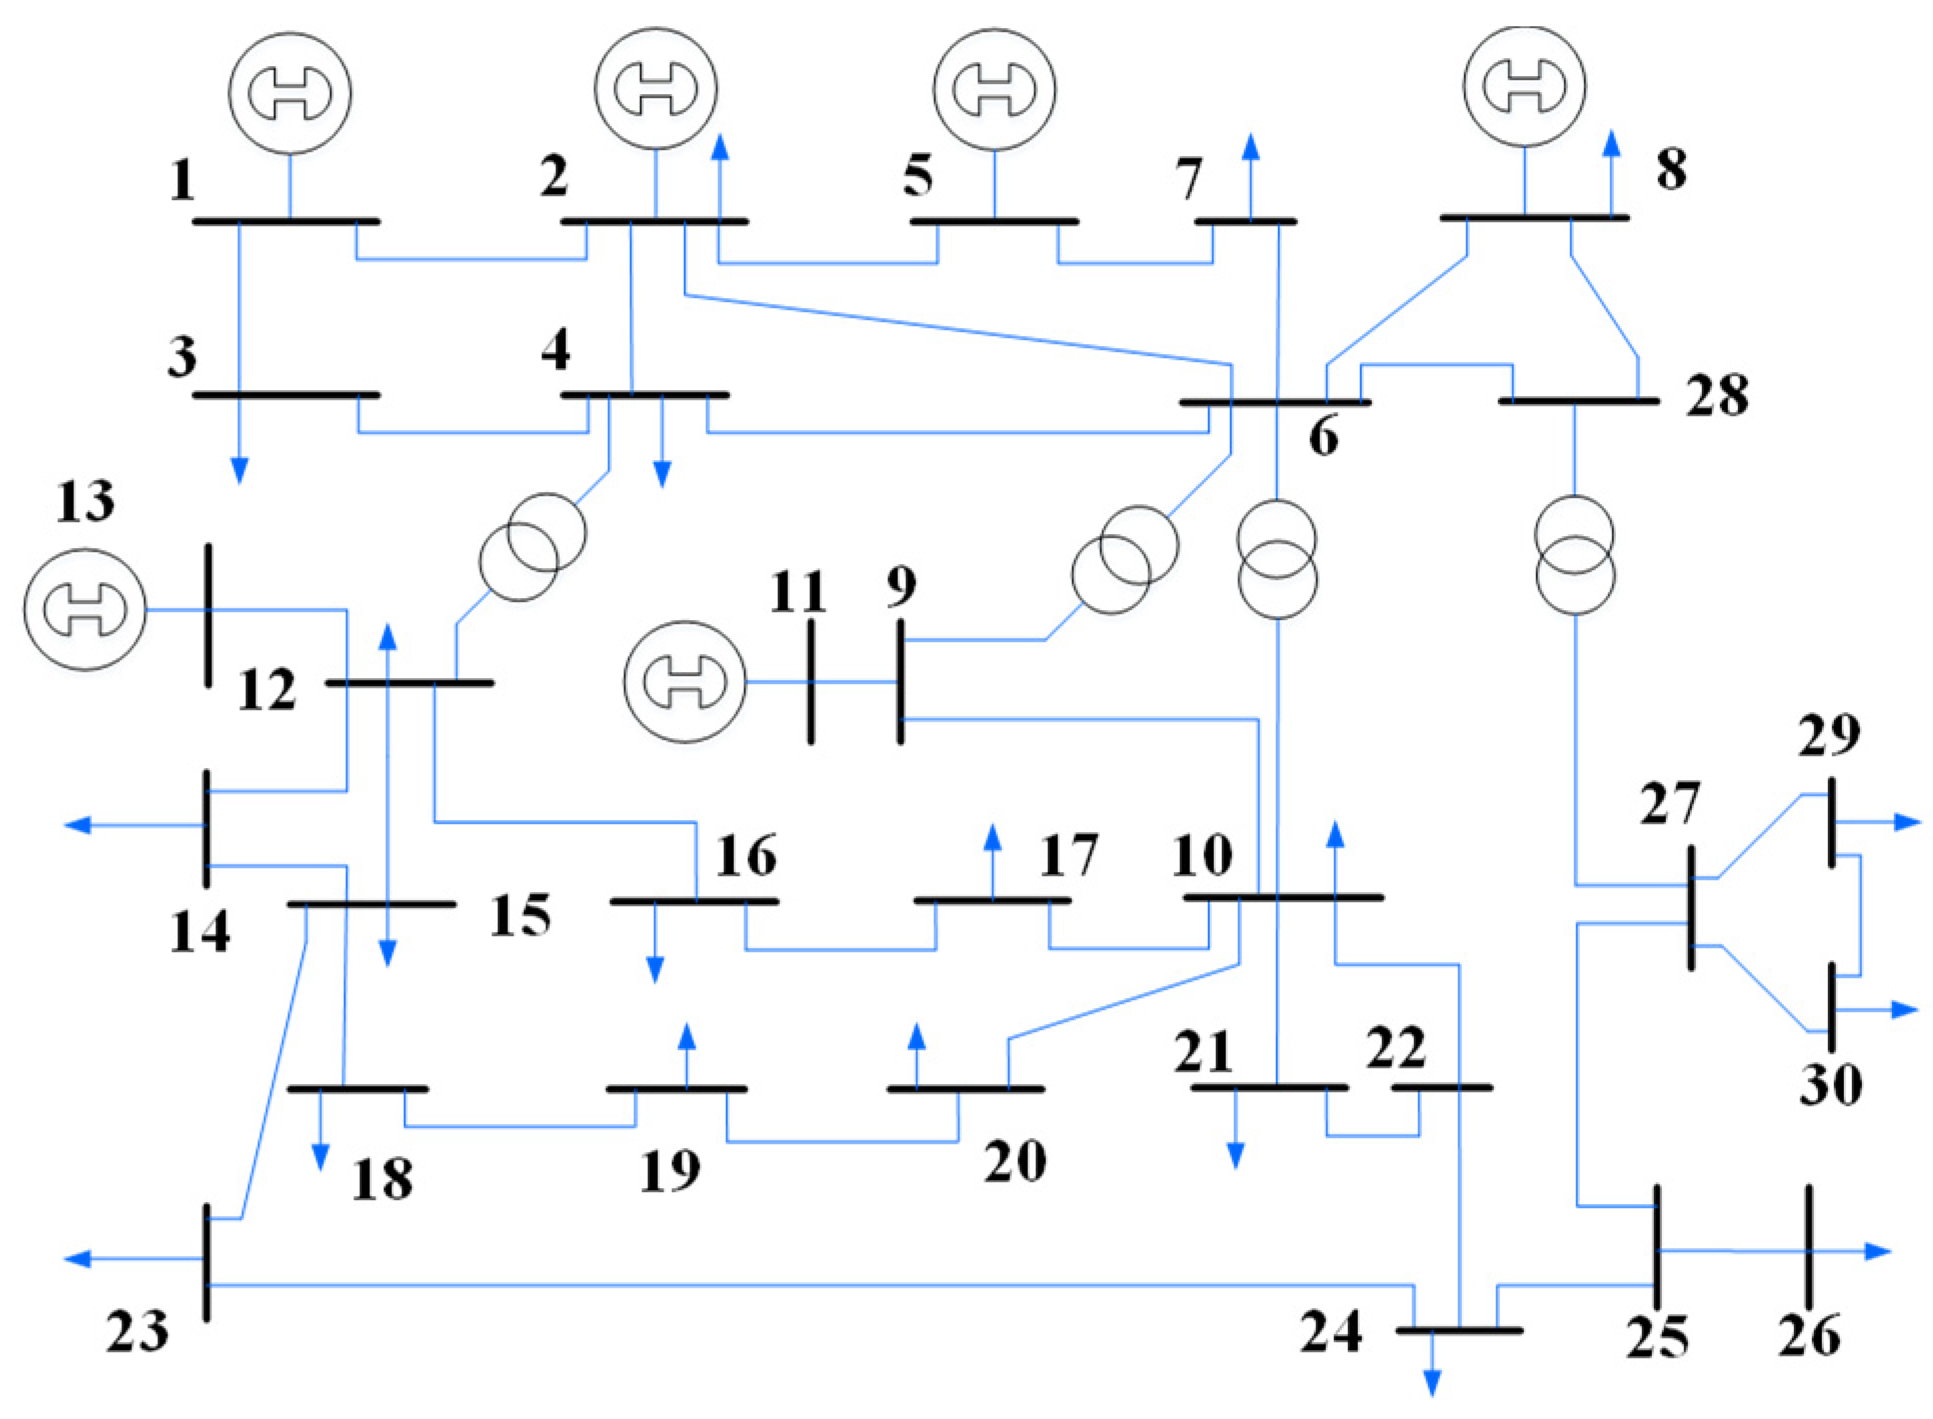
4.1. Test System and Data Generation

The VSA model proposed in this paper was tested on the IEEE 30-bus system, which consists of 30 buses, 6 generators, and 37 transmission lines. The original topology of the system is shown in Figure 6. The tests were conducted on an Intel Core i7 3.40 GHz Central Processing Unit (CPU) with 8 GB of Random Access Memory (RAM). In this study, Power System Simulator/ Engineering (PSS/E) was applied to generate abundant operation points and Python programs were used to automatically control PSS/E simulators.
By considering some impact factors of power system operation, such as topology change, variation of peak/minimum load, and variation of generator/load power distribution, more operation points were generated to enrich the knowledge base. In total, 4759 records were generated for the VSA model. The obtained sample set was split into two independent data sets: 70% of the records were randomly selected for training the model, and the remaining 30% of the records served the purpose of model testing. The training and testing were replicated over 5 times until the mean and standard deviation of the accuracy became stable.

4.2. Feature Selection

By exploring the connotative correlations between variables, the variables with high scores were selected as the key features, which were recorded as the inputs of IRF. Finally, 22 variables and the relative VSM were used to establish the sample sets.
From the computational consumption point of view, the feature selection procedure was able to avoid unnecessary computational burden for the IRF application. In the VSA model, it was desirable to maintain an acceptable prediction performance by using the representative features.

4.3. VSA Test

The performance of the VSA model was tested using the residual squared error ( R 2 ) and root mean squared error (RMSE) as follows:
R 2 = 1 i = 1 n ( Y i Y i ) 2 i = 1 n ( Y i Y ¯ ) 2
RMSE = 1 n i = 1 n ( Y i Y i ) 2
where n is the number of records, Y i is the actual VSM i , Y i * is the prediction value obtained by the VSA model, and Y ¯ is the mean of Y i .
In regression, R 2 is a statistical measure of how well the regression line approximates the real data points. The value of R 2 usually falls between 0 and 1. In general, the closer a value of R 2 is to 1, the better the prediction is. RMSE is another statistical tool for prediction performance, which is adopted to measure the specific difference between the predicted VSM and its corresponding actual value. A smaller RMSE value means a better performance, and the value of RMSE depends on the base magnitude of the specific object to be assessed.
Table 1 shows the accuracy of the VSA model in which the R 2 value is close to 0.99 and the RMSE value is less than 0.02. R 2 > 0.90 is acceptable based on experimental results [28] and was used as a basic requirement of prediction accuracy in this work. Therefore, this result indicates that the VSA model had a desirable ability for VSM prediction.

5. Application to a Larger System

To further verify the performance of the proposed framework in this paper, the VSA model was applied to a practical 1648-bus system provided by PSS/E, which contains 1648 buses, 313 generators, 182 shunts, and 2294 transmission lines. The method of building the knowledge base was the same as that for the IEEE 30-bus system. A total of 34,367 variables were extracted from the operation data of the 1648-bus system, and 16,579 records were generated for the VSA model. The feature preprocessing and feature selection procedures were executed before the IRF training procedure in the tests. The statistical accuracy of the assessment is shown in Table 1.

5.1. Comparison with Different Regression Tools

The VSA model was compared with some conventional VSM prediction tools to verify its advantages in regression prediction. A comparison of the accuracy results of different tools is shown in Table 2, including logistic regression (LR), SVM, regression tree (RT), ANN, and ELM. In the tests, the same number of input features was used for each tool. Table 2 shows that the VSA model based on IRF performed better in VSM prediction than some conventional tools, and the advantages of the VSA model based on IRF are summarized as follows.
(1)
For LR and SVM, it is an arduous task to train a massive number of samples. In particular, the accuracy may not be acceptable when LR is applied to a large-scale feature space [29]. Due to the attribute of IRF for accommodating large-scale data and the feature selection procedure, the VSA model is able to train massive samples efficiently.
(2)
For RT, missing data situations cannot be effectively handled. In addition, overly complex rules may be established when the depth of a tree is large [30]. Compared with RT, IRF has a parallel data processing structure with multiple trees, which can provide sufficient alternative choice of feature sets to overcome data missing.
(3)
For ANN and ELM, the high calculation cost is an obvious problem for the implementation of online VSA. The iterative tuning and slow learning speed may lead to a large consumption of computational resources when ANNs and ELMs are trained for prediction with large-scale data. Because of the rapid calculation of the IRF regressor and screening of the key variables in advance, the computational burden can be significantly reduced.

5.2. Robustness Assessment

In addition to accuracy-based measures, the robustness of the VSA model was also assessed. In this paper, some impact factors of system operation were studied, such as topology change, variation of peak/minimum load, and variation of generator/load power distribution.
(1)
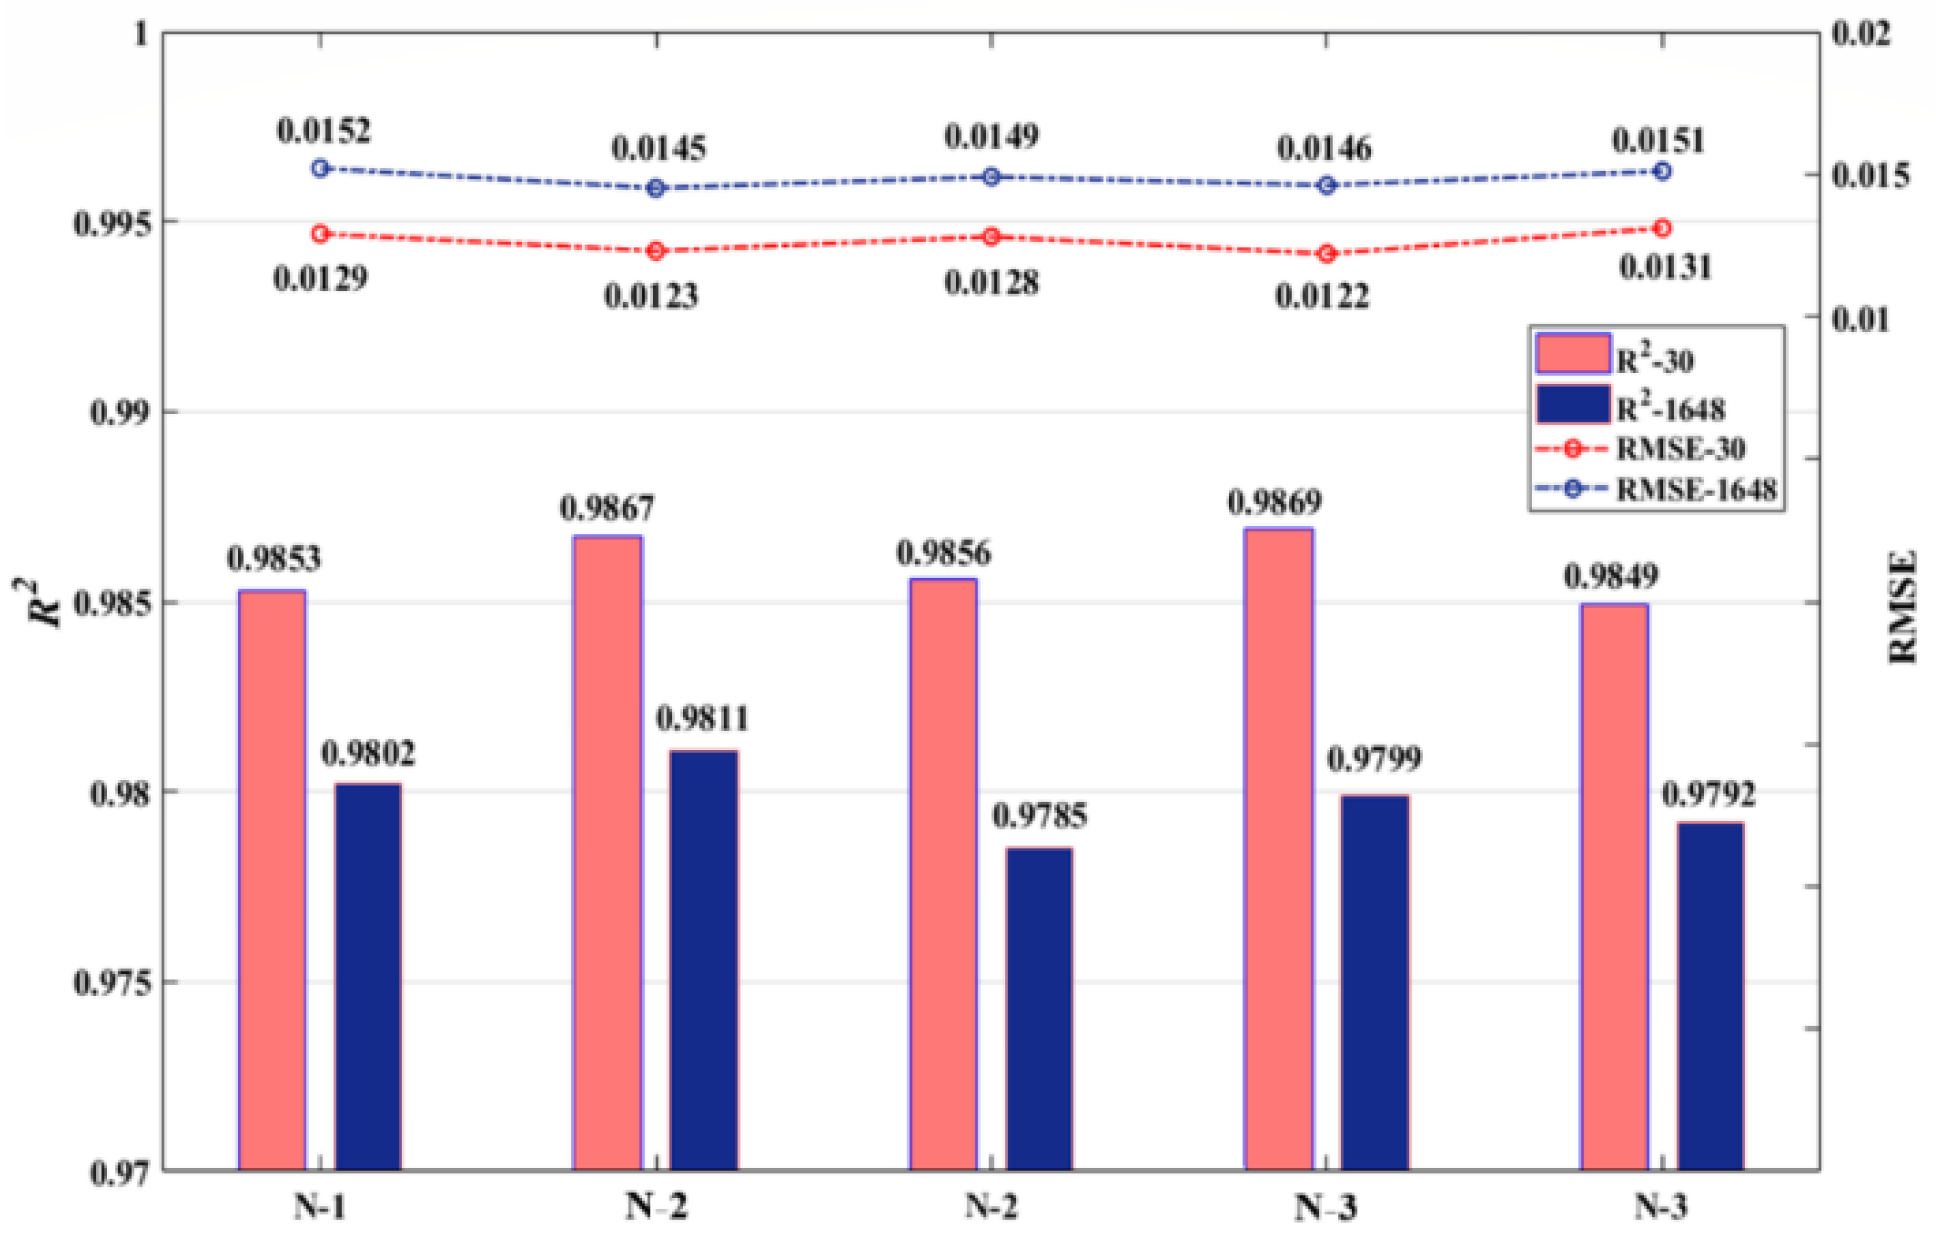
Topology Change: Different network topologies were tested in this study and a part of them is shown in Table 3. The corresponding test results are shown in Figure 7, where R2-30 and RMSE-30 represent the accuracies of the tests for the IEEE 30-bus system. Similarly, R2-1648 and RMSE-1648 represent the accuracies of tests for the 1648-bus system.
(2)
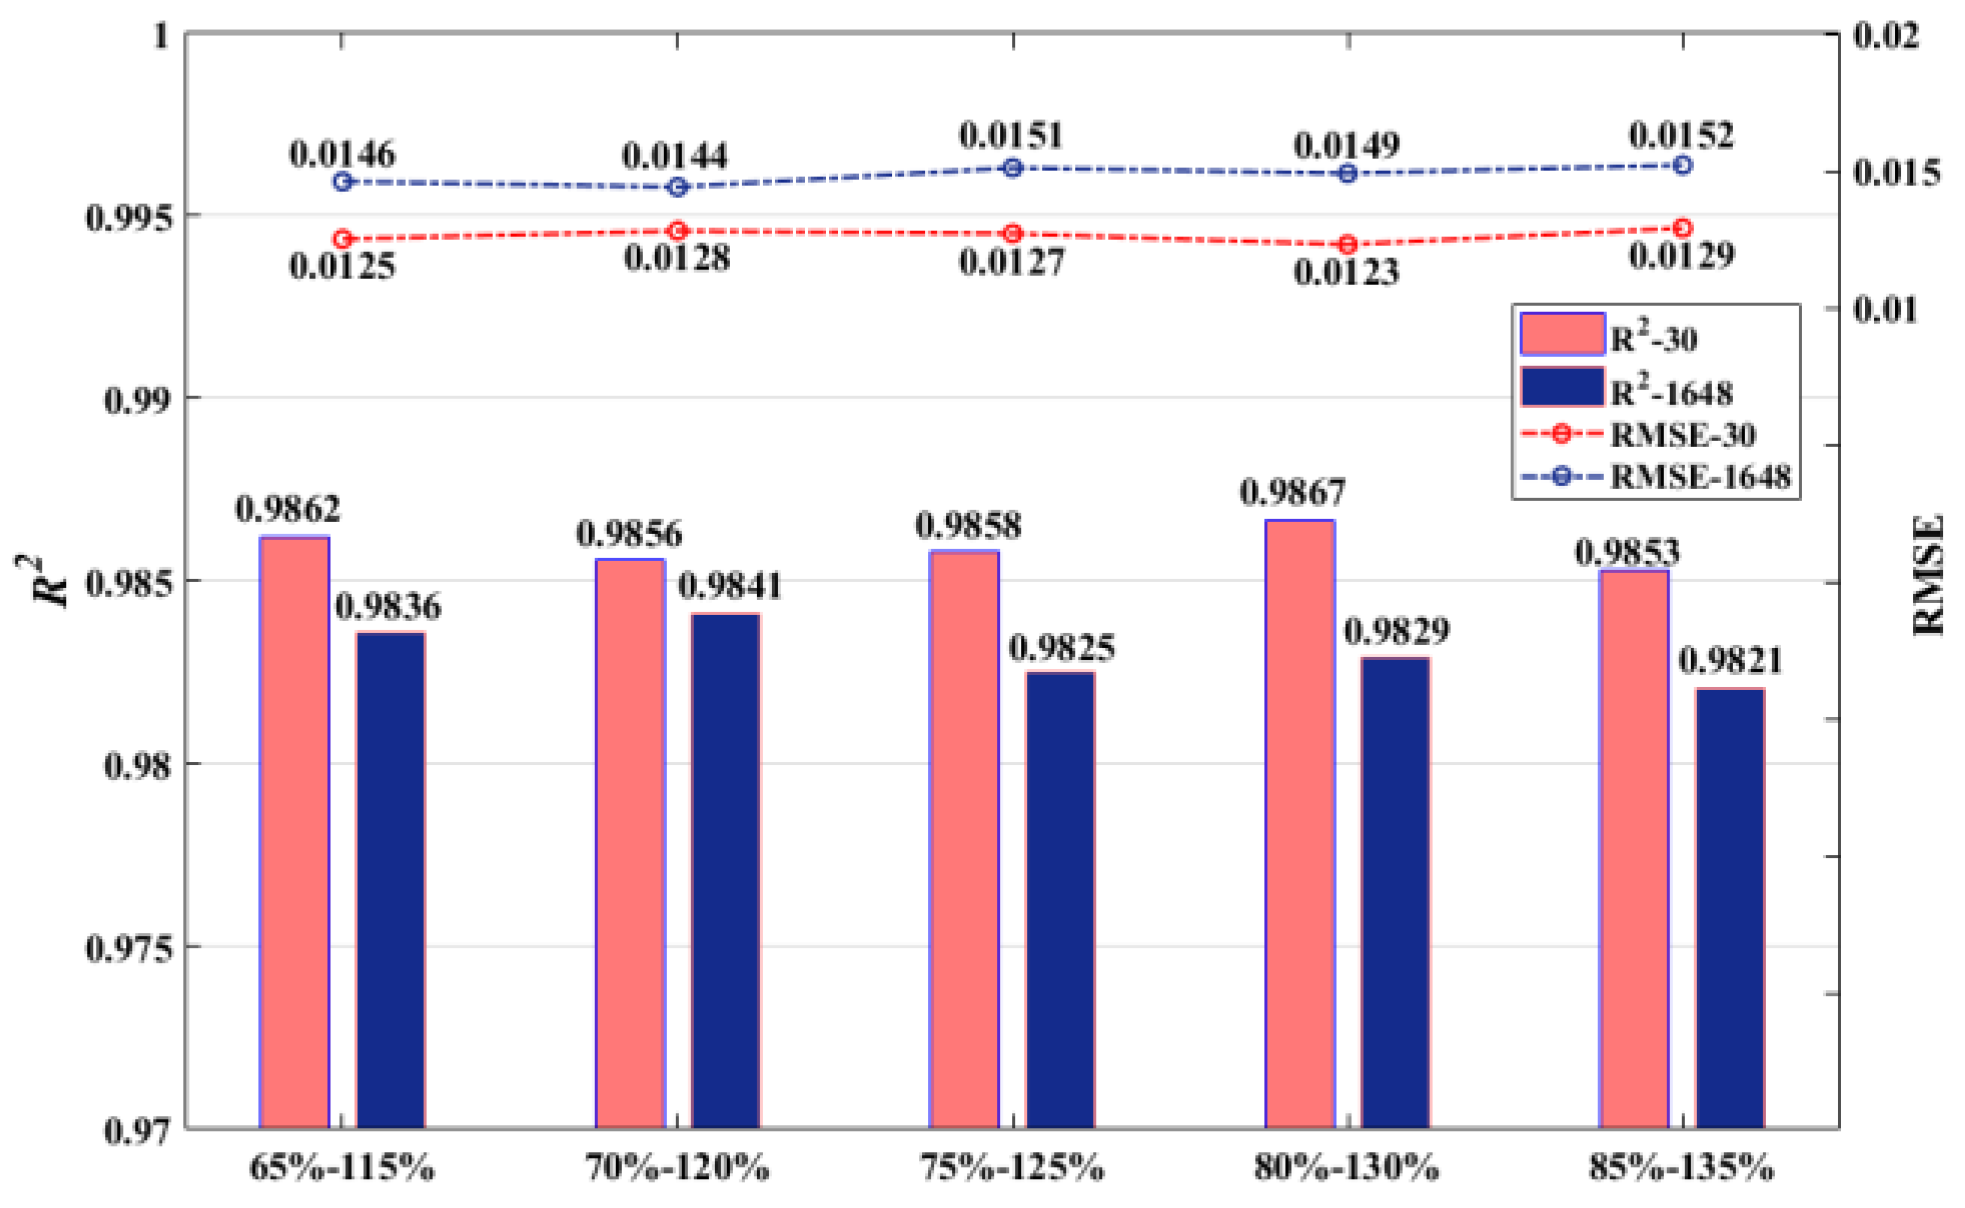
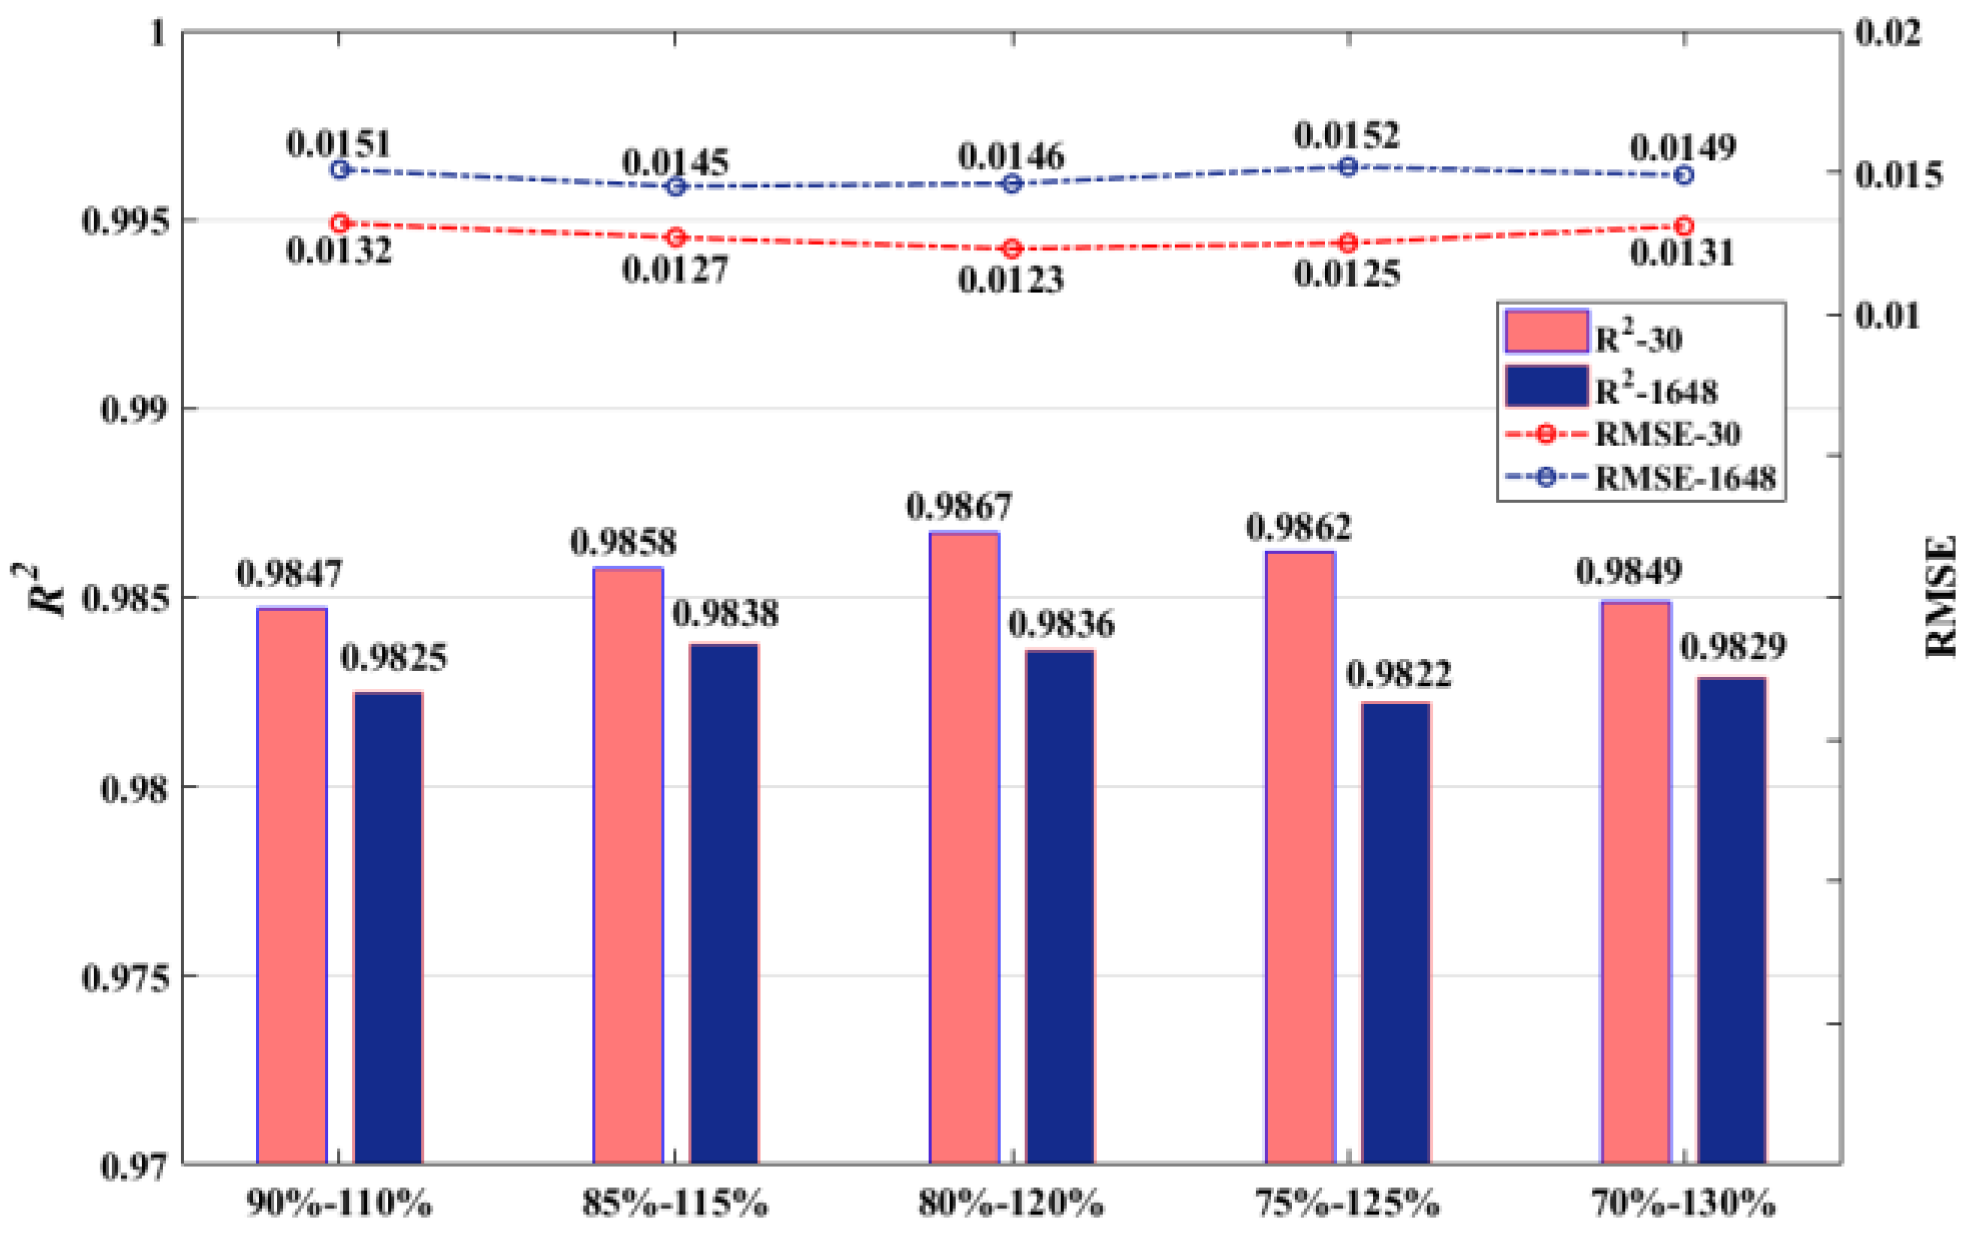
Variation of Peak/Minimum Load: The impact of different peak/minimum load ranges on the assessment accuracy was examined, and the test results are shown in Figure 8. Although fluctuation occurs in the prediction accuracy, the accuracy can still be maintained in an acceptable range ( R 2 > 0.90 ) for the two systems.
(3)
Variation of Generator/Load Power Distribution: Different generator/load power distributions were taken into account for testing, and the corresponding results are shown in Figure 9.
It should be noted that the variation ranges (the variation of peak/minimum load and the variation of generator/load power distribution) are based on the original loads and power distribution, respectively.
According to the above test results, it can be seen that the VSA model can provide desirable prediction accuracy for variable operation conditions, and good robustness of the model is demonstrated.

5.3. Impact of PMU Measurement Errors

In practice, although PMUs are precision level measurement units, there is a possibility that the signal processing may introduce some errors in the phasor calculations. Generally, PMUs that are Level 1 compliant with the standard should provide a total vector error (TVE) of less than 1% [31]. The TVE is the vector difference between the exact applied signal and the measured one. The impact of PMU measurement errors on the prediction performance was studied, and two scenarios were tested as follows.
(1)
Noise was added only to the test set.
(2)
Noise was added to both the training set and test set.
The test results for the considered scenarios are summarized in Table 4. It is shown that the VSA model can provide an acceptable prediction accuracy considering PMU measurement errors. In addition, the model with measurement error performs better than those without the error taken into account in the training data set.

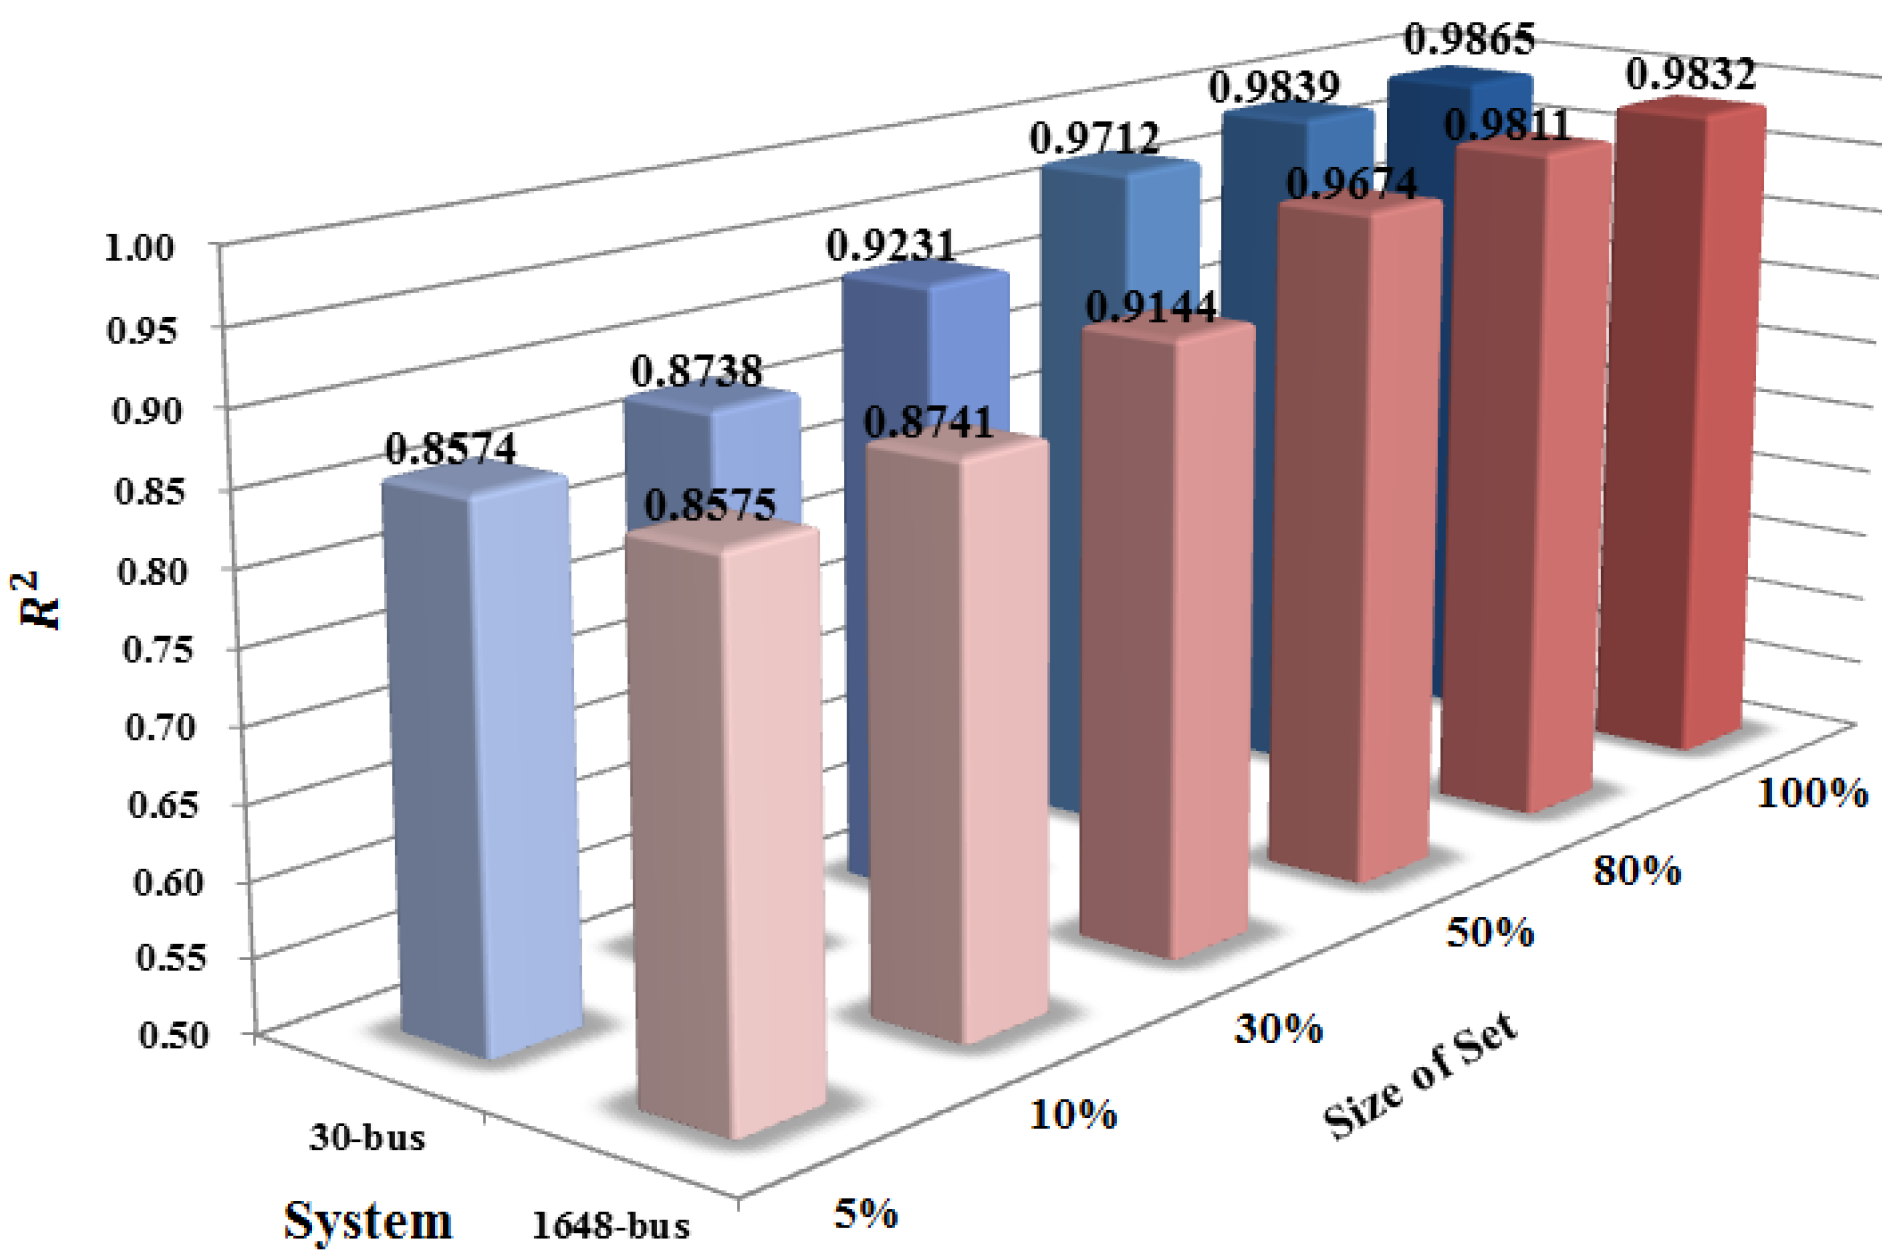
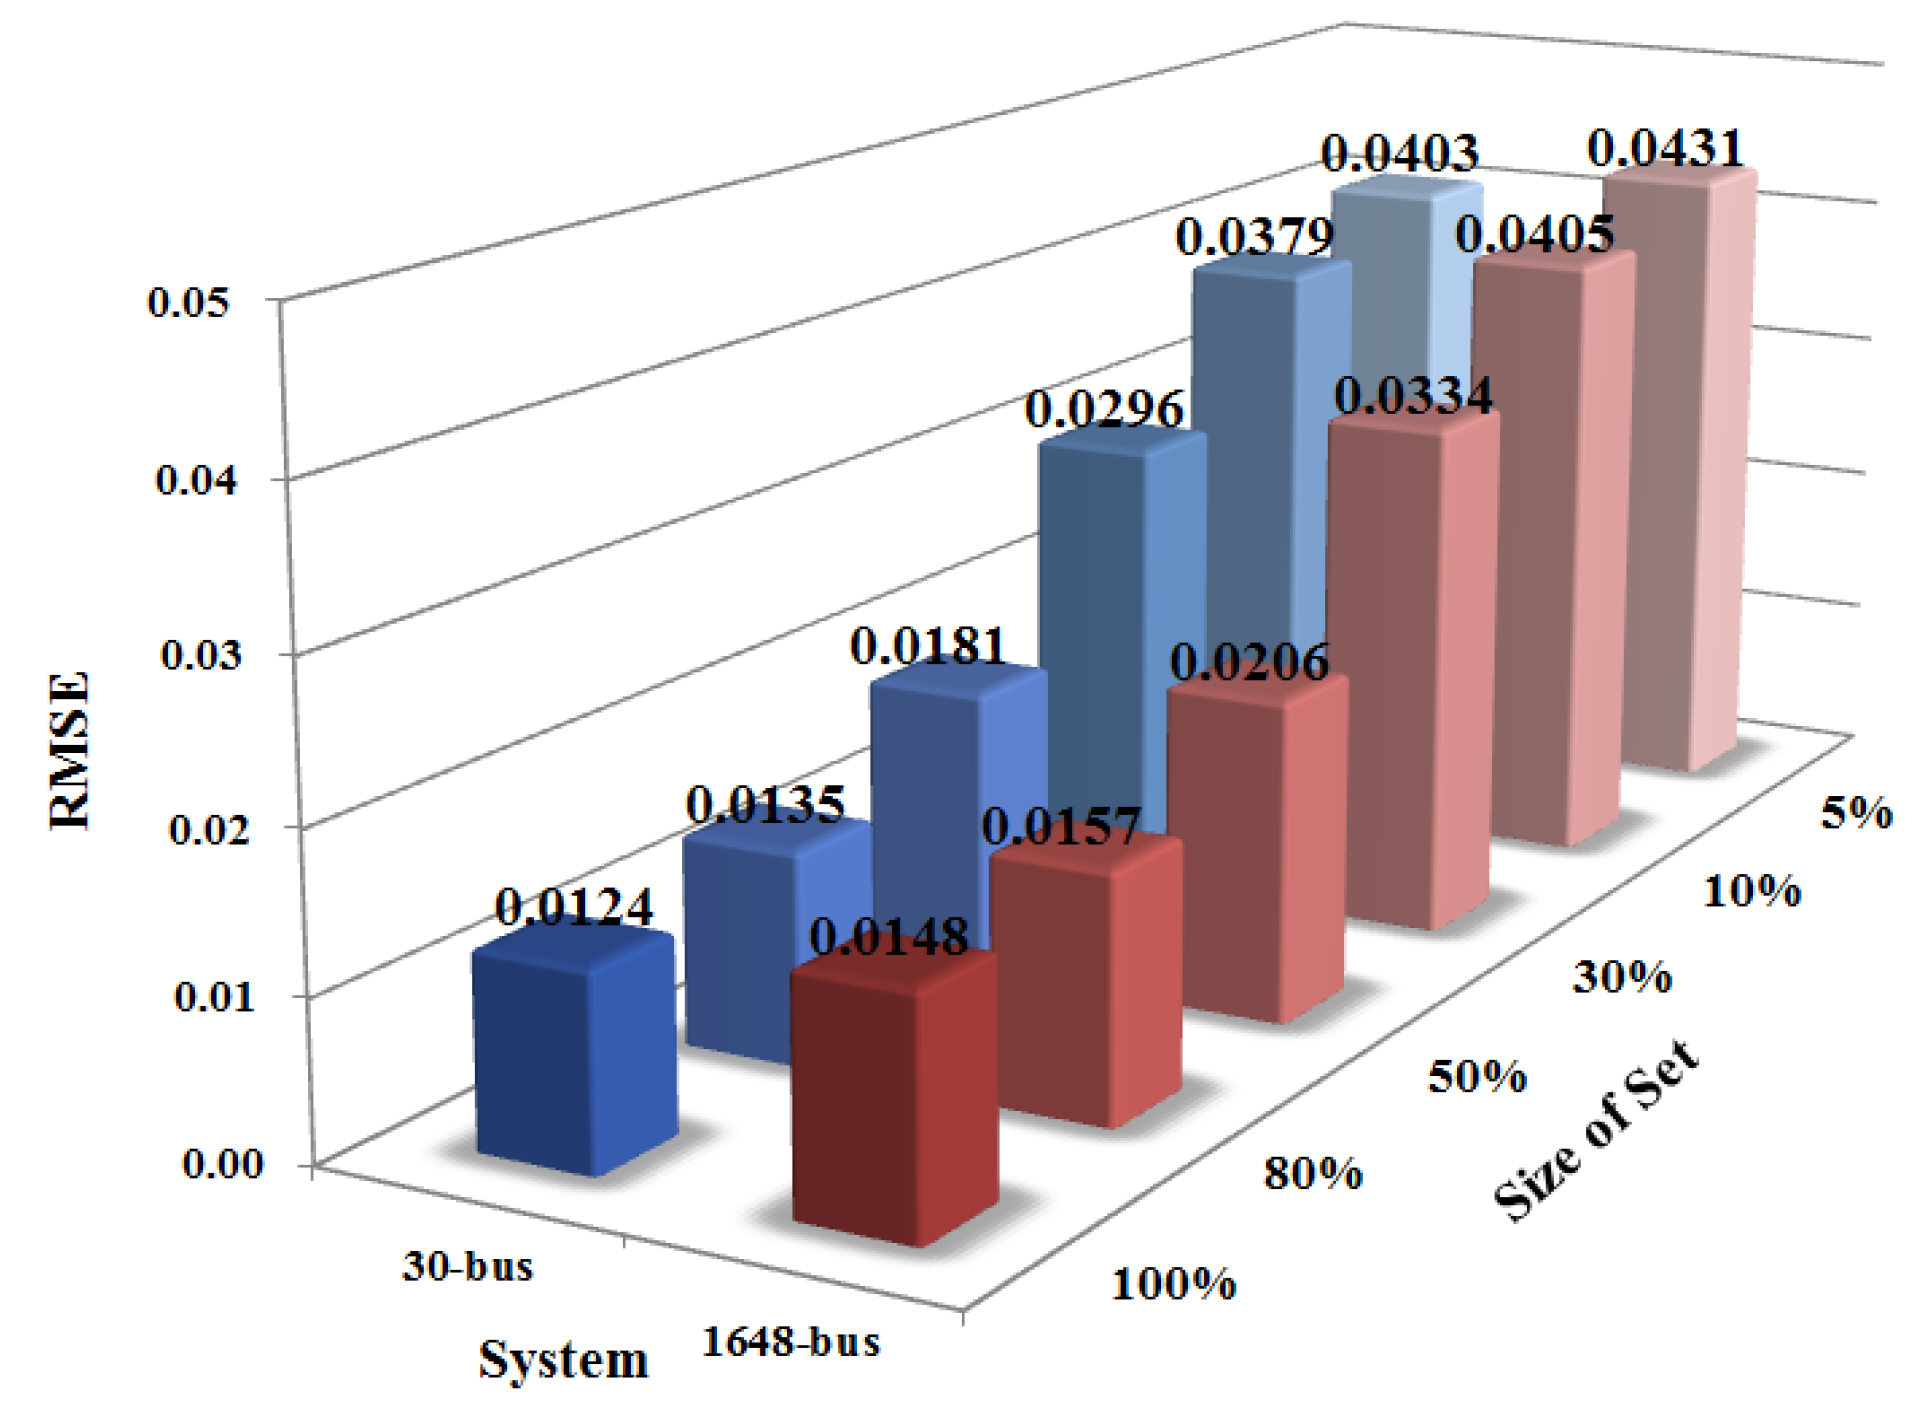
5.4. Impact of Training Set Size

To explore the impact of training set size on prediction accuracy, a series of training sets with different sizes was tested, and 5%, 10%, 30%, 50%, 80%, and 100% of the original training sets were used in each test. The overall accuracies of the tests for the two systems are given in Figure 10 and Figure 11. It can be seen that sufficient training samples are required to ensure a high accuracy for VSA.
According to replicated test results, at least approximately 10% of the original training samples can provide an acceptable assessment accuracy ( R 2 > 0.90 ) for the IEEE 30-bus system, and at least approximately 20% of the original training samples are needed for the 1648-bus system. Therefore, operators can conveniently choose an appropriate set size according to the required assessment accuracy.

5.5. Data Processing Speed

Data processing speed was also a concern for the online application of the VSA model. In practice, the sampling frequency of PMUs for system operation data is at least 30 times per second. Accordingly, to achieve a VSA for each snapshot, the processing time of PMU data should be less than 0.033 s [32]. Therefore, the capability of making full use of fast updated PMU data is essential for realizing online assessment.
The computation time results of the VSA model are summarized in Table 5. It is observed that a new operation point can be assessed in less than 0.002 s for both the IEEE 30-bus system and the 1648-bus system. Therefore, the data processing speed of the VSA model is rapid enough to satisfy the requirements of online application.

6. Conclusions

A data-driven and data-based framework for online VSA is proposed in this paper. The proposed framework is based on feature preprocessing, feature selection, and regression prediction. Using the feature preprocessing approach, redundant and irrelevant features can be removed from collected PMU data to improve computational efficiency. To further screen out the key variables highly related to the VSM, the feature selection procedure is completed based on PMI due to its advantages in exploring associations. IRF is applied to achieve the VSM prediction, which can effectively overcome the deficiencies of some conventional regression tools in VSA. The proposed framework supports model updating and adapts to unforeseen changes in system conditions. The desirable performance of the framework was demonstrated by the tests for the IEEE 30-bus system and a practical 1648-bus system. The robustness of the framework for some impact factors of system operation was also verified, including topology change, variation of peak/minimum load, and variation of generator/load power distribution.

Author Contributions

Conceptualization, S.L. (Songkai Liu) and R.S.; data curation, Y.H., X.L., and Z.L.; formal analysis, S.L. (Songkai Liu), L.W., D.M., and L.L. (Lihuang Liu); project administration, X.L. and G.Y.; software, L.L. (Lian Liu) and S.L. (Siyang Liao); supervision, S.L. (Songkai Liu) and M.Z.; visualization, L.W. and Y.H.; writing—original draft, R.S. and D.M.; writing—review and editing, R.S. and L.L. (Lihuang Liu). All authors have read and agreed to the published version of the manuscript.

Funding

This work was supported in part by the Open Foundation of Yichang Key Laboratory of Intelligent Operation and Security Defense of Power System under Grant 2020DLXY06, in part by the University Applied Fundamental Research Project of Yichang City under Grant A19-402-a15, in part by the Open Foundation of Hubei Provincial Key Laboratory for Operation and Control of Cascaded Hydropower Station under Grant 2019KJX11, in part by the Natural Science Foundation of Hubei Province under Grant 2019CFB331, and in part by the National Natural Science Foundation of China under Grant 51607104 and 51807109.

Conflicts of Interest

The authors declare no conflict of interest.

References

  1. Li, X.; Gui, D.; Zhao, Z.F.; Li, X.Y.; Wu, X.; Hua, Y.W.; Guo, P.F.; Zhong, H. Operation Optimization of Electrical-Heating Integrated Energy System Based on concentrating solar power plant hybridized with combined heat and power plant. J. Clean. Prod. 2021, 289, 125712. [Google Scholar] [CrossRef]
  2. Qiu, L.; Li, Y.; Yu, Y.; Xiao, Y.; Su, P.; Xiong, Q.; Jiang, J.; Li, L. Numerical and experimental investigation in electromagnetic tube expansion with axial compression. Int. J. Adv. Manuf. Technol. 2019, 104, 3045–3051. [Google Scholar] [CrossRef]
  3. Liu, Y.; Yang, N.; Dong, B.; Wu, L.; Yan, J.; Shen, X.; Xing, C.; Liu, S.; Huang, Y. Multi-Lateral participants decision-making: A distribution system planning approach with incomplete information game. IEEE Access 2020, 8, 88933–88950. [Google Scholar] [CrossRef]
  4. Cutsem, T.V.; Vournas, C. Voltage stability of electric power systems. Springer Int. 2007, 18, 32. [Google Scholar]
  5. Leonardi, B.; Ajjarapu, V. Development of multilinear regression models for online voltage stability margin estimation. IEEE Trans. Power Syst. 2011, 26, 374–383. [Google Scholar] [CrossRef]
  6. Zhang, X.P.; Ju, P.; Handschin, E. Continuation three-phase power flow: A tool for voltage stability analysis of unbalanced three-phase power systems. IEEE Trans. Power Syst. 2005, 20, 1320–1329. [Google Scholar] [CrossRef]
  7. Su, H.Y.; Liu, C.W. Estimating the voltage stability margin using PMU measurements. IEEE Trans. Power Syst. 2016, 31, 3221–3229. [Google Scholar] [CrossRef]
  8. Lee, D.H.A. Voltage stability assessment using equivalent nodal analysis. IEEE Trans. Power Syst. 2016, 31, 454–463. [Google Scholar] [CrossRef]
  9. Youssef, K.H. A new method for online sensitivity-based distributed voltage control and short circuit analysis of unbalanced distribution feeders. IEEE Trans. Smart Grid 2015, 6, 1253–1260. [Google Scholar] [CrossRef]
  10. Hashiesh, F.; Mostafa, H.E.; Khatib, A.R.; Helal, I.; Mansour, M.M. An intelligent wide area synchrophasor based system for predicting and mitigating transient instabilities. IEEE Trans. Smart Grid 2012, 3, 645–652. [Google Scholar] [CrossRef]
  11. Liu, S.K.; Liu, L.H.; Fan, Y.P.; Zhang, L.; Huang, Y.H.; Zhang, T.; Cheng, J.Z.; Wang, L.Y.; Zhang, M.L.; Shi, R.Y.; et al. An integrated scheme for online dynamic security assessment based on partial mutual information and iterated random forest. IEEE Trans. Smart Grid 2020, 11, 3606–3619. [Google Scholar] [CrossRef]
  12. Liu, S.K.; Liu, L.H.; Yang, N.; Mao, D.; Zhang, L.; Cheng, J.Z.; Xue, T.L.; Liu, L.; Yan, G.H.; Qiu, L.; et al. A data-driven approach for online dynamic security assessment with spatial-temporal dynamic visualization using random bits forest. Int. J. Electr. Power Energy Syst. 2021, 124, 106316. [Google Scholar] [CrossRef]
  13. Wang, B.; Fang, B.; Wang, Y.J.; Liu, H.S.; Liu, Y.L. Power system transient stability assessment based on big data and the core vector machine. IEEE Trans. Smart Grid 2016, 7, 2561–2570. [Google Scholar] [CrossRef]
  14. Achlerkar, P.D.; Samantaray, S.R.; Manikandan, M.S. Variational mode decomposition and decision tree based detection and classification of power quality disturbances in grid-connected distributed generation system. IEEE Trans. Smart Grid 2018, 9, 3122–3132. [Google Scholar] [CrossRef]
  15. Zhou, D.Q.; Annakkage, U.D.; Rajapakse, A.D. Online monitoring of voltage stability margin using an artificial neural network. IEEE Trans. Power Syst. 2010, 25, 1566–1574. [Google Scholar] [CrossRef]
  16. Xu, Y.; Dong, Z.Y.; Zhao, J.H.; Zhang, P.; Wong, K.P. A reliable intelligent system for real-time dynamic security assessment of power systems. IEEE Trans. Power Syst. 2012, 27, 1253–1263. [Google Scholar] [CrossRef]
  17. Zhao, J.; Zhou, Y.W.; Zhang, X.J.; Chen, L.N. Part mutual information for quantifying direct associations in networks. Proc. Natl. Acad. Sci. USA 2016, 113, 5130–5135. [Google Scholar] [CrossRef] [Green Version]
  18. Basu, S.; Kumbier, K.; Brown, J.B.; Yu, B. Iterative random forests to discover predictive and stable high-order interactions. Proc. Natl. Acad. Sci. USA 2018, 115, 1943–1948. [Google Scholar] [CrossRef] [Green Version]
  19. Ajjarapu, V.; Christy, C. The continuation power flow: A tool for steady state voltage stability analysis. IEEE Trans. Power Syst. 1992, 7, 416–423. [Google Scholar] [CrossRef]
  20. Zheng, C.; Malbasa, V.; Kezunovic, M. Regression tree for stability margin prediction using synchrophasor measurements. IEEE Trans. Power Syst. 2013, 28, 1978–1987. [Google Scholar] [CrossRef]
  21. Zhang, X.; Zhao, J.; Hao, J.; Zhao, X.; Chen, L. Conditional mutual inclusive information enables accurate quantification of associations in gene regulatory networks. Nucleic Acids Res. 2014, 43, 31–41. [Google Scholar] [CrossRef] [PubMed] [Green Version]
  22. Zhang, X.; Zhao, X.-M.; He, K.; Lu, L.; Cao, Y.; Liu, J.; Hao, J.-K.; Liu, Z.-P.; Chen, L. Inferring gene regulatory networks from gene expression data by path consistency algorithm based on conditional mutual information. Bioinformatics 2012, 28, 98–104. [Google Scholar] [CrossRef] [PubMed]
  23. Janzing, D.; Balduzzi, D.; Grosse-Wentrup, M.; Schölkopf, B. Quantifying causal influences. Ann Stat. 2013, 41, 2324–2358. [Google Scholar] [CrossRef]
  24. Anaissi, A.; Kennedy, P.J.; Goyal, M.; Catchpoole, D.R. A balanced iterative random forest for gene selection from microarray data. Bioinformatics 2013, 14, 261. [Google Scholar] [CrossRef] [Green Version]
  25. Breiman, L. Bagging predictors. Mach. Learn. 1996, 24, 123–140. [Google Scholar] [CrossRef] [Green Version]
  26. Voumvoulakis, E.M.; Hatziargyriou, N.D. A particle swarm optimization method for power system dynamic security control. IEEE Trans. Power Syst. 2010, 25, 1032–1041. [Google Scholar] [CrossRef]
  27. He, M.; Vittal, V.; Zhang, J. Online dynamic security assessment with missing PMU measurements: A data mining approach. IEEE Trans. Power Syst. 2013, 28, 1969–1977. [Google Scholar] [CrossRef]
  28. Nau, R.F. Forecasting. February 2005. Available online: http://www.duke.edu/~rnau/rsquared.htm (accessed on 1 June 2020).
  29. Zhao, B.B.; Cao, J.W.; Zhu, Z.Y.; Zhang, H.Y. A new transient voltage stability prediction model using big data analysis. In Proceedings of the 2016 IEEE Innovative Smart Grid Technologies—Asia (ISGT-Asia), Melbourne, Australia, 28 November–1 December 2016; Volume 25, pp. 2378–8542. [Google Scholar]
  30. Diao, R.S.; Vittal, V.J.; Logic, N. Design of a real-time security assessment tool for situational awareness enhancement in modern power systems. IEEE Trans. Power Syst. 2010, 25, 957–965. [Google Scholar] [CrossRef]
  31. IEEE Standard for Synchrophasors for Power Systems; IEEE Std. C37.118-2005; IEEE: New York, NY, USA, 2005.
  32. Su, H.Y.; Liu, T.Y. Enhanced-online-random-forest model for static voltage stability assessment using wide area measurements. IEEE Trans. Power Syst. 2018, 33, 6696–6704. [Google Scholar] [CrossRef]
Figure 1. Depiction of load active power margin.
Energies 14 00715 g001
Figure 2. Basic flow chart of iterated random forest (IRF).
Energies 14 00715 g002
Figure 3. Proposed framework for online voltage stability margin (VSM) assessment.
Energies 14 00715 g003
Figure 4. Flow chart of the division strategy.
Energies 14 00715 g004
Figure 5. Loop flow for the subset processing.
Energies 14 00715 g005
Figure 6. Diagram of the IEEE 30-bus system.
Energies 14 00715 g006
Figure 7. Tests for variation of topology.
Energies 14 00715 g007
Figure 8. Tests for variation of peak/minimum load.
Energies 14 00715 g008
Figure 9. Tests for variation of generator/load power distribution.
Energies 14 00715 g009
Figure 10. Assessment accuracies (residual squared error ( R 2 )) based on different training set sizes.
Energies 14 00715 g010
Figure 11. Assessment accuracies (root mean squared error (RMSE)) based on different training set sizes.
Energies 14 00715 g011
Table 1. Accuracies of the tests for the two systems.
Accuracy30-Bus System1648-Bus System
R 2 0.98650.9832
RMSE0.01240.0148
Table 2. Performance comparison between IRF and conventional tools.
Tool30-Bus System1648-Bus System
R 2 RMSE R 2 RMSE
LR0.97590.01650.97360.0185
SVM0.96870.01890.96080.0226
RT0.97160.01790.96940.0199
ANN0.97460.01710.97070.0195
ELM0.97130.01810.96580.0211
IRF0.98650.01240.98320.0148
Table 3. Different network topologies for the two systems.
TypeOut of Service
(30-Bus System)
Out of Service
(1648-Bus System)
N-1Lines 4–14Lines 303–310
N-2G 3 and Lines 15–17G 42 and Lines 6–10
N-2Lines 5–18 and Lines 12–13Lines 55–76 and Lines 344–385
N-3G 2, Lines 4–6, and Lines 55–76G 128, Lines 9–21, and Lines 1262–1035
N-3Lines 1–9, Lines 12–13, and Lines 21–22G 540, Lines 89–92, and Shunt 171
Table 4. Assessment accuracies considering PMU measurement errors.
Scenario30-Bus System1648-Bus System
R 2 RMSE R 2 RMSE
Scenario 10.96080.02300.95890.0252
Scenario 20.97420.01870.96840.0221
Table 5. Data processing speed tests for the two systems.
SystemTraining TimeTest Time
30-bus23.64 s (3331 records)2.79 s (1428 records)
1648-bus239.82 s (11,605 records)9.25 s (4947 records)
Publisher’s Note: MDPI stays neutral with regard to jurisdictional claims in published maps and institutional affiliations.

