1. Introduction
The indoor environment quality (IEQ) in buildings is related to the quality of life, health, and productivity [
1,
2,
3]. The main factors composing the IEQ are classified into thermal comfort, indoor air quality (IAQ), and visual comfort [
4,
5]. Among these factors, the degree of thermal comfort is decided by predicted mean vote (PMV), one of the thermal comfort indices proposed by Fanger [
5]. PMV considers six physical factors and two individual factors of metabolic rate and clothing insulation. While physical factors can be measured simply with sensors, the individual factors are difficult to measure objectively and accurately.
One of these individual factors, the metabolic rate, is the real-time rate of change in the heat production of the human body. The heat production of a human is mostly determined by activity, and the amount of produced heat varies greatly by activity: “Sleeping” (100 W), “light work” (200 W), “walking” (300 W), “jogging” (800 W) [
6]. In other words, the metabolic rate can be estimated if the activity that has a decisive influence on the heat production is identified in real-time.
However, unlike other environmental factors, activities of occupants are difficult to measure simply and accurately with sensors. Therefore, the metabolic rate is generally inferred from the measurement of indirect factors that change in response to human activity, such as the body surface temperature measured using an infrared camera [
7,
8]. However, in order to estimate the PMV for thermal comfort, it is necessary to develop a fundamental measuring method of the metabolic rate. Therefore, to estimate the metabolic rate, a method for identifying human activities in real-time is a promising approach.
A human activity estimation method being developed continuously not only in architecture but also in the computer vision field classifies human activities by learning image patterns [
9,
10,
11,
12]. Automatic analysis of human behavior from an image is an important but challenging problem. The human activity estimation method estimates the location of each joint of a person from an image and then uses this information to analyze the behavior of the target person. In classical approaches, researchers have proposed hand-crafted features specifically designed for certain attributes of joints in an input image. For example, a histogram of oriented gradients (HOG) [
9] is a widely used feature for human pose detection. Because a HOG is based on a gradient, it is robust to unexpected illumination changes in the input image. A classifier is trained to learn the pattern of local features for object recognition [
9,
10]. In such a framework, features and corresponding classifiers must be carefully chosen for a target application.
By contrast, neural network-based models learn important features on their own from training data rather than requiring a researcher to arbitrarily design the features. Several attempts have been made to improve human activity estimation using neural networks. Toshev and Szegedy [
11] proposed DeepPose, a deep neural network (DNN), for human activity estimation from an image, and this model is able to recognize various human activities in images with complex backgrounds. The DeepPose study demonstrated the potential of DNN for improving the activity estimation techniques. Each layer of a DNN learns progressively better representations of the target object in an image. This property allows one to identify features better from training data. Another interesting property of the DNN-based approach is that it facilitates a holistic approach that uses not only local features in local regions of an image but also the context information of the whole image.
However, conventional human activity estimation models are limited to outdoor applications, such as pedestrian detection [
9,
10,
12] and sports activities such as Leeds Sports Pose (LSP) [
13] and the Parse dataset [
14,
15,
16]. These datasets mainly focus on upright postures such as walking, running, and standing, and do not include other postures more typical of indoor activity, such as sleeping, reclining, and sitting. However, because modern people spend on average more than 80% of their time indoors, more accurate indoor activity estimation methods are essential when seeking to provide a comfortable and customized indoor environment that considers the occupants’ lifestyle and activity. In addition, based on human–computer interaction (HCI), smart services and technologies by considering indoor activity of an occupant can be provided in real-time. In order to identify indoor postures, it is necessary to develop a dataset and estimation model of indoor activity trained using this data.
In this study, a DNN-based model that estimates the joints location of the occupant for various indoor activities was developed. In the model development process, images of various indoor activities were collected from the laboratory and the internet. The DNN model was developed to estimate the joint coordinates of the person in the image, and the accuracy of the proposed model was assessed. The developed model is a vital technology for being applied to estimate the actual activity [
17,
18], and it is believed that the metabolic rate and the PMV of occupants can be calculated based on the estimated indoor activity. In addition, this possibility is expected to enable PMV-based environmental control and enhance indoor thermal comfort.
The remainder of this paper is organized as follows. In
Section 2, related research on human activity estimation is summarized.
Section 3 presents the 10 selected indoor activities and the method for collecting image data. In addition, the structure and parameters of the DNN model are presented.
Section 4 presents the results of an analysis of the accuracy of the proposed model. Finally,
Section 5 discusses the implications of the study results and future research directions.
2. Related Research
Extensive research has been conducted on how to recognize and analyze human behaviors from images, beginning with studies on how to detect a person present in an image. The most widely known and used technique for this is based on HOG. This technique was first proposed by Dalal and Triggs [
9], who presented a method for calculating features based on the distribution of a gradient by region and detecting a human body by combining the HOG features of adjacent regions. This gradient-based feature has the advantage of being robust to external influences, such as illumination, and it was designed to first calculate the distributions by region and then combine them to recognize complex human behavior. Various algorithms have since been proposed to improve the accuracy and speed of the HOG method [
10,
19]. As such, there have been ongoing studies into approaches for designing features for partial regions and recognizing an object by combining the features of surrounding regions. For example, approaches such as the “bag-of-features” approach to object recognition have been tried [
20]. Felzenszwalb [
21] proposed a part-based model for object detection that is a multi-scale approach that detects a whole object by considering the relationships between parts and filtering certain parts of a target object. In this way, the possibility of detecting the entire object and the part constituting the object was confirmed.
Improving such image recognition techniques, extensive studies have been performed to address the human activity estimation problem. Yang and Ramanan [
15] proposed a part-based model that simultaneously detects parts of the human body and identifies the relations between adjacent structures. This part-based model has a flexible structure that facilitates the capture of complex human activity information. Compared to conventional human activity models, this model is faster and more accurate. Chen and Alan [
16] developed a model that utilizes pairwise spatial relationships between joints and local image patches. Their model is a form of a graphical model combined with a deep convolutional neural network (DCNN) that learns conditional probabilities regarding whether body parts exist in an image patch and detects body parts in a local image patch using the spatial linking of the joint relationships. However, in these studies, most features are based on the characteristics of specific regions of an image; the overall characteristics of an image are not considered. In particular, feature-based methods perform poorly for foreshortening and occluded joints in an image.
To overcome these limitations, several attempts have been made recently to use DNNs. DNNs with a large number of layers can learn progressively complex features effectively from input images. Furthermore, a DNN learns to detect complex patterns for a whole image, not just local patches. The DeepPose model proposed by Toshev and Szegedy [
11] was the first model that used these advantages in human activity estimation. In their study, the last layer of a neural network called AlexNet [
22] was modified, resulting in significantly higher accuracy than is achievable by conventional image recognition methods, to output the coordinates of joints from an input image. However, the dataset used in this model had a high proportion of poses related to sports, and it was difficult to predict joints that were not visible in the image. State-of-the-art research has also been conducted on the estimation of hands and poses using the learning of three-dimensional (3D) coordinates [
23,
24]. This approach has the advantage of being able to estimate three-dimensional coordinates; however, estimating the coordinates from a single two-dimensional (2D) image can cause perspective distortion. This limitation needs to be resolved because it increases the possibility of error when predicting 3D values from 2D sources.
3. Methods
In this study, a DNN-based human activity estimation model that estimates human joint coordinates from various types of indoor activity images was developed. The 14 major joints of the human body are as follows: (1) Right ankle, (2) right knee, (3) right hip, (4) left hip, (5) left knee, (6) left ankle, (7) right wrist, (8) right elbow, (9) right shoulder, (10) left shoulder, (11) left elbow, (12) left wrist, (13) neck, and (14) head. The DNN-based model was constructed to output the coordinates of human joints from an input image. Complex behaviors were recognized by increasing the number of layers. The residual deep learning method [
25] was used to train the DNN effectively with a large number of layers.
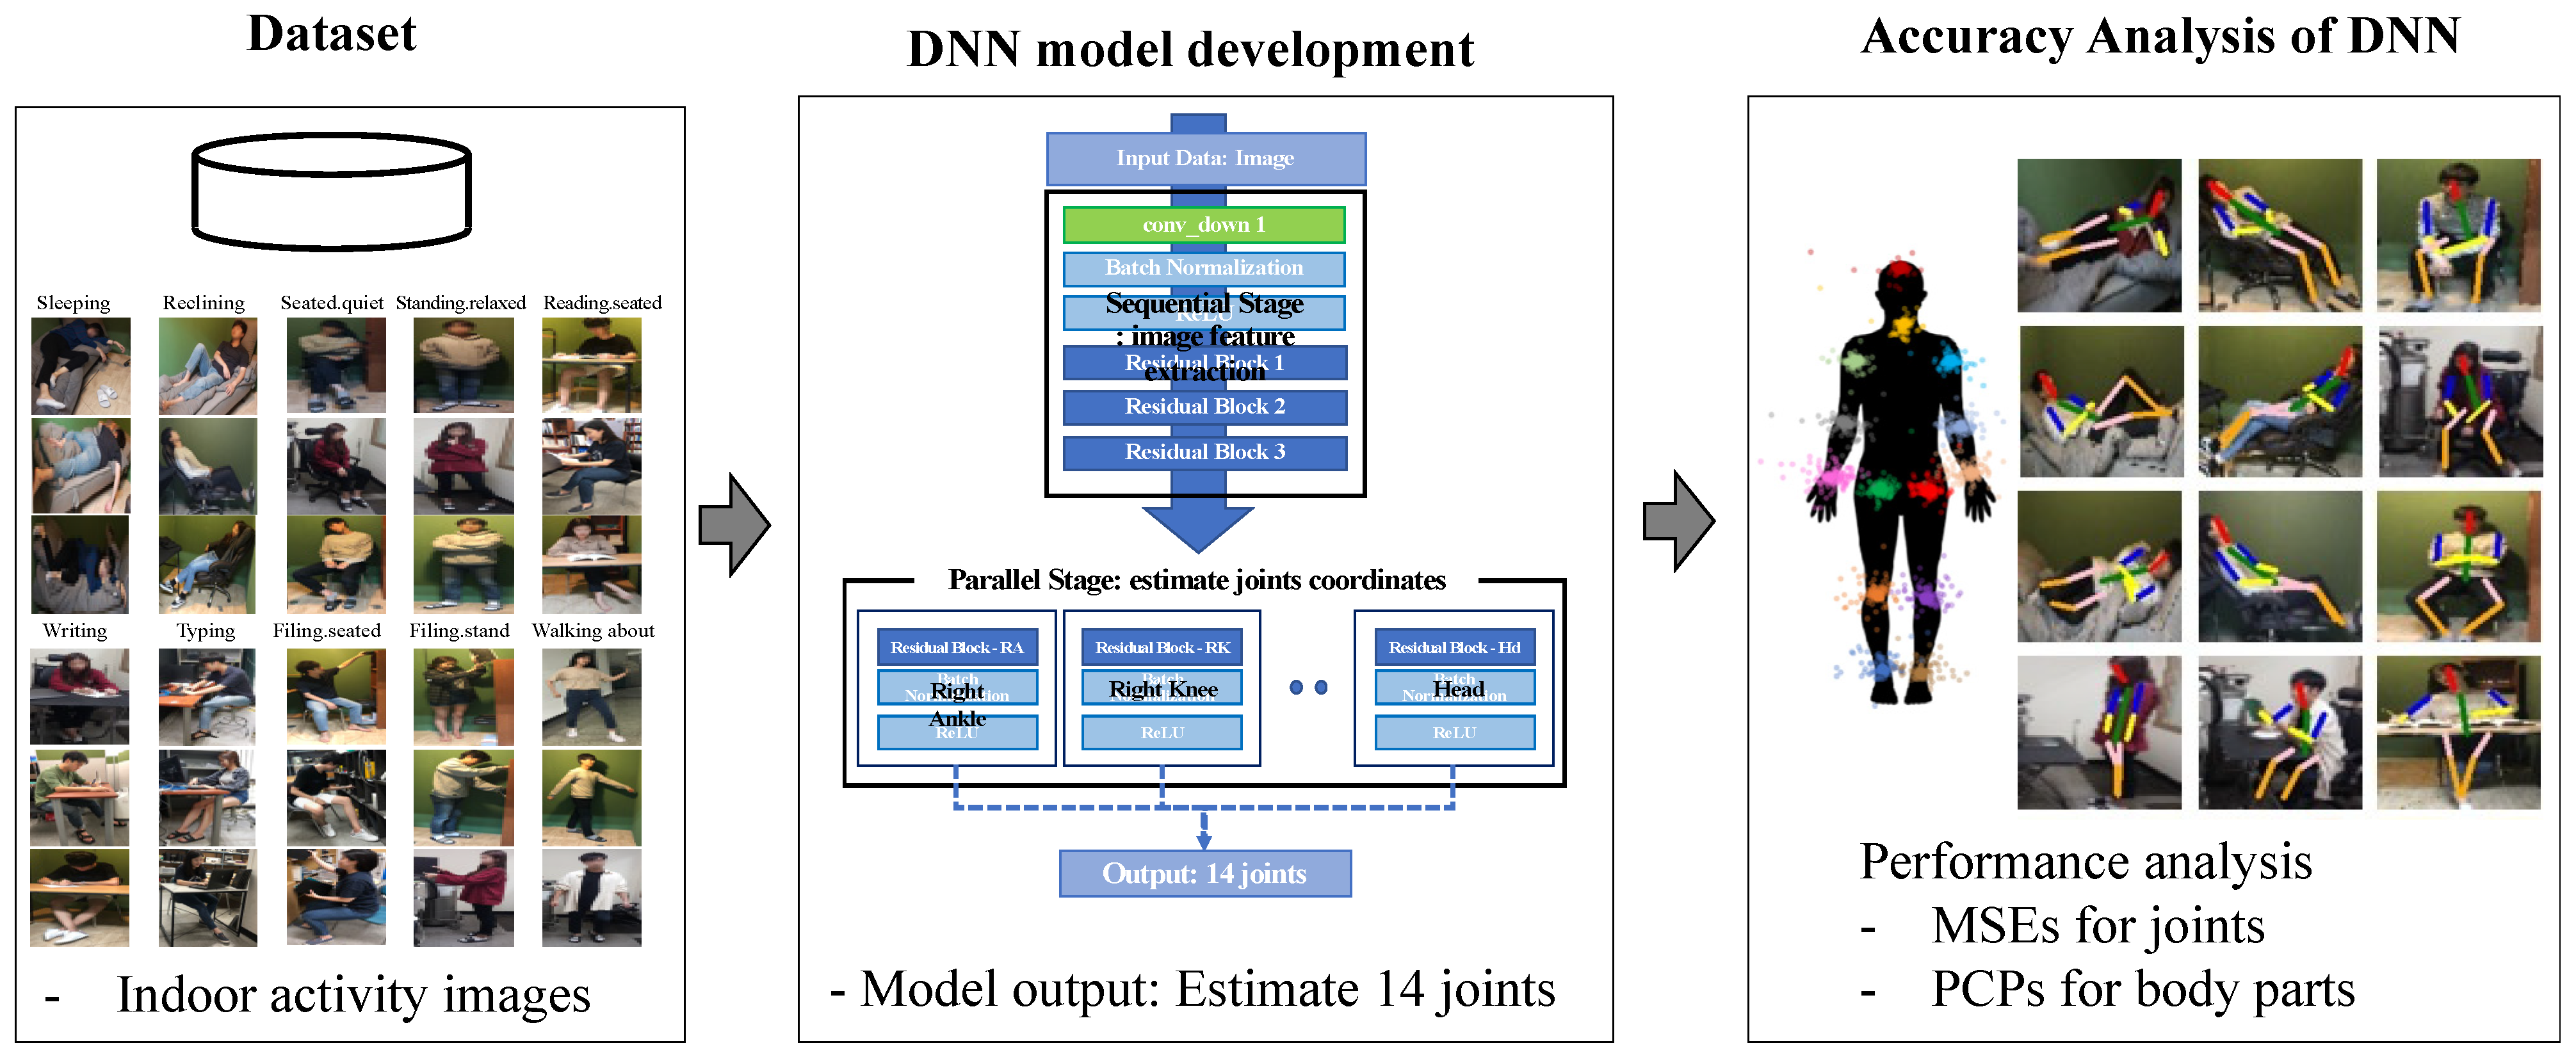
The development process for the model is presented in
Figure 1. First, a dataset consisting of images of people in various indoor activities was constructed, and the coordinates of 14 major joints were marked manually for each image. Second, the DNN was trained and optimized with 80% of the dataset. The DNN model took the images as input and produced the location of the 14 joints as output. Third, the estimation accuracy was tested with the remaining 20% of the dataset.
3.1. Datasets
First, representative indoor activities were selected from
Table 1, “Metabolic Rates for Typical Tasks,” of ASHRAE standard 55, produced by the American Society of Heating, Refrigerating, and Air-Conditioning Engineers (ASHRAE) [
26]. ASHRAE standard 55 provides a list of various indoor activities. From this list, 10 representative indoor activities within the home and at the office were selected (
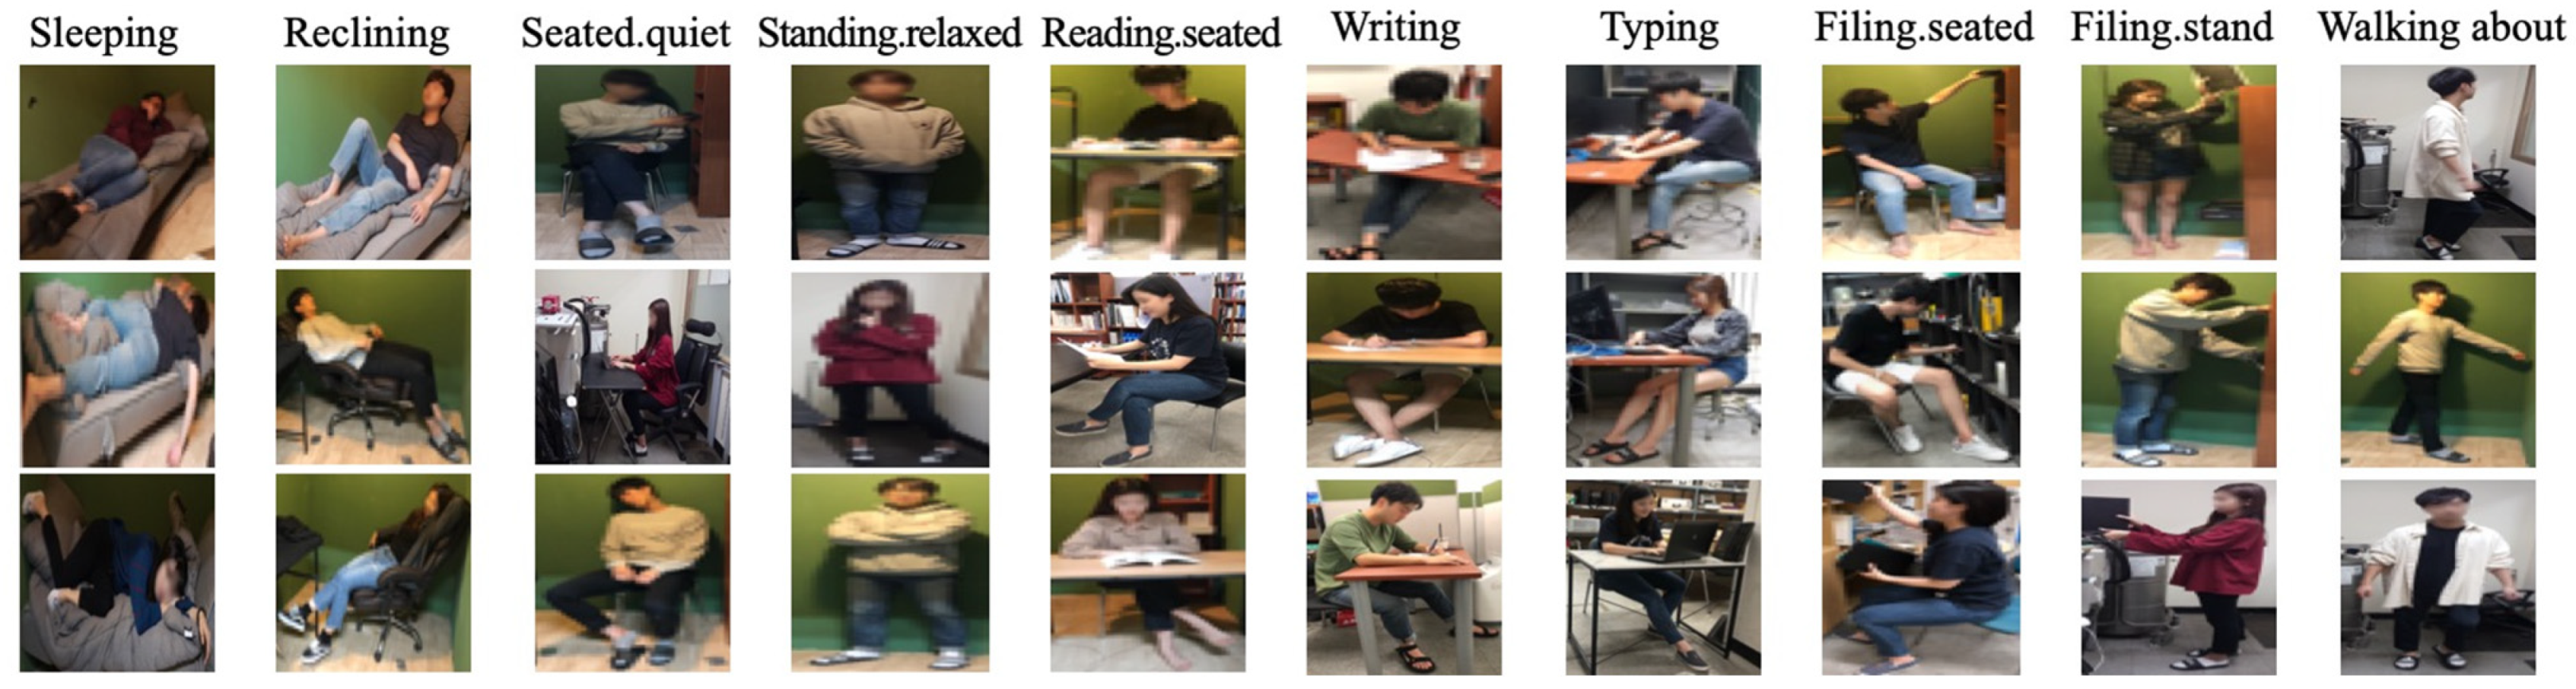
Table 1): Sleeping, reclining, sitting quietly, standing in a relaxed manner, reading while seated, writing, typing, filing while seated, filing while standing, and walking about. Of the 10 selected activities, five were sitting, three were standing, one was lying, and one was reclining.
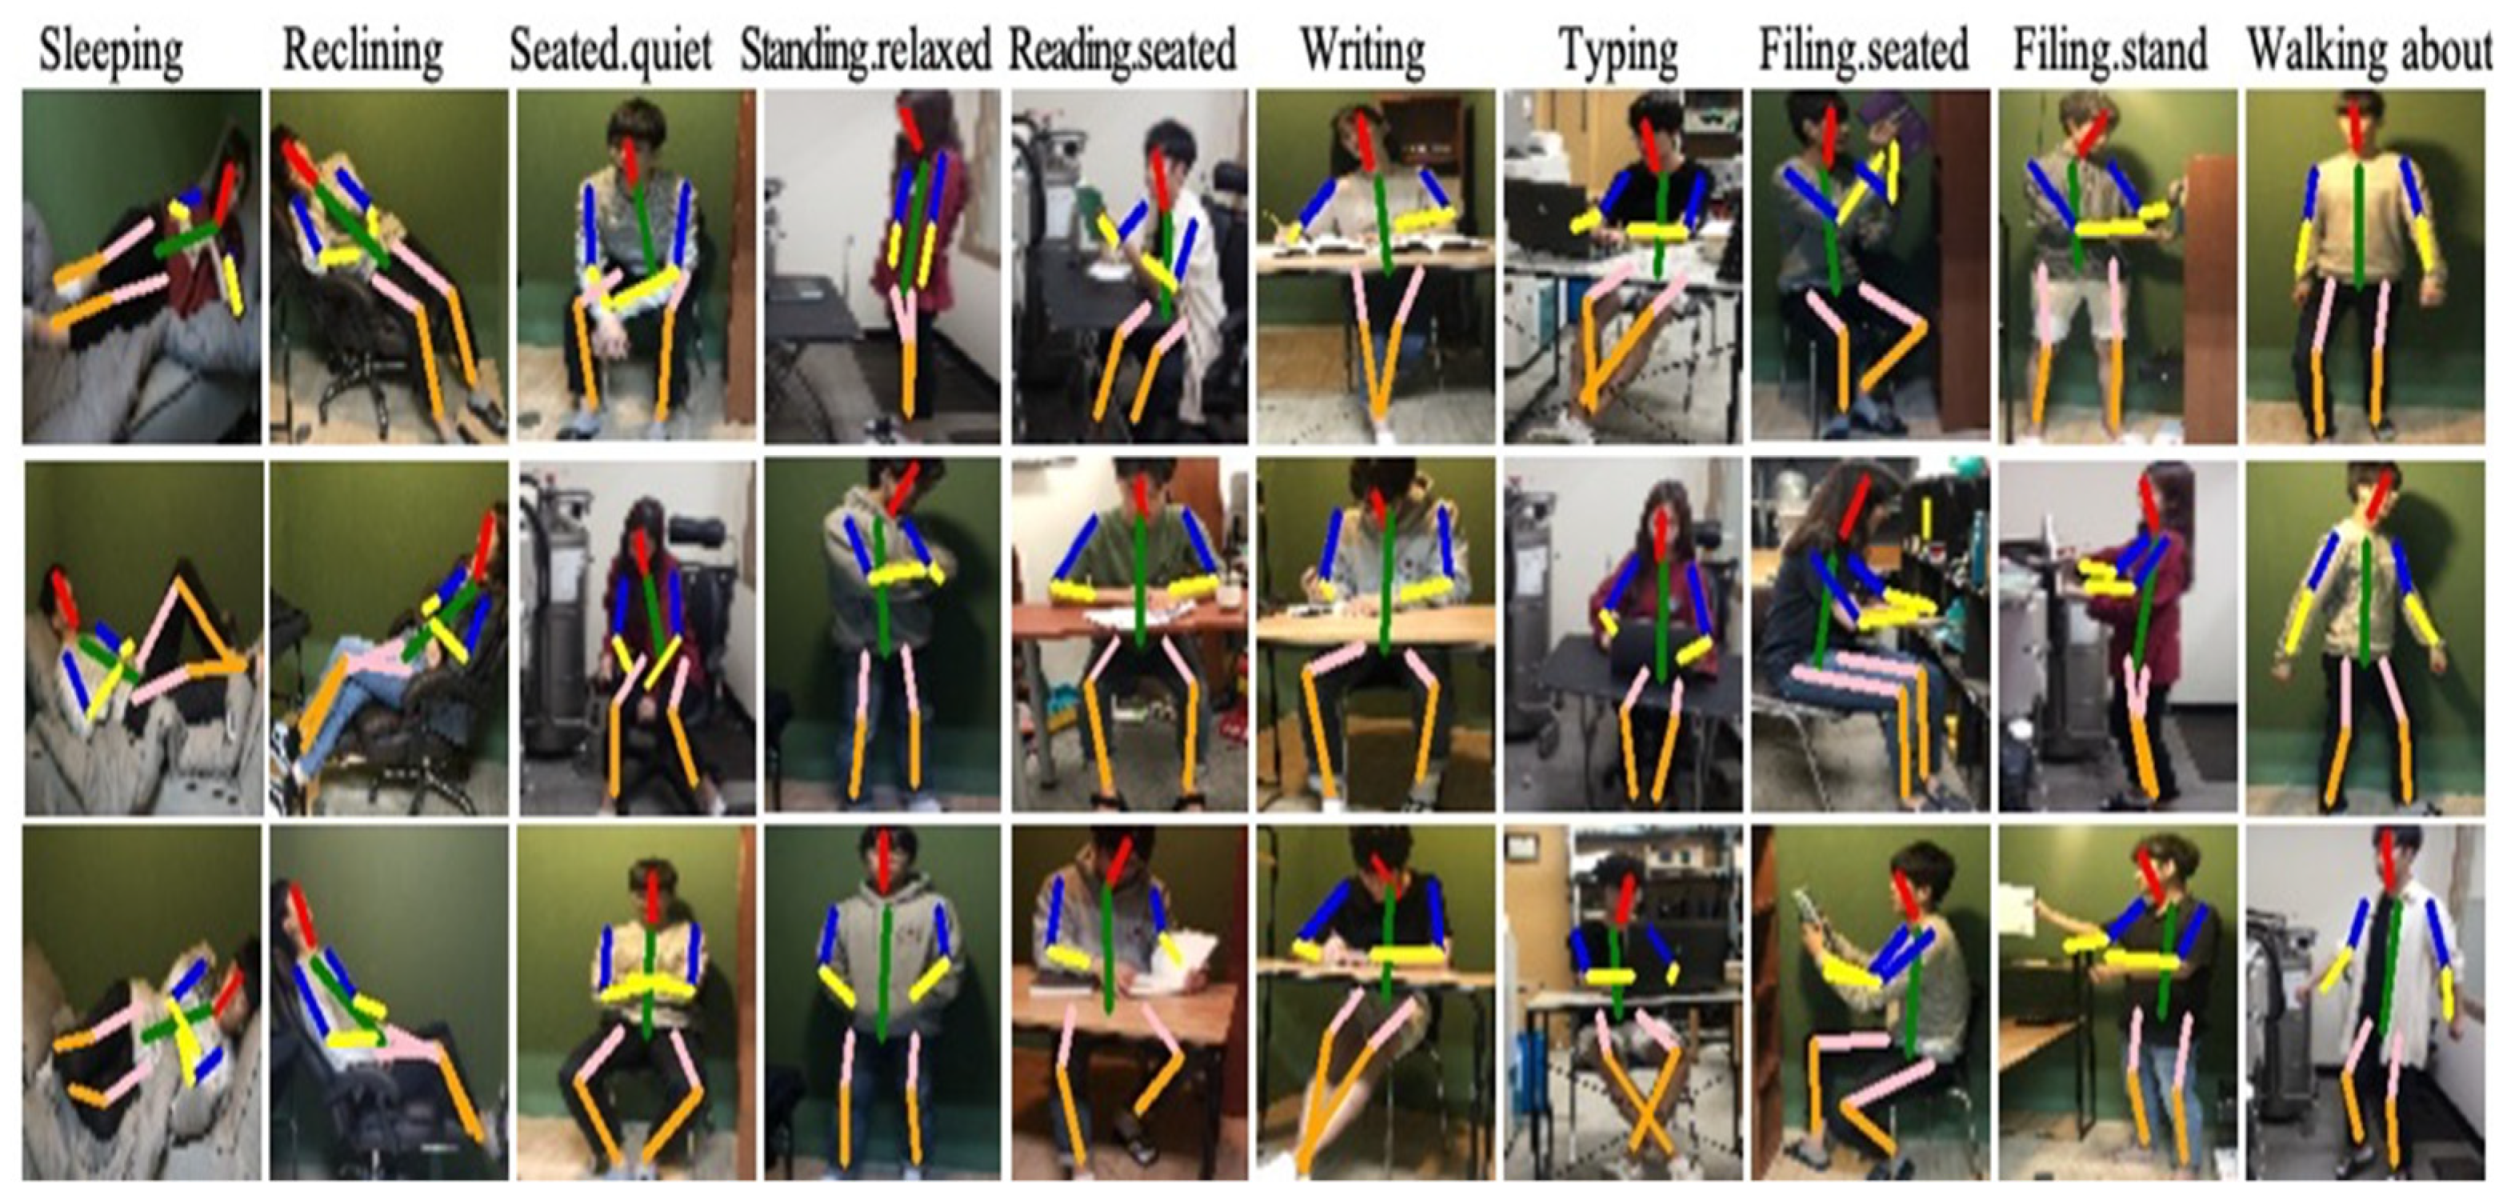
In total, 870 images for the 10 indoor activities were collected from the internet and by photographing participants directly in the laboratory. Images showing as many human joints as possible were used because, if some of the joints are not visible in the images, suboptimal training will occur. The collected images were resized to 128 × 128 for the training and testing of the proposed model.
Figure 2 shows examples of resized laboratory images for the 10 indoor activities.
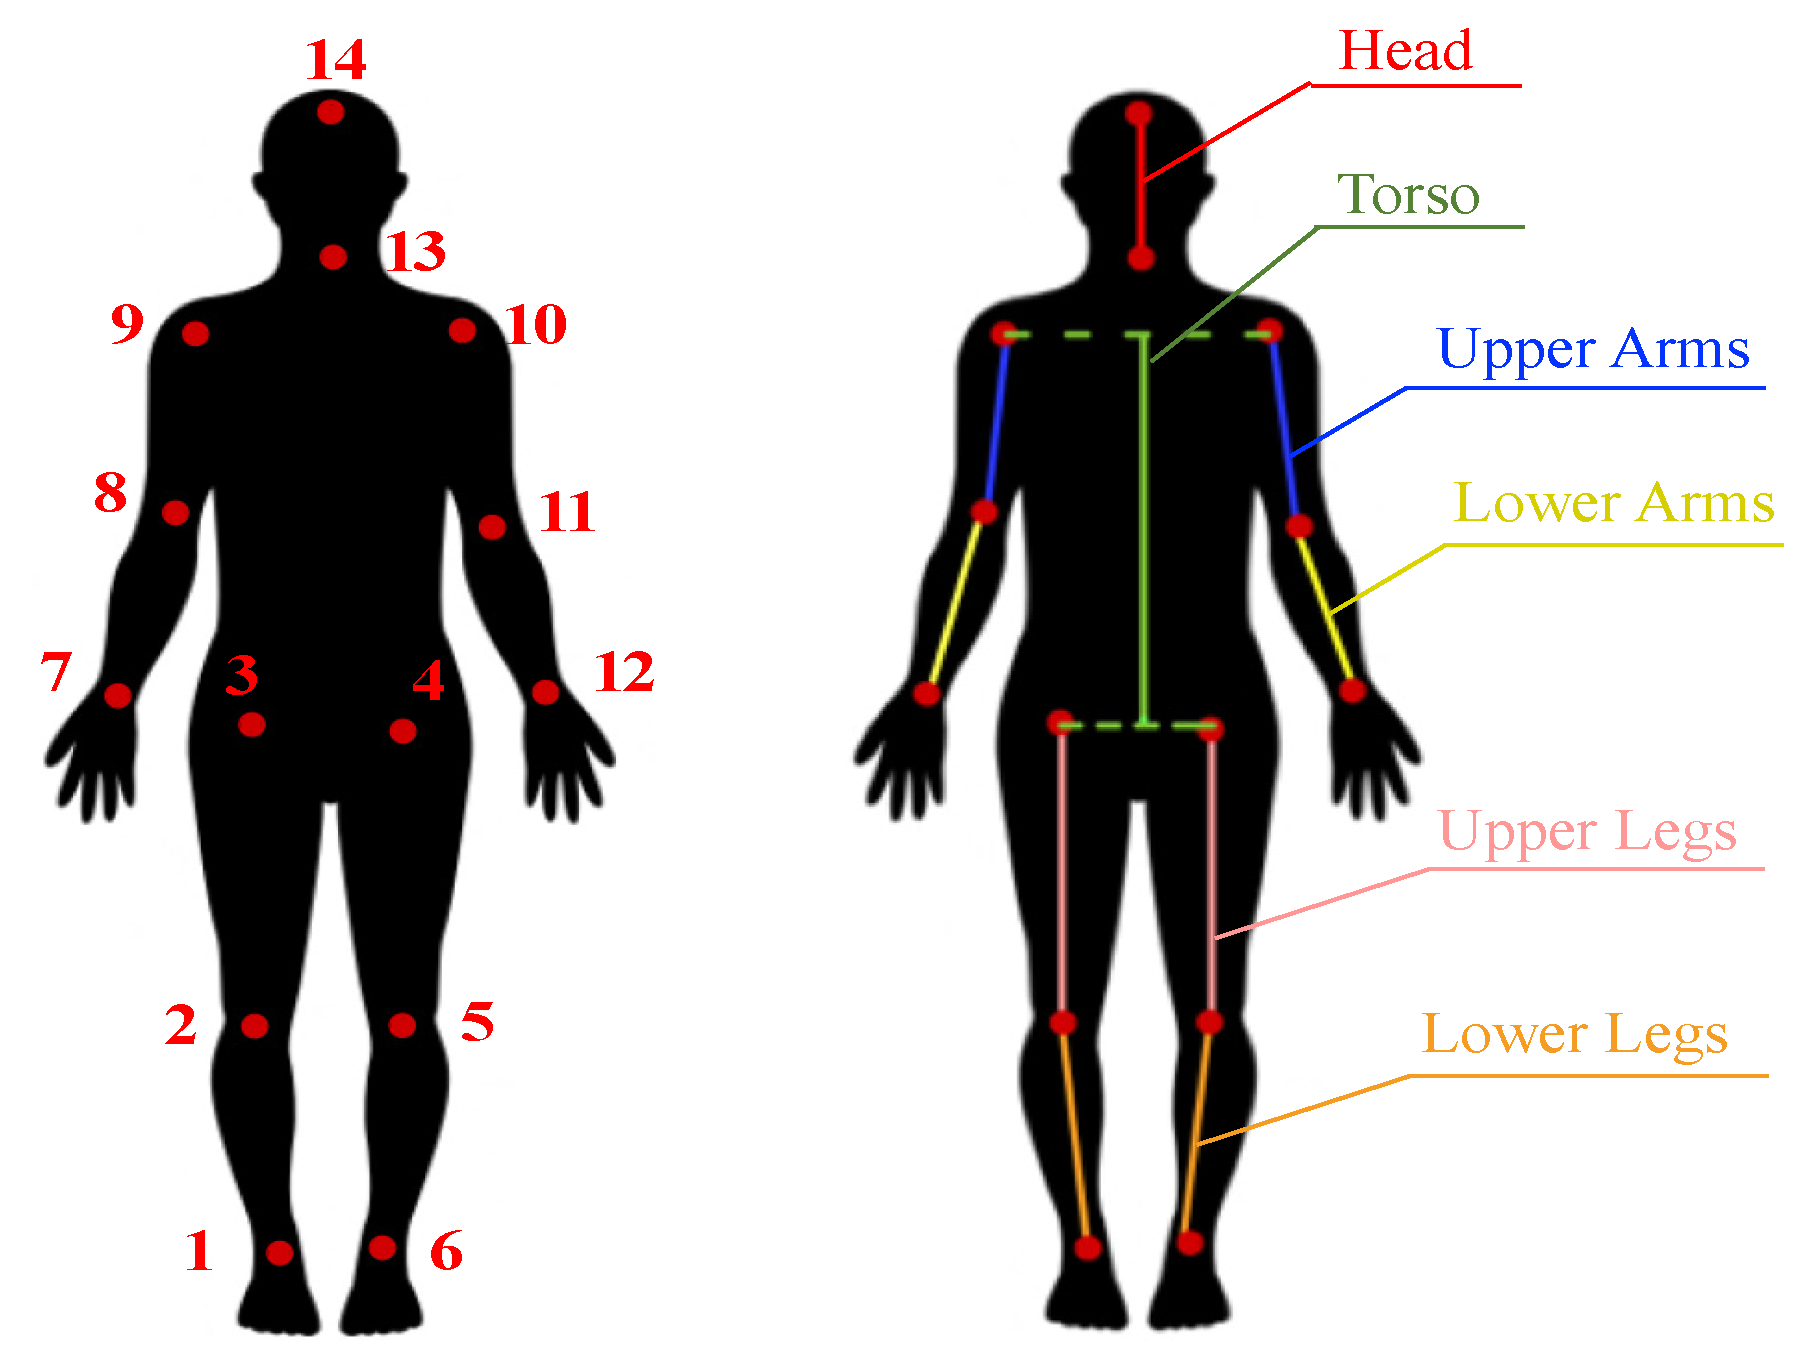
A human activity was defined by the coordinates of the 14 joints as shown on the left side of
Figure 3: (1) Right ankle, (2) right knee, (3) right hip, (4) left hip, (5) left knee, (6) left ankle, (7) right wrist, (8) right elbow, (9) right shoulder, (10) left shoulder, (11) left elbow, (12) left wrist, (13) neck, and (14) head. These are identical to the joints defined in the Leeds Sports Pose (LSP) dataset [
13]. For different joint models, the proposed DNN model can be applied by modifying the final output layer only.
Using the 14 joints, 10 body parts were defined, as shown on the right side of
Figure 3. Considering body symmetry, these 10 body parts could be further reduced to six: The head, torso, upper arms, lower arms, upper legs, and lower legs. Each body part, except the torso, was defined by connecting two adjacent joints. The torso (the solid green line) was defined as the centerline connecting the center points of the shoulders (joints 9 and 10) and hips (joints 3 and 4).
In the dataset, the coordinates of some joints that were not visible (because they were occluded or out of the image) were treated separately with a special annotation (−1), and these joints were excluded from the accuracy analysis.
3.2. Residual Deep Learning for Human Activity Estimation
The proposed model consisted of 138 convolutional layers to learn the features of the images and 14 fully connected layers for the output of the joint coordinates. To overcome the problem of vanishing or exploding gradients as the number of layers increases and to improve the overall accuracy, the residual deep learning method proposed by He et al. [
25] was used in this study.
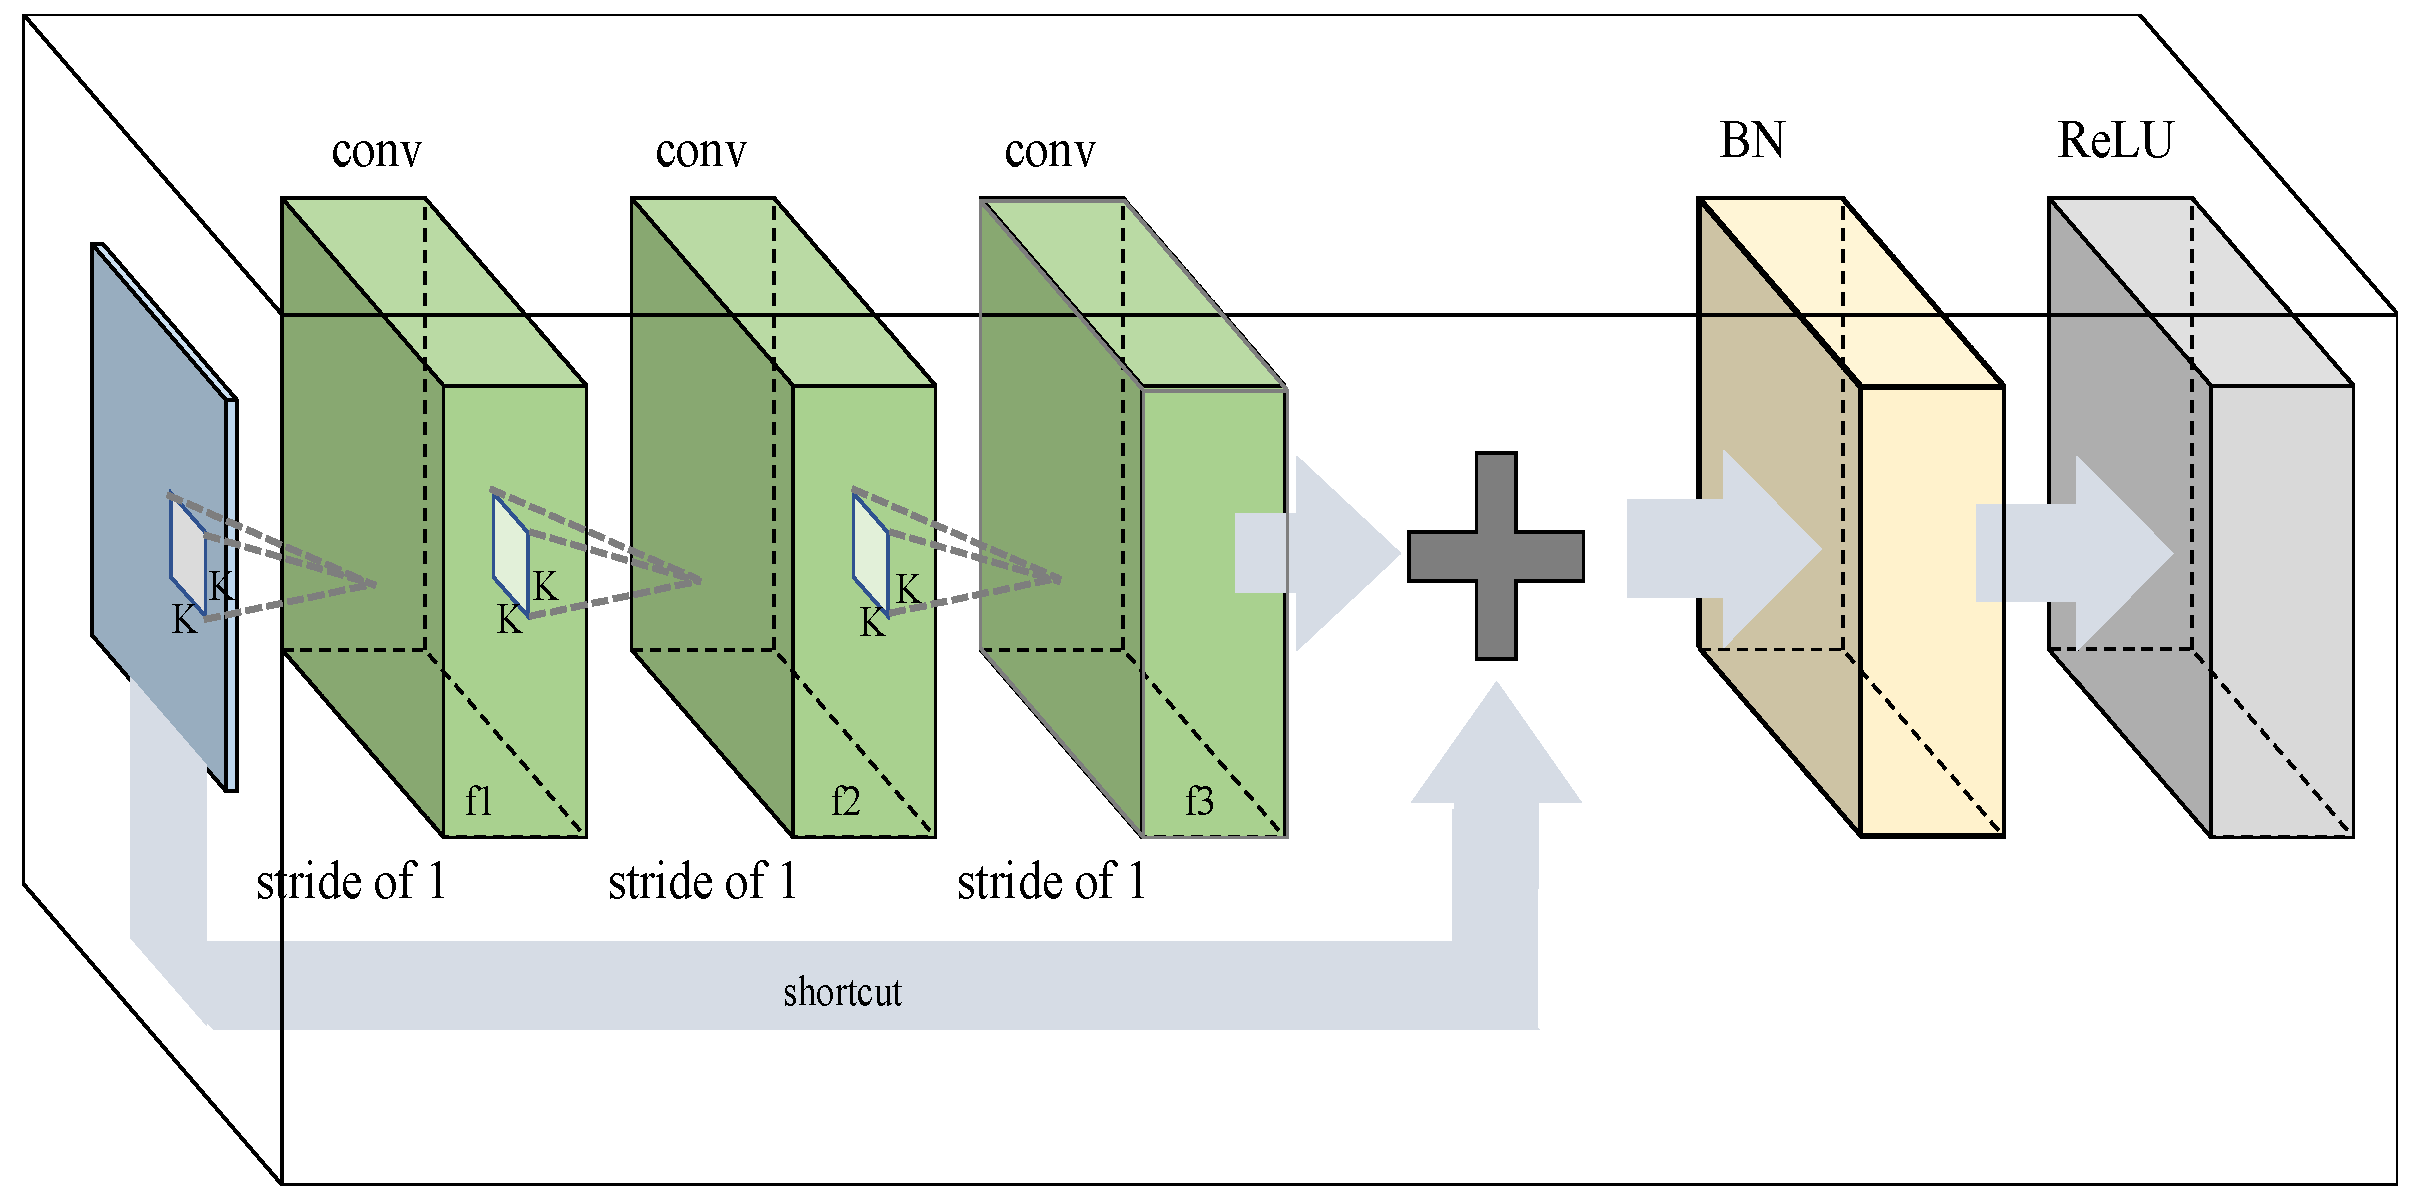
A residual block is a unit that has three convolution layers with a shortcut, followed by batch normalization (BN) and a rectified linear unit (ReLU) (see
Figure 4). A shortcut connection was added to directly connect the input and output of every three convolution layers. It prevents the gradient vanishing problem in training a very deep neural network. The values of the kernel size (k × k) of each convolution layer and the stride were set to one. Introducing numerous shortcuts prevented the vanishing gradient problem in training the proposed DNN with a very larger number of layers.
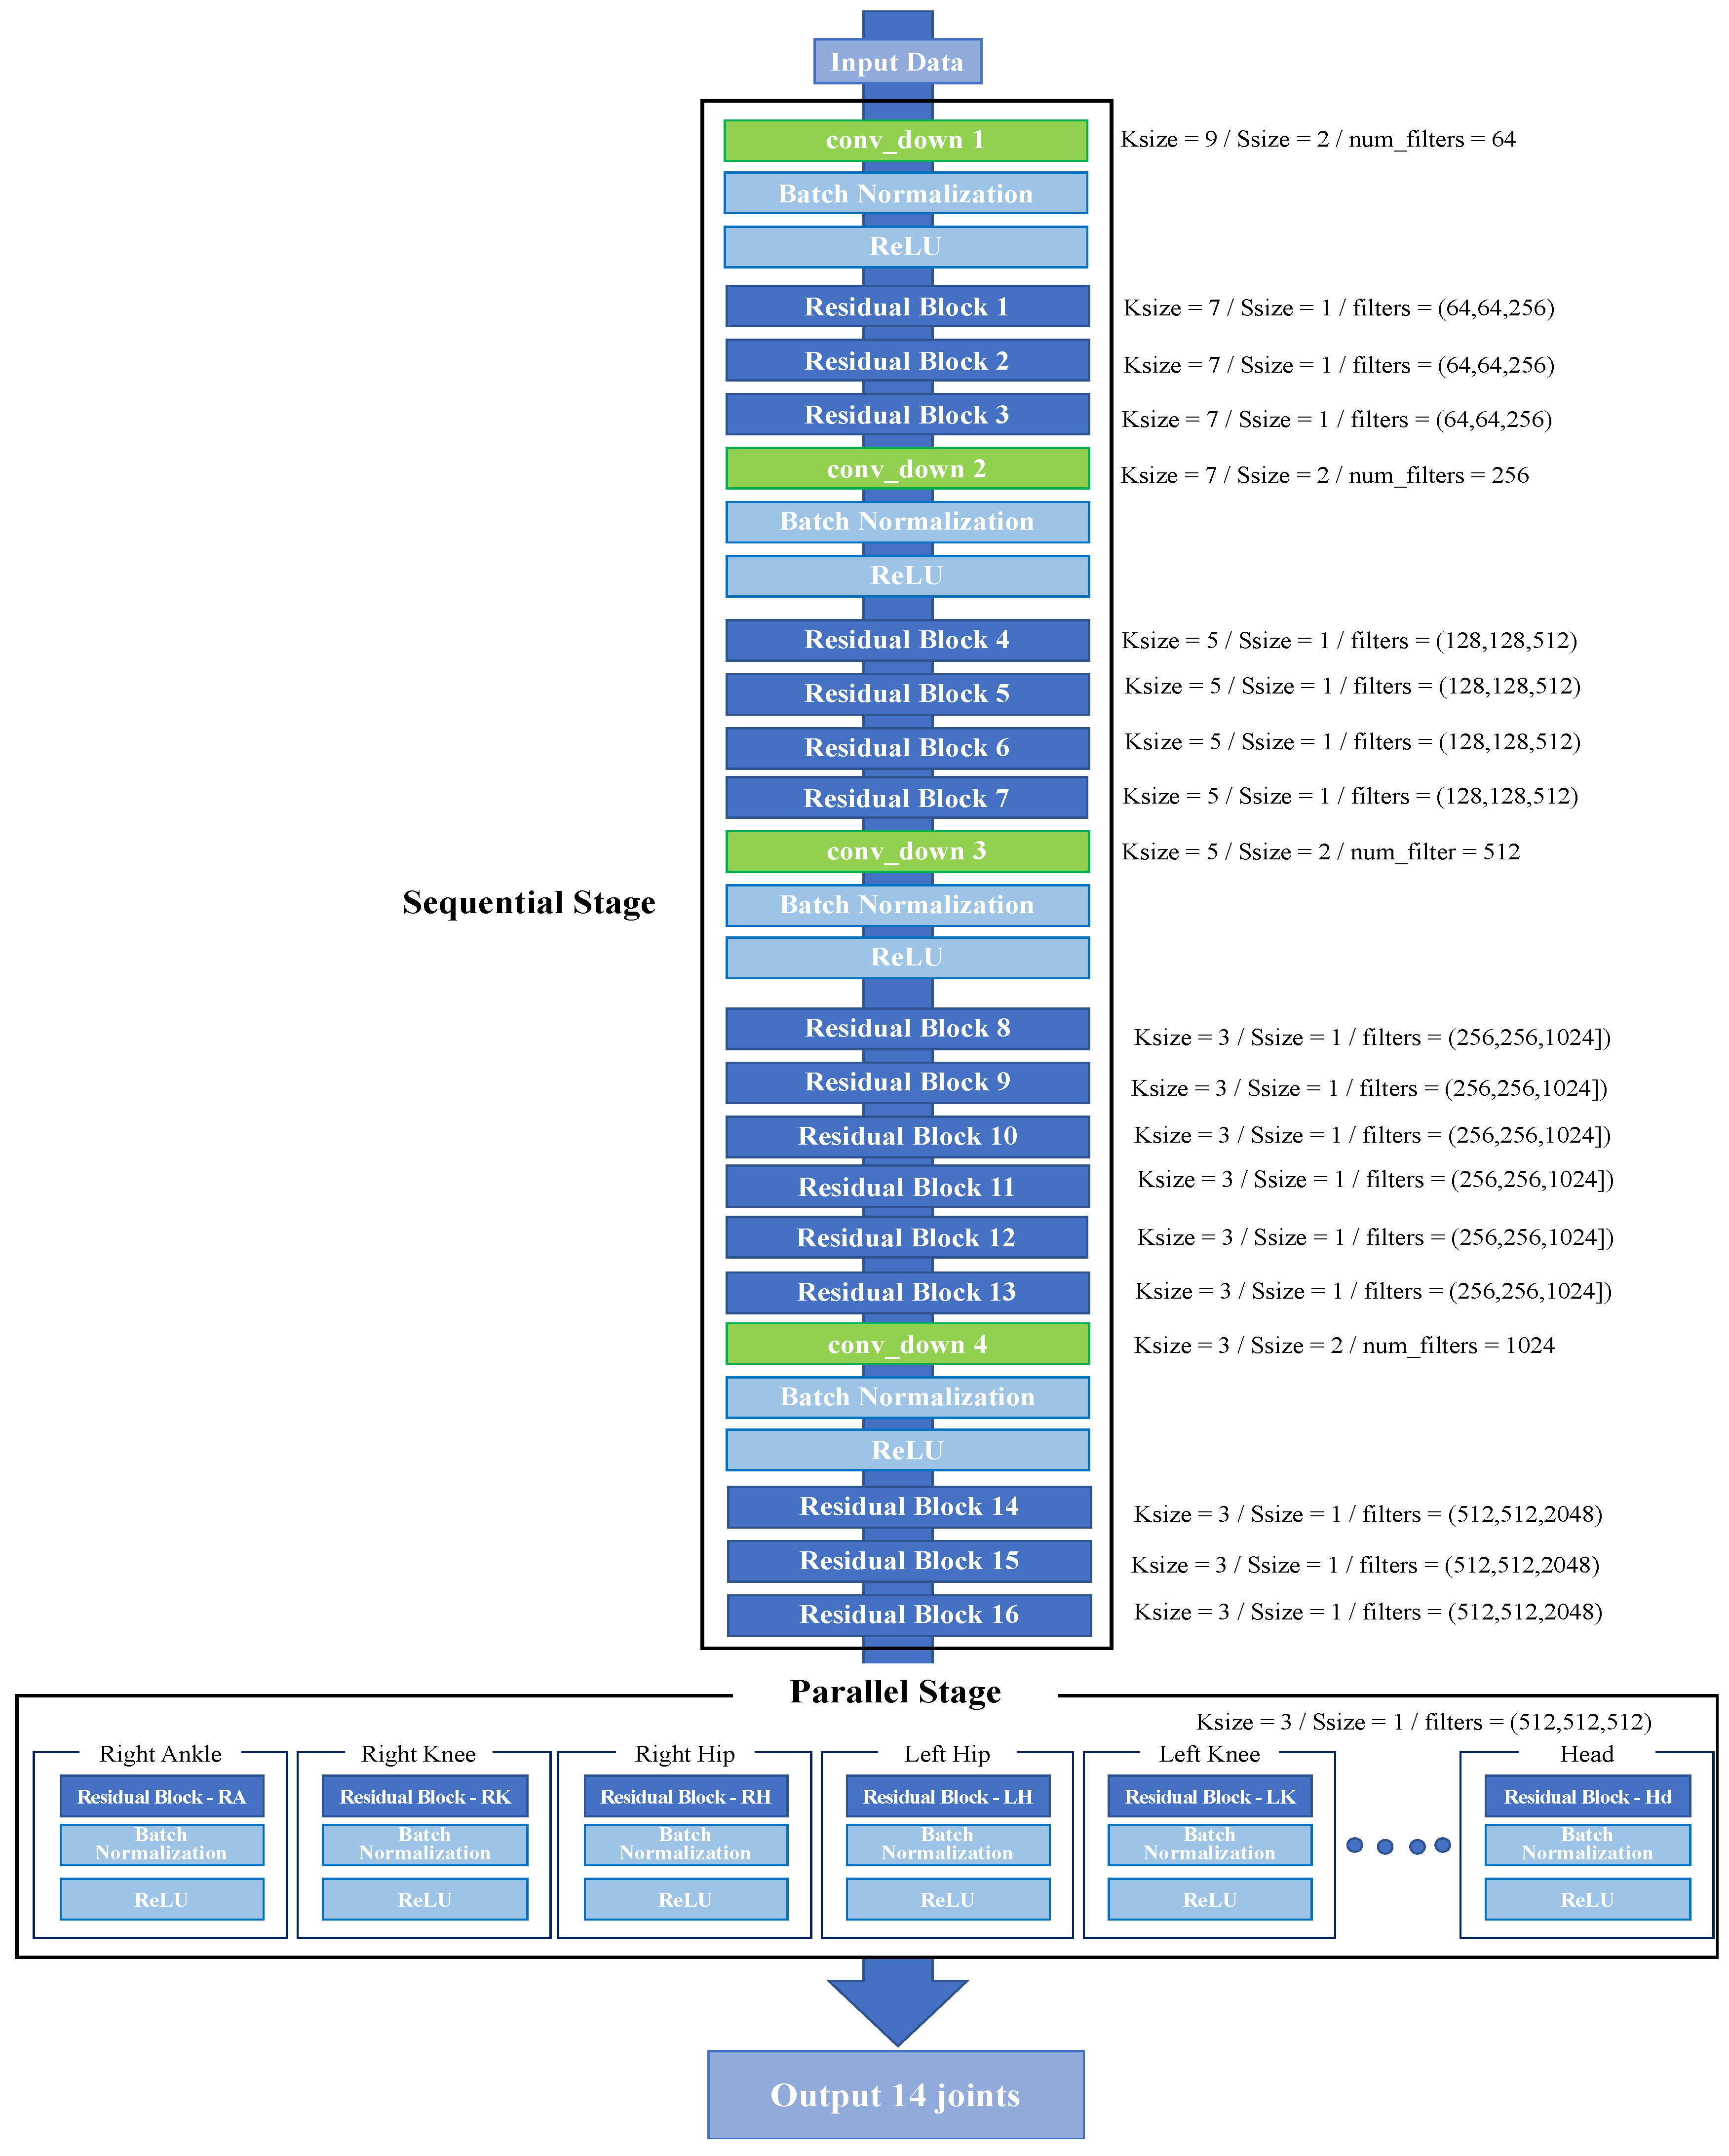
The deep residual network obtained using a combination of residual blocks in two stages is shown in
Figure 5. The sequential stage learns the whole image features sequentially, and the parallel stage independently estimates the coordinates of each of the 14 joints with 14 residual blocks. The sequential stage consists of four convolutional down-sampling (conv-down) layers and 16 residual blocks, and the sequence includes a conv-down layer and repeated multiple residual blocks. Parameters of the individual residual blocks and convolutional layers are denoted on the right side of
Figure 5. An input image passes through three residual blocks (1–3) after its spatial resolution is lowered by passing through the conv-down 1, BN, and ReLU stages. After passing through conv-down2, it goes through four residual blocks (4–7). Then, after passing through conv-down3, it goes through six residual blocks (8–13). Finally, after passing through conv-down 4, it goes through three residual blocks (14–16). The coordinates are then refined by going through residual blocks in parallel for each joint. As a result, the total parameter size is 1,734,490,260.
For the purpose of training, the proposed model was initialized with the Xavier initializer, and the Adadelta optimizer [
27] was used to minimize the Euclidean distances between the estimated joint coordinates and the true coordinates. The training was performed for 100 epochs, using a batch size of 45 and a learning rate of 0.01.
In the training of the model, the training data were augmented using various geometric transforms. Of the total 870 images, 696 images (80%) and joint coordinates were used for training, using stratified sampling that maintained the same proportion of each activity. After shuffling and pixel normalization, augmentation was performed with (1) rotation, (2) vertical flipping, and (3) random cropping. The rotation process increased the amount of training data by a factor of 11 by rotating an image by 5° at a time within the range of −30° to 30°, increasing twice using a vertical flip (flipping the left-hand and right-hand sides of an image around the center line of the image), and performing random cropping, by which an image with a person was scaled to various sizes and translations. To apply random cropping, a bounding box was set-up in an image including all human joint coordinates tightly. The four-sided gaps around the tight bounding box from the original image frame were divided into 50 equal intervals and defined as padding. A padded bounding box was generated by selecting a padding size between 1 and 25 intervals. Finally, a bounding box (Bbox) was applied to the augmented data by positioning the padded bounding box randomly between the space of the tight bounding box and the padded bounding box. Random cropping was performed before the training started, and the number of images was increased by a factor of 16. By using data augmentation, the number of training images was increased 352 times. Therefore, the augmented dataset included 696 × 352 = 244,992 images.
3.3. Analysis Metrics
To quantify the accuracy of the joint estimations, the mean squared error (MSE) and percentage of correct parts (PCP) were used to evaluate the joint coordinates and body part estimation, respectively. The MSE is defined as the mean of the squares of the distances between the estimated joint coordinates and the true joint coordinates, as shown in Equation (1):
where (
,
) and (
,
) are the estimated and true coordinates of the
ith joint, respectively, and n is the number of joints which is 14 in this model.
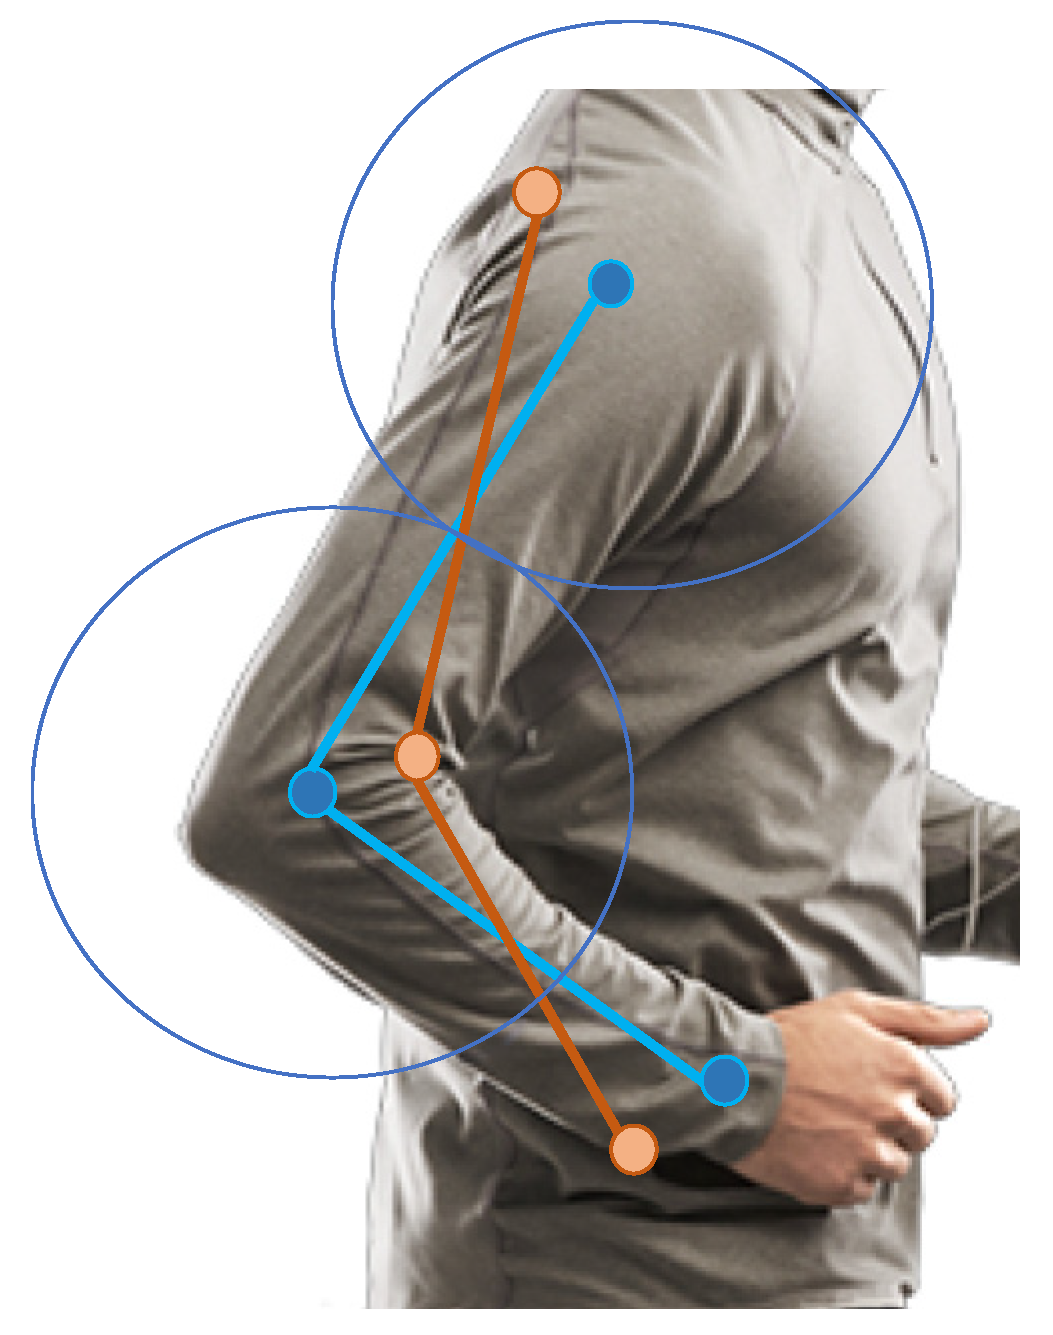
PCP is a method proposed by Eichner et al. [
28] that is used as a metric to evaluate the estimation accuracy of body parts such as the torso and limbs. The estimated position of a body part is considered correct when the errors for the joint coordinates at both ends of the body part are smaller than a predetermined threshold. The blue dots and lines in
Figure 6 represent the true joints and body parts, respectively. Orange dots and lines represent estimated joints and body parts, respectively. Typically, the threshold is set to half of the length of the body part of interest. For example, in
Figure 6, the upper arm is correctly estimated, because the estimated right shoulder and elbow positions are within the threshold ranges (shown by circles). Thus, in this study, the PCP was assumed to indicate that an estimated coordinate was correct if |Estimated joint coordinates—ground-truth joint coordinates| < (length of limb) / 2.
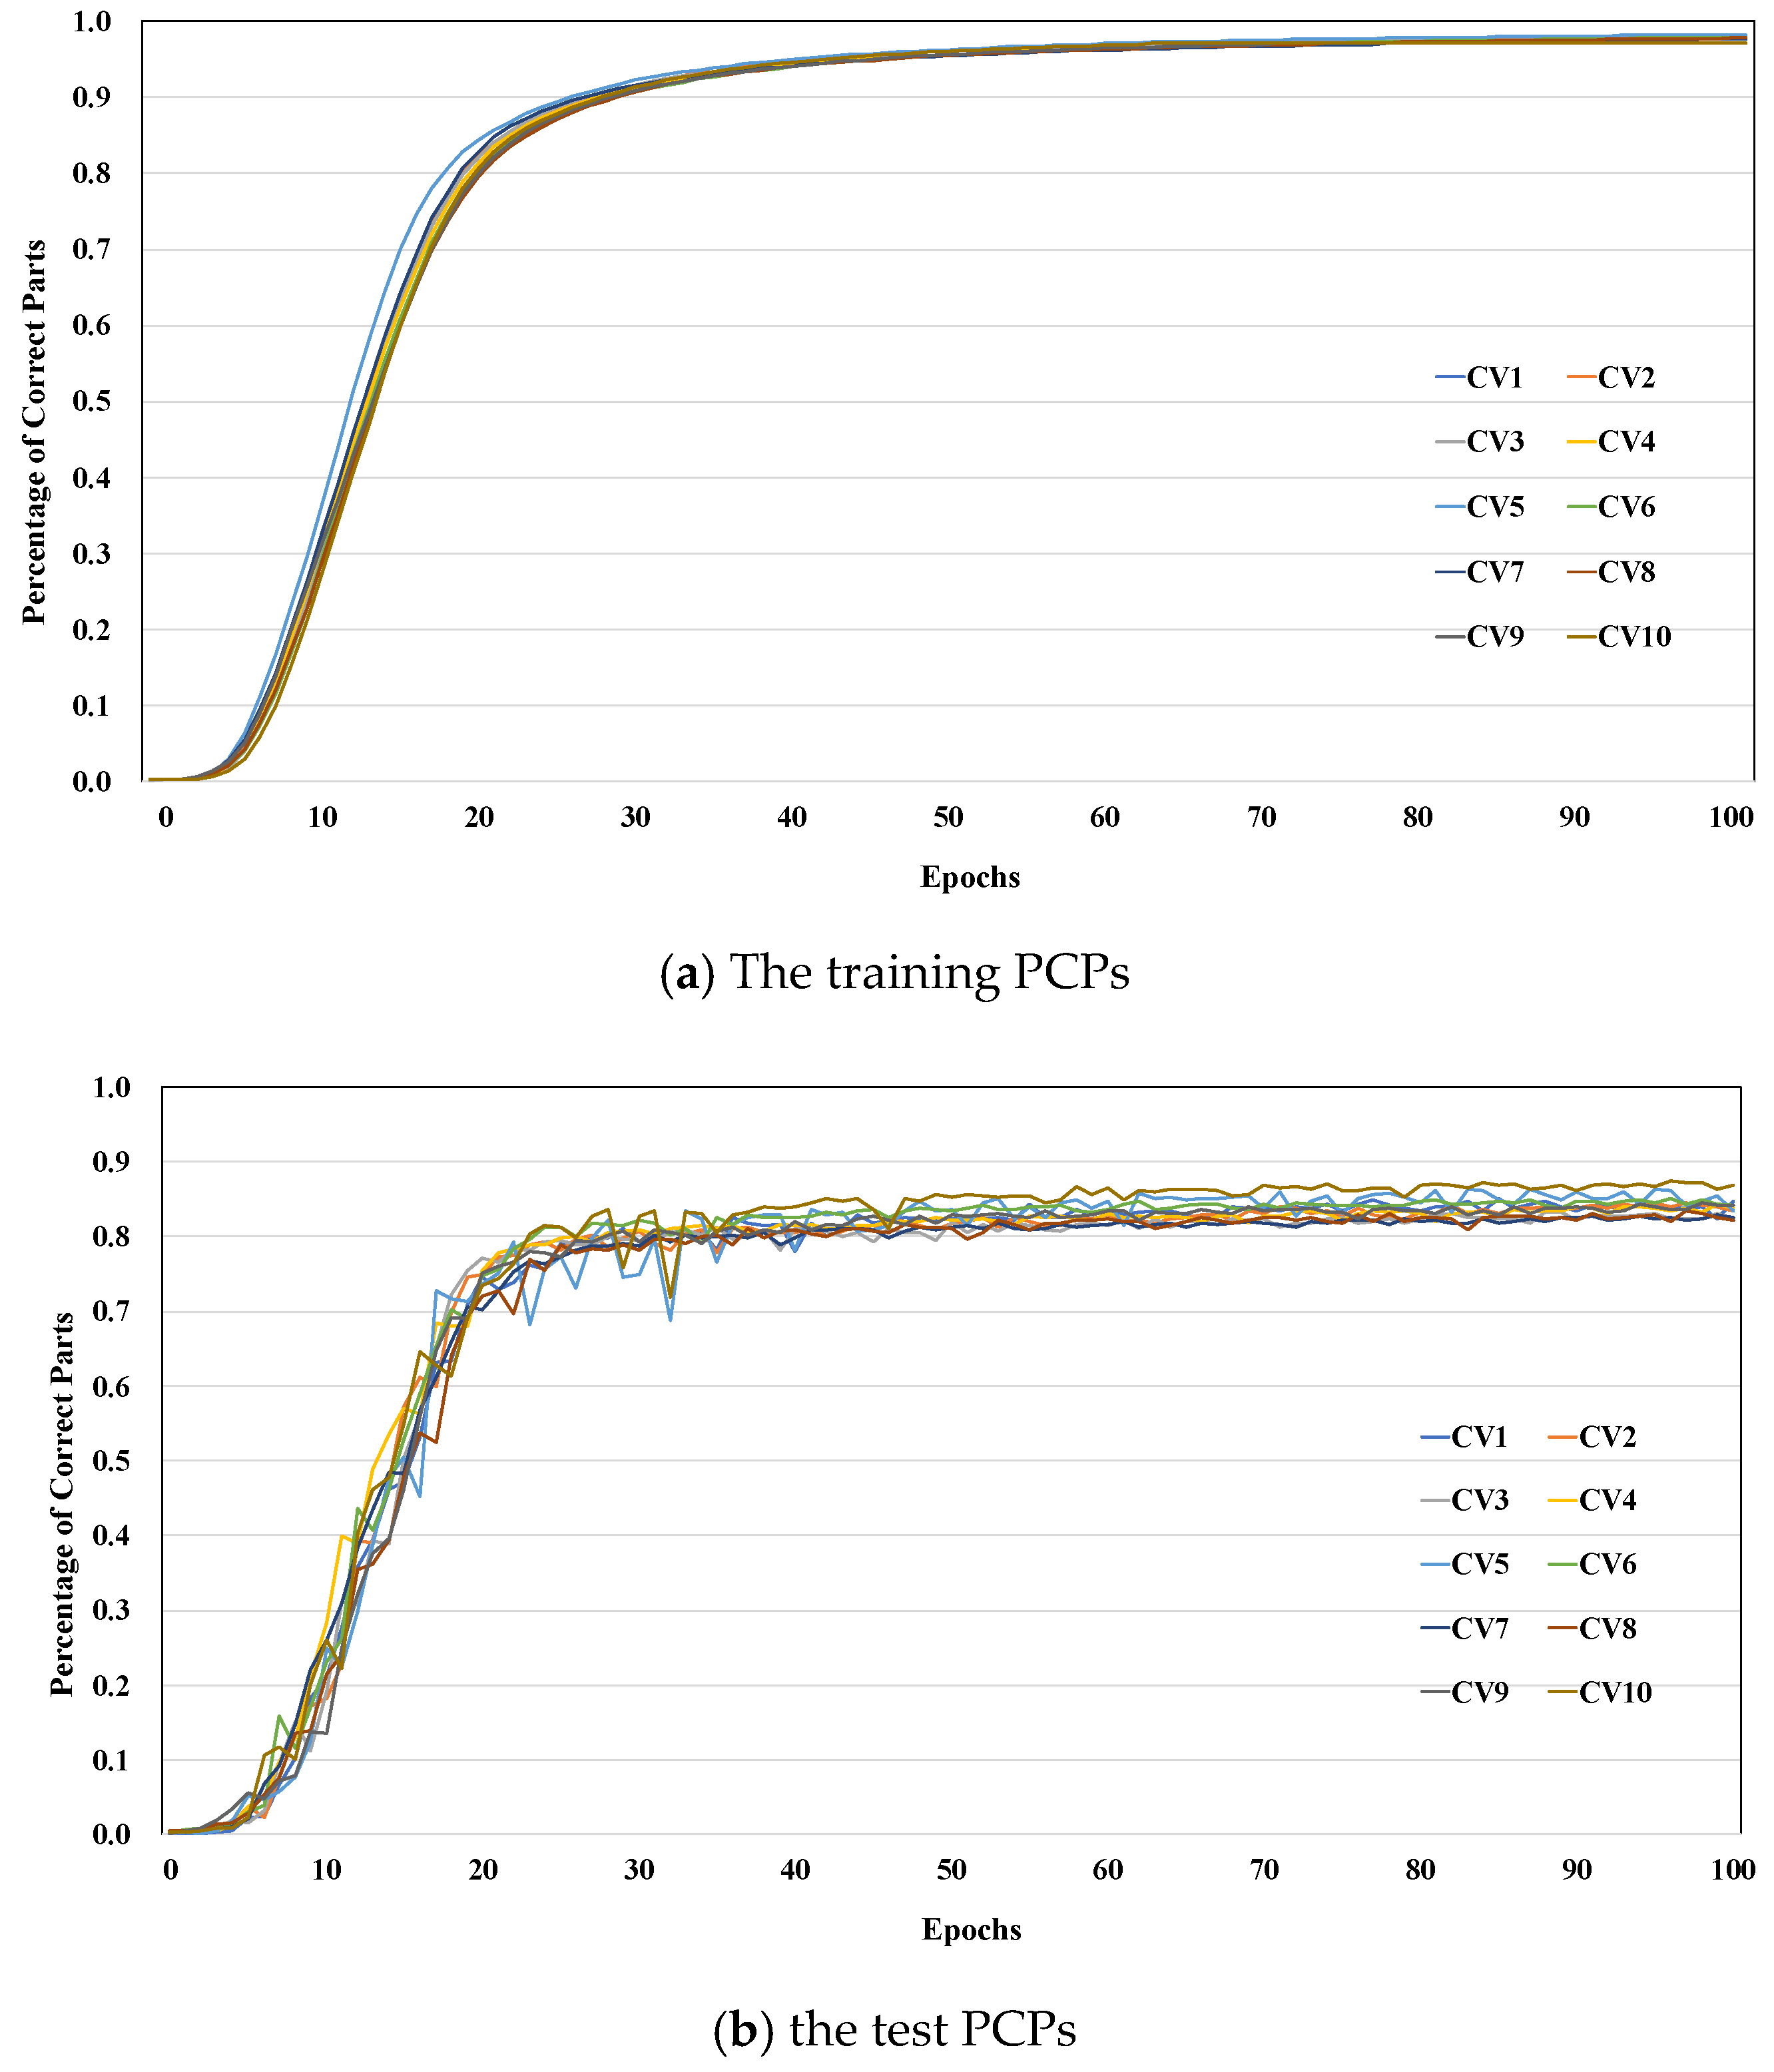
The MSE and PCP were measured using 10 cross-validations. For each cross-validation, the indoor dataset was randomly partitioned into training (80%) and test sets (20%) for the fixed activity ratios.
5. Conclusions
In this study, a DNN model for estimating joints location in various indoor activities was developed and analyzed. The model was trained with images of indoor activities and estimated human joint coordinates. The accuracy of the proposed model was then assessed, and the following conclusions could be drawn.
The proposed DNN uses a large number of layers to learn complex human poses images effectively. Shortcut connections in the residual block make it possible to efficiently train the model within only 100 epochs. In the first stage of the model, residual blocks are connected sequentially to learn progressively more complex features of indoor activities. In the second stage, 14 branches of residual blocks independently estimate 14 individual joints, encouraging fine-tuning of joint estimation.
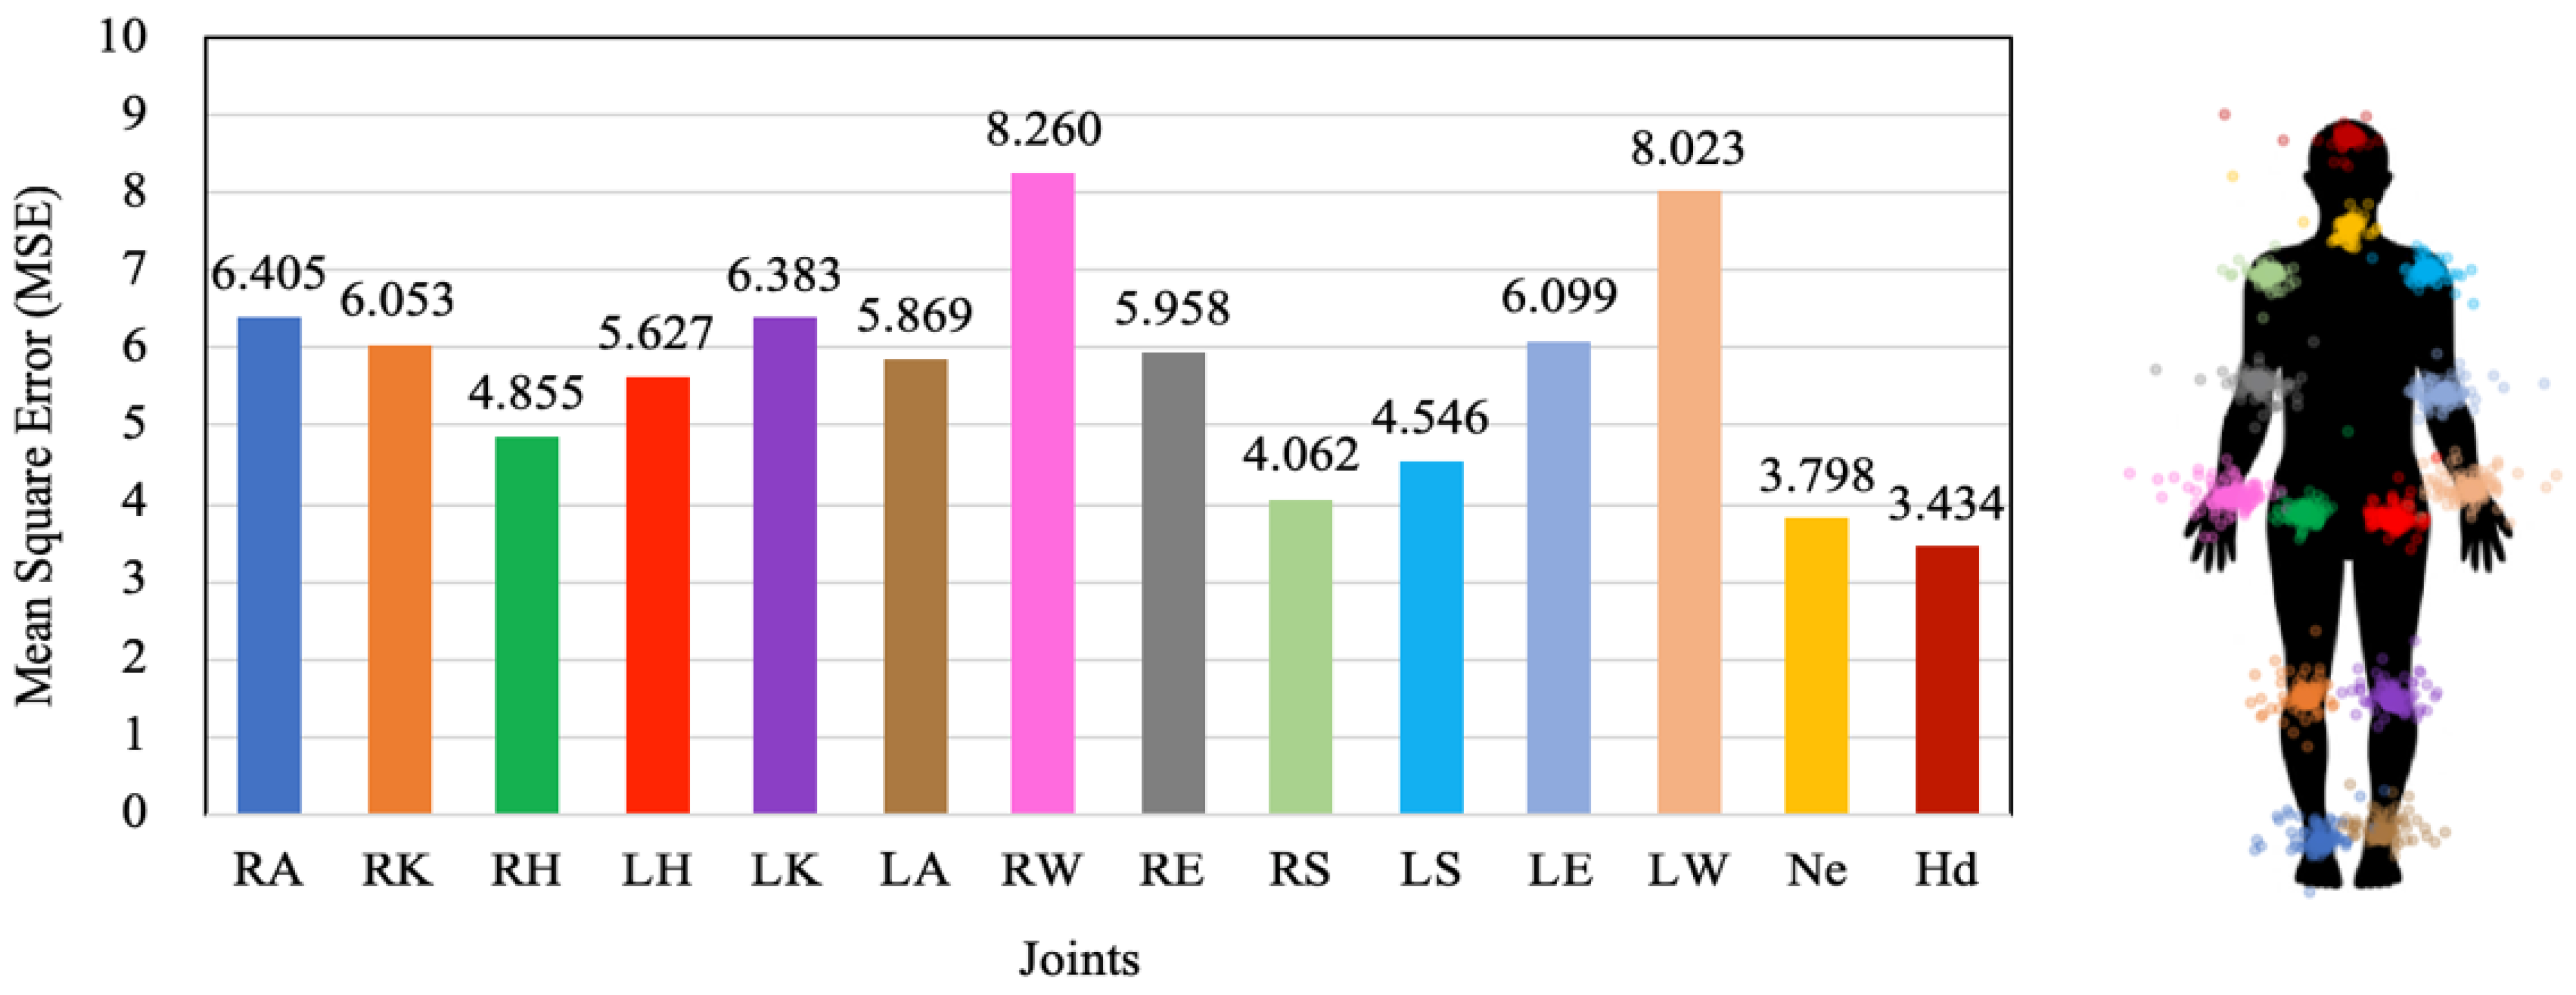
The accuracy of joint estimation indicated that the MSEs tended to increase as the joint’s distance from the torso increased. The MSE of the neck was lowest, while that of the left wrist was highest. The MSEs of the arms were higher than those of the legs. Because the arms exhibit more diverse poses, the range of movement is large; by contrast, legs exhibit smaller variations in poses, which results in a lower estimation error.
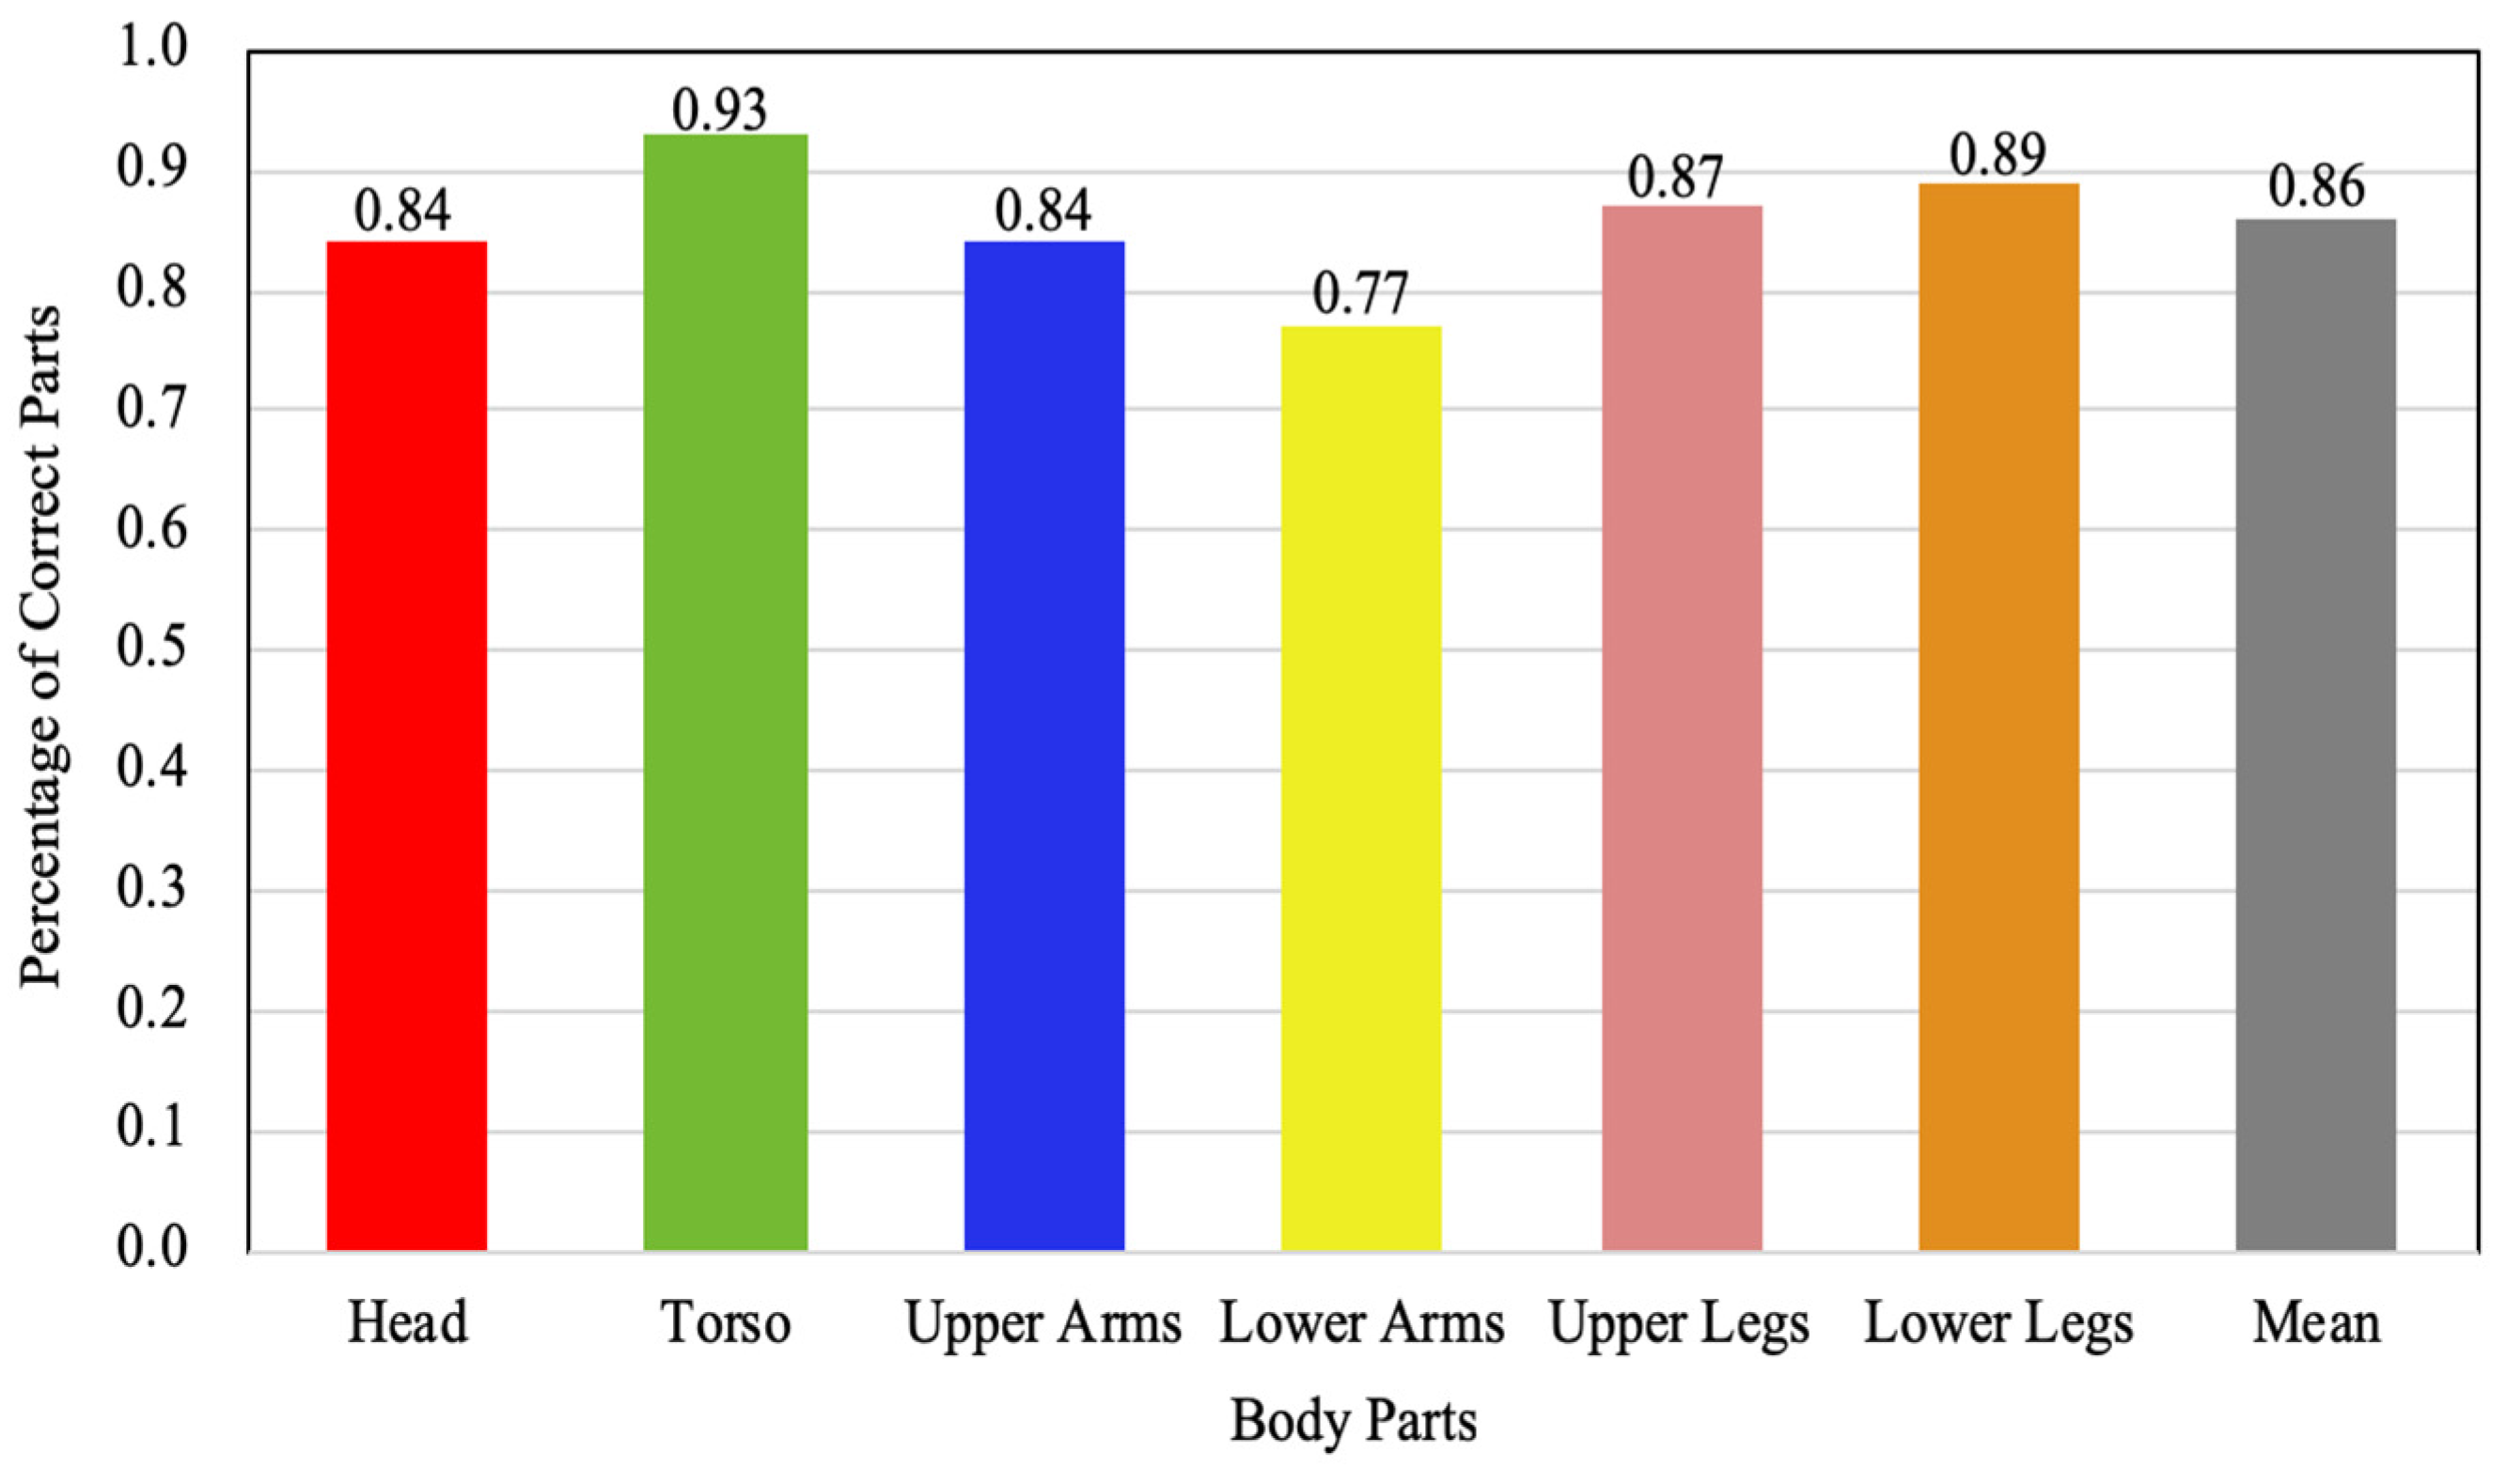
PCPs were calculated for body parts. The PCP of the torso was highest (0.93). The PCPs of the arms were low because the range of movement was larger than that of the legs. The lower legs had larger PCP values than the upper legs for sitting activities. Activity estimation accuracy varied for different activities. While the overall average PCP for the 10 activities was 0.86, the PCPs of individual activities ranged from 0.77 to 0.93. Accuracies were higher for relatively still activities but lower for activities involving wide ranges of arm or leg motions.
In this study, it was confirmed that joint coordinates can be estimated from indoor activity images by the developed DNN model, which could be applied for indoor activity prediction. The identification of indoor activity is applied to the metabolic rate estimation, which enables PMV-based thermal environment control. As a result, it not only provides a comfortable thermal environment, but also improves the health and quality of life of the occupants.
The developed model is currently trained with only 10 types of indoor activities; follow-up studies, however, will be conducted to expand the range of indoor activities and increase the size of the dataset in order to estimate various activities that might occur in the real environment. In addition, the DNN model can be re-trained with activity image data of occupants in the actual building, so that a personalized environment can be provided by adapting to the new environment.
In order to improve the estimation performance of the current model, which instantly outputs joint information from the image, an activity determination algorithm [
18] will be combined with the current model. The algorithm determines the representative activity and the activity intensity by computing the frequency of the estimation outputs from the model over a certain period of time. From this, the performance of estimating the metabolic rate in the actual building can be improved by compensating errors from the model and recognizing the intensity of activity. Another interesting direction for the future work would be to integrate an object detection model with the DNN model to improve the estimation accuracy by recognizing objects and inferring the human pose obscured by objects. Moreover, continuous efforts for model improvement should be carried out such as using information on three-dimensional images or estimating activities of multiple people. By supplementing these techniques for the performance enhancement of the model, it will be improved into an advanced model with high applicability to actual buildings.


