
Kinetic Parameters of Nut Shells Pyrolysis


Abstract

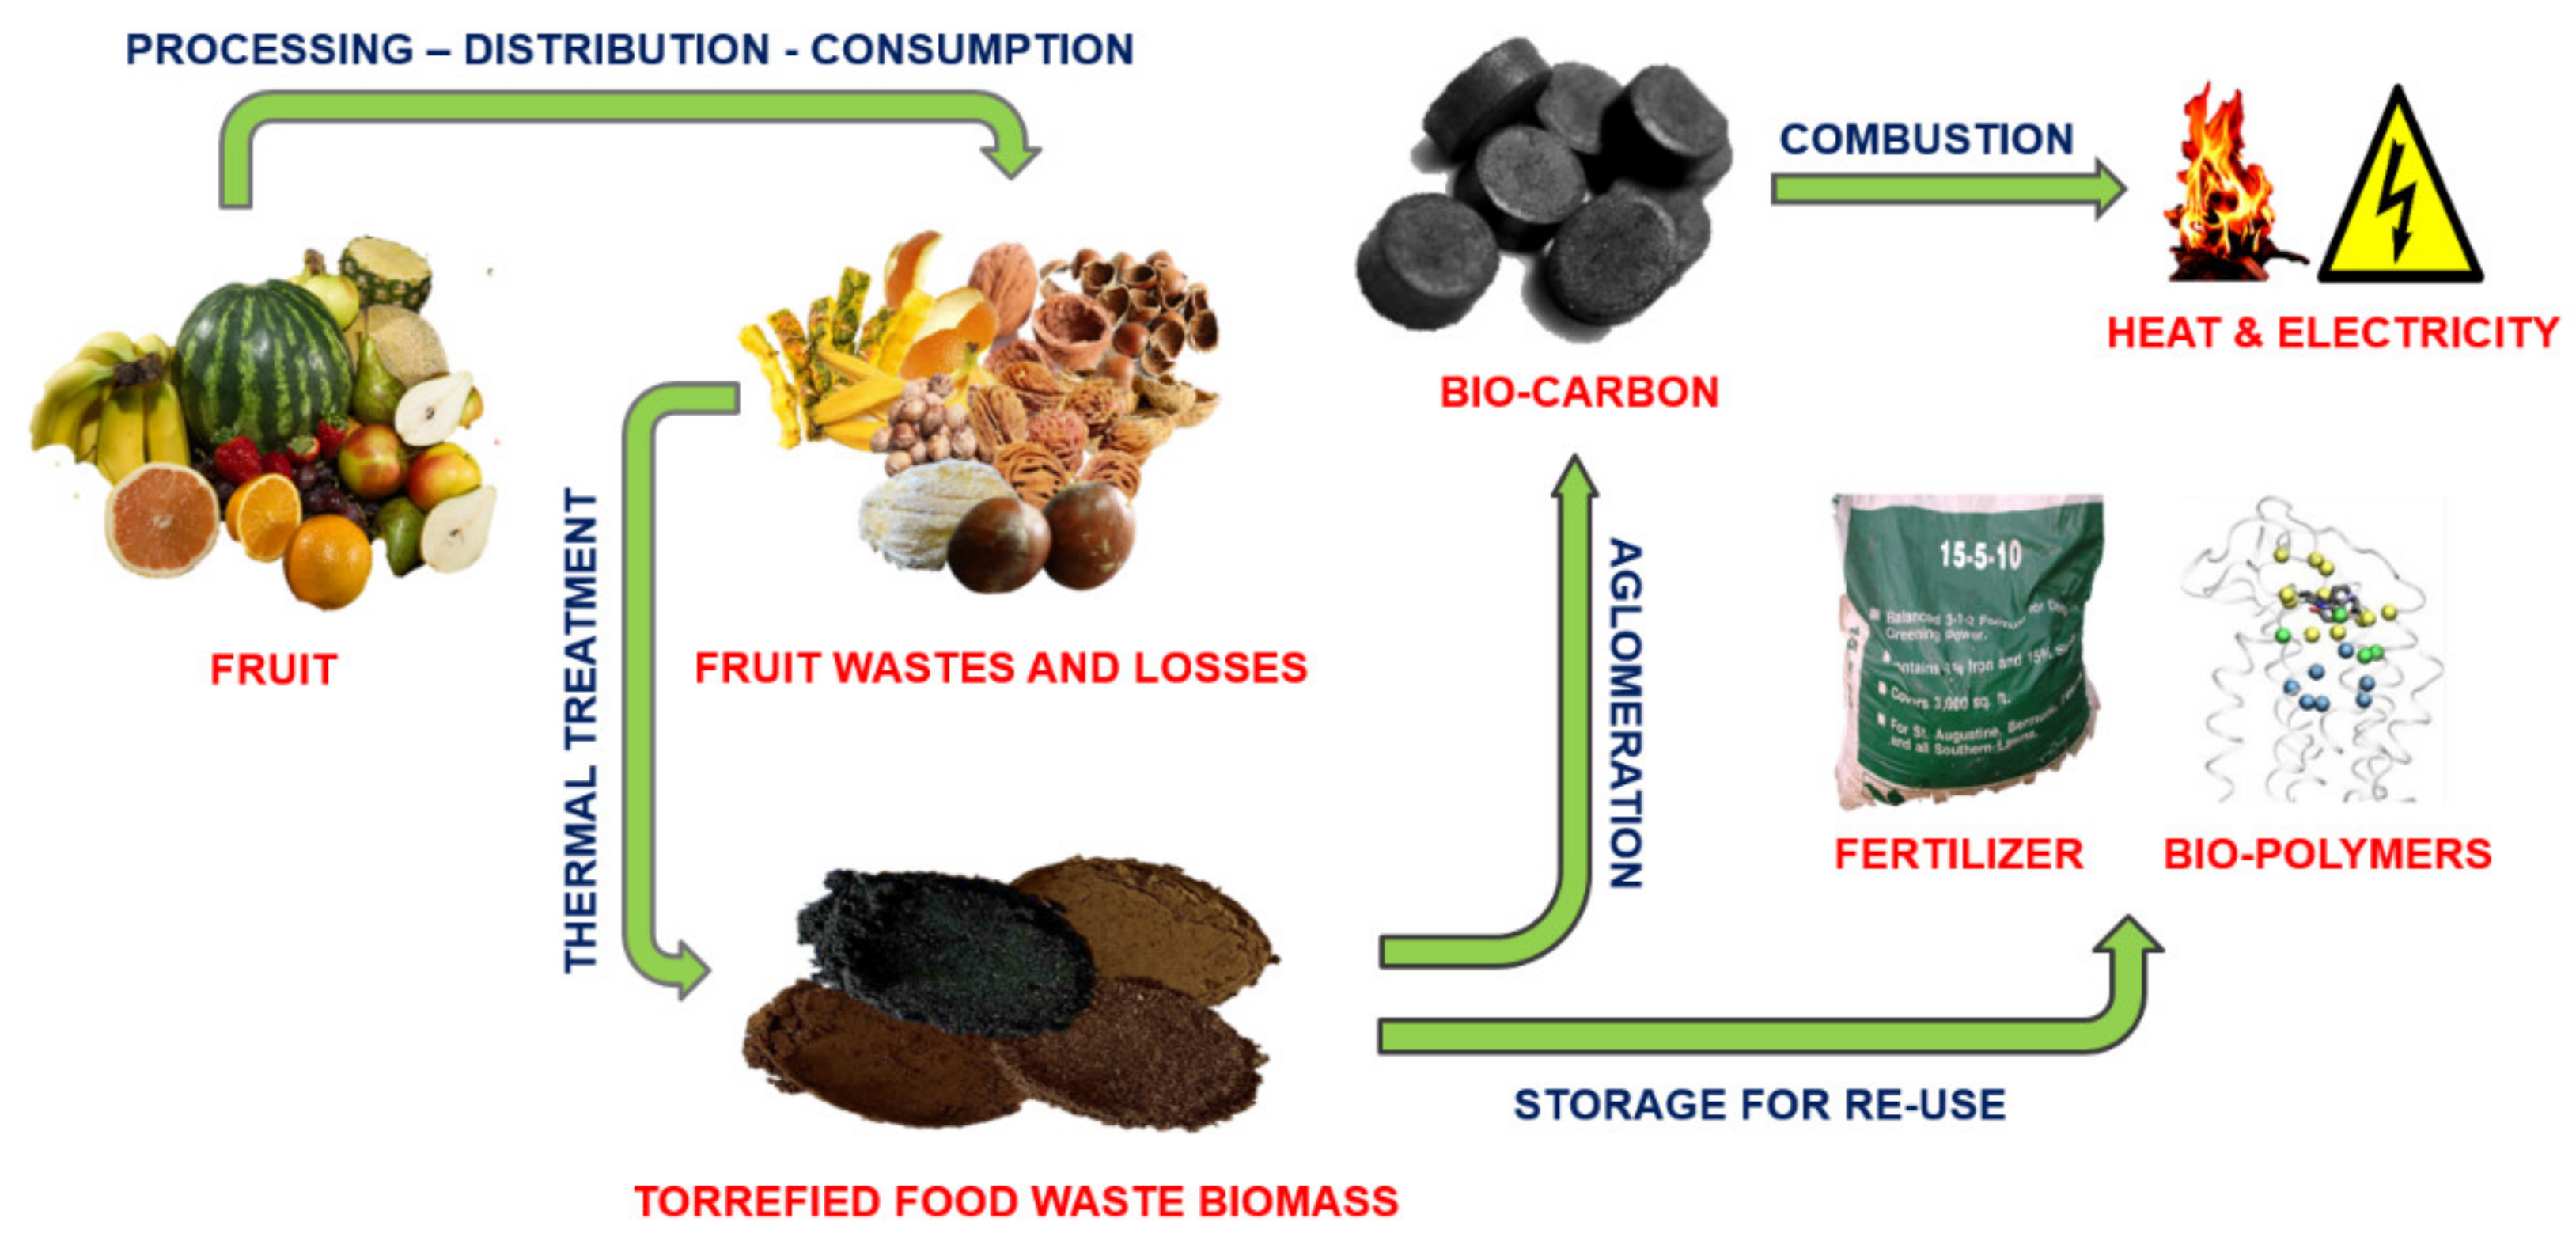
1. Introduction
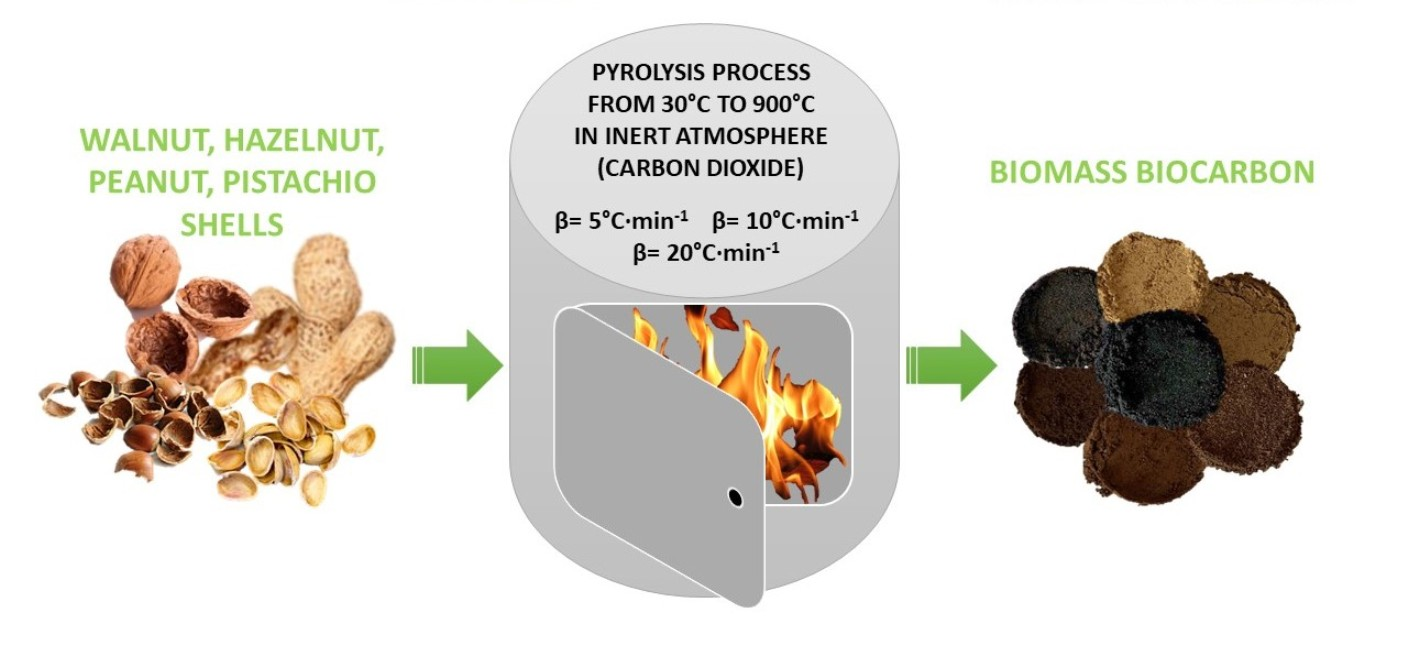
2. Materials and Methods
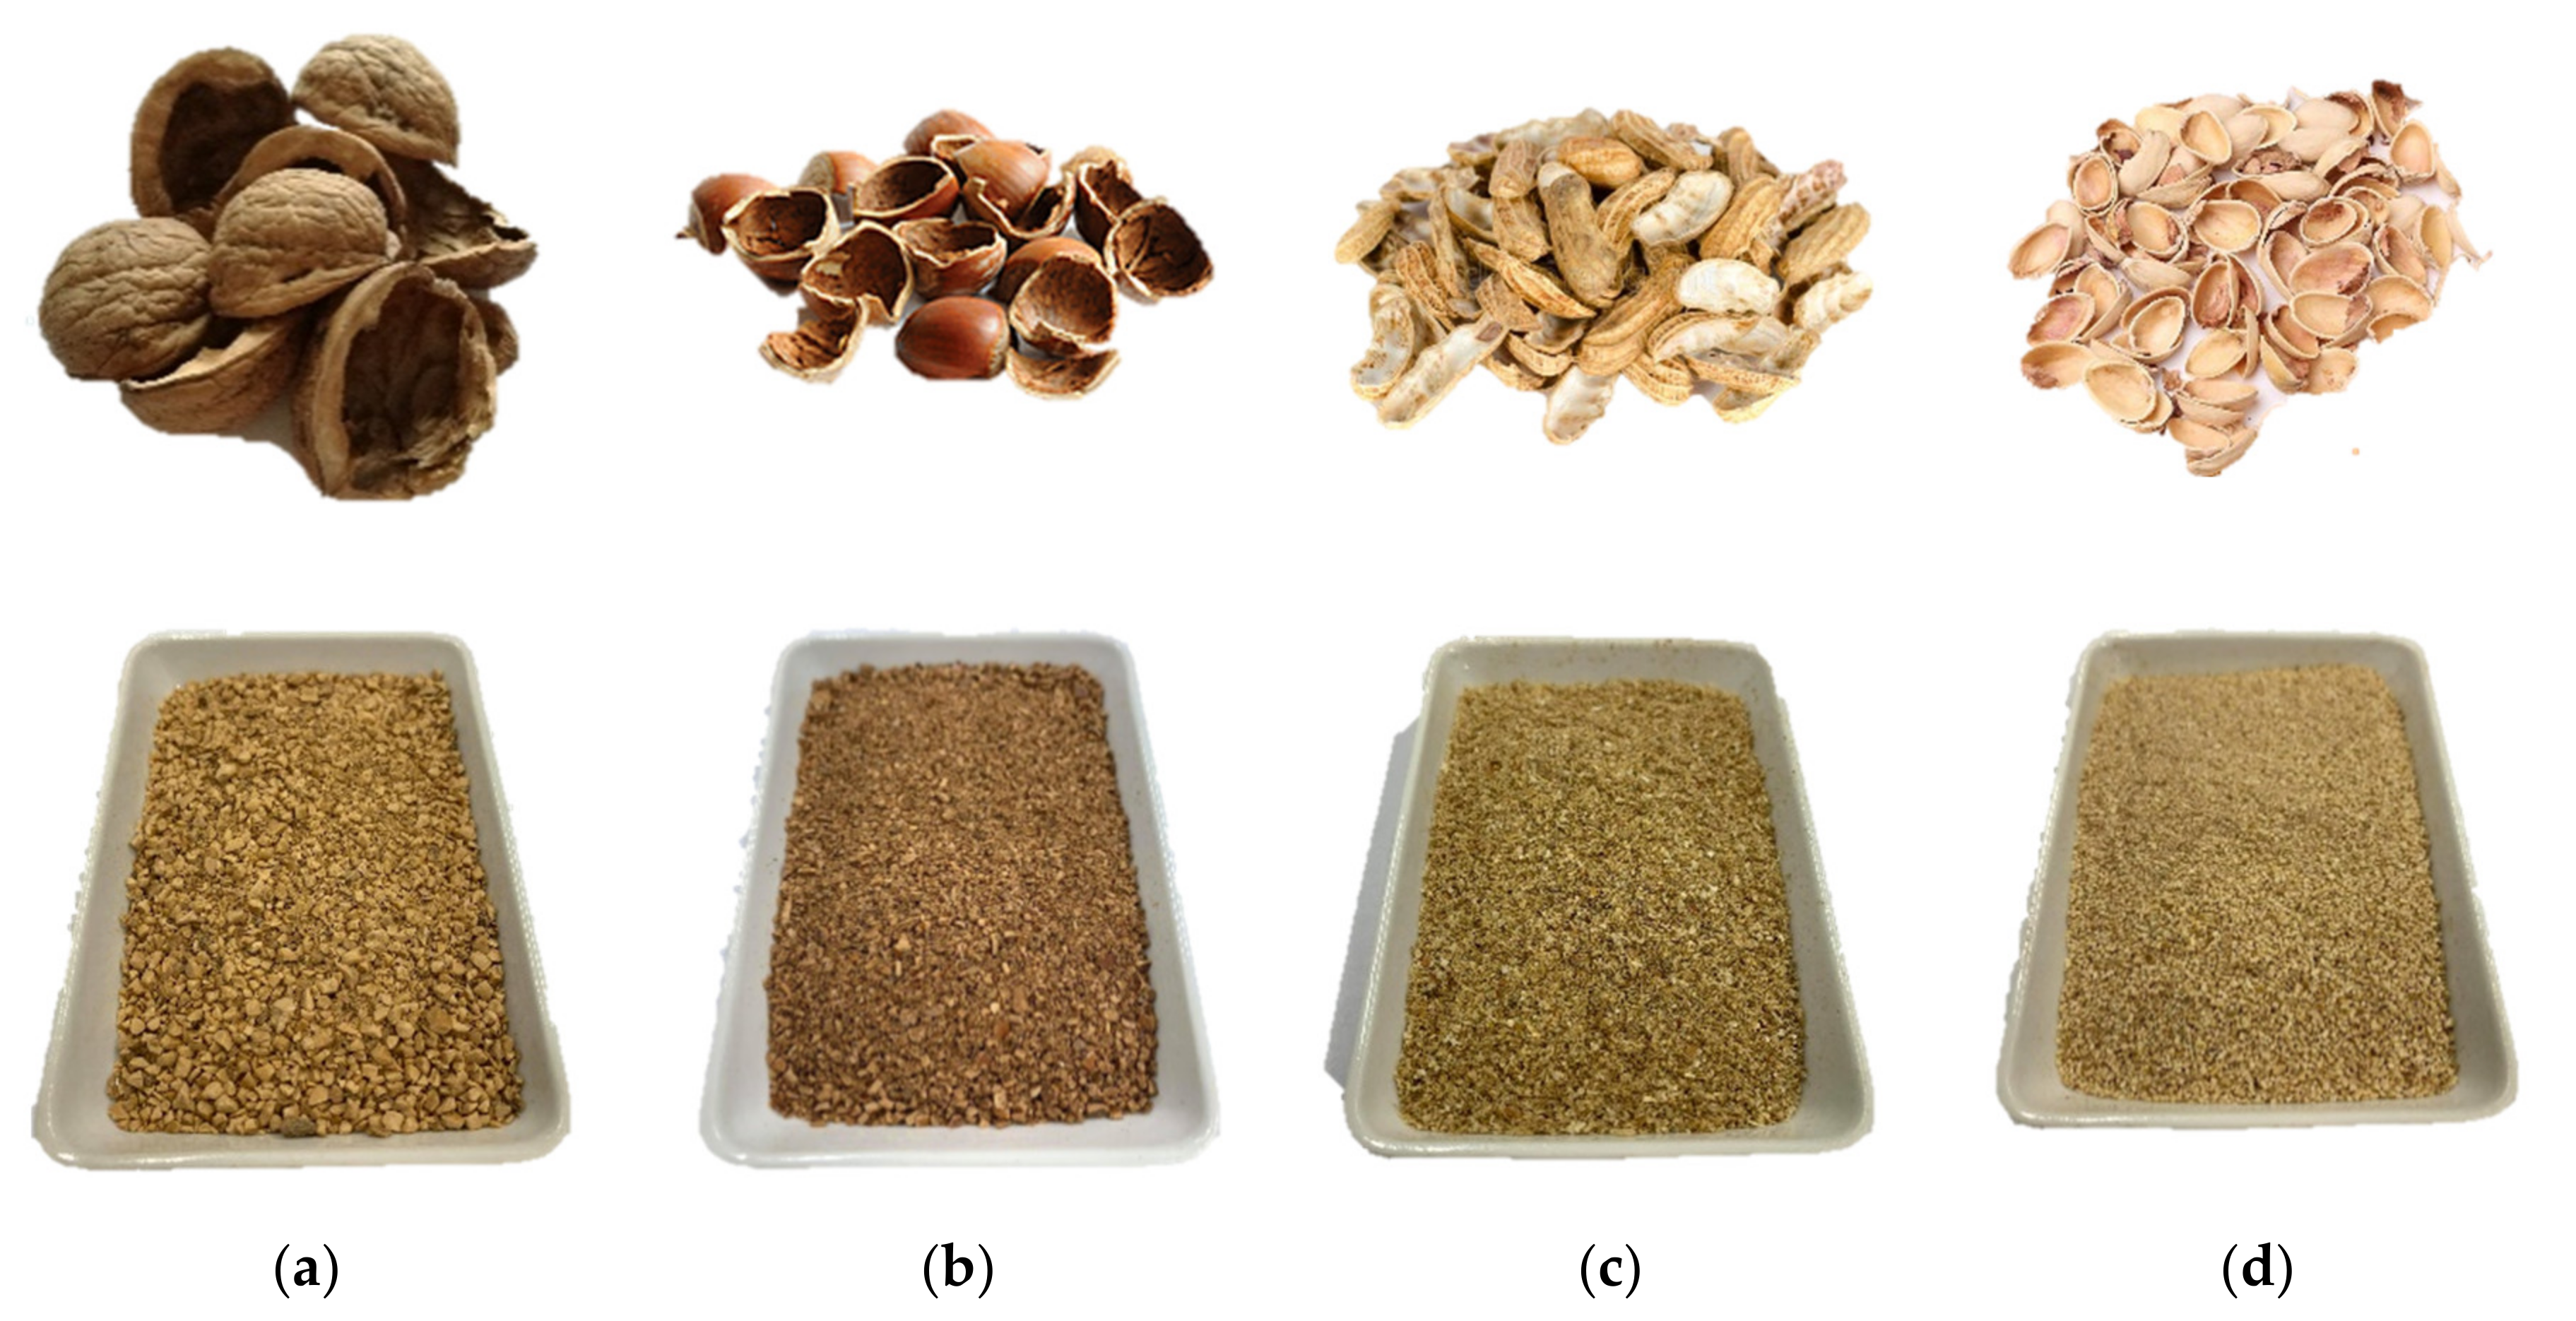
2.1. Characteristic of the Materials Used in the Research
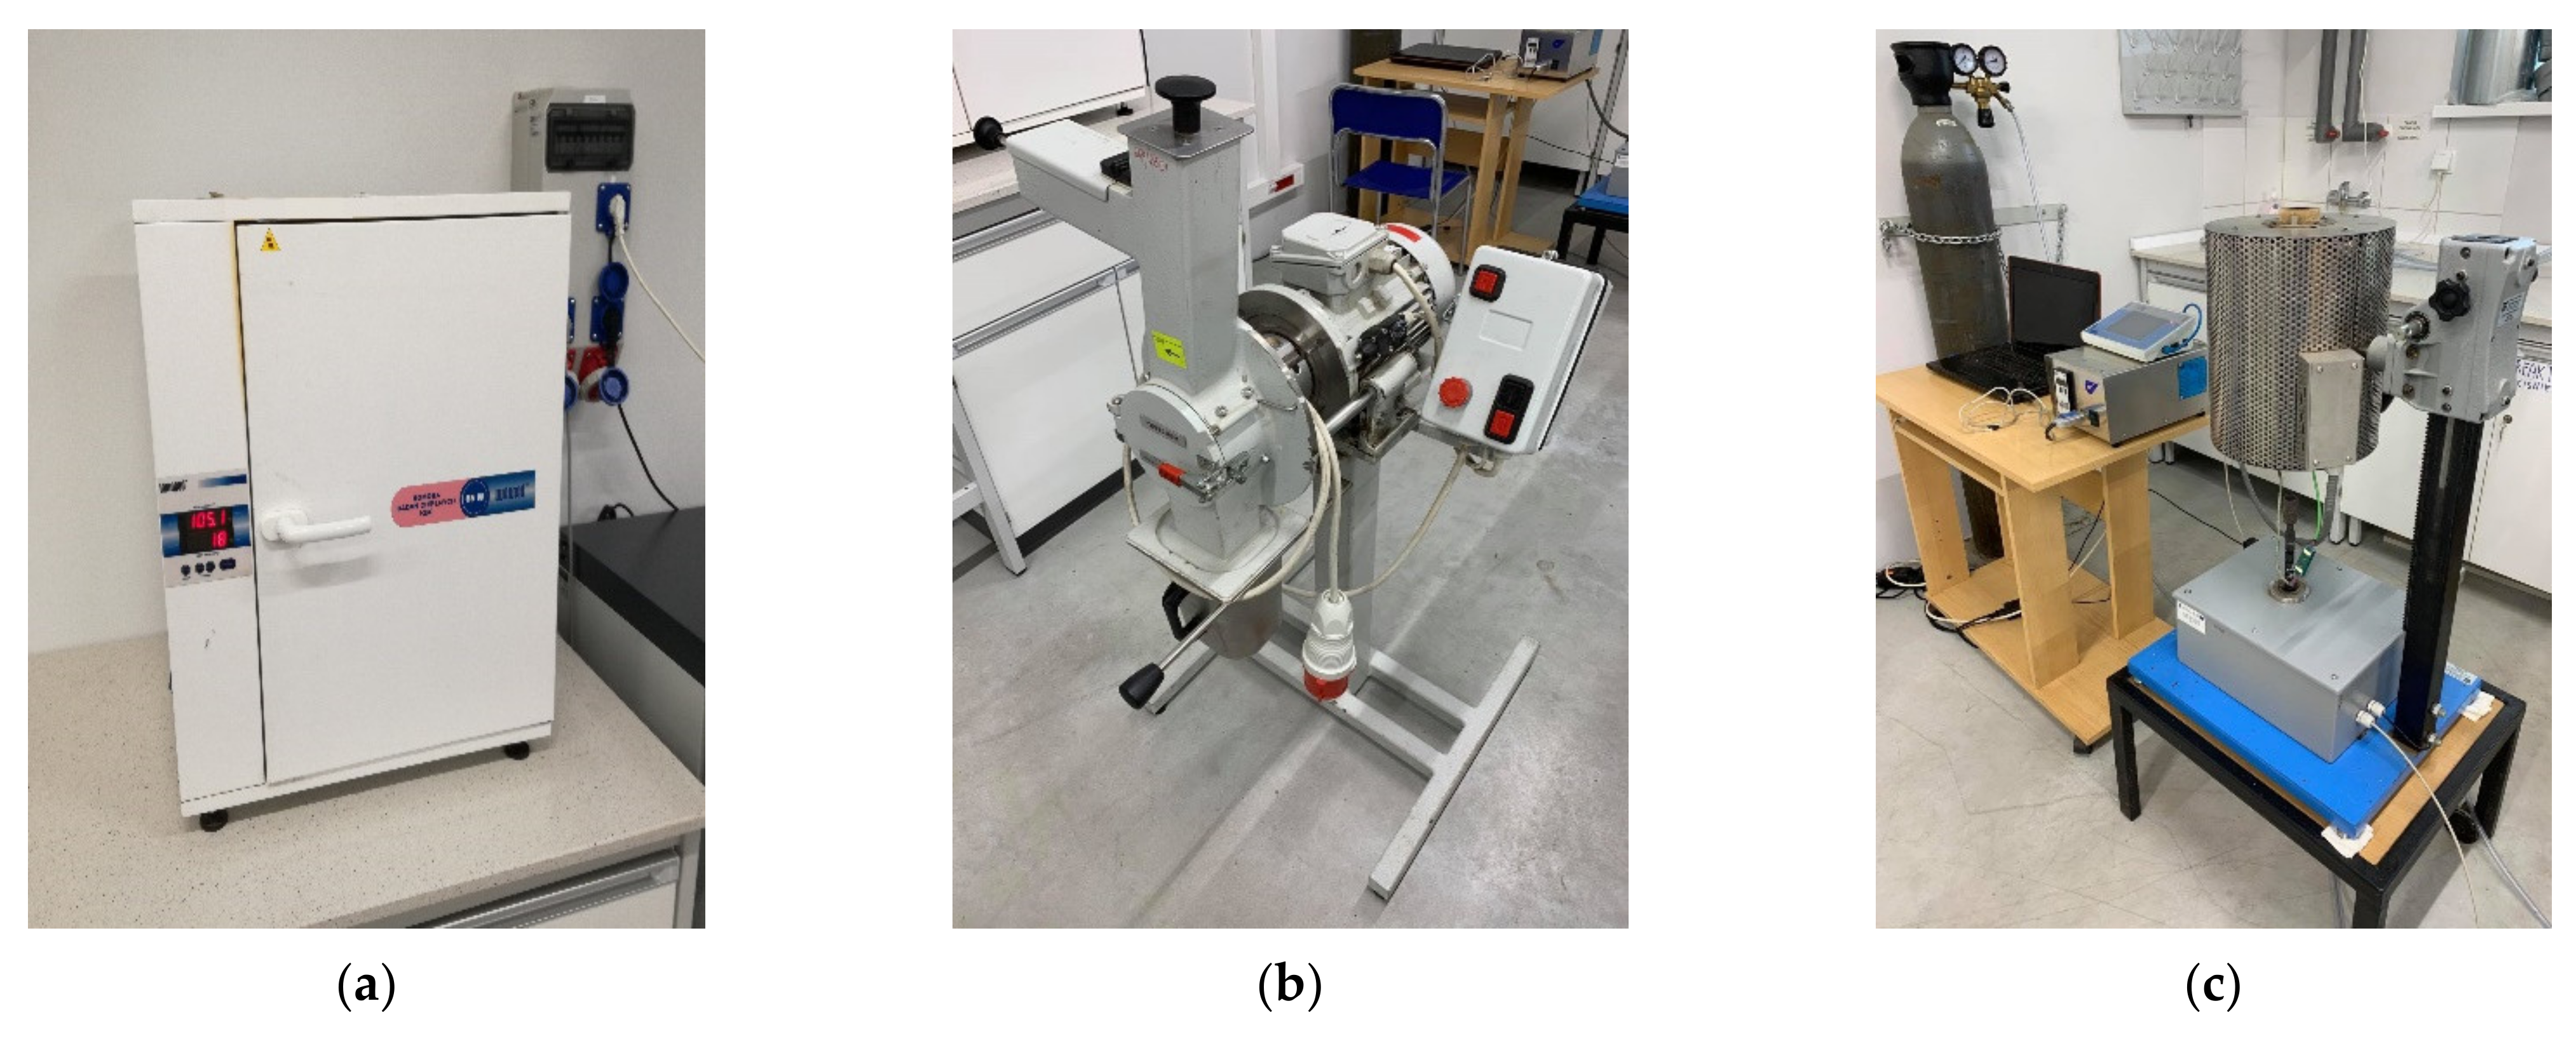
2.2. Thermogravimetric Analysis
2.3. Kinetic Modelling
| Raw biomass | → | Biochar | + | Pyrolysis gases |
| (solid fraction) | (solid fraction) | (volatile fraction) |
2.4. Model-Fitting Method: Coats–Redfern Method
3. Results and Discussion
3.1. Proximate and Ultimate Analysis
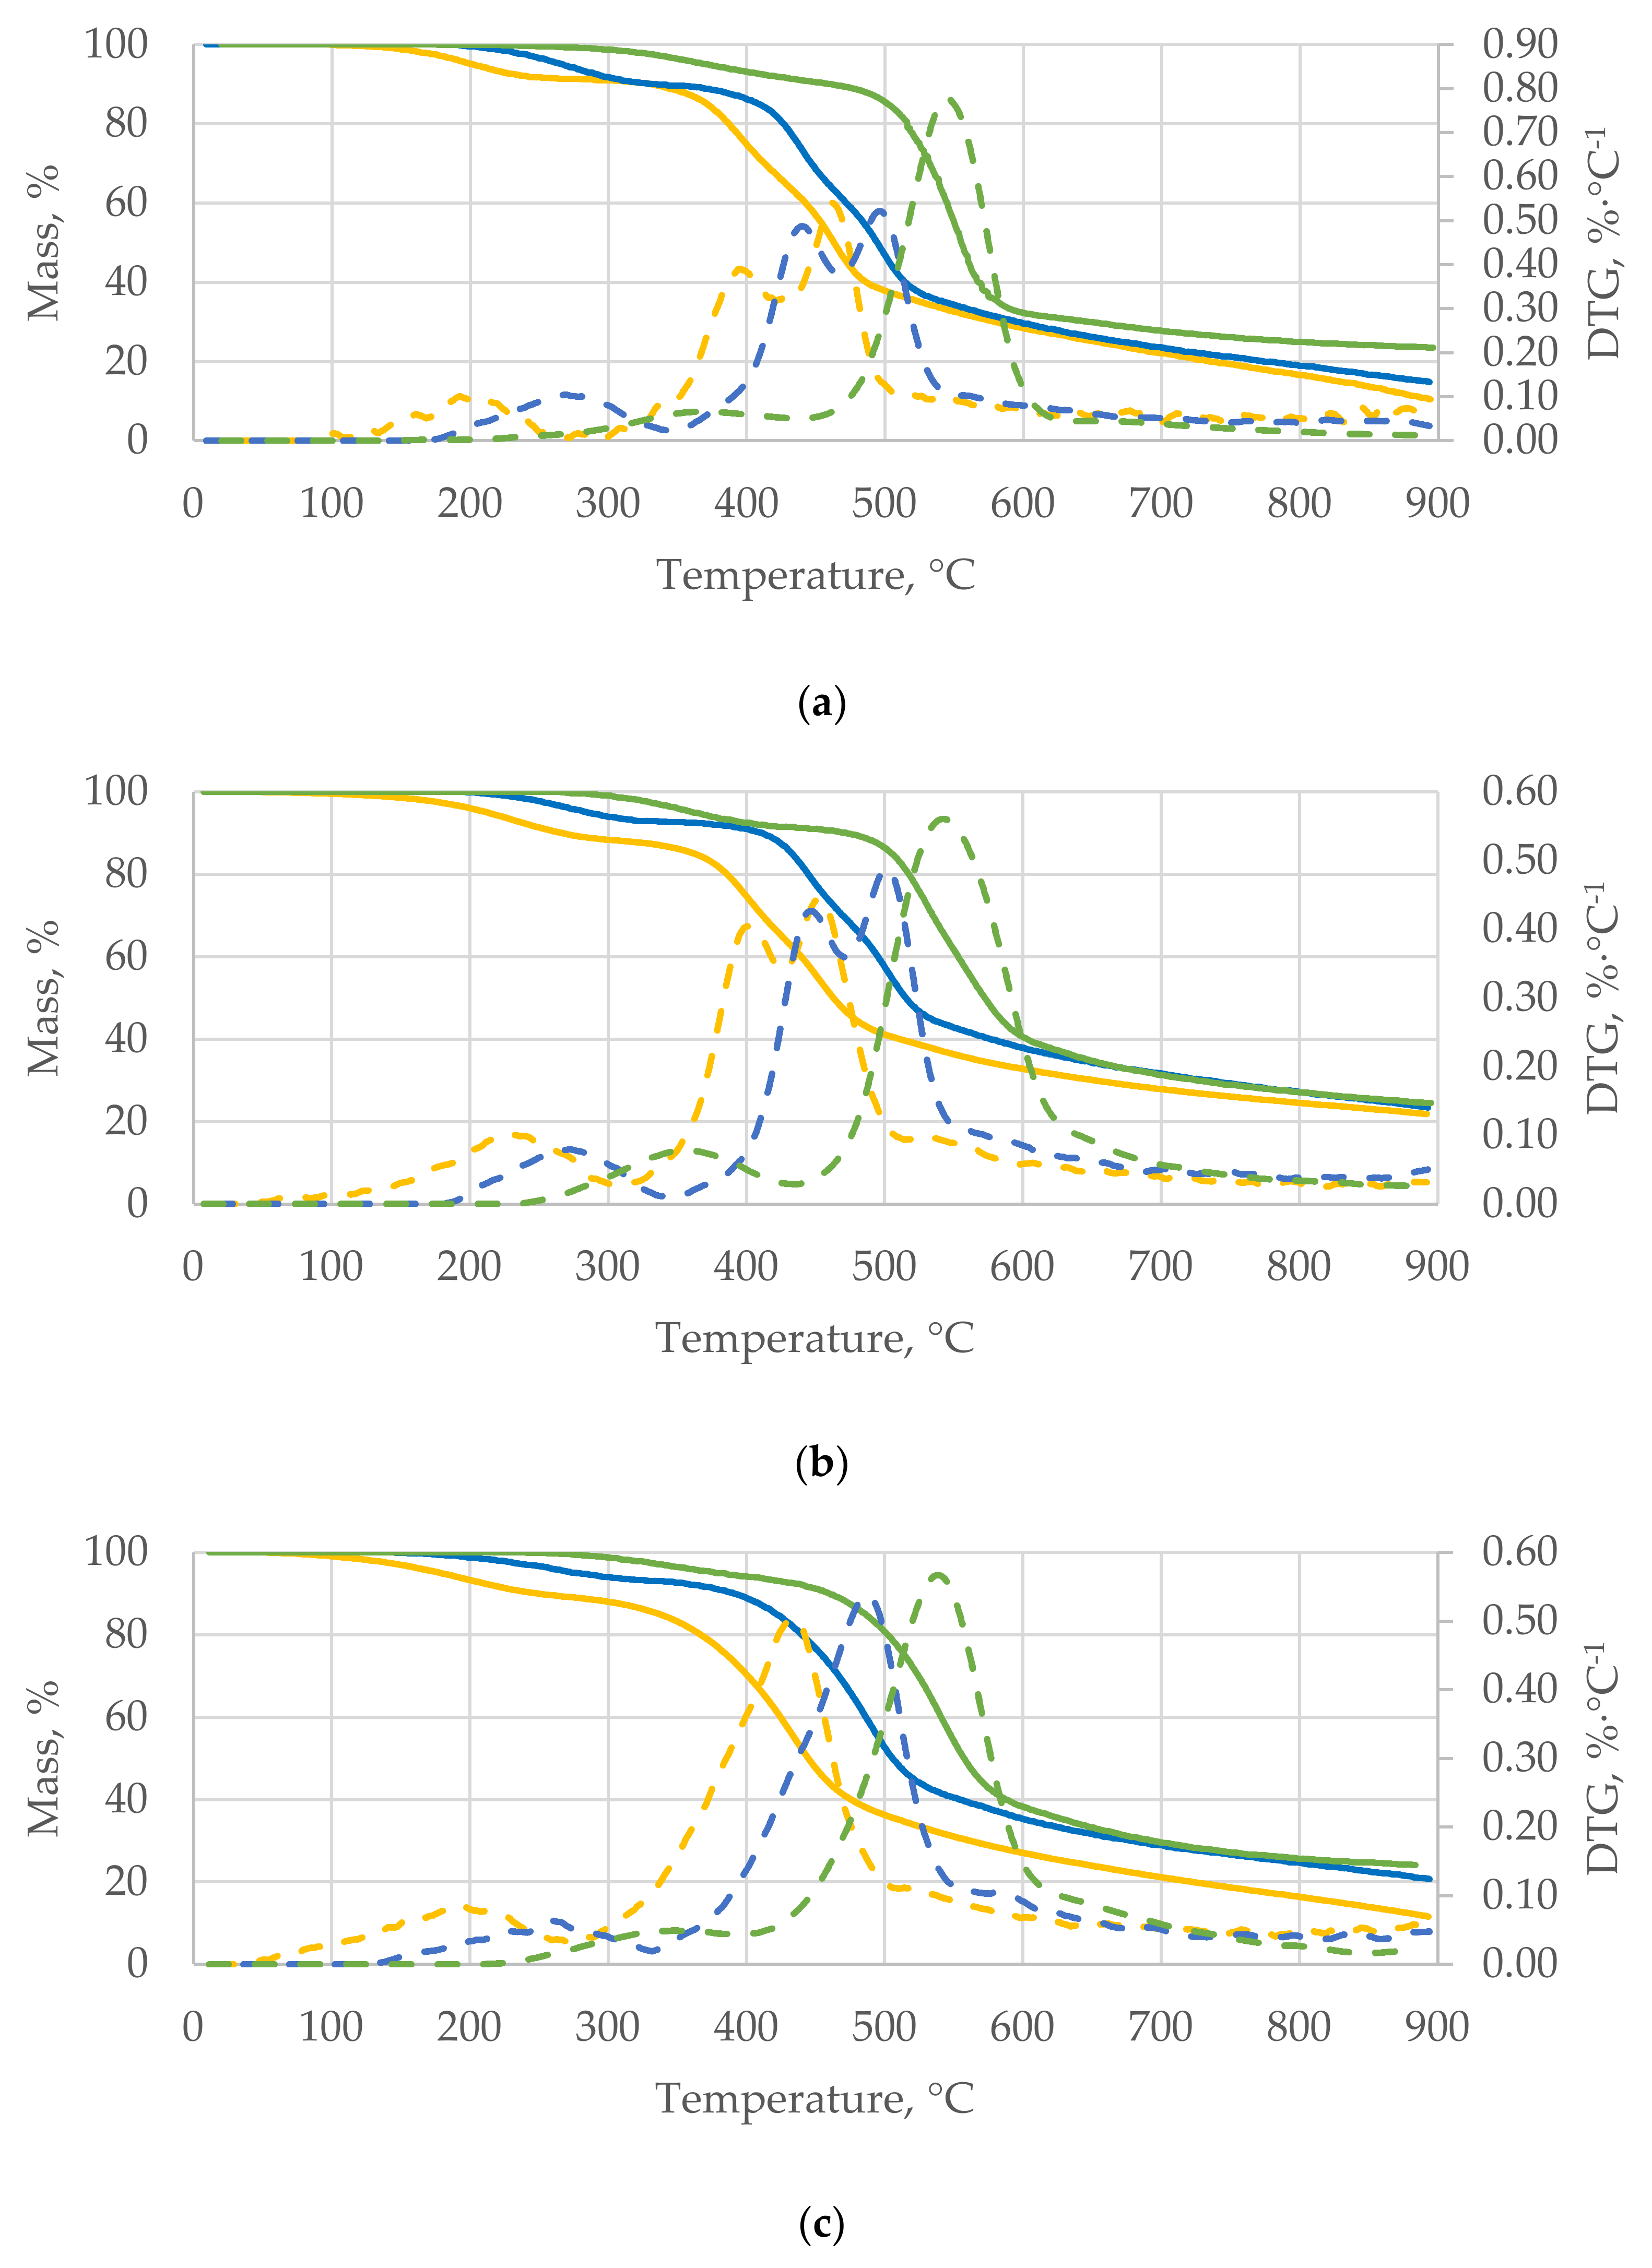
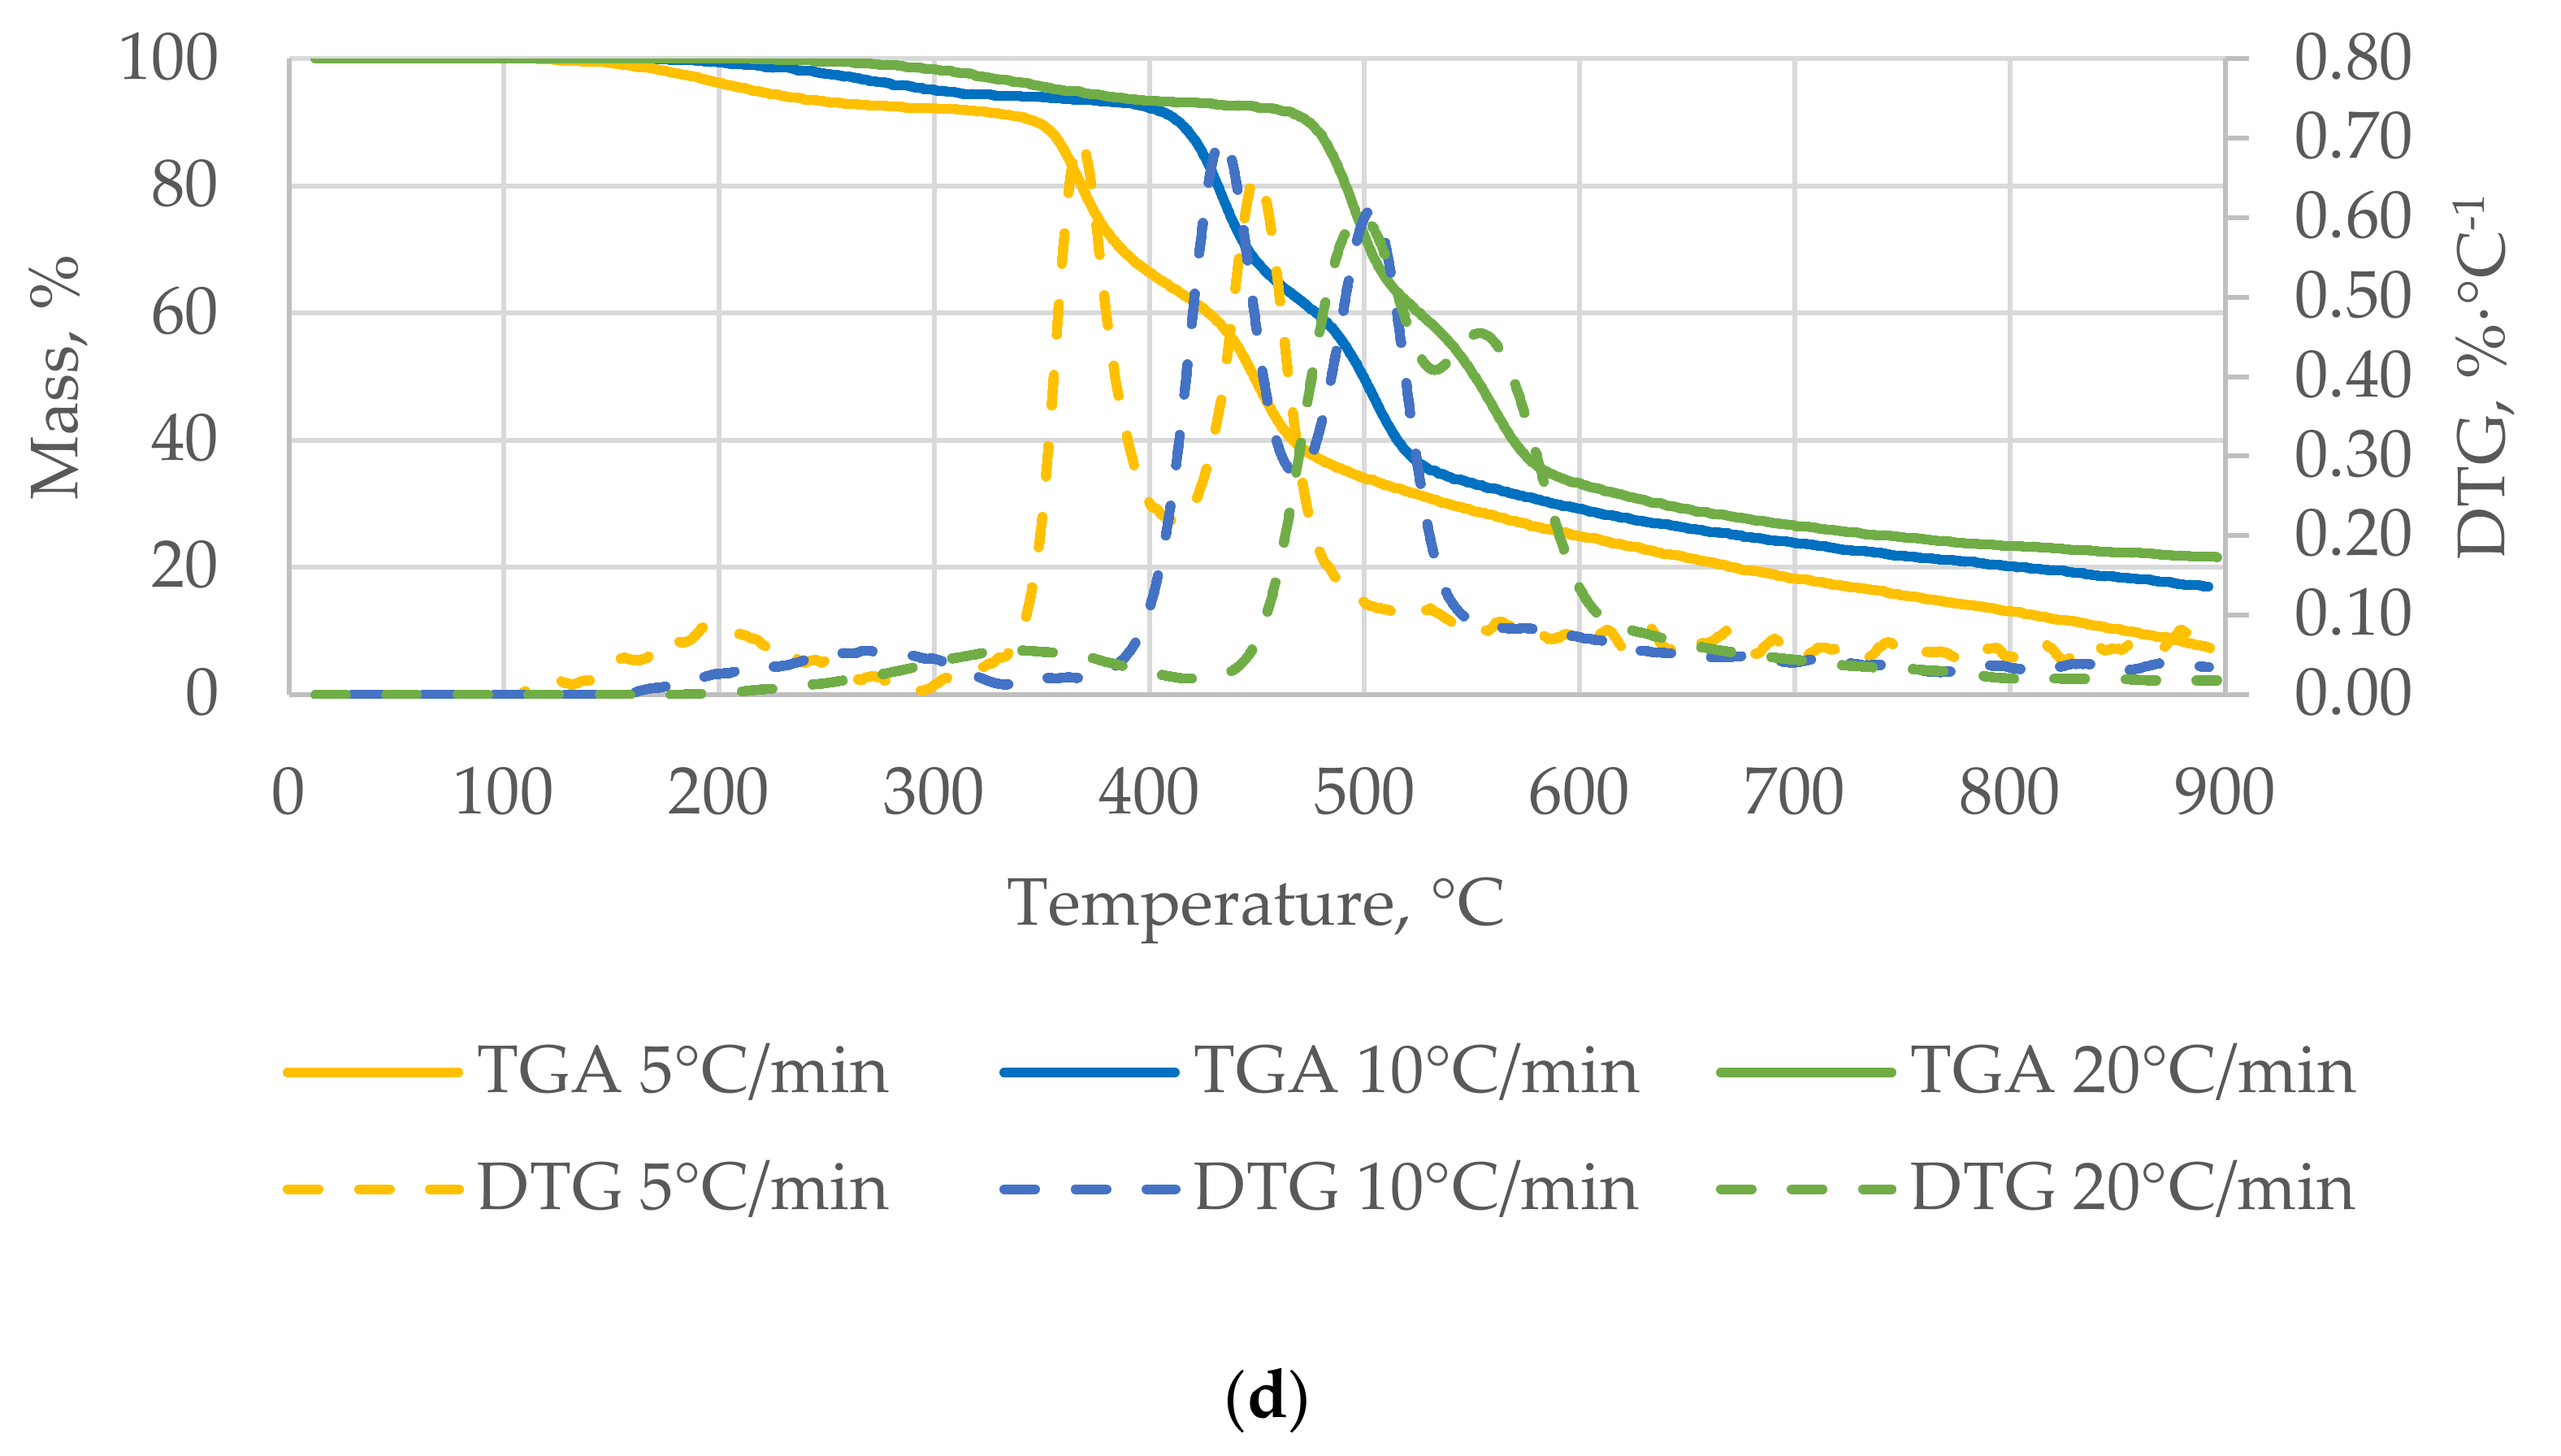
3.2. Thermogravimetric Analysis (TGA) and Derivative Thermogravimetric Analysis (DTG)
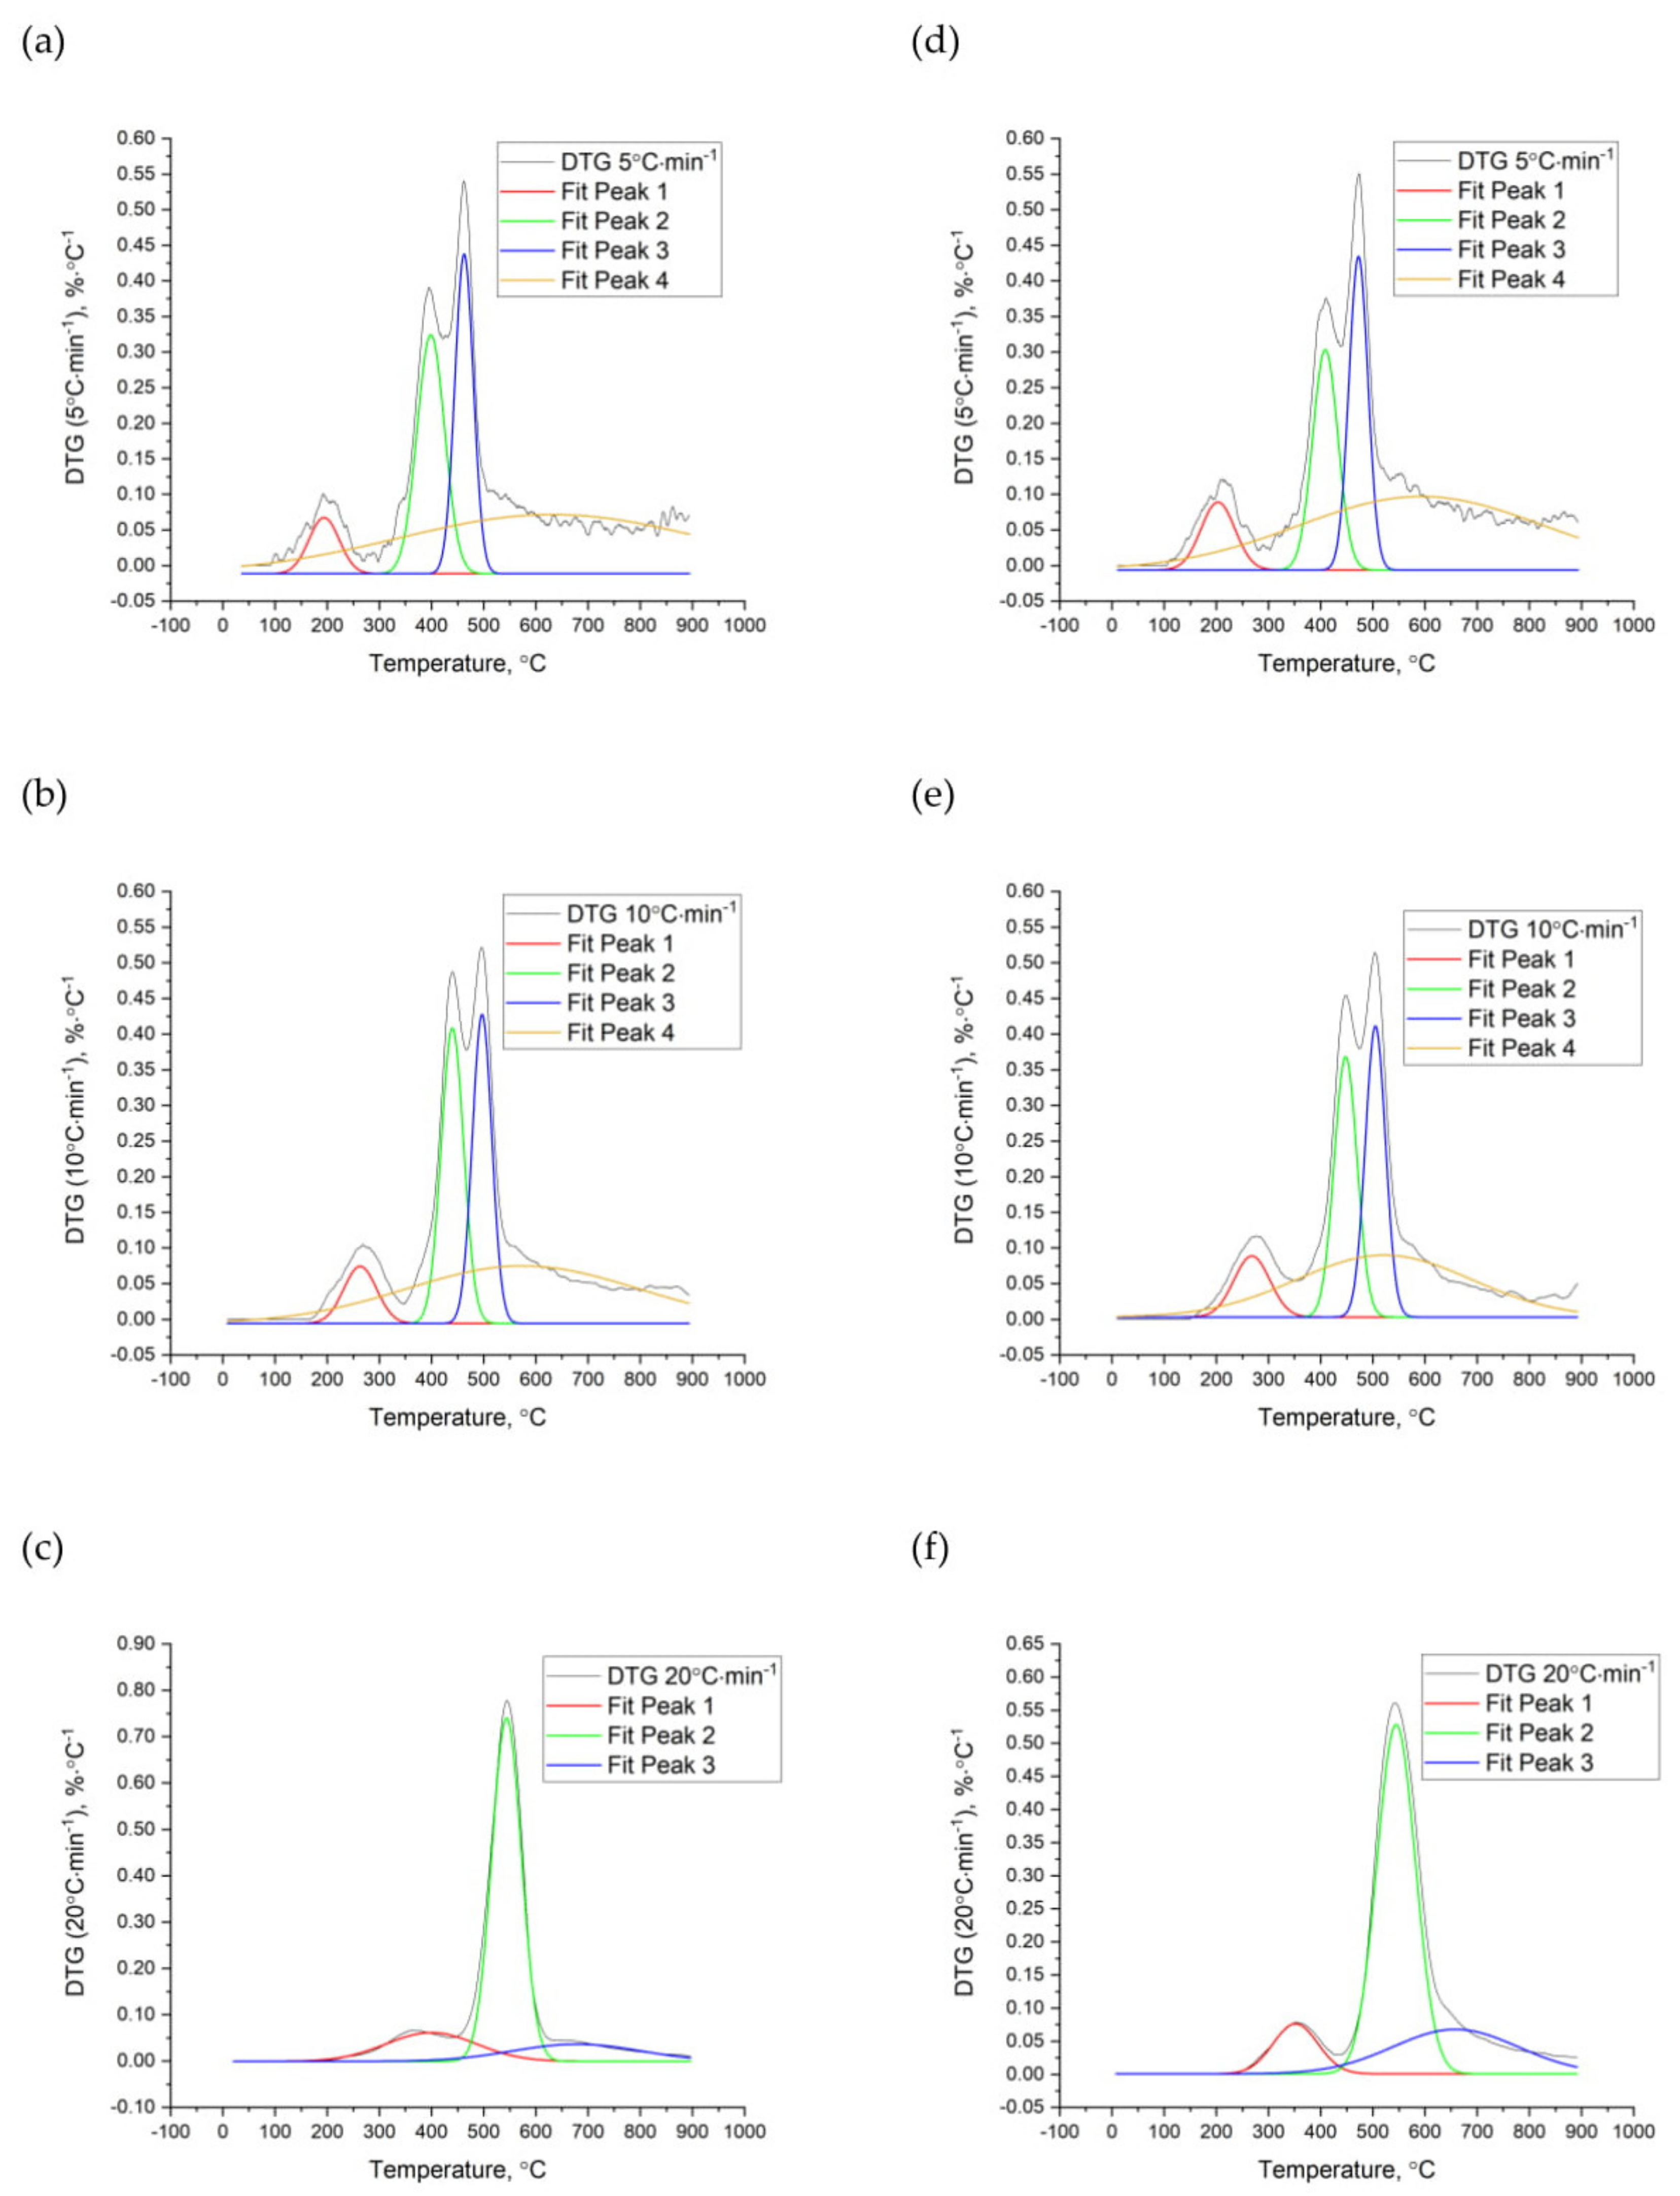
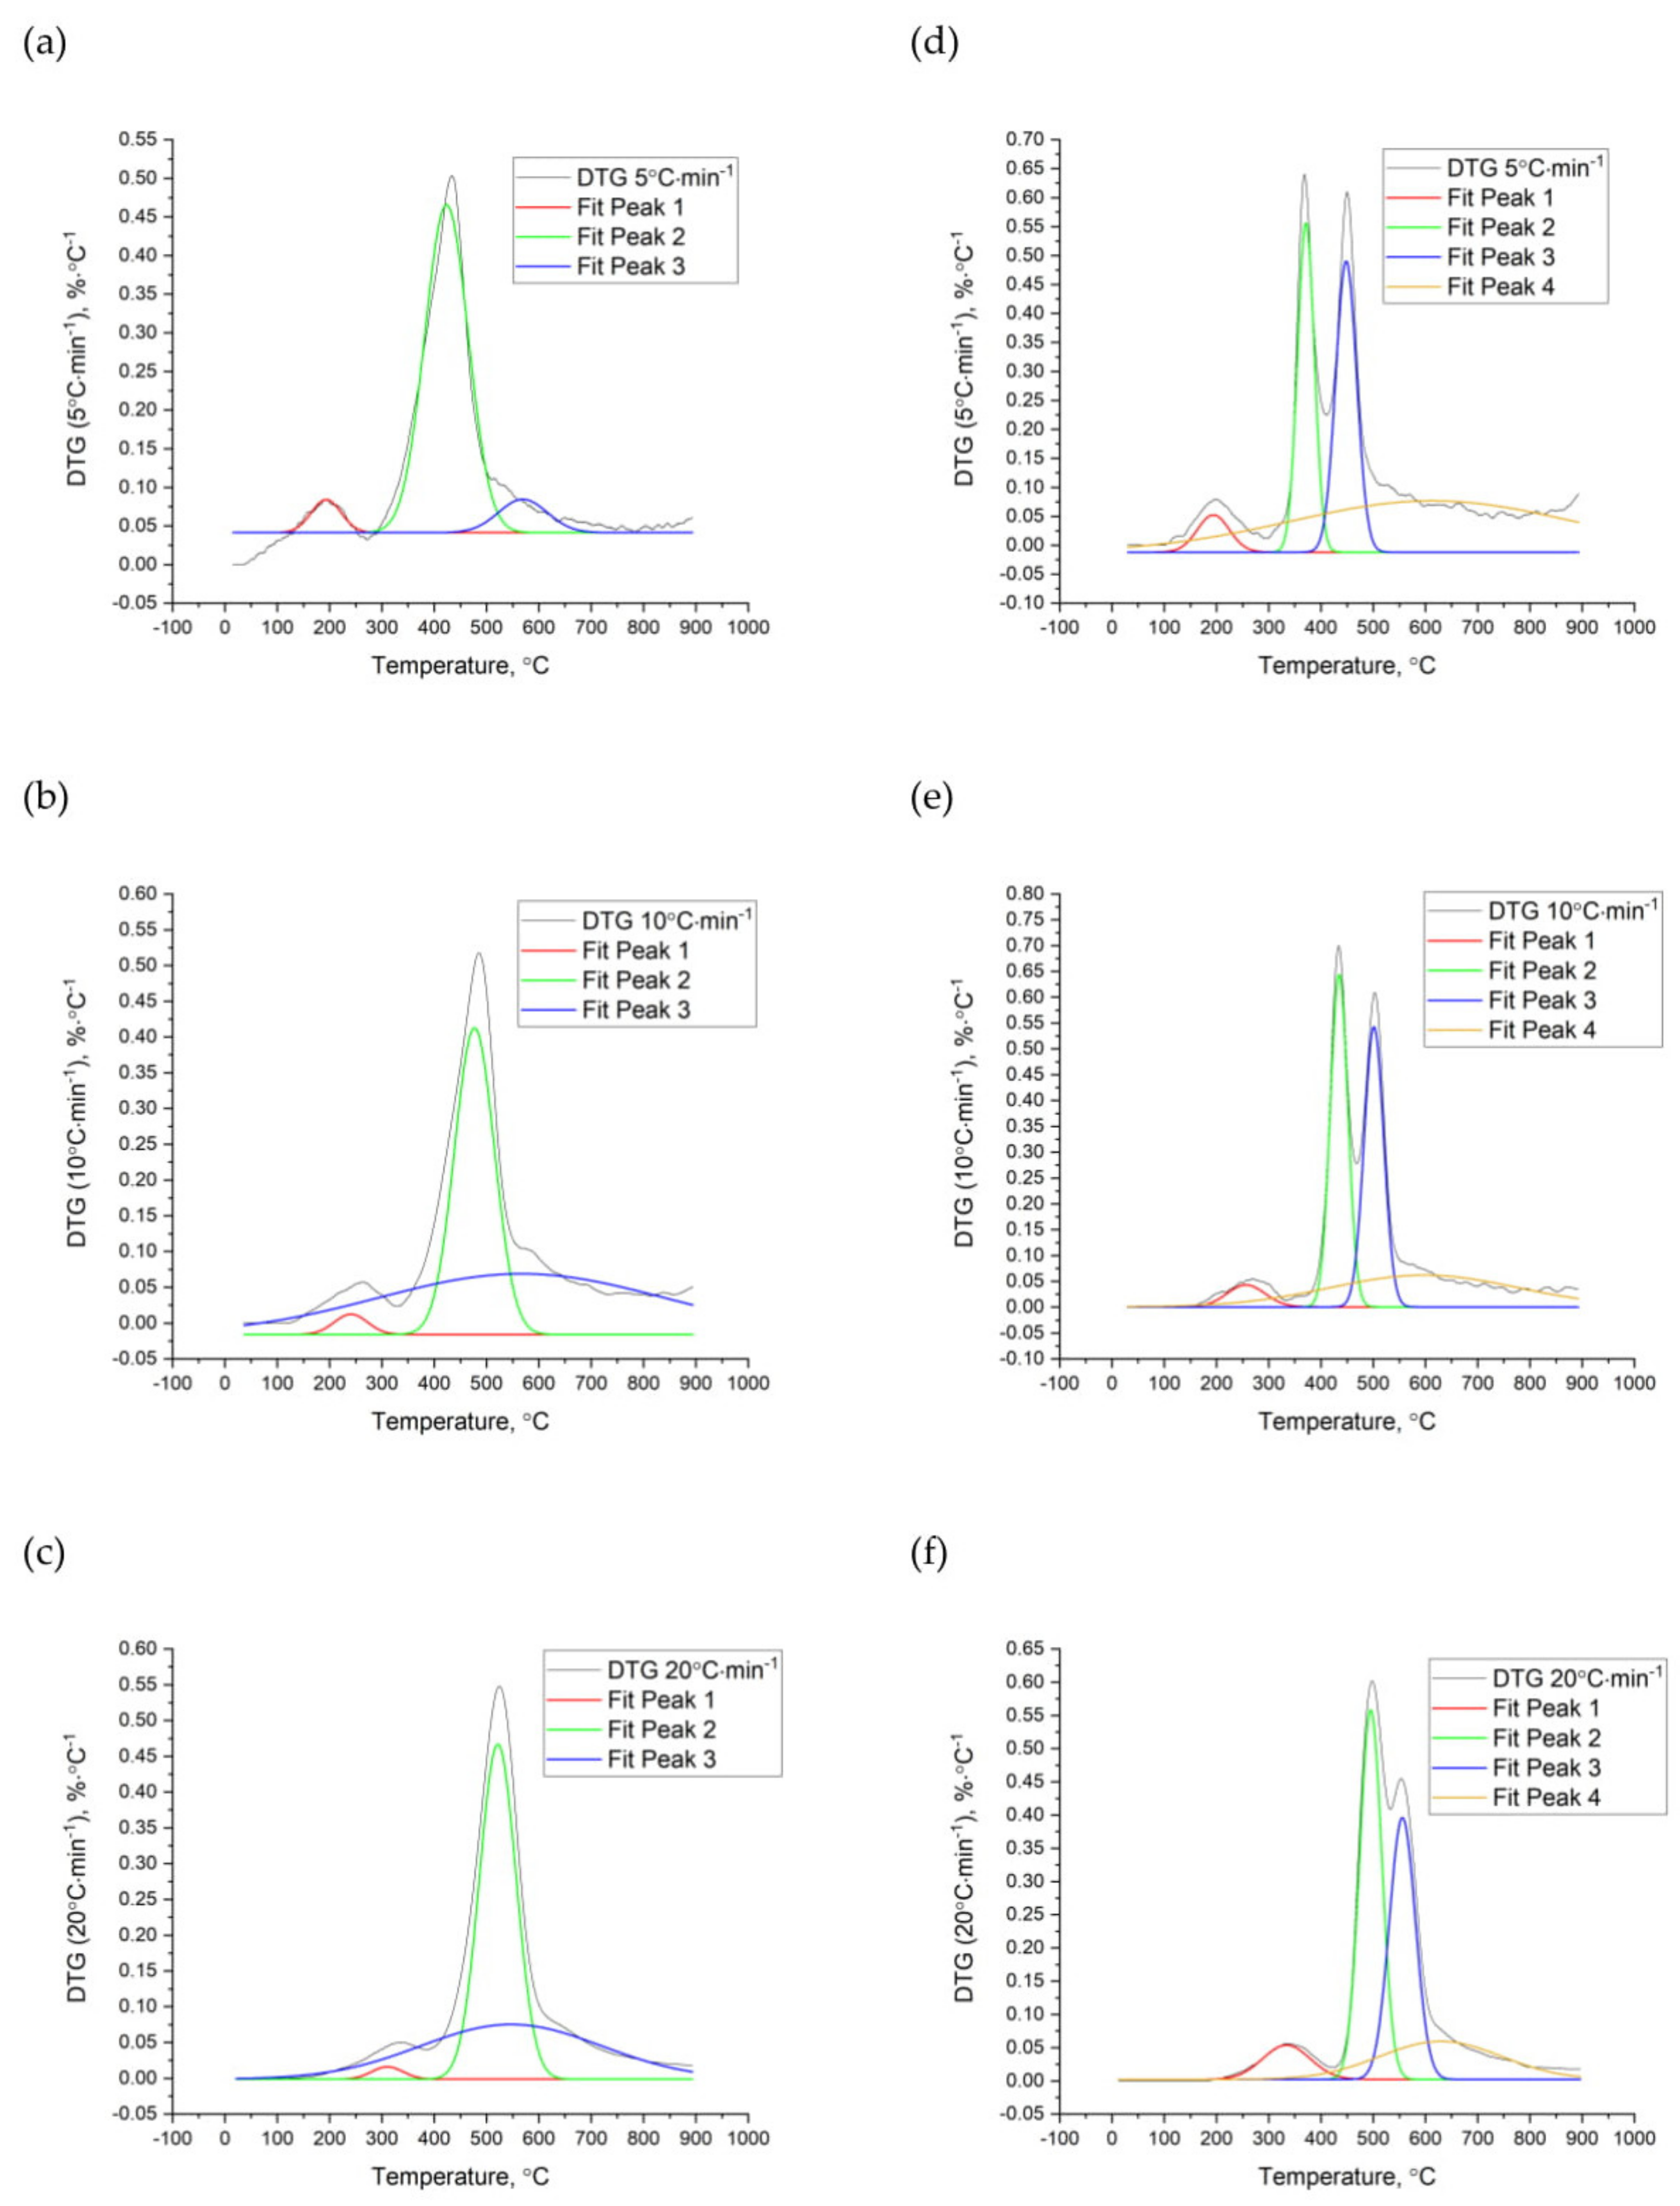
3.3. Peak Analysis during TGA
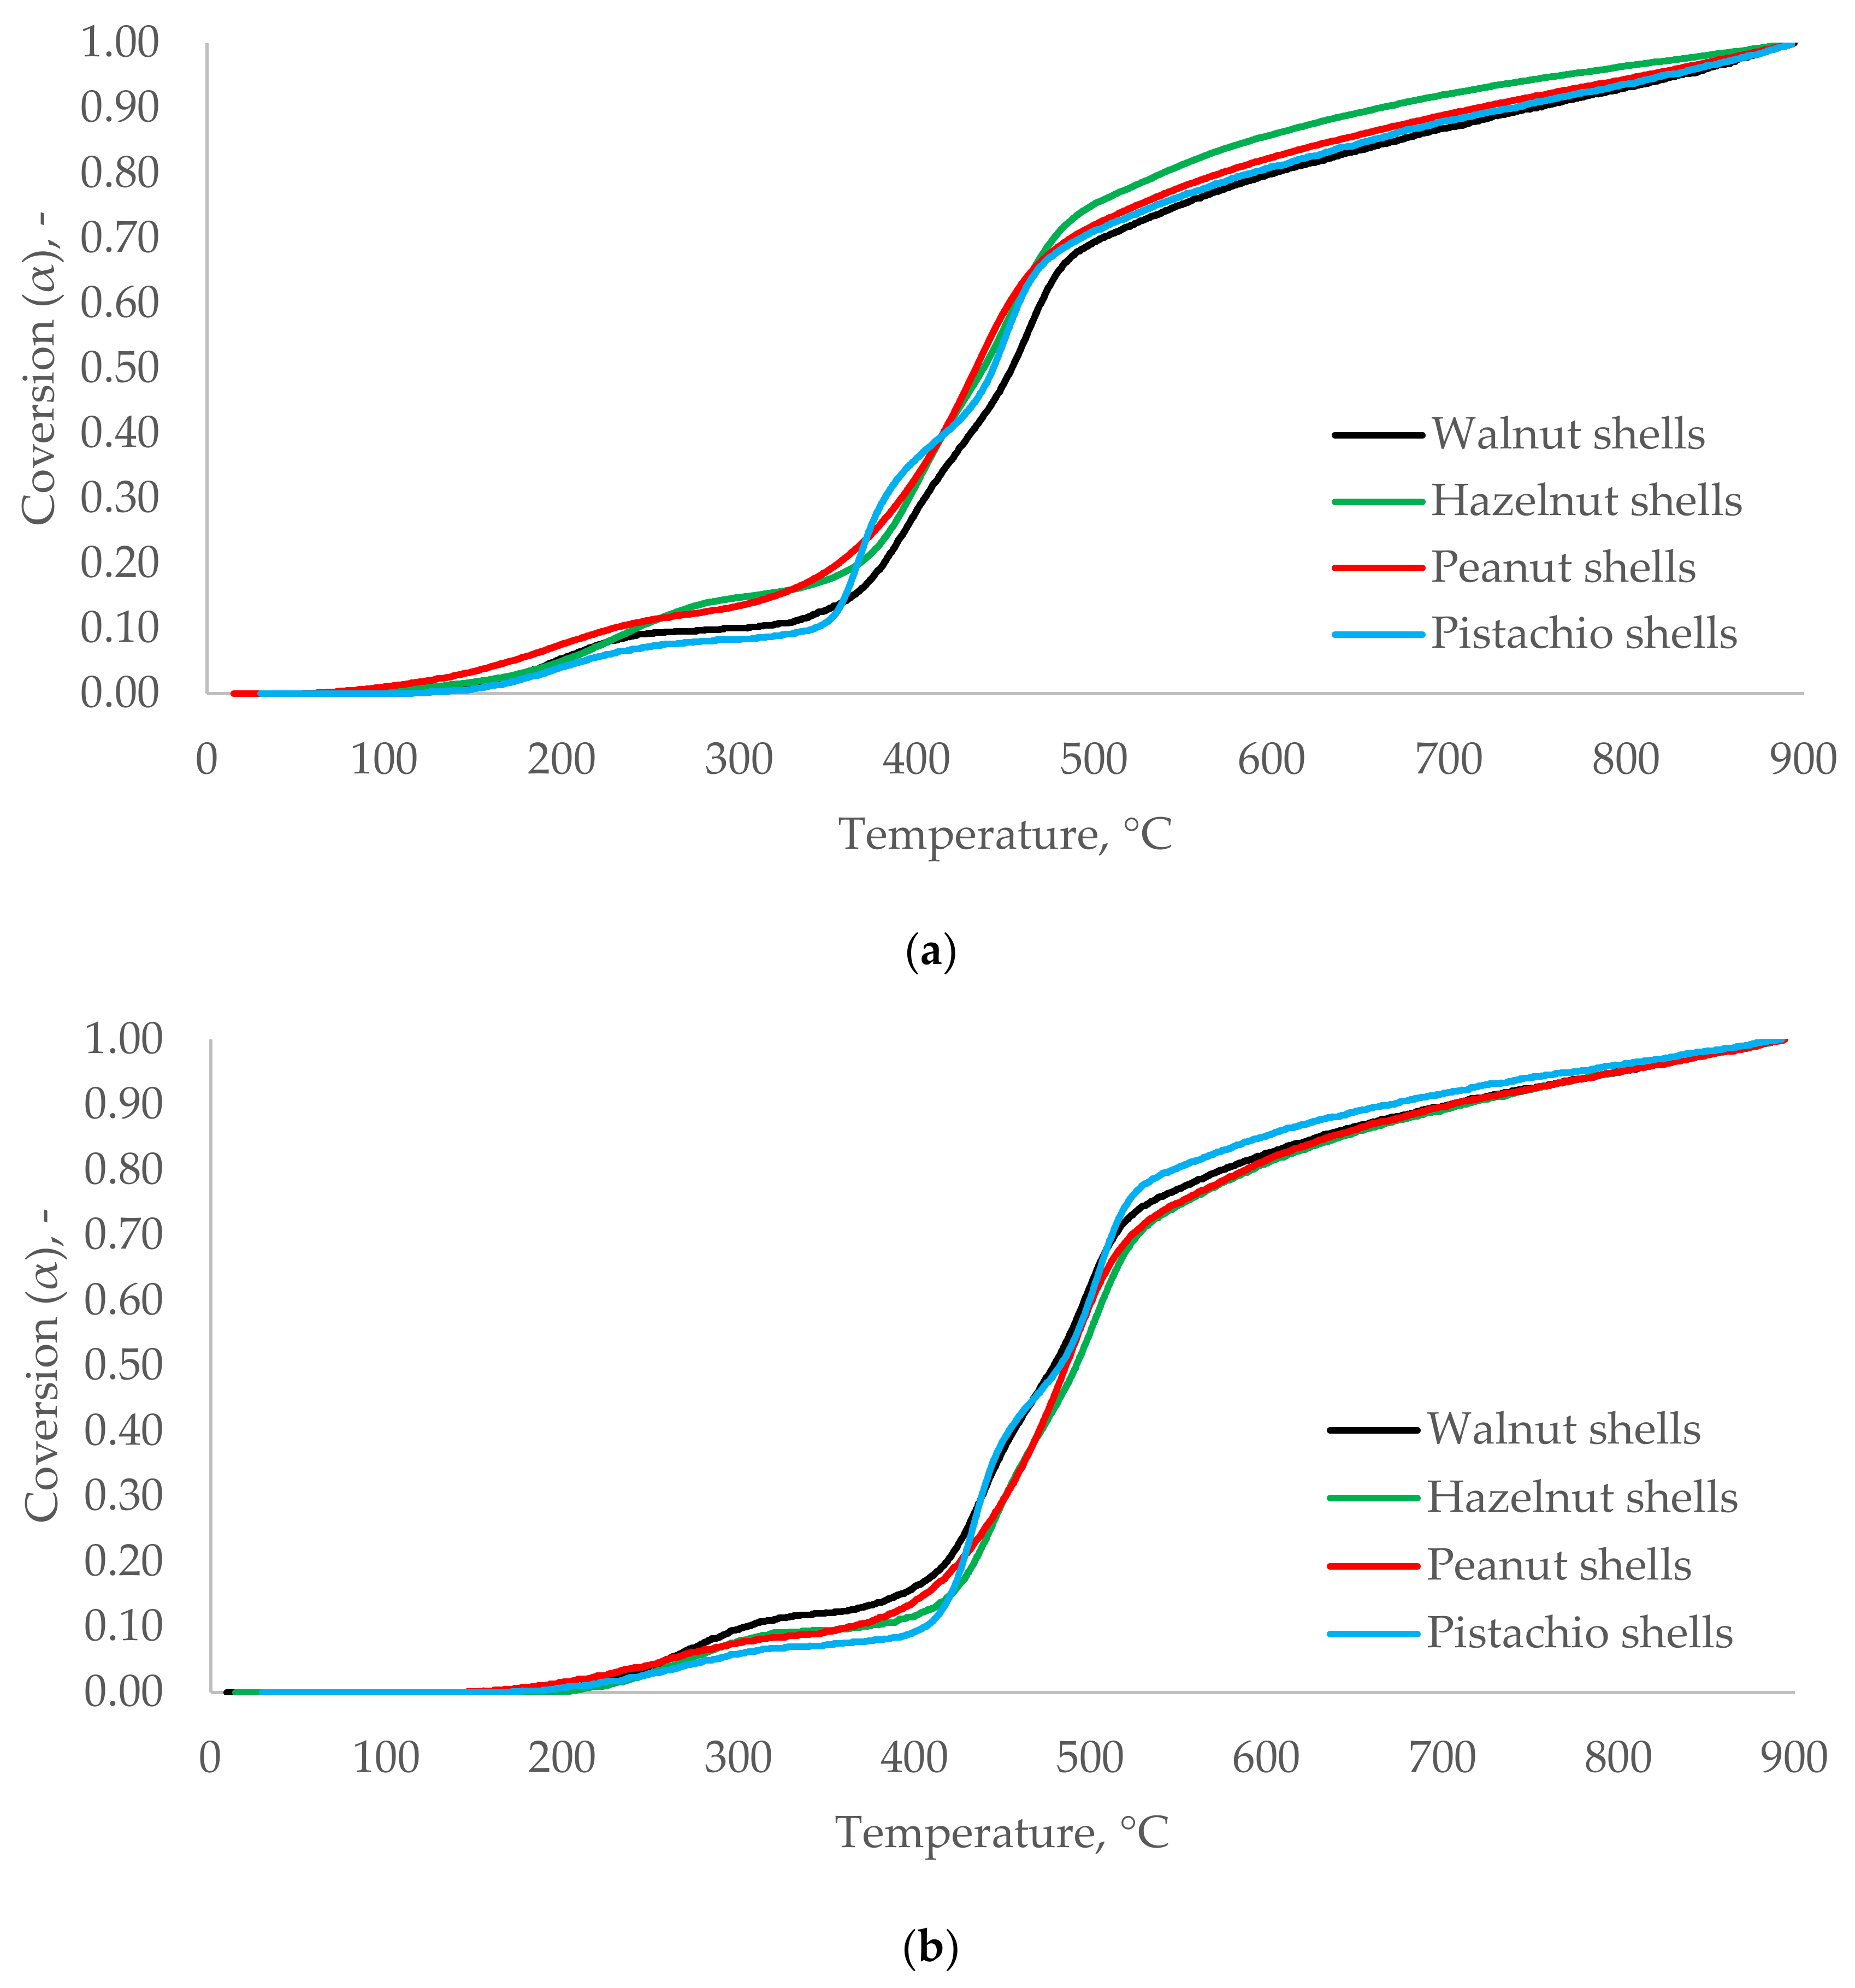
3.4. Conversion Rate and the Kinetic Parameters of the Pyrolysis Process
4. Conclusions
Supplementary Materials
Author Contributions
Funding
Institutional Review Board Statement
Informed Consent Statement
Data Availability Statement
Conflicts of Interest
Abbreviations
| AC | ash content |
| CCS | carbon capture storage |
| DTG | derivative thermogravimetric analysis |
| EC | European Commission |
| EGDP | European Green Deal Program |
| EU | European Union |
| FWO | Flynn–Wall–Ozawa method |
| GHG | greenhouse gases |
| HHV | higher heating value |
| HS | hazelnut shells |
| ICTAC | International Confederation for Thermal Analysis and Calorimetry |
| KAS | Kissinger–Akahira–Sunose method |
| MC | moisture content |
| PES | peanut shells |
| PIS | pistachio shells |
| TGA | thermogravimetric analysis |
| WS | walnut shells |
| VMC | volatile matter content |
| Kinetic parameters: | |
| Ea | activation energy |
| A | pre-exponential factor |
| k | reaction rate constant |
| n | order of the reaction |
References
- European Commission. The European Green Deal; European Commission: Brussels, Belgium, 2019; Available online: https://ec.europa.eu/info/sites/info/files/european-green-deal-communication_en.pdf (accessed on 6 December 2020).
- Tzelepi, V.; Zeneli, M.; Kourkoumpas, D.-S.; Karampinis, E.; Gypakis, A.; Nikolopoulos, N.; Grammelis, P. Biomass Availability in Europe as an Alternative Fuel for Full Conversion of Lignite Power Plants: A Critical Review. Energies 2020, 13, 3390. [Google Scholar] [CrossRef]
- Pouikli, K. Towards mandatory Green Public Procurement (GPP) requirements under the EU Green Deal: Reconsidering the role of public procurement as an environmental policy tool. ERA Forum 2020, 21, 699–721. [Google Scholar] [CrossRef]
- Catuti, M.; Elkerbout, M.; Alessi, M.; Egenhofer, C. Biomass and Climate Neutrality. In CEPS Policy Insights; CEPS: Brussels, Belgium, 2020. [Google Scholar]
- Scherhaufer, S.; Moates, G.; Hartikainen, H.; Waldron, K.; Obersteiner, G. Environmental impacts of foof waste in Europe. Waste Manag. 2018, 77, 980113. [Google Scholar] [CrossRef] [PubMed]
- European Commission. Estimates of European Food Waste Levels, Fusions Eu Project; European Commission: Stockholm, Sweden, 2016; ISBN 978-91-88319-01-2. [Google Scholar]
- Sharma, R.; Oberoi, H.S.; Dhillon, G.S. Chapter 2—Fruit and Vegetable Processing Waste: Renewable Feed Stocks for Enzymes Production. In Agro-Industrial Wastes as Feedstock for Enzyme Production; Academic Press: Cambridge, MA, USA, 2016; ISBN 9780128023921. [Google Scholar]
- Food and Agricultural Organization of United Nations. Statistical Database. 2018. Available online: http://www.fao.org/faostat/en/#data/QC (accessed on 4 December 2020).
- Razavi, S.M.A.; Rafe, A.; Moghaddam, T.M.; Amini, A.M. Physical properties of pistachio nut and its kernel as a function of moisture content and variety. Part II. Gravimetrical properties. J. Food. Eng. 2007, 81, 226–235. [Google Scholar] [CrossRef]
- Dyjakon, A.; Noszczyk, T.; Smędzik, M. The Influence of Torrefaction Temperature on Hydrophobic Properties of Waste Biomass from Food Processing. Energies 2019, 12, 4609. [Google Scholar] [CrossRef]
- Dyjakon, A.; Noszczyk, T. Alternative Fuels from Forestry Biomass Residue: Torrefaction Process of Horse Chestnuts, Oak Acorns, and Spruce Cones. Energies 2020, 13, 2468. [Google Scholar] [CrossRef]
- Niu, Y.; Lv, Y.; Lei, Y.; Liu, S.; Liang, Y.; Wang, D.; Hui, S. Biomass torrefaction: Properties, applications, challenges, and economy. Renew. Sustain. Energy Rev. 2019, 115, 109395. [Google Scholar] [CrossRef]
- Kanwal, S.; Chaudhry, N.; Munir, S.; Sana, H. Effect of torrefaction conditions on the physicochemical characterization of agricultural waste (sugarcane bagasse). Waste Manag. 2019, 88, 280–290. [Google Scholar] [CrossRef]
- Poudel, J.; Ohm, T.I.; Oh, S.C. A study on torrefaction of food waste. Fuel 2015, 140, 275–281. [Google Scholar] [CrossRef]
- Tursunov, O.; Dobrowolski, J.; Zubek, K.; Czerski, G.; Grzywacz, P.; Dubert, F.; Lapczynska-Kordon, B.; Klima, K.; Handke, B. Kinetic Study of the Pyrolysis and Gasification of Rosa Multiflora and Miscanthus Giganteus Biomasses via Thermogravimetric. Anal. Therm. Sci. 2018, 22, 3057–3071. [Google Scholar] [CrossRef]
- Khir, R.; Pan, Z.; Atungulu, G.G.; Thompson, J.F.; Shao, D. Size and Moisture Distribution characteristics of Walnut and Their Components. Food Bioprocess. Technol. 2013, 6, 771–782. [Google Scholar] [CrossRef]
- Perea-Moreno, M.A.; Manzano-Agugliaro, F.; Hernandez-Escobedo, Q.; Perea-Moreno, A.J. Peanut Shell for Energy: Properties and its Potential to Respect the Environment. Sustainability 2018, 10, 3254. [Google Scholar] [CrossRef]
- Apaydin-Vrol, E.; Putun, E.; Putun, A.E. Slow Pyrolysis of pistachio shell. Fuel 2007, 86, 1892–1899. [Google Scholar] [CrossRef]
- Turan, A.; Islam, A. Effect of Drying Methods on Some Chemical Characteristics of Hazelnuts (Corylus avellana L.) during storage. J. Inst. Sci. Tech. 2018, 8, 11–19. [Google Scholar] [CrossRef]
- Heydari, M.; Rahman, M.; Gupta, R. Kinetic Study and Thermal Decomposition Behavior of Lignite Coal. Int. J. Chem. Eng. 2015, 2015, 481739. [Google Scholar] [CrossRef]
- Via, B.K.; Adhikari, S.; Taylor, S. Modeling for proximate analysis and heating value of torrefied biomass with vibration spectroscopy. Bioresour. Technol. 2013, 133, 1–8. [Google Scholar] [CrossRef]
- Burhenne, L.; Messmer, J.; Aicher, T.; Laborie, M.P. The effect of the biomass components lignin, cellulose and hemicellulose on TGA and fixed bed pyrolysis. J. Anal. Appl. Pyrolysis 2013, 101, 177–184. [Google Scholar] [CrossRef]
- Quan, C.; Gao, N.; Song, Q. Pyrolysis of biomass components in a TGA and a fixed-bed reactor: Thermochemical behaviors, kinetics, and product characterization. J. Anal. Appl. Pyrol. 2016, 121, 84–92. [Google Scholar] [CrossRef]
- Lv, D.; Xu, M.; Liu, X.; Zhan, Z.; Li, Z.; Yao, H. Effect of cellulose, lignin, alkali and alkaline earth metallic species on biomass pyrolysis and gasification. Fuel Process. Technol. 2010, 91, 903–909. [Google Scholar] [CrossRef]
- Verhegyi, G.; Antal, M.J.; Jakab, E.; Szabo, P. Kinetic modeling of biomass pyrolysis. J. Anal. Appl. Pyrolysis 1997, 42, 73–87. [Google Scholar] [CrossRef]
- Yang, H.; Yan, R.; Chen, H.; Lee, D.H.; Zheng, C. Characteristics of hemicellulose, cellulose and lignin pyrolysis. Fuel 2007, 86, 1781–1788. [Google Scholar] [CrossRef]
- Zhou, H.; Long, Y.; Meng, A.; Chen, S.; Li, Q.; Zhang, Y. A novel method for kinetics analysis of pyrolysis of hemicellulose, cellulose, and lignin in TGA and macro-TGA. RSC Adv. 2015, 34, 26509–26516. [Google Scholar] [CrossRef]
- Lu, C.; Song, W.; Lin, W. Kinetics of biomass catalytic pyrolysis. Biotechnol. Adv. 2009, 27, 583–587. [Google Scholar] [CrossRef] [PubMed]
- Singh, R.K.; Bijayani, B.; Sachin, K. Determination of Activation Energy from Pyrolysis of Paper Cup Waste Using Thermogravimetric Analysis. Res. J. Recent Sci. 2013, 2, 177–182. [Google Scholar]
- Arenas, C.N.; Navarro, M.V.; Martinez, J.D. Pyrolysis kinetics of biomass wastes using isoconversional methods and the distributed activation energy model. Bioresour. Technol. 2019, 288, 121485. [Google Scholar] [CrossRef] [PubMed]
- Aboyade, A.O.; Hugo, T.J.; Carrier, M.; Meyer, E.L.; Stahl, R.; Knoetze, J.H.; Gorgens, J.F. Non-isothermal kinetic analysis of the devolatilization of corn cobs and sugar cane bagasse in an inert atmosphere. Thermochim. Acta 2011, 517, 81–89. [Google Scholar] [CrossRef]
- Paik, P.; Kar, K.K. Thermal degradation kinetics and estimation of life time of polyethylene particles: Effects of particle size. Mater. Chem. Phys. 2009, 113, 953–961. [Google Scholar] [CrossRef]
- Lisowski, A.; Pajor, M.; Świętochowski, A.; Dąbrowska, M.; Klonowski, J.; Mieszkalski, L.; Ekielski, A.; Stasiak, M.; Piątek, M. Effects of moisture content, temperautre, and die thickness on the compaction proces, and the density and strength of walnut shell pellet. Renew. Energy 2019, 141, 770–781. [Google Scholar] [CrossRef]
- Antmen, Z.F. Exploitation of peanut and hazelnut shells as agricultural industrial wastes for solid biofuel production. Fresenius Environ. Bull. 2019, 28, 2340–2347. [Google Scholar]
- Cardozo, E.; Erlich, C.; Alejo, L.; Fransson, T.H. Combustion of agricultural residues: An experimental study for small-scale applications. Fuel 2014, 115, 778–787. [Google Scholar] [CrossRef]
- Bonelli, P.R.; Della Rocca, P.A.; Cukierman, A.L. Effect of pyrolysis temperature on composition, surface properties and thermal degradation rates of Brazil Nut shells. Bioreesour. Technol. 2001, 76, 15–22. [Google Scholar] [CrossRef]
- Demirbas, Y. Effect of temperature on pyrolysis products from four nut shells. J. Anal. Appl. Pyrol. 2006, 76, 285–289. [Google Scholar] [CrossRef]
- Acikalin, K.; Karaca, F.; Bolat, E. Pyrolysis of Pistachio shell: Effects of pyrolysis conditions and analysis of products. Fuel 2012, 95, 169–177. [Google Scholar] [CrossRef]
- Lua, A.C.; Guo, T.Y.J. Effects of pyrolysis conditions on the properties of activated carbons prepared from pistachio-nut shells. Pyrolysis 2004, 72, 279–287. [Google Scholar] [CrossRef]
- Haykiri-Acma, H.; Yaman, S.; Kucukbayrak, S. Effects of torrefaction on lignin-rich biomass (hazelnut shell): Structural variations. J. Renew. Sustain. Energy 2017, 9, 063102. [Google Scholar] [CrossRef]
- Kasiri, N.; Fathi, M. Production of cellulose nanocrystals from pistachio shells and their application for stabilizing Pickering emulsions. Int. J. Biol. Macromol. 2018, 106, 1023–1031. [Google Scholar] [CrossRef]
- Hemmati, F.; Jafari, S.M.; Kashaninejad, M.; Motlagh, M.B. Synthesis and characterization of cellulose nanocrystals derived from walnut shell agricultural residues. Int. J. Biol. Macromol. 2018, 120, 1216–1224. [Google Scholar] [CrossRef]
- Cepeliogullar, Ö.; Haykiri-Acma, H.; Yaman, S. Kinetic modeling of RDF pyrolysis: Model-fitting and model free approaches. Waste Manag. 2016, 48, 275–284. [Google Scholar] [CrossRef]
- Vyazovkin, S.; Burnham, A.K.; Criado, J.M.; Perez-Maqueda, L.A.; Popescu, C.; Sbirrazzuoli, N. ICTAC Kinetics Committee recommendations for performing kinetic computations on thermal analysis data. Thermochim. Acta 2011, 520, 1–19. [Google Scholar] [CrossRef]
- Rueda-Ordonez, Y.J.; Tannous, K. Isoconversional kinetic study of the thermal decompositions of sugarcane straw for thermal conversion processes. Bioresour. Technol. 2015, 196, 136–144. [Google Scholar] [CrossRef]
- Khan, Z.; Yusup, S.; Ahmad, M.M.; Uemura, Y.; Chok, V.S.; Rashid, U.; Inayat, A. Kinetic Study on Palm Oil Waste Decomposition. In Biofuel’s Engineering Process Technology; InTech: Rijeka, Croatia, 2011. [Google Scholar]
- Vasudev, V.; Ku, X.; Lin, J. Kinetic study and pyrolysis characteristics of algal and lignocellulosic biomasses. Bioresour. Technol. 2019, 288, 121496. [Google Scholar] [CrossRef] [PubMed]
- Mallick, D.; Bora, B.J.; Barbhuiya, S.A.; Banik, R.; Garg, J.; Sarma, R.; Gogoi, A.K. Detailed Study of Pyrolysis Kinetics of Biomass Using Thermogravimetric Analysis. AIP Conf. Proc. 2019, 2091, 020014. [Google Scholar]
- Cai, J.; Bi, L. Precision of the Coats and Redfern Method for the Determination of the Activation Energy without Neglecting the Low-Temperature End of the Temperature Integral. Energy Fuel 2008, 22, 2172–2174. [Google Scholar] [CrossRef]
- Kahrizsangi, R.; Abbasi, M.H. Evaluation of reliability of Coats-Redfern method for kinetic analysis of non-isothermal TGA. Trans. Nonferrous Met. Soc. China 2008, 18, 217–221. [Google Scholar]
- Parascanu, M.M.; Sandoval-Salas, F.; Soreanu, G.; Valverde, J.L.; Sanchez-Silva, L. Valorization of Mexican biomasses through pyrolysis, combustion, and gasification processes. Reviews 2017, 71, 509–522. [Google Scholar] [CrossRef]
- Barzegar, R.; Yozgatligil, A.; Olgun, H.; Atimtay, A.T. TGA and kinetic study of different torrefaction conditions of wood biomass under air and oxy-fuel combustion atmospheres. J. Energy Inst. 2020, 93, 889–898. [Google Scholar] [CrossRef]
- Gronli, M.G.; Varhegyi, G.; Blasi, C.D. Thermogravimetric analysis and devolatilization kinetics of wood. Ind. Eng. Chem. Res. 2002, 41, 4201–4208. [Google Scholar] [CrossRef]
- Kaltschmitt, M.; Streicher, W. Energie aus Biomasse. Regenerative Energien in Österreich; Springer Vieweg: Wiesbaden, Germany, 2009. [Google Scholar]
- Blasi, C.D. Modeling chemical and physical processes of wood and biomass pyrolysis. Prog. Energy Combust. Sci. 2008, 34, 47–90. [Google Scholar]
- Wang, J.; Shen, B.; Kang, D.; Yuan, P.; Wu, C. Investigate the interactions between biomass components during pyrolysis using in-situ DRIFTS and TGA. Chem. Eng. Sci. 2019, 195, 767–776. [Google Scholar] [CrossRef]
- Yeo, J.Y.; Chin, B.L.F.; Tan, J.K.; Loh, Y.S. Comparative studies on the pyrolysis of cellulose, hemicellulose, and lignin based on combined kinetics. J. Energy Inst. 2019, 92, 27–37. [Google Scholar] [CrossRef]
- Senneca, O.; Cerciello, F.; Russo, C.; Wutscher, A.; Muhler, M.; Apicella, B. Thermal treatment of lignin, cellulose and hemicellulose in nitrogen and carbon dioxide. Fuel 2020, 271, 117656. [Google Scholar] [CrossRef]
- Jewiarz, M.; Wróbel, M.; Mudryk, K.; Szufa, S. Impact of the Drying Temperature and Grinding Technique on Biomass Grindability. Energies 2020, 13, 3392. [Google Scholar] [CrossRef]
- Wróbel, M.; Jewiarz, M.; Mudryk, K.; Knapczyk, A. Influence of Raw Material Drying Temperature on the Scots Pine (Pinus sylvestris L.) Biomass Agglomeration Process—A Preliminary Study. Energies 2020, 13, 1809. [Google Scholar]
- Kocabas-Atakh, Z.O.; Okyay-Oner, F.; Yurum, Y. Combustion characteristics of Turkish hazelnut shell biomass, lignite coal, and their respective blends via thermogravimetric analysis. J. Therm. Anal. Calorim. 2014, 119, 1723–1729. [Google Scholar] [CrossRef]
- Haykiri-Acma, H. The role of particle size in the non-isothermal pyrolysis of hazelnut shell. J. Anal. Appl. Pyrol. 2006, 75, 211–216. [Google Scholar] [CrossRef]
- Demirbas, A. Kinetics for non-isothermal flash pyrolysis of hazelnut shell. Bioresour. Technol. 1998, 66, 247–252. [Google Scholar] [CrossRef]
- Acikalin, K. Thermogravimetric analysis of walnut shell as pyrolysis feedstock. J. Therm. Anal. Calorim. 2011, 105, 145–150. [Google Scholar] [CrossRef]
- Acikalin, K. Pyrolytic characteristics and kinetics of pistachio shell by thermogravimetric analysis. J. Therm. Anal. Calorim. 2012, 109, 227–235. [Google Scholar] [CrossRef]
- Tasar, S.; Kaya, F.; Ozer, A. Biosorption of lead (II) ions from aqueous solution by peanut shells: Equilibrium, thermodynamic and kinetic studies. J. Environ. Chem. Eng. 2014, 2, 1018–1026. [Google Scholar] [CrossRef]


| Crops | Europe | Poland | ||||
|---|---|---|---|---|---|---|
| Area, ha | Production, Mg | Waste, Mg | Area, ha | Production, Mg | Waste, Mg | |
| Fruit (total) | 7,481,716 | 87,574,401 | - | 379,056 | 5,140,130 | - |
| Nuts (total) | 1,191,510 | 1,254,799 | 501,920 | 6322 | 15,119 | 6048 |
| Hazelnut | 117,057 | 173,946 | 69,578 | 3716 | 6642 | 2657 |
| Pistachio | 37,754 | 20,699 | 8280 | - | - | - |
| Walnut | 139,037 | 392,446 | 156,978 | 2606 | 8477 | 3391 |
| Analysis | Standard |
|---|---|
| Moisture content (MC) | PN EN ISO 18134-2:2017-03E |
| Ash content (AC) | PN EN ISO 18122:2015 |
| Volatile matter content (VMC) | PN EN ISO 18123:2016-01 |
| Higher heating value (HHV) | PN EN ISO 18125:2017-07 |
| Lower heating value (LHV) | Calculation based on the HHV and MC [10] |
| Fixed carbon content (FCC) | ASTM D-3172-73 |
| Reaction Model | Code | f(α) | g(α) |
|---|---|---|---|
| Avrami–Erofeev | A2 | 2(1 − α)[−ln(1 − α)]1/2 | [−ln(1 − α)]1/2 |
| Avrami–Erofeev | A3 | 3(1 − α)[−ln(1 − α)]2/3 | [−ln(1 − α)]1/3 |
| Avrami–Erofeev | A4 | 4(1 − α)[−ln(1 − α)]3/4 | [−ln(1 − α)]1/4 |
| 1-D diffusion | D1 | 1/2α−1 | α2 |
| 2-D diffusion | D2 | [−ln(1 − α)]−1 | (1 − α)ln(1 − α) + α |
| 3-D diffusion | D3 | 3/2(1 − α)2/3[1 − (1 − α)1/3]−1 | [1 − (1 − α)1/3]2 |
| Mampel (first-order) | F1 | 1 − α | −ln(1 − α) |
| Power law | P2 | 4α3/4 | α1/2 |
| Power law | P3 | 3α2/3 | α1/3 |
| Power law | P4 | 2α1/2 | α1/4 |
| Power law | P2/3 | 2/3α−1/2 | α3/2 |
| Contracting cylinder | R2 | 2(1 − α)1/2 | 1 − (1 − α)1/2 |
| Contracting sphere | R3 | 3(1 − α)2/3 | 1 − (1 − α)1/3 |
| n-order reaction | - | (1 − α)n | 1 − (1 − α)1−n/1 − n |
| Parameter | WS | HS | PES | PIS | ||
|---|---|---|---|---|---|---|
| Proximate analysis | MC | % | 4.32 ± 0.11 | 9.56 ± 0.00 | 6.32 ± 0.01 | 7.05 ± 0.01 |
| HHV | MJ∙kg−1 | 19,604 ± 330 | 18,887 ± 80 | 19,692 ± 57 | 17,780 ± 57 | |
| LHV | 18,731 ± 316 | 17,078 ± 72 | 18,446 ± 53 | 16,528 ± 53 | ||
| AC | % | 1.10 ± 0.20 | 1.00 ± 0.20 | 2.20 ± 0.40 | 3.10 ± 0.60 | |
| VMC | 81.44 ± 1.26 | 78.04 ± 0.05 | 78.84 ± 0.40 | 81.24 ± 0.26 | ||
| FC | 13.14 ± 0.57 | 11.39 ± 0.09 | 12.57 ± 0.33 | 8.26 ± 0.25 | ||
| Ultimate analysis | C | % | 48 ± 10 | 49 ± 10 | 49 ± 10 | 44 ± 9 |
| H | 8.0 ± 1.6 | 7.8 ± 1.6 | 7.9 ± 1.6 | 7.9 ± 1.6 | ||
| N | 0.31 ± 0.06 | 0.43 ± 0.09 | 1.2 ± 0.2 | 0.2 ± 0.04 | ||
| O | 42.6 ± 8.5 | 41.8 ± 8.4 | 39.6 ± 7.9 | 44.8 ± 9.0 | ||
| S | 0.014 ± 0.003 | 0.019 ± 0.004 | 0.083 ± 0.017 | 0.014 ± 0.003 | ||
| Kinetic Parameters | Heating Rate, β | |||||||
|---|---|---|---|---|---|---|---|---|
| 5 °C∙min−1 | 10 °C∙min−1 | 20 °C∙min−1 | ||||||
| Walnut shell | Peak 1 | Ea, kJ∙mol−1∙K−1 | From 148.0 °C ± 9.1 to 265.0 °C ± 17.7 | 34.5 ± 9.6 | From 196.0 °C ± 5.0 to 322.7 °C ± 4.0 | 45.3 ± 2.8 | From 232.7 °C ± 12.4 to 517.3 °C ± 51.7 | 44.8 ± 4.2 |
| A, s−1 | 2.00 ± 2.65 × 10⁻⁴ | 2.96 ± 1.97 × 10⁻⁴ | 9.47 ± 5.97 × 10⁻⁵ | |||||
| R2 | 0.9562 | 0.9678 | 0.9402 | |||||
| Peak 2 | Ea, kJ∙mol−1∙K−1 | From 350.7 °C ± 6.6 to 446.7 °C ± 4.1 | 56.5 ± 4.4 | From 397.7 °C ± 1.7 to 485.0 °C ± 2.2 | 74.3 ± 0.6 | From 478.7 °C ± 9.1 to 609.0 °C ± 12.0 | 140.0 ± 22.1 | |
| A, s−1 | 1.05 ± 0.96 × 10⁻³ | 1.85 ± 0.26 × 10⁻² | 4.48 ± 5.34 × 10³ | |||||
| R2 | 0.9914 | 0.9894 | 0.9847 | |||||
| Peak 3 | Ea, kJ∙mol−1∙K−1 | From 425.0 °C ± 1.6 to 497.7 °C ± 5.7 | 60.3 ± 2.5 | From 461.7 °C ± 1.7 to 538.3 °C ± 3.3 | 74.2 ± 1.5 | From 375.7 °C ± 90.4 to 889.7 °C ± 1.9 | 65.0 ± 7.4 | |
| A, s−1 | 1.48 ± 0.58 × 10⁻³ | 1.84 ± 0.49 × 10⁻² | 4.17 ± 2.81 × 10⁻³ | |||||
| R2 | 0.9887 | 0.9887 | 0.9430 | |||||
| Peak 4 | Ea, kJ∙mol−1∙K−1 | From 155.3 °C ± 53.7 to 852.0 °C ± 55.9 | 27.9 ± 1.2 | From 176.3 °C ± 5.6 to 890.7 °C ± 1.9 | 36.8 ± 0.7 | - | - | |
| A, s−1 | 2.73 ± 1.05 × 10⁻⁶ | 2.15 ± 0.25 × 10⁻⁵ | - | |||||
| R2 | 0.9431 | 0.9568 | - | |||||
| Kinetic Parameters | Heating Rate, β | |||||||
|---|---|---|---|---|---|---|---|---|
| 5 °C∙min−1 | 10 °C∙min−1 | 20 °C∙min−1 | ||||||
| Hazelnut shell | Peak 1 | Ea, kJ∙mol−1∙K−1 | From 145.7 °C ± 8.8 to 274.3 °C ± 15.8 | 36.2 ± 9.8 | From 198.7 °C ± 3.7 to 330.7 °C ± 4.9 | 48.7 ± 7.2 | From 272.3 °C ± 6.2 to 448.0 °C ± 8.6 | 51.5 ± 8.1 |
| A, s−1 | 2.70 ± 3.43 × 10⁻⁴ | 1.56 ± 1.97 × 10⁻³ | 9.81 ± 12.6 × 10⁻³ | |||||
| R2 | 0.9332 ± 0.0329 | 0.9329 ± 0.0251 | 0.8986 ± 0.0042 | |||||
| Peak 2 | Ea, kJ∙mol−1∙K−1 | From 358.8 °C ± 3.6 to 449.7 °C ± 5.2 | 53.8 ± 3.9 | From 403.3 °C ± 0.9 to 487.3 °C ± 3.4 | 75.8 ± 8.6 | From 477.7 °C ± 5.7 to 621.7 °C ± 2.5 | 113.9 ± 2.4 | |
| A, s−1 | 5.24 ± 4.22 × 10⁻⁴ | 5.07 ± 5.76 × 10⁻² | 5.57 ± 1.72 × 100 | |||||
| R2 | 0.9935 ± 0.0003 | 0.9904 ± 0.0000 | 0.9859 ± 0.0007 | |||||
| Peak 3 | Ea, kJ∙mol−1∙K−1 | From 426.7 °C ± 7.8 to 502.7 °C ± 4.6 | 59.3 ± 0.4 | From 462.0 °C ± 2.9 to 541.3 °C ± 3.1 | 75.5 ± 2.5 | From 426.7 °C ± 9.0 to 882.7 °C ± 11.1 | 65.4 ± 0.9 | |
| A, s−1 | 1.02 ± 0.16 × 10⁻³ | 2.17 ± 0.76 × 10⁻² | 2.36 ± 0.28 × 10⁻³ | |||||
| R2 | 0.9892 ± 0.0012 | 0.9897 ± 0.0007 | 0.9503 ± 0.0019 | |||||
| Peak 4 | Ea, kJ∙mol−1∙K−1 | From 173.0 °C ± 61 to 846.7 °C ± 64.1 | 28.2 ± 1.4 | From 201.°C ± 30.1 to 880.7 °C ± 16.0 | 36.8 ± 0.9 | - | - | |
| A, s−1 | 2.87 ± 1.14 × 10⁻⁶ | 2.07 ± 0.25 × 10⁻⁵ | - | |||||
| R2 | 0.9422 ± 0.036 | 0.9593 ± 0.0111 | - | |||||
| Kinetic Parameters | Heating Rate, β | |||||||
|---|---|---|---|---|---|---|---|---|
| 5 °C∙min−1 | 10 °C∙min−1 | 20 °C∙min−1 | ||||||
| Peanut shell | Peak 1 | Ea, kJ∙mol−1∙K−1 | From 131.3 °C ± 11.1 to 251.0 °C ± 2.4 | 34.3 ± 13.0 | From 183.3 °C ± 9.7 to 306.7 °C ± 3.9 | 36.7 ± 9.7 | From 245.7 °C ± 2.9 to 397.7 °C ± 3.9 | 47.2 ± 14.1 |
| A, s−1 | 2.00 ± 2.33 × 10⁻⁴ | 1.92 ± 2.62 × 10⁻⁴ | 2.41 ± 3.39 × 10⁻³ | |||||
| R2 | 0.9316 | 0.9617 | 0.9488 | |||||
| Peak 2 | Ea, kJ∙mol−1∙K−1 | From 350.0 °C ± 7.9 to 505.7 °C ± 3.3 | 53.4 ± 4.5 | From 399.3 °C ± 4.6 to 546.7 °C ± 5.8 | 75.5 ± 2.9 | From 475.3 °C ± 17.6 to 593.0 °C ± 14.4 | 116.0 ± 9.9 | |
| A, s−1 | 4.62 ± 3.42 × 10⁻⁴ | 2.22 ± 0.87 × 10⁻² | 2.84 ± 3.46 × 101 | |||||
| R2 | 0.9868 | 0.9892 | 0.9920 | |||||
| Peak 3 | Ea, kJ∙mol−1∙K−1 | From 426.7 °C ± 39.7 to 688.3 °C ± 14.3 | 19.2 ± 7.0 | From 142.7 °C ± 33.2 to 892.7 °C ± 0.5 | 36.3 ± 2.5 | From 217.3 °C ± 21.3 to 863.7 °C ± 28.1 | 53.1 ± 4.4 | |
| A, s−1 | 9.34 ± 9.65 × 10⁻³ | 1.99 ± 0.69 × 10⁻⁵ | 5.53 ± 3.82 × 10⁻⁴ | |||||
| R2 | 0.9009 | 0.9666 | 0.9718 | |||||
| Peak 4 | Ea, kJ∙mol−1∙K−1 | - | - | - | - | - | - | |
| A, s−1 | - | - | - | |||||
| R2 | - | - | - | |||||
| Kinetic Parameters | Heating Rate, β | |||||||
|---|---|---|---|---|---|---|---|---|
| 5 °C∙min−1 | 10 °C∙min−1 | 20 °C∙min−1 | ||||||
| Pistachio shell | Peak 1 | Ea, kJ∙mol−1∙K−1 | From 137.0 °C ± 27.9 to 266.0 °C ± 7.9 | 30.0 ± 6.6 | From 204.3 °C ± 22.8 to 328.0 °C ± 5.4 | 43.7 ± 9.1 | From 255.0 °C ± 11.2 to 434.3 °C ± 9.9 | 51.5 ± 9.3 |
| A, s−1 | 2.45 ± 3.31 × 10⁻⁵ | 5.72 ± 7.62 × 10⁻⁴ | 1.01 ± 1.34 × 10⁻³ | |||||
| R2 | 0.9549 | 0.9289 | 0.9226 | |||||
| Peak 2 | Ea, kJ∙mol−1∙K−1 | From 350.7 °C ± 8.7 to 414.0 °C ± 8.3 | 103.8 ± 22.8 | From 400.0 °C ± 9.9 to 461.3 °C ± 11.6 | 152.5 ± 19.8 | From 456.7 °C ± 2.6 to 540.7 °C ± 2.6 | 150.3 ± 5.8 | |
| A, s−1 | 9.11 ± 12.9 × 10² | 5.05 ± 7.01 × 10⁵ | 4.29 ± 3.68 × 10³ | |||||
| R2 | 0.9667 | 0.9636 | 0.9594 | |||||
| Peak 3 | Ea, kJ∙mol−1∙K−1 | From 417.3 °C ± 6.6 to 494.3 °C ± 4.5 | 63.0 ± 6.5 | From 454.7 °C ± 6.6 to 535.3 °C ± 10.8 | 80.2 ± 5.5 | From 508.7 °C ± 2.1 to 607.3 °C ± 1.2 | 96.1 ± 3.3 | |
| A, s−1 | 5.24 ± 5.96 × 10⁻³ | 7.77 ± 4.80 × 10⁻² | 6.21 ± 3.31 × 10⁻¹ | |||||
| R2 | 0.9768 | 0.9785 | 0.9805 | |||||
| Peak 4 | Ea, kJ∙mol−1∙K−1 | From 155.3 °C ± 49.4 to 865.7 °C ± 29.2 | 31.5 ± 5.8 | From 239.7 °C ± 1.7 to 888.0 °C ± 2.9 | 45.1 ± 5.2 | From 405.7 °C ± 6.6 to 860.3 °C ± 4.1 | 67.4 ± 1.3 | |
| A, s−1 | 8.69 ± 9.01 × 10⁻⁶ | 1.31 ± 1.20 × 10⁻⁴ | 3.96 ± 0.61 × 10⁻³ | |||||
| R2 | 0.9376 | 0.9394 | 0.9331 | |||||
Publisher’s Note: MDPI stays neutral with regard to jurisdictional claims in published maps and institutional affiliations. |
© 2021 by the authors. Licensee MDPI, Basel, Switzerland. This article is an open access article distributed under the terms and conditions of the Creative Commons Attribution (CC BY) license (http://creativecommons.org/licenses/by/4.0/).
Share and Cite
Noszczyk, T.; Dyjakon, A.; Koziel, J.A. Kinetic Parameters of Nut Shells Pyrolysis. Energies 2021, 14, 682. https://doi.org/10.3390/en14030682
Noszczyk T, Dyjakon A, Koziel JA. Kinetic Parameters of Nut Shells Pyrolysis. Energies. 2021; 14(3):682. https://doi.org/10.3390/en14030682
Chicago/Turabian StyleNoszczyk, Tomasz, Arkadiusz Dyjakon, and Jacek A. Koziel. 2021. "Kinetic Parameters of Nut Shells Pyrolysis" Energies 14, no. 3: 682. https://doi.org/10.3390/en14030682
APA StyleNoszczyk, T., Dyjakon, A., & Koziel, J. A. (2021). Kinetic Parameters of Nut Shells Pyrolysis. Energies, 14(3), 682. https://doi.org/10.3390/en14030682