Article

Individual vs. Community: Economic Assessment of Energy Management Systems under Different Regulatory Frameworks

Electric Engineering Department, Escola d’Enginyeria de Barcelona Est, Polytechnic University of Catalonia, 08019 Barcelona, Spain
*
Author to whom correspondence should be addressed.
Energies 2021, 14(3), 676; https://doi.org/10.3390/en14030676
Submission received: 30 November 2020 / Revised: 16 January 2021 / Accepted: 21 January 2021 / Published: 28 January 2021

Abstract

:
In the context of the increasing popularity of self-sufficient communities around the globe, this study aims to compare the economic performance of energy management in two distinct situations: whether it is conducted individually or collectively within a community. After setting the context and completing a literature review, a research gap concerning the influence of regulatory frameworks in the economic results is identified. Therefore, this work presents this comparison under several frameworks employed to promote renewable energy, in order to provide a more realistic point of view and deliver insights in policy making. To this end, a mixed integer linear program (MILP) is developed, and the formulation of three key regulatory schemes is embedded into it: feed-in tariff, net metering, and self-consumption schemes. A what-if analysis is performed in order to take into account different combinations of rewarding parameters for each regulatory framework, as well as different profiles of consumption for the individual case. Results show that energy management within a community improves the overall average benefit of the customers up to 0.44 €/day·dwelling, for all of the studied frameworks except feed-in-tariff and some instances of type-B self-consumption, which can reduce it up to −0.87 €/day·dwelling. The conclusions determine fundamental differences between regulatory schemes and their suitability to promote collective or individual facilities, and emphasize the need to design a set of policies that take into account the habits of consumption of the individuals to foster effectively energy communities.

1. Introduction

1.1. Context

The reduction of greenhouse gases emissions, the increase of the share of renewable energies and the improvement of energy efficiency are the three key targets set up in the 2030 European Union (EU) climate and energy framework [1]. With this goal in mind, the integration of distributed energy resources (DER) in the electrical system is being heavily promoted in many countries around the world [2]. Moreover, investments in renewable energy are regarded as a catalyst for the recovery of the economy in the post-pandemic times to come [3]. Many electricity consumers are increasing their level of self-sufficiency and becoming prosumers, owing to their financial and environmental concerns. The majority of these investments, at least in the EU, take the form of rooftop photovoltaic (PV) systems [4]. These facilities are normally privately-owned, and the generated electricity is either used for satisfying the owners’ loads or dumped into the grid. Habitually in this type of facilities generation and consumption peaks do not match in time, which leads the prosumers to have a low level of self-sufficiency no matter what initial investment they made.
In contrast to the current model in which consumers are passive actors, the energy community paradigm encourages the voluntary participation of consumers in the energy system, by engaging in the production process [5]. By sharing an identical pattern of generation but different consumption peaks, PV self-sufficiency and load matching [6] can be increased. In addition, communities amass a greater financial power which allows them to invest in other sources such as wind farms or combined heat and power (CHP). In consequence, energy communities are seen as a promising tool to tackle the EU targets for 2030.
However, it is not clear up to which point the association of individuals within a community is beneficial for all the participants [7]. Moreover, social, geographic [8], and psychological factors [9,10], risk aversion and political attitudes [11] can hinder the development of a peer-to-peer managed community. Willingness to invest financial resources [10] remains equally a determinant factor that has to be taken into account. If an individual is capable to perceive a better return acting by his own rather than acting jointly in a community, his willingness to participate in the system will be diminished.
Furthermore, the influence of regulatory frameworks remains a topic which is often overlooked when analyzing economic benefits in an energy context. A regulatory framework or scheme consists of a set of laws and policies developed in order to regulate the physical and economic conditions in which a facility operates. The influence of regulation in community renewable energy has been highlighted several times: whether local government can engage in renewable energy activities [12], how policy makers can handle the development of the new microgrid landscape [13] or how can it balance incentives to stimulate investment into PV energy [9]. Therefore, a comparison between the economic benefits of an energy community and their individuals acting separately is needed, not only to understand how these communities can shape our future energy landscape, but more importantly, how policy should be addressed to promote them.

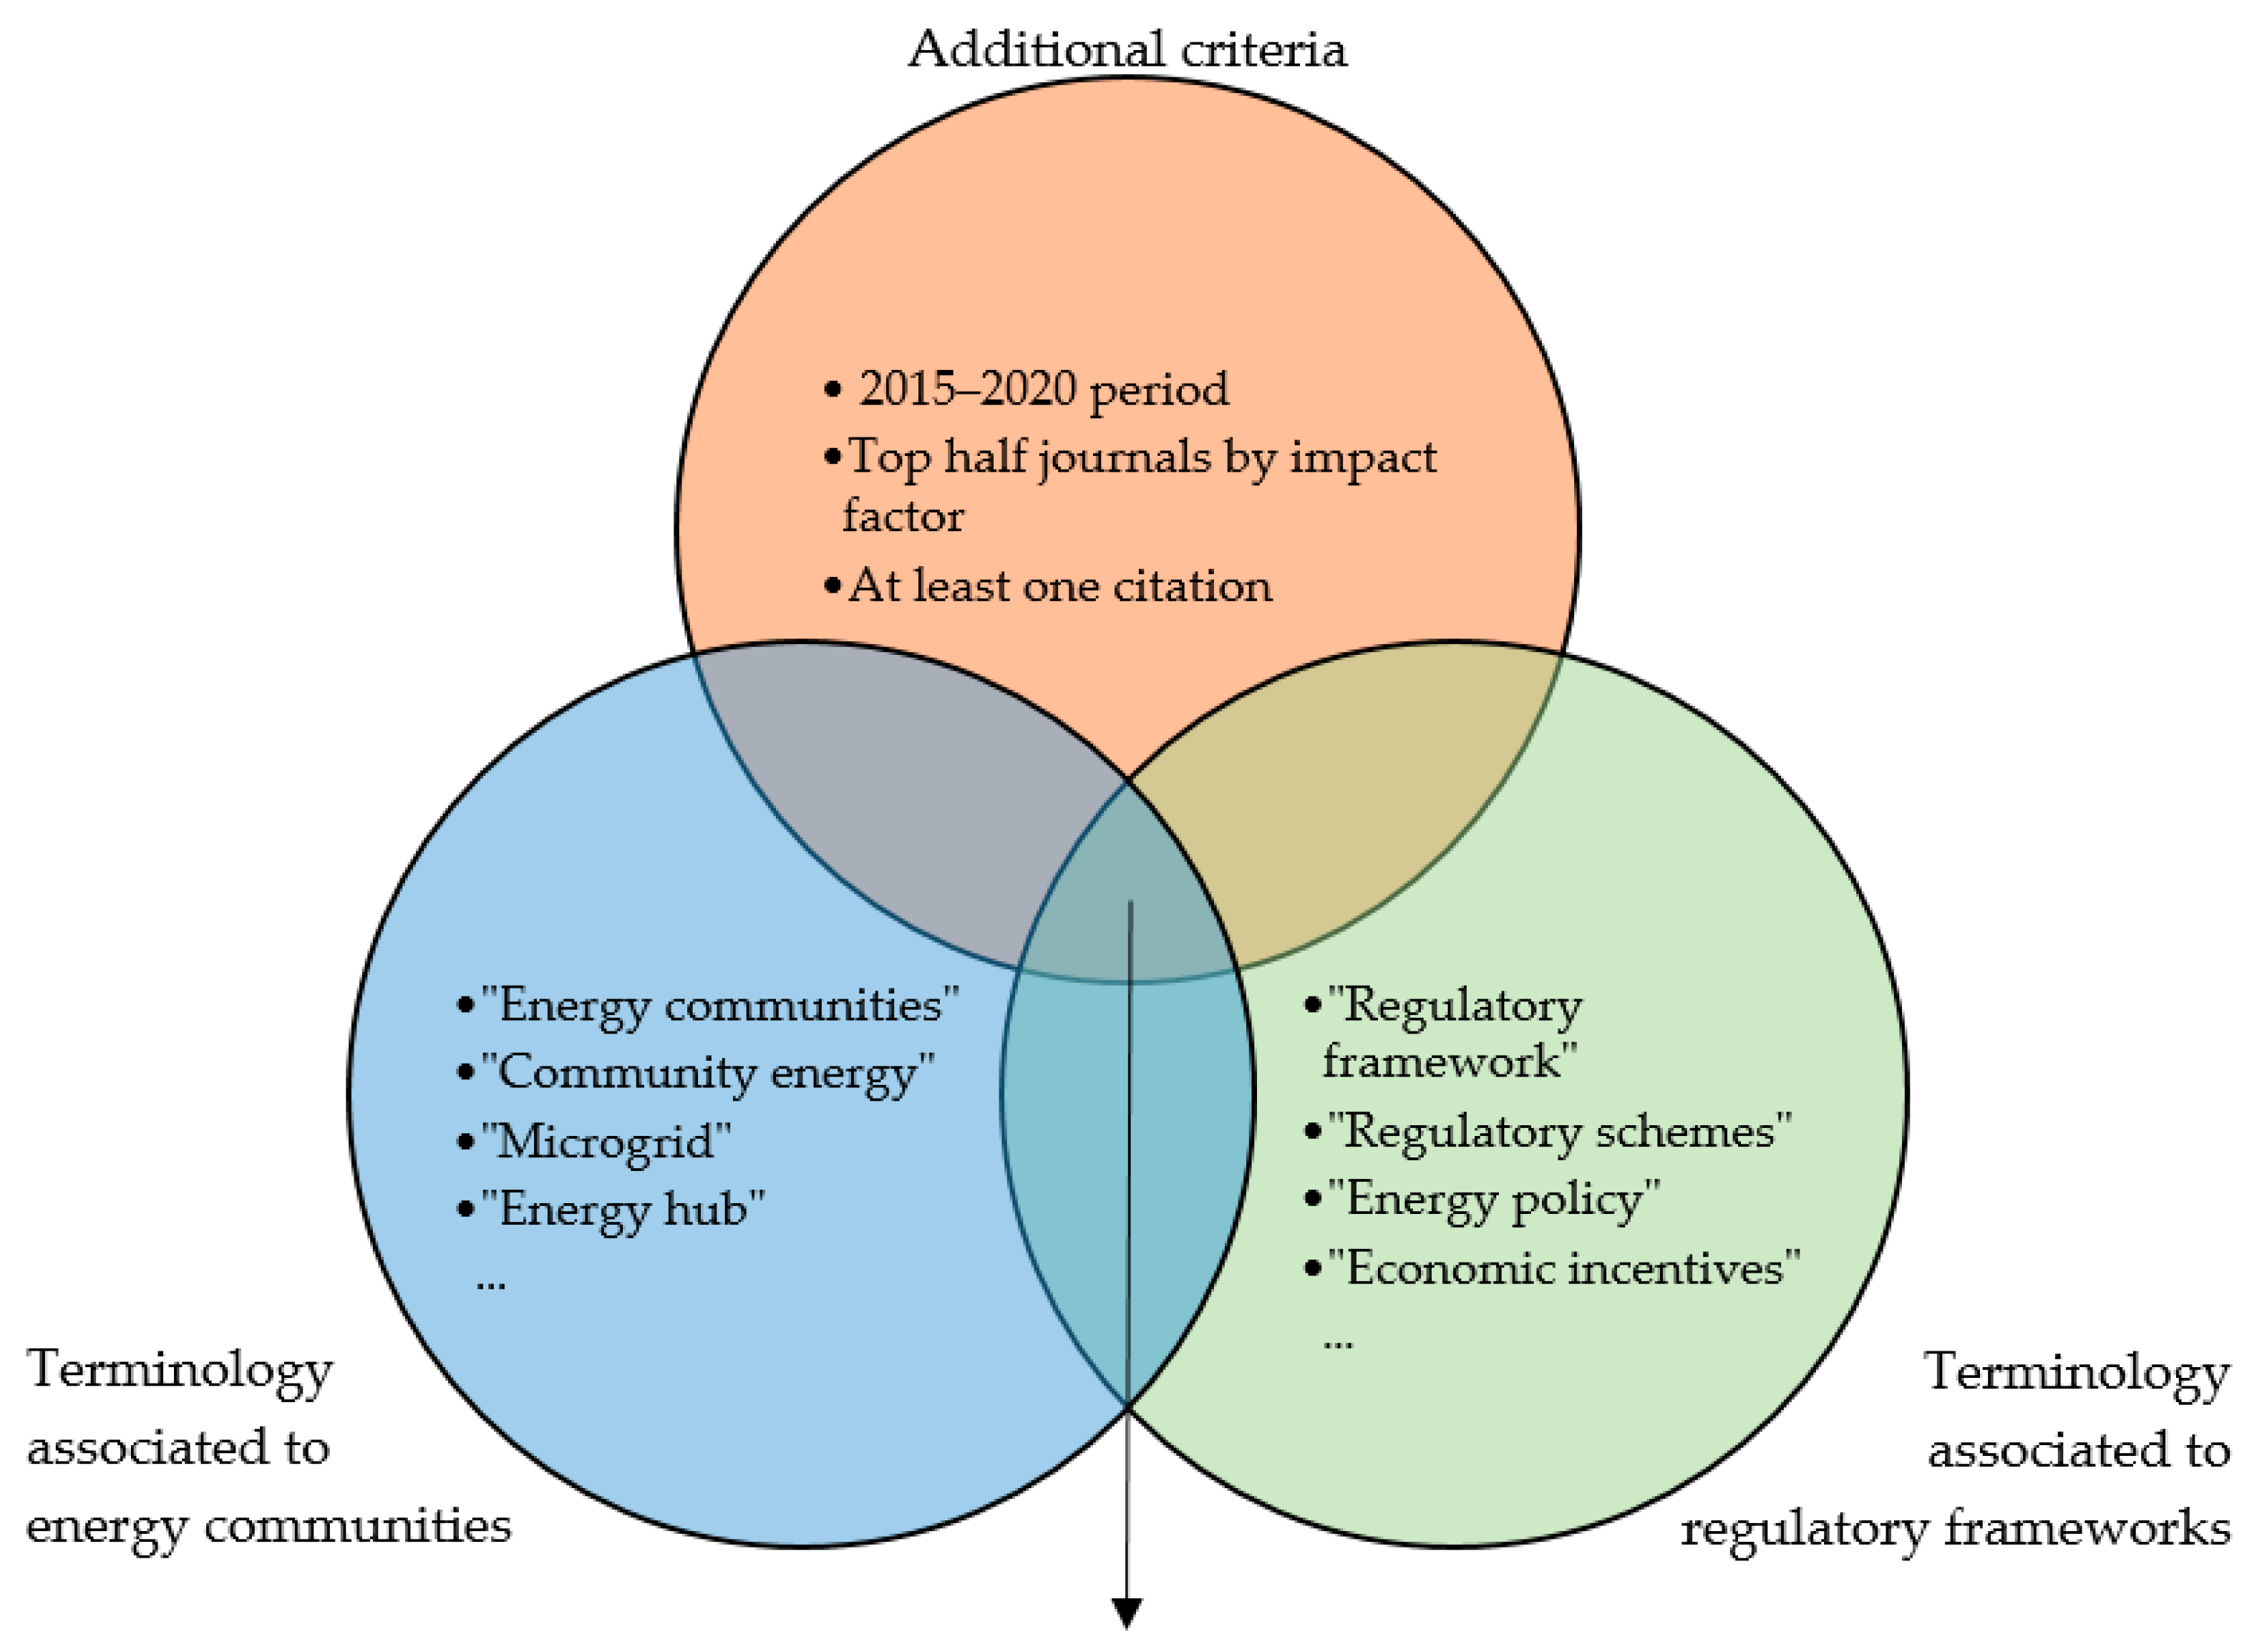
1.2. Literature Survey

In order to identify the publications that are related the most to the subject of study, several queries on Scopus database were performed. Scopus has been deemed appropriate because it includes articles from a broad range of publishers, including all of the Elsevier, IEEE and MDPI journals. The queries included a combination of terms related to the fundamental topic of this article, which are regulatory frameworks addressed to promote the development of energy communities. On one side of the query, the terminology associated to energy community was introduced while on the other side, the terminology associated to regulatory frameworks was inserted. The results were filtered to include exclusively research articles from the last five years and at least one citation, pertaining to the upper half of the journals ranked by their impact factor. Figure 1 illustrates the methodology employed in the article selection.
After this initial selection, articles regarding more technical aspects of the microgrid such as controller design or renewable energy forecasting were discarded. The final list of articles was obtained from a range of 85 articles that met these criteria and a few sources that the authors knew beforehand.
The scientific literature found under this process cover different knowledge gaps regarding individual and collective results in operation of microgrids. In [14], a microgrid with an internal market is designed. The price of energy is determined through social welfare maximization, and the operator ensures that no entity is penalized with respect to acting individually. A peer-to-peer, blockchain-managed market is theorized in [15]. In their literature review, the authors demonstrate that this feature can enhance self-sufficiency and a reduction of costs compared to the individual case, although they warn about the importance of regulation in the economic results.
Multi-agent and game theory models have been widely employed in order to quantify the benefits of each participant in a community. In [16], a three-tiered optimization is performed in which microgrid energy balances, aggregator scheduling and trading between aggregators are taken into account. This methodology enables decentralized energy trading between communities, as opposed to the actual paradigm of centralized dispatch. In [17], a cooperative game model is performed in order to simulate each prosumer’s behavior, which is to maximize their own benefit. A Stackelberg game is developed in [18] to model the relationship between consumers and the retail utility, owner of the microgrid. The centralized approach improves retail profit while the decentralized one improves consumer surplus. Game theory models are also employed in a market context [19], and in the estimation of incentives for energy storage [20].
Energy storage is, indeed, a recurrent topic of study in energy communities research. Battery and PV centralization and sharing are studied in [21] and promising results arise from this study, regarding an increase of self-sufficiency, an increase of self-consumption, and peak load shaving. Similar conclusions are reached in [22], where a battery control system in which sensing and communication are reduced is implemented. The battery role in peer-to-peer trading is investigated in [23,24]. Savings are observed for both cases, when the storage is privately owned and when it is shared between the members of the community, being marginally higher in the first case. However, interaction between members of the community and profitability of the renewable sources is higher when the battery is shared. In [25], a sharing community with an aggregator and several users with distributed energy sources is modeled. A metric called coordination surplus is defined as the difference between the users’ cost acting in community and the one if they traded independently with the aggregator. Results show a nonnegative coordination surplus, justifying the usefulness of the aggregator. Additional models addressed to evaluate the feasibility of energy storage can be found in [26,27] for the energy community, and in [28] for the individual case. Lastly, regulatory barriers against battery sharing are analyzed in [29], showing that changes need to be made in order to adopt community energy storage.

1.3. Gap Identification and Main Contributions

After thoroughly analyzing the scientific literature, several advantages of joining a community have been identified. Among them, there is the participation in the electricity market, the reduction of energy exchange with the grid, the reduction of environmental impact, an increase of self-sufficiency and peak load shaving. All of these can lead to an improvement in the finances of the users of the microgrid.
Nevertheless, to the best authors’ knowledge, there is a lack of studies addressed to determine whether the economic results of an energy community microgrid are superior to those obtained by a private-owned facility. Moreover, even though the relevance of regulation has been constantly emphasized [9,12,13], there are currently no studies that identify whether different regulatory frameworks might affect the comparison of the individual and the community cases.
Therefore, the main contributions of this article can be expressed as follows:
-
Identification and definition of key regulatory frameworks that may impact in the finances of the users of a microgrid.
-
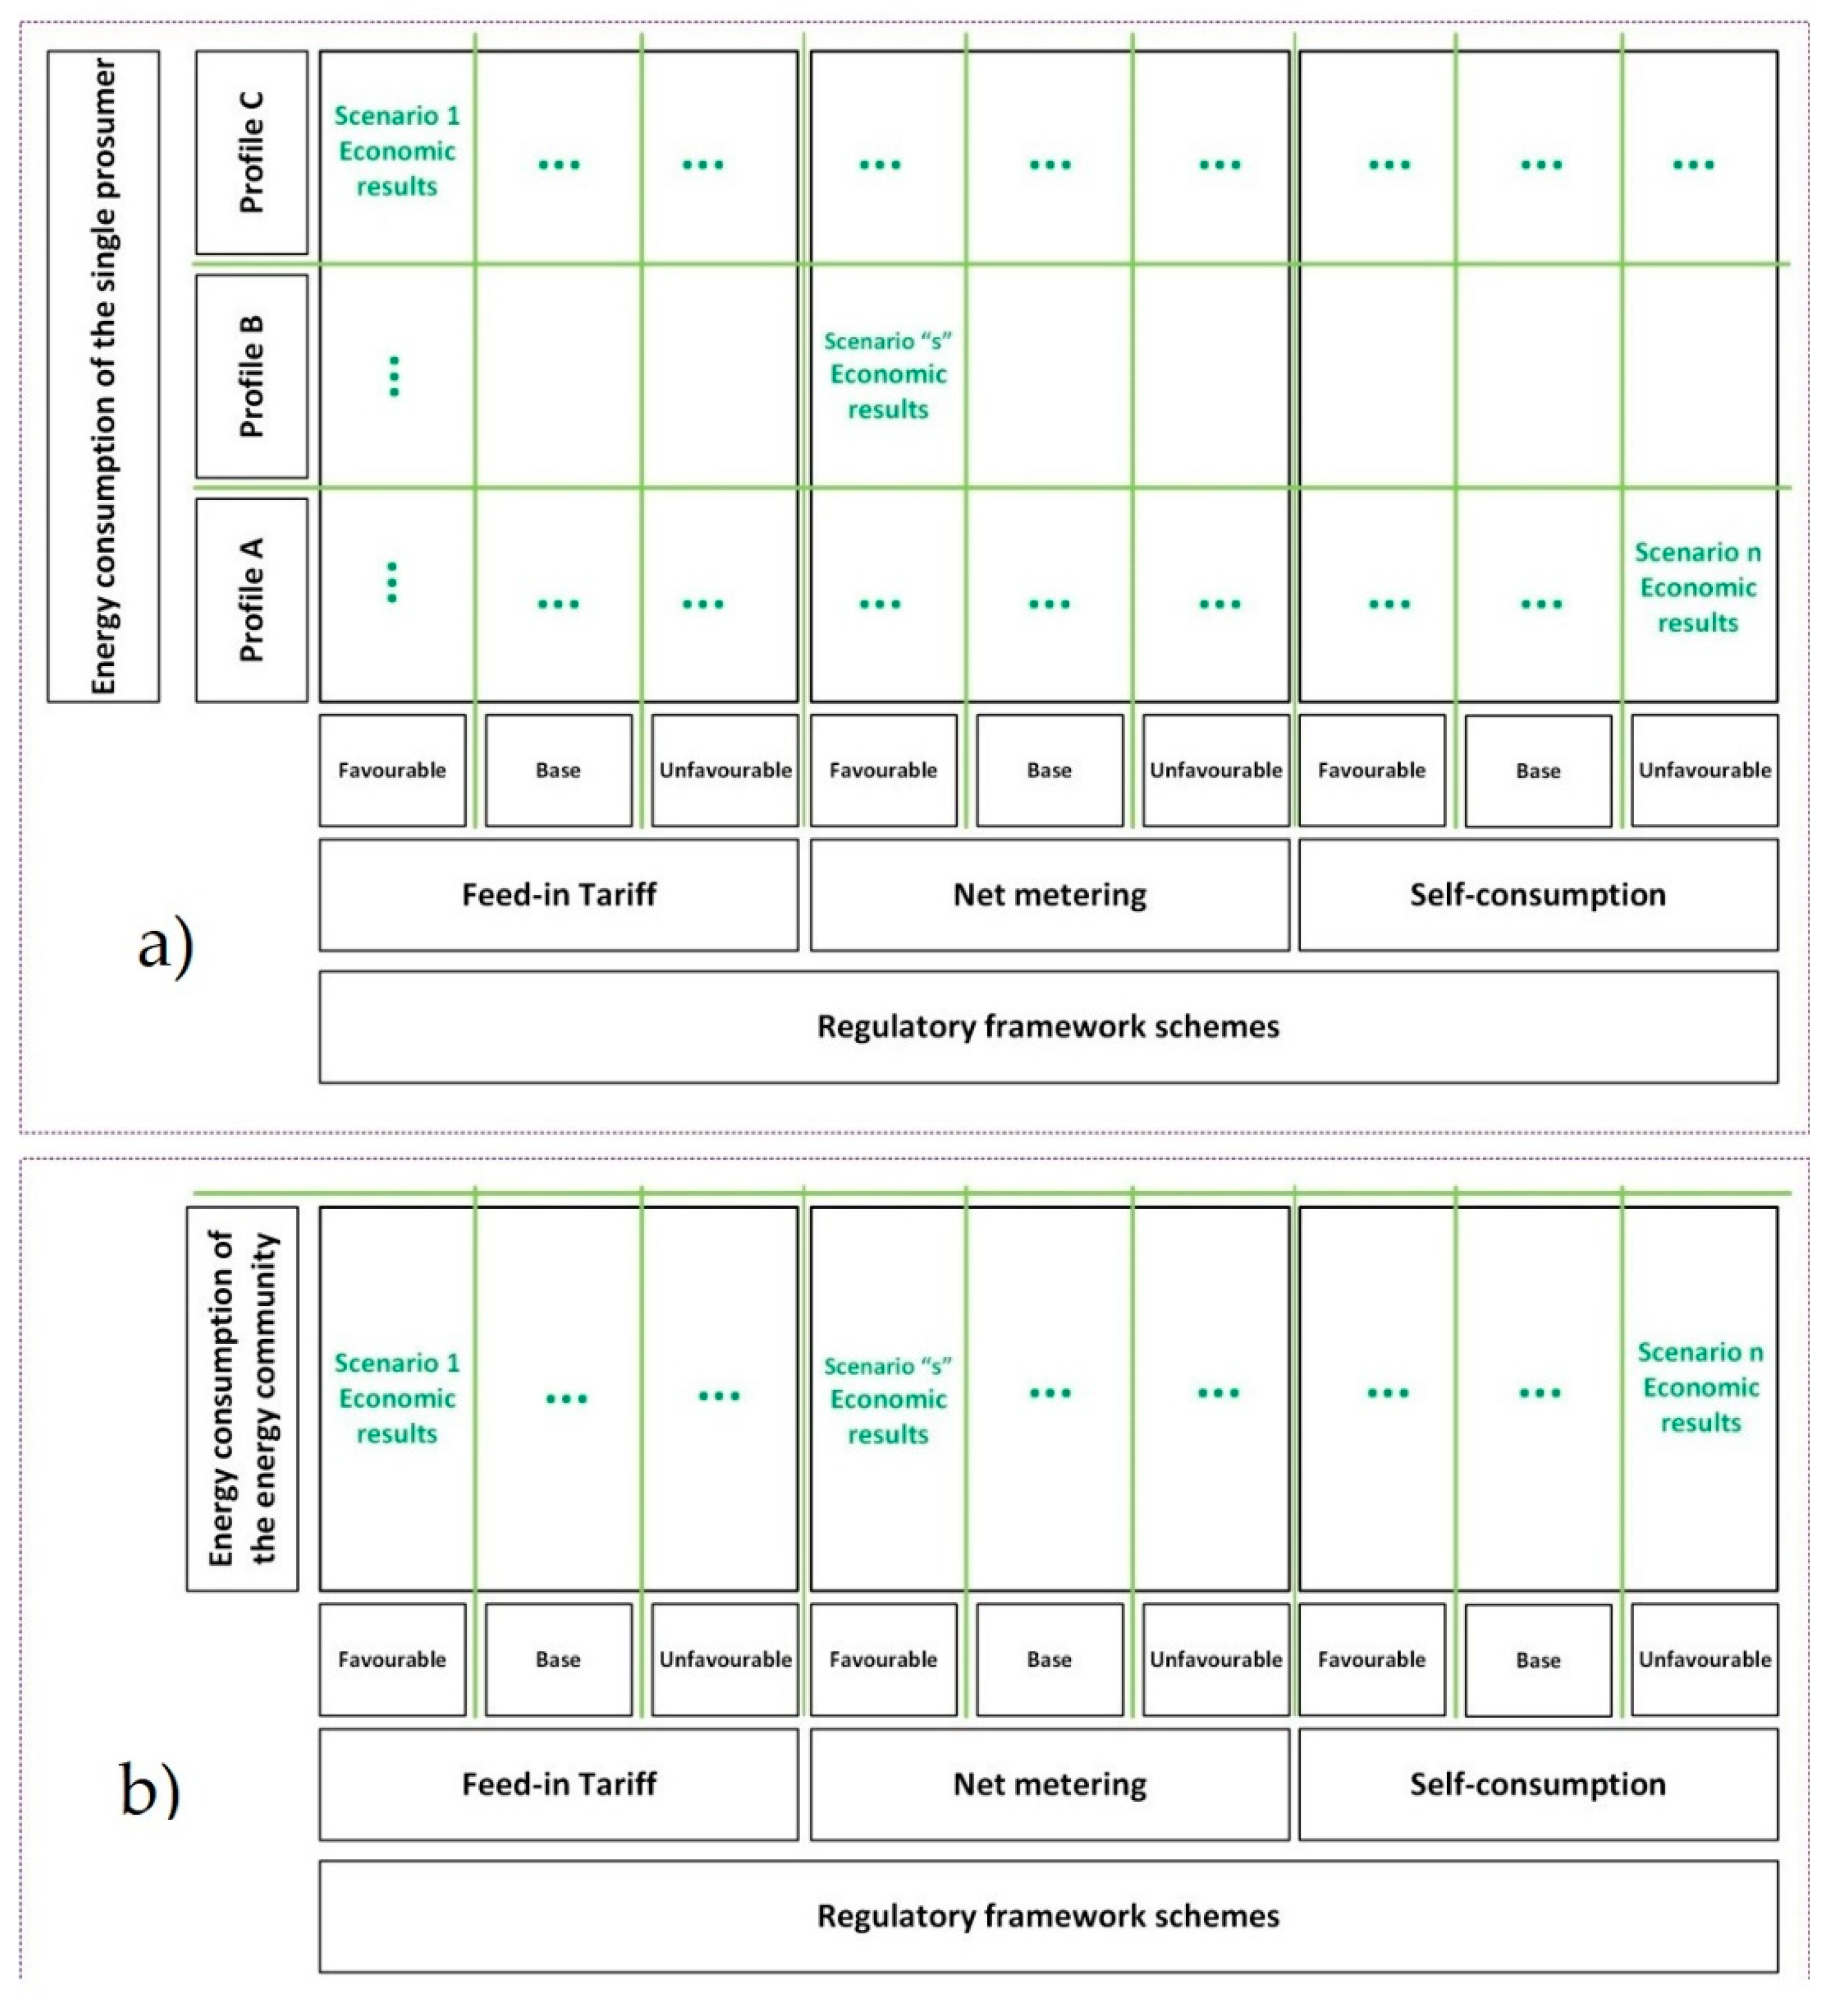
Definition of the boundaries of a what-if analysis addressed to quantify whether:
a)
The economic results of a single prosumer under the same regulatory scheme might be affected by the consumption profiles.
b)
The economic results of an individual or collective entity might be affected by the regulatory scheme under application.
-
Examination of the findings and provision of a clear insight into the pros and cons of an energy community versus a private facility. These insights derive from the discussion of the effects of the regulatory frameworks and consumption profiles on the results.
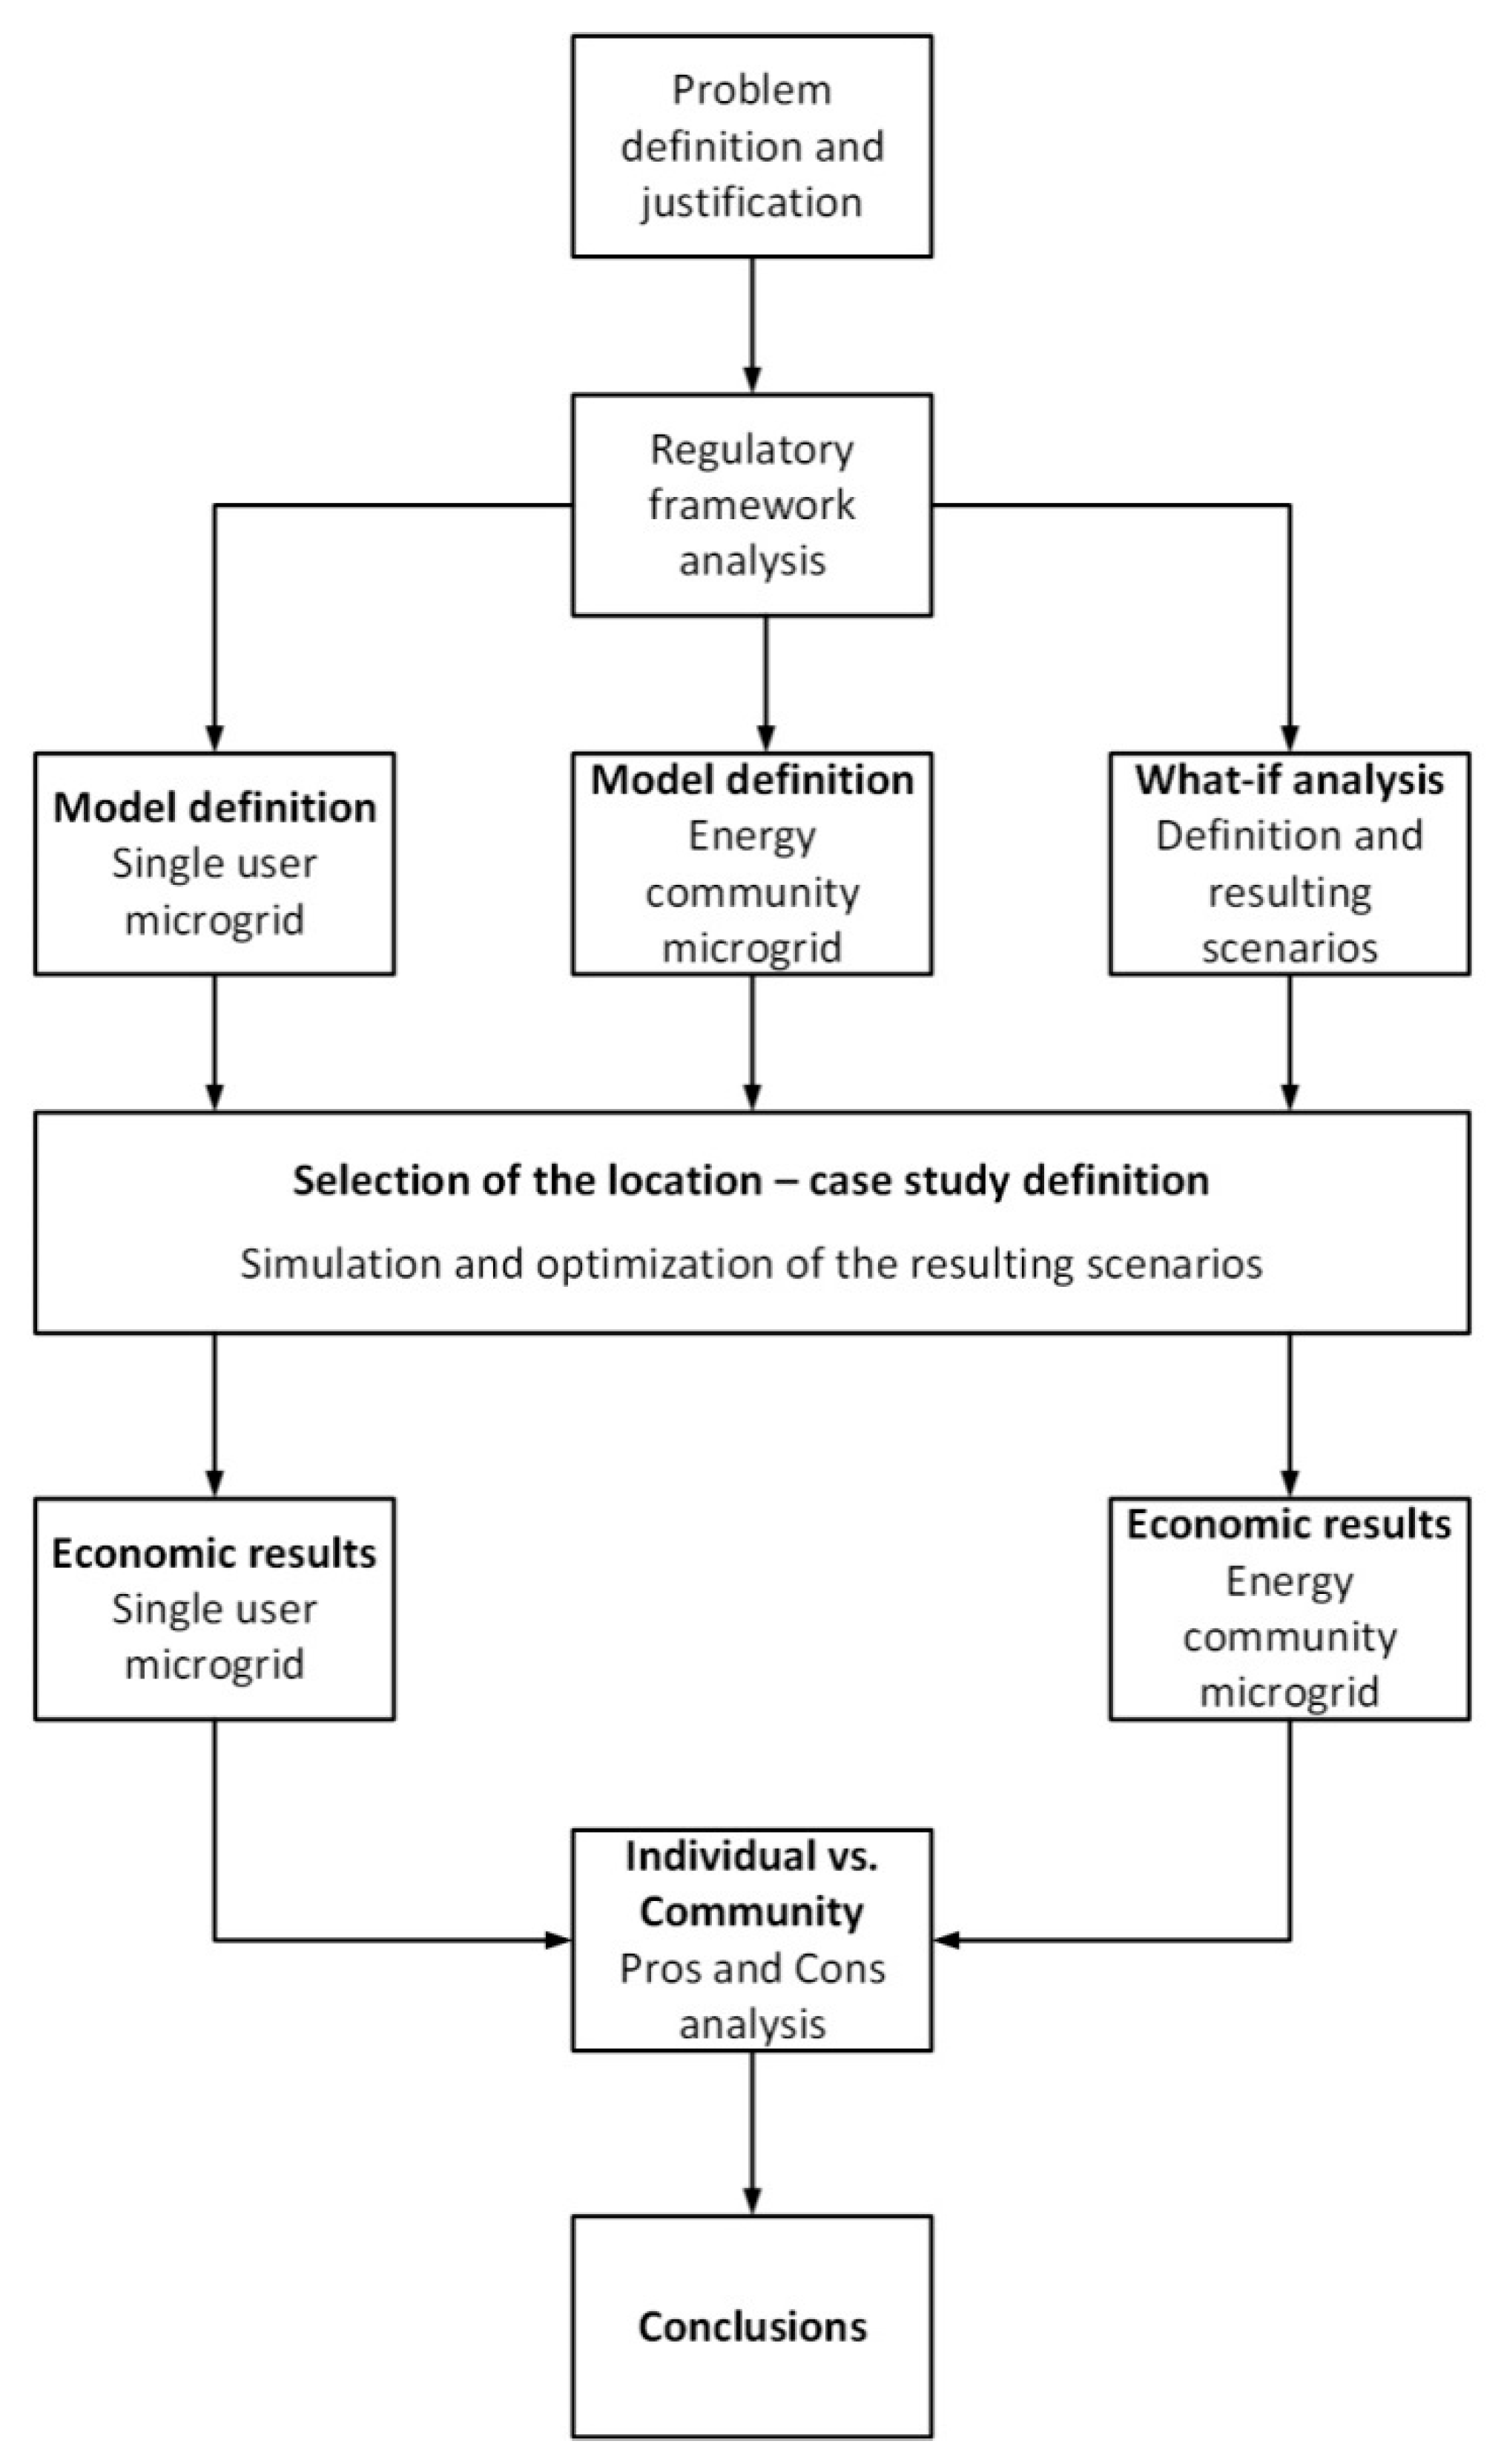
1.4. Methodology

As depicted in Figure 2, the methodology used in this study was developed in several stages. The first stage focused its attention on the literature review, which resulted in the definition of the objectives of the research, mentioned in the previous section.
The second stage was aimed to analyze and characterize the most representative regulatory schemes in Europe. It was intended to synthesize the substance of the structure of these regulatory frameworks instead of characterizing the particular policy of a specific country. This work was based on the study undertaken in [30] as well as by previous authors’ work [31]. The chosen regulatory frameworks were the feed-in tariff (FiT) scheme, the net metering scheme and the self-consumption scheme.
In the third stage, two different tasks were conducted. First, the models of an energy community under various regulatory schemes [31], were adequately adapted in order to obtain a model for a single prosumer. The second task was intended to define the plausible scenarios of both cases, individual and collective. These scenarios were established to take into account the effect of distinct values in the regulatory parameters of the analyzed frameworks, as well as the impact of diverse profiles of consumption in the individual case.
In the fourth stage, the case study was defined. The location, technical and economic parameters of the case study used in the what-if analysis were the same that the authors employed in [31], but including the necessary data to characterize the single prosumer behavior.
In the fifth stage, the optimization of the energy management system (EMS) of the case study was conducted, and results were depicted. Following, a discussion of pros and cons according to the results was held, and conclusions were obtained.

2. Microgrid Model and Mathematical Program
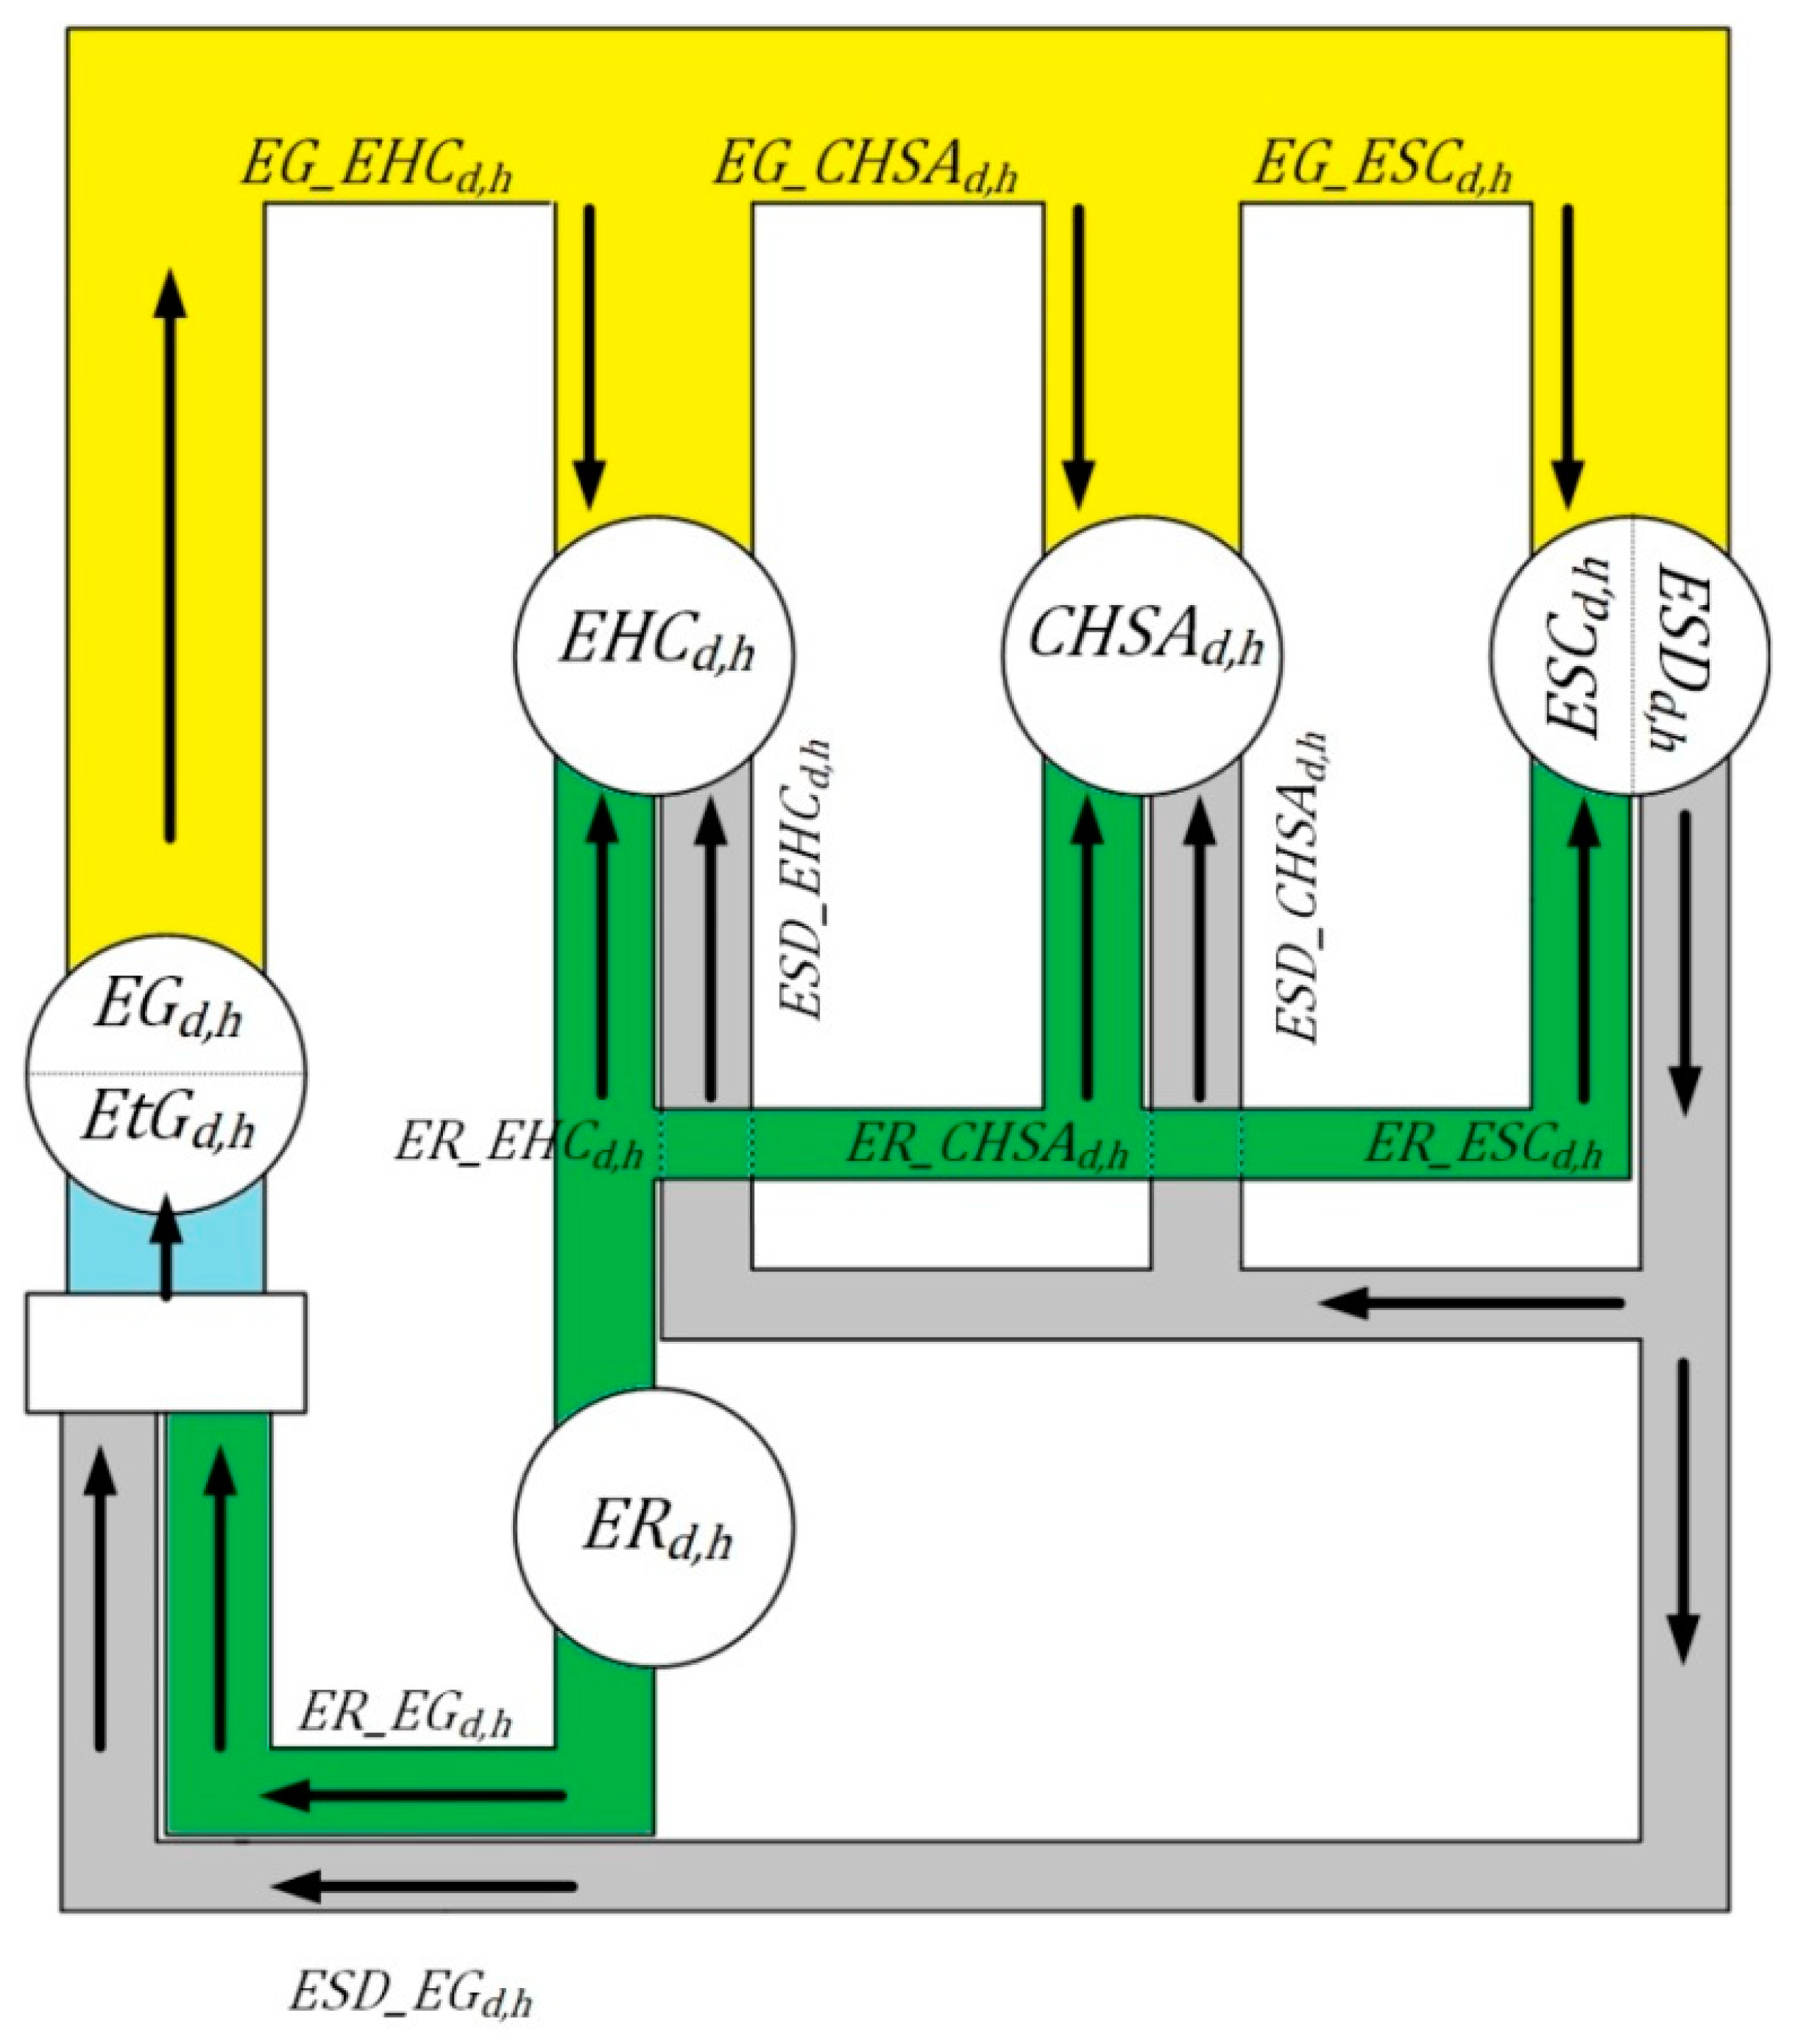
2.1. Physical Model

The model of a single prosumer, which includes physical, economic and regulatory aspects, is based on [31]. A summarized description of the single prosumer model has been provided in order to avoid repetitions in the description of the model, especially in the economic and regulatory field. A more elaborate description and explanation can be retrieved from [31].
The prosumer owns a DER facility, consisting of PV modules and an energy storage system (ESS) The prosumer enjoys full access to the electricity network, so he may satisfy his demand through the hourly (h) energy supplied by the grid each day (d) (EGd,h). Likewise, the prosumer can make use of the hourly energy generated by his PV modules each day (ERd,h) constrained to its maximum potential (ER_Maxd,h) and the hourly energy discharged on each day (ESDd,h). The energy demand of the prosumers is assigned to three different ends, that is to say, the hourly energy consumption on each day (EHCd,h), the hourly auxiliary services consumption on each day (CHSAd,h) and the hourly energy charged on each day by the ESS (ESCd,h). EHCd,h can be supplied either by the grid (EG_EHCd,h), by the renewable energy sources (RES) (ER_EHCd,h) or by the ESS (ESD_EHCd,h). Analogous relations apply to the energy flows of the ESS and the auxiliary services (AS). In addition, the prosumer can dump its energy excess into the grid, either from the RES (ER_EGd,h) or from the ESS (ESD_EGd,h). The energy power flows between the components of the microgrid is depicted in Figure 3 and defined in the following equations:
EHCd,h = EG_EHCd,h + ER_EHCd,h + ESD_EHCd,h
CHSA d,h = EG_CHSAd,h + ER_CHSAd,h + ESD_CHSAd,h
ESCd,h = EG_ESCd,h + ER_ESCd,h
EtG d,h = ER_EGd,h + ESD_EGd,h
ESDd,h = ESD_CHSAd,h + ESD_EHCd,h + ESD_EGd,h
ERd,h = ER_CHSAd,h + ER_EHCd,h + ER_EGd,h + ER_ESCd,h
EGd,h = EG_CHSAd,h + EG_EHCd,h + EG_ESCd,h
ERd,h ≤ ERmaxd,h
Besides, the ESS is modeled based on [32] and according the following constraints:
SoCd,h = Sd,h/Smax
S1,0 = S0
SoCmin ≤ SoCd,h ≤ SoCmax
Sd,h = Sd,h-1 + ESCd,h × Nbat-−ESDd,h/Nbat ∀h>1
Sd,1 = Sd-1,24 + ESCd,1 × Nbat-−ESDd,1/Nbat ∀d>1
ESD_CHSAd,h + ESD_EHCd,h + ESD_EGd,h ≤ ESDmax × Binary_St;
EG_ESCd,h + ER_ESCd,h ≤ ESCmax × Binary_St;
h   =   1 23 SoC d , h + 1     SoC d , h     0
where S0 is the initial charge, SoCmin and SoCmax are the minimum and maximum state of charge respectively, Smax is the maximum capacity of the battery, Nbat represents its performance, and ESCmax and ESDmax are the maximum charge and discharge energy that the battery can absorb or deliver in an hour. As justified in [32] the model aims to guarantee the battery lifetime according to the manufacturers’ recommendations.

2.2. Economic Model

2.2.1. Operation and Maintenance Costs

Operation and maintenance (O&M) costs comprise the ones necessary to maintain the DER facility working. These expenses can be either variable or fixed. Variable costs depend directly on the production of the facility, whereas fixed costs dismiss whether the installation is not working or is operating at maximum capacity.
Regarding solar generation, O&M costs correspond mainly to the maintenance of the modules and their structure because of time and adverse weather. These expenses are prominently fixed, meaning that they wholly depend on the size of the installation and not on the amount of generated energy.
In the ESS, O&M costs correspond to the maintenance of the batteries, but unlike PV generation they increase as a result of their use. Therefore, both variable and fixed O&M costs are taken into account:
CFG.AU = CFG × maxd,h(ERmaxd,h)
CVG . AU   = d , h ER d , h   ×   CVG
CF.ST = (ESDmax + ESCmax) × CFS
CV . ST = d , h ( ESD d , h   +   ESC d , h )   ×   CVS )
C.GAU = CFG.AU + CVG.AU + CF.St + CV.St

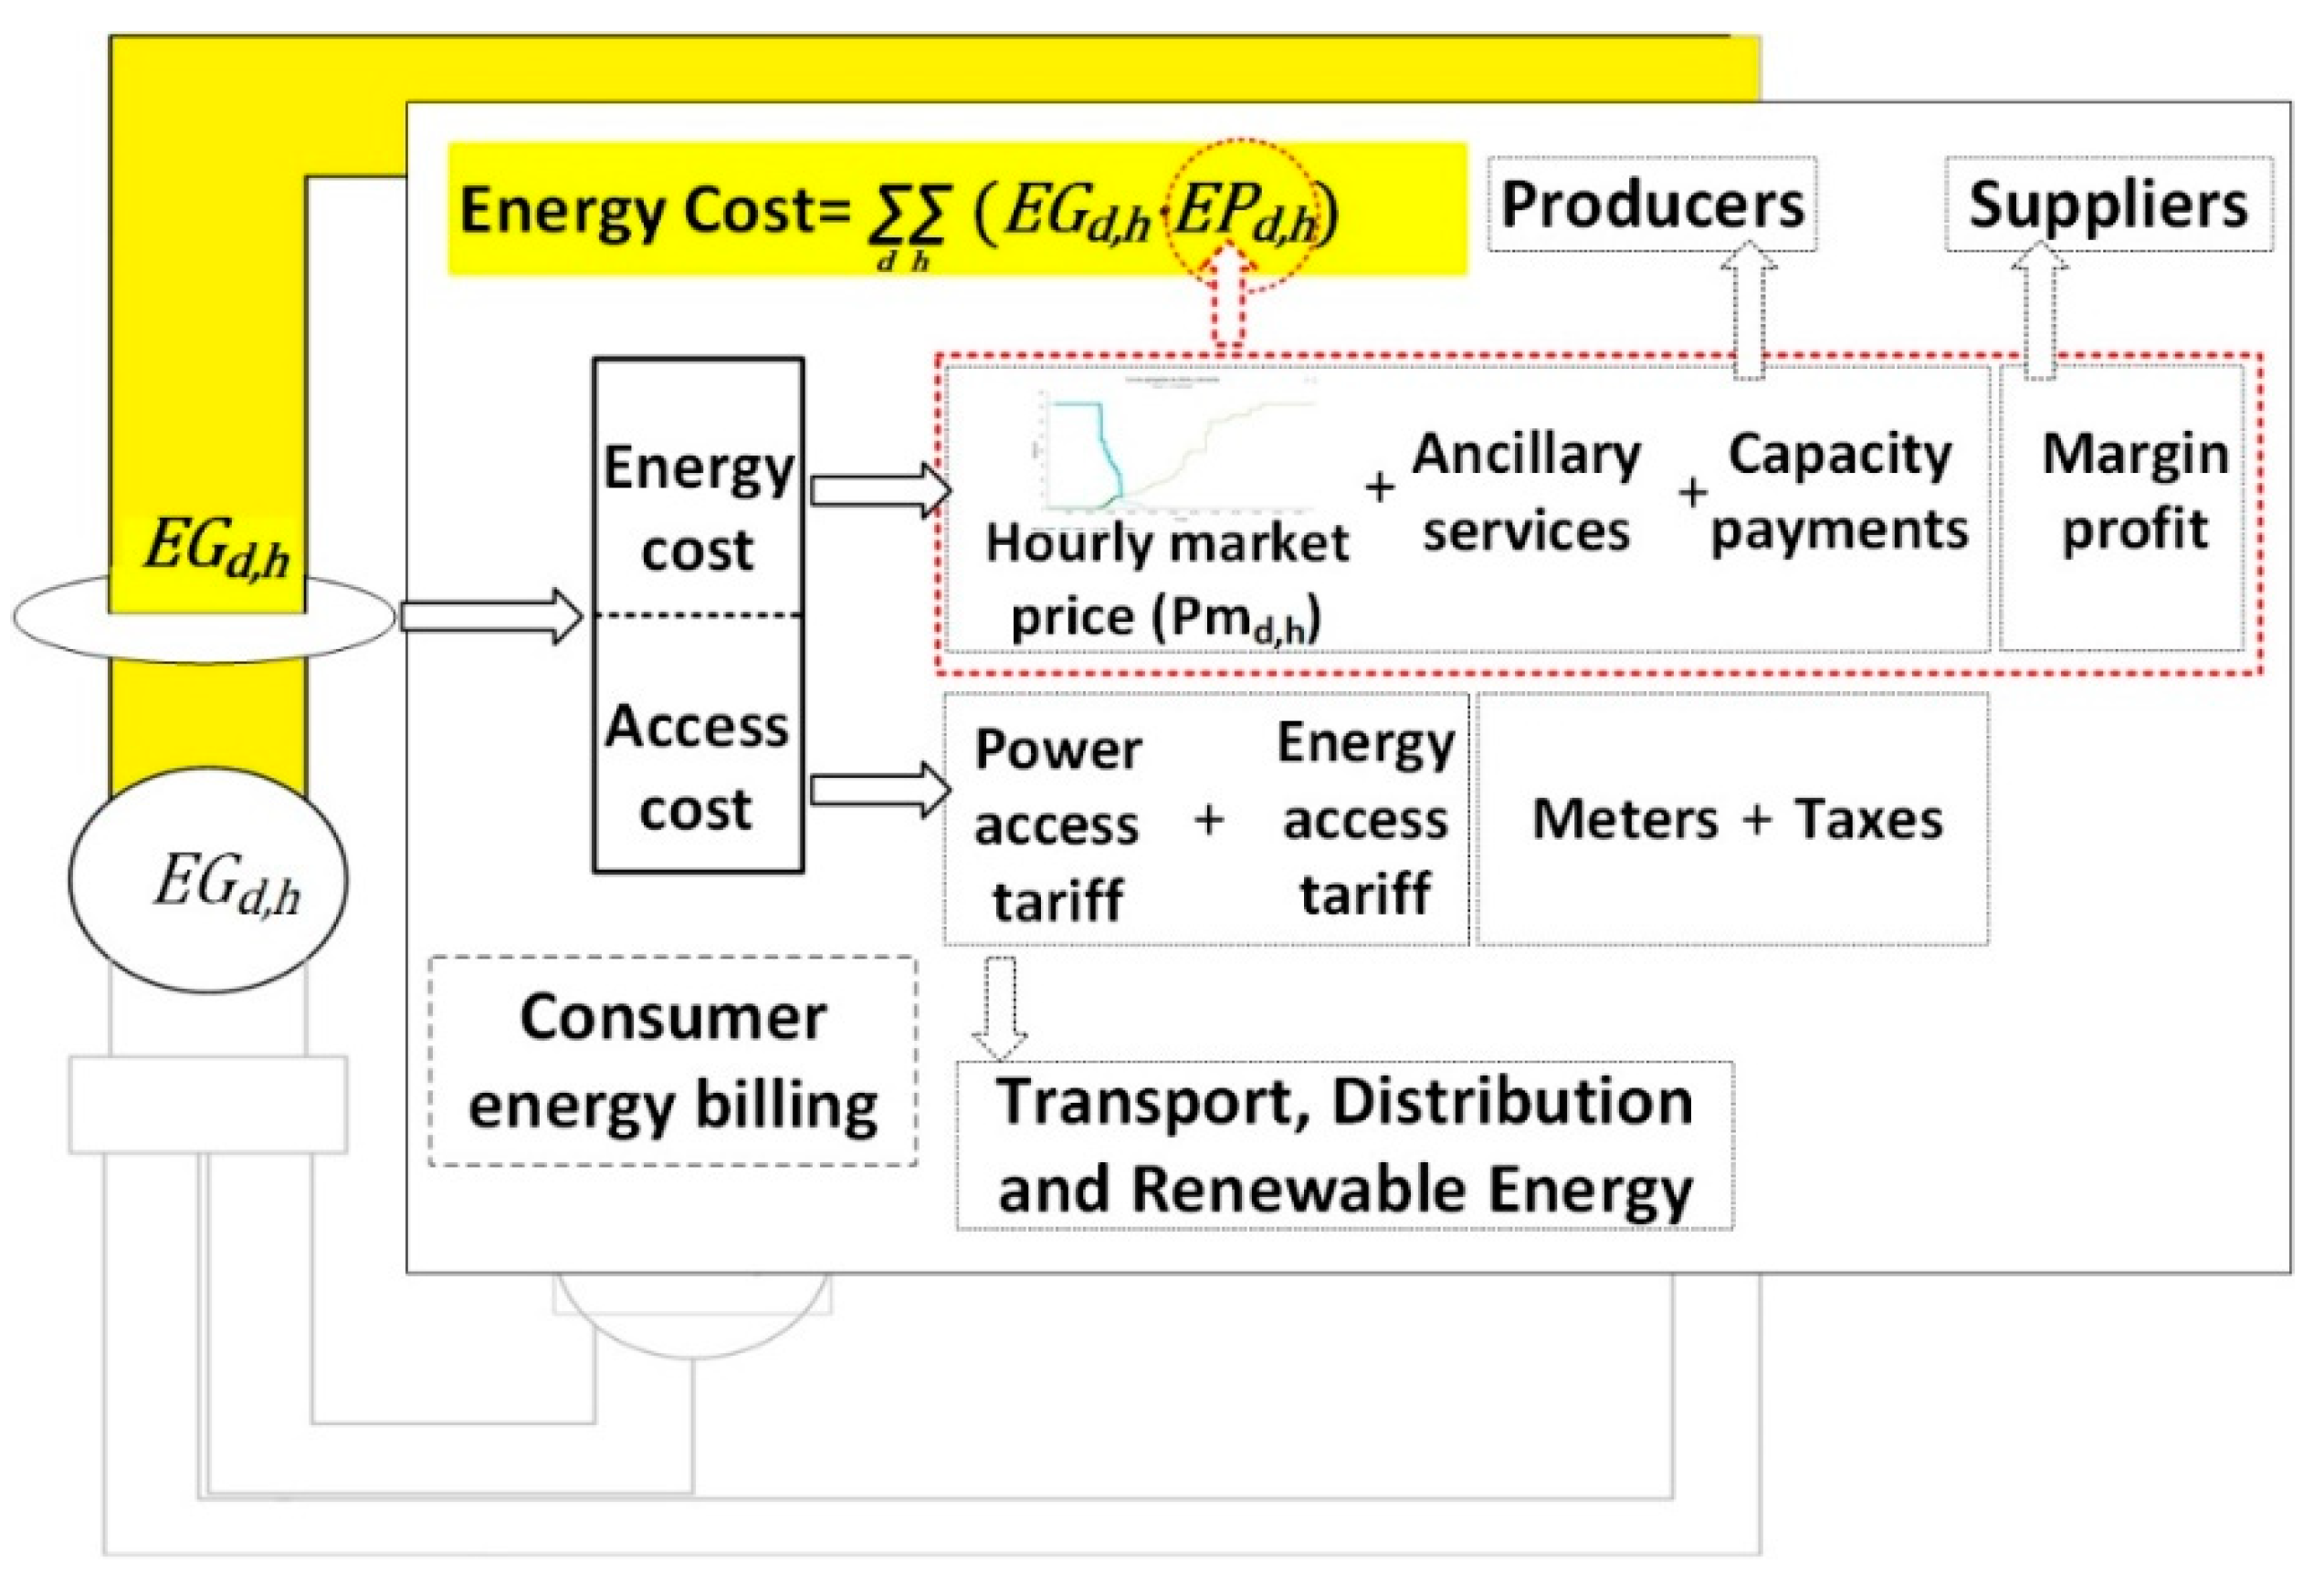
2.2.2. Consumers’ Energy Bill Structure

The calculation of the consumers’ electricity bill, disregarding financial incentives of RES, is based on the following terms (see Figure 4). The first term represents the cost of energy; it covers all the expenses to produce the energy such as the day-ahead market price (Pmd,h), the ancillary services cost and the capacity payments. Furthermore, it also includes a percentage to compensate the energy losses (CEL) of the system and the supplier’s margin profit. As a consequence, the equivalent energy price that the consumer is facing (EPd,h) is visibly higher than the market price alone.
The second term is the access tariff. Commonly overlooked when defining the energy bill structure, here it comprises two terms; the power term (Tp) and the active energy term (Te). These tariffs cover the expenditures of the transport and distribution networks, the renewable energy financial incentives, the payment to the system operator and others.
Lastly, the third term comprises the taxes and other minor charges, such as the meter rent. The taxes taken into consideration are the VAT, the electricity tax, and the generation tax. The billing procedure is depicted in Figure 4 and synthetized by the following constraints:
EnergyCost FiT   =   Tp   ×   PCon   + d , h ( EG d , h   ×   ( EP d , h   +   Te h ) )
EnergyCost NM   =   Tp   ×   PCon   + d , h ( EG d , h     EtG d , h ) ( EP d , h   +   Te h ) )
EnergyCost SFC   =   ( Tp   +   Pc )   ×   PCon   + d , h ( EG d , h   ×   ( EP d , h   +   Te h   +   Ec ) )
VAT and electricity tax coefficients are defined by a single percentage applied to the energy cost. The generation tax, conversely, depends on both the amount and the price of the sold energy:
IMP . GE   =   ENG · d , h EtG d , h   +   ING   ×   EtG d , h   ×   Pmd h  
where ENG is the coefficient of a tax over the amount of sold energy and ING is the coefficient of a tax over the price of the sold energy.
Most of the consumers in Europe are under several types of offers of power supply, such as fixed structures (with or without hour discrimination) or indexed to the electricity pool. As the fixed structure offers of power supply may vary according to the consumer and country, it is decided to choose the indexed offers. Moreover, in a context where renewable energies are taking over the electricity mix, market prices are being progressively reduced. On top of that, with the appearance of demand response strategies, it is expected that in the future dynamic pricing or mixed pricing schemes would be more common.

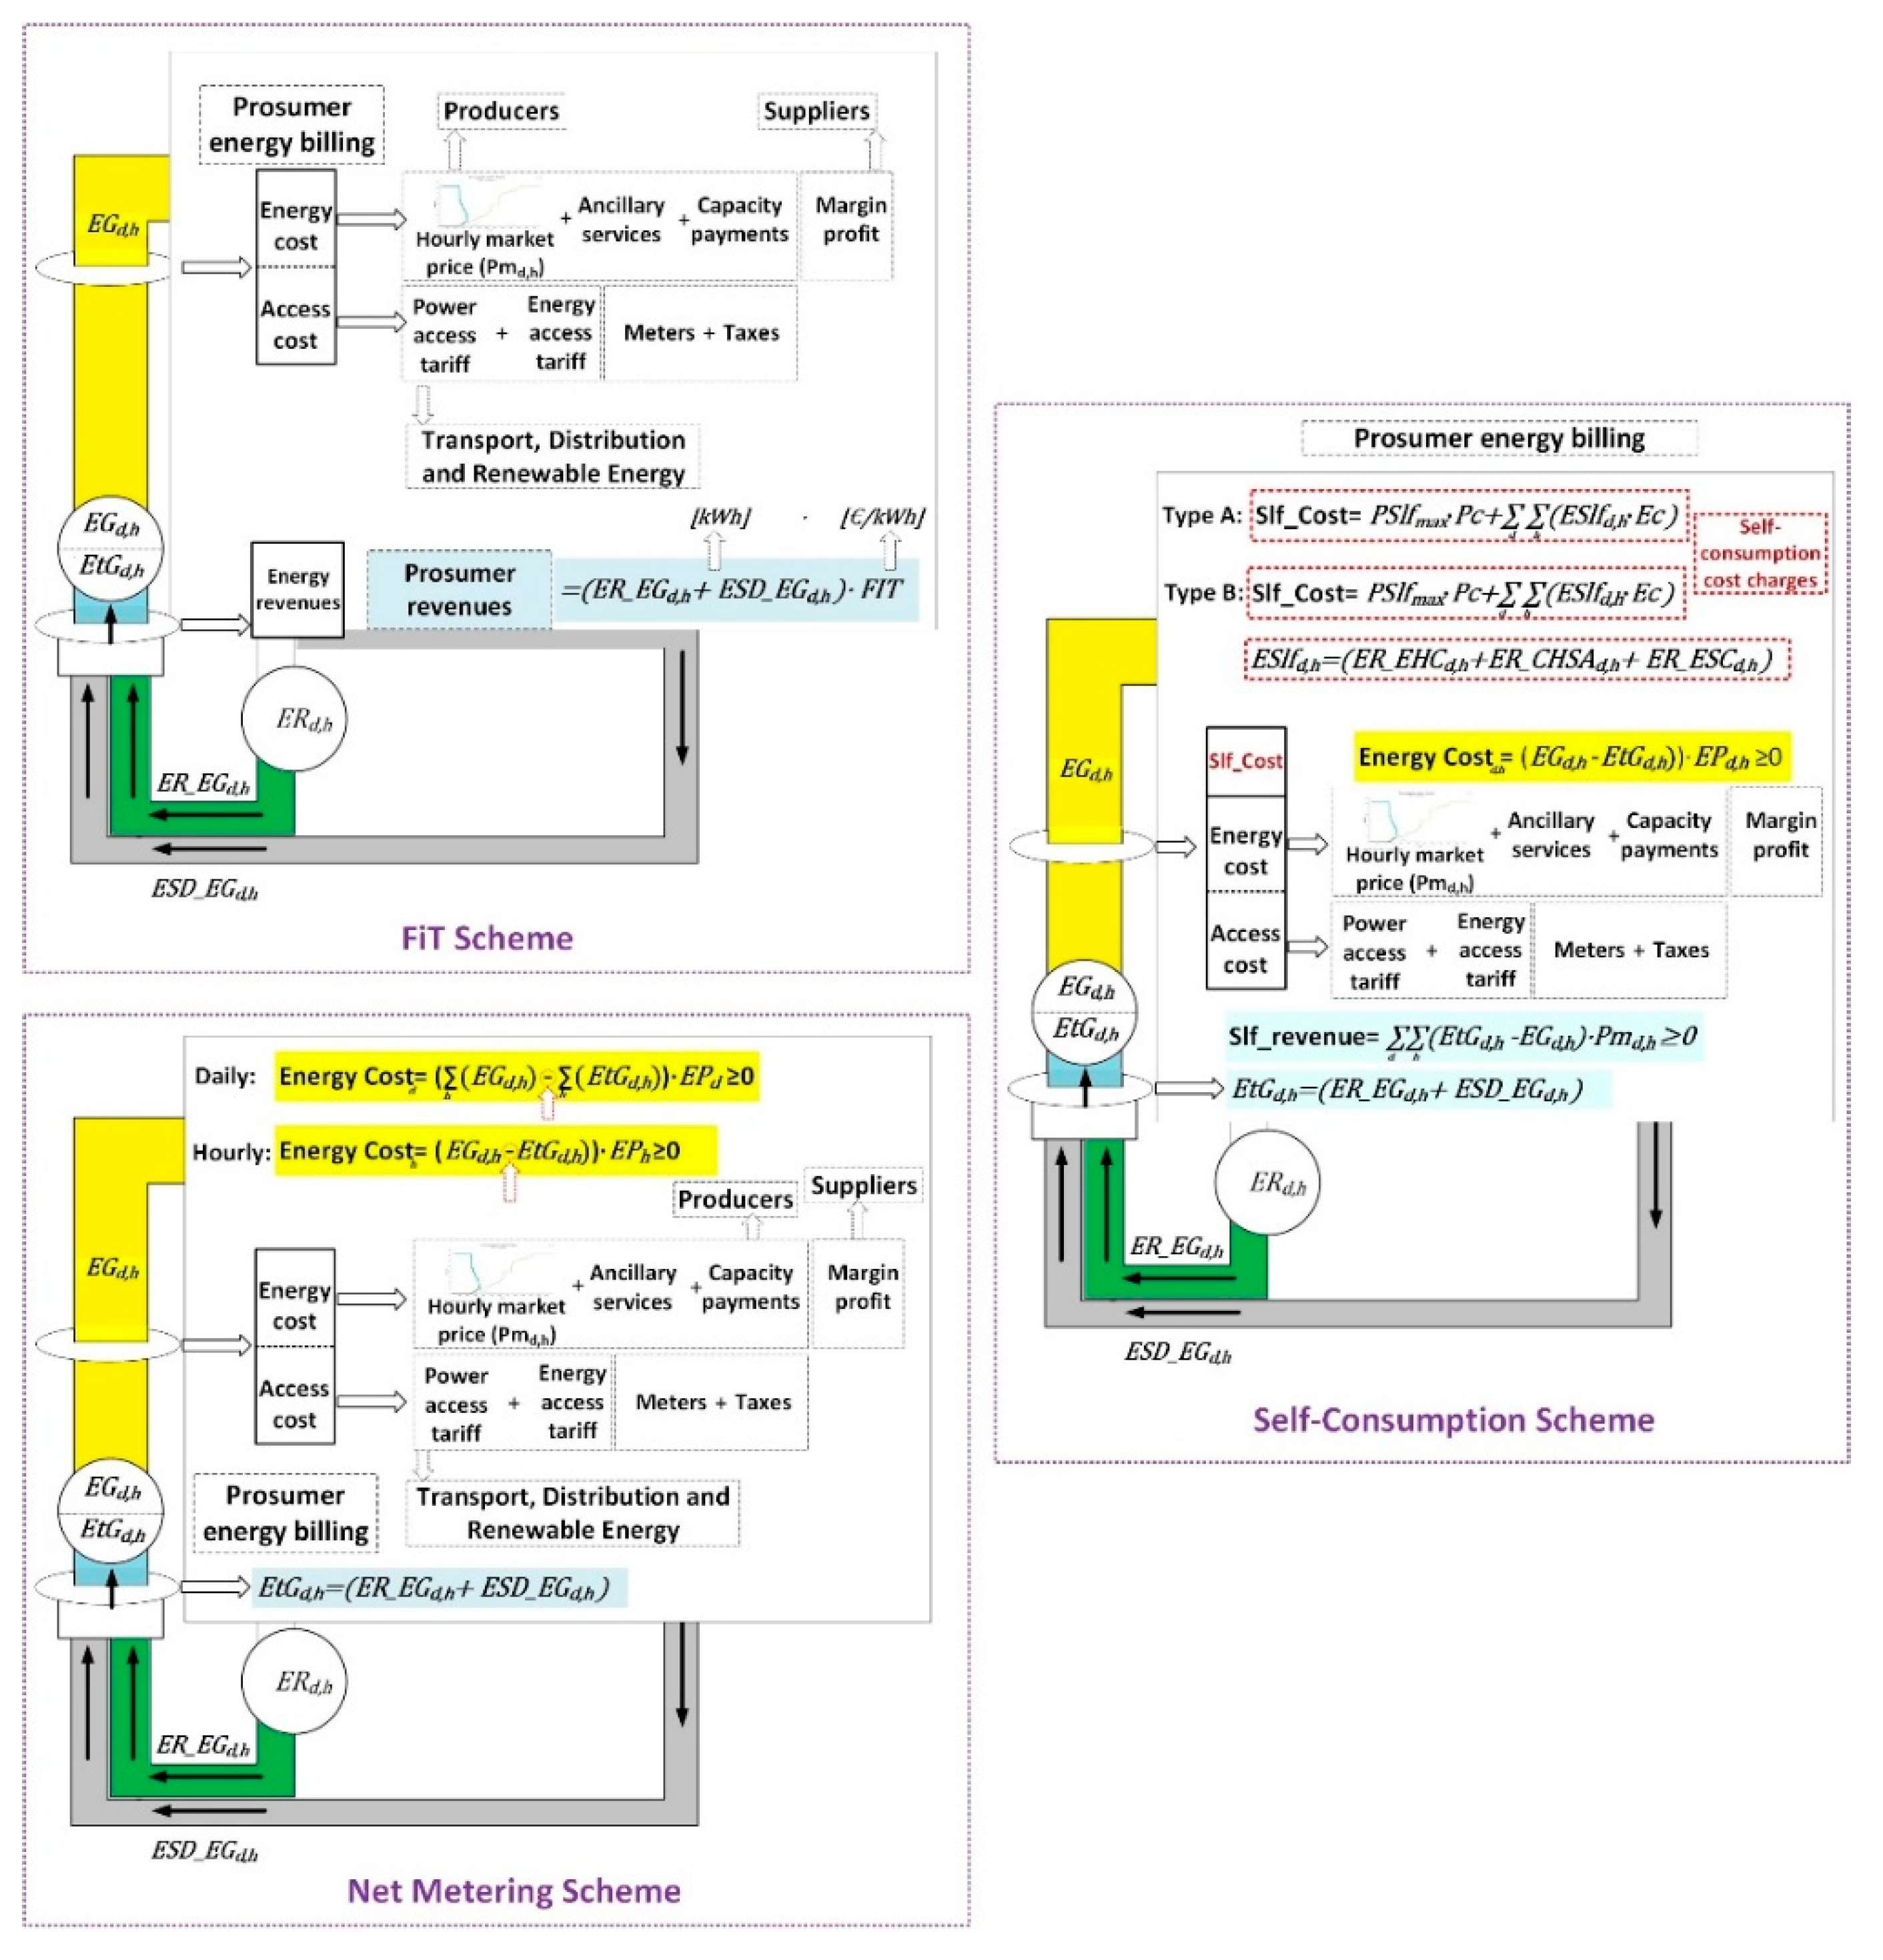
2.2.3. Regulatory Structures Used to Promote DER Facilities

In accordance with [30,33], several regulatory schemes have been adopted to promote the expansion of DER facilities within the EU. The most representative among them are FiT, net metering and the self-consumption scheme. These regulatory frameworks have been synthesized in order to outline their most representative features and to formulate the basis of their remuneration procedures. Therefore, the presented schemes are able to represent the broad spectrum of frameworks that exist at present, while avoiding their particularities.
FiT is the most extended framework in the EU [33]. Under this system, chosen renewable energy producers receive an amount for the electricity that they feed into the grid, hence the name. On the other hand, in a system with net metering, a bidirectional meter is introduced to register the amount of energy imported from and exported to the grid. At the end of the billing period, which can range from a few minutes to a year, prosumers only pay for their net consumption. That is the total electricity consumption (EGd,h), minus the electricity that is fed into the grid (EtGd,h).
Finally, in the self-consumption structure, the energy generated by the prosumer is charged through power (Pc) and energy charges (Ec). Two versions of this scheme are considered, differing on whether the energy fed into the grid is rewarded (Type-B) or not (Type-A). Figure 5 schematizes the aforementioned regulatory structures. A more comprehensive description is provided in [31].

2.3. Objective Function

The primary goal of the EMS is to guarantee the most inexpensive operation for the end-users, which is either the single prosumer or the participants of the energy community. The DER facility would be less likely to be installed in the case that its operation costed more money than running a conventional system.
As an initial assumption, it is considered that the installation of a DER facility reduces the price of the electrical bill. This reduction is determined by comparing the electricity bill after installing the facility, and under a certain regulatory structure (EBillRS), with the bill in the conventional system (EBillCS). In the community case, the comparison is between the value of the electricity bill of the energy community and the mean electricity bill of the prosumers of the community before installing a DER facility.
Therefore, the objective function contrasts these two values for the total of the planning horizon. It has been chosen to model the objective function as a minimization. For this to result in a maximization of the community savings, the expression must include the difference between EBillRS and EBillCS. The resulting objective function is introduced below:
EBillCS = EnergyCostCS × (1 + TaxCoef)
EBillFiT = EnergyCostFiT × (1 + TaxCoef) + C.GAUFiT + IMP.GEFiT − EtGd,h × P_FiTh
EBillNM = EnergyCostNM × (1 + TaxCoef) + C.GAUNM
EBill SFC   =   EnergyCost SFC   ×   ( 1   +   TaxCoef )   +   C . GAU SFC   +   IMP . GE SFC     EtG d , h   ×   Pm d , h
Obj.f = min (EBillRS − EBillCS)

2.4. Differences between Individual and Community Formulations

An aggregated approach has been employed to introduce the energy community model into the mathematical program. This leads to the energy flows between generation, storage, grid, loads, and auxiliary services to be considered for the whole collective, as if it was like a single big dwelling. Therefore, in the community model the energy balances are maintained but with the respective aggregated flows. Energy storage is shared, and thus the charge and discharge processes have to be considered only for a single battery which interacts simultaneously with all the members of the community.
Additionally, the power contract with the electric company is performed with the community acting as a unique agent. This can entail an advantage as the power charges typically do not grow linearly with the contracted power. Besides, it is much more difficult that the community becomes penalized for surpassing the maximum contracted power. Regarding the energy community models, a more thorough description is provided in [31].

3. Case Studies

3.1. What-If Analysis and Scenarios Definition

The definition of several scenarios for the single prosumer and the energy community was conducted to undertake a what-if analysis. These scenarios (as depicted in Figure 6) depend on the energy consumption and the regulatory scheme.
Regarding the energy consumption, three different consumption profiles were defined for the individual prosumer. These profiles differ in the hours of maximal consumption, meaning that each consumer is able to take advantage from renewable energy generation individually in a varying degree. In addition, these profiles are crafted in order to characterize plausible consumption behaviors, for example, by maintaining the evening consumption peak that typically appears in a residential setting. The same applies to the collective case, although owing to the effects of load matching [6] and peak load shaving [34], just one profile has been deemed necessary. On top of that, three values of the regulatory parameters (base, favorable and unfavorable) were assigned for each one of the analyzed regulatory schemes. These regulatory parameters have a direct influence in the income that the prosumer perceives for the sale of energy, and/or the price of the total purchased energy.
Therefore, as Figure 6a presents, the number of cases taken into account in the what-if analysis amounts to 27 for the private-owned facility (three consumption profiles, per three regulatory frameworks per three regulatory parameters) and to nine for the collective microgrid (one profile per three frameworks per three parameters), according to Figure 6b. In practice, the number of scenarios becomes higher because two different modalities were considered for the net metering (hourly and daily) and self-consumption schemes (types A and B). This number of cases is considered sufficient for the purpose of comparing both collective and individual settings while representing the vast majority of current policies regarding renewable energy promotion.
The simulation is performed in order to approximate annual results. Solar radiation and energy consumption profiles are gathered for different times of the year, and they are classified by season (autumn, winter, spring and summer) and in the case of energy consumption also by typology of day (weekday and weekend). For every season, a week consisting of five weekdays and two weekend days is simulated, and the results are averaged in terms of mean benefit per day. By employing this method, the results obtained in the simulation approach effectively the results that would have been obtained simulating the whole year, while the computational effort remains sufficiently low.

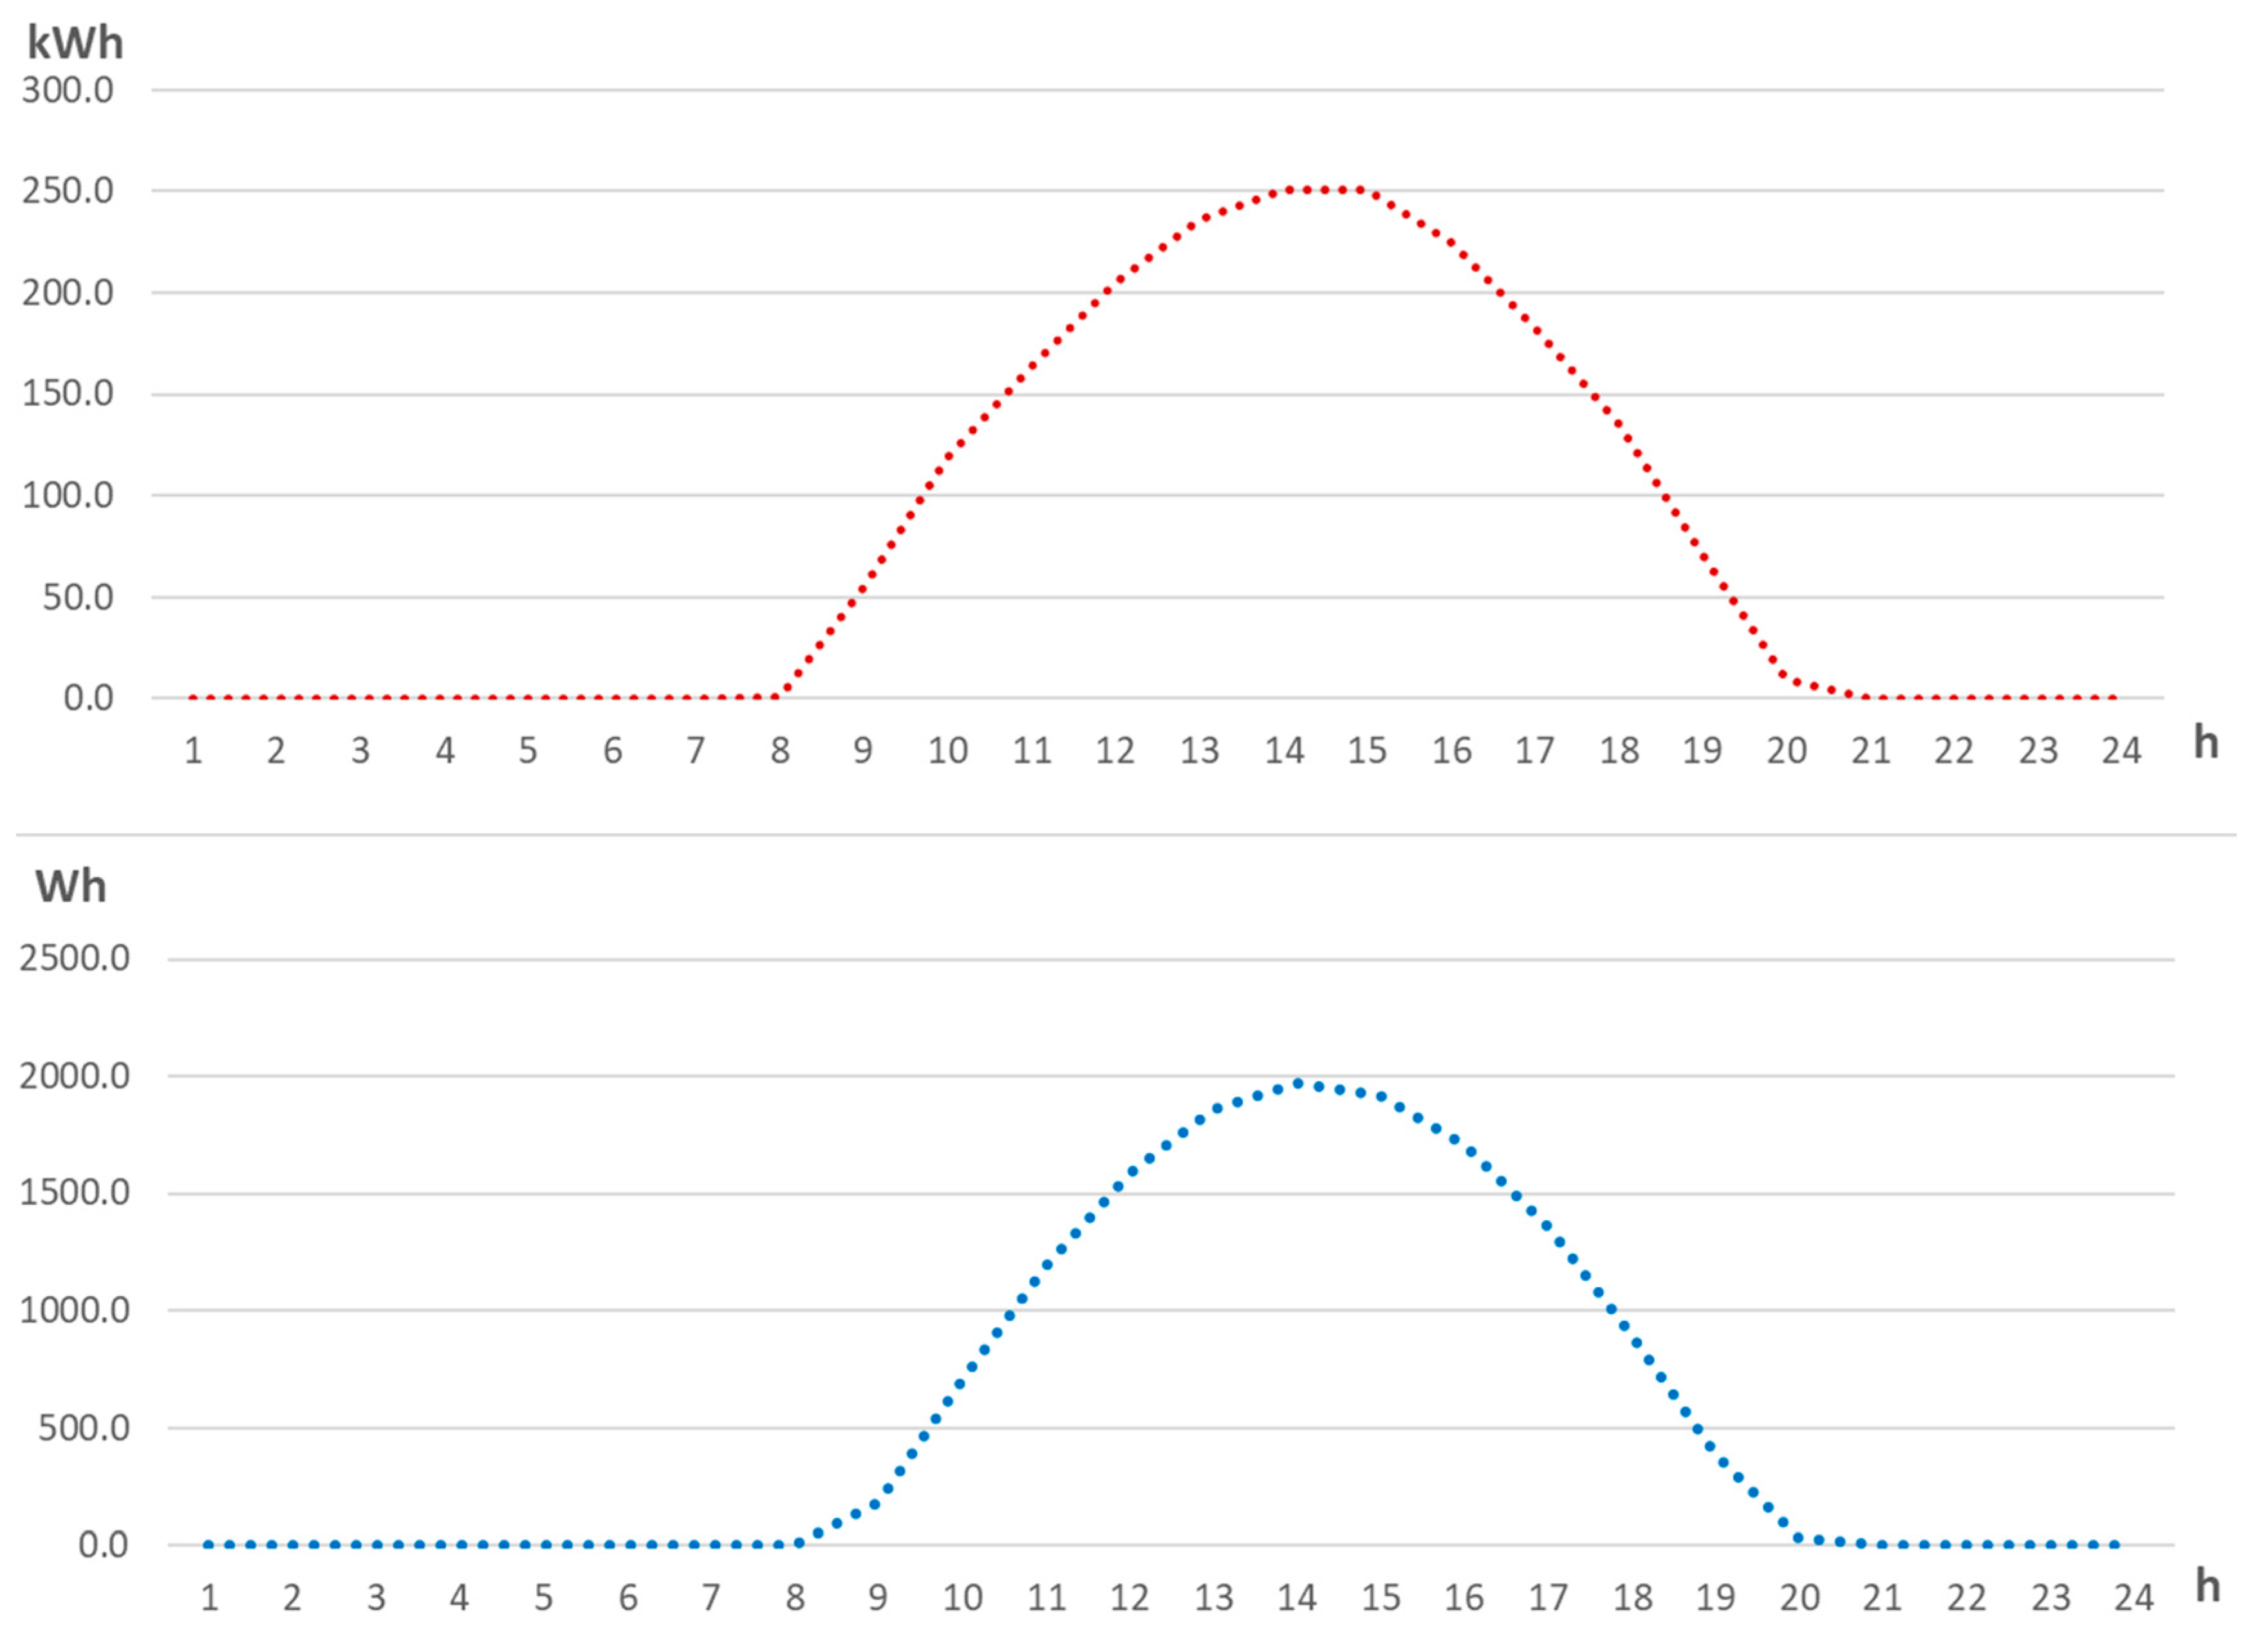
3.2. Generation Potential

Data regarding electrical consumption has been obtained from a household located at the geographic coordinates 41.65°N, 2.16°E, corresponding to the municipality of Caldes de Montbui (Spain). PV potential has been calculated for the same coordinates. The residential area in which this household is located consists of 166 dwellings of similar characteristics. This residential area constitutes the energy community that has been simulated in this study.
To estimate the solar radiation for a single household, PVGis application has been employed [35], using an optimal tilt of 37° and a 0° azimuth (solar panels tilted to the south). For the community it is assumed that the majority of dwellings capture radiation from the south but some of them capture it from the east and the west (−90° and 90° azimuth). The devices that convert radiation into electrical energy are the solar panels and the inverter. For this work, generic models from the PVSyst database [36] have been employed. Figure 7 depicts the maximum aggregated PV potential for the energy community and for a single prosumer in one of the sunny simulation days.

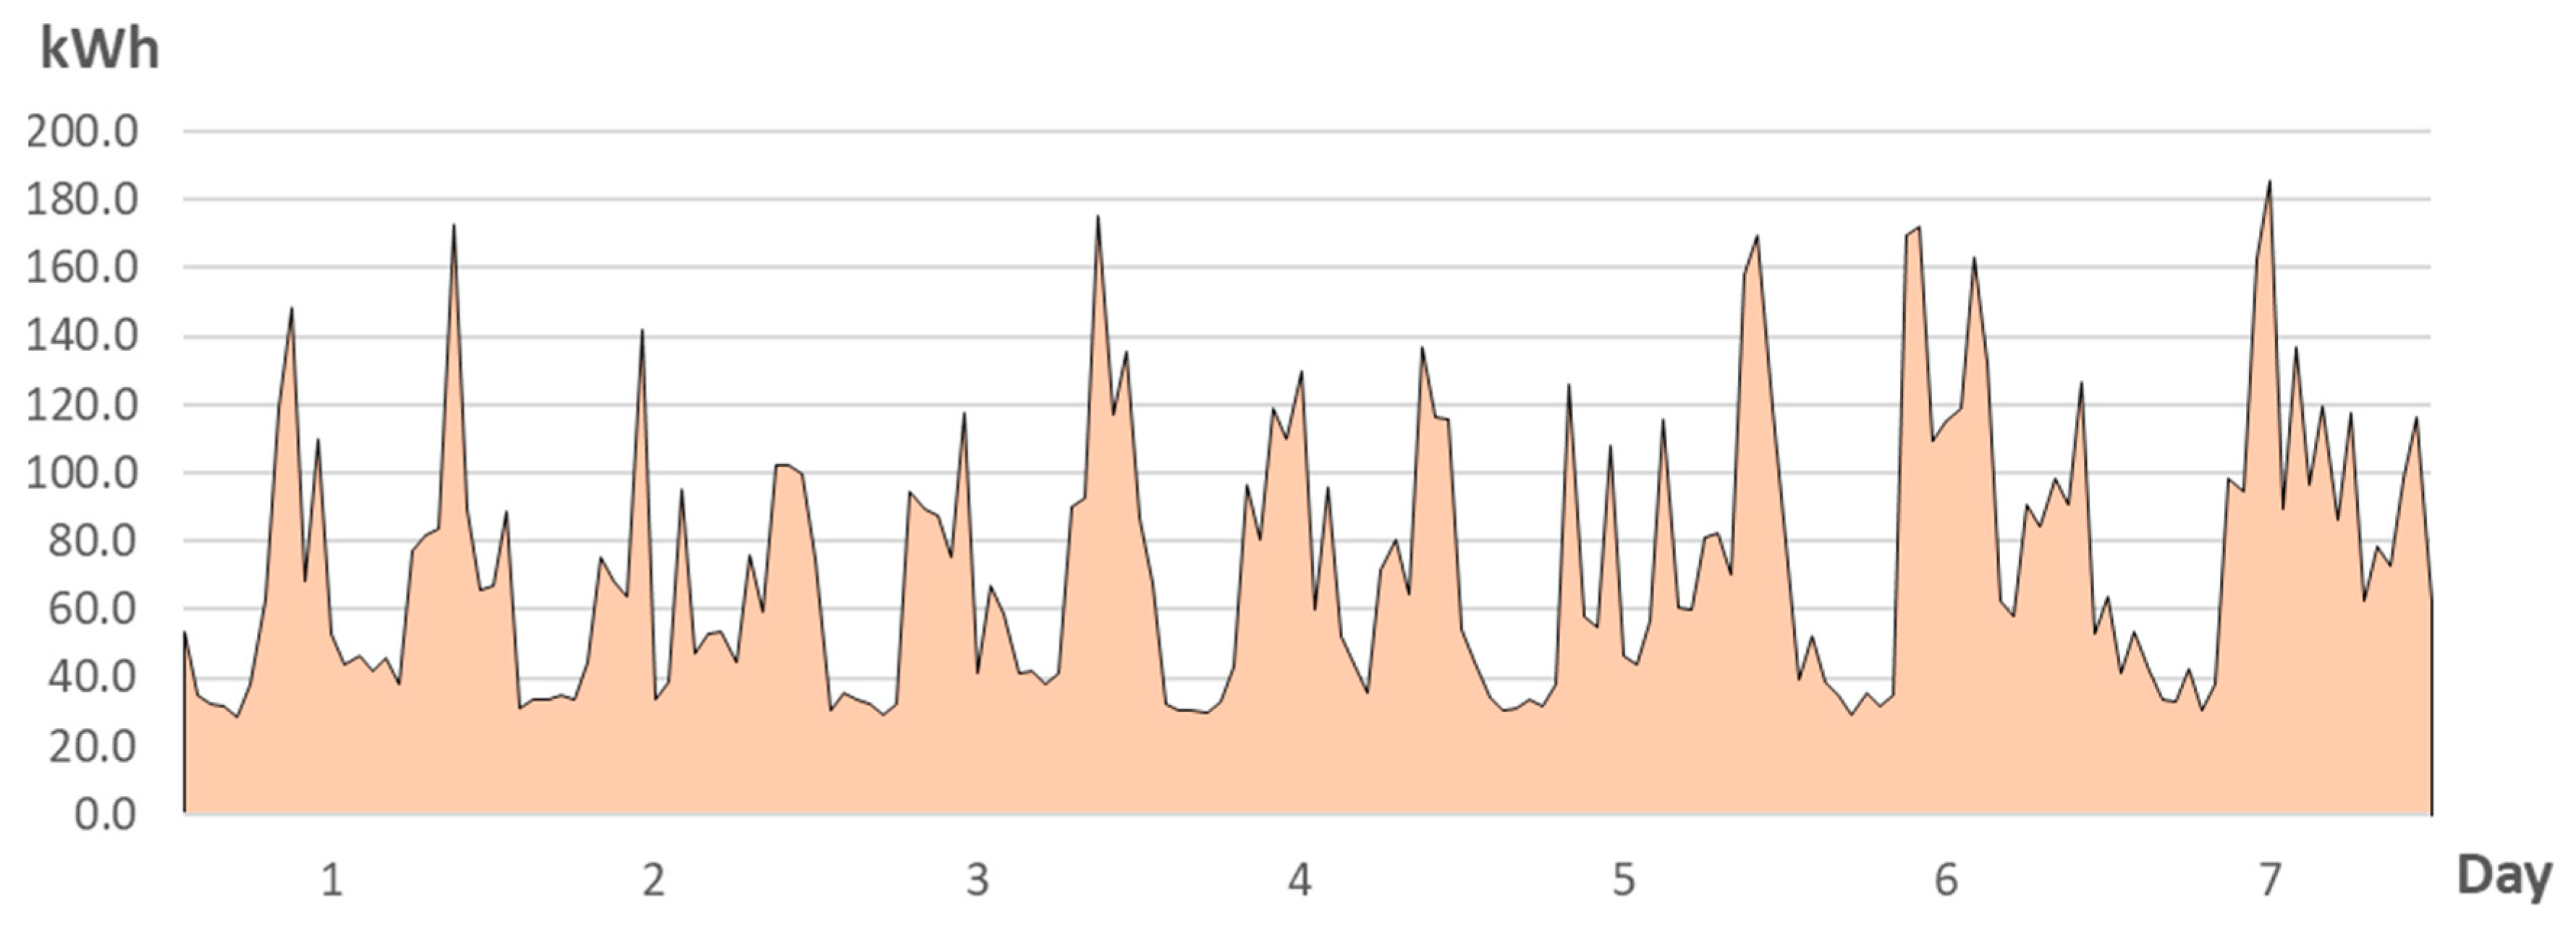
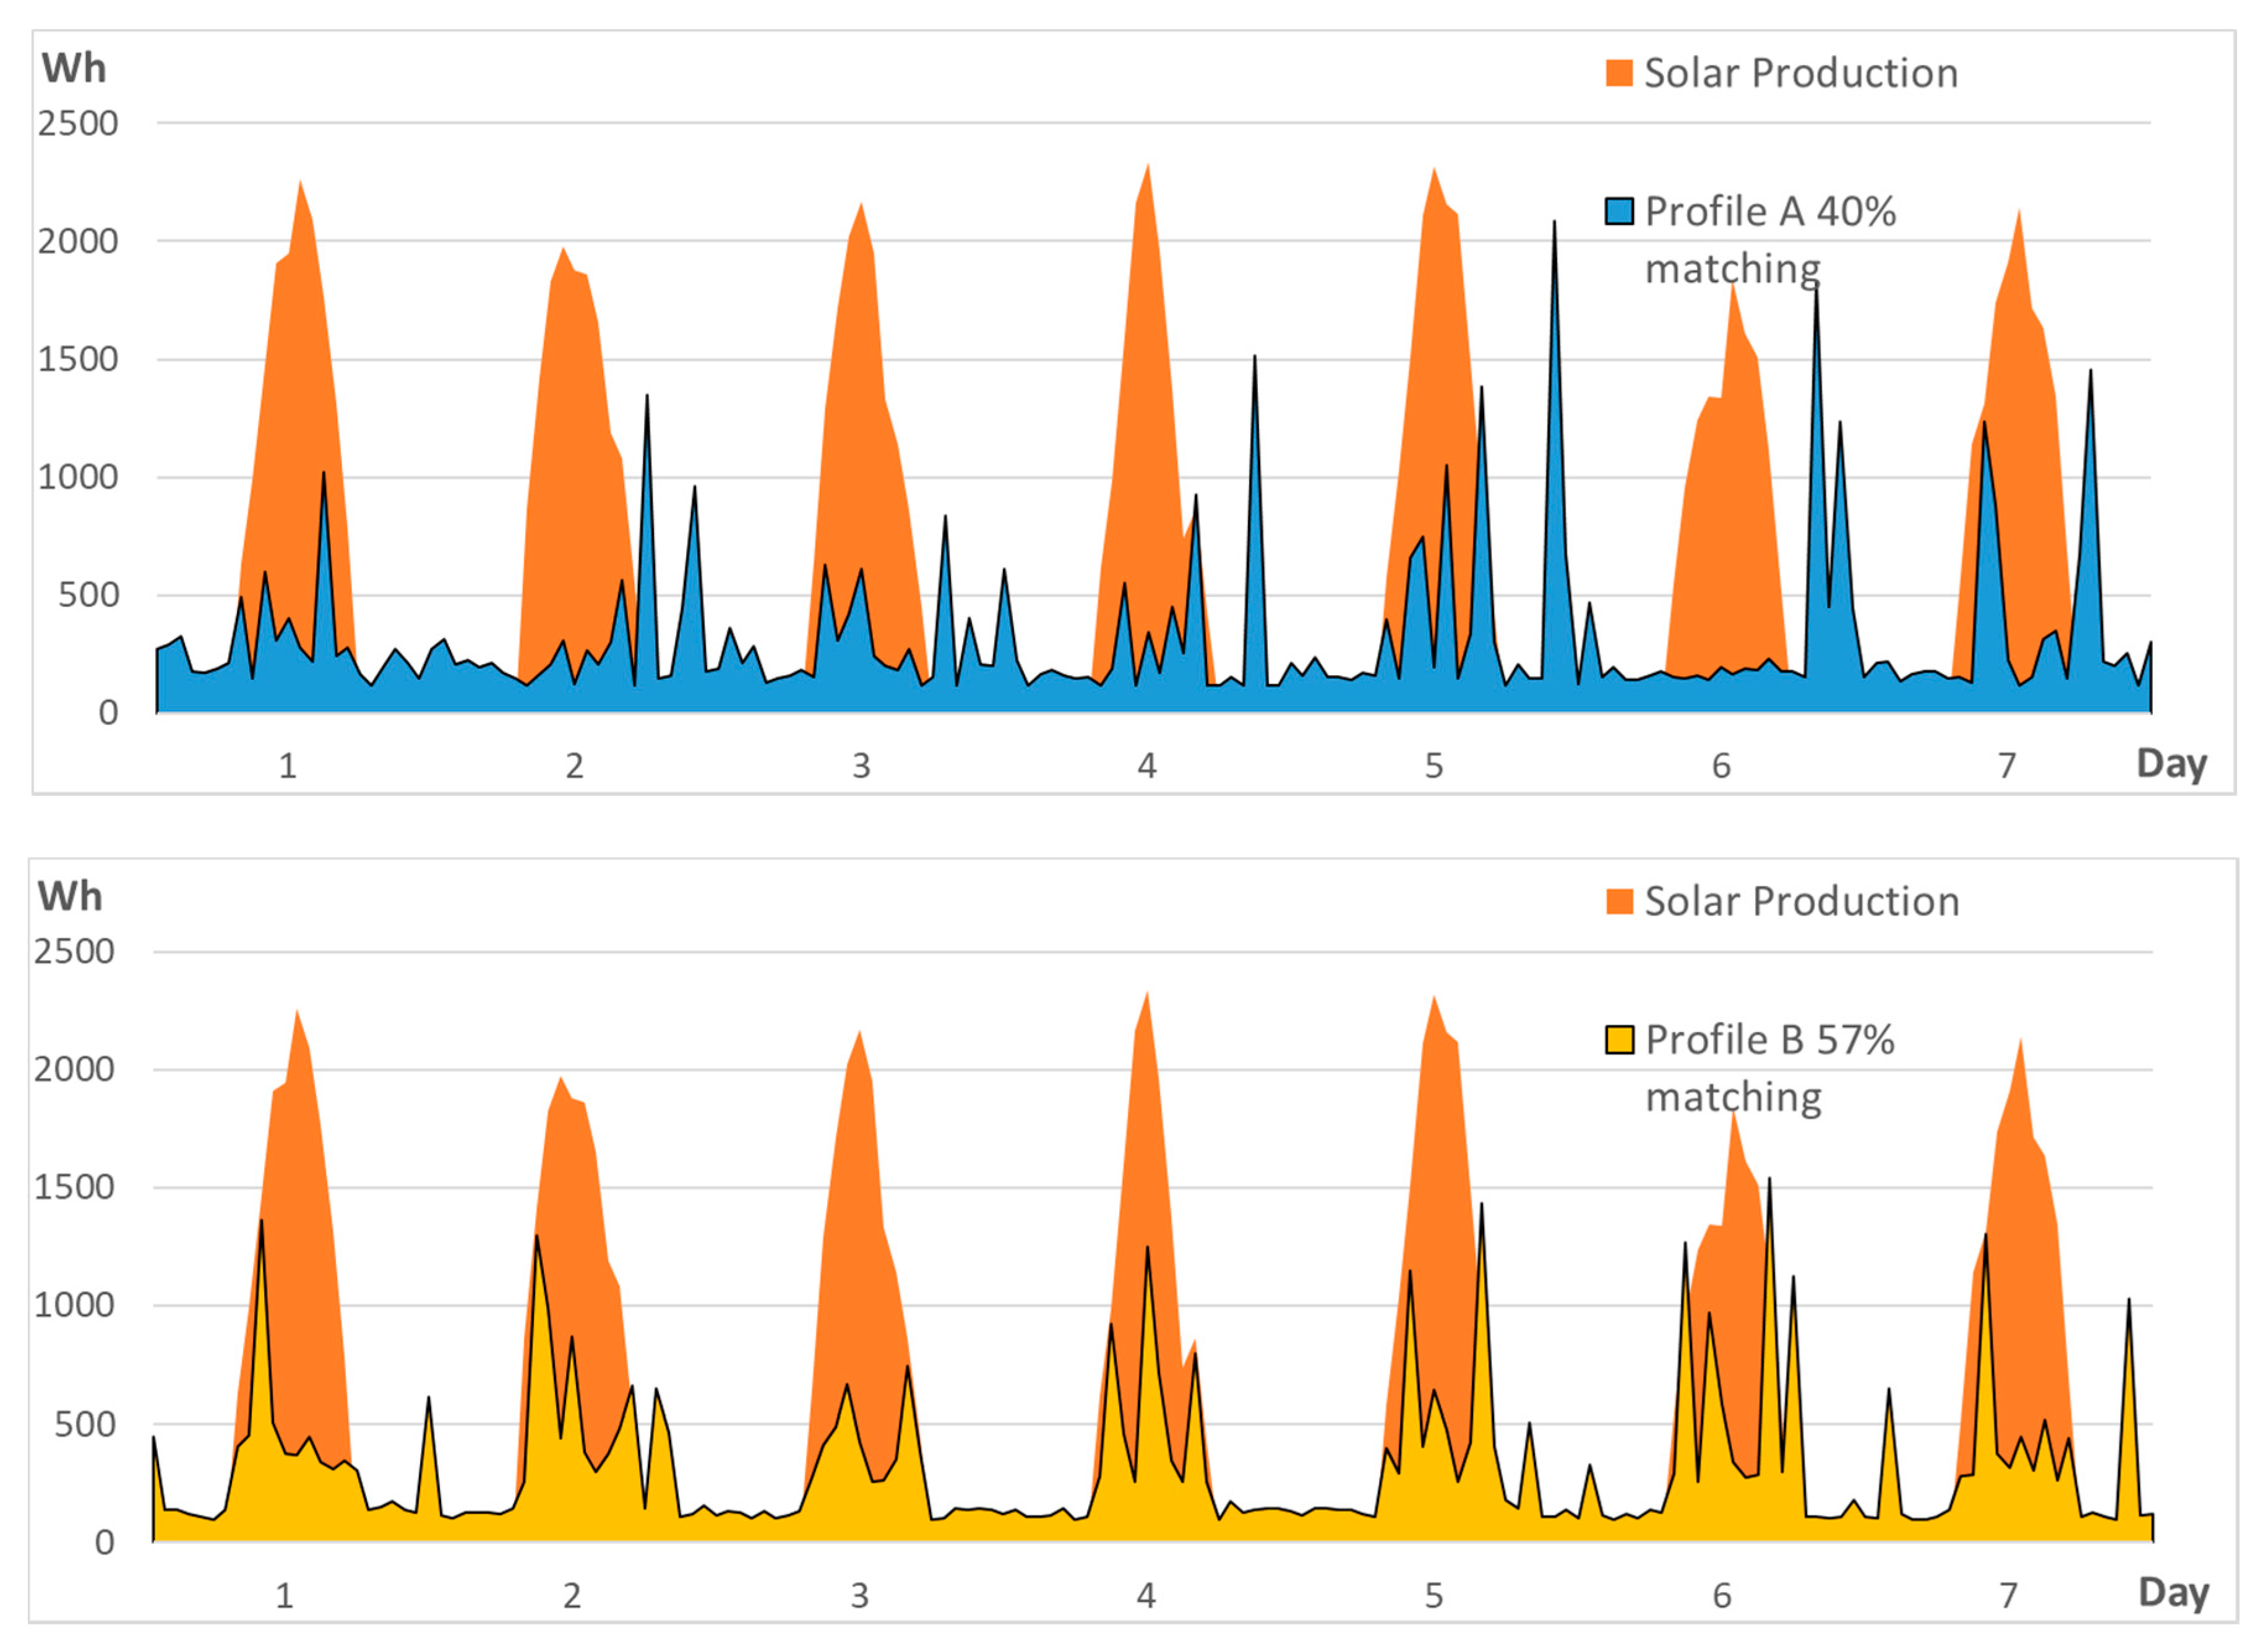
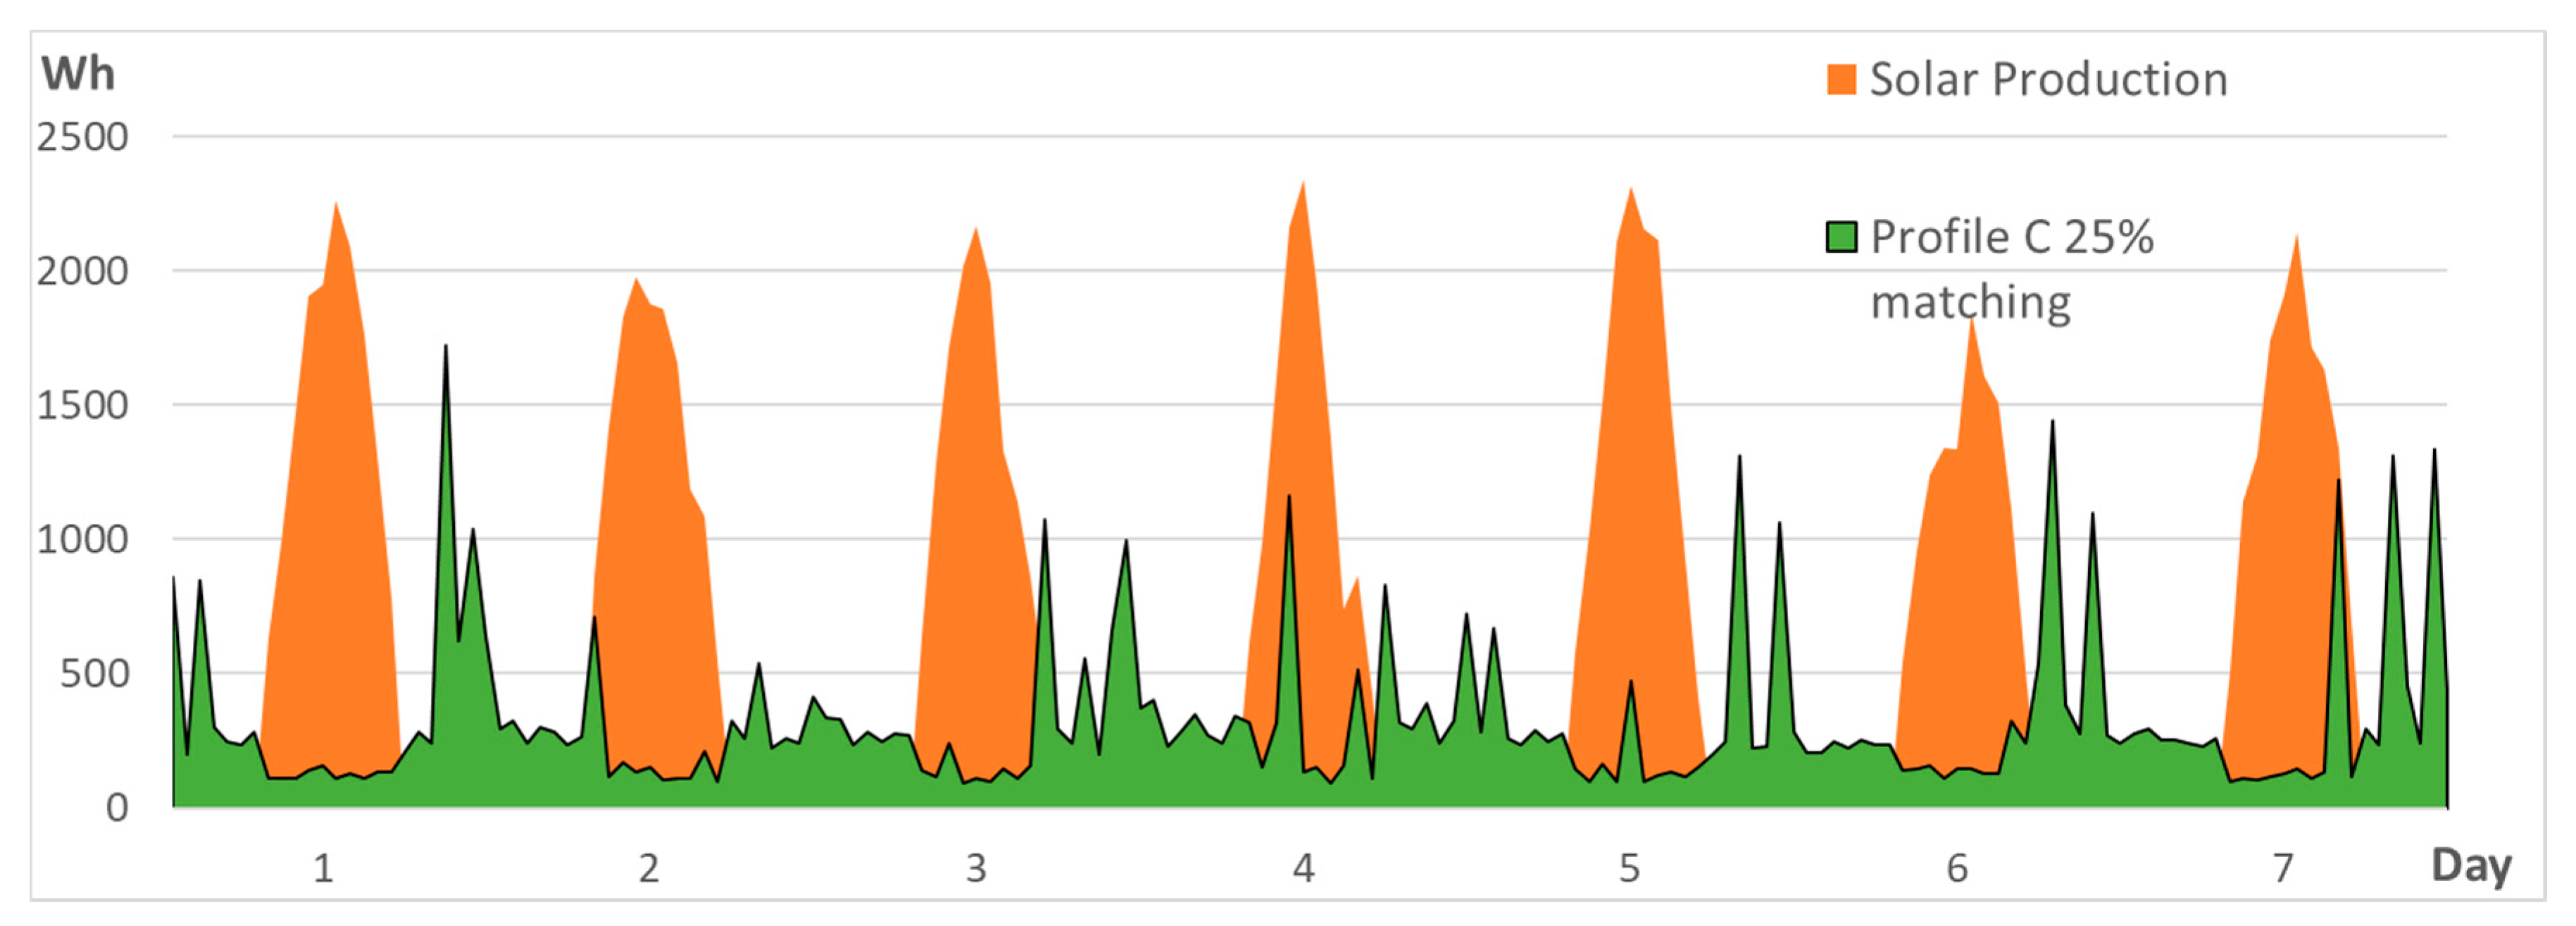
3.3. Energy Consumption

The available data of energy demand consist of the hourly consumption of the dwelling described in the previous section, for the period comprising the second half of the year. Based on this data, the community’s demand profile has been extrapolated using the method described in [37]. The community’s hourly demand profile for a typical week of autumn is shown in Figure 8.
The consumption of the single prosumer used in the optimization was selected from the generated profiles. Three out of the 166 generated profiles were chosen in order to be able to represent various schedules of energy consumption (see Figure 9). Nevertheless, the individual generation potential of the prosumer used in the optimization process remained the same during the study. Therefore, the percentage of the demand able to be supplied by the renewable sources is different in each case.

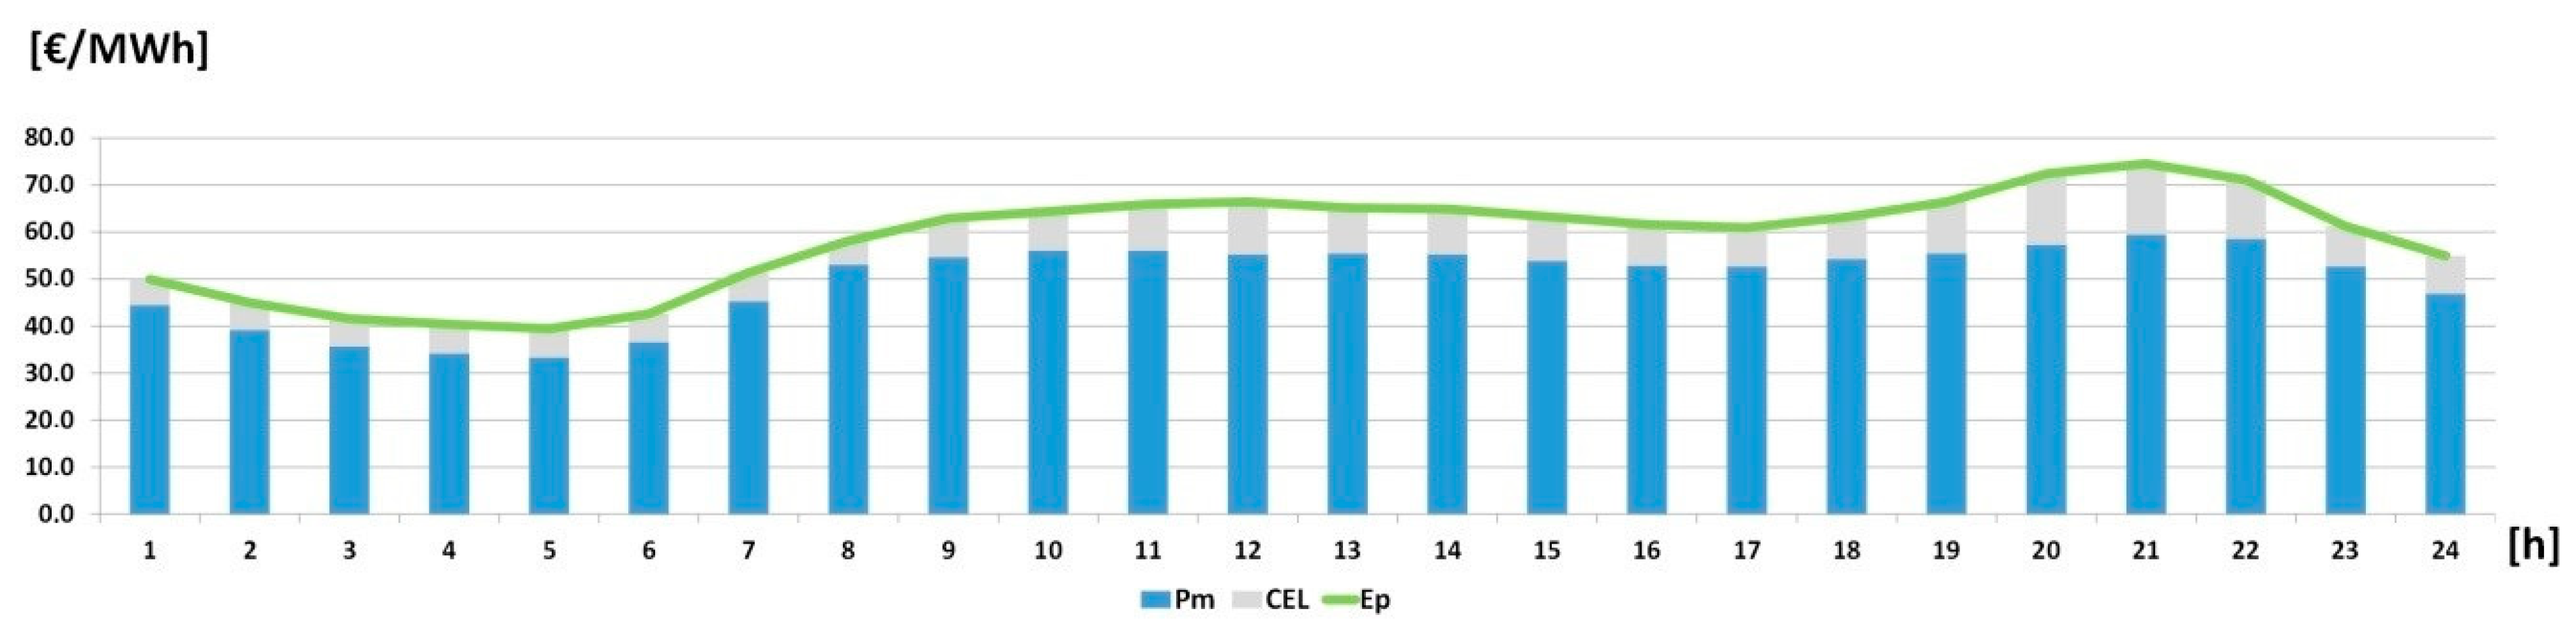
3.4. Electricity Prices

The electricity price for the simulation was obtained from [38] over the period 2014–2016. The data were separated by the season of the year and by day type (weekday and weekend). The mean of the price over these periods is employed as initial data for the mathematical program. Figure 10 depicts the breakdown of the equivalent electricity price, which comprises the day-ahead market price and the cost of the energy losses of the system.
Access tariff coefficients, which are extracted from the Spanish regulation, are presented in Table 1. These coefficients may vary from country to country, even though they are all calculated in order to guarantee the economic efficiency of the system. That is, to reflect the actual regulated costs that they are covering.

3.5. Regulatory Scenarios

3.5.1. FiT Scheme

Under a FiT scheme the price of the energy sale is constant and specified in advance, no matter how much energy is sold, where and when. Three tariffs have been introduced in this study in order to perform a sensitivity analysis. The values are extracted from real-life applications in countries such as UK [40], Germany [41] and Australia [42] (see Table 2).

3.5.2. Net Metering Schemes

Under a net metering scheme there is no fixed tariff for the sale of energy. However, every kWh of energy exported to the grid discounts one kWh of energy imported from the grid. The amount of energy which finally figures at the bill is equal to the imported energy minus the exported energy, with the constraint that this amount can never be below zero. In this study, two billing periods are under consideration: hourly and daily.
The longer the billing period, the more favorable net metering is for the consumer, for it means he can feed energy into the grid and be compensated for the energy he buys in another moment. Monthly and yearly net metering schemes have not been taken into consideration in this work, but their results are expected not to increase substantially respect daily net metering. The reason is that most of the energy compensation occurs within the day, unless the consumption profile has a remarkably low matching during the summer months.
In this study three scenarios of net metering, for each of the billing periods, are taken into account. In the base case, one unit of sold energy compensates for one unit of purchased energy. In the favorable case, one unit of sold energy compensates for 1.2 units of purchased energy. That means that every kWh fed into the grid will result in 1.2 kWh discounted from the electric bill. While in the unfavorable case, is the opposite: 1.2 units of sold energy compensate for one unit of purchased energy. That means that 1.2 kWh that are fed into the grid will imply a reduction of 1 kWh in the electric bill. The limit that the compensation must not surpass the purchased energy is extended or curtailed accordingly depending on the scenario.

3.5.3. Self-Consumption Schemes

Under a self-consumption structure, additional charges are included in the energy bill. These charges are justified, under this scheme, because the act of dumping energy compromises the grid stability. The three scenarios under study in the Self-consumption scheme vary depending on the value of these charges. The base values are taken from the Spanish regulation [43], whereas the favorable and unfavorable cases are formed by reducing and increasing 20% the value of these charges, respectively. The coefficients of the additional charges used in the simulation are shown in Table 3.

3.6. Data Summary

Because of the large number of parameters implemented in the model, a summary of all values employed in the simulation is introduced in Table 4.

4. Results

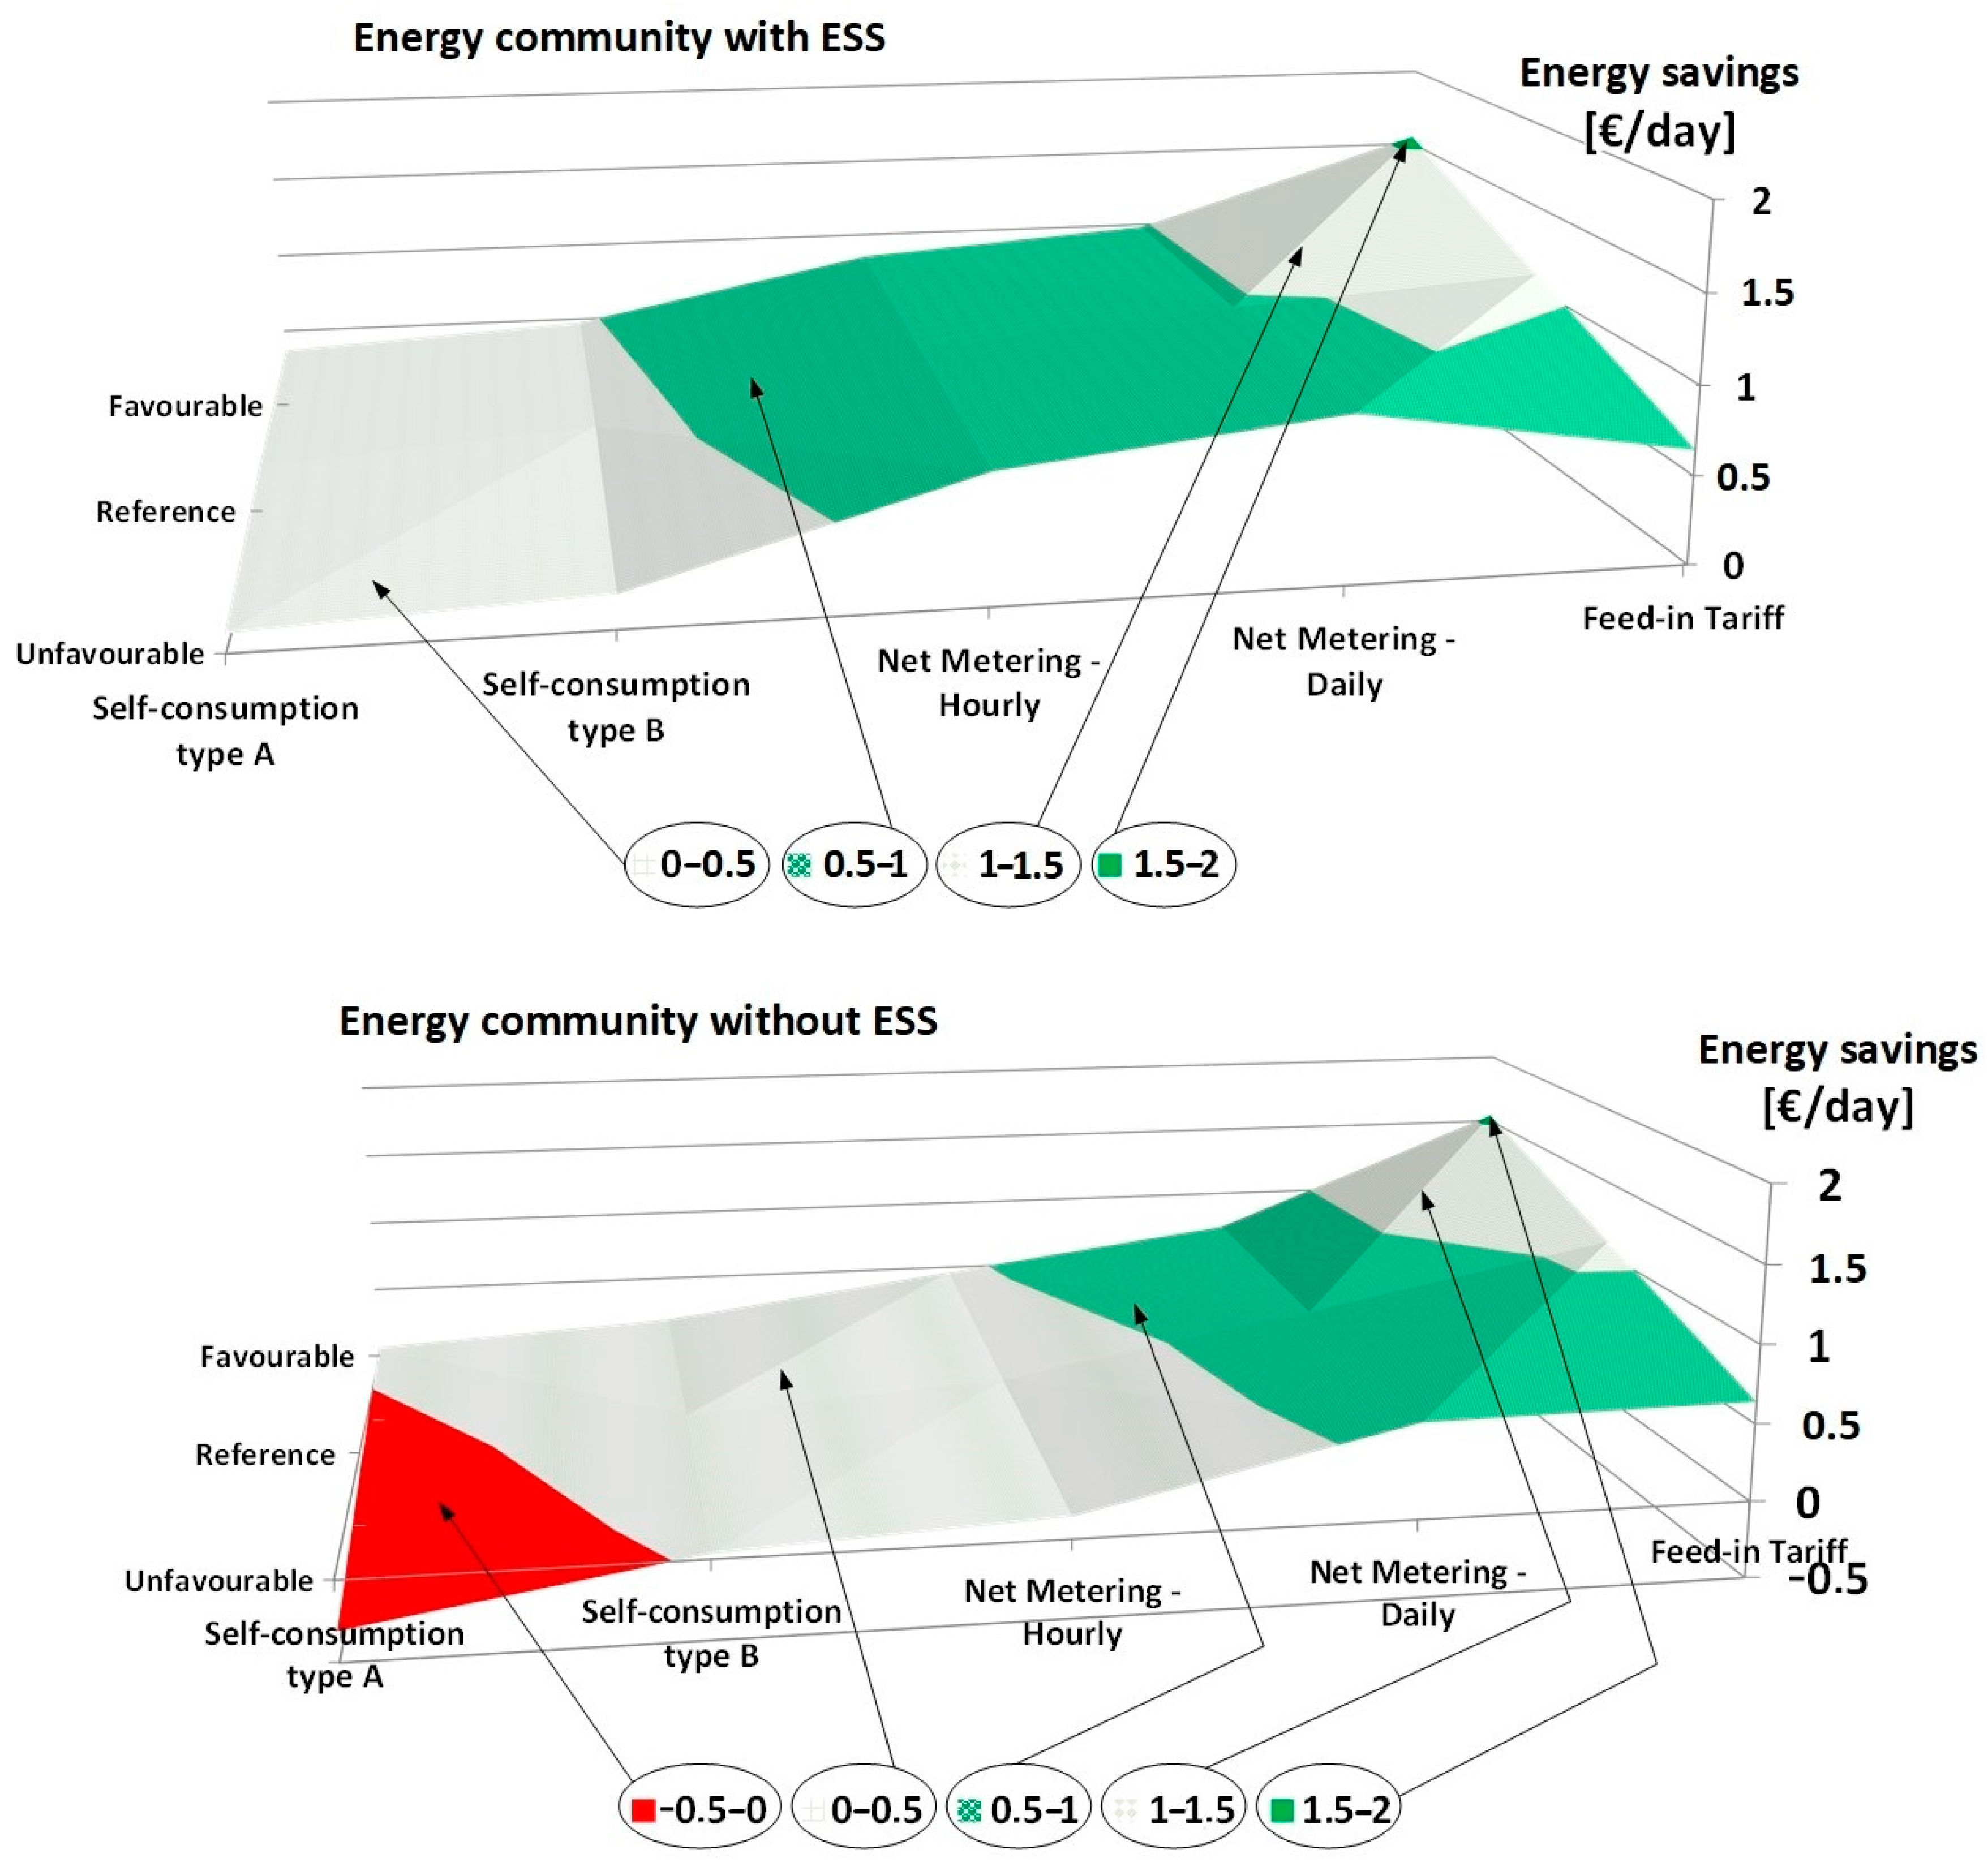
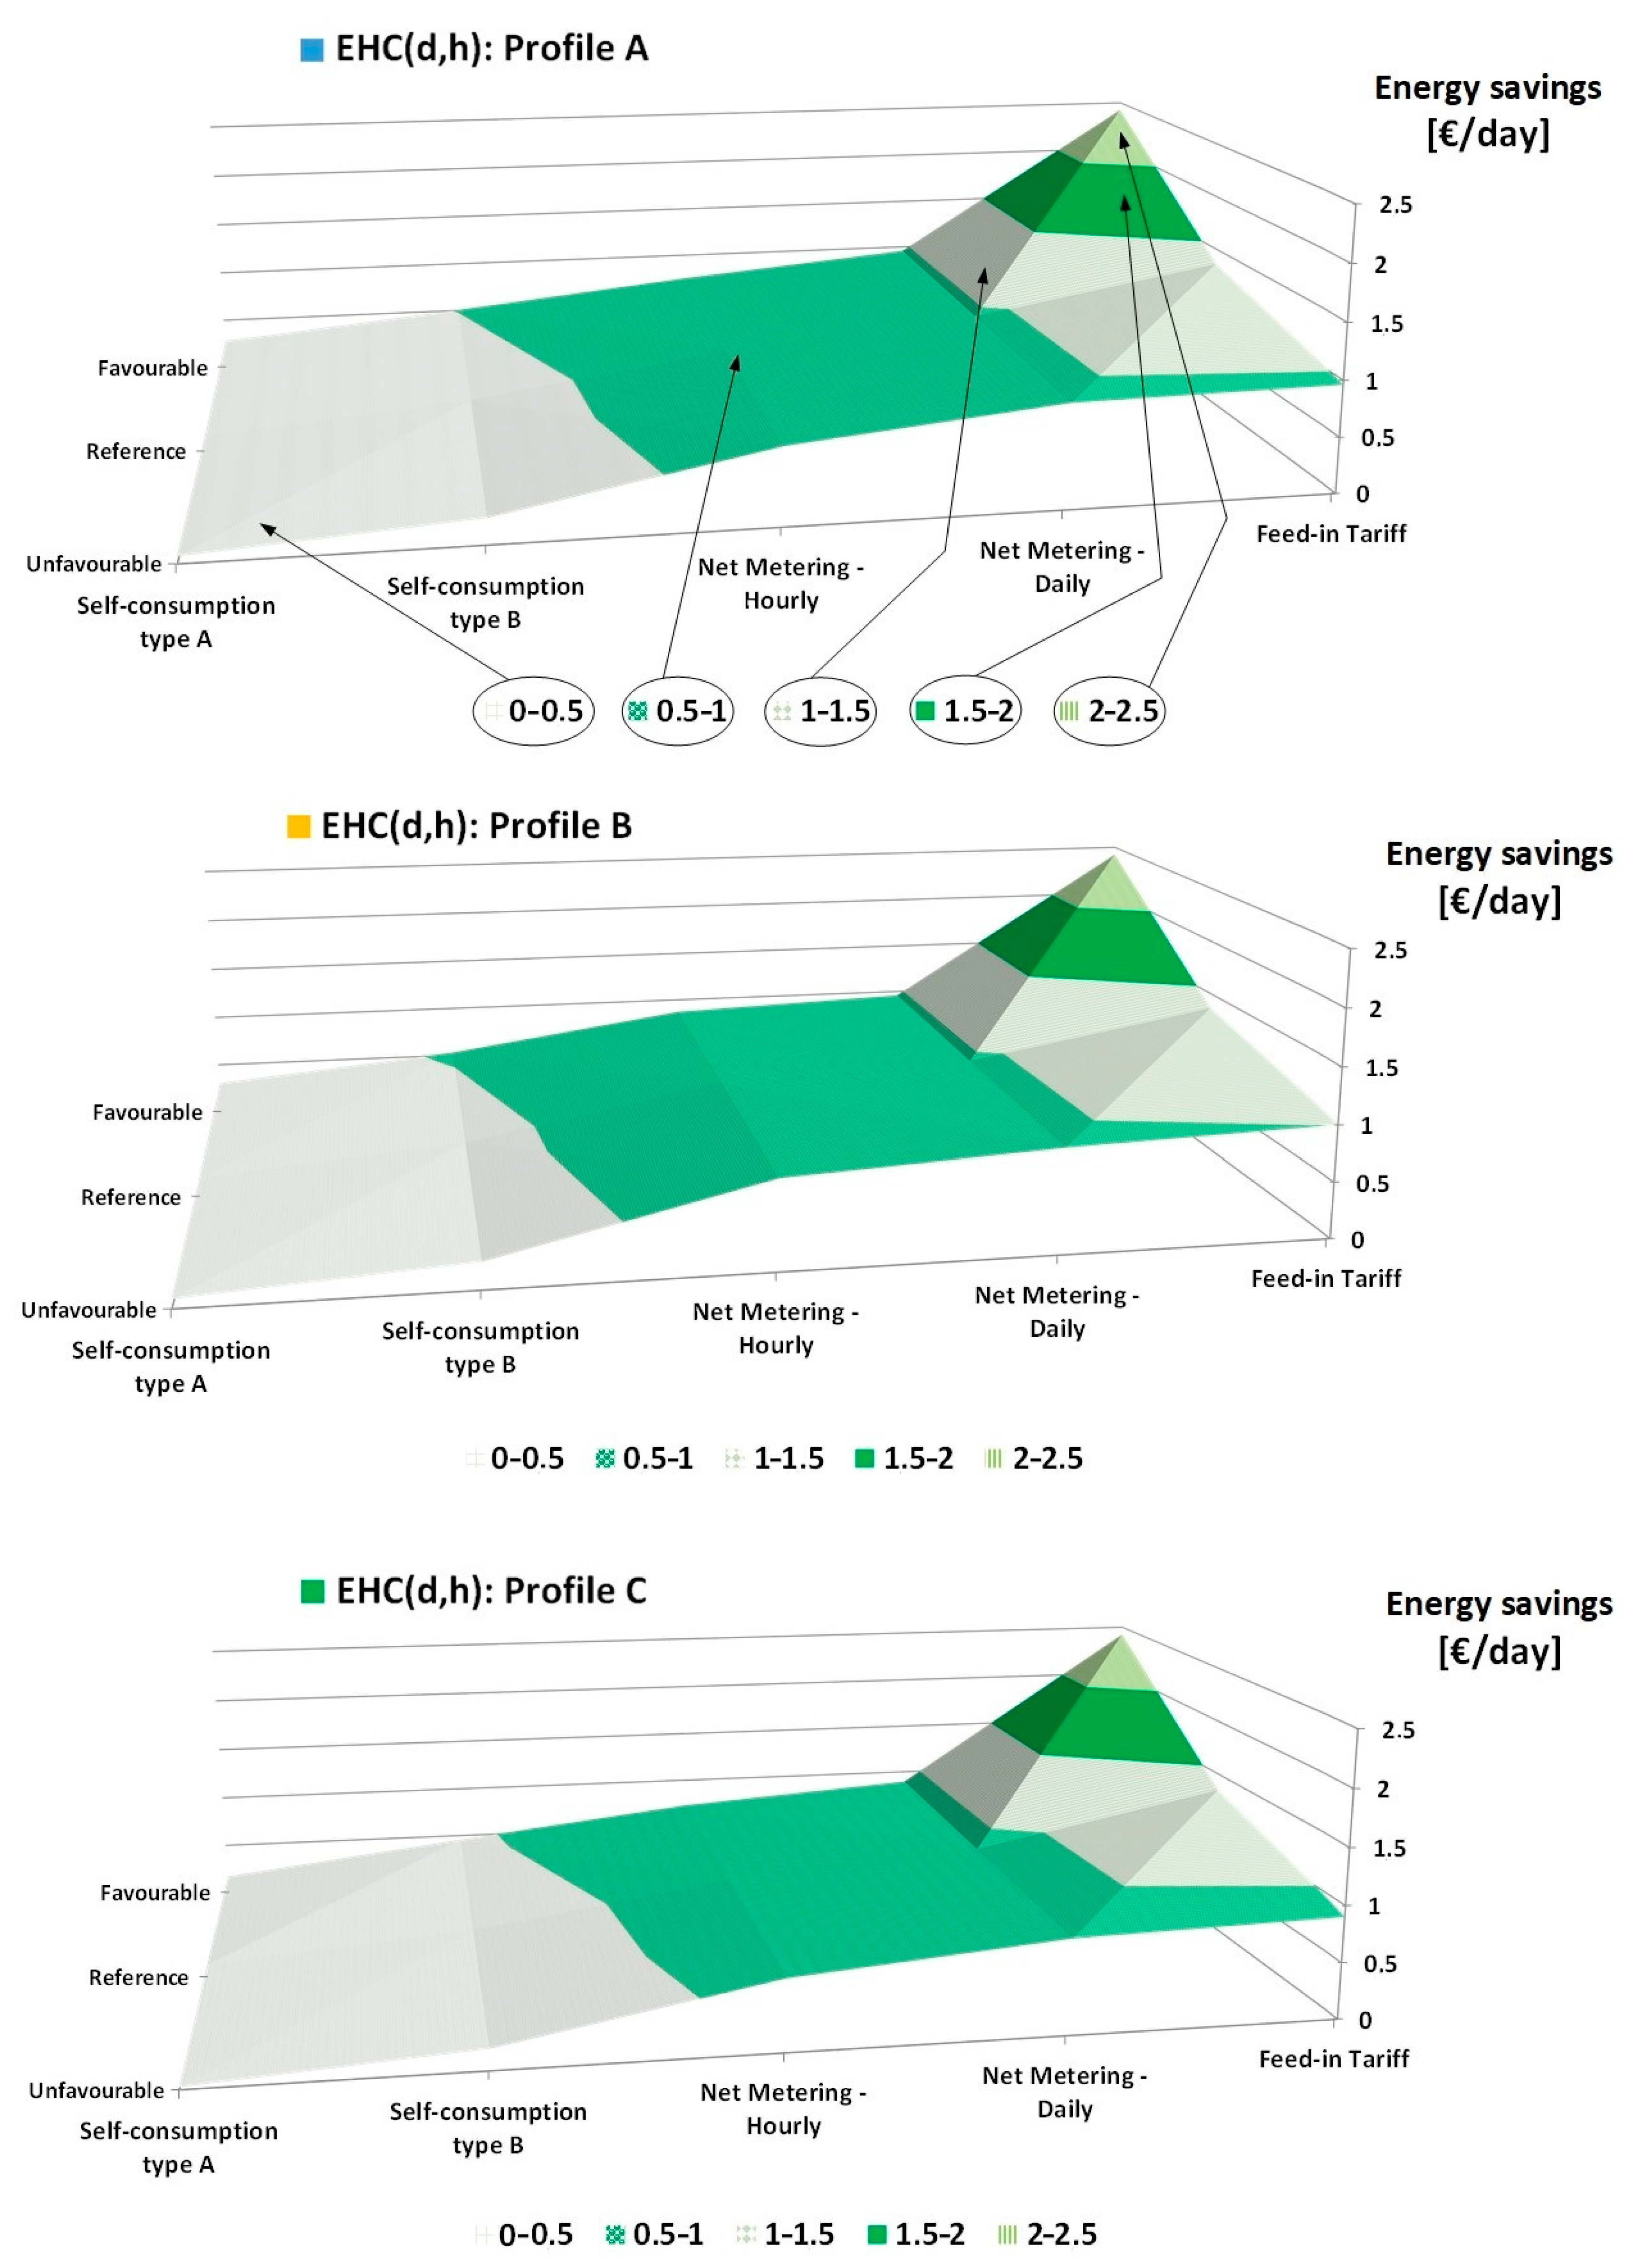
4.1. Economic Results of the Energy Community

The results for the aggregation of the energy community, for all regulatory frameworks and the three scenarios in consideration are shown in Figure 11. It can be observed that from the point of view of the consumer, the FiT scheme is the one which entails the more savings, followed closely by the daily net metering and also by hourly net metering in systems with ESS.
The sale price of the energy fed into the grid in the FiT scheme, for the reference and favorable cases is superior to the price of importing electricity after taxes. Therefore, the optimal solution leads to a continuous dump of renewable energy into the grid, as if the community was acting like a power plant. The existence of an ESS allows purchasing electricity at the lowest price in the day, thus increasing savings regardless of the regulatory framework applied.
In the unfavorable case, FiT almost entails the same savings as daily net metering. The reasons being that the chosen tariff is not superior to the price of importing electricity and the management becomes optimal when maximizing the self-sufficiency of the community. Self-sufficiency, at the same time, is also greatly maximized by using an ESS.
It can be observed that net metering benefits almost do not change within scenarios. The reason is that for this particular case study, the amount of generated energy during the simulation horizon is superior to the total consumption. As the compensation is limited to the total purchased energy, the inclusion of alternative scenarios in net metering, each with a different exchange coefficient between the sold energy and the energy discounted in the electrical bill, does not affect the economic results. Regarding the self-consumption scheme, it is the most unfavorable of all the analyzed frameworks, owing to the existence of surcharges to compensate the grid instability. The increase or decrease of these charges implies a direct change in the economic results, making the DER facility in the least favorable case, totally unprofitable for the members of the community. Changes in economic results are more prominent in systems without ESS, because of their inability to adapt the energy management to the fluctuations of the market.

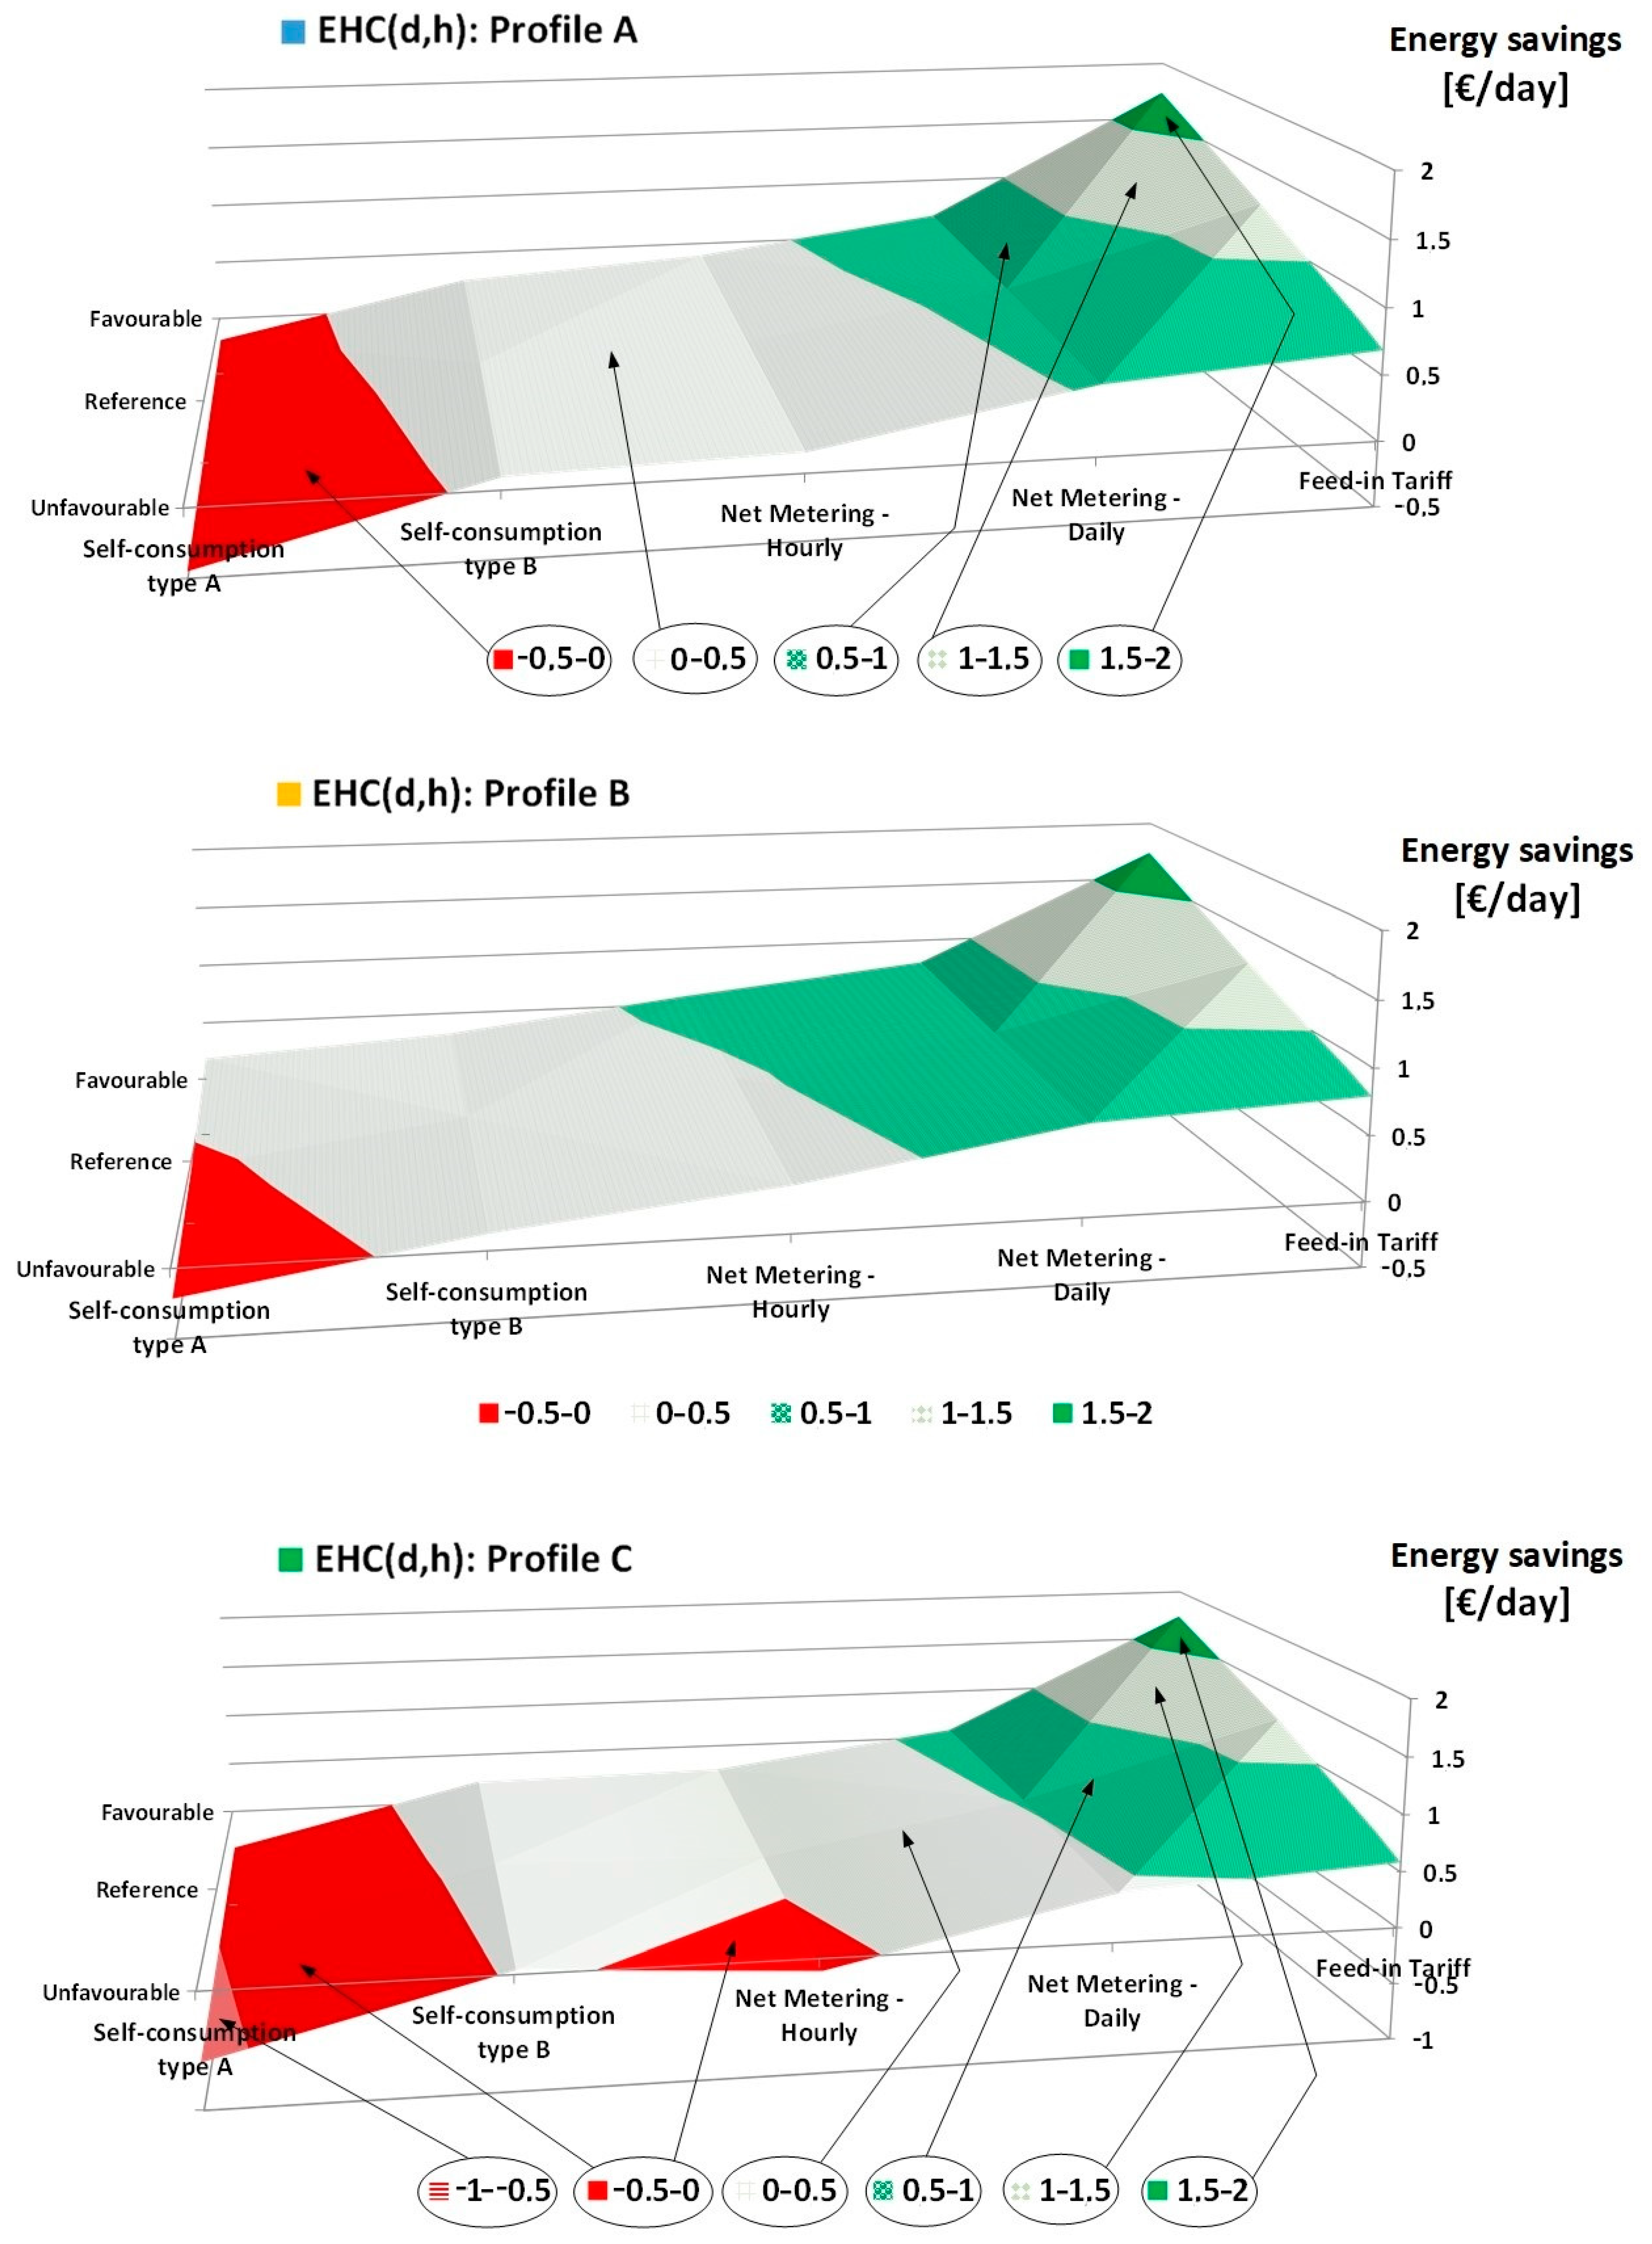
4.2. Economic Results of a Single Prosumer

4.2.1. Single Prosumer with ESS under Different Types of Energy Consumption Profiles

The results for a single household with ESS are expressed in Figure 12.
The tendency displayed by community results is maintained in the individual case. FiT is the scheme with the most savings for the consumer, followed by net metering, daily and hourly, and then self-consumption schemes, types B and A. The FiT rate has a significant impact on the economic savings of the dwelling, as the level of self-sufficiency in the base case is lower than the community self-sufficiency, and consumers greatly benefit from receiving a reward for selling the surplus electricity to the grid.
As it happens in the preceding section, daily net metering experiences minimal changes depending on the value of the regulatory parameters. Hence, it can be stated that it is the most resilient scheme.
Hourly net metering savings are theoretically limited to daily net metering savings. The reason is that, the wider the compensation frame, the more possible it is to compensate energy in time frames other than the same moment of consumption. In hourly net metering, the energy purchased at an hour h needs to be compensated during the same hour, but in daily net metering, it can be compensated at any time of the day. In consequence, the results are in line with the expectations: Systems with hourly net metering and ESS eachieve almost the same benefits than daily ESS because their ability to shift the compensation of energy in time.
Type-A self-consumption proves that, as an individual, being unrewarded for the energy sale while having to satisfy all the grid’s charges is detrimental for the economic savings. The installation of an ESS can make things better, but at the cost of a higher initial investment. Type-B self-consumption shows much better results. Both schemes are directly affected by the charges rate. A 20% decrease in this rate entails a greater percentage of change in the economic savings, specifically 94% in Type-A self-consumption and 41% in Type-B, for systems with ESS. The same is true for the 20% increase in the unfavorable scenario, which entails a 95% and a 36% reduction of the savings, in types A and B respectively.
When the individual patterns of consumption are such that match solar generation, benefits get increased, regardless of the regulatory framework applied. This shows the importance of flexibility measures such as demand response, which allows shifting the load to the hours of peak generation, inducing an increase of savings.

4.2.2. Single Prosumer without ESS under Different Types of Energy Consumption Profiles

The results for a single household without ESS are expressed in Figure 13. The lack of storage capacity is translated into a reduction of savings regardless of the regulatory framework applied, which represents an analogous behavior to what occurred for the energy community. Under a FiT scheme, this difference is less perceived. This scheme allows nonetheless for benefits under all the studied scenarios, achieving just 9% below systems with ESS for profile A in the reference scenario.
In other schemes, the lack of ESS is much more striking. Hourly net metering goes from a net saving of 0.72 €/day in the reference case for the profile A with ESS, to just 0.27 €/day in the aforesaid case without ESS. This pattern repeats across all consumption profiles and economic conditions, though not with the same intensity.
Daily net metering loses resilience against economic conditions, a trait that was not exhibited in systems with ESS. It remains, nevertheless, the most resilient scheme of all the studied ones, ranging from 0.54 €/day to 0.67 €/day in the unfavorable and favorable scenarios. However, a reduction of the compensation factor in non-ESS systems leads to a tangible loss, because the limit of compensation changes between scenarios (to a +20% or −20% of the total consumption, if it surpasses the total generation). Unlike in the previous case, hourly and daily net metering savings are much more dissimilar, because systems without ESS can compensate just a little part of the purchased energy.
Type-A self-consumption scheme becomes completely unprofitable without ESS support. Just under a profile B in the most favorable scenario, the savings are few, but positive. This proves the infeasibility of a regulatory framework addressed to promote renewable energies but without a rewarding scheme for the energy dumped into the grid. Type-B Self-consumption manages to obtain exiguous benefits, of 0.20 €/day in the reference case for the profile A, and of 0.53 €/day in the most favorable case under profile B, which is the one that matches generation the most.
The effect of the consumption profile matching generation can be perceived more strongly in systems without ESS, because households are pushed to self-consume their own energy at the time it is generated. This is not true in systems under a FiT scheme whose tariff exceeds the purchase price. In these systems, energy is being heavily dumped to the grid and self-sufficiency levels matter little.
In the case that the consumption pattern is opposed to solar generation, the prosumer perceives fewer savings, except on FiT schemes where the tariff surpasses the purchase price. The impact is again more pronounced on systems without ESS, and the magnitude of the change is similar both by increasing and by decreasing load matching.

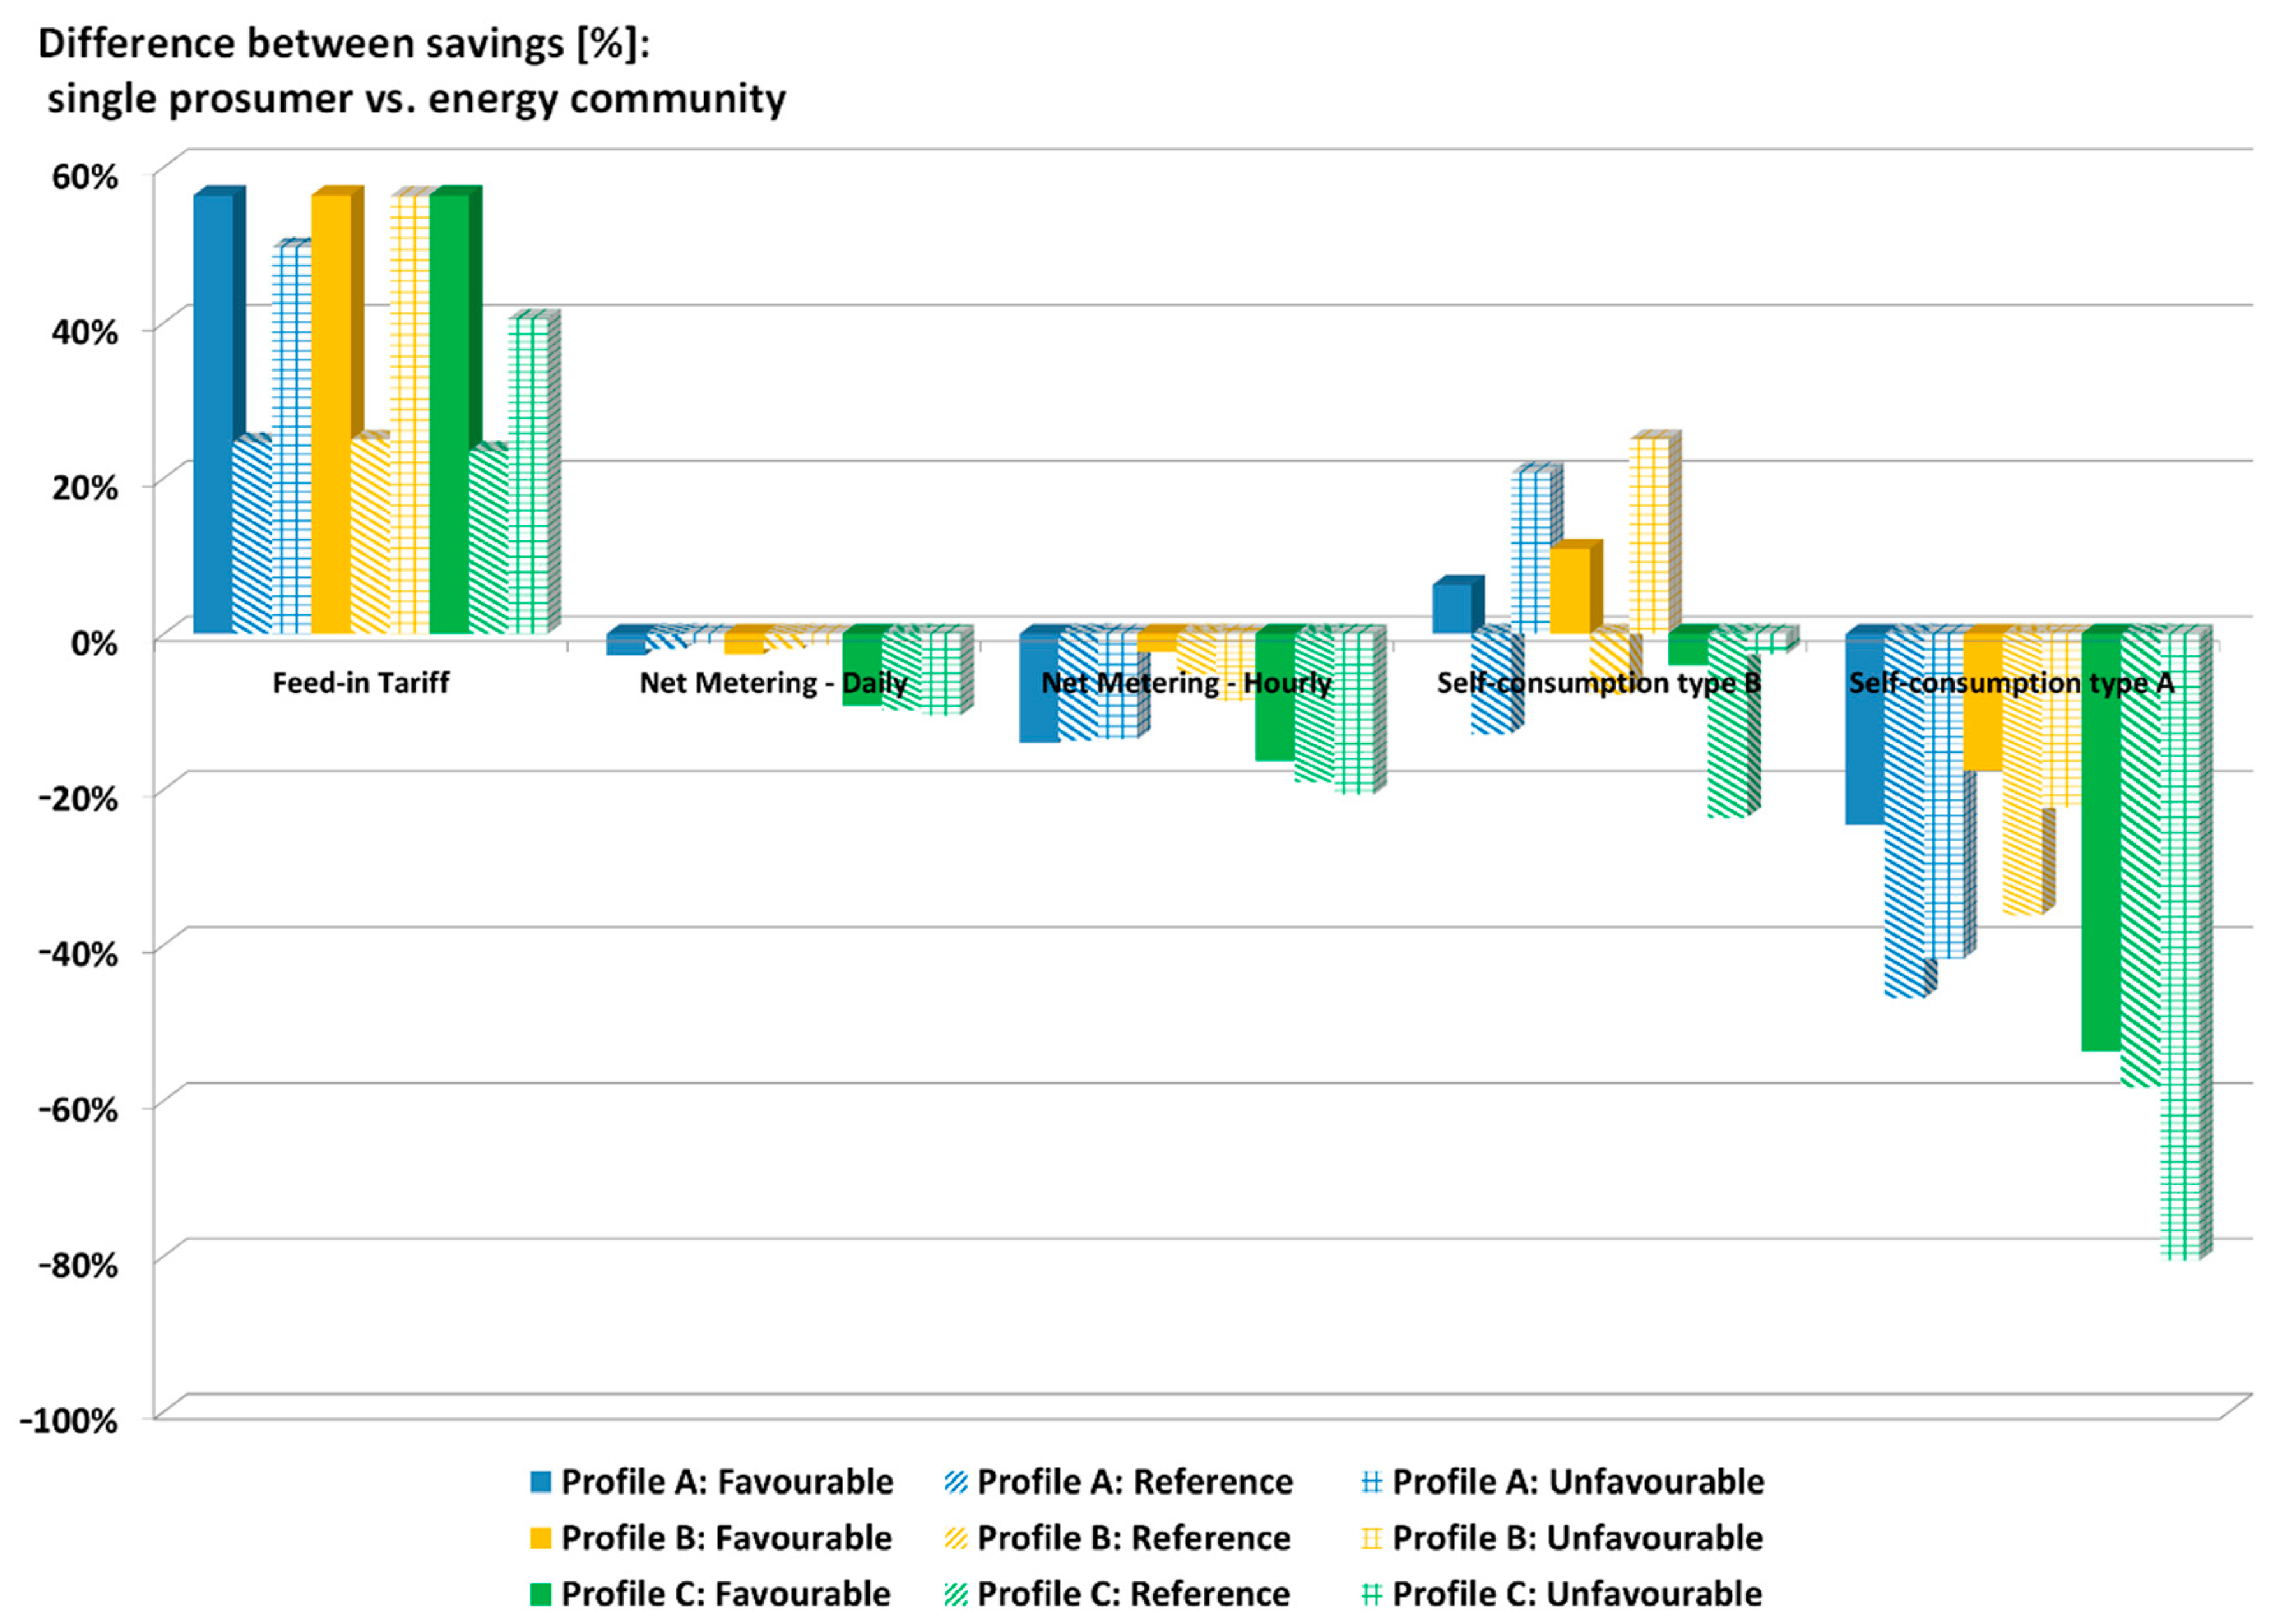
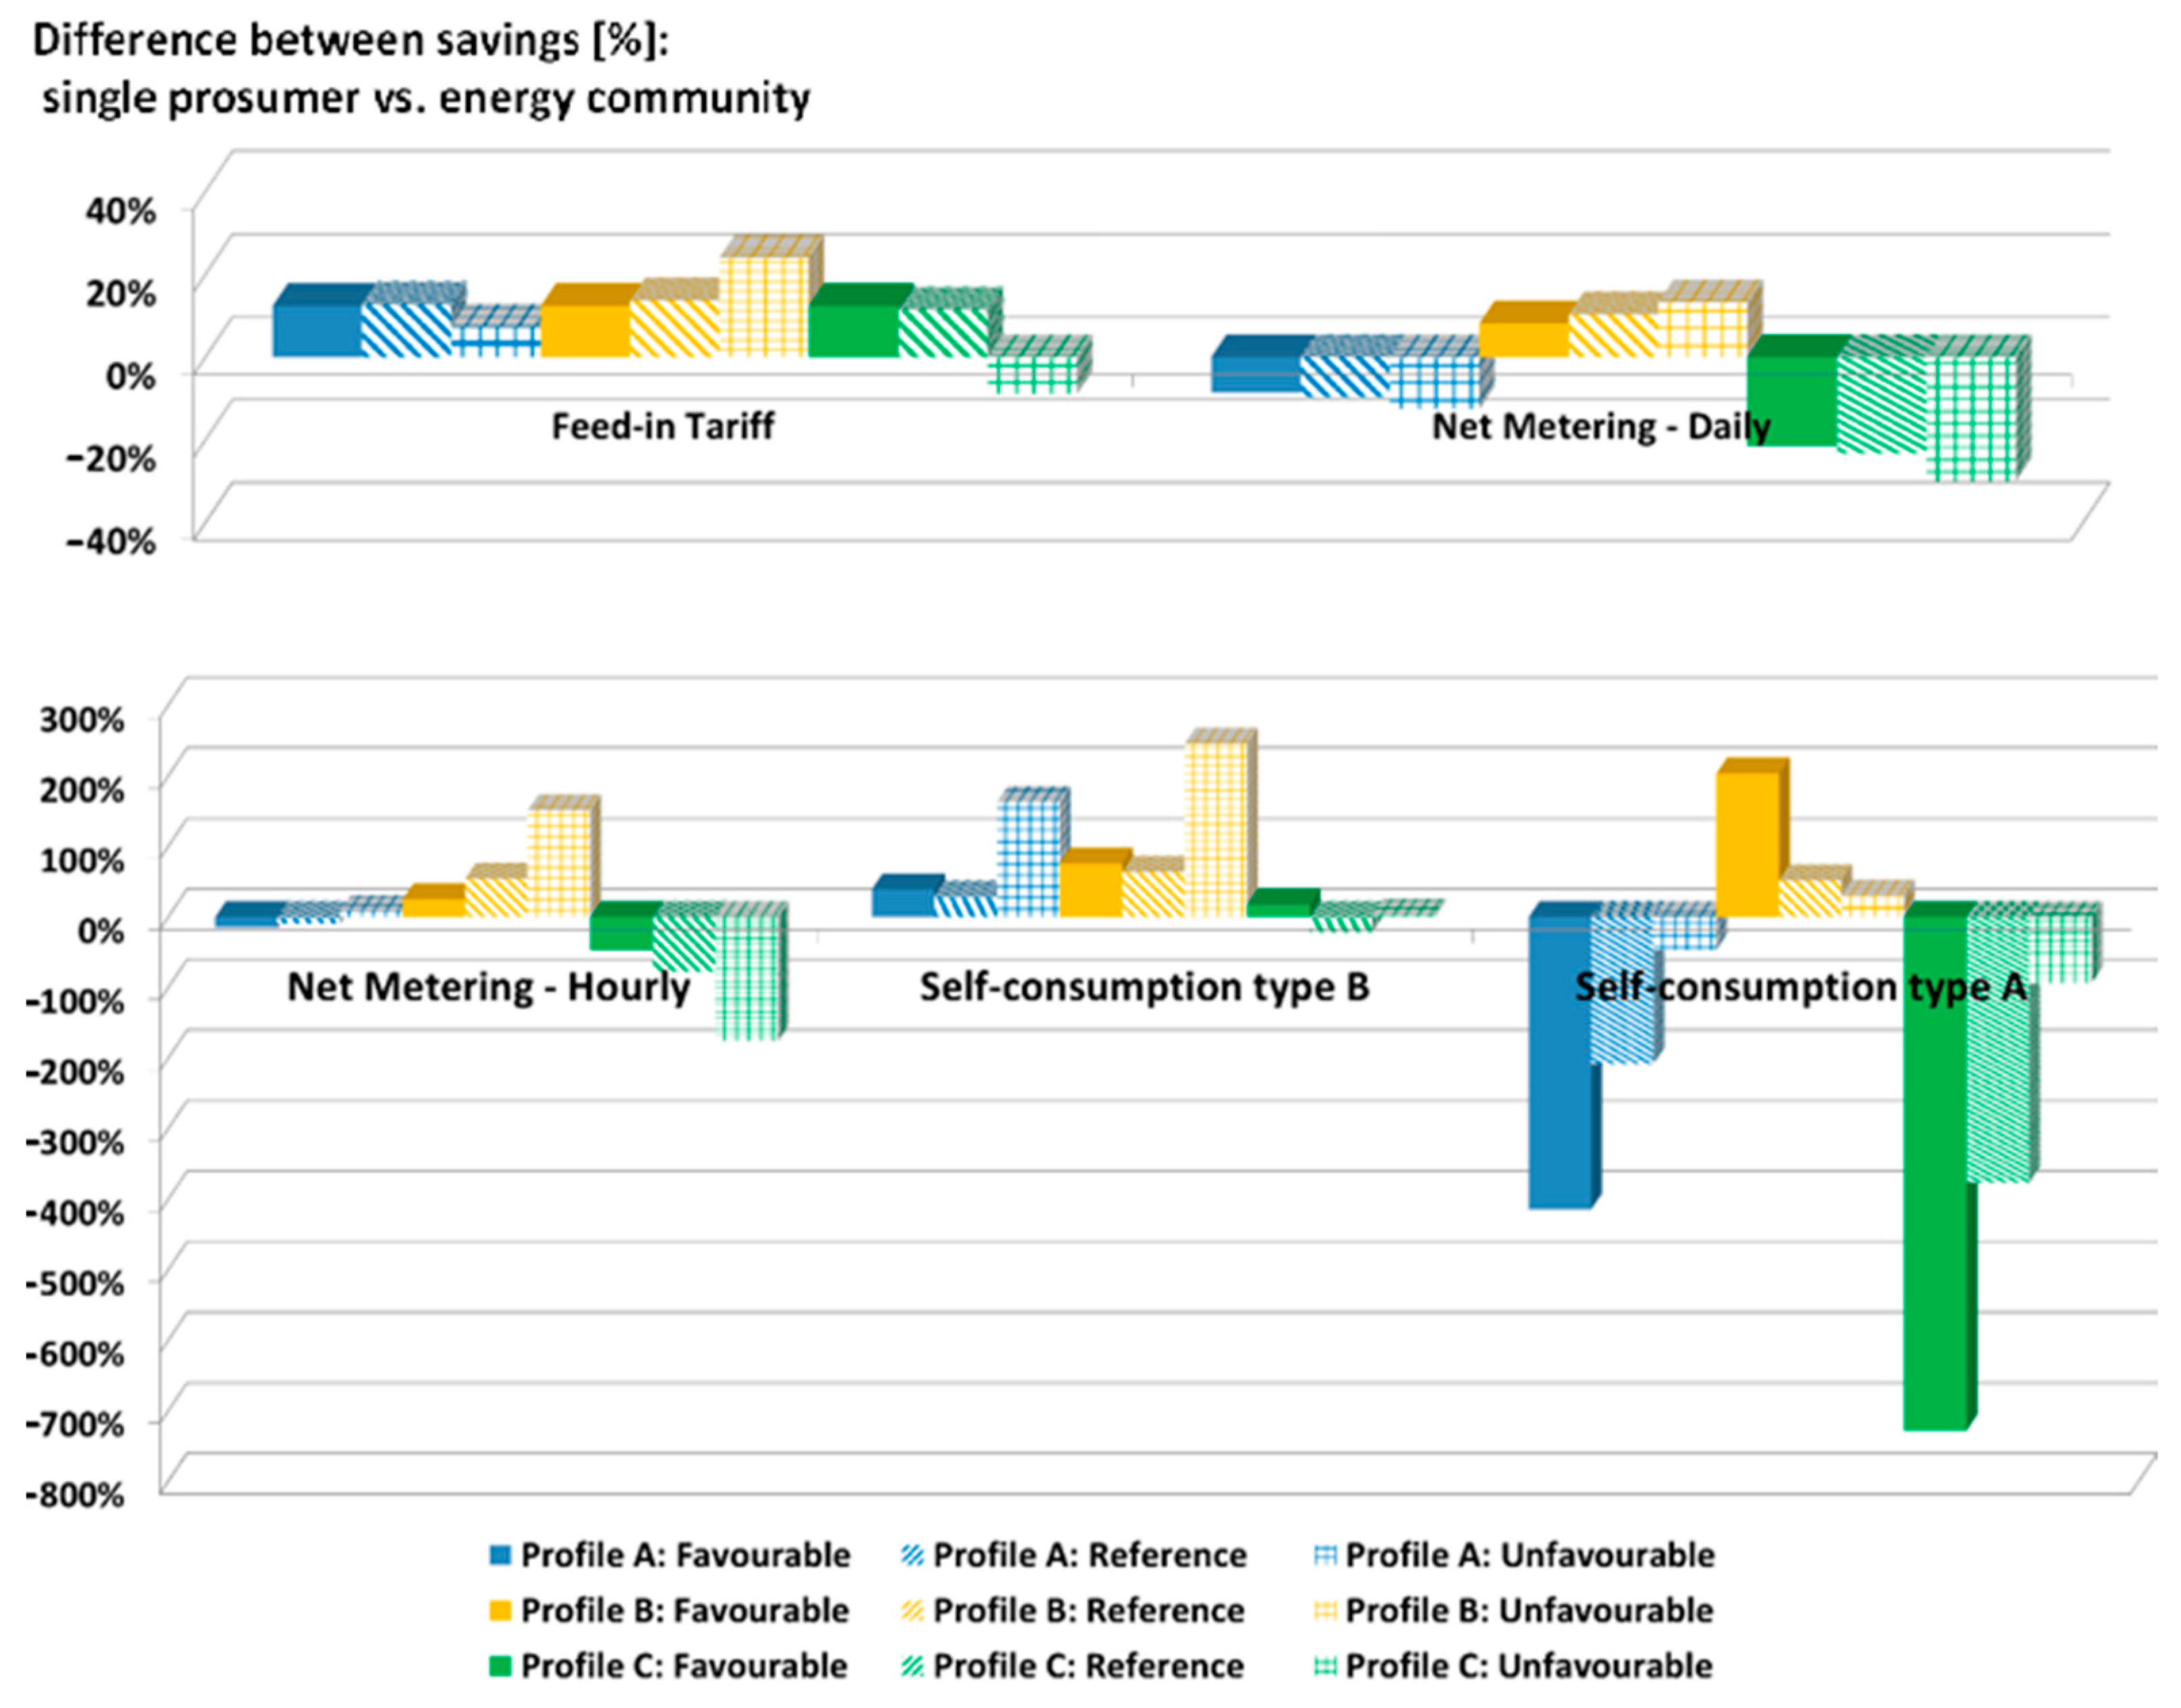
5. Individual Prosumer vs. Energy Community: Discussion

When comparing the reference case between an individual and the community mean, it can be concluded that grouping into a community entails several advantages:
-
Any of the individual generators can satisfy the energy needs of any other member of the community. For instance, solar panels on an empty household can supply energy to the neighborhood instead of selling the energy to the generally more beneficial grid.
-
The electrical overall demand curve is flatter. Even though each household has its own peaks of consumption, the peaks do not occur simultaneously. In consequence, the aggregate consumption is smoother. This reduces the energy storage needs, because the individual peaks are produced typically in the morning and in the night, moments where solar energy is unavailable.
-
Generators in different households can have diverse orientations. PV panels tilted to the east will generate more energy during the morning while the ones tilted to the west will provide more energy during the last hours of the day. This leads to the generation curve being more evenly distributed across the hours of the day. Therefore, the self-consumption rate, meaning the percentage of demand which is covered by the self-consumption facility, is higher.
The resulting difference between the savings of an energy community and a single prosumer is depicted in Figure 14 and Figure 15. For all the types of profiles, the savings of the single prosumer for each one of the regulatory schemes (FiT, net metering and self-consumption) and scenarios (favorable, reference and unfavorable), are compared with the savings of the energy community, for the same regulatory scheme and scenario. A positive result implies that the benefits of acting alone are higher to the ones that the prosumer would obtain within a community, and a negative result means the opposite.
Regarding systems with ESS, it is proved that under a FiT the benefits acting individually are superior to the ones that the prosumer would obtain within a community. This is because the optimal energy management under FiT consists of dumping the energy into the grid. In a community, the priority is to satisfy the needs of every member, and this is at odds with the maximization of the individual benefit that FiT implies.
Both types of net metering achieve a better performance in systems within a community. Unlike FiT, net metering benefits from a higher level of self-sufficiency, something that can be achieved easily when sharing resources globally rather than when prosumers act on their own.
Under self-consumption type-A, acting individually is greatly detrimental for the savings of the prosumer, regardless of its consumption profile. However, under self-consumption type-B, the results show quite the opposite. Type-B is a scheme that behaves similarly to FiT, in the sense that a substantial part of the benefits comes from the discharge of energy into the grid. Therefore, it can be observed that, under profiles A and B, the ones that match the most generation and consumption, it is discouraged for the prosumer to join the community. Under profile C, the savings remain more or less the same either acting jointly or individually.
For systems without ESS, the tendency explained before is maintained. FiT and type-B self-consumption do not achieve any benefit by joining a community, except in the most unfavorable case for FiT, and it is not determining. Hourly and daily net metering still improve their results within a community. This logic makes these regulatory schemes the most suitable to promote the development of energy communities and distributed generation facilities in general. Type-A self-consumption incurs in losses that are more extreme if acting individually.
Table 5 and Table 6 express all the aforementioned results in absolute terms. A positive value indicates that the individual benefit is superior to the mean benefit that the consumer would obtain within a community. More negative values imply that these frameworks are more suited to foster energy communities.
It is worth noting that, for a consumption profile B, and for all configurations without ESS, the savings of the individual exceed the mean savings in the community. That means that a customer with such a level of self-consumption will not be enticed to participate in the community if the benefits are shared equally. A reward scheme must be calculated in order to foster participation for all members of the residential area, and it must be based on the level of self-consumption that each customer has individually. Otherwise, this can be damaging to the collective welfare of the community, because the mean savings of the community surpass the sum of savings of all the individuals considered separately, except under schemes that are heavily electricity-dump oriented, such as FiT and type-B self-consumption.

6. Conclusions

In this paper, the influence of regulation on the economic benefits of a DER facility has been quantified. The study addressed the comparison between different ownerships: by the individual or single prosumer, and by the energy community or collective. A physical model which takes into account the different energy flows within the microgrid has been introduced. The economic model considers O&M costs, and a detailed billing structure in which charges and taxes are added to the energy market cost. Current regulatory frameworks for the promotion of renewable energies have been embedded into the economic model, namely, FiT, Net metering and the self-consumption scheme. After developing all the constraints, the formulation takes the form of a MILP. In order to improve the validity of the results, various scenarios have been taken into account in a what-if analysis. Several consumption profiles, as well as distinct rewarding or regulatory parameters have been employed in the analyzed cases. For each case, the economic savings of a private-owned facility have been evaluated and compared to the mean benefits of a dwelling inside an energy community. This comparison allowed to discern whether acting in community is more beneficial for the vast majority of the dwellings or not.
Results show that, for all regulatory frameworks studied except FiT and some instances of type-B self-consumption, mean results for the community are superior to the individual benefits that most consumers can achieve. However, it has been proved as well, that a consumer with an elevated level of self-sufficiency achieves higher benefits on his own than when joining a community, in the case without ESS. FiT and self-consumption schemes have proved to be extremely sensitive to modifications in the rewarding parameters, while net metering demonstrates much more resilience to changes. As suggested in our previous study [31] Net metering proves to be the most balanced scheme for fostering rooftop solar energy, because it provides a fair amount of savings to the prosumer, while being resilient to changes in consumption profiles and reward parameters, especially in systems with ESS.
After performing this research, several policy implications can be extracted, under the point of view of the authors:
-
It is proven that FiT, currently the most employed regulatory framework in the EU, is not the best alternative to foster DER facilities. In addition, while FiT efficacy to promote large-scale, private-owned facilities is undeniable, it encourages massive energy dumping, which can be detrimental for the grid stability and the economics of the system operator. If regulation is to change the energy paradigm into a decentralized system, policy makers should avoid the use of fixed tariffs for the energy sale. These tariffs are better suited for large and centralized power plants.
-
ESS should be promoted, especially in the collective case, where the initial investment can be jointly assumed among all members of the community. However, policy makers who opt for a FiT scheme should be wary about promoting ESS. The reason is that if the tariff is high enough, ESS can be used for energy arbitraging, meaning that ESS will be employed to purchase energy at the lowest price in the day and then sell it to the FiT rate. This is not a desirable effect of ESS promotion and can be detrimental both for the grid finances and the community’s ethics.
-
Of all the schemes analyzed, net metering is the one which shows the most advantages at DER promotion. However, policy makers should not blindly opt for net metering. Even daily net metering is unable to improve the economic results of individuals that already enjoy a high level of self-sufficiency by introducing them in a community. For a DER-fostering mechanism to have effect, a rewarding scheme based on each prosumer’s habits of consumption should be taken into consideration. This will, in turn, encourage investments in demand-side management, improving energy efficiency and economics.
-
Type-A self-consumption has been proved to be ineffective at promoting renewable energy facilities, both collective and privately owned. If policy makers determine that grid charges are to be introduced, a rewarding mechanism for the surplus energy must be established as well (type-B self-consumption).
This study has been performed considering the point of view of the consumer. This constitutes a limitation when drawing further policy implications. Future works will include how the different regulatory frameworks affect energy finances considering the point of view of the system operator as well. In addition, the what-if analysis can be improved if a model that considers uncertainty is employed instead. The authors are planning on including this model in a future work as well.

Author Contributions

Conceptualization: J.d.l.H. and H.M.; Data curation: À.A. and S.C.; Formal analysis: À.A., J.d.l.H. and H.M.; Funding acquisition: J.d.l.H., H.M. and J.M.; Investigation: À.A., J.d.l.H., S.C. and J.M.; Methodology: À.A., S.C. and J.M.; Project administration: J.d.l.H., H.M. and J.M.; Resources: À.A., H.M. and S.C.; Software: À.A. and H.M.; Supervision: J.d.l.H., H.M. and J.M.; Validation: J.d.l.H., H.M. and J.M.; Visualization: J.d.l.H.; Writing–original draft: À.A.; Writing–review & editing: À.A., M.T.P.; All authors have read and agreed to the published version of the manuscript.

Funding

This work has been partially supported by the research project ENE2015-64087-C2-1-R (MINECO/FEDER) and PECT LITORAL BESÒS TERRITORI SOSTENIBLE GO03-003364–Talent energètic.

Institutional Review Board Statement

Not applicable.

Informed Consent Statement

Not applicable.

Conflicts of Interest

The authors declare no conflict of interest.

Nomenclature

General
CELCost of energy loss
DERDistributed energy resources
ESSEnergy Storage System
FiTFeed-in-Tariff scheme
HNM/DNMHourly/Daily Net Metering
MILPMixed Integer Linear Program
O&MOperation and Maintenance
RESRenewable Energy Sources
SFC_A/SFC_BSelf-consumption scheme types A/B
Mathematical program
Binary_StBinary variable that indicates the state of the battery (dimensionless)
C.GAUTotal operation and maintenance costs [€]
CFG/CFG.AUFixed operation and maintenance costs term [€/kW] and overall [€]
CVG/CVG.AUVariable operation and maintenance costs term [€/kWh] and overall [€]
CFS/CF.STFixed O&M costs term [€/kW] and overall [€] for the ESS
CVS/CV.STVariable O&M costs term [€/kWh] and overall [€] for the ESS
CHSAAuxiliary services consumption [kWh]
EBill RS/CSFinal price of the electricity bill for the regulatory scheme (RS) and for the conventional system (CS) [€]
EGEnergy supplied by the electrical grid [kWh]
EHCEnergy consumption [kWh]
EnergyCostCost of electricity without charges and taxes [€]
ENGTax coefficient over the amount of sold energy [€/kWh]
EPEquivalent energy price [€/kWh]
EREnergy produced by RES [kWh]
ERMaxMaximum potential of RES [kW]
ESC/ESDEnergy charged / discharged by the ESS [kWh]
ESCmax/ESDmaxMaximum energy that the battery is able to charge /discharge in an hour [kWh]
EtGEnergy exported to the electrical grid [kWh]
IMP.GETaxes related to the energy sale [€]
INGTax coefficient over the price of sold energy (dimensionless)
Nbat
Obj. f
Efficiency of the battery (dimensionless)
Value of the objective function [€]
Pc and EcPower/Energy charges of the self-consumption scheme [€/kW] and [€/kWh]
PConContracted power [kW]
P_FiTFeed-in-tariff rate [€/kWh]
PmdDay-ahead electricity market price [€/kWh]
SStored energy in the ESS [kWh]
S0Initial charge of the battery [kWh]
SmaxMaximum capacity of the battery [kWh]
SoCState of Charge of the ESS (dimensionless)
SoC min/maxMinimum and maximum State of Charge of the ESS (dimensionless)
TaxCoefTax related to energy purchase (dimensionless)
Tp/T.FPPower term of the access tariff [€/kW]/Overall cost of the power term [€]
Te/T.FEEnergy term of the access tariff [€/kWh]/Overall cost of the energy term [€]
X_YEnergy flow from X to Y. For example, EG_EHC is the energy flow from grid to consumption

References

  1. European Commission. 2030 Climate & Energy Framework. Available online: https://ec.europa.eu/clima/policies/strategies/2030 (accessed on 30 March 2020).
  2. Gangale, F.; Vasiljevska, J.; Covrig, F.; Mengolini, A.; Fulli, G. Smart Grid Projects Outlook 2017: Facts, Figures and Trends in Europe; Publications Office of the European Union: Luxembourg, 2017; pp. 31–32. [Google Scholar] [CrossRef]
  3. International Renewable Energy Agency. The Post-Covid Recovery. An Agenda for Resilience, Development and Equality. Available online: https://www.irena.org/-/media/Files/IRENA/Agency/Publication/2020/Jun/IRENA_Post-COVID_Recovery_2020.pdf (accessed on 3 July 2020).
  4. European Commission. Study on “Residential Prosumers in the European Energy Union”. Available online: https://ec.europa.eu/commission/sites/beta-political/files/study-residential-prosumers-energy-union_en.pdf (accessed on 14 April 2020).
  5. Koirala, B.P.; Koliou, E.; Friege, J.; Hakvoort, R.A.; Herder, P.M. Energetic Communities for Community Energy: A Review of Key Issues and Trends Shaping Integrated Community Energy Systems. Renew. Sustain. Energy Rev. 2016, 56, 722–744. [Google Scholar] [CrossRef] [Green Version]
  6. Amaral-Lopes, R.; Martins, J.; Aelenei, D.; Pantoja-Lima, C. A cooperative net zero energy community to improve load matching. Renew. Energy 2016, 93, 1–13. [Google Scholar] [CrossRef]
  7. Tomc, M.E.; Vassallo, A.M. The effect of individual and communal electricity generation, consumption and storage on urban Community Renewable Energy Networks (CREN): An Australian case study. Int. J. Sustain. Energy Plan. Manag. 2016, 11, 15–32. [Google Scholar] [CrossRef]
  8. Süsser, D.; Döring, M.; Ratter, B. Harvesting energy: Place and local entrepreneurship in community-based renewable energy transition. Energy Policy 2017, 101, 332–341. [Google Scholar] [CrossRef]
  9. Braito, M.; Flint, C.; Muhar, A.; Penker, M.; Vogel, S. Individual and collective socio-psychological patterns of photovoltaic investment under diverging policy regimes of Austria and Italy. Energy Policy 2017, 109, 141–153. [Google Scholar] [CrossRef]
  10. Kalkbrenner, B.; Roosen, J. Citizens’ willingness to participate in local renewable energy projects: The role of community and trust in Germany. Energy Res. Soc. Sci. 2016, 13, 60–70. [Google Scholar] [CrossRef]
  11. Vuichard, P.; Stauch, A.; Dällenbach, N. Individual or collective? Community investment, local taxes, and the social acceptance of wind energy in Switzerland. Energy Res. Soc. Sci. 2019, 58, 101275. [Google Scholar] [CrossRef]
  12. Mey, F.; Diesendorf, M.; MacGill, I. Can local government play a greater role for community renewable energy? A case study from Australia. Energy Res. Soc. Sci. 2016, 21, 33–43. [Google Scholar] [CrossRef]
  13. Hanna, R.; Ghonima, M.; Kleissl, J.; Tynan, G.; Victor, D. Evaluating business models for microgrids: Interactions of technology and policy. Energy Policy 2017, 103, 47–61. [Google Scholar] [CrossRef]
  14. Cornélusse, B.; Savelli, I.; Paoletti, S.; Giannitrapani, A.; Vicino, A. A community microgrid architecture with an internal local market. Appl. Energy 2019, 242, 547–560. [Google Scholar] [CrossRef] [Green Version]
  15. Mengelkamp, E.; Gärttner, J.; Rock, K.; Kessler, S.; Orsini, L. Designing microgrid energy markets. A case study: The Brooklyn Microgrid. Appl. Energy 2018, 210, 870–880. [Google Scholar] [CrossRef]
  16. Liu, Y.; Zuo, K.; Liu, A.; Liu, J.; Kennedy, J.M. Dynamic pricing for decentralized energy trading in micro-grids. Appl. Energy 2018, 228, 689–699. [Google Scholar] [CrossRef] [Green Version]
  17. Liu, X.; Wang, S.; Sun, J. Energy management for community energy network with CHP based on cooperative game. Energies 2018, 11, 1066. [Google Scholar] [CrossRef] [Green Version]
  18. Jia, L.; Tong, L. Renewables and storage in distribution systems: Centralized vs. decentralized integration. IEEE J. Sel. Areas Commun. 2016, 34, 665–674. [Google Scholar] [CrossRef] [Green Version]
  19. Prete, C.L.; Hobbs, B. A cooperative game theoretic analysis of incentives for microgrids in regulated electricity markets. Appl. Energy 2016, 169, 524–541. [Google Scholar] [CrossRef] [Green Version]
  20. Chen, W.; Zeng, Y.; Xu, C. Energy storage subsidy estimation for microgrid: A real option game-theoretic approach. Appl. Energy 2019, 239, 373–382. [Google Scholar] [CrossRef]
  21. Roberts, M.B.; Bruce, A.; MacGill, I. Impact of shared battery energy storage systems on photovoltaic self-consumption and electricity bills in apartment buildings. Appl. Energy 2019, 245, 78–95. [Google Scholar] [CrossRef]
  22. Long, C.; Wu, J.; Zhou, Y.; Jenkins, N. Peer-to-peer energy sharing through a two-stage aggregated battery control in a community Microgrid. Appl. Energy 2018, 226, 262–276. [Google Scholar] [CrossRef]
  23. Lüth, A.; Zepter, J.M.; Crespo-del-Granado, P.; Egging, R. Local electricity market designs for peer-to-peer trading: The role of battery flexibility. Appl. Energy 2018, 229, 1233–1243. [Google Scholar] [CrossRef] [Green Version]
  24. Zepter, J.M.; Lüth, A.; Crespo-del-Granado, P.; Egging, R. Prosumer integration in wholesale electricity markets: Synergies of peer-to-peer trade and residential storage. Energy Build. 2019, 184, 163–176. [Google Scholar] [CrossRef]
  25. Qi, W.; Shen, B.; Zhang, H.; Shen, Z.M. Sharing demand-side energy resources—A conceptual design. Energy 2017, 135, 455–465. [Google Scholar] [CrossRef]
  26. Barbour, E.; Parra, D.; Awwad, Z.; González, M.C. Community Energy Storage: A smart choice for the smart grid? Appl. Energy 2018, 212, 489–497. [Google Scholar] [CrossRef] [Green Version]
  27. Van der Stelt, S.; AlSkaif, T.; van Sark, W. Techno-economic analysis of household and community energy storage for residential prosumers with smart appliances. Appl. Energy 2018, 209, 266–276. [Google Scholar] [CrossRef]
  28. Quoilin, S.; Kavvadias, K.; Mercier, A.; Pappone, I.; Zucker, A. Quantifying self-consumption linked to solar home battery systems: Statistical analysis and economic assessment. Appl. Energy 2016, 182, 58–67. [Google Scholar] [CrossRef]
  29. Müller, S.C.; Welpe, I.M. Sharing electricity storage at the community level: An empirical analysis of potential business models and barriers. Energy Policy 2018, 118, 492–503. [Google Scholar] [CrossRef]
  30. Campos, I.; Pontes Luz, G.; Marín-González, E.; Gährs, S.; Hall, S.; Holstenkam, L. Regulatory challenges and opportunities for collective renewable energy prosumers in the EU. Energy Policy 2019, 138, 111212. [Google Scholar] [CrossRef]
  31. De la Hoz, J.; Alonso, À.; Coronas, S.; Martín, H.; Matas, J. Impact of Different Regulatory Structures on the Management of Energy Communities. Energies 2020, 13, 2892. [Google Scholar] [CrossRef]
  32. Luna, A.C.; Diaz, N.L.; Graells, M.; Vasquez, J.C.; Guerrero, J.M. Mixed-Integer-Linear-Programming Based Energy Management System for Hybrid PV wind-battery Microgrids: Modelling, Design and Experimental Verification. IEEE Trans. Power Electr. 2017, 32, 2769–2783. [Google Scholar] [CrossRef] [Green Version]
  33. Banja, M.; Jégard, M.; Monforti-Ferrario, F.; Dallemand, J.F.; Taylor, N.; Motola, V.; Sikkema, R. Renewables in the EU: An Overview of Support Schemes and Measures; Publications Office of the European Union: Luxembourg, 2017; p. 3. [Google Scholar] [CrossRef]
  34. Luthander, S.; Widén, J.; Munkhammar, J.; Lingfors, D. Self-consumption enhancement and peak shaving of residential photovoltaics using storage and curtailment. Energy 2016, 112, 221–231. [Google Scholar] [CrossRef]
  35. Photovoltaic Geographical Information System—European Commission. Available online: https://re.jrc.ec.europa.eu/pvg_tools/en/tools.html#MR (accessed on 10 July 2017).
  36. PVSyst Photovoltaic Source Component Databsase. Available online: https://www.pvsyst.com/help/pvmodule_database.htm (accessed on 10 July 2017).
  37. Ortiz, J.; Guarino, F.; Salom, J.; Corchero, C.; Cellura, M. Stochastic model for electrical loads in Mediterranean residential buildings: Validation and applications. Energy Build. 2014, 80, 23–36. [Google Scholar] [CrossRef] [Green Version]
  38. Operador del Mercado Ibérico de la Electricidad. Available online: https://www.omie.es (accessed on 10 July 2017).
  39. Ministerio de Industria, Energía y Turismo. Orden IET/107/2014, de 31 de Enero. BOE, 1 February 2014. Available online: https://www.boe.es/diario_boe/txt.php?id=BOE-A-2014-1052 (accessed on 25 July 2017).
  40. Office of Gas and Electricity Markets. Feed-In Tariff (FIT) Rates. Available online: https://www.ofgem.gov.uk/environmental-programmes/fit/fit-tariff-rates (accessed on 17 April 2020).
  41. Federal Ministry for Economic Affairs and Energy. Renewable Energy Sources Act—RES Act 2014. Available online: https://www.bmwi.de/Redaktion/EN/Downloads/renewable-energy-sources-act-eeg-2014.pdf?__blob=publicationFile&v=1 (accessed on 17 April 2020).
  42. Organisation for Economic Co-Operation and Development. Renewable Energy Feed-In Tariffs. Available online: https://stats.oecd.org/Index.aspx?DataSetCode=RE_FIT (accessed on 20 April 2020).
  43. Ministerio de Energía, Turismo, y Agenda Digital. Orden ETU/1976/2016, de 23 de Diciembre. BOE, 29 December 2016. Available online: https://www.boe.es/buscar/doc.php?id=BOE-A-2016-12464 (accessed on 25 July 2017).
Figure 1. Criteria employed in the literature survey. Source: self-elaboration.
Energies 14 00676 g001
Figure 2. Methodology undertaken in this study. Source: self-elaboration.
Energies 14 00676 g002
Figure 3. Representation of the physical model of a microgrid for a single prosumer. Source: self-elaboration.
Energies 14 00676 g003
Figure 4. Representation of the consumer’s billing structure. Source: self-elaboration.
Energies 14 00676 g004
Figure 5. Representation of the prosumer’s billing subjected to the structure of the FiT scheme (a), the Net Metering scheme (b) and the Self-consumption scheme (c). Source: self-elaboration.
Energies 14 00676 g005
Figure 6. What-if analysis and scenarios under consideration, for the individual case (a) and the energy community (b). Source: self-elaboration.
Energies 14 00676 g006
Figure 7. Maximum aggregated hourly energy produced by an energy community (above) and a single prosumer (below) for a sunny simulation day. Source: self-elaboration.
Energies 14 00676 g007
Figure 8. Aggregated hourly energy consumption of the energy community for a typical autumn week. Source: self-elaboration.
Energies 14 00676 g008
Figure 9. Electricity consumption profiles of the single prosumer used in the simulation, for a week in autumn, and comparison with their energy generation. Source: self-elaboration.
Energies 14 00676 g009aEnergies 14 00676 g009b
Figure 10. Equivalent electricity price (in green color) of the consumer for a simulation day (autumn weekday). Source: self-elaboration.
Energies 14 00676 g010
Figure 11. Energy economic results of the energy community with and without ESS. Source: self-elaboration.
Energies 14 00676 g011
Figure 12. Energy economic results of a single prosumer with ESS under different types of consumption profiles. Source: self-elaboration.
Energies 14 00676 g012
Figure 13. Energy economic results of a single prosumer without ESS under different types of consumption profiles. Source: self-elaboration.
Energies 14 00676 g013
Figure 14. Comparative analysis of the energy economic results. Energy assets with ESS. Source: self-elaboration.
Energies 14 00676 g014
Figure 15. Comparative analysis of the energy economic results. Energy assets without ESS. Source: self-elaboration.
Energies 14 00676 g015
Table 1. Access tariff coefficients. Source: self-elaboration based on [39].
Type of Supply ContractSingle Period (SP)
Access tariffsp = 1
Te [€/kWh]0.044
Tp [€/kW·year]38.04
Table 2. FiT scenarios. Source: self-elaboration based on [40,41,42].
ScenarioFiT Value
Favorable case0.18 €/kWh
Base case0.1315 €/kWh
Unfavorable case0.061 €/kWh
Table 3. Self-consumption charges. Source: [43].
ScenarioFixed Charge
(€/kW·Year)
Variable Charge
(€/kWh)
Favourable case6.5150.034
Base case8.1440.043
Unfavourable case9.7730.052
Table 4. Data employed in the simulation. Source: self-elaboration.
ParameterCommunity ValueIndividual Value
Generation and Consumption
Time step1 h
Simulation periodOne week for each season (autumn, winter, spring and summer)
Peak consumption200 kWBaseFavorableUnfavorable
2.1 kW1.8 kW1.7 kW
Hour of peak consumption21 h21 h10 h21 h
Average daily consumed energy1553 kWh9.8 kWh9.3 kWh9.0 kWh
Auxiliary services consumption1.7 kW10 W
Contracted power381 kW2.3 kW
Total PV capacity374 kW2.3 kW
PV peak power 302 kW1.9 kW
Average daily generated energy1791 kWh11.9 kWh
Energy storage
Battery capacity1275 kWh 7.7 kWh
Aggregated maximum charge/discharge power128 kW768 W
Aggregated maximum charge/discharge power at status 125.5 kW154 W
Efficiency98%98%
Depth of discharge80%80%
Initial State of Charge60%60%
Electricity billing
Meter rent1.11 €/month
VAT21%
Electricity tax5.11%
Electricity market price0.039–0.075 €/kWh
Power term of the access tariff38.04 €/kW·year
Energy term of the access tariff0.044 €/kWh
FiTBaseFavorableUnfavorableBaseFavorableUnfavorable
0.13 €/kWh0.18 €/kWh0.06 €/kWh0.13 €/kWh0.18 €/kWh0.06 €/kWh
Net Metering1 to 11 to 1.21.2 to 11 to 11 to 1.21.2 to 1
Self-consumptionBase charges−20% charges+20% chargesBase charges−20% charges+20% charges
O&M Costs
Energy sale tax0.5 €/MWh + 7% over the energy value0.5 €/MWh + 7% over the energy value
PV O&M costs36.1 €/kW·year36.1 €/kW·year
Storage O&M costs6.1 €/kW·year + 0.49 €/MWh6.1 €/kW·year + 0.49 €/MWh
Table 5. Difference between the individual benefit and the mean benefit within a community, in €/day, for all profiles and regulatory frameworks considered in systems without ESS. Source: self-elaboration.
Regulatory FrameworkProfile AProfile BProfile C
Fav.Ref.Unf.Fav.Ref.Unf.Fav.Ref.Unf.
FiT0.190.140.050.190.150.150.190.12−0.06
Net Metering–Hourly−0.07−0.030.010.120.160.21−0.21−0.23−0.25
Net Metering–Daily−0.06−0.07−0.080.060.070.08−0.16−0.16−0.18
Self-Consumption A−0.25−0.22−0.140.120.050.09−0.44−0.39−0.29
Self-Consumption B0.070.050.060.140.100.090.03−0.030.00
Table 6. Difference between the individual benefit and the mean benefit within a community, in €/day, for all profiles and regulatory frameworks considered in systems with ESS. Source: self-elaboration.
Regulatory FrameworkProfile AProfile BProfile C
Fav.Ref.Unf.Fav.Ref.Unf.Fav.Ref.Unf.
FiT0.870.270.320.870.270.360.870.260.26
Net Metering–Hourly−0.12−0.11−0.11−0.02−0.04−0.07−0.14−0.16−0.17
Net Metering–Daily−0.03−0.02−0.01−0.03−0.02−0.01−0.09−0.09−0.10
Self-Consumption A−0.09−0.13−0.04−0.07−0.10−0.02−0.20−0.16−0.08
Self-Consumption B0.03−0.050.040.05−0.030.05−0.02−0.10−0.01
Publisher’s Note: MDPI stays neutral with regard to jurisdictional claims in published maps and institutional affiliations.

