Article

A Fault Diagnosis Mechanism with Power Generation Improvement for a Photovoltaic Module Array

Department of Electrical Engineering, National Chin-Yi University of Technology, Taichung 41170, Taiwan
*
Author to whom correspondence should be addressed.
Energies 2021, 14(3), 598; https://doi.org/10.3390/en14030598
Submission received: 10 October 2020 / Revised: 17 January 2021 / Accepted: 20 January 2021 / Published: 25 January 2021
(This article belongs to the Special Issue Fault Detection and Diagnosis of Photovoltaic Systems)

Abstract

:
This paper aims to develop an online diagnostic mechanism, doubling as a maximum power point tracking scheme, for a photovoltaic (PV) module array. In case of malfunction or shadow event occurring to a PV module, the presented diagnostic mechanism is enabled, automatically and immediately, to reconfigure a PV module array for maximum output power operation under arbitrary working conditions. Meanwhile, the malfunctioning or shaded PV module can be located instantly by this diagnostic mechanism according to the array configuration, and a PV module replacement process is made more efficient than ever before for the maintenance crew. In this manner, the intended maximum output power operation can be resumed as soon as possible in consideration of a minimum business loss. Using a particle swarm optimization (PSO)-based algorithm, the PV module array is reconfigured by means of switch manipulations between modules, such that a load is supplied with the maximum amount of output power. For compactness, the PSO-based online diagnostic algorithm is implemented herein using a TMS320F2808 digital signal processor (DSP) and is experimentally validated as successful to identify a malfunctioning PV module at the end of this work.

1. Introduction

A plunge in the output power of a photovoltaic (PV) module array is seen due to a shadow or malfunction event in [1,2]. Furthermore, an current-voltage (I–V) curve distortion in a PV module array results in a multiple peak problem along a power-voltage (P–V) characteristic curve. As a consequence, a maximum power point tracker (MPPT) in a power conditioner is likely to be trapped at a local, rather than the desired global, maximum power point (MPP). Even though the global maximum power point (GMPP) can be successfully tracked as expected on a P–V characteristic curve with multiple peaks [3,4], the overall power generation efficiency deteriorates in a heavily shaded case, and little improvement is made accordingly because a PV module array is not built with adaptive configuration. For this sake, a PV module array is made up of a fixed part and an adaptive bank, as presented in [5]. In the case of a partially shaded event, the adaptive bank is connected to the fixed part through array switches as an effective way to reduce the shadow effect on the operation of a power system. Nonetheless, this scheme requires a great number of voltage/current sensors and switches to connect an adaptive bank to a fixed part. It also particularly requires a tremendous amount of PV modules deployed in an adaptive bank to achieve a high output power level. Therefore, it is an impractical strategy in terms of cost. In addition, as put forward in [6], a PV module array is reconfigured in a way that deploys an MPPT on each branch to reduce the module shadow or malfunction effect. This approach is validated as effective in respect to the improvement in the overall power generation efficiency, but it requires a greater number of DC–DC converters, leading to a rise in the facility cost. As in [7], a shaded PV module goes offline, not to deteriorate the overall output power performance, but at the cost of a highly complex array configuration and a greater number of switches between modules. The static array configuration proposed in [8] does not require sensors or switches, and the PV modules are arranged in such a way that the shade is not concentrated but dispersed all over the PV module array. However, the dispersion of shade in the proposed arrangement has to be preformed in advance for different series and parallel connections. Therefore, it is only suitable for a specific number of PV module connections, and a considerable number of cables are needed for reassembling the configuration. Some mismatch mitigation techniques using power electronics integrated for PV modules are developed in [9,10] to become smart PV modules, but more complex module-integrated topologies/converters should be required, thus increasing the cost.
So far, there has been a great volume of published studies on PV module array malfunction diagnosis. As in [11], a method to detect PV array faults and partial shading in the PV system was proposed under all irradiation conditions using the measured array voltage, array current, and irradiance. However, this proposed method can only classify the status of the PV module array into three possible scenarios—normal operation, partial shading, and fault. A simple online fault detection method for PV systems using the available data of PV array voltage and current by means of wavelet packets was presented in [12]. However, this method can only detect the line–line fault with one or more than one module mismatch and partial shading occurrence. As shown in [13], a simple and effective approach was adopted for the automatic diagnosis of fault module strings in PV systems, which is based on the real-time operating voltage of PV modules. The analysis of PV string failure includes several electrical fault scenarios and their impact on the PV string characteristics. Nevertheless, this method can only locate the faulty strings. One major disadvantage of all the above-mentioned methods [11,12,13] is that the malfunctioning modules cannot be located. Another disadvantage is that if the malfunction of the module happens, these methods will fail to provide an improvement in the output power before the replacement. As suggested in [14,15,16], a fault diagnosis is made on the basis of field test results, while it might result in output power performance deterioration or even put operators in danger if a PV power generation system is not properly wired. Another problem is that this approach is developed to diagnose a case in a seriously abnormal operation, not a shaded or malfunction case, and it lacks a way to improve the output performance as well. An extension-based model and a PSIM circuit-oriented simulator model [17] are built for fault diagnosis and a nonlinear PV source, respectively, and give an accurate diagnosis due to a good agreement between computer simulations and experimental results. However, not taking into consideration the blocking and bypass diodes, the mathematical models result in errors in the output characteristic curves for a malfunction case.
In addition, there are few large-scale projects on fault diagnosis for PV module arrays worldwide other than photovoltaic operation using satellite data (PVSAT) co-conducted by Switzerland, Germany, and the Netherlands [18,19,20]. In PVSAT, the operation of grid-connected PV systems is monitored and remote failure detection is made based on a comparison between satellite and ground station meteorological data as the parameters for atmospheric simulation purposes and is based on another comparison between simulated and measured output performance. Needless to say, PVSAT is definitely a high-cost project because it involves satellite-based meteorological observation and is developed for commercial grid-connected, rather than stand-alone, PV power generation systems [21]. For this sake, each branch’s current and voltage are detected as a way for online fault detection using a microcontroller-based measurement technique [22]. All it takes is simply a voltage/current comparison among all the branches, and the fault zone is indicated on an LED display. Yet, a clear disadvantage is that a fault cannot be located accurately once the same fault is shared by all the branches, namely, the same voltage and current are seen over branches. As in [23], the output performance of a PV module array was simulated using Solar Pro software and was collected under various working conditions, i.e., solar radiation, module temperature, and malfunction. An extension neural network (ENN) based analysis was conducted on the collected data, and the analysis results were then transmitted to a human–machine interface for real-time display via a ZigBee wireless network module. Nevertheless, a major disadvantage is the aging problem resulting from a long-term operation of a PV module array, which leads to a deteriorated diagnostic accuracy. Besides, modifications must be made for all the characteristic parameters once a PV module array is reconfigured. An optimal configuration of photovoltaic module arrays based on adaptive switching controls was proposed in [24]. This study proposed a strategy for determining the optimal configuration of photovoltaic (PV) module arrays in shading or malfunction conditions. If shading or malfunctions of the photovoltaic module array occur, the module array immediately undergoes adaptive reconfiguration to increase the power output of the PV power generation system. However, this strategy only provides power generation performance improvement using simulation and does not propose a fault diagnosis method. A binary search-based fault detection system [25] was proposed for PV modules to ameliorate the deficiencies in the existing fault detectors for PV module arrays. To overcome multi-node voltage detection and reduce the number of integrated circuit components, an analog switch was used to perform detection channel switching. However, when the system gets larger, the time of fault diagnosis becomes longer, and the accuracy decreases. In recent years, some fault diagnosis technologies of photovoltaic module arrays were carried by using infrared and optical imaging equipment carried by unmanned aerial vehicles (UAVs) [26,27,28]. However, in order to improve the accuracy of diagnosis, high-priced and high-pixel lenses must be used so that the cost of maintenance cannot be reduced.
In short, all the fault diagnosis strategies, as presented in [11,12,13,14,15,16,17,18,19,20,21,22,23,24,25,26,27,28], lack a mechanism to locate malfunctioning modules with a 100% accuracy. Consequently, it takes time to identify the fault manually, particularly in a large PV module array, and hence slow down a maintenance task significantly. This highlights the significance of an online fault detection system.
In light of this, this work presents a novel PV module array configuration requiring a single MPP tracker and a typical number of switches. In case of any partial shadow or malfunction event, a particle swarm optimization (PSO)-based algorithm is enabled as a way to deliver the maximum amount of output power to load by means of switch manipulations. In the meantime, the malfunctioning PV module can be located instantly according to the PV module array configuration for a prompt module replacement.

2. Effect of Array Configuration on Output Performance

There are a great number of ongoing studies on PV module array configurations [29,30]. The most common configurations can be categorized into three types, namely, (i) series array, (ii) parallel array, and (iii) series-parallel (SP) array, each of which is depicted as follows. In the series configuration, all the PV modules are connected in series, resulting in a tremendous drop in the output current once there are shaded or malfunctioning modules. In the parallel configuration, all the PV modules are connected in parallel, but, in analogy with the series configuration, a major disadvantage is a plunge in the output voltage as the shadow or malfunction effect. As its name indicates, in the SP configuration, all the PV modules are connected in series and then in parallel, and it appears as an easy-to-implement and the most common configuration. However, the above three configurations will greatly reduce the output power of a PV module array due to module shading or failure [31,32]. In the bridge-linked (BL) configuration, all the PV modules are bridge linked, but a major problem is that the behaviors of neighboring modules are found susceptible to a shaded one, leading to a deterioration in the overall output performance [31]. Particularly, there is no way to integrate a global MPP tracker into this type of array configuration. In the honey-comb (HC) array configurations, all the PV modules are configured as a honeycomb [32]. It is developed as a way to reduce the shadow effect on the output power in some, but not in all cases, meaning that it is not a robust design. In the total cross-tied (TCT) configuration, all the PV modules are connected in parallel and then in series, as an improved version of the series and parallel configurations. Although the TCT configuration is rare in practical applications and will increase the cost of connection cables, this configuration can improve the problem of power reduction due to module shading or failure [31,32].
At identical module surface temperature and irradiation level, all the above-stated six array configurations share the same output performance only if there is no shadow or malfunction event in the configurations. Otherwise, the output power varies among the configurations, simply due to the fact that the output performance of the neighboring modules, and finally the entire array, are adversely affected by the shaded one. For this sake, an array in this work is automatically reconfigured in such a way that the maximum amount of output power is provided in case of a shadow or malfunction event.
As illustrated in Figure 1, switches, deployed between PV module array on neighboring branches, are manipulated as a way to reconfigure an array for MPP operation. At the lower part of each branch, a Hall-effect current sensor is employed as a requirement for online fault diagnosis purposes. The well-known particle swarm optimization (PSO) algorithm will be detailed in the following section, based on which an array configuration mechanism is developed.

3. Particle Swarm Optimization Algorithm

Proposed in 1995 by James Kennedy and Russell Eberhart, the particle swarm optimization (PSO) algorithm is characterized as having collective intelligence and is essentially a type of evolutionary algorithm [33,34,35,36]. As presented in [33,34,36], the velocity of each particle is updated according to the difference between the particle velocity and the optimal value pbest of a particle or between the particle velocity and the global optimal value of all particles gbest. The position, the search range, and direction of each particle are updated according to an updated velocity. The adopted PSO-based algorithm of this paper was provided in [37]. The velocity and position of a particle are updated as
v j k + 1 = w × v j k + C 1 × r a n d ( ) × ( p b e s t j k X j k ) + C 2 × r a n d ( ) × ( g b e s t X j k )
X j k + 1 = X j k + v j k + 1
where v j k + 1 and v j k respectively denote the velocities of particle j at time instants k + 1 and k, C1 and C2 are the learning factors, w is the inertia weight, p b e s t j k is the optimal value of particle j at time instant k, gbest is the global optimal value, X j k + 1 and X j k indicate the switch positions of particle j at time instants k + 1 and k, and rand () is a rand real number between 0 and 1.

4. Online Fault Diagnosis System

4.1. System Framework

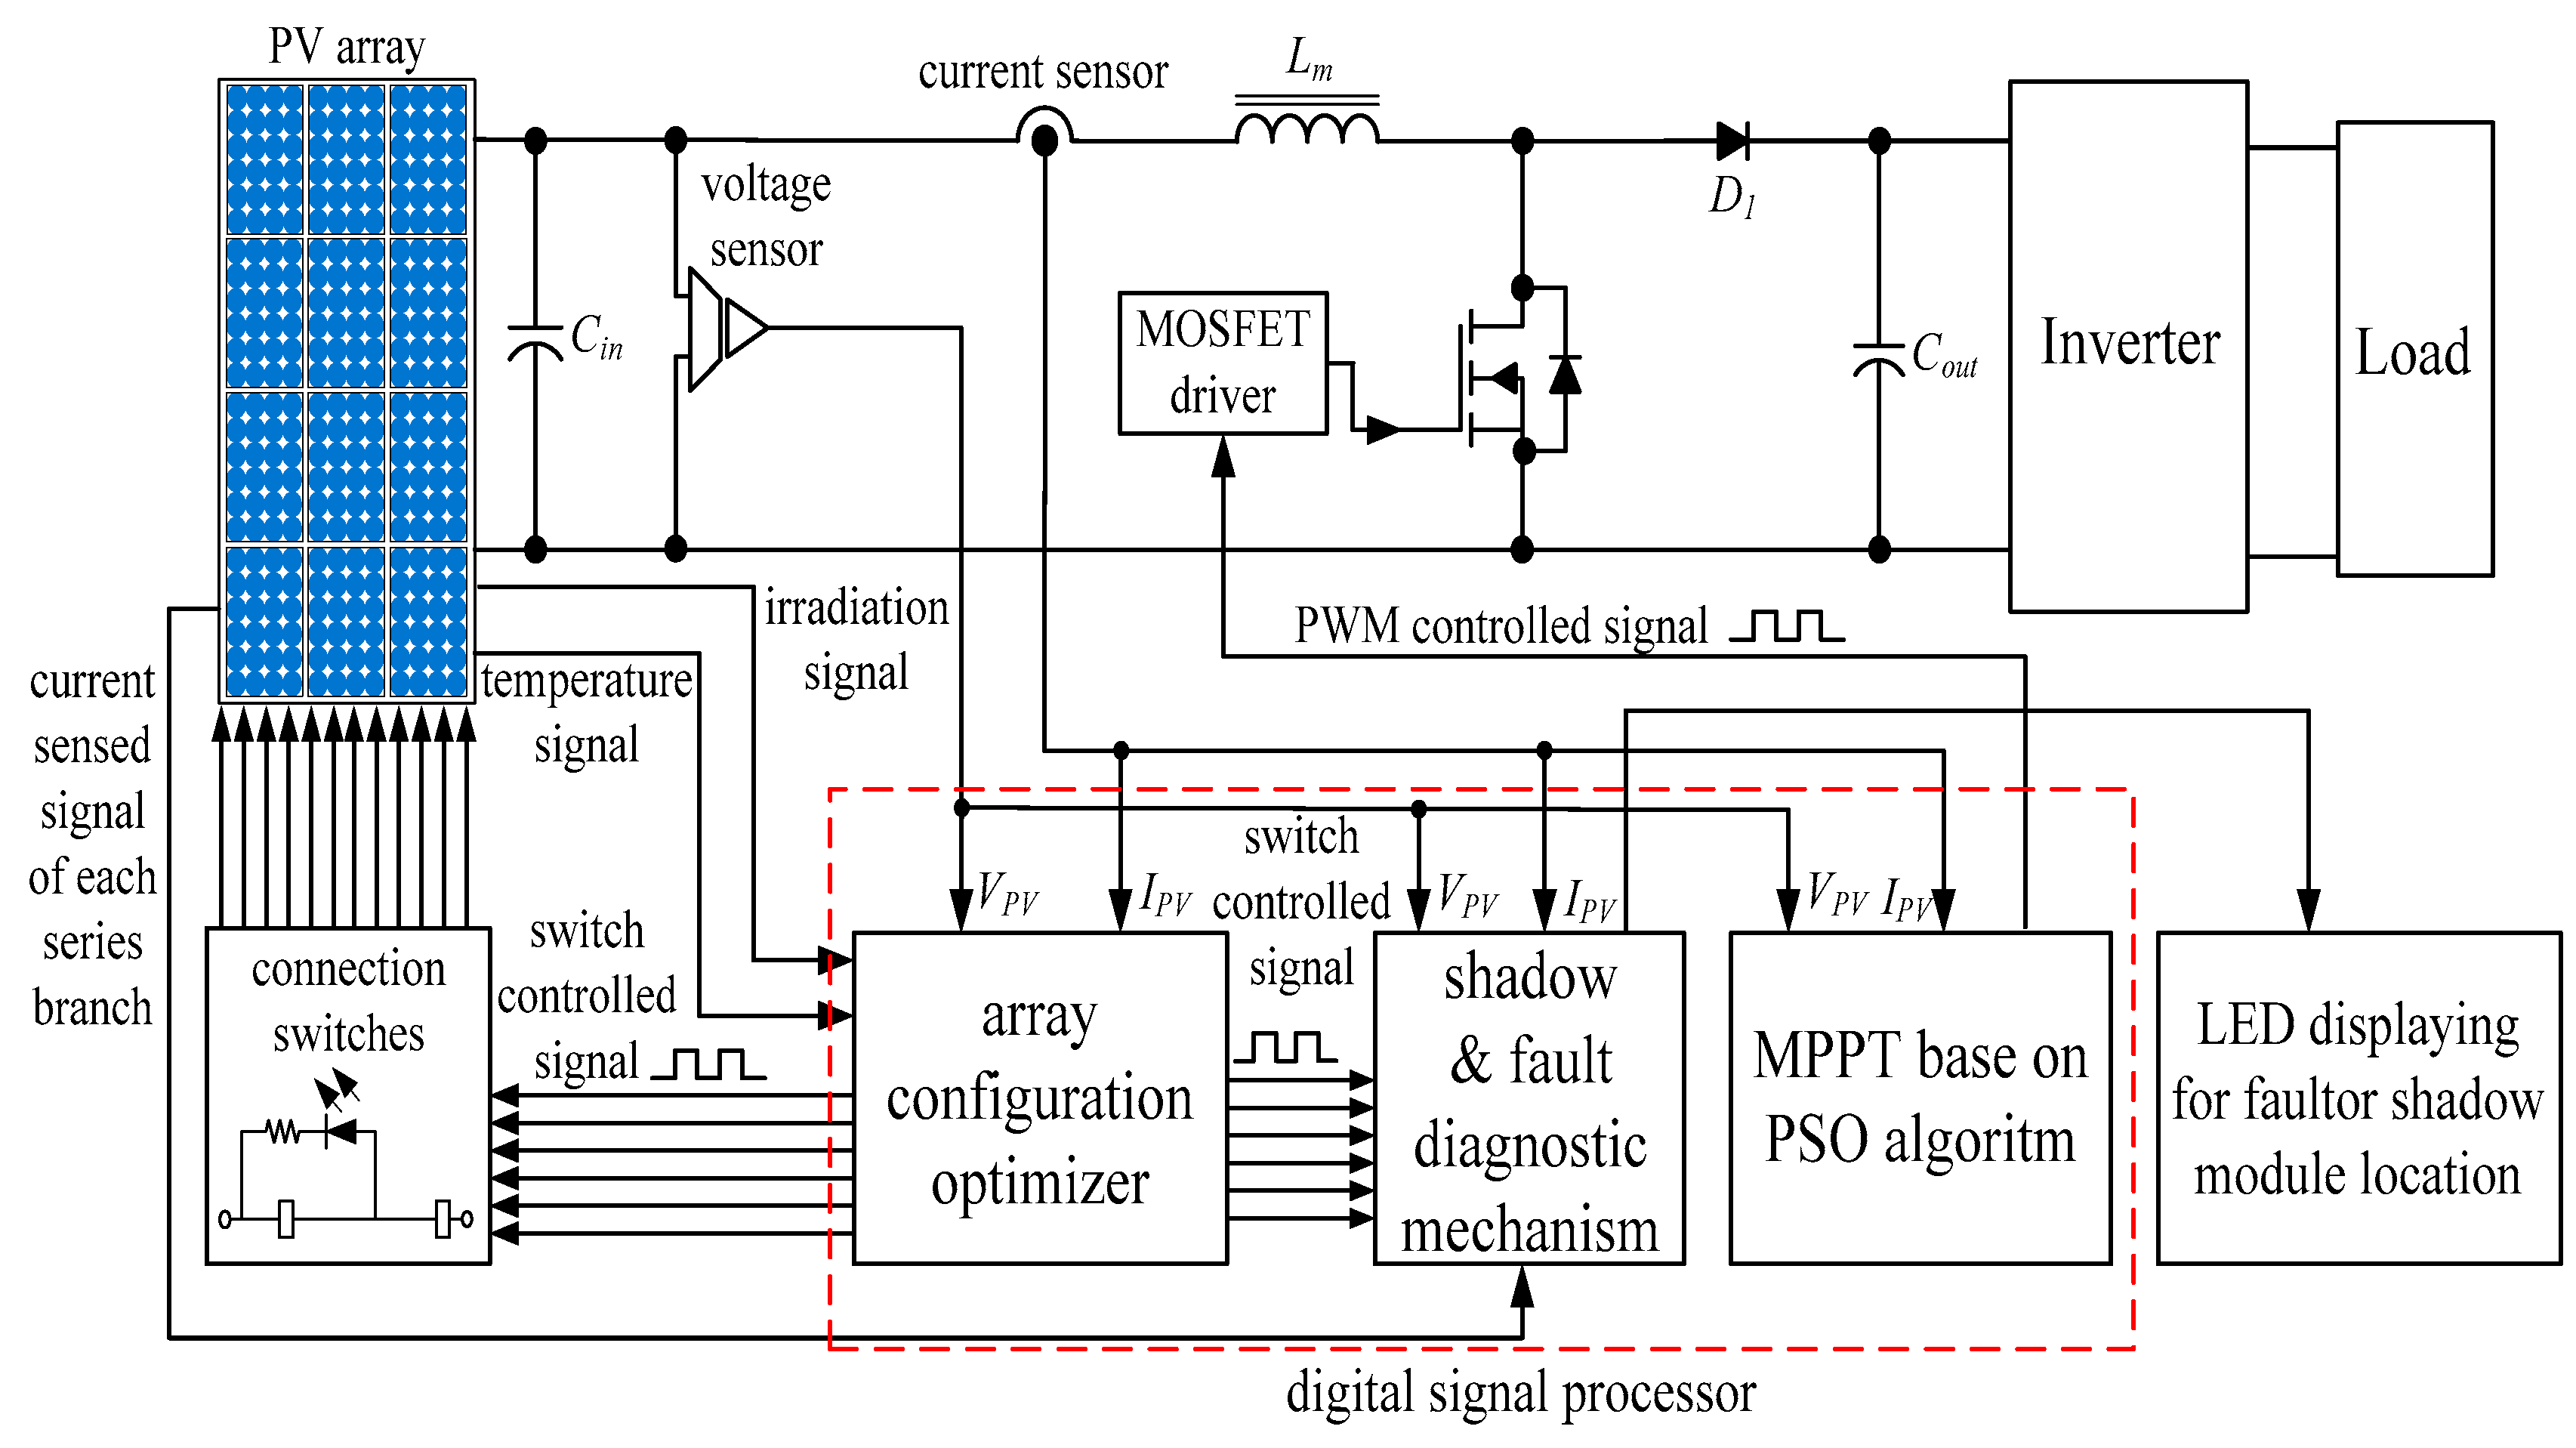
As illustrated in Figure 2, the presented online diagnostic system for a PV module array mainly involves (i) a boost converter, (ii) an MPP tracker, (iii) an array configuration optimizer, (iv) a unit to detect module shielding and malfunction, and (v) an LED array for shaded or malfunctioning module display. A PV module array is designed to operate at the MPP all the time via skillful manipulation of the MPP tracker-controlled boost converter. In case of any module shadow or malfunction, the array configuration optimizer is enabled as a way to reconfigure the PV module array and detect the output voltage and current thereof to achieve the aim of MPP operation under arbitrary working conditions. A complete set of switch statuses together with the above-stated measured output quantities are then delivered to the malfunction diagnostic block for the real-time location and the LED array for displaying the shaded or malfunctioning modules.

4.2. MPPT under Shaded Conditions

As pointed out in [38], the simple and easy-to-implement perturbation and observation (P&O) method stands as the most popular maximum power point tracking approach for a PV module array. Yet, multiple peaks exist along the PV characteristic curve in the event of shaded or malfunctioning PV modules, meaning that the output power is likely to be trapped at a local, rather than the desired global, MPP. For this sake, a PSO-based global MPP tracker is employed herein to handle the multiple peak problem, hence leading to an improved power generation efficiency. A PSO-based MPP tracking algorithm, as presented in [39], is adopted in this study.

4.3. Integration between MPPT and Array Configuration Optimization

The power generation efficiency is maximized herein as a consequence of a joint operation between a global MPP tracker and the presented configuration optimization mechanism. Once a branch current in Figure 1 is detected by a Hall-effect current sensor as far below the others, it is identified as a module shading or malfunctioning event, and the presented configuration optimization mechanism is enabled right away to manipulate the switches between modules. The algorithm is the same as stated in [37,39] except that the switch control signal is set to the position of a particle, and the output power of a PV module array is defined as the objective function.

4.4. Online Fault Detection Mechanism

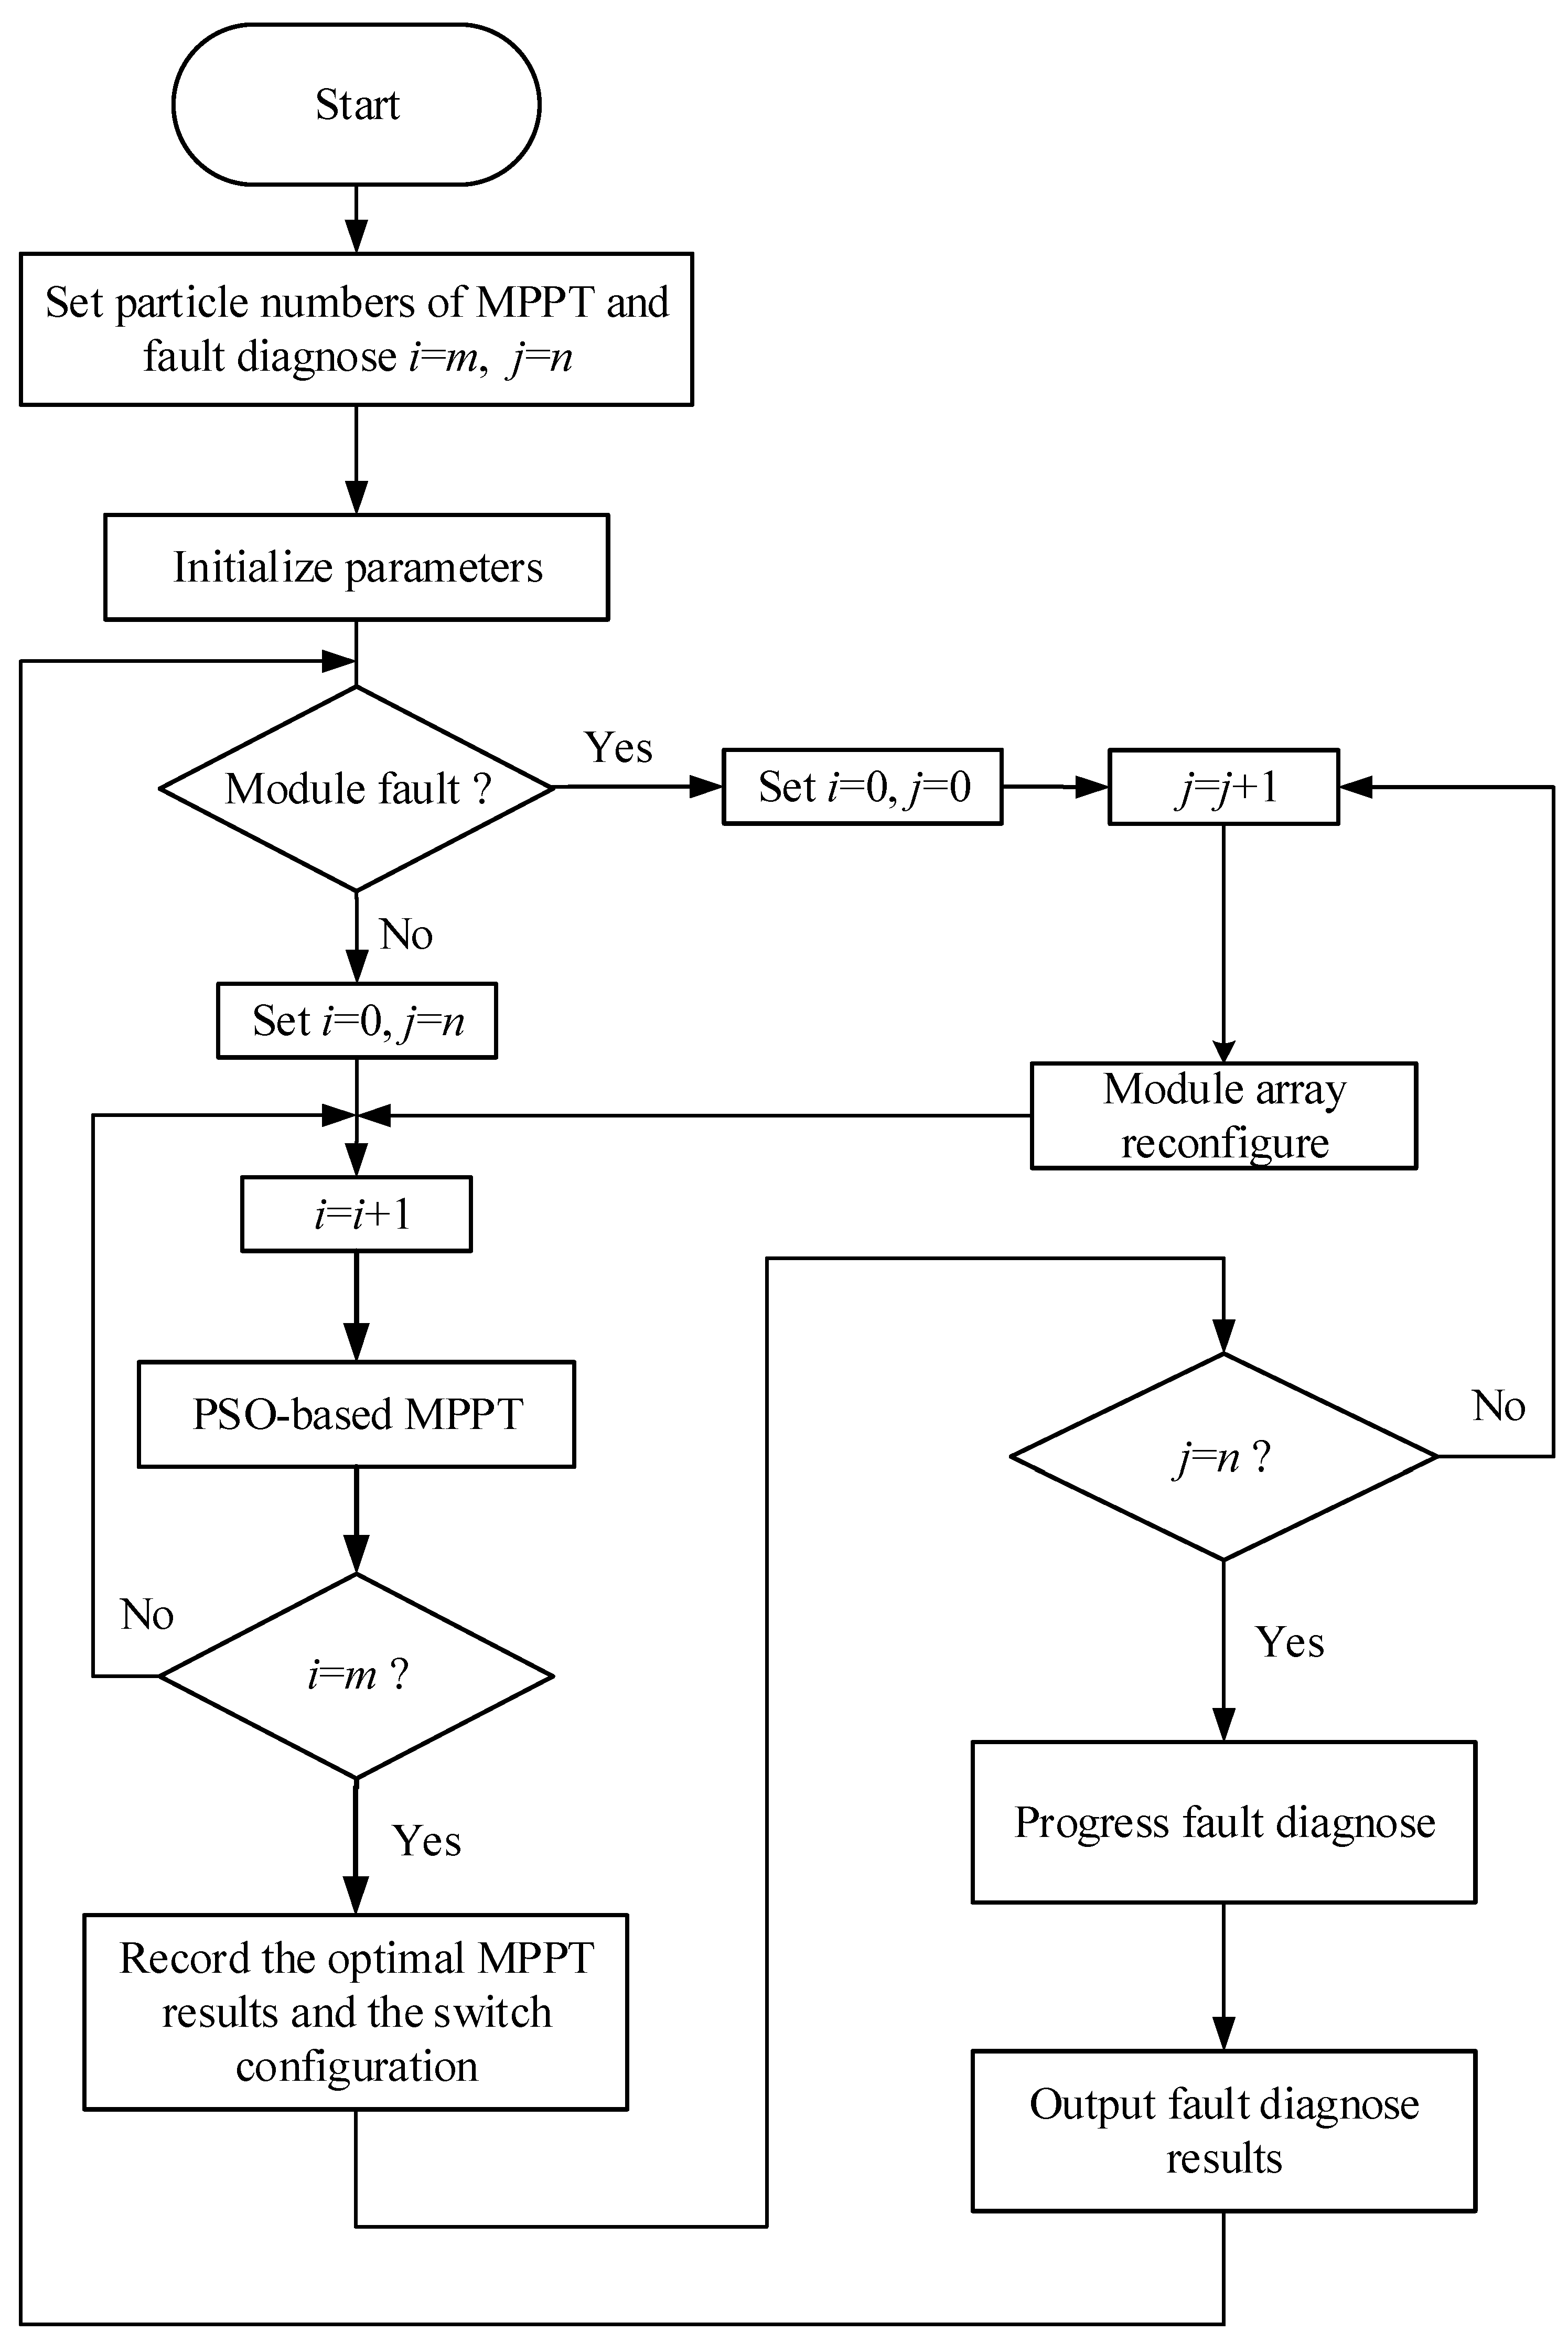
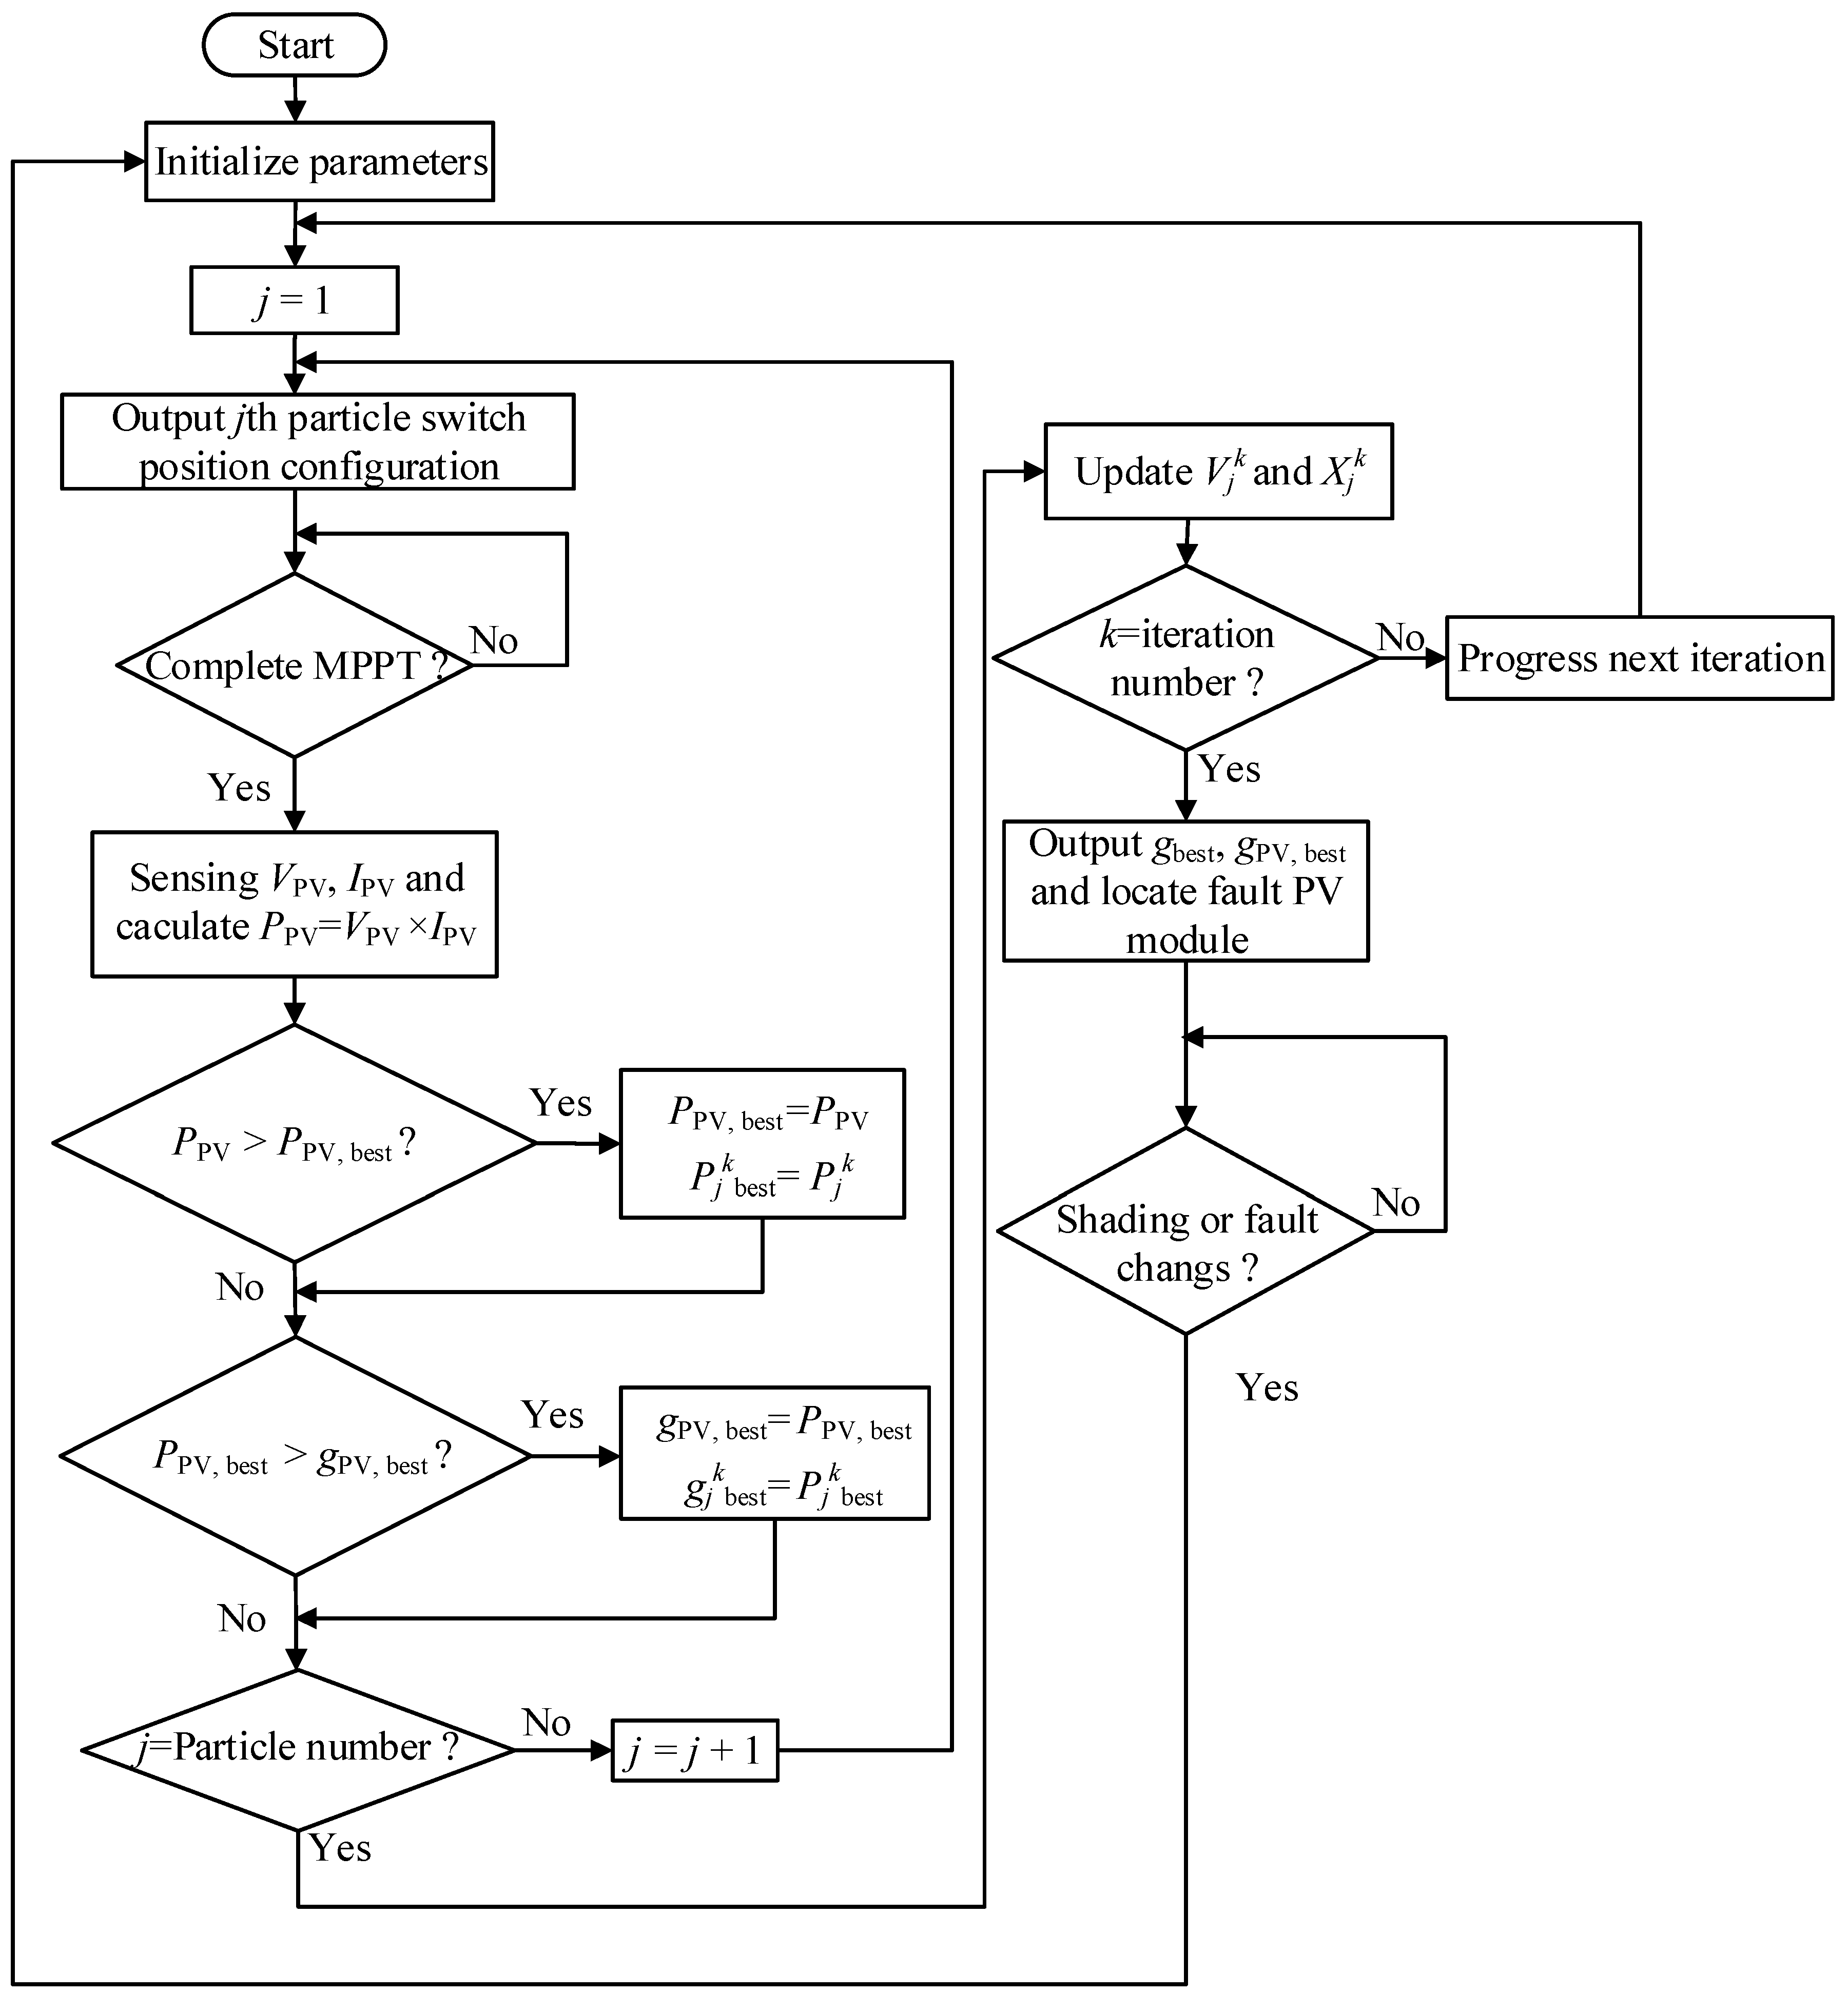
In an attempt to reduce a business loss due to PV module shading or malfunction, a way must be found to efficiently locate the non-well operated PV modules online. For this sake, an online diagnostic mechanism is integrated with the presented configuration optimization strategy. Once a branch current is detected by a Hall-effect current sensor as far below the others, it is identified as a non-well-operated event, and the configuration optimization and then the diagnostic mechanisms are enabled. Illustrated in Figure 2 as a system, a high-level step sequence block diagram of configuration optimization and flowchart of the algorithm are shown in Figure 3 and Figure 4, and the presented diagnostic mechanism is stated as follows:
step 1:
Initialize all the PSO parameters, including the controlled signal (i.e., the configuration of switch position) of all the switches (here using relays as switches) pbest and gbest. The controlled signal of all the switches are set as the positions of particles, and the output power of a PV module array is defined as the objective function, that is, P pv ( X j k ) = V pv × I pv .
step 2:
The configuration of switch positions of particles is employed as the switch control signals in the progress of an MPP tracking event.
step 3:
The output power of the PV module array is evaluated as the output voltage times the output current at the end of a tracking event.
step 4:
Compare the current output power with PPV,best. In case the current output power is superior to PPV,best, then PPV,best is updated. At the same time, the optimal configuration of switch position Pbest is also update. Then, further compare PPV,best with gPV,best. If PPV,best is superior to gPV,best, then gPV,best is replaced with PPV,best. Meanwhile, the global optimal configuration of switch position gbest is also updated.
step 5:
The positions and velocities of all the particles are updated according to Equations (1) and (2). The X j k indicates the switch positions of particle j at kth iteration.
step 6:
Repeat steps 2 to 5 until the maximum number of iterations is reached.
step 7:
The malfunction diagnostic block takes the switch control signals (configuration of switch positions) and the measured output power as inputs and locates and displays the non-well-operated PV modules on an LED array.
step 8:
In case of any change in the state of a malfunction event, go back to step 1 for a new run. Otherwise, remain idle.
In the algorithm of fault diagnosis, a particle represents the configuration of switch position in the Boolean variable. In Figure 1, the configuration of switch positions of S2, S3, S6, S7, S10, and S11 is presented in Binary form 000000 ~ 111111. Therefore, there are 64 different switch position configurations. Here, 0 indicates that the switch is at the “OFF” state, and 1 indicates that the switch is at the “ON” state. Four particles are adopted in the algorithm of fault diagnosis in this paper each of which represents 16 switching states. For example, the first particle represents one of the position configurations 000000 ~ 001111, while the second particle represents another one of the position configurations 010000 ~ 011111, etc. However, in order to facilitate the iteration of a continuous variable in the iterative formula, the binary switch states are converted to a decimal value.
As for the particles adopted in the maximum power tracking controller, they represent the output voltages of the PV module array or are equivalent to the duty cycles of the boost converter. This is also equivalent to the output voltage of the photovoltaic module array. Because the output voltage of the photovoltaic module can be controlled by changing the duty cycle of the boost converter, taking the duty cycle of each iteration to control the boost converter will control the photovoltaic module array to operate at different voltages and get different output power until the maximum power point is tracked or the number of iterations is reached.

5. Experimental Results

A succession of simulations and experiments are conducted on a 334 W 4 series-3 parallel array with SANYO (Moriguchi, Osaka, Japan) HIP2717 PV modules [40] as the building blocks. The setting of weight value and learning factors in PSO will affect the success rate and efficiency of maximum power point tracking. If the weight value is set too small, the moving speed of the particle will be slow, resulting in a multi-peak problem and failing to precisely skip the local best solution; on the contrary, when the weight value setting is too large, the particle step is too large when moving, resulting in failure to precisely search the target function. Thus, the selection of a weight value usually depends on the target function. In addition, if the learning factor setting is too large, the iteration time spent increases, resulting in reduced overall tracking efficiency. Therefore, in consideration of the benefits, C1 and C2 values set must not be too large. Based on this, according to the suggestion in [39], we select the PSO parameter values shown in Table 1. The same array configuration as in Figure 1 is used to illustrate the presented online malfunction diagnostic mechanism.
A shaded PV module is known to provide less amount of output current than in a normal case. Hence, as a way to precisely locate a shaded module on a row basis, a Hall-effect current sensor is placed at the bottom of each branch, as illustrated in Figure 1. Each time before a configuration optimization is performed, each branch current is detected and then sent to the presented online diagnostic module so as to locate the malfunctioning module. The P–V characteristic curves of PV module arrays under different shading ratios were measured using an MP 170 I–V checker manufactured by EKO Instruments CO. Ltd. (Tokyo, Japan) [41].

5.1. Optimized Configurations for Different Shaded Cases

5.1.1. Case 1: A 30% Shaded PV Module in Row 1 (Module 1, 5, or 9)

As a consequence of the switch manipulations, five out of 63 configurations are found to deliver the same and the maximal amount of output power to the load, according to the mechanism stated in Section 4. Taking the case of a 30% shadow in module 1 as an instance, all the possible optimized configurations are presented in a tabular form in Table 2 for comparison purposes. The same observation applies to the cases with a single partially shaded module on the same row, but different column. As highlighted in blue in Table 2, what all the optimized array configurations have in common is that both S1 and S6 are switched on. A single P–V characteristic curve, as illustrated in Figure 5, is shared by all the optimized configuration cases. A point worthy of mention is that the peak power plunges from 334 W in an unshaded case to 262.3 W in this case.

5.1.2. Case 2: A 30% shaded PV Module in Row 2 (Module 2, 6, or 10)

The same test as in Case 1 is repeated on the case of a single 30% shaded module on the second row. The optimized array configurations are presented in Table 2 but not illustrated for brevity. The position of each switch in Table 2 is indicated in Figure 1. The highlighted portions in orange indicate that the output power is optimized on a condition that switches S1, S2, S6, and S7 are switched on. The same P–V characteristic curve as in Figure 5 is seen again in Figure 6 for this case. The peak power plunges from 334 W in an unshaded case to 263.4 W in this case.
Note that 1 and 0 represent the ON and OFF states of a switch, respectively, and the switches with an always ON state in each case are highlighted. The position of each switch is indicated in Figure 1.

5.1.3. Case 3: A 30% Shaded PV Module in Row 3 (Module 3, 7, or 11)

The same test as in Cases 1 and 2 is repeated on the case of a single 30% shaded module on the third row. The optimized array configurations are presented in Table 2, but not illustrated for brevity. The highlighted portions in gree indicate that the output power is optimized on a condition that switches S2, S3, S7, and S8 are switched on. The same P–V characteristic curve as in Figure 5 is seen again in Figure 7 for this case. The peak power plunges from 334 W in an unshaded case to 266.4 W in this case.

5.1.4. Case 4: A 30% Shaded PV Module in Row 4 (Module 4, 8, or 12)

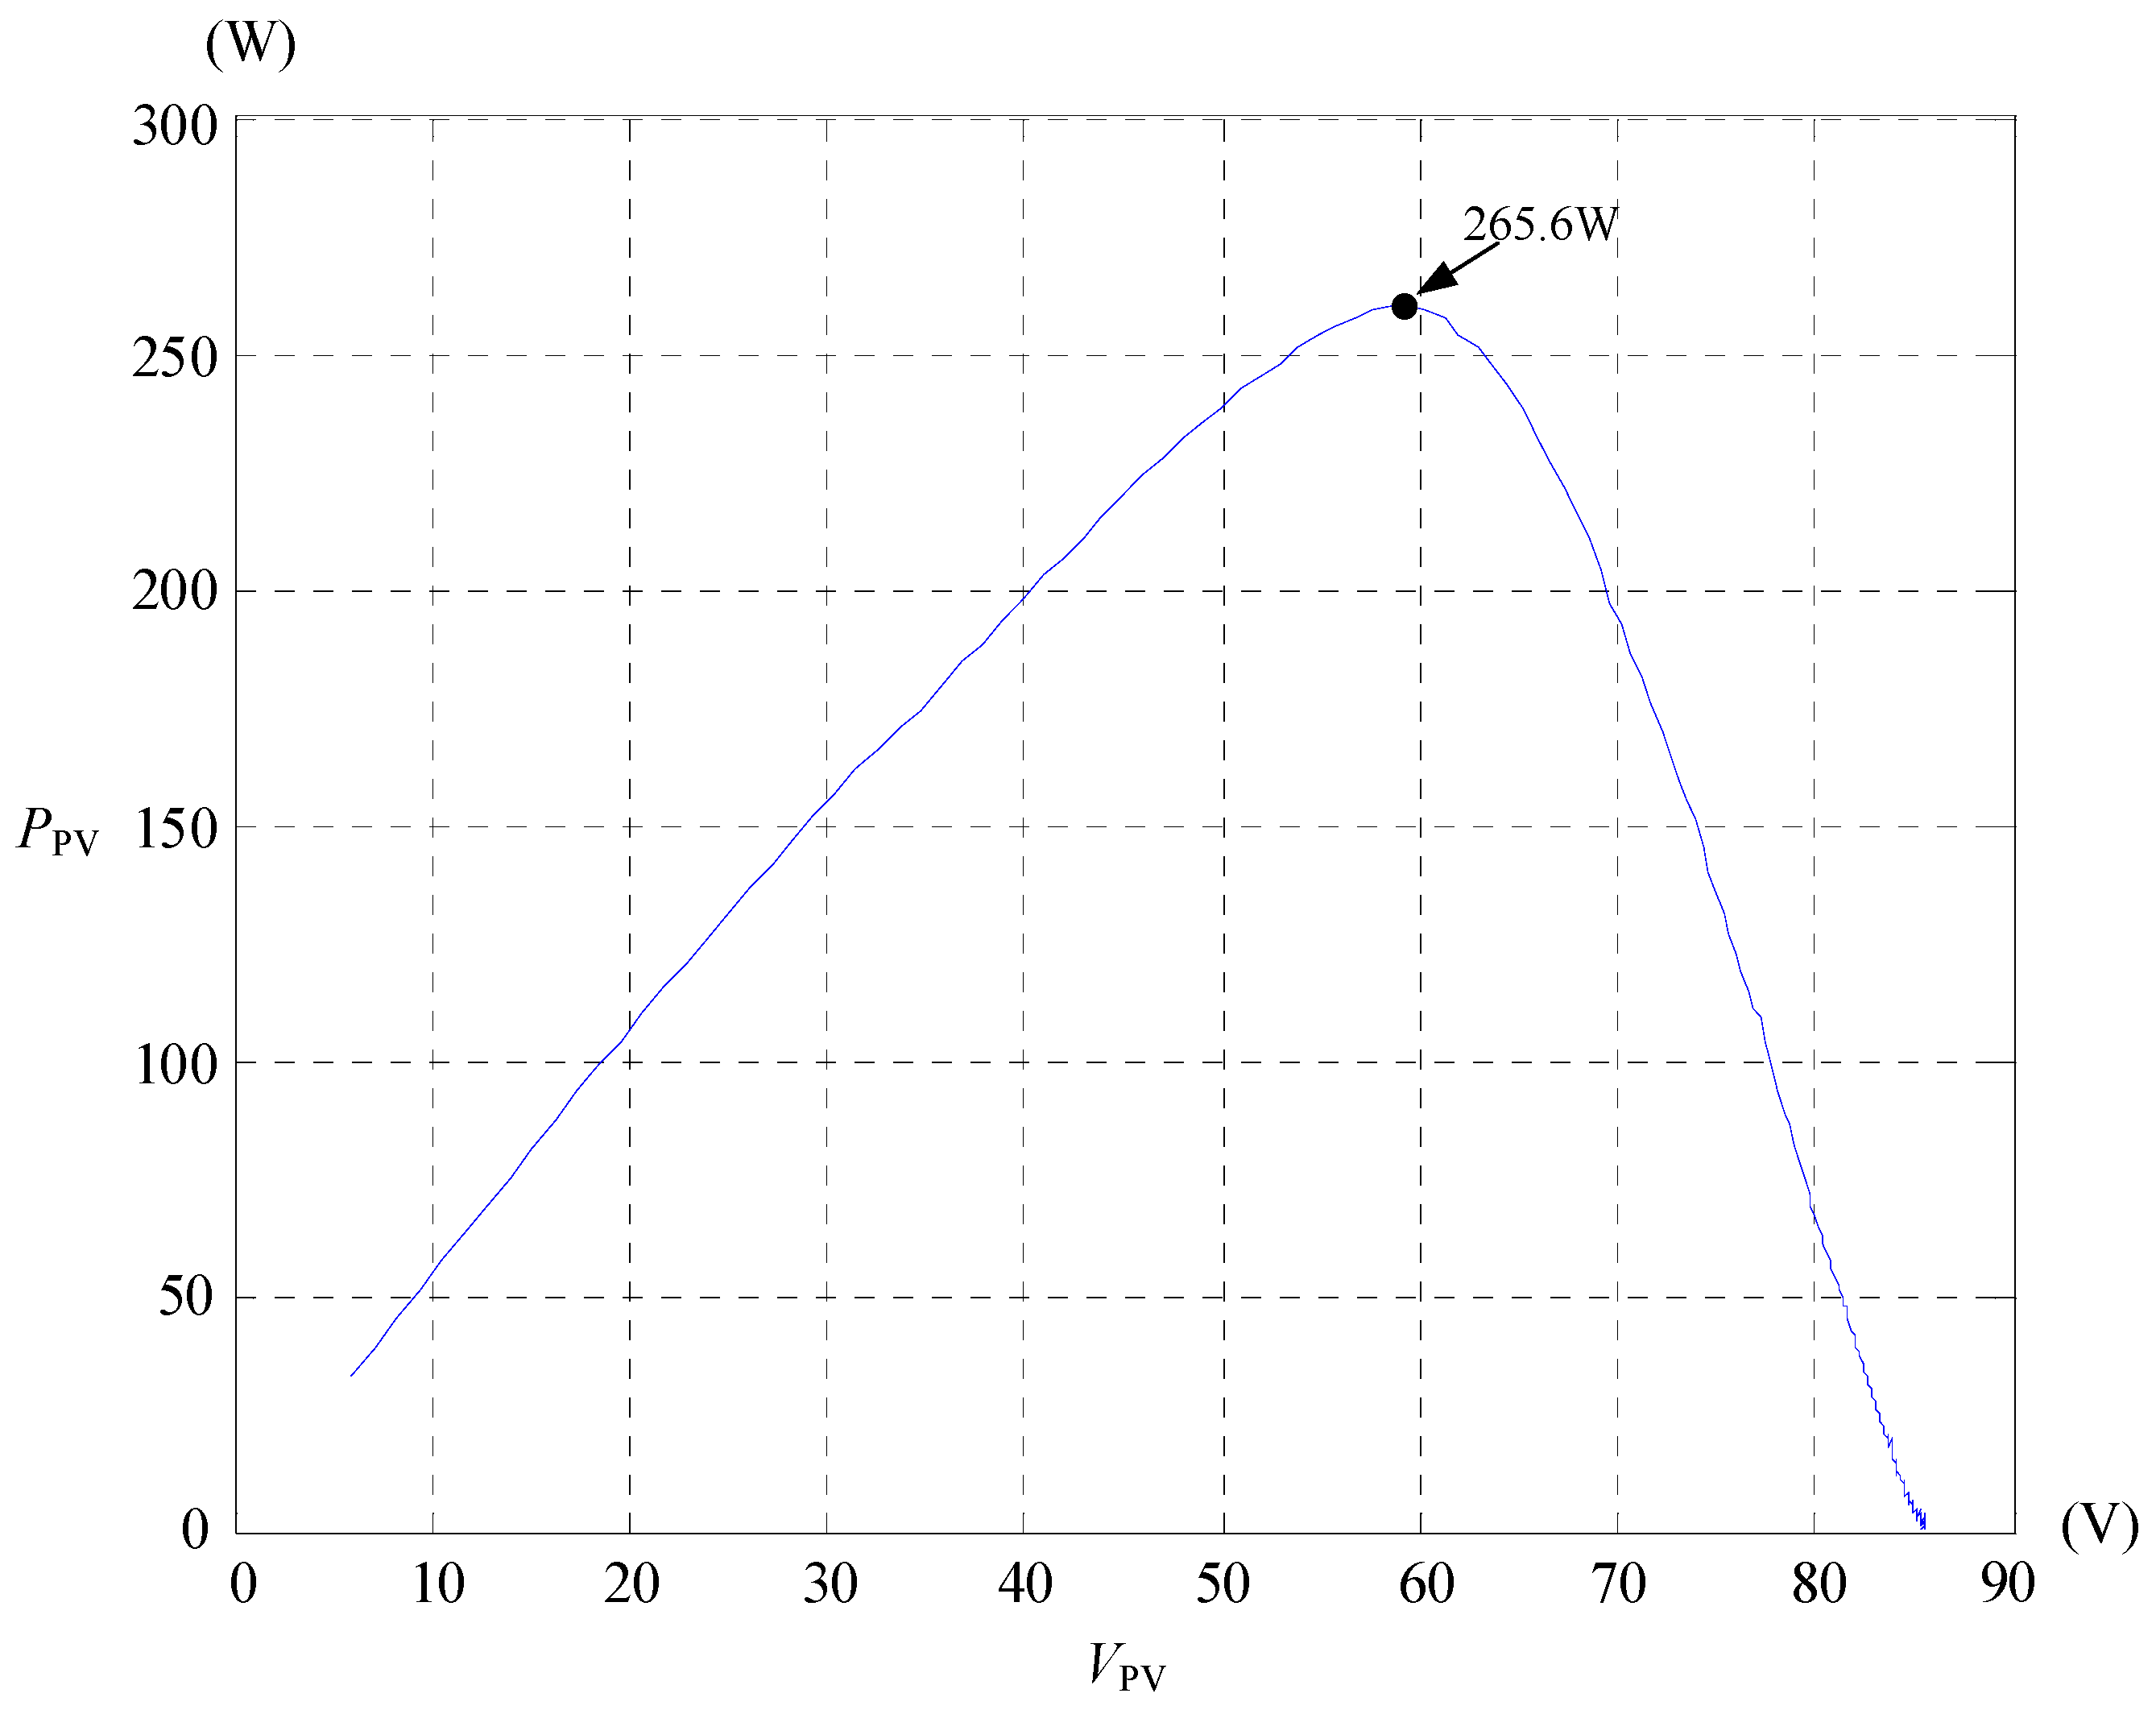
The same test as in Cases 1–3 is repeated on the case of a single 30% shaded module on the fourth row. The optimized array configurations are presented in Table 2, but not illustrated for brevity. The highlighted portions in purple indicate that the output power is optimized on a condition that switches S3 and S8 are switched on. The same P–V characteristic curve as in Figure 5 is seen again in Figure 8 for this case. The peak power plunges from 334 W in an unshaded case to 265.6 W in this case.
Hence, it is concluded that a malfunctioning PV module can be located by means of the switch statuses in an optimized array configuration. As can be found in Table 2, all the possible optimized configurations for each case are able to be characterized as a set of switch conditions, say (S1 = S6 = 1) and (S1 = S2 = S6 = S7 = 1) for Cases 1 and 2, respectively. Thus, this close observation gives a diagnostic criterion for PV module malfunction, formulated as
n + 1 = m
where m represents the row on which a module malfunction event occurs and n denotes the smallest index among the ON switches. Nevertheless, an additional condition must be tested whether S2 and S7 are switched on when n = 1 for distinguishing a malfunction in row 1 from a malfunction in row 2.
The malfunctioning PV module can be accurately located via the combined use of Equation (3) and each branch current, which is detected by a Hall-effect current sensor, in a pre-optimized array configuration. The malfunction diagnostic mechanism is illustrated as follows. For instance, exhibited in Figure 9 and Figure 10 are the pre- and post-optimized configurations of a 4 series-3 parallel array with a 30% shadow in module 3 (in Case 3), respectively. As can be seen in Figure 10, S2, S3, S7, and S8 are switched on, meaning that S2 is the leading switch in ascending order and n = 2 accordingly. A substitution of n = 2 into Equation (3) gives m = 3, meaning that there is a single abnormal event on row 3, namely, module 3, 7, or 11. If the current in branch 1 is detected as far below the others in the pre-optimized configuration, then the module on column 1 and row 3 (module 3), is recognized as malfunctioning and is displayed on an LED array. It must be noted that this diagnostic mechanism can be directly applied to an arbitrary m series-n parallel array configuration and is not limited to this case.

5.2. On-Line Tests of Duo Purpose Mechanism

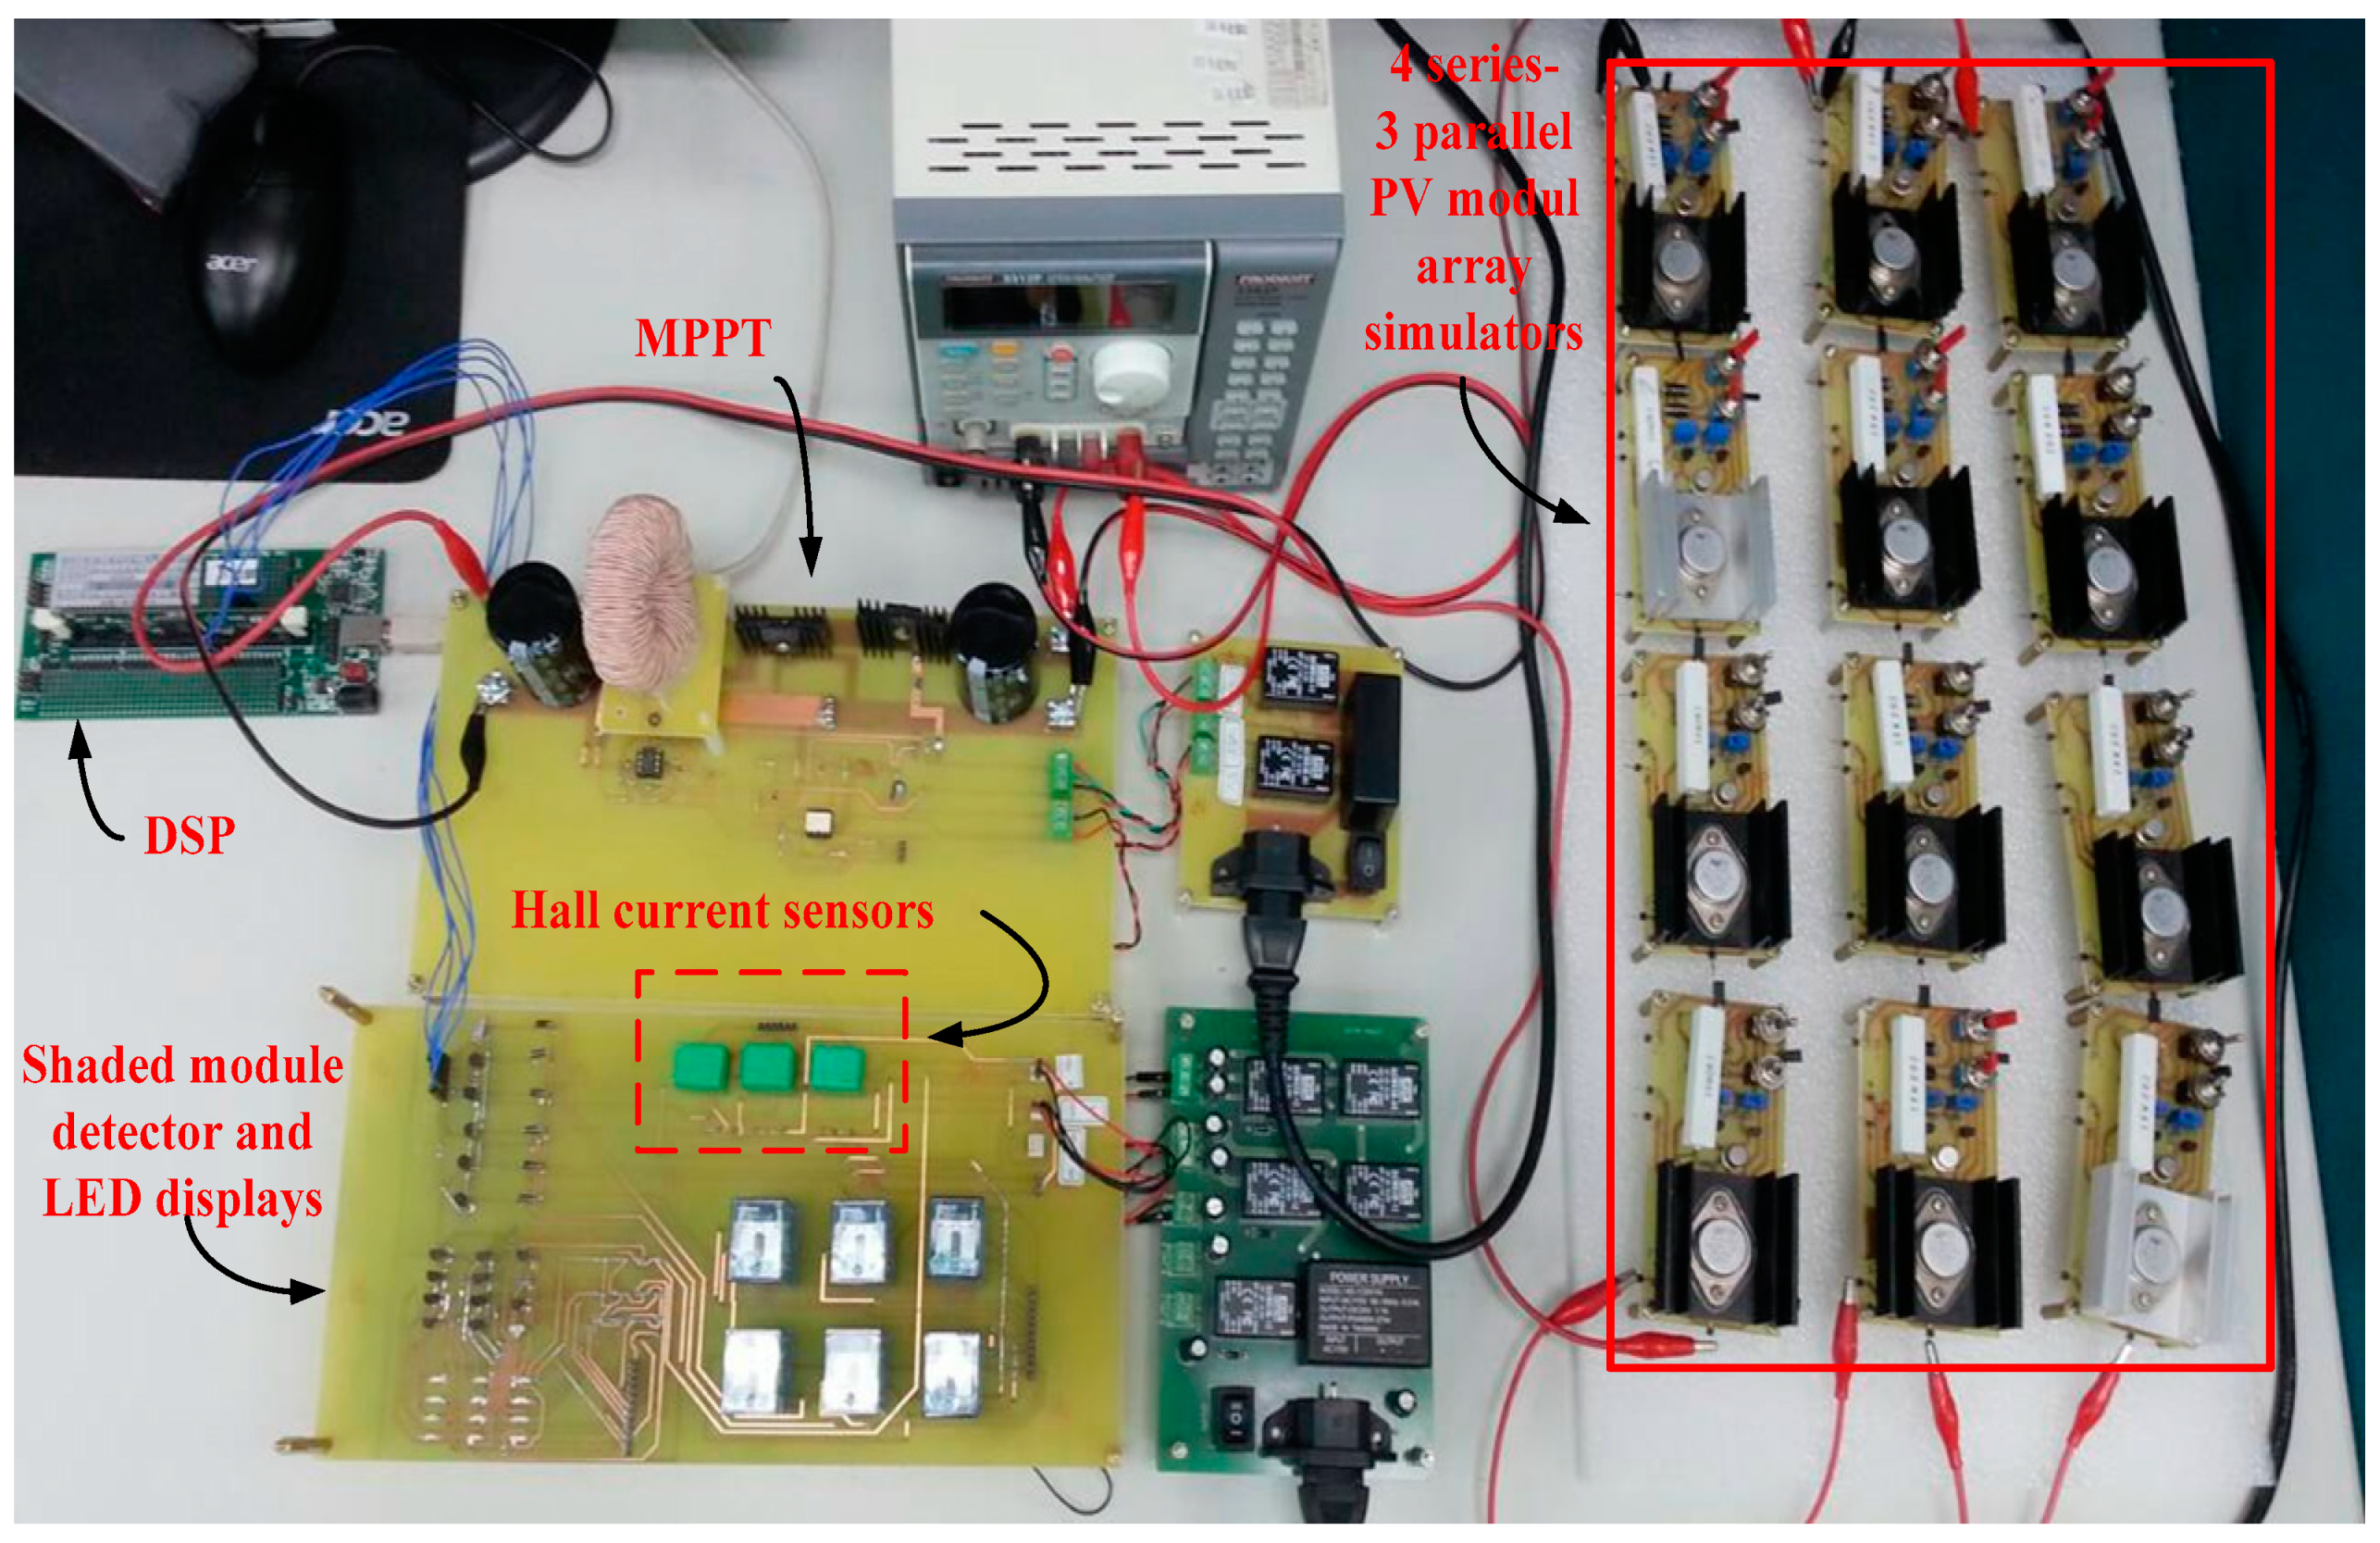
As discussed in Section 5.1, the presented online malfunction diagnostic mechanism that was developed for a PV power generation system had been well analyzed by measurement results. This subsection is devoted to the implementation of the online diagnostic mechanism using a TMS320F2808 digital signal processor (DSP) and a PSO-based MPP tracker [37,39]. Presented in Figure 11 is a photo of the realized online PSO-based diagnostic apparatus. All the PV modules are built with a user-specified shadow, and field tests can be conducted on all the cases in the preceding subsection.

5.2.1. Case 1: Module 1 with a 30% Shadow

The branch current 1, 2, and 3 are detected as 1.16, 1.54, and 1.56 A, respectively, in the pre-optimized array configuration. Since branch current 1 is far below the other two, there must be a shaded module on column 1. An array configuration mechanism, as referred to in Section 4, is enabled, following which the optimized configuration is characterized as Case 1 in Table 2, that is, S1 and S6 both are switched on, and hence n = 1. A further condition is found that S2 and S7 are not switched on, and module 1 is diagnosed with the shadow.
Exhibited in Figure 12 is the measured output waveforms in the progress of an array configuration optimization. The post-optimized configuration is measured to provide a maximum output power of 261.9 W, in agreement with the peak value of the P–V characteristic curve in Figure 5.

5.2.2. Case 2: Module 6 with a 30% Shadow

The branch current 1, 2, and 3 are detected as 1.59, 1.14, and 1.56 A, respectively in the pre-optimized array configuration. Since branch current 2 is far below the other two, there must be a shaded module on column 2. The same array configuration mechanism as in Case 1 is enabled, following which the optimized configuration is characterized as Case 2 in Table 2, that is, S1, S2, S6, and S7 are switched on, and hence n = 1. According to Equation (3), m is found to be 2. In other words, the module on column 2 and row 2, i.e., module 6, is diagnosed with the shadow. Figure 13 exhibits the measured output waveforms in the progress of an array configuration optimization. The post-optimized configuration is measured to provide a maximum output power of 262.91 W, in agreement with the peak value of the P–V characteristic curve in Figure 6.

5.2.3. Case 3: Module 11 with a 30% Shadow

In Case 3, branch current 1, 2, and 3 are detected as 1.5, 1.49, and 1.15 A, respectively, in the pre-optimized array configuration. Since branch current 3 is far below the other two, there must be a shaded module on column 3. The same array configuration mechanism as in Case 1 is enabled, following which the optimized configuration is characterized as Case 3 in Table 2, that is, S2, S3, S7, and S8 are switched on, and hence, n = 2. A substitution of n = 2 into Equation (3) gives m = 3. In other words, the module on column 3 and row 3, i.e., module 11, is diagnosed with the shadow. Figure 7 and Figure 14 exhibit the P–V characteristic curve and the measured output waveforms in the progress of an array configuration optimization. The post-optimized configuration is measured to provide a maximum output power of 266.2 W, in agreement with the peak value of the P–V characteristic curve in Figure 6.

5.2.4. Case 4: Module 8 with a 30% Shadow

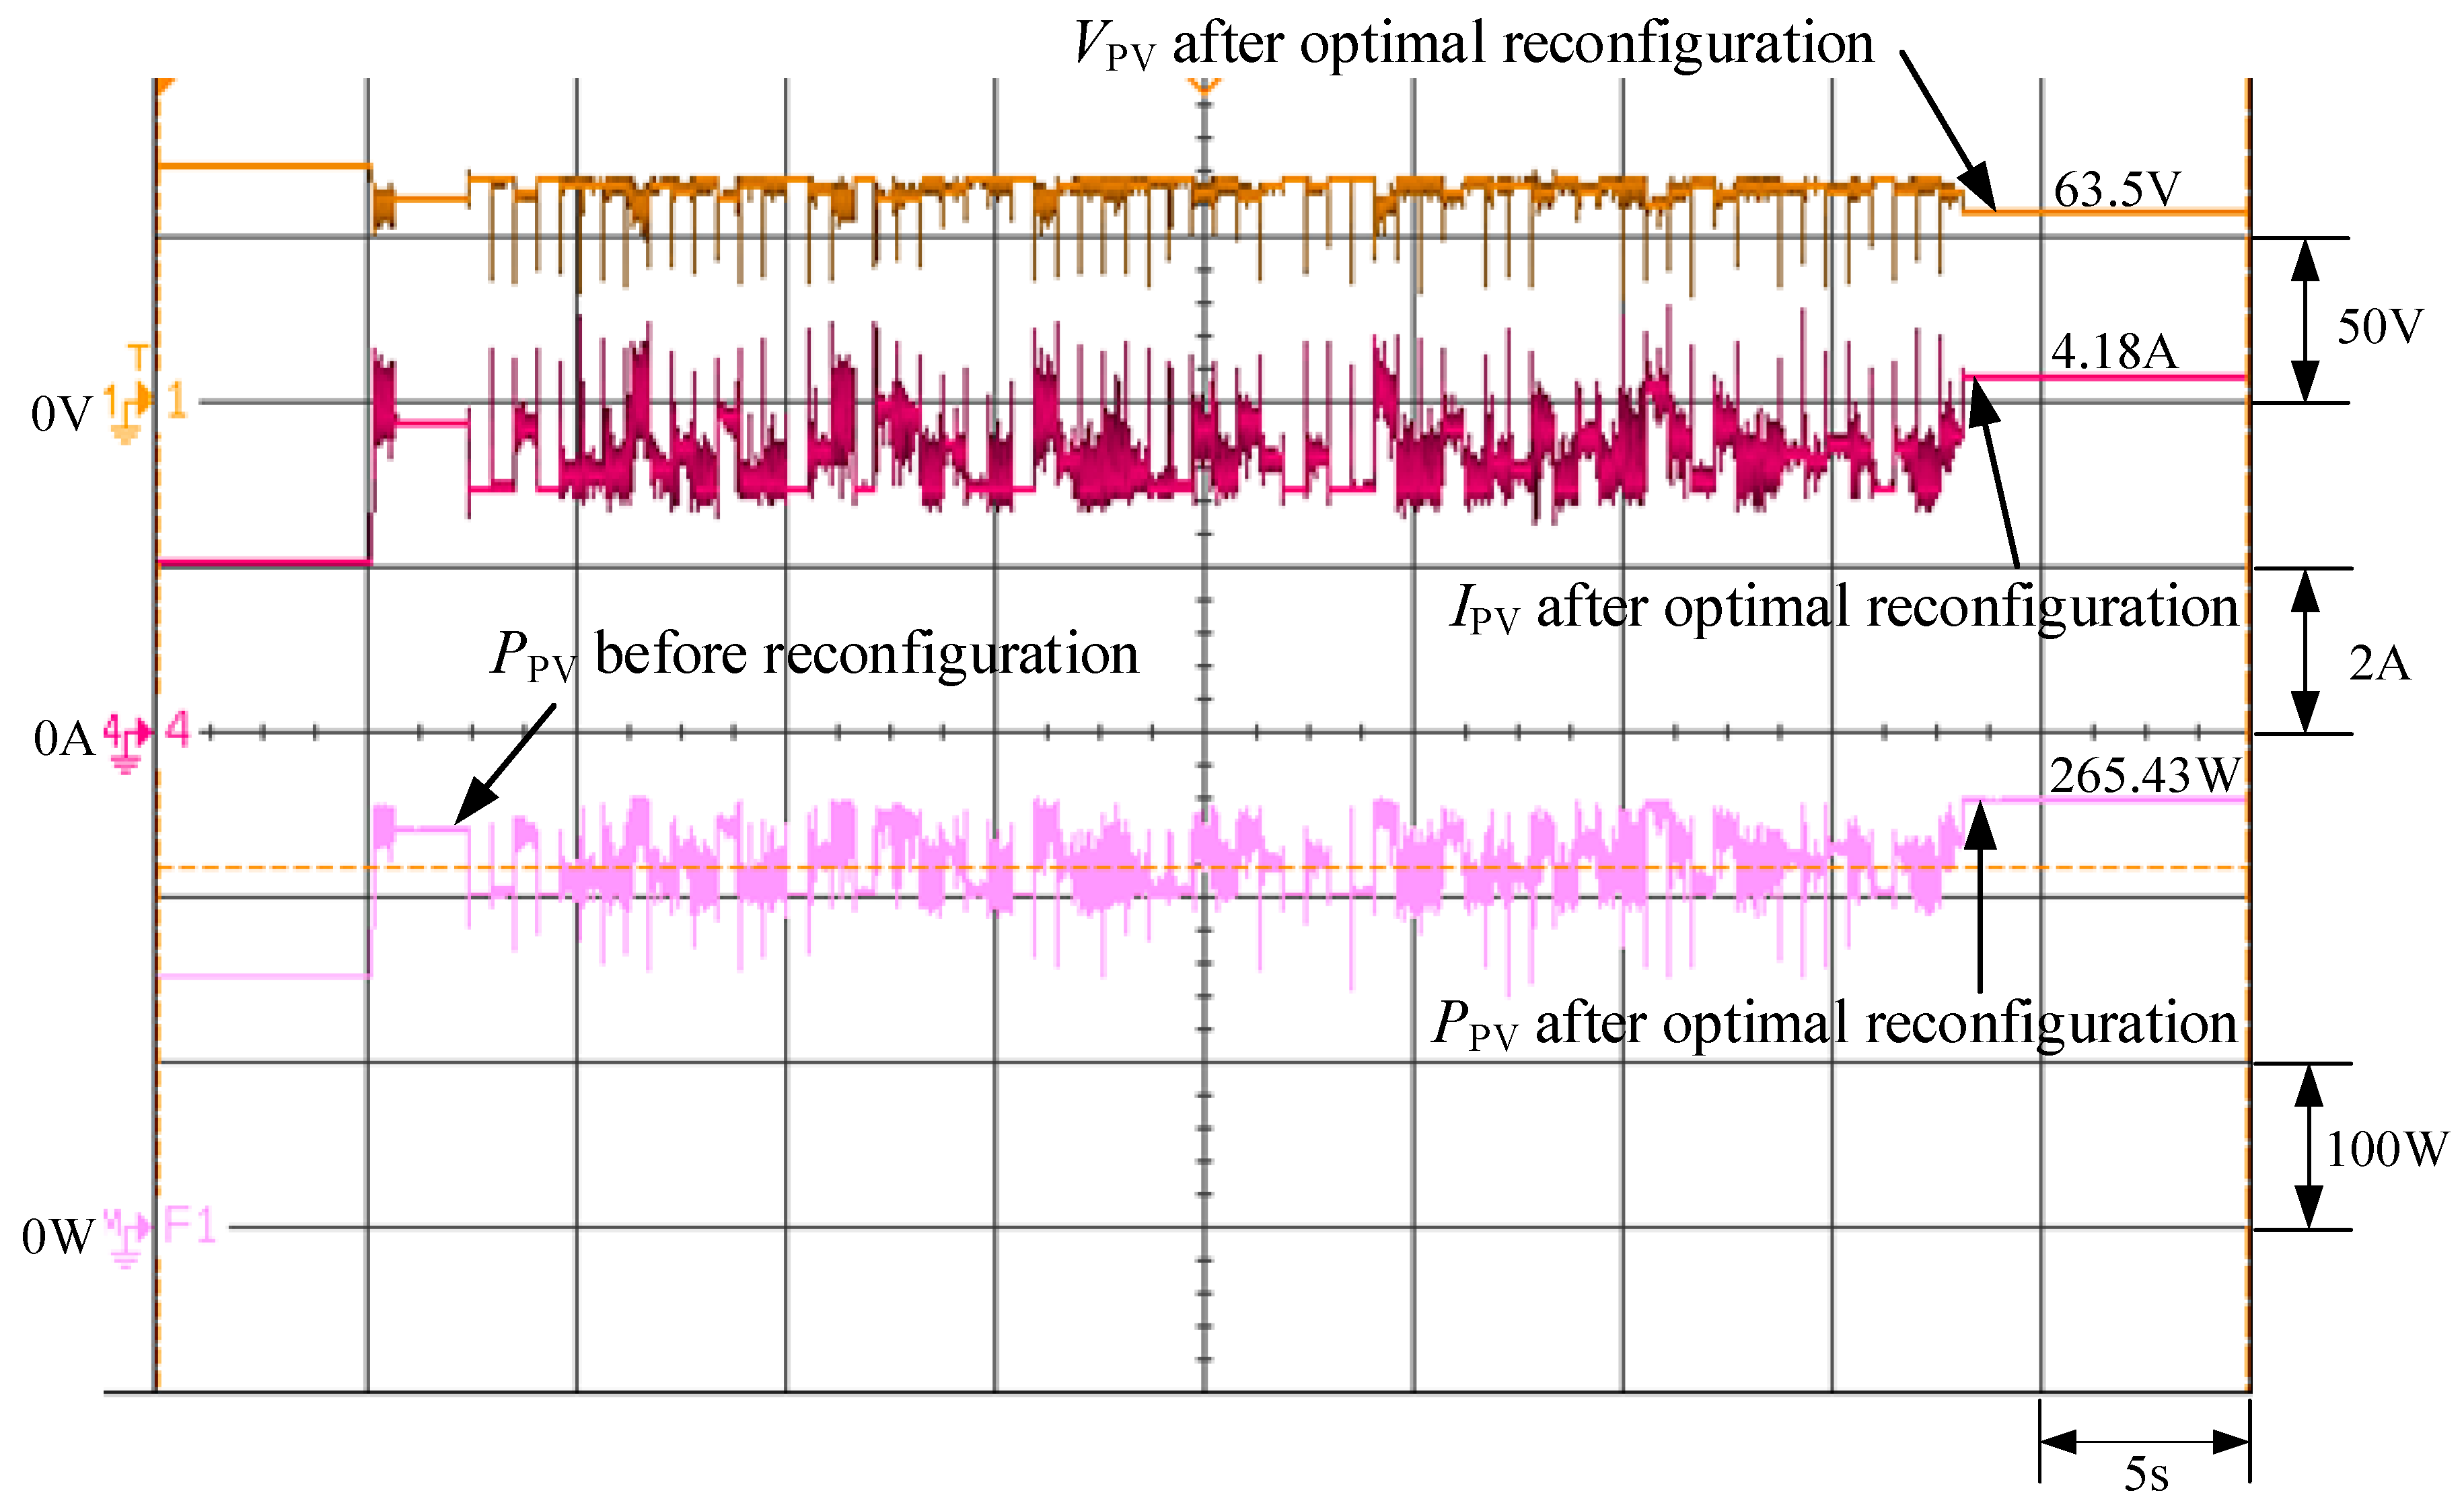
In Case 4, branch current 1, 2, and 3 are detected as 1.48, 1.15, and 1.54 A, respectively, in the pre-optimized array configuration. Since branch current 2 is far below the other two, there must be a shaded module on column 2. The same array configuration mechanism as in Case 1 is enabled, following which the optimized configuration is characterized as Case 4 in Table 2, that is, S3 and S8 are switched on, and hence n = 3. A substitution of n = 3 into Equation (3) gives m = 4. In other words, the module on column 2 and row 4, i.e., module 8, is diagnosed with shadow. Figure 8 and Figure 15 exhibit the P–V characteristic curve and the measured output waveforms in the progress of an array configuration optimization. The post-optimized configuration is measured to provide a maximum output power of 265.43 W, in agreement with the peak value of the P–V characteristic curve in Figure 8.

6. Conclusions

As a preliminary step in this work, the SANYO HIP217 PV module is used to build a 4 series-3 parallel array for testing. By sensing current in each series of photovoltaic module array, we can judge whether there is a fault in a photovoltaic module array. Once a module failure occurs, it starts the switch reconfiguration scheme based on the PSO algorithm to control each switch at the “ON” or “OFF” state. When the switch position configuration of each particle is changed, a PSO-based global MPP tracker is enabled each time till the MPP is tracked or the number of iterations is reached. Then, which switch configuration can obtain the maximum output power among all of the particles is recorded. In this manner, the malfunctioning module can be identified and indicated on an LED array instantly as a way to speed up the replacement process for a PV module and as a means to reduce a business loss accordingly. In the end, the PSO-based online diagnostic mechanism is implemented using a TMS320F2808 digital signal processor and is experimentally validated as successful to locate a malfunctioning PV module out of four malfunction cases. In case of a malfunction occurring to a module, an optimized PV module array operating together with an MPP tracker turns out to provide a 4–6% improvement in the output power relative to an unoptimized counterpart. More importantly, the online diagnostic mechanism is presented as a way to efficiently recognize and then replace a malfunctioning PV module for maintenance staff, such that the maximum output power operation can be resumed as soon as possible in practical operations.
Indeed, it is possible for two or more modules to fail at the same time. Nevertheless, so far there is no way to automatically detect the faults of two or more modules simultaneous in the world unless an unmanned aerial vehicle (UAV) or manpower is used to detect them on site. However, it will increase the cost of detection. Because the current flow direction is very complex when two or more modules break down simultaneously, it will be impossible to find a regular way to determine the location of the module fault in a short period of time. In the next stage of research, the authors will focus on fault detection on two or more modules.

Author Contributions

The conceptualization was proposed by K.-H.C., who also was responsible for writing—review and editing this paper. K.-H.C. completed the formal analysis of the particle swarm optimization algorithm. P.-L.L. carried out the data curation, software program, and experiment validation. K.-H.C. was in charge of project administration. All authors have read and agreed to the published version of the manuscript.

Funding

This research was funded by the Ministry of Science and Technology, Taiwan, under the Grant Number MOST 108-2622-E-167-018–CC3.

Institutional Review Board Statement

Not applicale.

Informed Consent Statement

Not applicable.

Acknowledgments

The authors gratefully acknowledge the support of the Ministry of Science and Technology, Taiwan, under the Grant Number MOST 108-2622-E-167-018–CC3.

Conflicts of Interest

The authors of the manuscript declare that there is no conflict of interest with any of the commercial identities mentioned in the manuscript.

References

  1. Tang, K.H.; Chao, K.H.; Chao, Y.W.; Chen, J.P. Design and implementation of a simulator for photovoltaic modules. Int. J. Photoenergy 2012, 2012, 1–6. [Google Scholar] [CrossRef]
  2. Patel, H.; Agarwal, V. Maximum power point tracking scheme for PV systems operating under partially shaded conditions. IEEE Trans. Ind. Electron. 2008, 55, 1689–1698. [Google Scholar] [CrossRef]
  3. Bradai, R.; Boukenoui, R.; Kheldoun, A.; Salhi, H.; Ghanes, M.; Barbot, J.-P.; Mellit, A. Experimental assessment of new fast MPPT algorithm for PV systems under non-uniform irradiance conditions. Appl. Energy 2017, 199, 416–429. [Google Scholar] [CrossRef]
  4. Gosumbonggot, J.; Fujita, G. Partial shading detection and global maximum power point tracking algorithm for photovoltaic with the variation of irradiation and temperature. Energies 2019, 12, 202. [Google Scholar] [CrossRef] [Green Version]
  5. Dzung, N.L.B. An adaptive solar photovoltaic array using model-based reconfiguration algorithm. IEEE Trans. Ind. Electron. 2008, 55, 2644–2654. [Google Scholar]
  6. Sharm El-Dein, M.Z.; Kazerani, M.; Salama, M.M.A. Novel configurations for photovoltaic farms to reduce partial shading losses. In Proceedings of the 2011 IEEE Power and Energy Society General Meeting, Detroit, MI, USA, 24–28 July 2011; pp. 1–5. [Google Scholar]
  7. Alahmad, M.; Chaaban, M.A.; Lau, S.K.; Shi, J.; Neal, J. An adaptive utility interactive photovoltaic system based on a flexible switch matrix to optimize performance in real-time. Sol. Energy 2012, 86, 951–963. [Google Scholar] [CrossRef] [Green Version]
  8. Malathy, S.R.; Ramaprabha, R. Reconfiguration strategies to extract maximum power from photovoltaic array under partially shaded conditions. Renew. Sust. Energy Rev. 2018, 81, 2922–2934. [Google Scholar] [CrossRef]
  9. Niazi, K.A.K.; Yang, Y.H.; Sera, D. Review of mismatch mitigation techniques for PV modules. IET Renew. Power Gener. 2019, 13, 2035–2050. [Google Scholar] [CrossRef]
  10. Niazi, K.A.K.; Yang, Y.H.; Nasir, M.; Sera, D. Evaluation of interconnection configuration schemes for PV modules with switched-inductor converters under partial shading conditions. Energies 2019, 12, 2802. [Google Scholar] [CrossRef] [Green Version]
  11. Hariharan, R.; Chakkarapani, M.; Saravana Ilango, G.; Nagamani, C. A method to detect photovoltaic array faults and partial shading in PV systems. IEEE J. Photovolt. 2016, 6, 1278–1285. [Google Scholar] [CrossRef]
  12. Kumar, B.P.; Ilango, G.S.; Reddy, M.J.B.; Chilakapati, N. Nagamani Chilakapati. Online fault detection and diagnosis in photovoltaic systems using wavelet packets. IEEE J. Photovolt. 2018, 8, 257–265. [Google Scholar] [CrossRef]
  13. Rivai, A.; Rahim, N.A.; Elias, M.F.M.; Jamaludin, J. Analysis of photovoltaic string failure and health monitoring with module fault identification. Energies 2020, 13, 100. [Google Scholar] [CrossRef] [Green Version]
  14. Alam, M.K.; Khan, F.; Johnson, J.; Flicker, J. A comprehensive review of catastrophic faults in PV arrays: Types, detection, and mitigation techniques. IEEE J. Photovolt. 2015, 5, 982–997. [Google Scholar] [CrossRef]
  15. Zhao, Y.; Palma, J.F.; Mosesian, J.; Lyons, L.; Lehman, B. Line–line fault analysis and protection challenges in solar photovoltaic arrays. IEEE Trans. Ind. Electron. 2013, 60, 3784–3795. [Google Scholar] [CrossRef]
  16. Chen, Z.C.; Wu, L.J.; Cheng, S.Y.; Lin, P.J.; Wu, Y.; Lin, W.C. Intelligent fault diagnosis of photovoltaic arrays based on optimized kernel extreme learning machine and I-V characteristics. Appl. Energy 2017, 204, 912–931. [Google Scholar] [CrossRef]
  17. Chao, K.H.; Ho, S.H.; Wang, M.H. Modeling and fault diagnosis of a photovoltaic system. Elec. Power Syst. Res. 2008, 78, 97–105. [Google Scholar] [CrossRef]
  18. PVSAT Website. Available online: http://pvsat.de/rahmen.html (accessed on 20 August 2020).
  19. Lorenz, E.; Betcke, J.; Drews, A.; Heinemann, D.; Toggweiler, P.; Stettler, S.; Van Sark, W.; Heilscher, G.; Schneider, M.; Wiemken, E.; et al. PVSAT-2: Intelligent performance check of PV system operation based on satellite data. In Proceedings of the 19th European Photovolatic Solar Energy Conference, Paris, France, 7–11 June 2004; pp. 3069–3072. [Google Scholar]
  20. Drews, A.; Keizer, A.C.; Beyer, H.G.; Lorenz, E.; Betcke, J.; Van Sark, W.G.J.H.M.; Heydenreich, W.; Wiemken, E.; Stettler, S.; Toggweiler, P.; et al. Monitoring and remote failure detection of grid-connected PV systems based on satellite observations. Sol. Energy 2007, 81, 548–564. [Google Scholar] [CrossRef] [Green Version]
  21. De Keizer, A.C.; Van Sark, W.G.J.H.M.; Stettler, S.; Toggweiler, P.; Lorenz, E.; Drews, A.; Heinemann, D.; Heilscher, G.; Schneider, M.; Wiemken, E.; et al. PVSAT-2: Results of field test of the satellite-based PV system performance check. In Proceedings of the 21th European Photovolatic Solar Energy Conference, Dresden, Germany, 4–8 September 2006; pp. 2681–2685. [Google Scholar]
  22. Zhiqiang, H.; Li, G. Research and implementation of microcomputer online fault detection of solar array. In Proceedings of the 4th International Conference on Computer Science & Education, Nanning, China, 25–28 July 2009; pp. 1052–1055. [Google Scholar]
  23. Chao, K.H.; Chen, P.Y.; Wang, M.H.; Chen, C.T. An intelligent fault detection method of a photovoltaic module array using wireless sensor networks. Int. J. Distrib. Sens. Netw. 2014. [Google Scholar] [CrossRef] [Green Version]
  24. Chao, K.H.; Lai, P.L.; Liao, B.J. The optimal configuration of photovoltaic module arrays based on adaptive switching controls. Energy Convers. Manag. 2015, 100, 157–167. [Google Scholar] [CrossRef]
  25. Chao, K.H.; Tsai, J.H.; Chen, Y.H. Development of a low-cost fault detector for photovoltaic module array. Electronics 2019, 8, 255. [Google Scholar] [CrossRef] [Green Version]
  26. Grimaccia, F.; Leva, S.; Niccolai, A. PV plant digital mapping for modules defects detection by unmanned aerial vehicles. IET Renew. Power Gener. 2017, 11, 1221–1228. [Google Scholar] [CrossRef]
  27. Li, X.; Yang, Q.; Chen, Z.; Luo, X.; Yan, W. Visible defects detection based on UAV-based inspection in Iarge-scale photovoltaic systems. IET Renew. Power Gener. 2017, 11, 1234–1244. [Google Scholar] [CrossRef]
  28. Menéndez, O.; Guamán, R.; Pérez, M.; Cheein, F.A. Photovoltaic modules diagnosis using artificial vision techniques for artifact minimization. Energies 2018, 11, 1688. [Google Scholar] [CrossRef] [Green Version]
  29. Ramaprabha, R.; Mathur, B.L. A comprehensive review and analysis of solar photovoltaic array configurations under partial shaded conditions. Int. J. Photoenergy 2012. [Google Scholar] [CrossRef] [Green Version]
  30. Wang, Y.J.; Hsu, P.C. An investigation on partial shading of PV modules with different connection configurations of PV Cells. Energy 2011, 36, 3069–3078. [Google Scholar] [CrossRef]
  31. Satpathy, P.R.; Jena, S.; Sharma, R. Power enhancement from partially shaded modules of solar PV arrays. Energy 2018, 144, 839–850. [Google Scholar] [CrossRef]
  32. Deshpande, V.P.; Bodkhe, S.B. Analysis of various connection configuration of photovoltaic module under different shading conditions. Int. J. Appl. Eng. Res. 2017, 12, 5715–5720. [Google Scholar]
  33. Eberhart, R.C.; Kennedy, R.C. A new optimizer using particle swarm theory. In Proceedings of the 6th International Symposium on Micro Machine and Human Science, Nagoya, Japan, 4–6 October 1995; pp. 39–43. [Google Scholar]
  34. Kennedy, J.; Eberhart, R.C. Particle swarm optimization. In Proceedings of the International Neural Networks Conference, Perth, Australia, 27 November–1 December 1995; pp. 1942–1948. [Google Scholar]
  35. Liu, Y.; Niu, B. A novel PSO model based on simulating human social communication behavior. Int. J. Photoenergy 2012. [Google Scholar] [CrossRef]
  36. Liu, A.; Zahara, E.; Yang, M.T. A modified NM-PSO method for parameter estimation problems of models. Int. J. Photoenergy 2012. [Google Scholar] [CrossRef]
  37. Ishaque, K.; Salam, Z.; Amjad, M.; Mekhilef, S. An improved particle swarm optimization (PSO)—Based MPPT for PV with reduced steady-state oscillation. IEEE Trans. Power Electron. 2012, 27, 3627–3638. [Google Scholar] [CrossRef]
  38. Chao, K.H.; Lee, Y.H. A maximum power point tracker with automatic step size tuning scheme for photovoltaic systems. Int. J. Photoenergy 2012. [Google Scholar] [CrossRef]
  39. Liu, Y.H.; Huang, S.C.; Huang, J.W.; Liang, W.C. A particle swarm optimization-based maximum power point tracking algorithm for PV systems operating under partially shaded conditions. IEEE Trans. Energy Convers. 2012, 27, 1027–1035. [Google Scholar] [CrossRef]
  40. SANYO HIP 2717 Datasheet. Available online: http://iris.nyit.edu/~mbertome/solardecathlon/SDClerical/SD_DESIGN+DEVELOPMENT/091804_Sanyo190HITBrochure.pdf (accessed on 18 December 2019).
  41. MP-170 Brochure. Available online: http://www.environmental-expert.com/products/model-mp-170-iv.checker-80092 (accessed on 21 August 2020).
Figure 1. The presented photovoltaic (PV) module array configuration.
Energies 14 00598 g001
Figure 2. The framework of the presented online fault detection system.
Energies 14 00598 g002
Figure 3. The step sequence of configuration optimization using particle swarm optimization (PSO) for a PV module array.
Energies 14 00598 g003
Figure 4. The flowchart of the configuration optimization using PSO for PV module array.
Energies 14 00598 g004
Figure 5. A single experimental P–V characteristic curve for all optimized configurations in Case 1.
Energies 14 00598 g005
Figure 6. A single experimental P–V characteristic curve for all optimized configurations in Case 2.
Energies 14 00598 g006
Figure 7. A single experimental P–V characteristic curve for all optimized configurations in Case 3.
Energies 14 00598 g007
Figure 8. A single experimental P–V characteristic curve for all optimized configurations in Case 4.
Energies 14 00598 g008
Figure 9. A pre-optimized array configuration with a 30% shadow in module 3.
Energies 14 00598 g009
Figure 10. An optimized version of Figure 8.
Energies 14 00598 g010
Figure 11. A photo of the implemented online fault diagnosis system.
Energies 14 00598 g011
Figure 12. Response to an optimization request in a Case 1 array configuration.
Energies 14 00598 g012
Figure 13. Response to an optimization request in a Case 2 array configuration.
Energies 14 00598 g013
Figure 14. Response to an optimization request in a Case 3 array configuration.
Energies 14 00598 g014
Figure 15. Response to an optimization request in a Case 4 array configuration.
Energies 14 00598 g015
Table 1. PSO parameter settings.
Parameter Items
Particle amount4
Cognition learning factor (C1)1
Social learning factor (C2)2
Weighting (w)0.8
Iterations8
Table 2. Optimized configurations for different shaded cases.
Switch
NO.
Switch
S1
Switch
S2
Switch
S3
Switch
S6
Switch
S7
Switch
S8
Shadow
Position
Shaded PV module in row 1 (module 1, 5 or 9)100100
110100
101100
111100
100110
Shaded PV module in row 2 (module 2, 6 or 10)110110
111110
110111
111111
Shaded PV module in row 3 (module 3, 7 or 11)011011
111011
011111
111111
Shaded PV module in row 4 (module 4, 8 or 12)001001
101001
011001
111001
001101
101101
Publisher’s Note: MDPI stays neutral with regard to jurisdictional claims in published maps and institutional affiliations.