Abstract
With the advent of restructuring in the power industry, the conventional unit commitment problem in power systems, involving the minimization of operation costs in a traditional vertically integrated system structure, has been transformed to the profit-based unit commitment (PBUC) approach, whereby generation companies (GENCOs) perform scheduling of the available production units with the aim of profit maximization. Generally, a GENCO solves the PBUC problem for participation in the day-ahead market (DAM) through determining the commitment and scheduling of fossil-fuel-based units to maximize their own profit according to a set of forecasted price and load data. This study presents a methodology to achieve optimal offering curves for a price-taker GENCO owning compressed air energy storage (CAES) and concentrating solar power (CSP) units, in addition to conventional thermal power plants. Various technical and physical constraints regarding the generation units are considered in the provided model. The proposed framework is mathematically described as a mixed-integer linear programming (MILP) problem, which is solved by using commercial software packages. Meanwhile, several cases are analyzed to evaluate the impacts of CAES and CSP units on the optimal solution of the PBUC problem. The achieved results demonstrate that incorporating the CAES and CSP units into the self-scheduling problem faced by the GENCO would increase its profitability in the DAM to a great extent.
1. Introduction
In recent years, many electric power systems throughout the world have undergone massive changes due to restructuring in the power industry, with the aim of propelling this industry from a non-competitive integrated structure toward a competitive framework, resulting in substantial alterations in the operation and planning of vertically integrated electrical energy systems [1,2]. Deregulation in the electric power sector causes generation companies (GENCOs) to be exposed to more challenges and induces them to adopt new production scheduling strategies to survive in the restructured environment. The unit commitment (UC) problem plays a fundamental role in the daily functioning of a traditional electric power system [3,4,5]. The UC problem, aimed at the scheduling of generation resources to satisfy the daily load demand during a specific time horizon (e.g., 24 h), is solved in order to minimize the total operating costs while satisfying various commitment and scheduling constraints, including the maximum and minimum limits of generating units, minimum downtime (MDT), minimum up-time (MUT), ramp-up and ramp-down constraints, and power balance [6,7]. It should be noted that in the regulated environment, GENCOs have an obligation to satisfy the electricity demand.
In a restructured power system, GENCOs are faced with a profit maximization problem called the profit-based unit commitment (PBUC), instead of the conventional operating cost minimization problem. The PBUC is a sophisticated, non-linear, and mixed-integer optimization problem determining the optimum commitment status (on/off) of units, as well as the production scheduling of committed power plants, with the goal of maximizing the GENCO’s profit while meeting the commitment and scheduling constraints mentioned for the UC problem. Another difference between UC and PBUC problems is concerned with the power balance constraint, which is considered as a soft constraint in a deregulated environment, meaning that GENCOs can maximize their own profits without any obligation to satisfy the load demand. Therefore, similar to UC, in PBUC, two types of decision variables should be optimized: binary variables and real or continuous variables. The committed or de-committed status of the production sources is depicted by the binary variables, whereas the real or continuous variables represent the power dispatched to units committed at the time sub-interval of operation. As the number of generation units available for commitment increases, there would be more on/off combinations. Hence, the PBUC problem with various constraints is regarded as a remarkably challenging task confronted by GENCOs in restructured power systems.
The majority of the previous studies, which have been conducted regarding the PBUC problem, consider merely fossil-fuel-based power plants [8] to obtain the optimal scheduling of GENCOs to participate in the day-ahead market (DAM) by proposing various optimization methods [9,10,11,12,13,14,15,16]. The research studies reported in [17,18] determine an optimal solution for the PBUC problem by considering environmental emissions.
Recently, there has been a growing tendency to use energy storage technologies in electrical energy systems. Bulk energy storage systems can serve load-shifting and peak capacity services. Moreover, electricity price volatility in some electricity markets provides a business opportunity for energy arbitrage using these storage facilities [19]. To date, numerous storage systems, including pumped hydro storage (PHS) [20,21]; compressed air energy storage (CAES) [22]; batteries consisting of nickel–cadmium, lead acid, and lithium ion [23]; hydrogen storage [24]; capacitors and supercapacitors [25], flywheels [24,25]; and superconducting magnetic energy storage [26], have been introduced. Among these storage technologies, PHS and CAES have high potential and capability to store a significant quantity of electrical energy (hundreds of MWh) [27]. The need for a certain elevation difference between the two reservoirs, the large footprint, the environmental licensing, and the relatively significant capital costs are the main factors restricting the development of PHS [28].
In CAES systems, electricity can be purchased over the off-peak periods when the energy price is low in order to power large compressors to inject air into a large reservoir, such as a salt cavern or pressure vessels. Hence, electrical energy can be stored in the form of compressed air, which can be utilized to run modified gas turbines (air expander) over the peak periods to sell electricity in the market at higher prices. CAES technologies require a shorter construction period (approximately three years) and their capital cost is considerably lower than other storage facilities (such as PHS) which employ these existing reservoirs [28,29]. Furthermore, CAES systems benefit from high ramp rates and quick response times, making them appropriate tools for ancillary services [30].
In the last few years, the application of CAES units in electricity markets and the operation of electrical energy systems has been a highlighted research subject from many researchers’ points of view. A review on CAES was conducted in [31], wherein basic concepts, the historical background, and recent advancements of this technology were covered. In [32], a risk-constrained bidding framework for a merchant CAES was presented. A market-driven model was proposed in [33] to evaluate the profitability of the coordinated operation of a wind system with a particular type of CAES. Optimal planning of an islanded microgrid comprising the wind turbine, photovoltaic array, diesel generators, and CAES was performed in [34]. The research work reported in [35] dealt with the look-ahead risk-constrained scheduling of wind power integrated with CAES. A self-scheduling tool for a price-taker GENCO owning conventional thermal units and CAES systems was presented in [36]. The optimal bidding of a GENCO equipped with a CAES unit in addition to wind and thermal units was investigated in [37] to participate in day-ahead energy and spinning reserve markets.
On the other hand, due to the depletion of fossil fuels and global warming caused by greenhouse gases, the extensive penetration of renewable energy resources in electrical energy systems seems to be indispensable. In particular, solar energy is regarded as one of the most promising energy resources to generate electricity [38]. Nonetheless, solar radiation is highly associated with large variability and uncertainty; hence, solar energy production is extremely dependent on weather conditions [39]. This drawback can result in serious challenges in operating power systems and can intensify the risk of imbalance between supply and demand.
However, a newly developed renewable generation technology named concentrating solar power (CSP) is expected to have a key role in highly renewable energy penetrated power systems because of being dispatchable through using thermal energy storage (TES) [40]. In addition to supplying electricity during the hours when solar irradiation is available, a CSP unit can transform solar energy into thermal energy, which can be stored in TES over the daytime. Indeed, TES enables CSP to generate electricity as it is required, even during the hours solar irradiation is not available. Since the main difference between a CSP unit and a fossil-fuel-based thermal power plant is the source utilized to heat the transfer fluid, these units are capable of providing a higher stabilizing capability for an electric power system compared with other renewable energy systems. Both CSP units and conventional thermal power plants are connected to the grid by means of a steam turbine and an alternator, providing stabilizing capability [41]. It is worth mentioning that the global installed capacity of CSP will reach 261 GW by 2030, according to the prediction of the International Energy Agency [38].
The technical literature concerned with the strategic operation of CSP plants and the investigation of this technology benefits is still scant, and most of the research has been conducted in the last few years due to the growing penetration of renewable energy sources. A power block concept for flexible electricity dispatch in a CSP plant utilizing an unfired closed air Brayton cycle with a particle-based TES system was presented in [42]. The methodology proposed in [43] dealt with the optimal offering strategy of a CSP owner participating in a pool-based electricity market. A profit maximization model was presented in [44], wherein the bidding strategies of a hybrid CSP fossil producer, involved in the DAM, were optimized. In [45], a risk-constrained model to determine the day-ahead scheduling strategies of a virtual power plant coordinated with a CSP plant and some responsive residential and industrial loads was presented. A profit maximization mixed-integer linear programming (MILP) model was proposed in [46] to obtain a dispatch schedule for a CSP unit with utility-scale photovoltaics. In the research work reported in [47], a risk assessment study was conducted to investigate the impacts of the downside risk constraints on the profit of a central CSP power plant while providing optimal bidding curves, submitted to the electricity market. A look-ahead stochastic UC problem was addressed in [48] for a highly renewable penetrated power system involving CSP. Furthermore, the advantages of CSP plants in accommodating variable renewable energy generation were analyzed. In [49], the optimized offering strategies of a price-taker CSP unit in the DAM, as well as real-time electricity markets, were determined by using the information gap decision theory.
According to our knowledge, there is no research dealing with the joint operation of CAES and CSP in the PBUC problem and their effects on the optimal generation scheduling of conventional thermal power plants. Therefore, in the current study, a novel model for the PBUC problem considering CAES as well as CSP units is presented to determine the optimal short-term operation scheduling of a price-taker GENCO participating in a day-ahead and pool-based electricity market. The problem is formulated as an MILP format, which is solvable by employing commercial optimization packages. The proposed framework allows the construction of the optimal offering curves of a GENCO composed of three types of production facilities, consisting of conventional fossil-fuel-based thermal power plants, CAES systems, and CSP units.
With respect to the aforementioned background and literature review, the main contributions of the current study can be stated as follows:
- Providing a profit-maximization model to obtain the GENCO’s optimal day-ahead scheduling strategy in the presence of CAES as well as CSP;
- Determining the charge and discharge of CAES to maximize the GENCO’s profit;
- Integration of the TES system with the CSP plant, enabling it to operate independently from the instantaneous solar radiation;
- Investigating the impacts of CAES and CSP units on the operation scheduling of the conventional thermal units;
- Using the CPLEX solver to solve the PBUC problem for a GENCO in the presence of conventional thermal units, CAES, and CSP.
The remainder of this paper is categorized as follows. Section 2 describes the mathematical formulation of the proposed PBUC problem considering CAES and CSP units. The obtained simulation results and the required information in the considered case study are provided in Section 3. Eventually, some relevant conclusions are addressed in Section 4.
2. Problem Formulation
In this section, the mathematical description of the PBUC problem considering CAES and CSP is presented. In contrast to the conventional UC problem, which aims to satisfy the electricity demand at the minimum operating cost, maximizing the total profit of GENCOs in the DAM is taken into account as the target of the PBUC problem in competitive electricity markets. The mathematical model of the proposed objective function can be expressed as follows:
where
The proposed objective function defined in (1) aims to maximize the GENCO’s profit. As can be observed, the objective function includes two terms, namely the total revenue and costs. Indeed, the GENCO’s profit is equal to the income received by selling the electric power produced by thermal units, CSP, and CAES in the DAM minus the net operation costs of the thermal power plants and CAES. This profit must be maximized subject to the relevant constraints of the thermal, CAES, and CSP units.
2.1. Thermal Unit Modeling
The mathematical formulation of the operation costs associated with the thermal units considering the start-up cost can be stated as:
where the start-up cost is modeled using a two-valued staircase function representing hot and cold start-up costs as follows [50]:
As can be observed in (4), the generation cost for the thermal power plants is described by quadratic cost functions. In addition, the formulation includes binary decision variables representing the commitment state of the units. In this case, the model would be in a mixed-integer, non-linear format, increasing the complexity of the problem to be solved, since it may face convergence issues. Due to the simplicity of solving MILP problems, the non-linear terms are approximated by employing the piecewise linear approximation approach in order to convert the model into a linear format [51,52]. It is worth mentioning that in this method, the number of pieces selected by users can affect the precision of the approximation. Adopting a sufficient number of pieces can guarantee the accuracy, as was the case in the current study.
The technical constraints associated with the thermal units are provided in (6)–(10). Constraint (6) demonstrates that the power generated by thermal units is constrained by their maximum and minimum ranges. Constraints (7) and (8) represent the permissible minimum on/off time durations of thermal units. The ramp rate restrictions of thermal power plants are shown in (9) and (10).
2.2. Compressed Air Energy Storage Model
The layout of a typical CAES unit considered in this study is illustrated in Figure 1.
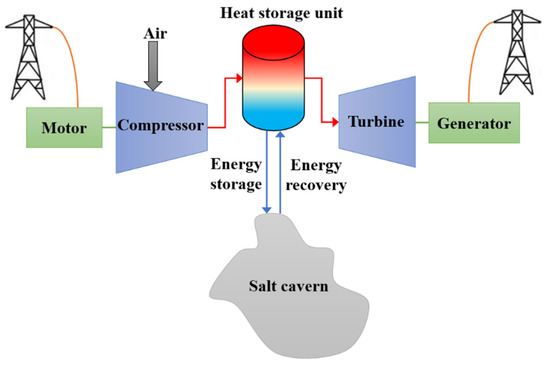
Figure 1.
The layout of the considered CAES unit.
In the charging mode, when energy needs to be stored during the off-peak periods, the purchased electricity from the network is used to power the motor, which drives the compressor. The compressor compresses air into a cavern after increasing its pressure. The compression of air produces heat, which is transferred and stored in the heat storage module to provide the required heat for the expansion process. Afterward, the cold and compressed air is stored in a sealed underground cavern. Pre-existing structures, such as disused salt mines, can be utilized for this purpose. In the discharging mode, when energy needs to be recovered, the high-pressure air is first reheated through the heat storage unit to start the expansion of the compressed air. Then, the expanding air spins the blades of the expansion turbines. Eventually, the generator converts the spinning motion of the turbines into electricity, which can be used over peak periods [53].
The operation cost for CAES includes the cost of purchasing electricity from the pool market for compressing and injecting air in charging mode, which can be stated as follows:
The technical constraints associated with the CAES systems are presented in (12)–(19). Constraint (12) defines the energy equivalent of the injected air into the storage as the electric power consumed by CAES multiplied by the injection efficiency. Constraint (13) states that the amount of electric power generated by CAES equals the energy equivalent of the released air from the storage multiplied by the expanding efficiency. Constraints (14) and (15) express that the proportions of air injected into the storage and released from it are constrained by their maximum and minimum ranges. It is worthwhile mentioning that the restricted capacity varies according to the valve size and pressure limits. Since the CAES systems cannot be operated in the production and consumption states simultaneously, (16) ensures that the CAES system will operate in only one particular mode at a time interval. The storage level for each period is updated according to (17), where the quantity of the stored air is computed based on the current storage and the injected or released air. The storage reservoir limitation for storing air is incorporated in the proposed framework by (18). Meanwhile, (19) shows the initial level of air stored in the storage reservoir.
2.3. Concentrating Solar Power Plant Model
The configuration of the CSP plant considered in this paper is depicted in Figure 2. In addition, Figure 3 demonstrates the schematic energy flow framework in a CSP unit equipped with a TES system. As can be observed, the considered CSP plant includes three integrated blocks, namely the solar field (SF), TES, and power block (PB). Heat transfer fluid (HTF) flows through these blocks to deliver thermal power. Solar irradiation can be concentrated by the SF, which in turn would heat the HTF, which flows through the metal tubes of a receiver. Then, high-temperature HTF absorbing the thermal energy produced by the SF flows into the PB. The transferred thermal energy to the PB can provide high-temperature steam, which can be utilized to drive a steam turbine to generate electric power. Moreover, HTF can flow into the TES system to store or release thermal power.
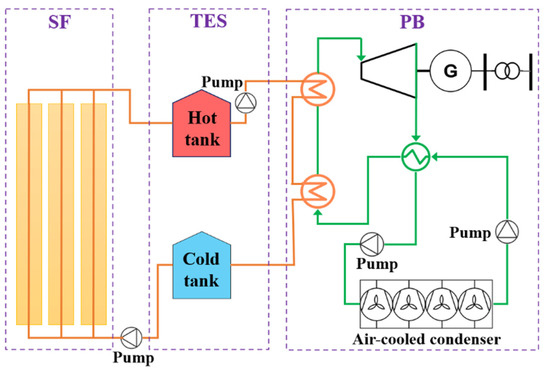
Figure 2.
Configuration of the considered CSP plant.
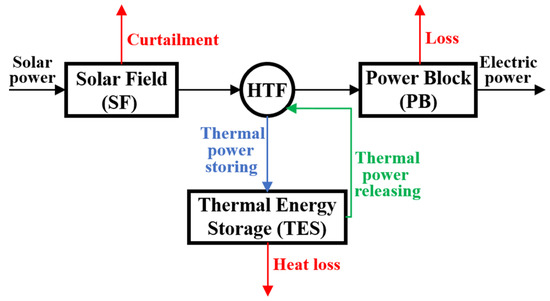
Figure 3.
Simplified energy flow in the CSP unit with TES.
The technical constraints of CSP plants are expressed in (20)–(31). Constraint (20) states that the output power of the CSP units equals the electric power supplied by the SF and the TES. Constraint (21) defines the electric power generated by the SF as the thermal power of the SF utilized for electricity production multiplied by the corresponding efficiency.
Constraint (22) restricts the summation of the thermal power employed to produce electricity and transmitted to the TES system to the average value of thermal power production output by the SF. Constraint (23) states that the thermal power utilized for generating electricity should be restricted based on the corresponding lower and upper permissible ranges. Constraint (24) restricts the maximum electric power output of the CSP plants with respect to their corresponding capacity. The dynamic equation for the storage level of thermal energy in TES is shown in (25). According to (26), the electric power output from the TES equals the thermal power from the storage employed to produce electricity multiplied by the corresponding efficiency. Constraint (27) imposes the allowed level of thermal energy stored in the TES. The ramp-down and ramp-up limits related to TES for the electric power level over the discharging and the charging periods are provided in (28) and (29). Meanwhile, (31) expresses the initial level of thermal energy stored in the TES.
2.4. Power Balance Constraint
The proposed framework has a constraint which establishes the power balance in the GENCO’s decision-making problem to participate in the DAM, which can be expressed as follows:
3. Case Study and Simulation
In the previous section, to obtain the operation scheduling of a price-taker GENCO owning three types of electricity generation facilities, comprising conventional fossil-fuel-based power plants, CAES, and CSP units, the PBUC problem formulation was developed with the aim of maximizing the GENCO’s total profit in the DAM. Four cases are studied in the numerical simulation to assess the impacts of CAES and CSP technologies on the solution of the PBUC problem as follows:
- Case 1: Day-ahead scheduling of a GENCO equipped with only conventional thermal power plants;
- Case 2: Day-ahead scheduling of a GENCO equipped with thermal and CAES units to analyze the advantages of CAES;
- Case 3: Day-ahead scheduling of a GENCO equipped with thermal and CSP units to indicate the benefits of CSP;
- Case 4: Day-ahead scheduling of a GENCO in the presence of thermal, CAES, and CSP units to investigate the positive impacts of using CAES and CSP simultaneously.
The optimization model is formulated as an MILP problem and is solved by utilizing the CPLEX solver, a high-performance mathematical programming tool for solving linear and MILP problems, in the general algebraic modeling system (GAMS) environment [54]. For clarification, a schematic of the proposed framework is illustrated in Figure 4.
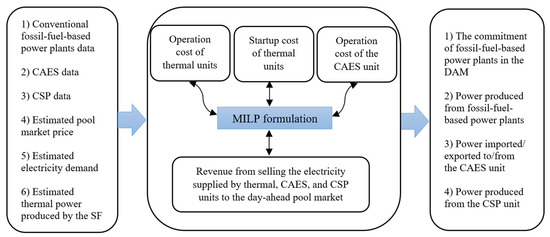
Figure 4.
Schematic of the presented framework.
3.1. Input Data
Table 1 presents the conventional thermal power plant data [9]. The parameters associated with the CAES and CSP units are given in Table 2 and Table 3, respectively [29,43]. The estimated electricity demand and market price in the DAM are depicted in Figure 5 and Figure 6, respectively. Moreover, Figure 7 demonstrates the estimated thermal power produced by the SF.

Table 1.
Characteristics of the conventional thermal power plants.

Table 2.
Parameters of the CAES unit.

Table 3.
Parameters of the concentrating solar power (CSP) unit.
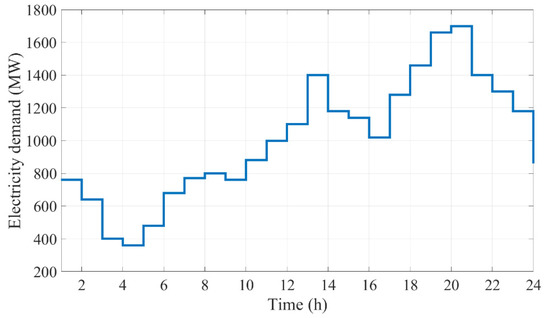
Figure 5.
Estimated load profile.
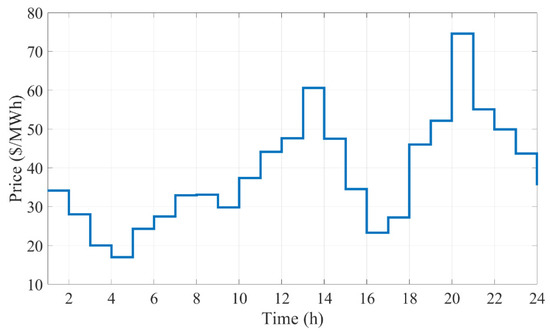
Figure 6.
Estimated pool market price.
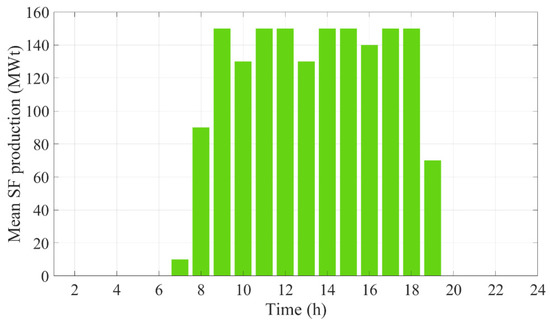
Figure 7.
Estimated thermal power produced by the solar field in the CSP plant.
3.2. Results
In this section, the effects of CAES and CSP technologies on the optimal offering curves of the GENCO are examined in four cases. In case 1, the PBUC problem is solved by considering conventional fossil-fuel-based units. In case 2, the day-ahead scheduling problem of the GENCO is addressed in the presence of CAES units. Moreover, the same problem is dealt with in case 3 by considering the CSP plant and ignoring the CAES unit to investigate the impact of using CSP on the GENCO’s decision-making problem. Eventually, the PBUC problem is handled in the simultaneous presence of CAES and CSP units. The aim is to indicate what changes occur in terms of the optimal bidding and profit of the GENCO. The results of the four mentioned cases are compared in Table 4 from a financial viewpoint. Moreover, the optimal operation scheduling of the conventional thermal power plants in different cases is presented in Appendix A (Table A1, Table A2, Table A3 and Table A4).

Table 4.
Simulation results of the four cases.
According to Table 4, the simulation results, obtained by solving the PBUC problem for case 2, prove the positive and substantial influence of CAES on the profitability of the GENCO by reducing the total operation costs for the conventional thermal power plants. This increment in profit to a great extent is due to the fact that by using CAES, the GENCO would be able to purchase electric power in off-peak hours to be stored in the form of compressed air and to sell the stored energy in peak periods when the prices in the pool market are significantly higher. Hence, the need to operate costly thermal power plants in peak hours is diminished, which in turn would decrease the total operating costs of the conventional thermal units. Comparing the outcomes of cases 1 and 2 reveals that the total profit achieved by the GENCO would increase by 1.16% by utilizing the CAES unit. It is evident that this percentage would increase depending on the capacity and number of installed CAES facilities.
In case 3, the CSP plant is applied to the PBUC problem in order to analyze its effects on the day-ahead scheduling of the GENCO, without considering CAES. The comparison results of cases 1 and 3 indicate a 3.51% enhancement in the acquired total profits compared to case 1. The key explanation for this observation is that due to the characteristics of solar energy, which make the CSP plant an appropriate tool to provide electricity over the peak periods, employing the CSP plant lessens the need to operate costly thermal power plants. Furthermore, incorporating the TES system in the structure of the CSP unit allows the GENCO to satisfy some of the demand when solar irradiation is not available. Therefore, instead of consuming expensive fossil fuels, the GENCO can benefit from the CSP plant by using a free resource, solar energy, to heat the transfer fluid, which in turn would increase the total obtained income and profit.
Finally, in case 4, the PBUC problem is handled by taking both CAES and CSP units into account to observe their simultaneous effects on the day-ahead scheduling of the GENCO. By considering the impacts of both CAES and CSP technologies, the total achieved profit increases by 4.39% compared with case 1. In general, the GENCO’s total profit associated with case 4 is higher compared to that of the previous cases owing to taking advantage of both CAES and CSP units. According to Table A1, Table A2, Table A3 and Table A4 in Appendix A, representing the optimal scheduling of conventional thermal power plants in different cases, the lower participation of many units in the DAM can be observed in case 4. As can be seen, the total scheduled production associated with thermal units 3, 7, and 9 is 780, 190, and 100.5 MW, respectively, which are substantially lower compared to those of other cases. Another point deserving of emphasis is related to thermal unit 10, whose commitment status in all hours is zero in case 4. Thus, this unit is not required to be participated in the DAM in the case of joint operation of CAES and CSP. For the above reasons, in case 4, the operation cost for fossil-fuel-based power plants is considerably lower than that of other cases, as shown in Table 4, which in turn would result in higher profitability for the GENCO.
The amount of power consumed or generated by the CAES unit in cases 2 and 4 is demonstrated in Figure 8 and Figure 9, respectively.
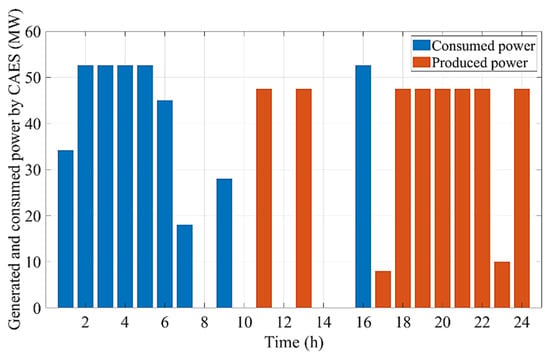
Figure 8.
Amount of power consumed or produced by the CAES unit in case 2.
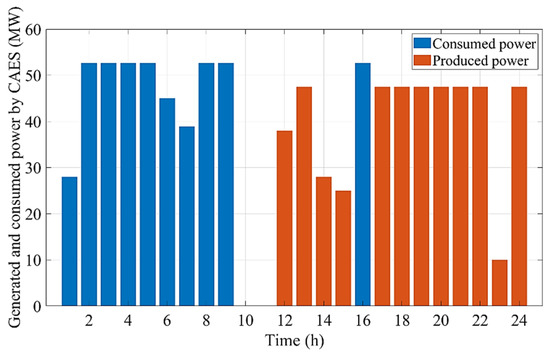
Figure 9.
Amount of power consumed or produced by the CAES unit in case 4.
Additionally, Figure 10 and Figure 11 represent the quantities of energy stored in the CAES in cases 2 and 4, respectively. As can be observed, in case 2, electrical energy is purchased during the off-peak periods (i.e., hours 1–7, 9, and 16) when the electricity price is inexpensive in the pool market in order to store energy in the CAES unit in the form of compressed air. The stored energy can be utilized to produce electricity during the peak periods (i.e., hours 11, 13, 17–24) when the prices are noticeably higher. Similar to case 2, in case 4, the electric power is consumed by the CAES unit over the low-price periods (i.e., hours 1–9 and 16) to generate electric power in the high-price periods (i.e., hours 12–15 and 17–24). Consequently, CAES can provide a great opportunity for the GENCO to achieve higher profits in competitive electricity markets by buying electricity during hours of low energy prices to sell it at higher prices over peak periods.
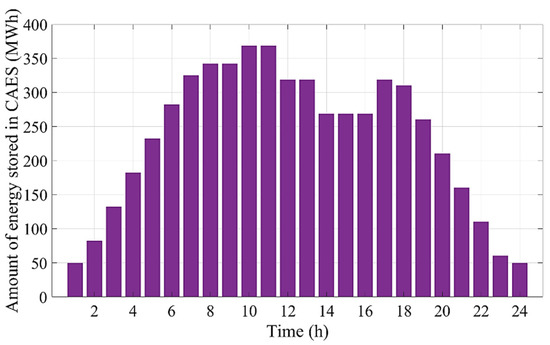
Figure 10.
Quantity of energy stored in the CAES in case 2.
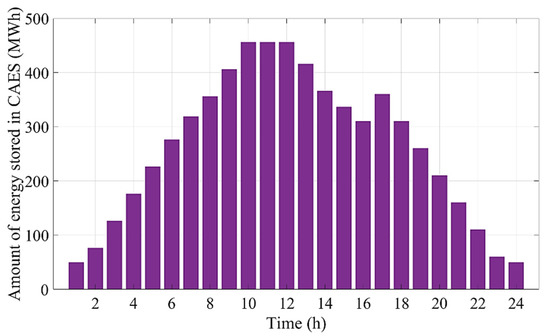
Figure 11.
Quantity of energy stored in the CAES in case 4.
Optimal decisions made by the GENCO concerning the operation scheduling of the CSP unit in cases 3 and 4 are presented in Table 5. Furthermore, Figure 12 and Figure 13 depict the amounts of energy charged and discharged by the TES system in the CSP plant associated with cases 3 and 4, respectively. As can be seen, over hours 8–19, when sufficient sunlight is available, electric power is generated by the CSP plant by using thermal energy directly produced by SF. In these periods, the TES system is also charged by receiving thermal energy produced by SF. The stored energy is then used to produce electric power over the periods when the solar source is not available (i.e., hours 20–24).

Table 5.
Optimal operation scheduling for the CSP plant.
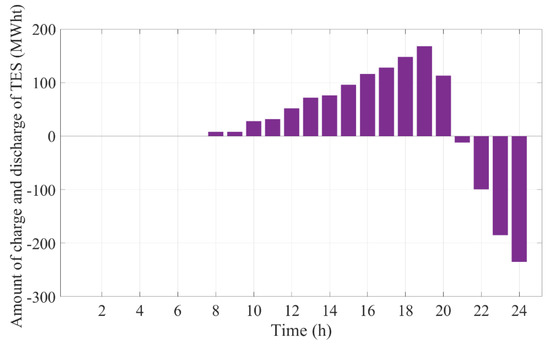
Figure 12.
Amounts of charge and discharge of TES in the CSP plant associated with case 3.
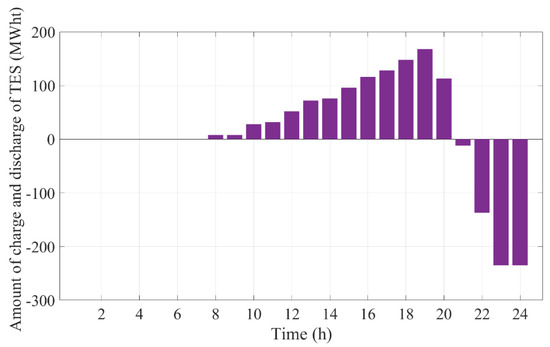
Figure 13.
Amounts of charge and discharge of TES in the CSP plant associated with case 4.
4. Conclusions
In this paper, the day-ahead scheduling of a price-taker GENCO equipped with thermal, CAES, and CSP units was presented. The proposed mathematical model determines the optimal bidding strategy in the DAM for the GENCO, whose objective is to maximize the total profit achieved through participation in the energy market. The proposed framework, formulated based on the MILP format, was effectively solved by employing the CPLEX solver under the GAMS environment. In this paper, the effects and valuable benefits of the CAES and CSP units on the optimal solution of the PBUC problem were studied in four cases. The simulation results revealed that the CAES technology enables the GENCO to take advantage of favorable price deviations through opportunistic measures and to potentially attain higher profits. These storage facilities provide an appealing opportunity for GENCOs to purchase electrical energy over off-peak hours to be retained in the form of compressed air and to sell the stored energy during peak periods when the prices in the pool market are significantly higher. In addition, the numerical analysis demonstrates that the CSP plant is an appropriate tool to reduce the need to operate costly thermal power plants by supplying electricity over the periods when the solar resource is available. Furthermore, it has been shown that using the TES system enhances the dispatchability of the CSP unit through storing the thermal energy provided by the SF over the periods when the thermal energy can be produced by the SF and utilizing it to generate electrical energy over the periods without solar irradiation. The obtained results indicate that the GENCO can benefit from the advantages of both CAES and CSP units through the joint operation of these facilities to increase its profitability in the DAM to a great extent (by 4.39%) compared with the case where only conventional thermal power plants are utilized.
Author Contributions
Conceptualization, M.N.G.; data curation, M.H.I.; methodology, M.N.G. and M.J.G.; software, M.N.G. and M.H.I.; supervision, L.L.; validation, M.N.G., M.H.I., and M.J.G.; writing—original draft preparation, M.N.G.; writing—review and editing, M.N.G., M.H.I., M.J.G., L.L. and A.G. All authors have read and agreed to the published version of the manuscript.
Funding
This research received no external funding.
Institutional Review Board Statement
Not applicable.
Informed Consent Statement
Not applicable.
Data Availability Statement
Not applicable.
Conflicts of Interest
The authors declare no conflict of interest.
Nomenclature
| Indices | |
| Index of fossil-fuel-based units | |
| Index of CSP units | |
| Index of CAES units | |
| Index of time periods (h) | |
| Parameters and Constants | |
| Cost function coefficients of the ith conventional thermal unit | |
| Initial level of air storage pertaining to the kth CAES (MWh) | |
| Lowest level of the storage reservoir pertaining to the kth CAES (MWh) | |
| Highest level of the storage reservoir pertaining to the kth CAES (MWh) | |
| Cold start-up cost of the ith thermal unit ($/h) | |
| Cooling constant of the ith thermal unit (h) | |
| Average amount of the thermal power generated by the SF pertaining to the jth CSP unit at period t (MWt) | |
| Hot start-up cost of the ith thermal unit ($/h) | |
| Number of CAES units | |
| Number of CSP units | |
| Number of conventional thermal units | |
| Number of time periods | |
| Capacity of the jth CSP unit (MWe) | |
| Electricity demand at period t (MW) | |
| Lower bound of the electricity produced by the ith thermal unit (MW) | |
| Upper bound of the electricity produced by the ith thermal unit (MW) | |
| Minimum thermal power input to the power block pertaining to the jth CSP unit (MWt) | |
| Thermal capacity of the power block pertaining to the jth CSP unit (MWt) | |
| Minimum thermal energy level in TES pertaining to the jth CSP unit (MWht) | |
| Maximum thermal energy level in TES pertaining to the jth CSP unit (MWht) | |
| Ramp-down rate of the ith thermal unit (MW/h) | |
| Ramp-up rate of the ith thermal unit (MW/h) | |
| Ramp-down rate for discharging TES pertaining to the jth CSP unit (MWe/h) | |
| Ramp-up rate for charging TES pertaining to the jth CSP unit (MWe/h) | |
| Initial level of thermal energy stored in TES pertaining to the jth CSP (MWht) | |
| Minimum “on” time of the ith thermal unit (h) | |
| Minimum “off” time of the ith thermal unit (h) | |
| Lowest level of injected air into storage pertaining to the kth CAES (MWh) | |
| Highest level of injected air into storage pertaining to the kth CAES (MWh) | |
| Lowest level of released air from storage pertaining to the kth CAES (MWh) | |
| Highest level of released air from storage pertaining to the kth CAES (MWh) | |
| Conversion efficiency of thermal power generated by the SF to electricity pertaining to the jth CSP unit (MWe/MWt, %) | |
| Conversion efficiency of thermal power generated by the SF and transferred to TES pertaining to the jth CSP unit (%) | |
| Conversion efficiency of thermal power generated by TES to electricity pertaining to the jth CSP unit (MWe/MWt, %) | |
| Pool market price at period t ($/MWh) | |
| Efficiency of injecting power pertaining to the kth CAES | |
| Efficiency of producing power pertaining to the kth CAES | |
| Functions and Variables | |
| Amount of energy stored in storage pertaining to the kth CAES at period t (MWh) | |
| GENCO’s total cost ($) | |
| Cost of operating CAES units ($) | |
| Cost of operating thermal units ($) | |
| Electric power directly supplied by the SF pertaining to the jth CSP at period t (MWe) | |
| Electric power generated from TES pertaining to the jth CSP at scenario ω and period t (MWe) | |
| Electricity consumed by the kth CAES unit for compressing and injecting air at period t (MW) | |
| Power output of the kth CAES unit sold to the pool market at period t (MW) | |
| Electric power output of the jth CSP unit at period t (MWe) | |
| Thermal power from the SF utilized to produce electricity pertaining to the jth CSP at period t (MWt) | |
| Thermal power from the SF transferred to TES pertaining to the jth CSP at period t (MWt) | |
| Thermal energy stored in TES at the end of hour t pertaining to the jth CSP (MWht) | |
| Thermal power from TES utilized to produce electricity pertaining to the jth CSP at period t (MWt) | |
| Electricity produced by the ith thermal unit at period t (MW) | |
| Binary variable representing commitment state of thermal unit i at period t | |
| Binary variable, which is equal to 1 if the jth CSP is “on” at period t, 0 otherwise | |
| Binary variable, which is equal to 1 if the kth CAES is in the injecting mode at period t, 0 otherwise | |
| Binary variable, which is equal to 1 if the kth CAES is in the discharge mode at period t, 0 otherwise | |
| GENCO’s total profit ($) | |
| GENCO’s total revenue ($) | |
| Start-up cost of the ith thermal unit at period t ($) | |
| Energy equivalent of injected air to storage pertaining to the kth CAES at period t (MWh) | |
| Energy equivalent of released air from the storage pertaining to the kth CAES at period t (MWh) | |
| Time duration for which the ith thermal unit has been “on” at hour t (h) | |
| Time duration for which the ith thermal unit has been “off” at hour t (h) | |
| Abbreviations | |
| CAES | Compressed air energy storage |
| CSP | Concentrating solar power |
| DAM | Day-ahead market |
| GAMS | General algebraic modeling system |
| GENCO | Generation company |
| HTF | Heat transfer fluid |
| MILP | Mixed-integer linear programming |
| PBUC | Profit-based unit commitment |
| PB | Power block |
| SF | Solar field |
| TES | Thermal energy storage |
| UC | Unit commitment |
Appendix A

Table A1.
Optimal operation scheduling for the conventional thermal units in case 1.
Table A1.
Optimal operation scheduling for the conventional thermal units in case 1.
| Hour | ||||||||||
|---|---|---|---|---|---|---|---|---|---|---|
| 1 | 455 | 305 | 0 | 0 | 0 | 0 | 0 | 0 | 0 | 0 |
| 2 | 390 | 250 | 0 | 0 | 0 | 0 | 0 | 0 | 0 | 0 |
| 3 | 250 | 150 | 0 | 0 | 0 | 0 | 0 | 0 | 0 | 0 |
| 4 | 210 | 150 | 0 | 0 | 0 | 0 | 0 | 0 | 0 | 0 |
| 5 | 330 | 150 | 0 | 0 | 0 | 0 | 0 | 0 | 0 | 0 |
| 6 | 450 | 230 | 0 | 0 | 0 | 0 | 0 | 0 | 0 | 0 |
| 7 | 455 | 315 | 0 | 0 | 0 | 0 | 0 | 0 | 0 | 0 |
| 8 | 455 | 345 | 0 | 0 | 0 | 0 | 0 | 0 | 0 | 0 |
| 9 | 455 | 305 | 0 | 0 | 0 | 0 | 0 | 0 | 0 | 0 |
| 10 | 455 | 425 | 0 | 0 | 0 | 0 | 0 | 0 | 0 | 0 |
| 11 | 455 | 455 | 0 | 0 | 60 | 30 | 0 | 0 | 0 | 0 |
| 12 | 455 | 455 | 0 | 0 | 120 | 70 | 0 | 0 | 0 | 0 |
| 13 | 450 | 455 | 130 | 130 | 150 | 80 | 0 | 0 | 0 | 0 |
| 14 | 455 | 415 | 130 | 130 | 50 | 0 | 0 | 0 | 0 | 0 |
| 15 | 455 | 400 | 130 | 130 | 25 | 0 | 0 | 0 | 0 | 0 |
| 16 | 455 | 335 | 86 | 94 | 50 | 0 | 0 | 0 | 0 | 0 |
| 17 | 455 | 455 | 130 | 130 | 110 | 0 | 0 | 0 | 0 | 0 |
| 18 | 455 | 455 | 130 | 130 | 162 | 80 | 48 | 0 | 0 | 0 |
| 19 | 455 | 455 | 130 | 130 | 162 | 80 | 85 | 55 | 53 | 55 |
| 20 | 455 | 455 | 130 | 130 | 162 | 80 | 85 | 55 | 55 | 55 |
| 21 | 455 | 455 | 130 | 130 | 162 | 0 | 68 | 0 | 0 | 0 |
| 22 | 455 | 455 | 130 | 130 | 130 | 0 | 0 | 0 | 0 | 0 |
| 23 | 455 | 435 | 130 | 130 | 30 | 0 | 0 | 0 | 0 | 0 |
| 24 | 455 | 405 | 0 | 0 | 0 | 0 | 0 | 0 | 0 | 0 |
| Total production | 10,275 | 8710 | 1386 | 1394 | 1373 | 420 | 286 | 110 | 108 | 110 |

Table A2.
Optimal operation scheduling for the conventional thermal units in case 2.
Table A2.
Optimal operation scheduling for the conventional thermal units in case 2.
| Hour | ||||||||||
|---|---|---|---|---|---|---|---|---|---|---|
| 1 | 455 | 339.208 | 0 | 0 | 0 | 0 | 0 | 0 | 0 | 0 |
| 2 | 442.632 | 250 | 0 | 0 | 0 | 0 | 0 | 0 | 0 | 0 |
| 3 | 302.632 | 150 | 0 | 0 | 0 | 0 | 0 | 0 | 0 | 0 |
| 4 | 262.632 | 150 | 0 | 0 | 0 | 0 | 0 | 0 | 0 | 0 |
| 5 | 382.632 | 150 | 0 | 0 | 0 | 0 | 0 | 0 | 0 | 0 |
| 6 | 455 | 270 | 0 | 0 | 0 | 0 | 0 | 0 | 0 | 0 |
| 7 | 455 | 333 | 0 | 0 | 0 | 0 | 0 | 0 | 0 | 0 |
| 8 | 455 | 345 | 0 | 0 | 0 | 0 | 0 | 0 | 0 | 0 |
| 9 | 455 | 333 | 0 | 0 | 0 | 0 | 0 | 0 | 0 | 0 |
| 10 | 455 | 425 | 0 | 0 | 0 | 0 | 0 | 0 | 0 | 0 |
| 11 | 455 | 455 | 0 | 0 | 42.5 | 0 | 0 | 0 | 0 | 0 |
| 12 | 455 | 413 | 0 | 130 | 102 | 0 | 0 | 0 | 0 | 0 |
| 13 | 455 | 455 | 130 | 130 | 162 | 0 | 0 | 0 | 0 | 0 |
| 14 | 455 | 403 | 130 | 130 | 62 | 0 | 0 | 0 | 0 | 0 |
| 15 | 455 | 400 | 130 | 130 | 25 | 0 | 0 | 0 | 0 | 0 |
| 16 | 455 | 335 | 110.632 | 130 | 42 | 0 | 0 | 0 | 0 | 0 |
| 17 | 455 | 455 | 130 | 130 | 102 | 0 | 0 | 0 | 0 | 0 |
| 18 | 455 | 455 | 130 | 130 | 162 | 0 | 80 | 0 | 0 | 0 |
| 19 | 455 | 455 | 130 | 130 | 162 | 80 | 85 | 55 | 55 | 0 |
| 20 | 455 | 455 | 130 | 130 | 162 | 80 | 80 | 55 | 50 | 55 |
| 21 | 455 | 455 | 130 | 130 | 162 | 20.5 | 0 | 0 | 0 | 0 |
| 22 | 455 | 455 | 130 | 130 | 82 | 0 | 0 | 0 | 0 | 0 |
| 23 | 455 | 455 | 130 | 130 | 0 | 0 | 0 | 0 | 0 | 0 |
| 24 | 455 | 357.5 | 0 | 0 | 0 | 0 | 0 | 0 | 0 | 0 |
| Total production | 10,490.53 | 8748.708 | 1410.632 | 1560 | 1268 | 180.5 | 245 | 110 | 105.5 | 55 |

Table A3.
Optimal operation scheduling for the conventional thermal units in case 3.
Table A3.
Optimal operation scheduling for the conventional thermal units in case 3.
| Hour | ||||||||||
|---|---|---|---|---|---|---|---|---|---|---|
| 1 | 455 | 305 | 0 | 0 | 0 | 0 | 0 | 0 | 0 | 0 |
| 2 | 390 | 250 | 0 | 0 | 0 | 0 | 0 | 0 | 0 | 0 |
| 3 | 250 | 150 | 0 | 0 | 0 | 0 | 0 | 0 | 0 | 0 |
| 4 | 210 | 150 | 0 | 0 | 0 | 0 | 0 | 0 | 0 | 0 |
| 5 | 330 | 150 | 0 | 0 | 0 | 0 | 0 | 0 | 0 | 0 |
| 6 | 450 | 230 | 0 | 0 | 0 | 0 | 0 | 0 | 0 | 0 |
| 7 | 455 | 315 | 0 | 0 | 0 | 0 | 0 | 0 | 0 | 0 |
| 8 | 455 | 309 | 0 | 0 | 0 | 0 | 0 | 0 | 0 | 0 |
| 9 | 455 | 255 | 0 | 0 | 0 | 0 | 0 | 0 | 0 | 0 |
| 10 | 455 | 375 | 0 | 0 | 0 | 0 | 0 | 0 | 0 | 0 |
| 11 | 455 | 455 | 0 | 0 | 0 | 40 | 0 | 0 | 0 | 0 |
| 12 | 455 | 455 | 0 | 0 | 60 | 80 | 0 | 0 | 0 | 0 |
| 13 | 455 | 455 | 130 | 130 | 120 | 60 | 0 | 0 | 0 | 0 |
| 14 | 455 | 390 | 130 | 130 | 25 | 0 | 0 | 0 | 0 | 0 |
| 15 | 455 | 350 | 130 | 130 | 25 | 0 | 0 | 0 | 0 | 0 |
| 16 | 455 | 295 | 86 | 94 | 40 | 0 | 0 | 0 | 0 | 0 |
| 17 | 455 | 415 | 130 | 130 | 100 | 0 | 0 | 0 | 0 | 0 |
| 18 | 455 | 455 | 130 | 130 | 160 | 0 | 80 | 0 | 0 | 0 |
| 19 | 455 | 455 | 130 | 130 | 162 | 80 | 85 | 55 | 55 | 0 |
| 20 | 455 | 455 | 130 | 130 | 162 | 80 | 80 | 55 | 54.25 | 55 |
| 21 | 455 | 455 | 130 | 130 | 162 | 37.45 | 0 | 0 | 0 | 0 |
| 22 | 455 | 455 | 130 | 130 | 100 | 0 | 0 | 0 | 0 | 0 |
| 23 | 455 | 447.5 | 130 | 130 | 0 | 0 | 0 | 0 | 0 | 0 |
| 24 | 455 | 370 | 0 | 0 | 0 | 0 | 0 | 0 | 0 | 0 |
| Total production | 10,275 | 8396.5 | 1386 | 1394 | 1116 | 377.45 | 245 | 110 | 109.25 | 55 |

Table A4.
Optimal operation scheduling for the conventional thermal units in case 4.
Table A4.
Optimal operation scheduling for the conventional thermal units in case 4.
| Hour | ||||||||||
|---|---|---|---|---|---|---|---|---|---|---|
| 1 | 455 | 333 | 0 | 0 | 0 | 0 | 0 | 0 | 0 | 0 |
| 2 | 442.632 | 250 | 0 | 0 | 0 | 0 | 0 | 0 | 0 | 0 |
| 3 | 302.632 | 150 | 0 | 0 | 0 | 0 | 0 | 0 | 0 | 0 |
| 4 | 262.632 | 150 | 0 | 0 | 0 | 0 | 0 | 0 | 0 | 0 |
| 5 | 382.632 | 150 | 0 | 0 | 0 | 0 | 0 | 0 | 0 | 0 |
| 6 | 455 | 270 | 0 | 0 | 0 | 0 | 0 | 0 | 0 | 0 |
| 7 | 455 | 353.911 | 0 | 0 | 0 | 0 | 0 | 0 | 0 | 0 |
| 8 | 455 | 361.632 | 0 | 0 | 0 | 0 | 0 | 0 | 0 | 0 |
| 9 | 455 | 307.632 | 0 | 0 | 0 | 0 | 0 | 0 | 0 | 0 |
| 10 | 455 | 375 | 0 | 0 | 0 | 0 | 0 | 0 | 0 | 0 |
| 11 | 455 | 453 | 0 | 0 | 42 | 0 | 0 | 0 | 0 | 0 |
| 12 | 455 | 455 | 0 | 0 | 102 | 0 | 0 | 0 | 0 | 0 |
| 13 | 455 | 455 | 0 | 130 | 162 | 0 | 0 | 55 | 45.5 | 0 |
| 14 | 455 | 455 | 0 | 130 | 62 | 0 | 0 | 0 | 0 | 0 |
| 15 | 455 | 455 | 0 | 130 | 25 | 0 | 0 | 0 | 0 | 0 |
| 16 | 455 | 355.132 | 0 | 130 | 82.5 | 0 | 0 | 0 | 0 | 0 |
| 17 | 455 | 455 | 0 | 130 | 142.5 | 0 | 0 | 0 | 0 | 0 |
| 18 | 455 | 455 | 130 | 130 | 162 | 30.5 | 0 | 0 | 0 | 0 |
| 19 | 455 | 455 | 130 | 130 | 162 | 80 | 80 | 55 | 0 | 0 |
| 20 | 455 | 455 | 130 | 130 | 162 | 80 | 85 | 55 | 55 | 0 |
| 21 | 455 | 455 | 130 | 130 | 113.75 | 0 | 25 | 0 | 0 | 0 |
| 22 | 455 | 455 | 130 | 130 | 48.2 | 0 | 0 | 0 | 0 | 0 |
| 23 | 455 | 455 | 130 | 130 | 0 | 0 | 0 | 0 | 0 | 0 |
| 24 | 455 | 322.5 | 0 | 0 | 0 | 0 | 0 | 0 | 0 | 0 |
| Total production | 10,490.53 | 8836.807 | 780 | 1430 | 1265.95 | 190.5 | 190 | 165 | 100.5 | 0 |
References
- Shahidehpour, M.; Yamin, H.; Li, Z. Market Operations in Electric Power Systems: Forecasting, Scheduling, and Risk Management; John Wiley & Sons: Hoboken, NJ, USA, 2003. [Google Scholar]
- Gilvaei, M.N.; Baghramian, A. A two-stage stochastic framework for an electricity retailer considering demand response and uncertainties using a hybrid clustering technique. Iran. J. Sci. Technol. Trans. Electr. Eng. 2019, 43, 541–558. [Google Scholar] [CrossRef]
- Padhy, N.P. Unit commitment-a bibliographical survey. IEEE Trans. Power Syst. 2004, 19, 1196–1205. [Google Scholar] [CrossRef]
- Padhy, N.P. Unit commitment problem under deregulated environment-a review. In Proceedings of the 2003 IEEE Power Engineering Society General Meeting (IEEE Cat. No. 03CH37491), Toronto, ON, Canada, 13–17 July 2003; Volume 2, pp. 1088–1094. [Google Scholar]
- Gilvaei, M.N.; Jafari, H.; Ghadi, M.J.; Li, L. A novel hybrid optimization approach for reactive power dispatch problem considering voltage stability index. Eng. Appl. Artif. Intell. 2020, 96, 103963. [Google Scholar]
- Wood, A.J.; Wollenberg, B.F.; Sheblé, G. Power Generation, Operation, and Control; John Wiley & Sons: Hoboken, NJ, USA, 2013. [Google Scholar]
- Anand, H.; Narang, N.; Dhillon, J.S. Unit commitment considering dual-mode combined heat and power generating units using integrated optimization technique. Energy Convers. Manag. 2018, 171, 984–1001. [Google Scholar] [CrossRef]
- Kryzia, D.; Kopacz, M.; Kryzia, K. The Valuation of the Operational Flexibility of the Energy Investment Project Based on a Gas-Fired Power Plant. Energies 2020, 13, 1567. [Google Scholar] [CrossRef]
- Ghadi, M.J.; Baghramian, A.; Imani, M.H. An ICA based approach for solving profit based unit commitment problem market. Appl. Soft Comput. 2016, 38, 487–500. [Google Scholar] [CrossRef]
- Krishna, P.R.; Sao, S. An improved TLBO algorithm to solve profit based unit commitment problem under deregulated environment. Procedia Technol. 2016, 25, 652–659. [Google Scholar] [CrossRef]
- Reddy, K.S.; Panwar, L.K.; Kumar, R.; Panigrahi, B.K. Binary fireworks algorithm for profit based unit commitment (PBUC) problem. Int. J. Electr. Power Energy Syst. 2016, 83, 270–282. [Google Scholar] [CrossRef]
- Sudhakar, A.V.V.; Karri, C.; Laxmi, A.J. Profit based unit commitment for GENCOs using Lagrange Relaxation–Differential Evolution. Eng. Sci. Technol. Int. J. 2017, 20, 738–747. [Google Scholar] [CrossRef]
- Reddy, K.S.; Panwar, L.; Panigrahi, B.K.; Kumar, R. Binary whale optimization algorithm: A new metaheuristic approach for profit-based unit commitment problems in competitive electricity markets. Eng. Optim. 2019, 51, 369–389. [Google Scholar] [CrossRef]
- Anand, H.; Narang, N.; Dhillon, J.S. Profit based unit commitment using hybrid optimization technique. Energy 2018, 148, 701–715. [Google Scholar] [CrossRef]
- Reddy, S.; Panwar, L.K.; Panigrahi, B.K.; Kumar, R.; Alsumaiti, A. Binary grey wolf optimizer models for profit based unit commitment of price-taking GENCO in electricity market. Swarm Evol. Comput. 2019, 44, 957–971. [Google Scholar] [CrossRef]
- Dhaliwal, J.S.; Dhillon, J.S. Profit based unit commitment using memetic binary differential evolution algorithm. Appl. Soft Comput. 2019, 81, 105502. [Google Scholar] [CrossRef]
- Ghadi, M.J.; Karin, A.I.; Baghramian, A.; Imani, M.H. Optimal power scheduling of thermal units considering emission constraint for GENCOs’ profit maximization. Int. J. Electr. Power Energy Syst. 2016, 82, 124–135. [Google Scholar] [CrossRef]
- Senthilvadivu, A.; Gayathri, K.; Asokan, K. Exchange Market algorithm based Profit Based Unit Commitment for GENCOs Considering Environmental Emissions. Int. J. Appl. Eng. Res. 2018, 13, 14997–15010. [Google Scholar]
- Sioshansi, R.; Denholm, P.; Jenkin, T.; Weiss, J. Estimating the value of electricity storage in PJM: Arbitrage and some welfare effects. Energy Econ. 2009, 31, 269–277. [Google Scholar] [CrossRef]
- Pickard, W.F.; Shen, A.Q.; Hansing, N.J. Parking the power: Strategies and physical limitations for bulk energy storage in supply–demand matching on a grid whose input power is provided by intermittent sources. Renew. Sustain. Energy Rev. 2009, 13, 1934–1945. [Google Scholar] [CrossRef]
- Brown, P.D.; Lopes, J.P.; Matos, M.A. Optimization of pumped storage capacity in an isolated power system with large renewable penetration. IEEE Trans. Power Syst. 2008, 23, 523–531. [Google Scholar] [CrossRef]
- Cavallo, A. Controllable and affordable utility-scale electricity from intermittent wind resources and compressed air energy storage (CAES). Energy 2007, 32, 120–127. [Google Scholar] [CrossRef]
- Chang, Y.; Mao, X.; Zhao, Y.; Feng, S.; Chen, H.; Finlow, D. Lead-acid battery use in the development of renewable energy systems in China. J. Power Sources 2009, 191, 176–183. [Google Scholar] [CrossRef]
- Aguado, M.; Ayerbe, E.; Azcárate, C.; Blanco, R.; Garde, R.; Mallor, F.; Rivas, D.M. Economical assessment of a wind–hydrogen energy system using WindHyGen® software. Int. J. Hydrog. Energy 2009, 34, 2845–2854. [Google Scholar] [CrossRef]
- Beaudin, M.; Zareipour, H.; Schellenberglabe, A.; Rosehart, W. Energy storage for mitigating the variability of renewable electricity sources: An updated review. Energy Sustain. Dev. 2010, 14, 302–314. [Google Scholar] [CrossRef]
- Buckles, W.; Hassenzahl, W.V. Superconducting magnetic energy storage. IEEE Power Eng. Rev. 2000, 20, 16–20. [Google Scholar] [CrossRef]
- DeCarolis, J.F.; Keith, D.W. The economics of large-scale wind power in a carbon constrained world. Energy Policy 2006, 34, 395–410. [Google Scholar] [CrossRef]
- Safaei, H.; Keith, D.W. Compressed air energy storage with waste heat export: An Alberta case study. Energy Convers. Manag. 2014, 78, 114–124. [Google Scholar] [CrossRef]
- Abbaspour, M.; Satkin, M.; Mohammadi-Ivatloo, B.; Lotfi, F.H.; Noorollahi, Y. Optimal operation scheduling of wind power integrated with compressed air energy storage (CAES). Renew. Energy 2013, 51, 53–59. [Google Scholar] [CrossRef]
- Daneshi, H.; Srivastava, A.K.; Daneshi, A. Generation scheduling with integration of wind power and compressed air energy storage. In Proceedings of the IEEE PES T&D 2010, New Orleans, LA, USA, 19–22 April 2010; pp. 1–6. [Google Scholar]
- Budt, M.; Wolf, D.; Span, R.; Yan, J. A review on compressed air energy storage: Basic principles, past milestones and recent developments. Appl. Energy 2016, 170, 250–268. [Google Scholar] [CrossRef]
- Shafiee, S.; Zareipour, H.; Knight, A.M.; Amjady, N.; Mohammadi-Ivatloo, B. Risk-constrained bidding and offering strategy for a merchant compressed air energy storage plant. IEEE Trans. Power Syst. 2016, 32, 946–957. [Google Scholar] [CrossRef]
- Moradi, J.; Shahinzadeh, H.; Khandan, A.; Moazzami, M. A profitability investigation into the collaborative operation of wind and underwater compressed air energy storage units in the spot market. Energy 2017, 141, 1779–1794. [Google Scholar] [CrossRef]
- Zhang, J.; Li, K.J.; Wang, M.; Lee, W.J.; Gao, H.; Zhang, C.; Li, K. A bi-level program for the planning of an islanded microgrid including CAES. IEEE Trans. Ind. Appl. 2016, 52, 2768–2777. [Google Scholar] [CrossRef]
- Aliasghari, P.; Zamani-Gargari, M.; Mohammadi-Ivatloo, B. Look-ahead risk-constrained scheduling of wind power integrated system with compressed air energy storage (CAES) plant. Energy 2018, 160, 668–677. [Google Scholar] [CrossRef]
- Soroudi, A. Smart self-scheduling of Gencos with thermal and energy storage units under price uncertainty. Int. Trans. Electr. Energy Syst. 2014, 24, 1401–1418. [Google Scholar] [CrossRef]
- Akbari, E.; Hooshmand, R.A.; Gholipour, M.; Parastegari, M. Stochastic programming-based optimal bidding of compressed air energy storage with wind and thermal generation units in energy and reserve markets. Energy 2019, 171, 535–546. [Google Scholar] [CrossRef]
- Nojavan, S.; Pashaei-Didani, H.; Saberi, K.; Zare, K. Risk assessment in a central concentrating solar power plant. Sol. Energy 2019, 180, 293–300. [Google Scholar] [CrossRef]
- Wang, Y.; Zhang, N.; Kang, C.; Miao, M.; Shi, R.; Xia, Q. An efficient approach to power system uncertainty analysis with high-dimensional dependencies. IEEE Trans. Power Syst. 2017, 33, 2984–2994. [Google Scholar] [CrossRef]
- Denholm, P.; Wan, Y.H.; Hummon, M.; Mehos, M. The value of CSP with thermal energy storage in the western United States. Energy Procedia 2014, 49, 1622–1631. [Google Scholar] [CrossRef][Green Version]
- García, I.L.; Álvarez, J.L.; Blanco, D. Performance model for parabolic trough solar thermal power plants with thermal storage: Comparison to operating plant data. Sol. Energy 2011, 85, 2443–2460. [Google Scholar] [CrossRef]
- Rovense, F.; Reyes-Belmonte, M.A.; González-Aguilar, J.; Amelio, M.; Bova, S.; Romero, M. Flexible electricity dispatch for CSP plant using un-fired closed air Brayton cycle with particles based thermal energy storage system. Energy 2019, 173, 971–984. [Google Scholar] [CrossRef]
- Dominguez, R.; Baringo, L.; Conejo, A.J. Optimal offering strategy for a concentrating solar power plant. Appl. Energy 2012, 98, 316–325. [Google Scholar] [CrossRef]
- Pousinho, H.M.I.; Contreras, J.; Pinson, P.; Mendes, V.M.F. Robust optimisation for self-scheduling and bidding strategies of hybrid CSP–fossil power plants. Int. J. Electr. Power Energy Syst. 2015, 67, 639–650. [Google Scholar] [CrossRef]
- Zhao, Y.; Lin, Z.; Wen, F.; Ding, Y.; Hou, J.; Yang, L. Risk-constrained day-ahead scheduling for concentrating solar power plants with demand response using info-gap theory. IEEE Trans. Ind. Inform. 2019, 15, 5475–5488. [Google Scholar] [CrossRef]
- Hamilton, W.T.; Husted, M.A.; Newman, A.M.; Braun, R.J.; Wagner, M.J. Dispatch optimization of concentrating solar power with utility-scale photovoltaics. Optim. Eng. 2020, 21, 335–369. [Google Scholar] [CrossRef]
- Yu, D.; Ebadi, A.G.; Jermsittiparsert, K.; Jabarullah, N.H.; Vasiljeva, M.V.; Nojavan, S. Risk-constrained stochastic optimization of a concentrating solar power plant. IEEE Trans. Sustain. Energy 2019. [Google Scholar] [CrossRef]
- Du, E.; Zhang, N.; Hodge, B.M.; Wang, Q.; Lu, Z.; Kang, C.; Kroposki, B.; Xia, Q. Operation of a high renewable penetrated power system with CSP plants: A look-ahead stochastic unit commitment model. IEEE Trans. Power Syst. 2018, 34, 140–151. [Google Scholar] [CrossRef]
- Zhao, Y.; Liu, S.; Lin, Z.; Wen, F.; Yang, L.; Wang, Q. A Mixed CVaR-Based Stochastic Information Gap Approach for Building Optimal Offering Strategies of a CSP Plant in Electricity Markets. IEEE Access 2020, 8, 85772–85783. [Google Scholar] [CrossRef]
- Kazarlis, S.A.; Bakirtzis, A.G.; Petridis, V. A genetic algorithm solution to the unit commitment problem. IEEE Trans. Power Syst. 1996, 11, 83–92. [Google Scholar] [CrossRef]
- Safdarian, A.; Fotuhi-Firuzabad, M.; Lehtonen, M. A medium-term decision model for DisCos: Forward contracting and TOU pricing. IEEE Trans. Power Syst. 2014, 30, 1143–1154. [Google Scholar] [CrossRef]
- Imani, M.H.; Yousefpour, K.; Ghadi, M.J.; Andani, M.T. Simultaneous presence of wind farm and V2G in security constrained unit commitment problem considering uncertainty of wind generation. In Proceedings of the 2018 IEEE Texas Power and Energy Conference (TPEC), College Station, TX, USA, 8–9 February 2018; pp. 1–6. [Google Scholar]
- Ghadi, M.J.; Azizivahed, A.; Rajabi, A.; Ghavidel, S.; Li, L.; Zhang, J.; Shafie-khah, M.; Catalão, J.P. Day-Ahead Market Participation of an Active Distribution Network Equipped with Small-Scale Compressed Air Energy Storage Systems. IEEE Trans. Smart Grid 2020. [Google Scholar] [CrossRef]
- The GAMS Software Website. Available online: http://www.gams.com/dd/docs/solvers/cplex.pdf (accessed on 20 December 2020).
Publisher’s Note: MDPI stays neutral with regard to jurisdictional claims in published maps and institutional affiliations. |
© 2021 by the authors. Licensee MDPI, Basel, Switzerland. This article is an open access article distributed under the terms and conditions of the Creative Commons Attribution (CC BY) license (http://creativecommons.org/licenses/by/4.0/).