Abstract
The crucial design elements of a good capacity remuneration mechanism are market orientation, insurance of long-term power system adequacy, and optimal cross-border generation capacity utilization. Having in mind these design elements, this research aims to propose a financially fair pricing mechanism that will guarantee enough new capacity and will not present state aid. The proposed capacity remuneration mechanism is an easy-to-implement linear program problem presented in its primal and dual form. The shadow prices in the primal problem and dual variables in the dual problem are used to calculate the prices of firm capacity which is capacity needed for long-term power system adequacy under capacity remuneration mechanism. In order to test if the mechanism ensures sufficient new capacity under fair prices, the mechanism is tested on the European Network of Transmission System Operators for Electricity (ENTSO-E) regional block consisting of Austria, Slovenia, Hungary, and Croatia with simulation conducted for a period of one year with a one-hour resolution and for different scenarios of the credible critical events from a standpoint of security of supply; different amounts of newly installed firm capacity; different short-run marginal costs of newly installed firm capacity; and different capacity factors of newly installed firm capacity. Test data such as electricity prices and electricity load are referred to the year 2018. The results show that the worst-case scenario for Croatia is an isolated system scenario with dry hydrology that results with high values of indicators expected energy not served (EENS), loss of load expectation (LOLE), and loss of load probability (LOLP) for Croatia. Therefore, new capacity of several hundred MW is needed to stabilize these indicators at lower values. Price for that capacity depends on the range of installed firm capacity and should be in range of 1000–7000 €/MW/year for value of lost load (VoLL) in Croatia of 1000 €/MWh and 3000–22,000 €/MW/year for VoLL of 3100 €/MWh that correlates with prices from already established capacity markets. The presented methodology can assist policymakers, regulators, and market operators when determining capacity remuneration mechanism rules and both capacity and price caps. On the other hand, it can help capacity market participants to prepare the most suitable and near-optimal bids on capacity markets.
1. Introduction
A few decades ago, a debate between policymakers and researchers started on whether or not the energy-only markets are sufficient for tackling missing money problem [1]. Namely, there are a lot of existing power plants that are needed in very few periods and generally have factor. Therefore, these power plants with rather high marginal costs cannot cover long term costs in energy-only markets. In other words, a need for capacity markets has emerged. A good capacity remuneration mechanism (CRM) ensures long-term power system adequacy, optimal cross-border generation capacity utilization, and market orientation [2]. Consequently, it financially values firm capacity (FC) and encourages sufficient capacity to remain active or attracts investments in new capacity without undermining the competitiveness of existing electricity markets (forward, day-ahead, intra-day, and balancing markets). An increased number of states have introduced CRMs to ensure generation adequacy [3,4], i.e., to ensure that in medium and long term the power system can supply the aggregate electricity demand at all times while accounting for scheduled and reasonably expected unscheduled outages of power system elements [5,6]. Generally, a CRM provides additional income to the capacity providers on top of the income obtained from selling electricity. In return, they are maintaining existing FC or invest in new FC. The various CRM designs attracted attention from various countries with the overview given in [7]. The preferred CRM design characteristics could be found in [8] in a form of the reference model for European capacity markets. Further interesting research could be found in the following papers. In [9], the impact of coordinated and uncoordinated CRMs on the generation adequacy and the competition (on the European level) is analyzed. The study concludes that coordinated CRMs have a great potential for increasing cross-border synergies and cost savings while uncoordinated and unilateral implementations lead to inefficiencies (such as free-riding effects) and endanger the security of supply due to adverse allocation of FC. A similar study on the issue of CRM cross-border effects is done in [10], more specifically, the impact of the unilateral implementation of a CRM on the neighboring market. A more recent study in CRM cross-border effects is given in [11] where the impact of the particular CRM design on the cross-border sharing of generation resources is addressed. In the same paper, a new CRM design is proposed which alleviates missing money problem and the problem of cross-border participation. The regulatory basis for the effective participation of foreign agents in national CRMs is discussed in [12], where it is argued that a stronger coordination of transmission system operators (TSOs) should be required, and a new type of firm cross-border nominations linked to the CRMs commitments should be introduced. Those nominations could be considered only in situations of system stress and no ex-ante cross-border capacity reservations would be needed.
The main problem that is targeted by this paper is the suitability of pricing mechanisms in the scope of CRM in Croatia and neighboring power systems. The aim is to propose and develop such financially fair pricing mechanism that will guarantee sufficient new capacity, will not present state aid, and is financially fair. In the center of this research is the equilibrium pricing of FC through the shadow pricing of remaining margin (RM) which is a deterministic indicator for generation adequacy assessment. The proposed method is easy to implement in existing security-constrained unit commitment (SCUC) problems.
1.1. Related Works
This section provides a brief literature review on most relevant pricing mechanisms that are already introduced in several countries or investigated in other papers. The long-term analysis can be found in [13] where optimal levels of investments in FC are identified till 2030 to ensure capacity adequacy. Moreover, the optimal CRM design is identified with the discussion on the implications of non-harmonized remuneration across the EU states. In [14], further long-term planning is conducted in the case of Polish power system expansion. Here, another insight on how to provide generation adequacy by simultaneously considering long-term and short-term needs is given. The same authors proposed in [15] a CRM design whose goal is to remunerate higher those technologies which are flexible, ecological, and have a more valuable location. Interesting research is conducted in the [16] on the case of the Nordic countries where the methodology for assessing the impact of the CRMs on the power system dispatch is given. Ref. [17] discusses the issue of generation adequacy in systems with a high share of hydro or renewable energy resources (RES). The paper recommends possible CRM designs to alleviate issues regarding generation adequacy in such power systems. The paper also provides case studies of Brazil and Iceland which represent a large and small renewable and hydro-based power systems. In [18], the effectiveness of a CRM such as strategic reserve in the presence of a high RES share is studied. Another example of issues regarding generation adequacy can be found in [19], where a scenario analysis for various CRM designs is conducted in the case of Belgium. The same authors gave their point of view on the effects of non-harmonized CRMs on the generation adequacy in an interconnected power system in [20]. In [21], a capacity obligation mechanism is analyzed in the context of generation adequacy on the French case. In [22], the main lessons from Great Britain’s capacity market could be found. An expert survey on the capacity markets in the United States with suggestions and lessons for the European Union (EU) is provided in [23]. In [24], various CRM designs are analyzed in Great Britain’s case. Firmness or reliability issues of FC are addressed in [25] where a novel approach is proposed for allocating the cost of operating reserve among the electricity customers according to their reliability requirements. An interesting approach based on reliability payments to FC for supply reliability is proposed in [26]. On the other hand, ref [27] analyzes the impact of penalty schemes to improve the firmness of the acquired FC. A different view on the same issue was conducted in [28] where electricity consumers can set their costs and reliability requirements by selection among different suppliers. In [29], a capacity oversupply resulting from the Russian CRM design is addressed. The impact of CRM designs (capacity market and strategic reserve mechanism) on the investment in FC is studied in [30]. General issues regarding CRMs such as missing money, missing market problems, and problems of over-estimation of the “loss of load events” and capacity over-procuring are addressed in [31].
Three commonly used major adequacy indices, loss of load probability (LOLP), loss of load hours (LOLH), and loss of load expectation (LOLE) were studied in [32] where wind power adequacy, considering wind power unpredictability, is estimated using a multivariate model of wind power plant output that is based on indexed semi-Markov chains (ISMC). A case study of the Moroccan power system that assesses adequacy risk that results from volatile RES is presented in [33]. The paper analyzes the role of thermal energy storage (TES) in combination with concentrated solar power (CSP) while optimizing production cost that is affected by variability associated with solar technologies. Work presented in [34] focuses on energy storage systems (ESS) and their role and potential for balancing the volatile nature of RES that consequently provides benefits for power system adequacy and stability. Again, the LOLP is used as the operational adequacy index that relates to the risk of variations in load and electricity production. In addition to discussion on ensuring of FC in CRMs, several papers assessed the potential of participation of storage technologies in a power market with CRM [35]. Results of a case study for northern Europe showed that the participation of storage units can reduce the need for mid-merit and peaking thermal generation capacity. Moreover, due to the significantly different costs and round-cycle efficiencies, one of the findings was that batteries and reversible hydro energy storage can complement each other in business opportunities. The issue of coexistence of systems with CRMs, and systems with “energy-only markets” (where generators can rely only on their earnings from sales on power markets), was well discussed under the EU’s internal electricity market framework [36]. The goal of the EU internal electricity market is to enable short-term markets to improve liquidity and competition and provide market signals that should allow participants to recover their costs. Therefore, CRMs are allowed for the systems where there are resource adequacy concerns. The assessment of adequacy concerns is carried out EU-wide but can be complemented by national assessments. In the case of establishment of CRMs, cross-border participation should be allowed to the degree possible, which is calculated by the TSOs. Recent assessment of CRM in Spain (based on targeted capacity payments [37,38]) suggests that CRMs should reflect the uncertainty of the system’s evolution, that hedging alternatives could be needed to ensure cost recovery for new generators. The analysis of a proposed CRM in Italy (based on central buyer [37,39]) suggests that the lag period of four years could not be long enough for planned projects to bid and that no adequacy or flexibility problems are expected in the near future. Bolton et al. [40] discussed the ambiguous nature of CRMs in the energy transition in Britain and Germany as CRMs are legitimized as a means of facilitating the integration of renewables, while at the same time they could be a risk to carbon lock-in. It is shown that CRMs are not static, and they co-evolve with energy systems and related policy.
1.2. Overview of Used Methods and Optimization Techniques
A survey on electricity market design with insights from theory and real-world implementation of CRMs is provided by Bublitz et al. [37]. There, six different types of mechanisms are differentiated and described: (1) tender for new capacity; (2) strategic reserve; (3) targeted capacity payment; (4) central buyer; (5) de-central obligation; and (6) market-wide capacity payment. Further, the overview of modeling approaches regarding the development of electricity market design with a focus on capacity remuneration mechanisms or generation adequacy is provided. It is evident that several modeling types were used in existing literature, including: analytical [41], system dynamics [42], agent-based [43], stochastic equilibrium [44], single-firm optimization [45], statistical [46], or combination of methods [47]. In general, there is no single-best method and policy makers can guide their decisions based on several comparative approaches. The modeling approach used in this paper is based on the analytical method, where the cost of FC is estimated through the duality-based equilibrium pricing.
Historically, a lot of metaheuristic methods have been used for optimization problems in power systems such as evolutionary optimization algorithms, genetic algorithms, artificial neural networks, particle swarm optimization, etc. There are also some most novel approaches such as Mendelian evolutionary theory optimization algorithm [48], plant biology-inspired genetic algorithm: superior efficiency to firefly optimizer [49], and evolutionary optimization based on biological evolution in plants [50]. These techniques may be used in future work for solving generation adequacy issues in power systems. The presented method is a linear program form solved with simplex algorithm under CPLEX solver which enables global optimum to be achieved. In contrast to electricity market short-run hourly prices prediction using neural networks such as [51], it is still impossible to use a similar approach for CRM market prices. The reasons for this are that CRM prices are set and fixed for several years and also that there is not enough available historical data to train such neural networks. Some interesting insights for short term profit maximization can also be found in [52,53].
Duality-based optimization has been frequently used in power system related problems. Some examples are following. In [54] where authors have been using linear programming approach, in primal problem, a short-run profit maximization problem of coordinated hydro-wind operation was conducted while dual formulation is used for evaluation of the values of limited hydro and wind resources. The strong duality theorem for solving linear robust optimization for the reactive power optimization of islanded microgrids was used in [55]. Another example of applying strong duality theorem is presented in [56]. The paper focused on energy storage arbitrage issue to maximize the revenue in power systems with high wind penetration levels. Paper [57] proposes an updated duality-based method for solving optimization problems related to optimal power flows. The proposed method has proven to be very efficient especially in cases of numerous thermal-limit constraints. Model and conventional real-time pricing for automated double auction mechanism is presented in [58] with its primal and dual formulation. An algorithm based on a series of dual problems using min-max optimization with related primal and dual formulation is presented in [59] that is motivated by peak-demand minimization. A method that can guarantee zero duality gap in non-convex optimization problems is presented in [60].
1.3. Novelty and Originality
This research contributes to the approach for pricing of FC through the duality-based method for pricing of RM based on the shadow price, a method that has not been used for this purpose so far. Furthermore, the paper provides the reformulated dual problem in such a way that it provides interesting and new insights which will enable easier implementation of the proposed method in existing SCUC problems. The method is characterized by transparent and market-oriented pricing which ensures that the remuneration, which the provider of FC obtains, is not state aid and is financially fair. The final dual problem is in a much simpler form compared to primal. That allows easier computer implementation and reduced execution time, and it enables understanding of dependencies between dual variables since there is a clear set of inequations explaining them. The presented method and insights could be useful and assist entities involved in power market such as policy makers, regulators, and market operators. The method and insights are valuable for defining CRM mechanism and both capacity and price caps and other crucial design elements of a good CRM defined by ENTSO-E target methodology for adequacy assessment [6], which are market orientation, insurance of long-term power system adequacy, and optimal cross-border generation capacity utilization. The paper also gives the case study where the proposed method is tested on the model of ENTSO-E regional block consisting of Austria, Slovenia, Hungary, and Croatia with some interesting results and discussion.
The rest of the paper is organized as follows. In Section 2, the mathematical framework for the obtainment of FC prices is established. The framework consists of a mid-term cost minimization primal problem and its dual for the duality-based method for shadow pricing. They are set as the doubly infinite linear programming problems because of continuous time-dating (see [54,61]). In Section 3, the method is tested on the case of the EU’s regional block. The simulation is conducted over the period of one year with a one-hour resolution for (i) the credible critical events from a standpoint of security of supply; (ii) different amounts of newly installed FC; (iii) different short-run marginal costs of newly installed FC; and (iv) different capacity factors of newly installed FC. The results are presented and comparison with state-of-the-art results from already established CRM markets is provided in Section 4. Discussion on obtained results is given in Section 5. Section 6 concludes the papers.
2. Formulation of Primal and Dual Problem as a Method for Pricing Firm Capacity
The mid-term cost minimization primal problem in (1)–(16) is formulated for the needs of obtaining its dual. The dual, to the primal problem, has a purpose of (financial) valuation, i.e., shadow pricing of the limited resources (constraints in primal problem) in a power system. In order to achieve strong duality, the primal problem has to be convex and needs to satisfy Slater’s condition. The primal problem used here is a linear program, meaning it is convex and it satisfies linearity constraint qualification, which is sufficient condition for strong duality. The dual is formulated as shown in (17)–(22). In dual, the FC is priced at the value of shadow price,, of the remaining margin (RM) (shown in (8)) which is a deterministic indicator for adequacy assessment recommended by ENTSO-E Pan-EU target methodology [5,6]. The is measured in €/MW and it is an equilibrium price since it ensures that the generation capacity supplied is equal to the capacity demanded. In order to obtain equilibrium prices of FC, , the relations between reliability indicators from [5,6] are redefined as seen in Figure 1 and Equations (8)–(16). The idea behind this method is to use the main deterministic indicators for adequacy (reliability) assessment recommended by ENTSO-E Pan-EU target methodology [5,6] and to determine their shadow prices through the duality-based method. In addition, for more on the used ENTSO-E indicators shown in Figure 1, consult [5,6]. Figure 1 shows the adequacy assessment indicators used in (1)–(22) and their relation to each other. A short explanation is given here. The NGC measured in terms of power (MW) is a net generating capacity in the power system, i.e., total installed power in the system; NuC (MW) is a non-usable capacity in the power system that consists of all kinds of mothballed units and units with all kind of limitations due to unavailability which mostly consists of capacity in hydro units due to unavailable water and capacity of wind units due to low-capacity factor of such units. SC (in MW) is spare capacity in the power system and reflects the additional capacity which should be available in the power system to cope with any unforeseen extreme conditions. Usually, SC is defined as 5% of NGC. SSR (in MW) is a system services reserve such as regulation and spinning reserve in the power system used to ensure short-term security. Overhauls and outages represent the total capacity unavailable due to outages and overhauls in the power system at the time period in question which reduces the NGC alongside SSR and NuC. The UC is the unusable capacity which sums the SSR, outages, overhauls, and NuC capacity in one indicator, also in MW and is defined by Equation (11). RAC (MW) is a reliable available capacity (defined in Equation (10)) and as the name suggests, this capacity should be available at all times. It is obtained by subtracting the UC from NGC as seen in (10). The RM (MW) is remaining margin obtained by subtracting the electricity demand (load) from RAC and here is redefined according to Equation (15). The further explanation of indicators and their relation to each other is left for Section 2.1 where extensive discussion is provided.
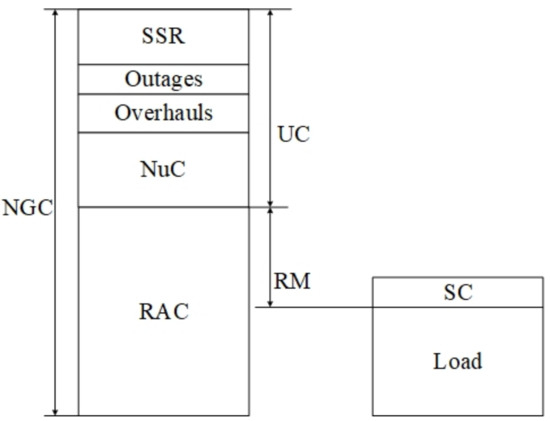
Figure 1.
ENTSO-E deterministic indicators for adequacy (reliability) assessment.
First, let’s define the framework and for clarity we will assume one node which could represent one power system. For simplicity, a multi-node model will be explained in a later section. The set is used for indexation of generators connected to node . In Inequation (3), the represents the power output of generator , and expression defines power outputs of each generator connected at node as decision variables. The power output is defined over a time horizon and is measured in MWh.
The generator power output, , is limited by maximum and minimum generator limits and as seen in (4). In addition to the ith generator’s maximum and minimum capacity and , the range of generation is also restricted by the footroom and headroom of regulation and spinning reserve . The ramp-rate limits are excluded from the presented model due to clarity (see [37,38] for ramp-rate, regulation and spinning reserve models).
The term in (1) and (9) is a short-run marginal cost function of generator and is expressed in €/MWh. is assumed as a constant term in order to preserve linearity in the problem. The short-run cost function of electricity generator in (9) is measured in € and is obtained by product of short-run marginal cost (€/MWh) and power output (MWh) as defined by Equation (9). As shown in (2), the goal of this optimization is to minimize total short-run costs of the system over entire time horizon and over all power outputs,, of generators connected to node , .
With Inequation (5), a supply-demand balance is ensured. On the left-hand side (LHS) there is a total generation in node k in time period t and on the right-hand side (RHS) there is electricity demand in node at time period t, Demand is defined as an input data in (1) and is measured MWh.
Values of and in (1) represent the minimum regulation and spinning reserve requirement at node set by TSO. The required and values are used as LHS values Inequations (6) and (7) in order to ensure that total system regulation capacity in time period is greater than the required regulation capacity in each node The Inequation (7) ensures that spinning reserve, , of the generators providing it in kth node is greater than required value for each time period . In Equation (13), the sums the input data and while is a sum of the current level of regulation capacity and spinning capacity , in the system in time period as seen in (12). The SSR is used to ensure short-term security while the RM is used for long-term adequacy.
As an input data in (1) the available demand response , and non-usable capacity in node k should be entered as an input data. Finally, the level of required firm capacity in the node should be entered.
The shadow price of Inequation (8) will serve as the price of firm capacity (FC). This assumption is justified since the remaining margin (RM) is assumed to be able to provide long-term firmness [5,6] and because RM encapsulates FC as seen in Equation (15). In order to formally define the RM, it is assumed that it could consist of various combination of capacity reserved in demand-side management (DSM), spare capacity (SC), and firm capacity (FC) as shown in (15). The SC is defined as 5% of NGC in Equation (14) (generally, SC comes in addition to SSR and margin against seasonal peak load (MaSPL) and gives the additional capacity which should be available in the power system to cope with any unforeseen extreme conditions [5,6]). For the RM, it could be required to exceed the load by 10% as required in (16). The electricity price, , is defined over and is in €/MWh. The prices of regulation, , spinning reserve, , and firm capacity, , are defined over and are measured in €/MW. These prices are the shadow prices of Inequations (5)–(8) which we aim to obtain. Notably, for the Inequation (8), its shadow price serves as the price of FC. The final primal problem is shown with expressions (1)–(16). The variables denoted after the “;” are the shadow prices associated with the constraints.
Given
minimize
over
subject to
where
In order to obtain a dual problem, (8) needs a reformulation since it needs to be expressed by structure variables of the primal problem, in this case and . In order to achieve this, few analytical manipulations of Inequation (8) are needed, which resulted in being paired with instead , thus the pairing . The generator lower capacity limit, , is paired with the, , and this paring is denoted by . The is the turbine upper capacity limit, therefore pairing is . Other pairings are , and . The pairing means the price variable is in some relation to variables and . However, it is not clear how this relation looks and in order to find it, a dual problem (17)–(22) is needed where these dependencies could be identified. The final dual problem is in a much simpler form compared to primal and some input data are not needed since dual variables are not dependent on them. This insight is obtained after the dual is crated. The simpler form of the dual means easier computer implementation, reduced execution time and it enables understanding of dependencies between dual variables since there are clear Inequations (20)–(22) explaining them. Moreover, it is possible to conduct analytical manipulations on these inequations in order to obtain some other useful insights on how dual variables affect each other.
The goal function in (18) is a linear expression where dual variables from (19) are multiplied by parameters in (17). This goal function is then maximized in order to determine the optimal value of dual variables in (19) which then represent the shadow prices of Inequations (4)–(8). The dual goal function financially values fixed resources of the power system in the following way. Total financial value of the regulation is ; total financial value of the spinning reserve is ; total financial value of the generation turbine capacities is ; total financial value of electricity generation is ; and total financial value of the firm capacity is . The final dual problem is:
Given
maximize
over
subject to
2.1. Discussion
2.1.1. Goal Function in Primal
The mid-term cost minimization primal problem should consider various costs in its goal functions, such as the cost of penalization of unserved energy, the cost of penalization of RM not met, and start-up costs [62]. However, for clarity, the presented goal function in (2) consists only of the short-run total cost of generation, , calculated for each time step. Expression (2) is minimized over power outputs,, of generators connected in node , .
2.1.2. Equilibrium Pricing of Firm Capacity
In order to price FC, i.e., determine its price in a transparent and competitive way, there is no better way than the method for pricing energy and ancillary services in uniform-pricing auction markets. In uniform-pricing auction markets, the prices of electricity and ancillary services are set at the shadow price of the market-clearing constraints shown in (5)–(7) and these prices are considered equilibrium prices since they are actually a price where the merit-order curve and aggregated demand curve intersect. Therefore, the price of FC is set in the same way, i.e., as the shadow price, , of clearing constraint (8). Therefore, it is also an equilibrium price since it enables the generation capacity supplied is equal to the capacity demanded. It is important to notice that equilibrium price, , depends on the values of electricity and ancillary services equilibrium prices as can be easily seen in dual Inequalities (20)–(23), since it assumes the market is cleared simultaneously. A dual problem and its Inequalities (20)–(23) means that the obtained optimal solution is tractable which helps in easier understating of CRM prices and market and ancillary services prices and their interdependence.
2.1.3. More Than One Node and Cross-Border Participation
For several nodes, , goal function in (2) should be replaced with and vector should be replaced with . Furthermore, constraints (23)–(24) should be added. The (23) restricts the power flow in a direction from the node to at the values of the available transfer capacity, , between nodes and . The is a power flow in line connected to the kth node. The is the value of the Lagrange multiplier or shadow price in €/MW associated with the (sometimes referred to as the flow gate right (FGR) price). Inequation (24) is the energy balance equation for kth node. is the set of incidence power lines with node .
2.1.4. Cross-Border Participation
If there is no FC in the node , then the FC should be obtained from other nodes, , incident to the node , . The reserved cross-border capacity for FC from abroad could be treated as transmission reliability margin (TRM) which covers the forecast uncertainties of cross-border power flows due to imperfect information from market subjects and other unexpected real-time events. Alternatively, more suitably, as it is done here, it can be treated as a notified transmission flow (NTF) as in (27) which is the already occupied part of net transfer capacity (NTC) by the previously allocated capacities whose fees (€/MW) are a result of the auction mechanism for cross-border transmission capacity allocation. In both cases, the FC from abroad countries will reduce available transfer capacity between nodes and according to (25). Where is net transfer capacity between nodes and defined by (26), notified transmission flow between nodes and , is total transfer capacity, and is transmission reliability margin between nodes and . The in (27) is FC reserved in node for the needs of node .
where
2.1.5. Issues in Cross-Border Participation
The extensive ex-ante cross-border capacity reservation for abroad FC will mean higher fees for procurement of cross-border capacity and would increase/decrease nodal prices, depending on the merit order in a particular node. This will result in a higher congestion surplus. On the other hand, it would give an initiative for investing in new FC in nodes where generation adequacy is endangered, or alternatively, could encourage system operators to invest in additional cross-border capacities. This ex-ante approach would undermine and exaggerate a negative impact on the competition of existing electricity markets (forward, day-ahead, intra-day and balancing markets) in the short-term. In the long-term it will provide initiative for additional FC or NTC, therefore solving the long-term generation adequacy issues.
2.1.6. Practical Implementation
CRMs could be based on many approaches and various pricing methods. If they are not already, the presented method can help them become market-oriented. The discretization can be done with the various time resolutions (5 min, half an hour, hourly, daily). The FC prices in (€/MW) could be averaged over a day or week resulting in daily, monthly, yearly remuneration (€/MW/day), (€/MW/mo.), (€/MW/yr.). The implementation of primal problem for calculation of CRM prices for FC is simple since most of the needed equations are already available in current market clearing and unit commitment algorithms used on most power and ancillary services markets around the world and those equations/inequations which are not available are simple and easy to implement as seen in (1)–(16). The prices, of FC are then easily obtained since tools for modeling and optimization usually enable readout of the shadow prices for each constraint. On the other hand, the final dual problem in (17)–(22) is in a much simpler form compared to primal which means easier computer implementation and reduced execution time. A dual problem and its Inequalities (20)–(23) means obtained optimal solution is tractable which helps in easier understating of interdependence between CRM prices, market, and ancillary services prices.
3. Case Study
In this research, a regional block level is used and the regional block of Austria, Slovenia, Hungary, and Croatia is identified. This regional block presents a logical transmission interconnected region with Croatian power system as the focal point and considering existing interconnection transmission lines towards neighboring power systems (Figure 2). The power system of the regional block is modelled as a DC network optimal power flow with one-hour resolution. The test data (market prices, electricity load, etc.) refer to year 2018 and the optimization period was one year. The Available Transfer Capacity (ATC) approach for cross-border participation is used. This is mostly in line with the current situation in the regional block where prices are calculated with the EUPHEMIA algorithm used for price coupling of regions [63]. The method is tested on the regional block and three possible outcomes of the regional block: reference regional model (Figure 3a); regional (Figure 3b) model; and model of isolated power systems (Figure 3c).
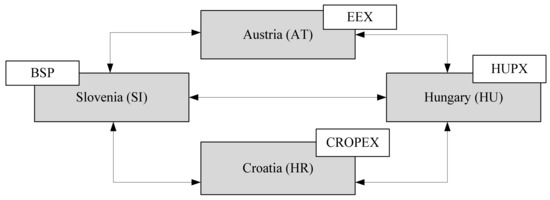
Figure 2.
Depiction of the regional block consisting of Austria (AT), Slovenia (SI), Hungary (HU), and Croatia (HR) and possible power flows between countries.
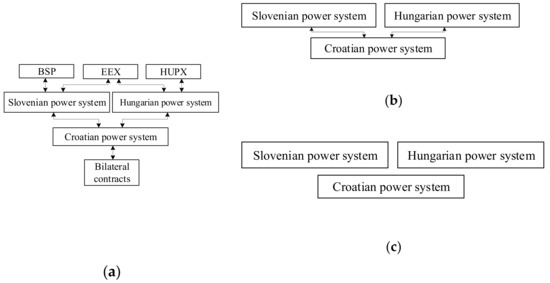
Figure 3.
Flow diagram depicts possible power transactions and power flows between power systems and energy markets in (a) reference regional model; (b) regional model; and (c) model of isolated power systems.
The current situation is best represented by the reference regional model. The Croatian power system is connected to the power systems of the neighboring countries and consequently to the power systems of the rest ENTSO-E power systems. Input data for modeling Croatian power system is based on the existing inputs gathered for the development of Croatian power system strategic documents and can be found in [64]. Typically, Croatian system load ranges from 1000 to 3200 MWh/h [65] and annual net consumption is around 17.0 TWh [66] Croatia also has substantial net cross-border transmission capacity towards Bosnia and Herzegovina, Serbia, Slovenia, and Hungary, which in total ranges from about 3600 MW to 4400 MW [65]. The regional model has the same assumptions as to the reference regional model with the only differences that the electricity markets are excluded. The model of isolated power systems lacks both electricity markets and interconnectors. The considered electricity markets are Croatian CROPEX, Slovenian BSP South pool, European energy market EEX, and Hungarian energy market HUPX. Therefore, BSP South pool is defined as a power market associated with the Slovenian power system with 1200 MW of maximum purchase/sell. The HUPX is a power market associated with Hungarian power system with 2500 MW of maximum purchase possible. The EPEX is a middle European power market and among other power systems, it is also associated with Slovenian and Hungarian power systems on which these systems can obtain the maximum purchase of 1100 MW for Slovenia and 950 MW for Hungary at any moment. The price of electricity is of hourly resolution and is defined over one year (prices are based on historical data for year 2018). The bilateral agreements for the delivery of energy to the Croatian power system are also modeled and it has been established that there are 200 MW to 300 MW of bilateral contracts to supply the baseload in Croatia over one year. Thus, in this research, the conservative amount of 200 MW on the yearly basis was taken as input data, with the energy equivalent of 1.75 TWh and the price of 60 €/MWh. The current RM is 300 MW for Croatia, 200 MW for Slovenia, and 600 MW for Hungary. They are modeled conservatively, accounting 10% of yearly load peak of respective power systems. The parameters which characterize these power plants in the model are technical minimum (MW); installed power (MW); the fixed cost of production and maintenance (€/kW/year); short-run marginal cost (€/kWh); and start-up cost (€). Hydropower plants are grouped according to the basins they belong in. The reference regional model, regional model, and the model of isolated power systems are assessed in the context of five possible events which can occur:
- (1st) The first event of the possible future state consists of outcomes: prolongation of the current situation, which translated in the extension of a decision of decommissioning of thermal power plants and nuclear power plants Krško and Paks.
- (2nd) The second event of the possible future state consists of the outcomes: decommissioning of nuclear power plant Krško and decommissioning of nuclear power plant Paks.
- (3rd) The third event of the possible future state consists of outcomes: decommissioning of thermal power plants which will be at the end of life by the year 2025, and there is no commissioning of new power plants by the year 2025.
- (4th) The fourth event of the possible future state consists of outcomes: decommissioning of thermal power plants which will be at the end of life by the year 2025; no commissioning of new power plants by the year 2025; decommissioning of nuclear power plant Krško, and decommissioning of nuclear power plant Paks.
- (5th) The fifth event of the possible future state consists of outcomes: decommissioning of thermal power plants which will be at the end of life by the year 2025; no commissioning of new power plants by the year 2025; decommissioning of nuclear power plant Krško; decommissioning of nuclear power plant Paks; and dry year.
In addition to the previous five events, models are assessed for the different amount of newly installed FC; different capacity factors of newly installed FC; and different short-run marginal costs of newly installed FC.
4. Results
The presented results were obtained on 3.4 GHz based processor with 8 GB RAM using CPLEX solver. For clarity and readability, only the worst-case scenario results are shown. The prices are shown as a yearly average in order to get meaningful insights. Figure 4 shows the FC prices for various levels of installed FC. It is assumed the FC is installed in Croatian power system, since Croatia had the most endangered generation adequacy in the regional block. As already stated, there are three possible outcomes of the regional block: reference regional model, regional model, and model of isolated power systems. After a comparison of numerous possible scenarios, the identified worst-case scenario for Croatia is the model of isolated power systems, with 2nd event and dry year. Namely, in the Croatian power system, production from hydropower plants varies from around 4 TWh in dry year to around 8 TWh in wet year. Figure 5 shows the yearly capacity factors (CF) of the newly installed FC for various short-run marginal cost, , of FC. Results are shown for all three model outcomes where a decrease of CF can be observed as installed FC rises. The results in Figure 6 show an exponential relationship of the probabilistic generation adequacy indicators EENS (Figure 6a), LOLE (Figure 6b), and LOLP (Figure 6c) with the amount of FC.
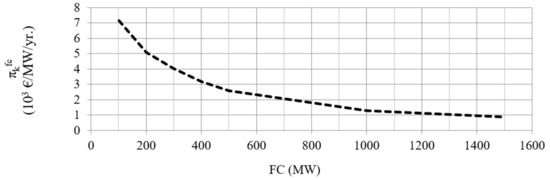
Figure 4.
The firm capacity (FC) prices in the Croatian power system assessed for the worst-case scenario.
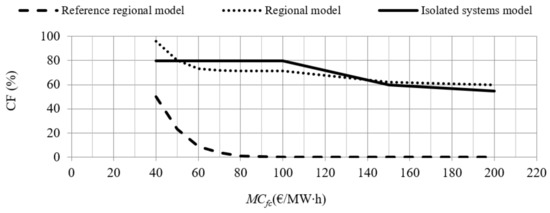
Figure 5.
The capacity factor (CF) of a newly installed FC in the Croatian power system for different assessed for model outcomes.
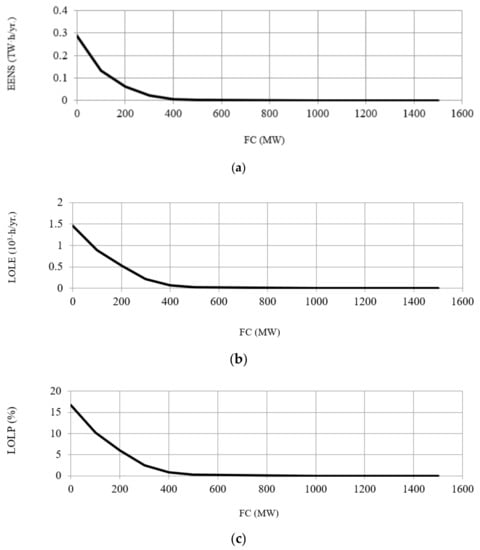
Figure 6.
The probabilistic reliability indexes (a) expected energy not served (EENS); (b) loss of load expectation (LOLE); and (c) loss of load probability (LOLP) for the Croatian power system assessed for the model of isolated power systems and worst-case scenario.
From Figure 4, it is evident that the prices of new FC are highly dependent on the value of new FC. Therefore, prices can be as high as 7000 €/MW/year for FC value around 100 MW and as low as 1000 €/MW/year for FC values greater than 1300 MW, but the most volatile part of curve is for values of FC below 500 MW. These values are obtained for a default value of VoLL (value of lost load) of 1000 €/MWh.
Capacity factor of the new FC is more resilient on its own short-run marginal cost,, the value in isolated systems and regional model is slowly decreasing from 80–100% towards 60% with increasing from 40 €/MWh to 200 €/MWh. On the other hand, in the reference regional model, the capacity factor of new FC drops very fast to zero ( equals 80 €/MWh) and is well below CF values compared to the other two outcomes (even for low values). The reason for this is better interconnection of the regional block with surrounding markets (Figure 5).
As expected, increasing value of FC decreases values of all three indicators (Figure 6). EENS drops from around 0.3 TWh to zero when FC equals 400 MW. LOLE drops from 1500 h to zero when FC equals 500 MW. LOLP decreases from 17% to zero when FC equals 500 MW.
As it can be seen from Table 1, CRM prices for new build differ largely between different countries. In addition to the VoLL parameter, geographical position, generation mix, interconnection, and detailed specifications of CRM mechanism in charge affect these values. Therefore, there cannot be identified certain narrow price range of FC and the conclusion can be derived that these prices are very country specific. Additionally, CRM pricing mechanisms and auctions are rather immature and need more time to adjust and develop in the right directions when it is expected that prices will more converge. It is also evident that results obtained for the Croatian case are in order of magnitude of other examined countries that can give some confidence and validation for the proposed model in this paper. When adjusted to the benchmark VoLL for Croatia [67], the FC price ranges from around 3000 to 22,000 €/MW.

Table 1.
Comparison of FC prices for different countries and capacity remuneration mechanisms (CRMs).
5. Discussion
5.1. Exponential Price Decrease
In Figure 4, results are shown for the worst-case scenario which is the model of isolated power systems, the 2nd event and a dry year. A noticeable drop in Croatian FC prices due to the increase of a newly installed FC is observed. The dependence is almost exponential. The prices are shown as a yearly average. It can be observed that FC price decreases from 7000 €/MW/year to 1000 €/MW/year as installed FC increases from 100 MW to 1500 MW. This is the case when Croatian VoLL is set at 1000 €/MWh. When Croatian VoLL is set at 3100 €/MWh as in Table 1 then FC price decreases from 22,000 €/MW/year to 3000 €/MW/year as installed FC increases from 100 MW to 1500 MW. This clearly shows the effects of the overcapacity.
5.2. Law of Diminishing Marginal Utility
In Figure 5, it can be observed that after the FC passes the 500 MW limit, the generation adequacy indicators diminish to almost zero. After the 500 MW limit, there is no additional improvement of generation adequacy which can be explained by the law of diminishing marginal utility. The reasonable level of new FC in case of Croatian power system could be set at 500 MW.
5.3. Capacity Factor
In Figure 4, the CF of a FC decreases as installed FC rises. For the worst-case scenario, the CF of the new plant is always above 50% (in most cases even higher than 60%) regardless of the value of .
5.4. Expected Price and Revenue
In order to mitigate generation adequacy issues the new power plant of 500 MW with the range of short-run marginal costs from 40 €/MWh to 200 €/MWh could mitigate generation adequacy issues. This new plant would have capacity factor from 10% to 50% (depending on the scenario) and would earn in average €2,500,000.00 per year (5000 €/MW 500 MW) from the CRM market at VoLL of 1000 €/MWh in Croatia.
5.5. Practical Application
The presented methodology in this paper can have benefits for several entities involved in power market. First, it can assist policy makers, regulators, and market operators when determining CRM rules and both capacity and price caps. On the other hand, it can help capacity market participants to prepare most suitable and near-optimal bids on CRM.
6. Conclusions
This research contributes a duality-based method for equilibrium pricing. It systematically and transparently determined the price of a firm capacity based on the shadow pricing in the dual problem. A capacity remuneration mechanism whose design is based on the proposed method is transparent and market oriented. This ensures that the remuneration, which the provider of firm capacity obtains, is not state aid and is financially fair. The case study tests the proposed method on the model of ENTSO-E regional block with the mid-term planning horizon and hourly resolution. The case study results show a noticeable drop in the prices of firm capacity due to the increase of a newly installed firm capacity. The required level of newly installed firm capacity in the regional block necessary to ensure satisfactory generation adequacy affects CRM prices greatly and they range from around 1000 to 7000 €/MW/year for Croatian VoLL of 1000 €/MWh and 3000 to 22,000 €/MW/year, when adjusted to the VoLL of Croatia at 3000 €/MWh. These payments ensure that regardless of the short-run marginal cost this new plant would work from 10% to 50% of the time and would earn a significant income per year from the CRM market. For example, if 500 MW of new capacity is built it will earn an average € 3,900,000 per year from capacity market regardless of its capacity factor.
In cases different from worst-case scenario, needs for FC and corresponding prices are lower. It is due to fact that Croatia is well interconnected regionally. The other important aspect is that almost half of installed power capacity (around 2 GW) is in form flexible hydropower plants that can provide significant adjustments and system adequacy. Still, due to fast-growing penetration of renewables, it is expected that capacity adequacy will become a larger issue in years to come and be valuable for several entities involved in power market. First, it can assist policy makers, regulators, and market operators when designing CRM rules and capacity and price caps. Secondly, it can help capacity market participants in preparation of bidding strategies.
Future work includes research and application of CRM for the microgrids or energy islands. Due to the increased installations of distributed energy resources, energy markets are adapting and the users on the distribution grid are becoming active participants (prosumers) and providers of flexibility. These trends lead to new business models, such as peer-to-peer (P2P) electricity trading [69,70]. It is shown that these new business models can have beneficial impacts on the local supply-demand balancing and voltage levels [71,72,73]. In this context, it is worthwhile to explore potential to apply CRMs on the distribution grid, where feeders can be organized similarly as countries’ systems are on the macro scale and could provide adequate supply for local prosumers and auxiliary services to the rest of the system.
Author Contributions
Conceptualization, P.I.; formulation of the methodology, P.I.; validation of the methodology, P.I. and L.H.; results analysis P.I. and L.H.; data collection, P.I., I.R., and Ž.T.; writing—original draft preparation, P.I.; writing—review and editing, P.I., L.H., I.R., S.R., and Ž.T.; investigation, supervision, and paper review L.H., I.R., S.R., and Ž.T.; project administration, I.R. and L.H.; funding acquisition, I.R. and P.I. All authors have read and agreed to the published version of the manuscript.
Funding
This work was supported by the by Croatian Science Foundation under the project IMPACT—Implementation of Peer-to-Peer Advanced Concept for Electricity Trading (grant No. UIP-2017-05-4068).
Institutional Review Board Statement
Not applicable.
Informed Consent Statement
Not applicable.
Data Availability Statement
Not applicable.
Conflicts of Interest
The authors declare no conflict of interest.
Nomenclature
| Sets | |
| Set of generating units in node , | |
| Set of nodes, | |
| Set of incidence power lines with node , | |
| Planning interval | |
| Parameters | |
| Available transfer capacity between node and node (MW) | |
| Short-run total cost of electricity generation, , of the generator (€) | |
| Electricity demand in time in node (MWh) | |
| Capacity reserved in unit i and time t of demand side | |
| Power flow on the line to node in time (MW) | |
| Firm capacity reserved in unit in time step (MW) | |
| Maximal power output of the generator (MW) | |
| Short-run marginal cost of electricity generation, , of the generator (€/MWh) | |
| Minimal power output of the generator (MW) | |
| Net generation capacity in the node (MW) | |
| Net transfer capacity between nodes and (MW) | |
| Notified transmission flow between nodes and (MW) | |
| Non-usable capacity in the node (MW) | |
| System service margin for regulation reserve in node (MW) | |
| Reliable available capacity in node and time (MW) | |
| Remaining margin in node and time (MW) | |
| System service margin for spinning reserve in node (MW) | |
| Spinning reserve and regulation in time and node (MW) | |
| System service margin for spinning reserve and regulation (MW) | |
| Spare capacity in time and node (MW) | |
| Transmission reliability margin between nodes and (MW) | |
| Total transfer capacity between nodes and (MW) | |
| Unavailable capacity in time and node (MW) | |
| Variables | |
| Shadow price in time of unit maximum power output constraint (€/MW) | |
| Value of the Lagrange multiplier or shadow price in (€/MW) associated with the | |
| Shadow price in time of unit minimum power output constraint (€/MW) | |
| Shadow price in time of electricity generation in node (€/MW∙h) | |
| Shadow price in time of regulation reserve in node (€/MW) | |
| Shadow price in time of spinning reserve in time in node (MW) | |
| Shadow price in time of firm capacity in node (MW) | |
| Regulation reserve of generator in time (MW) | |
| Spinning reserve of generator in time (MW) | |
| Power generation of generator in time (MW) |
References
- Hildmann, M.; Ulbig, A.; Andersson, G. Empirical Analysis of the Merit-Order Effect and the Missing Money Problem in Power Markets with High RES Shares. IEEE Trans. Power Syst. 2015, 30, 1560–1570. [Google Scholar] [CrossRef]
- Keppler, J.H. Rationales for capacity remuneration mechanisms: Security of supply externalities and asymmetric investment incentives. Energy Policy 2017, 105, 562–570. [Google Scholar] [CrossRef]
- Billinton, R.; Allan, R. Power-system reliability in perspective. Electron. Power 1984, 30, 231. [Google Scholar] [CrossRef]
- Billinton, R.; Allan, R.N. Reliability Evaluation of Power Systems, 2nd ed.; Plenum Press: New York, NY, USA, 1996. [Google Scholar]
- (ENTSO-E), European Network of Transmission System Operators for Electricity. Scenario Outlook and Adequacy Forecast 2014–2030; ENTSO-E AISBL: Brussels, Belgium, 2014. [Google Scholar]
- (ENTSO-E), European Network of Transmission System Operators for Electricity. Target Methodology for Adequacy Assessment; ENTSO-E AISBL: Brussels, Belgium, 2014. [Google Scholar]
- Coibion, A.; Pickett, J. Capacity Mechanisms. Reigniting Europe’s Energy Markets; Linklaters: London, UK, 2014. [Google Scholar]
- Alba Rios, J.J.; Lopes, P.; Lorenz, G. A Reference Model for European Capacity Markets; EURELECTRIC: Brussels, Belgium, 2015. [Google Scholar]
- Bucksteeg, M.; Spiecker, S.; Weber, C. Impact of Coordinated Capacity Mechanisms on the European Power Market. Energy J. 2017, 40, 221–264. [Google Scholar] [CrossRef]
- Meyera, R.; Goreb, O. Cross-border effects of capacity mechanisms: Do uncoordinated market design changes contradict the goals of the European market integration? Energy Econ. 2015, 51, 9–20. [Google Scholar] [CrossRef]
- See, P.C.; Fosso, O.B.; Wong, K.Y.; Molinas, M. Flow-Based Forward Capacity Mechanism: An Alternative to the Regulated Capacity Remuneration Mechanisms in Electricity Market with High RES Penetration. IEEE Trans. Sustain. Energy 2015, 7, 830–840. [Google Scholar] [CrossRef]
- Mastropietroa, P.; Rodillaa, P.; Batlle, C. National capacity mechanisms in the European internal energy market: Opening the doors to neighbours. Energy Policy 2015, 82, 38–47. [Google Scholar] [CrossRef]
- Tasios, N.; Capros, P.; Zampara, M. Model-based analysis of possible capacity mechanisms until 2030 in the European internal electricity market. In Proceedings of the 11th International Conference on the European Energy Market (EEM14), Krakow, Poland, 28–30 May 2014; Volume 14, pp. 1–5. [Google Scholar]
- Wierzbowski, M.; Lyzwa, W.; Musial, I. MILP model for long-term energy mix planning with consideration of power system reserves. Appl. Energy 2016, 169, 93–111. [Google Scholar] [CrossRef]
- Musial, I.; Wierzbowski, M. A novel capacity remuneration mechanism for energy mix optimization. In Proceedings of the 2016 13th International Conference on the European Energy Market (EEM), Porto, Portugal, 6–9 June 2016; pp. 1–5. [Google Scholar]
- Jaehnert, S.; Wolfgang, O.; Doorman, G.; Stefan, J. A methodology to assess the impact of capacity remuneration mechanisms in a detailed power system model. In Proceedings of the 2015 12th International Conference on the European Energy Market (EEM), Lisbon, Portugal, 19–22 May 2015; pp. 1–5. [Google Scholar]
- Hreinsson, E.B. Supply Adequacy Issues in Renewable Energy and Hydro-Based Power Systems. In Proceedings of the 2006 International Conference on Power System Technology, Chongqing, China, 22–26 October 2006; pp. 1–6. [Google Scholar]
- Bhagwat, P.; Richstein, J.C.; Chappin, E.; De Vries, L. The effectiveness of a strategic reserve in the presence of a high portfolio share of renewable energy sources. Util. Policy 2016, 39, 13–28. [Google Scholar] [CrossRef]
- Hoschle, H.; De Jonghe, C.; Six, D.; Belmans, R.; Hanspeter, H. Capacity remuneration mechanisms and the transition to low-carbon power systems. In Proceedings of the 2015 12th International Conference on the European Energy Market (EEM), Lisbon, Portigal, 19–22 May 2015; pp. 1–5. [Google Scholar]
- Hoschle, H.; De Jonghe, C.; Six, D.; Belmans, R. Influence of non-harmonized capacity mechanisms in an interconnected power system on generation adequacy. In Proceedings of the 2016 Power Systems Computation Conference (PSCC), Genoa, Italy, 20–24 June 2016; pp. 1–11. [Google Scholar]
- Petitet, M.; Marie, P. Ensuring security of electricity supply: How capacity obligation impacts investments including demand response opportunities? In Proceedings of the 2015 12th International Conference on the European Energy Market (EEM), Lisbon, Portugal, 19–22 May 2015; pp. 1–5. [Google Scholar]
- Barillas, A.; Cohen, R.; Sukthaworn, N.; Ana, B. Lessons from the first capacity market auction in Great Britain. In Proceedings of the 2015 12th International Conference on the European Energy Market (EEM), Lisbon, Portugal, 19–22 May 2015; pp. 1–6. [Google Scholar]
- Bhagwata, P.C.; Vries, L.J.; Hobbs, B.F. Expert survey on capacity markets in the US: Lessons for the EU. Util. Policy 2016, 38, 11–17. [Google Scholar] [CrossRef]
- Hach, D.; Chyong, C.K.; Spinler, S. Capacity market design options: A dynamic capacity investment model and a GB case study. Eur. J. Oper. Res. 2016, 249, 691–705. [Google Scholar] [CrossRef]
- Afshar, K.; Barati, M. A new approach for determination and cost allocation of reserve in the restructured power systems. Electr. Power Syst. Res. 2013, 100, 25–33. [Google Scholar] [CrossRef]
- Olsinaa, F.; Pringlesa, R.; Larisson, C.; Garcésa, F. Reliability payments to generation capacity in electricity markets. Energy Policy 2014, 73, 211–224. [Google Scholar] [CrossRef]
- Mastropietro, P.; Herrero, I.; Rodilla, P.; Batlle, C. A model-based analysis on the impact of explicit penalty schemes in capacity mechanisms. Appl. Energy 2016, 168, 406–417. [Google Scholar] [CrossRef]
- Wang, P.; Goel, L. Reliability-based reserve management in a bilateral power market. Electr. Power Syst. Res. 2003, 67, 185–189. [Google Scholar] [CrossRef]
- Vanadzina, E.; Gore, O. Capacity market in Russia: Possibilities for new generation entry and cost of CRMs. In Proceedings of the 2016 13th International Conference on the European Energy Market (EEM), Porto, Portugal, 6–9 June 2016; pp. 1–5. [Google Scholar]
- Harya, N.; Rious, V.; Saguan, M. The electricity generation adequacy problem: Assessing dynamic effects of capacity remuneration mechanisms. Energy Policy 2016, 91, 113–127. [Google Scholar] [CrossRef]
- Newbery, D.M. Missing money and missing markets: Reliability, capacity auctions and interconnectors. Energy Policy 2016, 94, 401–410. [Google Scholar] [CrossRef]
- D’Amico, G.; Masala, G.B.; Petroni, F.; Sobolewski, R.A. Managing Wind Power Generation via Indexed Semi-Markov Model and Copula. Energies 2020, 13, 4246. [Google Scholar] [CrossRef]
- Bouramdane, A.-A.; Tantet, A.; Drobinski, P. Adequacy of Renewable Energy Mixes with Concentrated Solar Power and Photovoltaic in Morocco: Impact of Thermal Storage and Cost. Energies 2020, 13, 5087. [Google Scholar] [CrossRef]
- Shrestha, T.K.; Karki, R. Utilizing Energy Storage for Operational Adequacy of Wind-Integrated Bulk Power Systems. Appl. Sci. 2020, 10, 5964. [Google Scholar] [CrossRef]
- Askeland, M.; Jaehnert, S.; Korpås, M. Equilibrium assessment of storage technologies in a power market with capacity remuneration. Sustain. Energy Technol. Assess. 2019, 31, 228–235. [Google Scholar] [CrossRef]
- EC Regulation (EU) 2019/943 of the European Parliament and of the Council of 5 June 2019 on the internal market for electricity (recast). Off. J. Eur. Union 2019, L 158/54, 54–124.
- Bublitz, A.; Keles, D.; Zimmermann, F.; Fraunholz, C.; Fichtner, W. A survey on electricity market design: Insights from theory and real-world implementations of capacity remuneration mechanisms. Energy Econ. 2019, 80, 1059–1078. [Google Scholar] [CrossRef]
- Gerres, T.; Chaves Ávila, J.P.; Martín Martínez, F.; Rivier Abbad, M.; Cossent Arín, R.; Sánchez Miralles, Á. Rethinking the electricity market design: Remuneration mechanisms to reach high RES shares. Results from a Spanish case study. Energy Policy 2019, 129, 1320–1330. [Google Scholar] [CrossRef]
- Mastropietro, P.; Fontini, F.; Rodilla, P.; Batlle, C. The Italian capacity remuneration mechanism: Critical review and open questions. Energy Policy 2018, 123, 659–669. [Google Scholar] [CrossRef]
- Bolton, R.; Clausen, T. Ambiguous interventions: Capacity remuneration mechanisms and the politics of energy transition in Britain and Germany. Energy Res. Soc. Sci. 2019, 56, 101218. [Google Scholar] [CrossRef]
- Bajo-Buenestado, R. Welfare implications of capacity payments in a price-capped electricity sector: A case study of the Texas market (ERCOT). Energy Econ. 2017, 64, 272–285. [Google Scholar] [CrossRef]
- Abani, A.O.; Hary, N.; Rious, V.; Saguan, M. The impact of investors’ risk aversion on the performances of capacity remuneration mechanisms. Energy Policy 2018, 112, 84–97. [Google Scholar] [CrossRef]
- Bhagwat, P.C.; Iychettira, K.K.; Richstein, J.C.; Chappin, E.; De Vries, L. The effectiveness of capacity markets in the presence of a high portfolio share of renewable energy sources. Util. Policy 2017, 48, 76–91. [Google Scholar] [CrossRef]
- Fan, L.; Norman, C.S.; Patt, A.G. Electricity capacity investment under risk aversion: A case study of coal, gas, and concen-trated solar power. Energy Econ. 2012, 34, 54–61. [Google Scholar] [CrossRef]
- Gore, O.; Vanadzina, E.; Viljainen, S. Linking the energy-only market and the energy-plus-capacity market. Util. Policy 2016, 38, 52–61. [Google Scholar] [CrossRef]
- Laleman, E.; Albrecht, J. Nuclear and old fossil phase out scenarios: Assessment of shortages, surpluses and the load factor of flexible assets with high renewable generation targets—A Belgian case study. Int. J. Electr. Power Energy Syst. 2016, 74, 338–347. [Google Scholar] [CrossRef]
- Weiss, O.; Bogdanov, D.; Salovaara, K.; Honkapuro, S. Market designs for a 100% renewable energy system: Case isolated power system of Israel. Energy 2017, 119, 266–277. [Google Scholar] [CrossRef]
- Gupta, N.; Khosravy, M.; Patel, N.; Nilanjan, D.; Mahela, O.P. Mendelian evolutionary theory optimization algorithm. Soft Comput. 2020, 24, 14345–14390. [Google Scholar] [CrossRef]
- Gupta, N.; Khosravy, M.; Patel, N.; Mahela, O.P.; Varshney, G. Plant Genetics-Inspired Evolutionary Optimization: A Descriptive Tutorial. In Frontier Applications of Nature Inspired Computation; Springer: Singapore, 2020; pp. 53–77. [Google Scholar]
- Gupta, N.; Khosravy, M.; Patel, N.; Sethi, I. Evolutionary Optimization Based on Biological Evolution in Plants. Proc. Comput. Sci. 2018, 126, 146–155. [Google Scholar] [CrossRef]
- Singh, N.; Mohanty, S.R. Short Term Price Forecasting Using Adaptive Generalized Neuron Model. In Advances in Intelligent Systems and Computing; Springer: Cham, Switzerland, 2017; Volume 553, pp. 419–428. [Google Scholar]
- Ilak, P.; Krajcar, S.; Rajšl, I.; Delimar, M. Pricing Energy and Ancillary Services in a Day-Ahead Market for a Price-Taker Hydro Generating Company Using a Risk-Constrained Approach. Energies 2014, 7, 2317–2342. [Google Scholar] [CrossRef]
- Ilak, P.; Krajcar, S.; Rajšl, I.; Delimar, M. Profit maximization of a hydro producer in a day-ahead energy market and an-cillary service markets. In Proceedings of the EUROCON, Zagreb, Croatia, 1–4 July 2013. [Google Scholar]
- Ilak, P.; Rajšl, I.; Krajcar, S.; Delimar, M. The impact of a wind variable generation on the hydro generation water shadow price. Appl. Energy 2015, 154, 197–208. [Google Scholar] [CrossRef]
- Lu, Y.D.; Yan, K. Adjustable Rubost Reactive Power Optimization of Islanded Microgrids. In Proceedings of the 2018 2nd IEEE Conference on Energy Internet and Energy System Integration (EI2), Beijing, China, 20–22 October 2018; pp. 1–9. [Google Scholar]
- Cui, H.; Li, F.; Fang, X.; Chen, H.; Wang, H. Bilevel Arbitrage Potential Evaluation for Grid-Scale Energy Storage Considering Wind Power and LMP Smoothing Effect. IEEE Trans. Sustain. Energy 2017, 9, 707–718. [Google Scholar] [CrossRef]
- Lin, C.H.; Lin, S.Y.; Lin, S.S. Improvements on the Duality-Based Method Used in Solving Optimal Power Flow Problems. IEEE Power Eng. Rev. 2002, 22, 58. [Google Scholar] [CrossRef]
- Taniguchi, T.; Takata, T.; Fukui, Y.; Kawasaki, K. Convergent Double Auction Mechanism for a Prosumers’ Decentralized Smart Grid. Energies 2015, 8, 12342–12361. [Google Scholar] [CrossRef]
- Notarnicola, I.; Franceschelli, M.; Notarstefano, G. A Duality-Based Approach for Distributed Min–Max Optimization. IEEE Trans. Autom. Control. 2019, 64, 2559–2566. [Google Scholar] [CrossRef]
- Xia, Y.; Li, D. Strong duality in optimization: Shifted power reformulation. Optim. Methods Softw. 2015, 31, 720–736. [Google Scholar] [CrossRef]
- Romeijn, H.E.; Smith, R.L.; Bean, J.C. Duality in infinite dimensional linear programming. Math. Program. 1992, 53, 79–97. [Google Scholar] [CrossRef]
- Deane, J.P.; McKeogh, E.J.; Gallachoir, B.P.O. Derivation of Intertemporal Targets for Large Pumped Hydro Energy Storage With Stochastic Optimization. IEEE Trans. Power Syst. 2013, 28, 2147–2155. [Google Scholar] [CrossRef]
- APX/Belpex; EPEX SPOT; Nord Pool Spot; OMIE; OTE. EUPHEMIA Public Description: PCR Market Coupling Algorithm; Europex: Brussels, Belgium, 2013; pp. 1–45. [Google Scholar]
- Tomšić, Ž.; Raos, S.; Rajšl, I.; Ilak, P. Role of Electric Vehicles in Transition to Low Carbon Power System—Case Study Croatia. Energies 2020, 13, 6516. [Google Scholar] [CrossRef]
- HOPS. Godišnje Izvješće o Sigurnosti Opskrbe Hrvatskog EES-a za 2018. Godinu; Hrvatski Operator Prijenosnog Sustava d.o.o.: Zagreb, Croatia, 2019. [Google Scholar]
- Ministry of Environment and Energy of the Republic of Croatia. Annual Energy Report Energy in Croatia 2018; Ministry of Environment and Energy of the Republic of Croatia: Zagreb, Croatia, 2019.
- Cambridge Economic Policy Associates Ltd. Study on the Estimation of the Value of Lost Load of Electricity Supply in Europe ACER/OP/DIR/08/2013/LOT 2/RFS 10; Agency for Coopeartion of Energy Regulators: Ljubljana, Slovenia, 2018. [Google Scholar]
- Timera Energy. A Tour of European Capacity Markets. 10 February 2020. Available online: https://timera-energy.com/a-tour-of-european-capacity-markets/ (accessed on 5 January 2021).
- Ilak, P.; Rajšl, I.; Herenčić, L.; Zmijarević, Z.; Krajcar, S. Decentralized Electricity Trading in the Microgrid: Implementation of Decentralized Peer-to-Peer Concept for Electricity Trading (P2PCET). In Proceedings of the Mediterranean Conference on Power Generation, Transmission, Distribution and Energy Conversion (MEDPOWER 2018), Dubrovnik, Croatia, 12–15 November 2018; p. 36. [Google Scholar]
- Herenčić, L.; Ilak, P.; Rajšl, I.; Zmijarević, Z.; Cvitanović, M.; Delimar, M.; Pećanac, B. Overview of the main challenges and threats for implementation of the advanced concept for decentralized trading in microgrids. In Proceedings of the IEEE EUROCON 20191—8th International Conference on Smart Technologies, Novi Sad, Serbia, 1–4 July 2019. [Google Scholar]
- Herenčić, L.; Ilak, P.; Rajšl, I. Effects of Local Electricity Trading on Power Flows and Voltage Levels for Different Elasticities and Prices. Energies 2019, 12, 4708. [Google Scholar] [CrossRef]
- Herenčić, L.; Ilak, P.; Rajšl, I. Peer-to-Peer Electricity Trading in Distribution Grid: Effects of Prosumer’s Elasticities on Voltage Levels. In Proceedings of the 2020 6th IEEE International Energy Conference (ENERGYCon), Gammarth, Tunisia, 28 September–1 October 2020; pp. 724–729. [Google Scholar]
- Herenčić, L.; Ilak, P.; Rajšl, I. Impact of Producer’s Offering Prices in Peer-to-Peer Electricity Trading on Power Flows in Distribution Grid. In Proceedings of the 2020 6th IEEE International Energy Conference (ENERGYCon), Gammarth, Tunisia, 28 September–1 October 2020; pp. 730–733. [Google Scholar]
Publisher’s Note: MDPI stays neutral with regard to jurisdictional claims in published maps and institutional affiliations. |
© 2021 by the authors. Licensee MDPI, Basel, Switzerland. This article is an open access article distributed under the terms and conditions of the Creative Commons Attribution (CC BY) license (http://creativecommons.org/licenses/by/4.0/).