Article

The Use of Capsuled Paraffin Wax in Low-Temperature Thermal Energy Storage Applications: An Experimental and Numerical Investigation

Department of Thermodynamics and Renewable Energy Sources, Faculty of Mechanical and Power Engineering, Wrocław University of Science and Technology, 27 Wybrzeże Wyspiańskiego Street, 50-370 Wrocław, Poland
*
Author to whom correspondence should be addressed.
Energies 2021, 14(3), 538; https://doi.org/10.3390/en14030538
Submission received: 21 December 2020 / Revised: 14 January 2021 / Accepted: 17 January 2021 / Published: 21 January 2021
(This article belongs to the Special Issue Energy Processes, Systems and Equipment)

Abstract

:
The article deals with the experimental and numerical thermal-flow behaviours of a low-temperature Phase Change Material (PCM) used in Thermal Energy Storage (TES) industrial applications. The investigated PCM is a composition that consists of a mixture of paraffin wax capsuled in a melamine-formaldehyde membrane and water, for which a phase change process occurs within the temperature range of 4 °C to 6 °C and the maximum heat storage capacity is equal to 72 kJ/kg. To test the TES capabilities of the PCM for operating conditions close to real ones, a series of experimental tests were performed on cylindrical modules with fixed heights of 250 mm and different outer diameters of 15, 22, and 28 mm, respectively. The module was tested in a specially designed wind tunnel where the Reynolds numbers of between 15,250 to 52,750 were achieved. In addition, a mathematical model of the analysed processes, based on the enthalpy porosity method, was proposed and validated. The temperature changes during the phase transitions that were obtained from the numerical analyses in comparison with the experimental results have not exceeded 20% of the relative error for the phase change region and no more than 10% for the rest. Additionally, the PCM was examined while using a Scanning Electron Microscope (SEM), which indicated no changes in the internal structure during phase transitions and a homogeneous structure, regardless of the tested temperature ranges.

1. Introduction

Thermal Energy Storage (TES) technology has gained increasing worldwide attention, because it, among others, has been regarded as an effective way to compensate for the intermittence of renewable sources [1,2]. Among various TES technologies, Latent Heat Thermal Energy Storage, (LHTES), utilising Phase Change Materials, (PCMs), is one of the most attractive forms, with a relatively high storage density and small temperature changes from storage to retrieval [3]. PCMs are substances with the property of heat absorption when they undergo a phase change from solid to liquid, liquid to gas, or vice versa [4,5,6]. These PCMs are widely applicable in a broad range of industrial areas. For instance, they can be encapsulated in building materials, e.g., gypsum plasterboard, cubicle, and wall board in order to enhance the thermal storage capacity [7,8]. PCMs are also considered to improve the frosting/defrosting operating performance of air source heat pumps [9]. Likewise, PCMs are frequently used in order to produce thermoregulated textiles, where they are generally entrapped in micro/nano-capsules to prevent leakage [10]. PCMs-assisted packaging is an innovative technology, which can plenarily control temperature-sensitive food products under different conditions [11]. In addition, PCMs also play an important role in a large number of fields, like temperature-adjustable greenhouses [12,13], waste heat recovery [14], and building air-conditioning [15]. High-temperature PCMs have attracted considerable interests over the past decade, which is extraordinarily promising in the concentrated solar thermal field and other high-temperature-required domains [16,17,18]. On the other hand, Amin et al. [19] considered a different temperature interval with a focus on low-temperature PCMs that are encapsulated in spheres.
PCMs can be generally classified into two types: organic and inorganic. Most inorganic PCMs are barely applicable to the TES system due to their toxicity, corrosivity, and super-cooling properties. In contrast, organic PCMs are relatively safe, chemically inert and ecologically friendly [20]. Among diverse organic PCMs, paraffin wax is one of the most common materials, with several remarkable properties, e.g., high energy storage density, relatively low cost in commerce, and a small super-cooling trend. Paraffin wax (usually extracted from ozokerite, petroleum, natural gas, etc.) has a wide range of phase change temperatures and it has a general chemical formula C n H 2 n + 2 (n≥ 4, the higher the value of n the higher the melting temperature) [21]. Consequently, an ideal scheme seems to be to use capsuled paraffin wax as a storage material and proposals for such a method have already been tackled by groups of researchers [22,23].
Plenty of investigations on the mathematical models and numerical analyses with PCMs that are capsuled in different configurations have been performed and reported in the literature. Shamsundar and Sparrow [24] resolved the enthalpy equation using the finite difference approach and performed an analysis of the multidimensional transient solidification process with the change of density and an increasing shrinkage cavity. The authors noted that the highest impact of the density ratio and the Stefan number on the heat transfer occurred at almost the end of solidification. In a horizontal tube with unfixed solid PCMs inside, the thermal behaviours of the PCMs (heat flux densities, geometric shape, melting rates, etc.) were obtained by Bareiss and Beer [25] through neglecting the inertial force. The authors pointed out that the gravity of the solid PCMs and pressure forces in a thin liquid layer jointly formed a force balance. Bilir and Ilken [26] investigated PCMs capsuled in a spherical/cylindrical container employing the third kind of boundary condition. The authors derived correlations that utilise the Biot number, the Stefan number and the dimensionless surface temperature to present the dimensionless total solidification time of PCMs. Verma et al. [27] studied the mathematical models that are based on the first and second law of thermodynamics regarding the LHTES system with PCMs inside. The authors indicated that the model based on the first law of thermodynamics had been experimentally validated, and could be employed to model PCMs. However, the model based on the second law of thermodynamics required additional work related to its experimental verification. A numerical model regarding the solidification process of PCMs in a triplex tube with external and internal fins was proposed by Al-Abidi et al. [28]. The authors noted that factors, including the fin length, the fin thickness, and the numbers of fins, had a considerable impact on the heat transfer. However, the effect of the fin thickness was assessed to be less than that of the fin length. Similarly, Li et al. [29] explored the enhancement effect of aluminium oxide on phase change heat transfer in the triplex tube with fins. The conducted research revealed that an extra alumina contributed to a stronger conduction and the best discharging rate was determined in the case of d p = 40 nm. The entropy optimization method was applied in order to study the solidification behaviour of nanoparticle-enhanced PCMs in the LHTES system affected by a magnetic field by Shah et al. [30]. The authors indicated that the Lorentz force, caused by the Hartmann number, and buoyancy forces had positive and negative impacts on the solidification rate of nanoparticle-enhanced PCMs, respectively. Jourabian et al. [31] utilised the enthalpy-based Lattice Boltzmann method and double distribution function to explore the melting process of the ice within a semicircle enclosure. The authors noticed that the concentration of nanoparticles had a positive and an adverse effect on the thermal conductivity and the latent heat of PCMs, respectively, but a negligible impact on the average Nusselt number. A novel PCM-air tubular heat exchanger and the corresponding analytical solution were proposed by Dubovsky et al. [32]. The authors successfully predicted the results of separate tubes and verified the applicability of the analytical solution to the practical heat exchangers. Darzi et al. [33] presented several simulations of the symmetric melting process between two cylinders in an eccentric and concentric position using N-eicosane as the PCM. The authors pointed out that the downward movement of the inner cylinder caused a significant increase in the melting rate due to the dominance of convective heat transfer in most areas of the PCM. Mahdaoui et al. [34] proposed a numerical model involving the natural convection phenomenon in the PCM-melted region around a horizontal cylinder. As a result of the conducted research, the authors assessed that regardless of the assumed boundary conditions, (constant temperature of the cylinder walls, constant heat flux), the melting of the PCM in the lower part was ineffective since the energy was transferred mainly by convection to the top of the cylinder. Regin et al. [35] focused on the cylindrical PCM-melting model integrated into the LHTES system, which was combined with a solar water heating collector. The conducted analyses indicated that the melting of PCMs was primarily dependent on the magnitude of the temperature range of the phase transformation, the Stefan number, and the capsule radius. Although these papers have successfully studied diverse mathematical and numerical PCM melting/solidification models employing different constraints. Additionally, it was considered various influencing factors and configurations, none of them pays attention to the changes in the internal structure of the PCMs during the phase change process. Furthermore, most of them only deal with the PCMs capsuled in horizontal cylinders and heat transfer is uniformly along the circumference of the circular cylinder. Accordingly, we have made an attempt to investigate the case of PCMs capsuled in the vertical position of a cylinder, which will undergo several heat-flow processes of the cross-flow of air with different velocities. We are highly expecting to test and compare the capabilities of the mixture of paraffin wax and water in different heat flux environments and to more explicitly describe the characteristic parameters of five-phase change regions of the mixed PCMs. In addition, a Scanning Electron Microscope (SEM) will be expedient in confirming the specific changes in the internal structure of the mixed PCMs during the phase transition.
The motivation to undertake the analyses carried out in the article is to design a container for storing/accumulating cold “energy” cooperating with the heat pump. The presented literature analysis shows that one of the most promising candidates that can be directly applied in the analysed device and its ranges of the temperature is the PCM-capsuled paraffin wax. This container unit filled with PCM has to operate with a system named a Flower Shape Oscillating Heat Pipe (FSOHP), which was described in detail by Czajkowski et al. in [36] and it has also been patented in [37] by Pietrowicz et al. Thus, an integral element in the innovative system for cooling mixed substances is a special exchanger that contains the PCM described and studied in this paper. The operational parameters of the exchanger have been defined and described by Ochman and Pietrowicz in [38], and have also been patented by Pietrowicz et al. [39]. What is important, due to the required technological process, PCMs are expected to store the “cold” energy in the range of 4 °C to 6 °C. The paraffin wax, due to its thermodynamic and functional properties, is a pertinent candidate for this novel system, as it was mentioned.
Thus, when preparing the design procedures that are dedicated for a storage tank, the authors of the article needed to have a complete, validated mathematical model of the thermal-flow processes occurring in the tested phase change material and to have knowledge of the impact of the operating conditions of the designed storage tank on the temperature change in the PCMs, depending on the total applied mass of the PCM. It was also important to determine the time that is needed for the phase changes and to compare them with different values of the supplied heat flux. The authors of the article also believe that the developed numerical procedures together with the conducted research will help in the future during the optimization process of the construction of a cold accumulator cooperating with a heat pump and a mixing/dissolver device.
In the presented article, the thermal-flow processes occurring in the low-temperature PCM were experimentally tested and then numerically investigated. The experiments were carried out for fully turbulent flow (15,250 < Re < 52,750) and for three cylindrical modules filled with a PCM with fixed heights of 250 mm and with outer diameters of 15, 22, and 28 mm, respectively. For this purpose, a special set-up was designed and constructed, in which a wind tunnel is the main element. Additionally, special test procedures were developed and adapted. Subsequently, a mathematical model of thermal-flow processes existing in the phase change material, based on the enthalpy porosity method, was proposed and validated. Finally, the numerical calculations, during the transient processes, were carried out for various boundary conditions that are close to those expected during the real operation of the device.
The structure of the article consisted of the following elements: Section 2 describes the tested phase change material, with a description of the thermophysical properties and the analysis of the internal structure while using a SEM. The test stand, tested modules filled with PCM and measurement procedures are described in Section 3. Section 4 presents the mathematical model and numerical procedures, numerical domains with the applied boundary conditions and applied thermal properties. The experimental studies are detailed and discussed in Section 5. Additionally, this section compares the results of the numerical studies with the experimental data and summarizes them by the relative error analysis. Section 6 concludes the work, where the most important results and observations from the conducted research are presented.

2. Phase Change Material (PCM)

2.1. General Description of the PCM

To meet the thermal requirements, i.e., the phase change temperature range and usability, the research was conducted on a commercial phase-change material, which was paraffin wax capsules in a melamine-formaldehyde membrane and water mixture, produced by the MikroCaps company [40]. Table 1 shows the selected thermophysical properties describing the tested PCM.

2.2. Analysis of the PCM’s Internal Structure

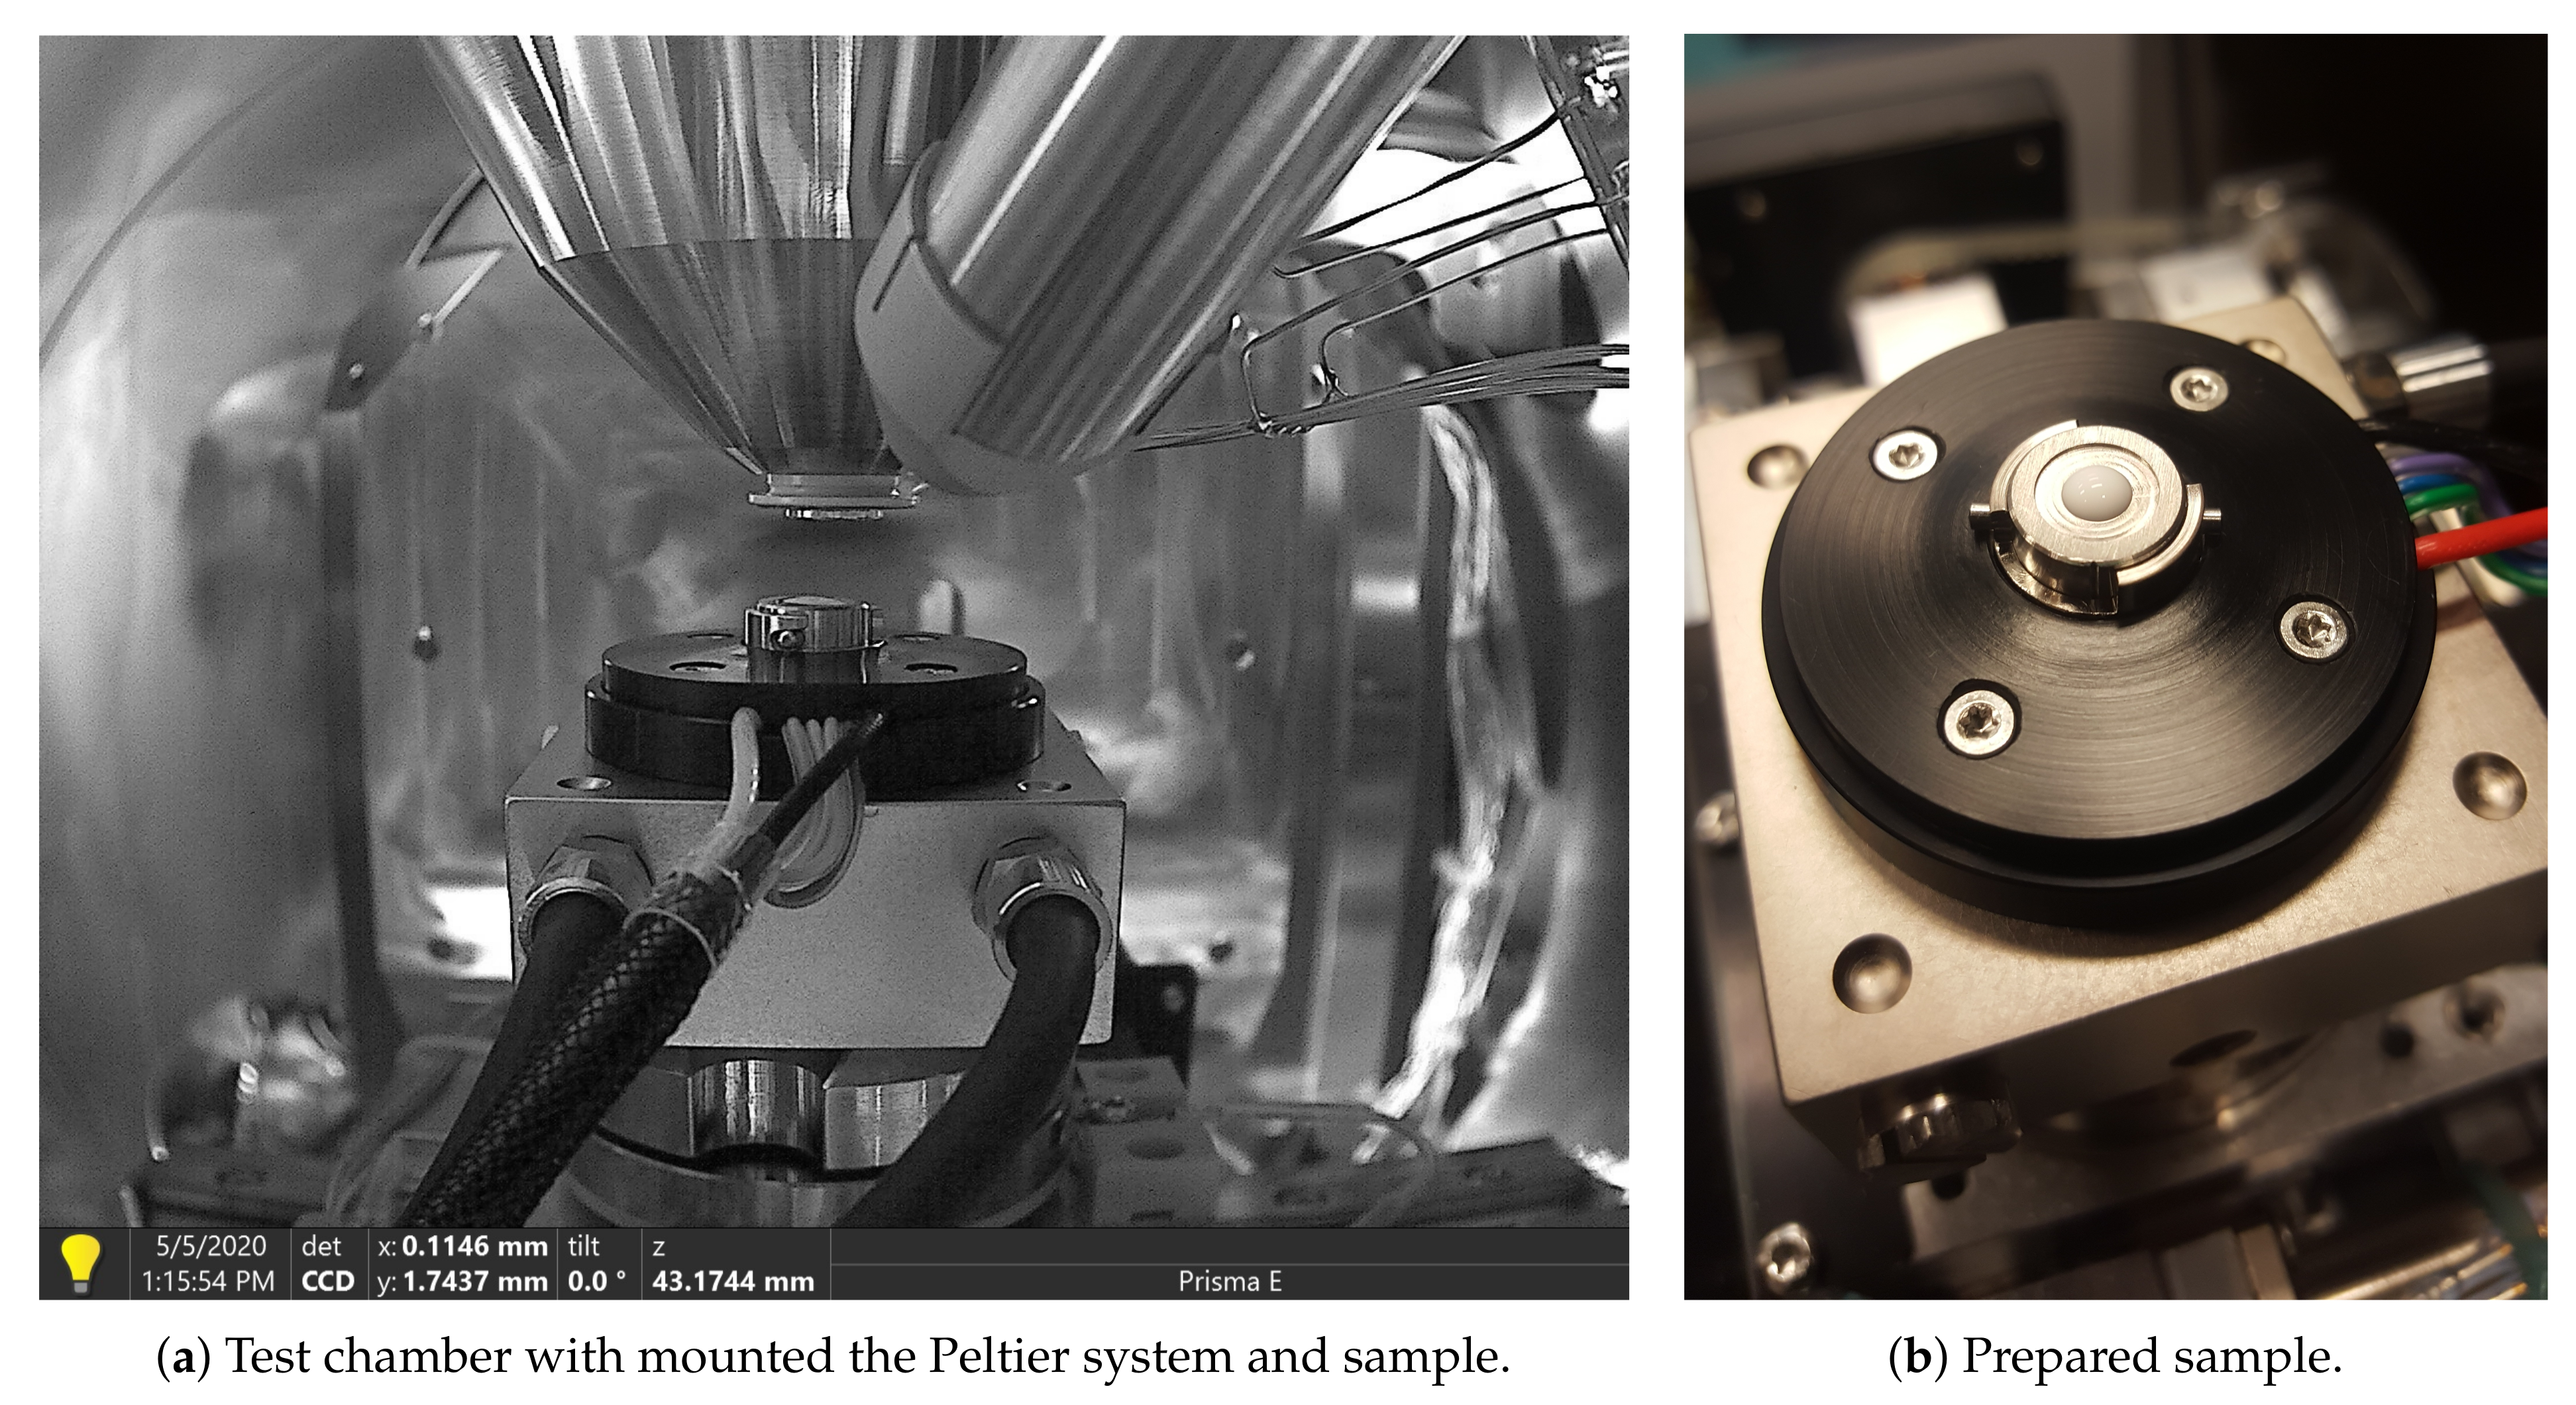
2.2.1. Test Conditions and Testing Procedures

The purpose of the analysis described in this section was to observe whether and how the internal structure of the PCM changes at the characteristic temperature points. The structure of the material was studied while using a Scanning Electron Microscope (SEM). A Prisma E scanning electron microscope from Thermo Fisher Scientific was used for this purpose. A special table with a Peltier system was installed in the test chamber in order to regulate the sample temperature in the phase transition range, i.e., from 0 °C to 16 °C. Figure 1 shows the system with the studied sample along with the details of the test chamber.
During the measurements, the focusing beam power was set from 20 to 25 kV. Those values were experimentally selected to ensure the right quality of contrast and sharpness of an image. It should be mentioned that the power of the selected high-energy electron beam allowed for the analysis of the sample without its visible degradation of the sample.
Efforts were made to keep the relative humidity value in the measuring chamber at 17 ÷ 42% in order to maintain the emulsion structure of the sample during the analyses of the PCM structure. Maintaining these parameters ensured that the evaporation of water from the material was minimized by achieving thermal conditions far from saturation conditions. Figure 2 presents the change in sample temperature and humidity during the experiment.

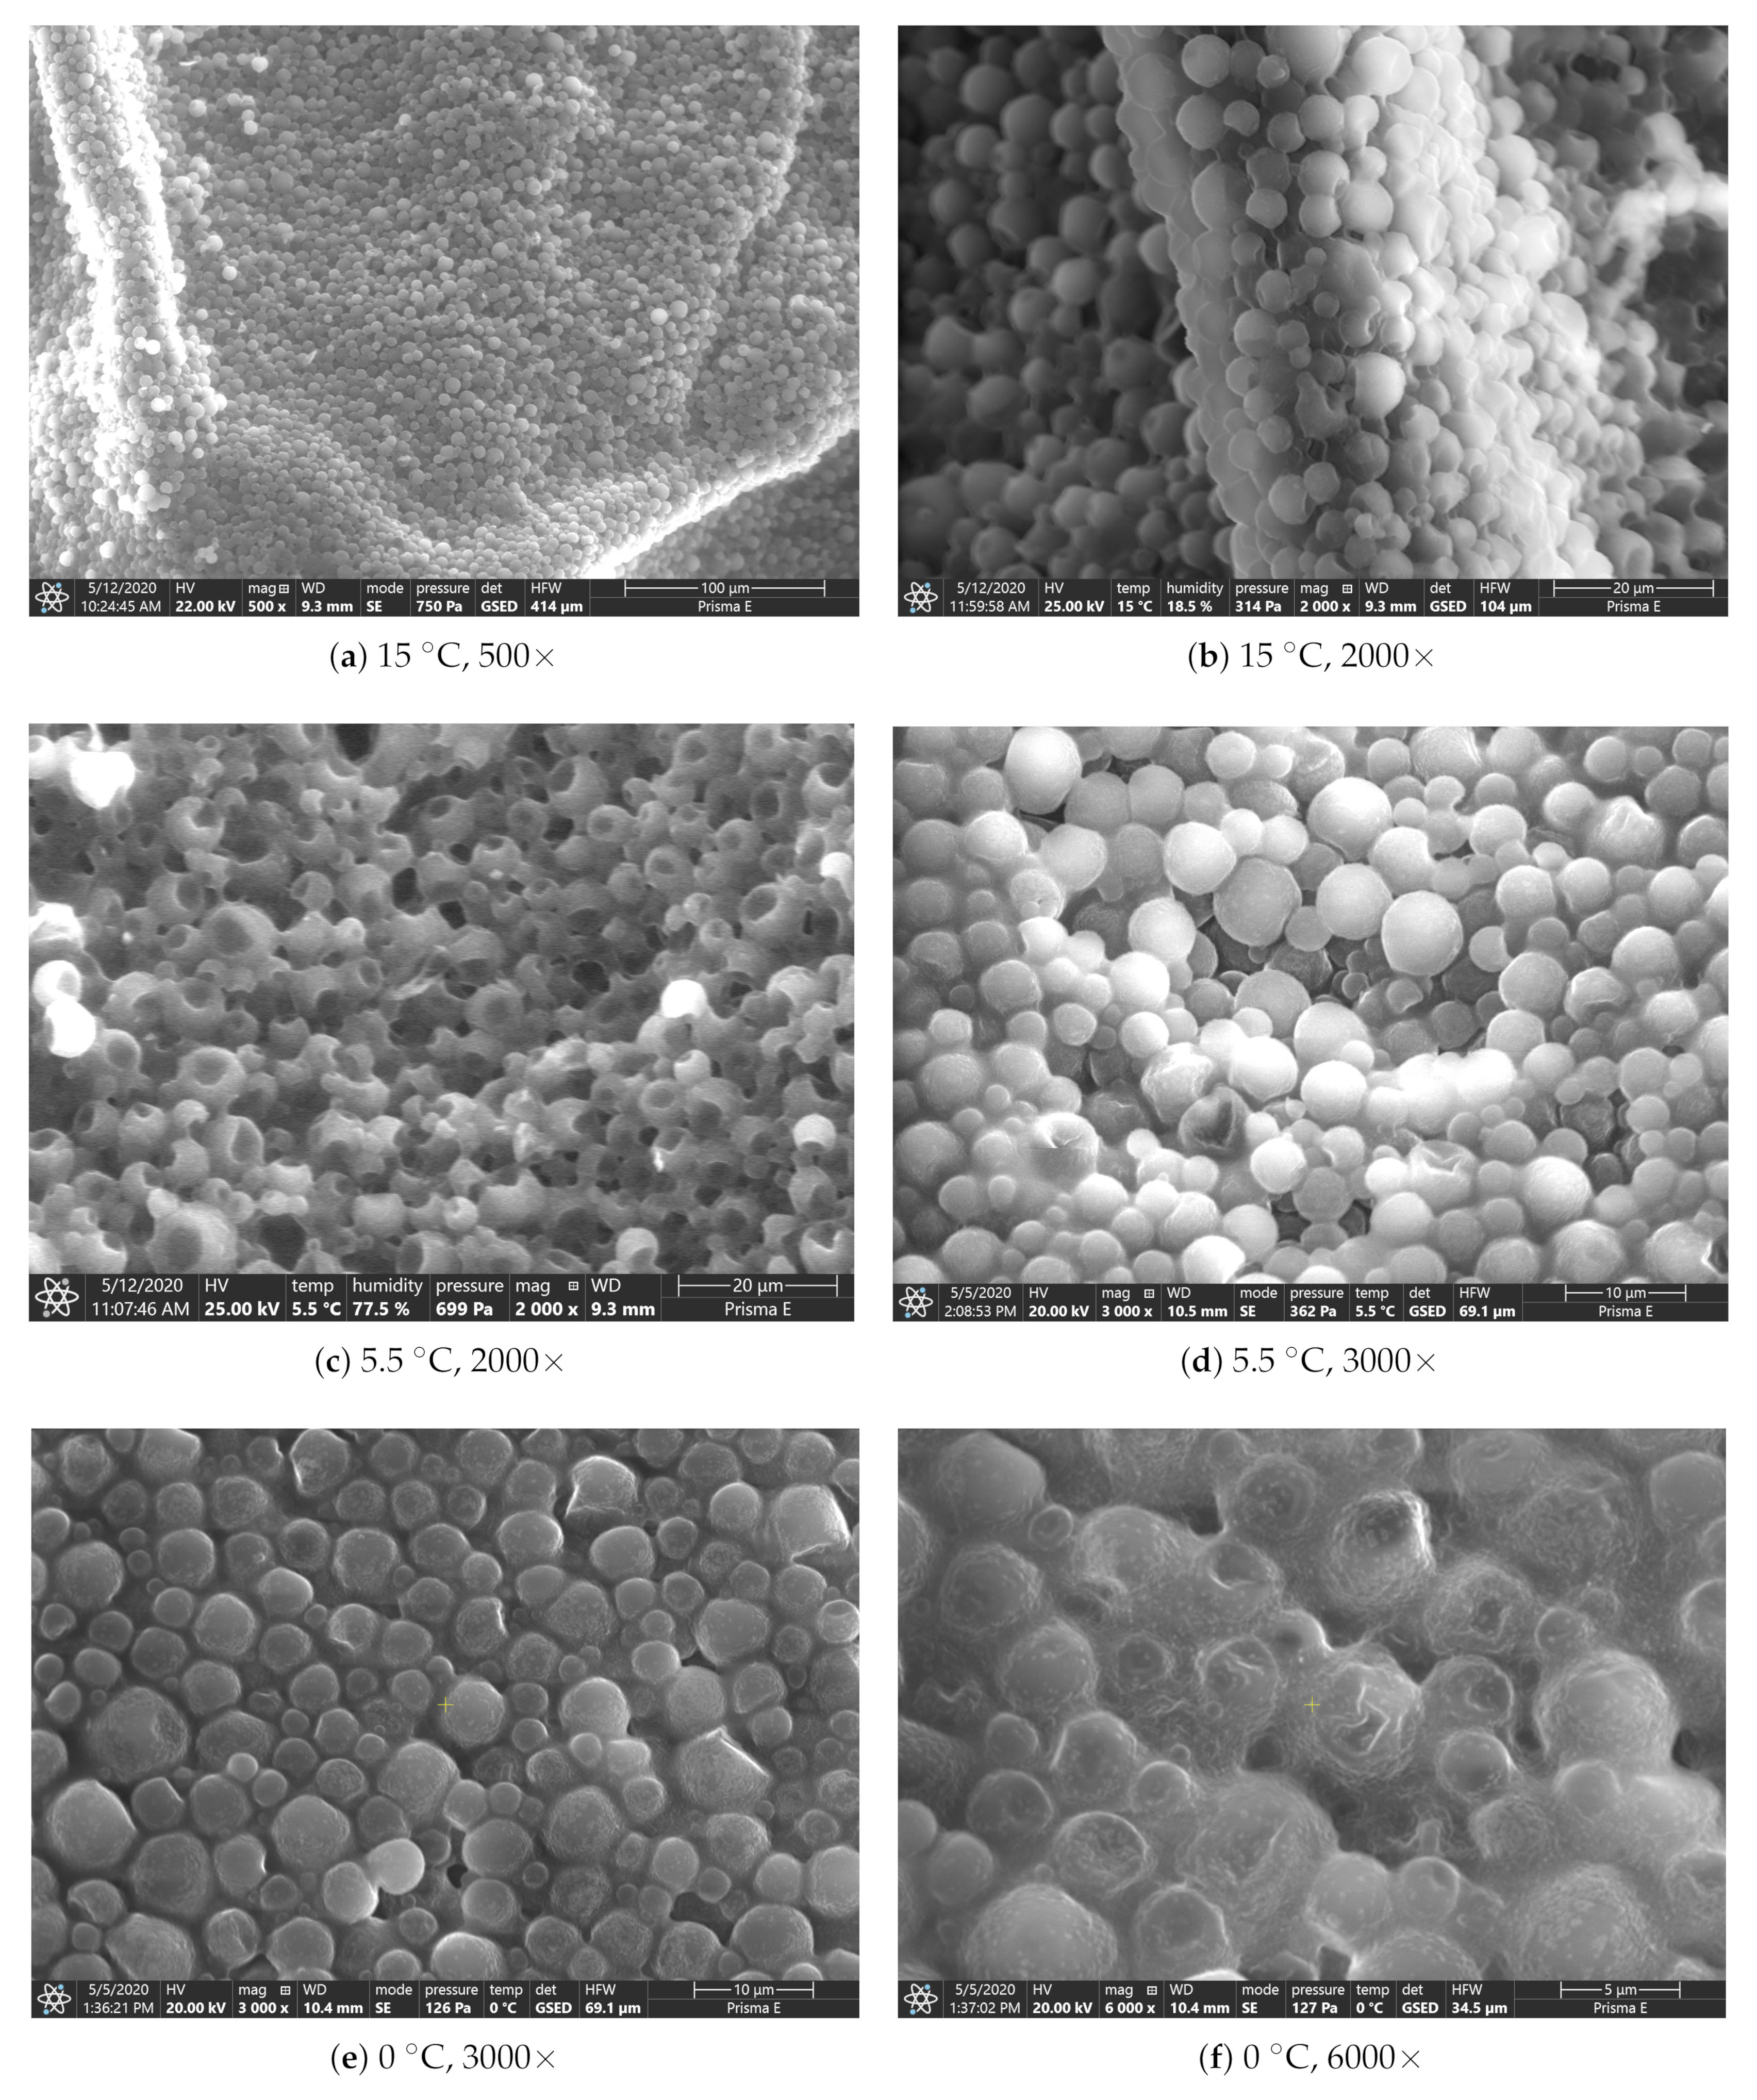
2.2.2. SEM Analysing

Figure 3 presents the results of the SEM’s investigation of the PCM structure for selected temperature points that were defined at 0 °C, 5.5 °C, and 15 °C.
Those temperatures have been selected, because the potential changes in the structure were expected. Thus, the temperature of 15 °C (Figure 3a,b) is significantly separated from the phase transition temperature, which was estimated at between 4 °C and 6 °C (Figure 3c,d). Because the analysed substance is an emulsion of two components-paraffin wax and water, analysis at 0 °C (Figure 3e,f) was also potentially considered, due to the phase change of the water.
The investigation showed that the diameter of the analysed paraffin capsules is between 3 and 8 μm. This differs from the values declared by the manufacturer and described in Table 1. Additionally, it was observed from Figure 3e,f, that, for 0 °C, the distances between microcapsules increase in comparison with other tested temperatures, which are a consequence of the presence of water in the form of ice and a higher value of the specific volume compared to other temperature tests. Generally, it can be concluded that, in the studied temperature ranges, no significant changes in the internal structure were noticed. This is an important fact that was used later during numerical simulations. The substance that is taken into account is homogeneous and the separation of components, i.e., sedimentation, is not later considered.

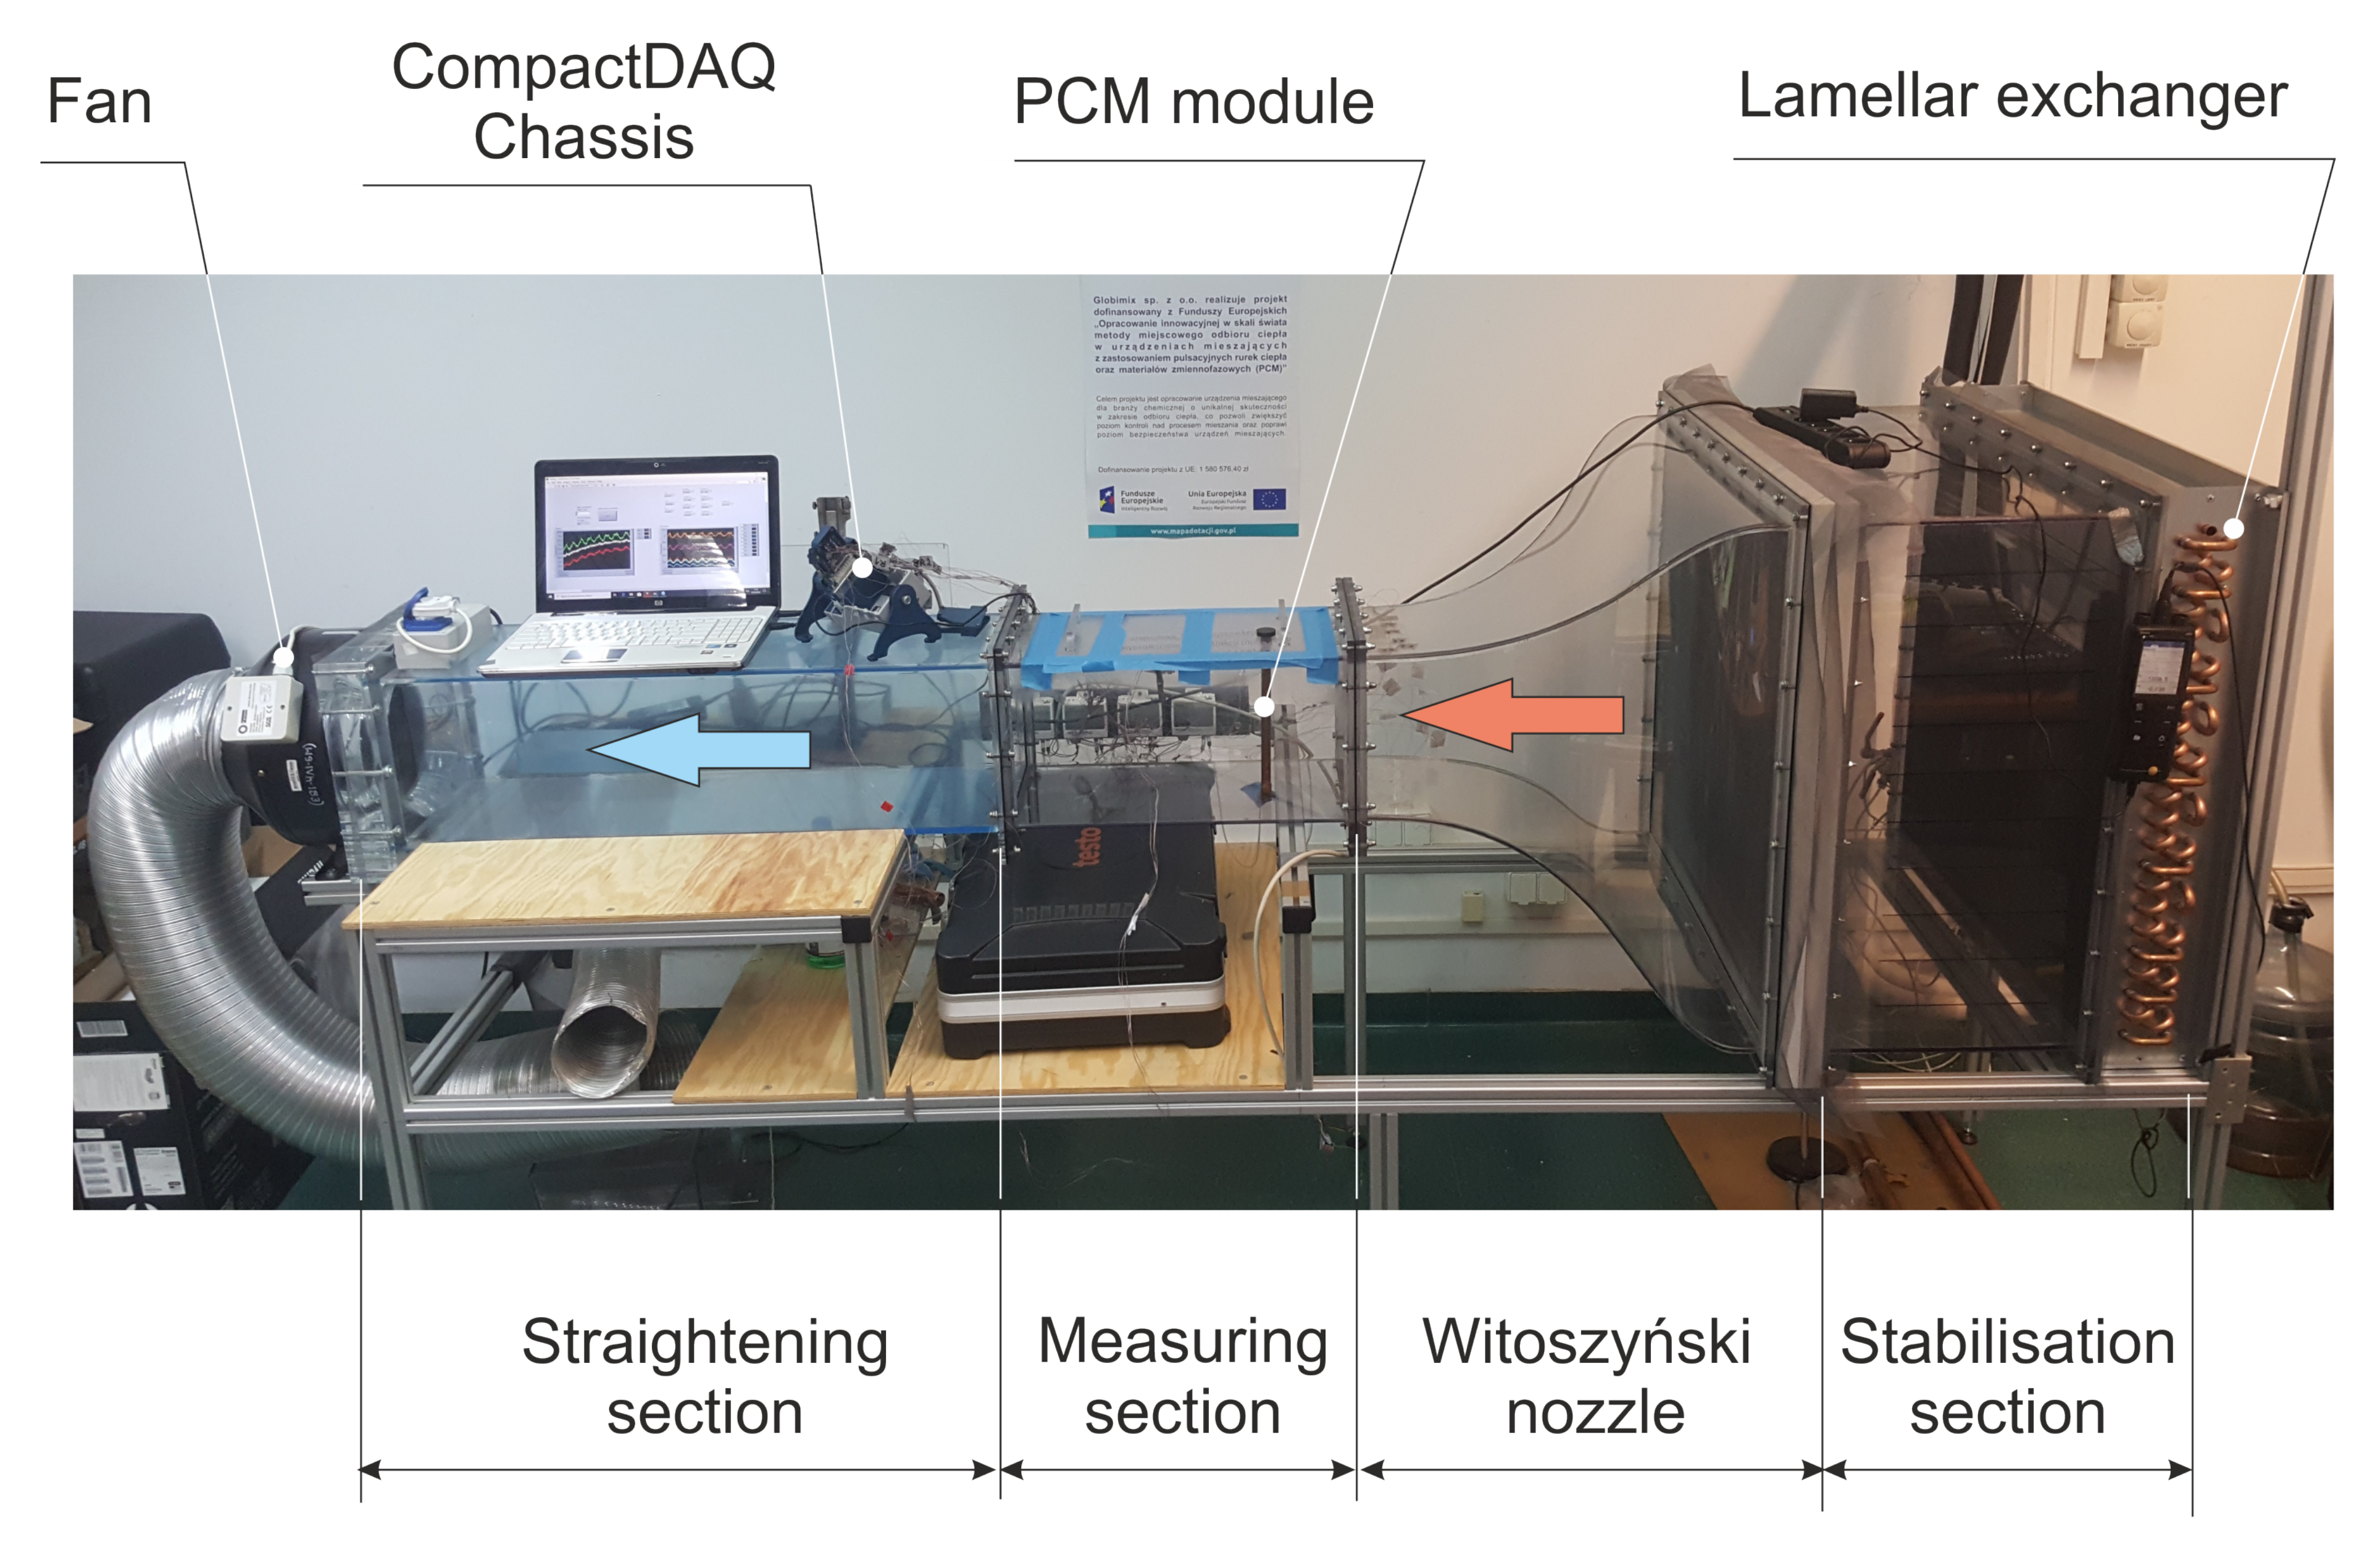
3. Experimental Set-Up and Measuring Procedure

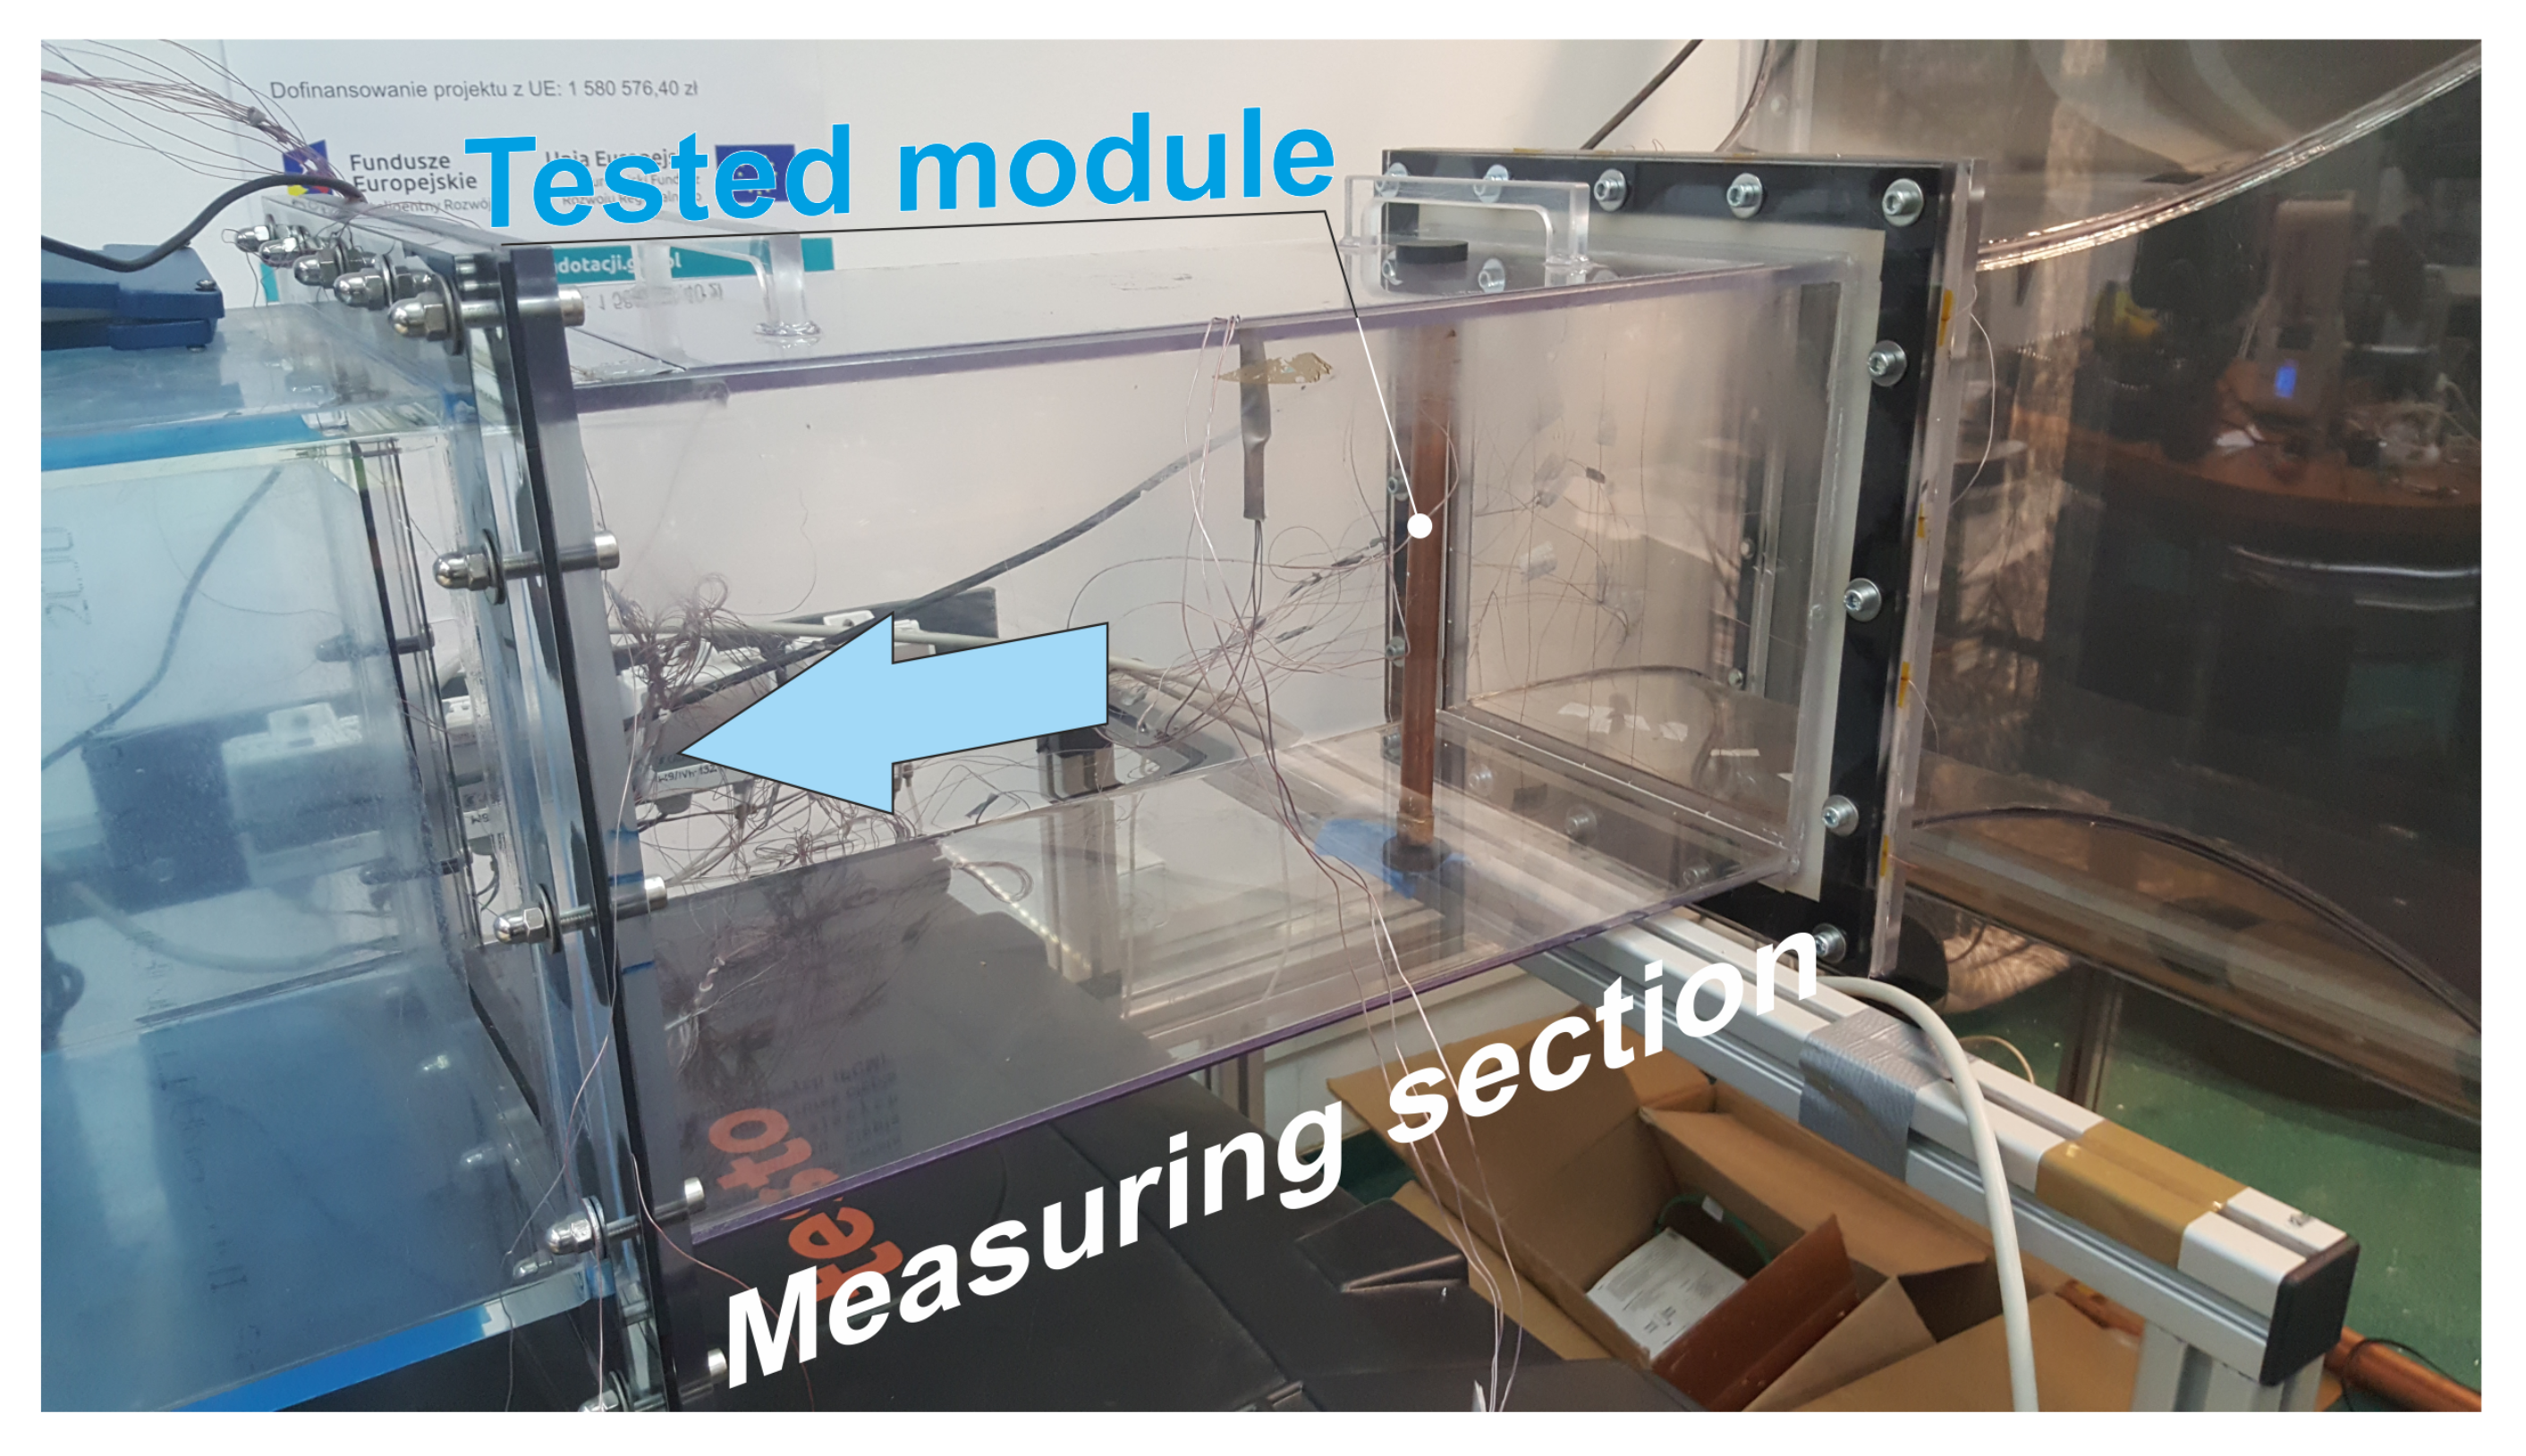
3.1. General Description
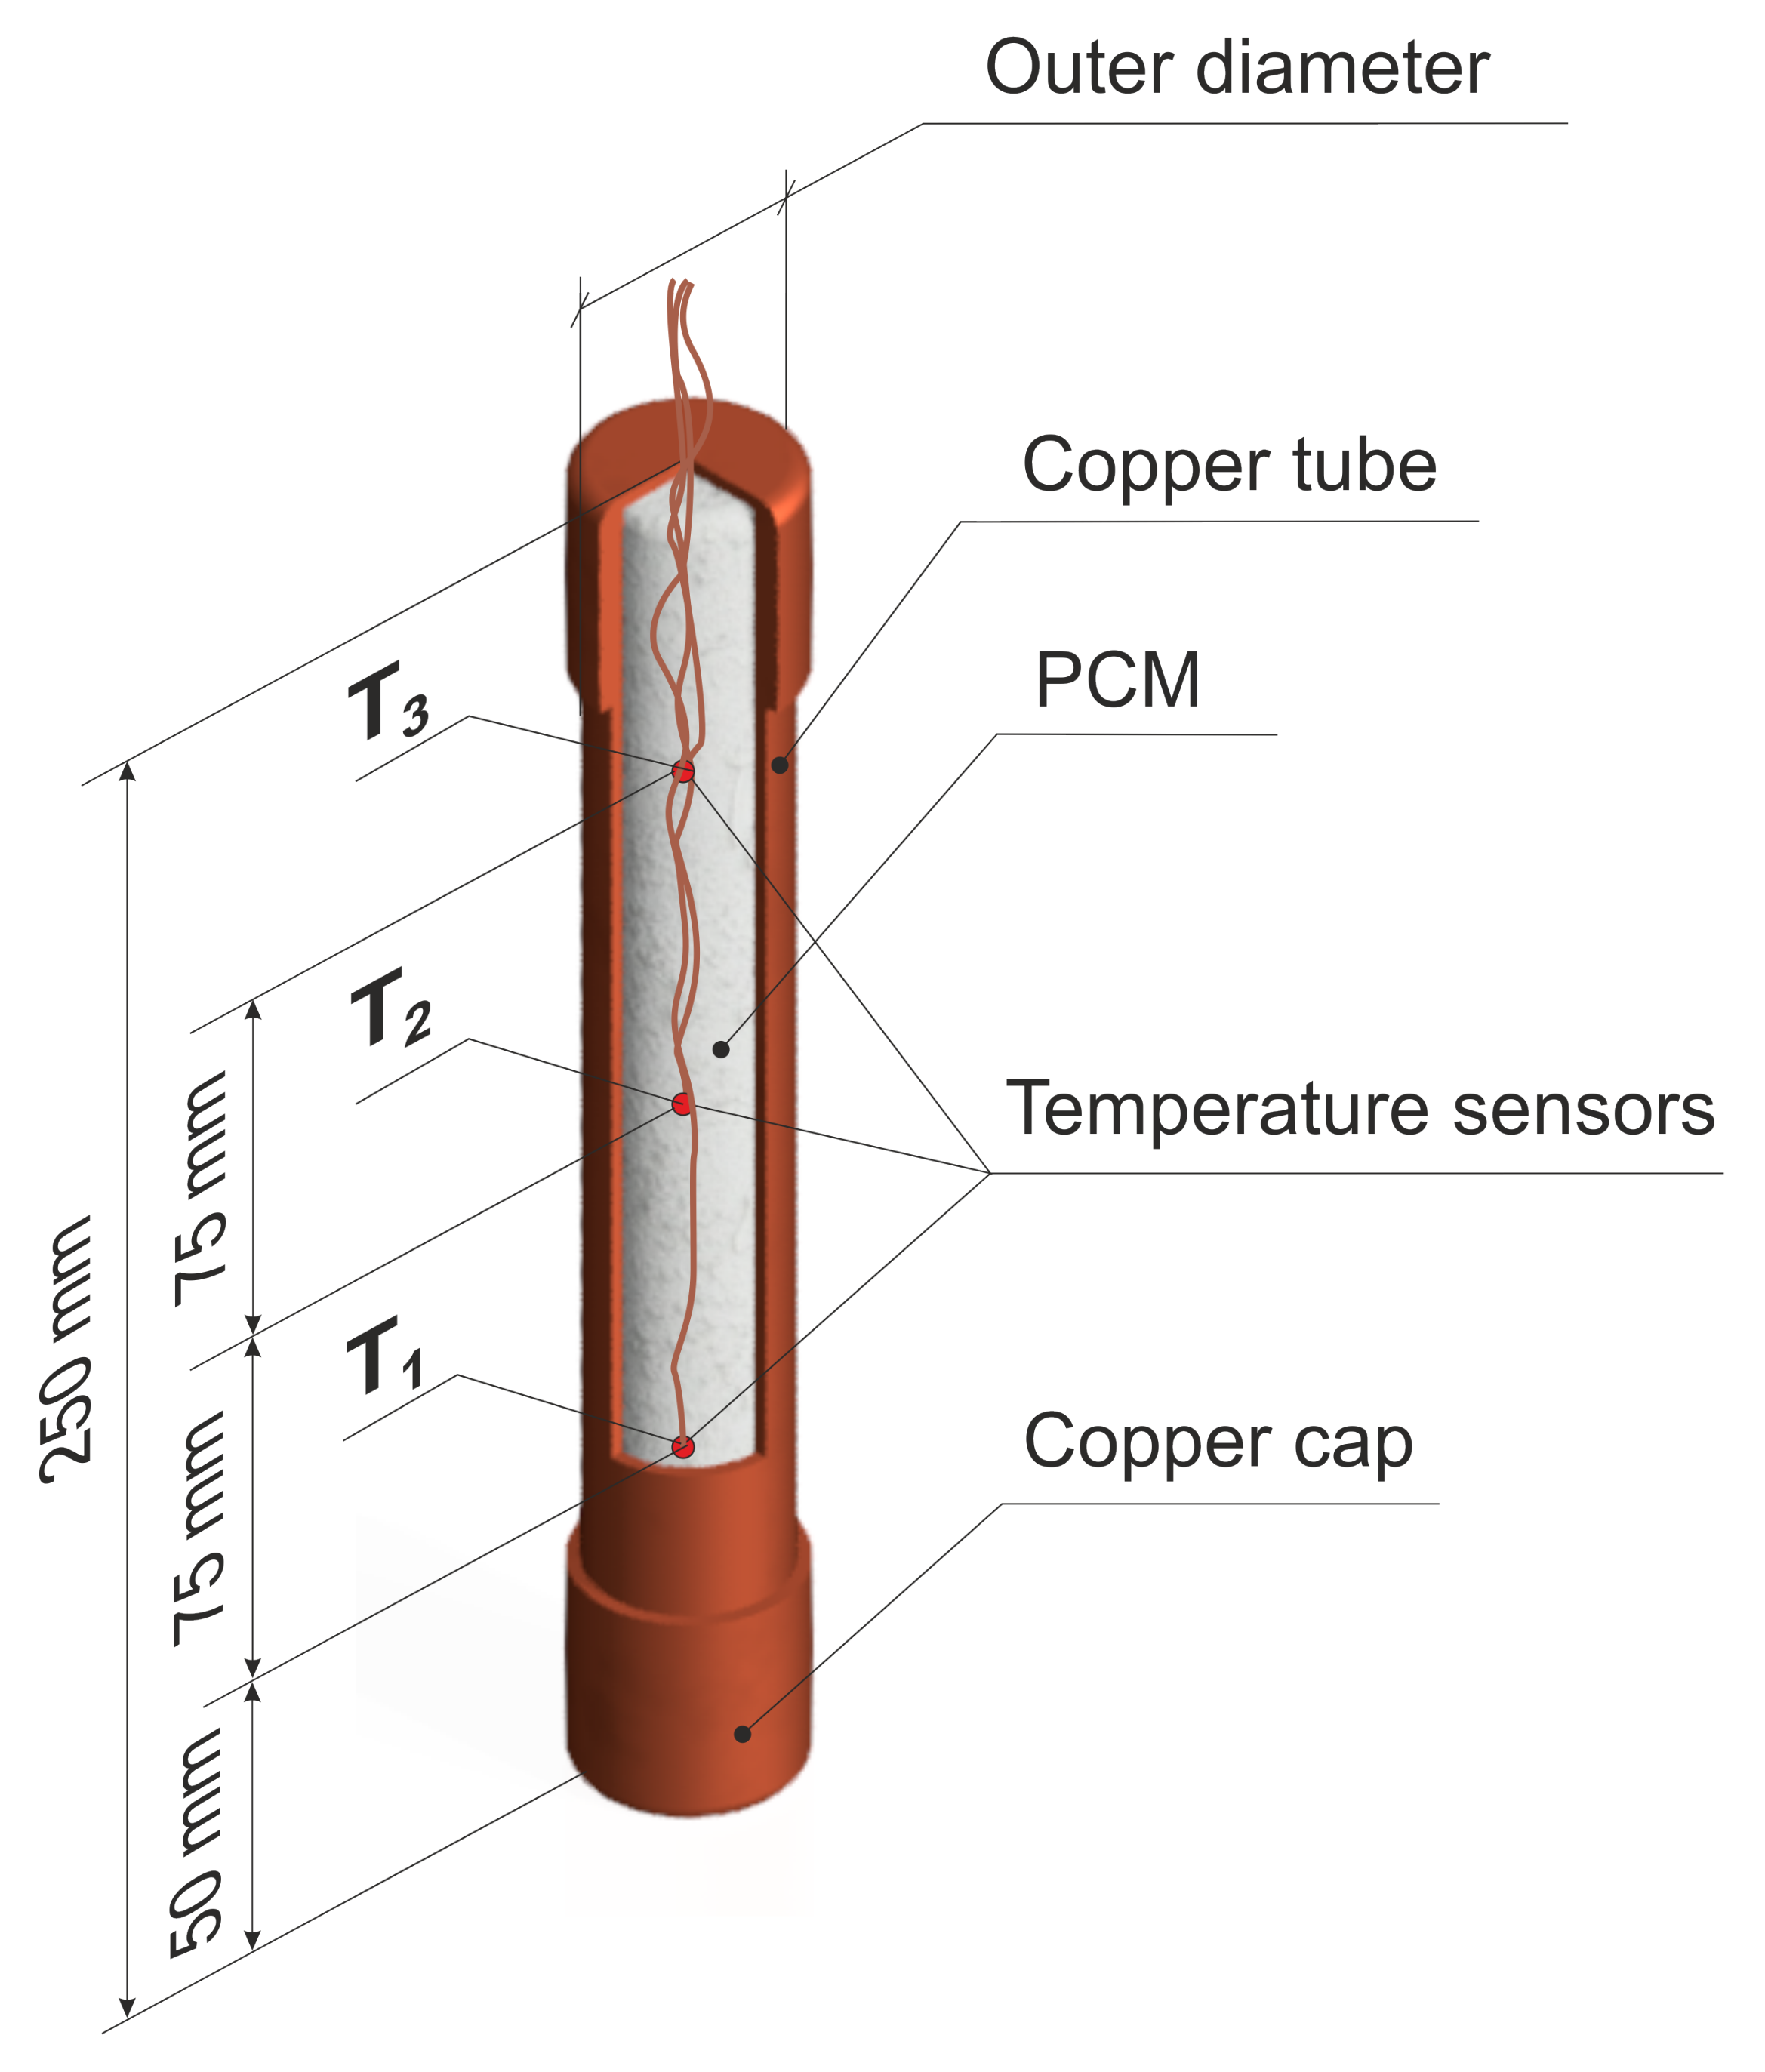
In Section 1, it was mentioned that the tested PCM is dedicated to working in a special storage heat exchanger/tank [38,39]. It was decided that the PCM, due to the design of the heat exchanger, should be studied in a cylindrical system for the conditions most similar to those in which it will be operated later. For this purpose, a wind tunnel, as presented in Figure 4, was used that met the operational and functional parameters. The obtained range of the Reynolds numbers (15,260–52,767) is fully turbulent and the heat transfer conditions (temperature and the Nusselt numbers) are similar to the considered storage tank.
The experimental set-up consists of four basic sections, operated in an open circuit suction mode. The first section is related to the air inlet. It is composed of a lamellar exchanger with a cross-section of 0.75 m × 0.74 mm in which it was possible to control the temperature in the range of −15 °C to 35 °C while using a chiller with a maximum cooling capacity of 4 kW. Subsequently, a stabilisation flow section was installed behind the lamellar exchanger. The stabilisation section is made of three net layers with a mesh size of approximately 1.5 mm × 1.5 mm. Such a system ensured a stable flow, without recirculation zones while also eliminating potential turbulence behind the lamellar exchanger. The next section is the so-called the Witoszyński nozzle, whose task is to shape a flat velocity profile in the measuring section. This special velocity profile allowed for homogeneous thermal-flow parameters along the entire length of the tested module to be obtained. The measuring section had a square cross section with dimensions of 0.25 m × 0.25 m and a length of 0.52 m. In order to eliminate the impact of the installed fan, between the measuring section and the fan a 0.9 m long channel with an identical cross-section as the measuring section was installed. The purpose of this channel was to stabilise the fan working conditions and eliminate any possible flow disorders that are caused by its operation. The fan that is installed in the experimental set-up provides the opportunity to achieve three mean values of velocity in the measuring section equal to 0.92, 2.27, and 3.18 m/s, respectively, which correspond to the Reynolds numbers 15,260, 37,688, and 52,767, based on the channel height of the test section. In order to achieve different mean value of air velocities, the fan power was regulated by a capacitor system. Generally, the maximum volume air flow rate was 1000 m3/h, which was generated for the maximum electrical power of the fan engine, equal to 150 W.
The parameters of inlet air, such as ambient temperature, pressure, and humidity, were measured just before the lamellar exchanger by a high-precision digital temperature, humidity, and airflow meter Testo 480 with Testo Robust Humidity Probe.

3.2. Tested Module

The PCM was experimentally tested in a special cylindrical module made of copper, as presented in Figure 5. This module was characterised by a fixed height and a wall thickness of 250 mm and 1 mm, respectively. Three different outer diameters of 15, 22, and 28 mm were studied. At the ends of the module, two pipe caps that were made of the same material with a height of 15 mm were mounted. Additionally, three T-type thermocouples have been installed in situ in the axis of the module, at half height, and one-third above and below, as is shown in Figure 5. The module was then placed and tested in the measuring section, as depicted in Figure 4 and Figure 6.
The PCM mass contribution in the module varied from 25.23% to 37.82%, (see Table 2). The theoretical heat transfer from the air to the modules were estimated and presented in Table 2, according to the producer information, as described in Table 1 and assumptions concerning paraffin and copper properties used during the numerical calculations, as summarised in Table 4. For paraffin, it varies from 2.87 kJ to 10.19 kJ for sensible heat and from 2.46 kJ to 8.74 kJ for latent heat. For copper the heat transfer varies from 1.62 kJ to 3.71 kJ. The heat storage in copper is 23.31% for d = 15 mm, 20.78% for d = 22 mm and 16.37% for d = 28 mm of the total system, respectively. Those estimations show that PCM phase change plays an important role during the heating of the module that is filled with the PCM.

3.3. Preparation of the Module to the Test

The module has been specially prepared in order to test the thermal behaviour of the module filled with the PCM for various thermal-flow conditions. First, before filling with the PCM, the module was degreased with propyl alcohol and thoroughly dried. Next, three T-type thermocouples with an accuracy of ±0.5 °C were placed in the prepared arrangement in the configuration that is shown in Figure 5. Subsequently, the module was filled with the phase change material. Before testing, the module was placed in a freezer for about 4 h to cool to a temperature of about −18 °C. The freezing process was completed when the material obtained the same temperature in the entire volume, which was monitored by thermocouples that were placed inside the module. The module prepared in this way was then mounted in the wind tunnel measuring section. Figure 6 presents the measuring section with the installed PCM module.

3.4. Measurement and Control Systems

The experimental set-up was equipped with two types of measurement system: one was based on Testo devices and the second one on the National Instruments module 4-Slot USB CompactDAQ Chassis (cDAQ 9174) working under the LabView environment. The high-precision digital temperature, humidity, and airflow meter Testo 480 had a build-in absolute pressure meter with an accuracy of ±3 hPa and allowed for up to three probes to be connected. The first Testo device was a Robust Humidity Probe, which was used to measure humidity and temperature of the suction air with an accuracy of temperature ±0.5 °C (from −20 °C to 0 °C) and ±0.4 °C (from 0.1 °C to 50 °C), relative humidity: ±2% RH (from 2.1 to 98% RH). The second installed device was a Thermal Flow Velocity Probe, Testo 480, which was used to measure the velocity profile. The device is characterised by the accuracy of measured velocity profile amounting to ±0.03 m/s + 5% of the measured velocity.
A special thermocouples net system was installed in order to measure inlet and outlet air temperatures at the measured section. At the inlet to the section, eight T-type thermocouples were installed and used to determine the average inlet temperature. At the outlet, one T-type thermocouples type of temperature sensor was mounted. The accuracy of installed T-type thermocouples was ±0.5 °C.
The combination of the National Instruments equipment and LabView software allowed for the measurement of temperature with a high resolution and frequency. During the experiments, it was sufficient that the measurements were carried out with a frequency of 0.2 Hz (every 5 s).

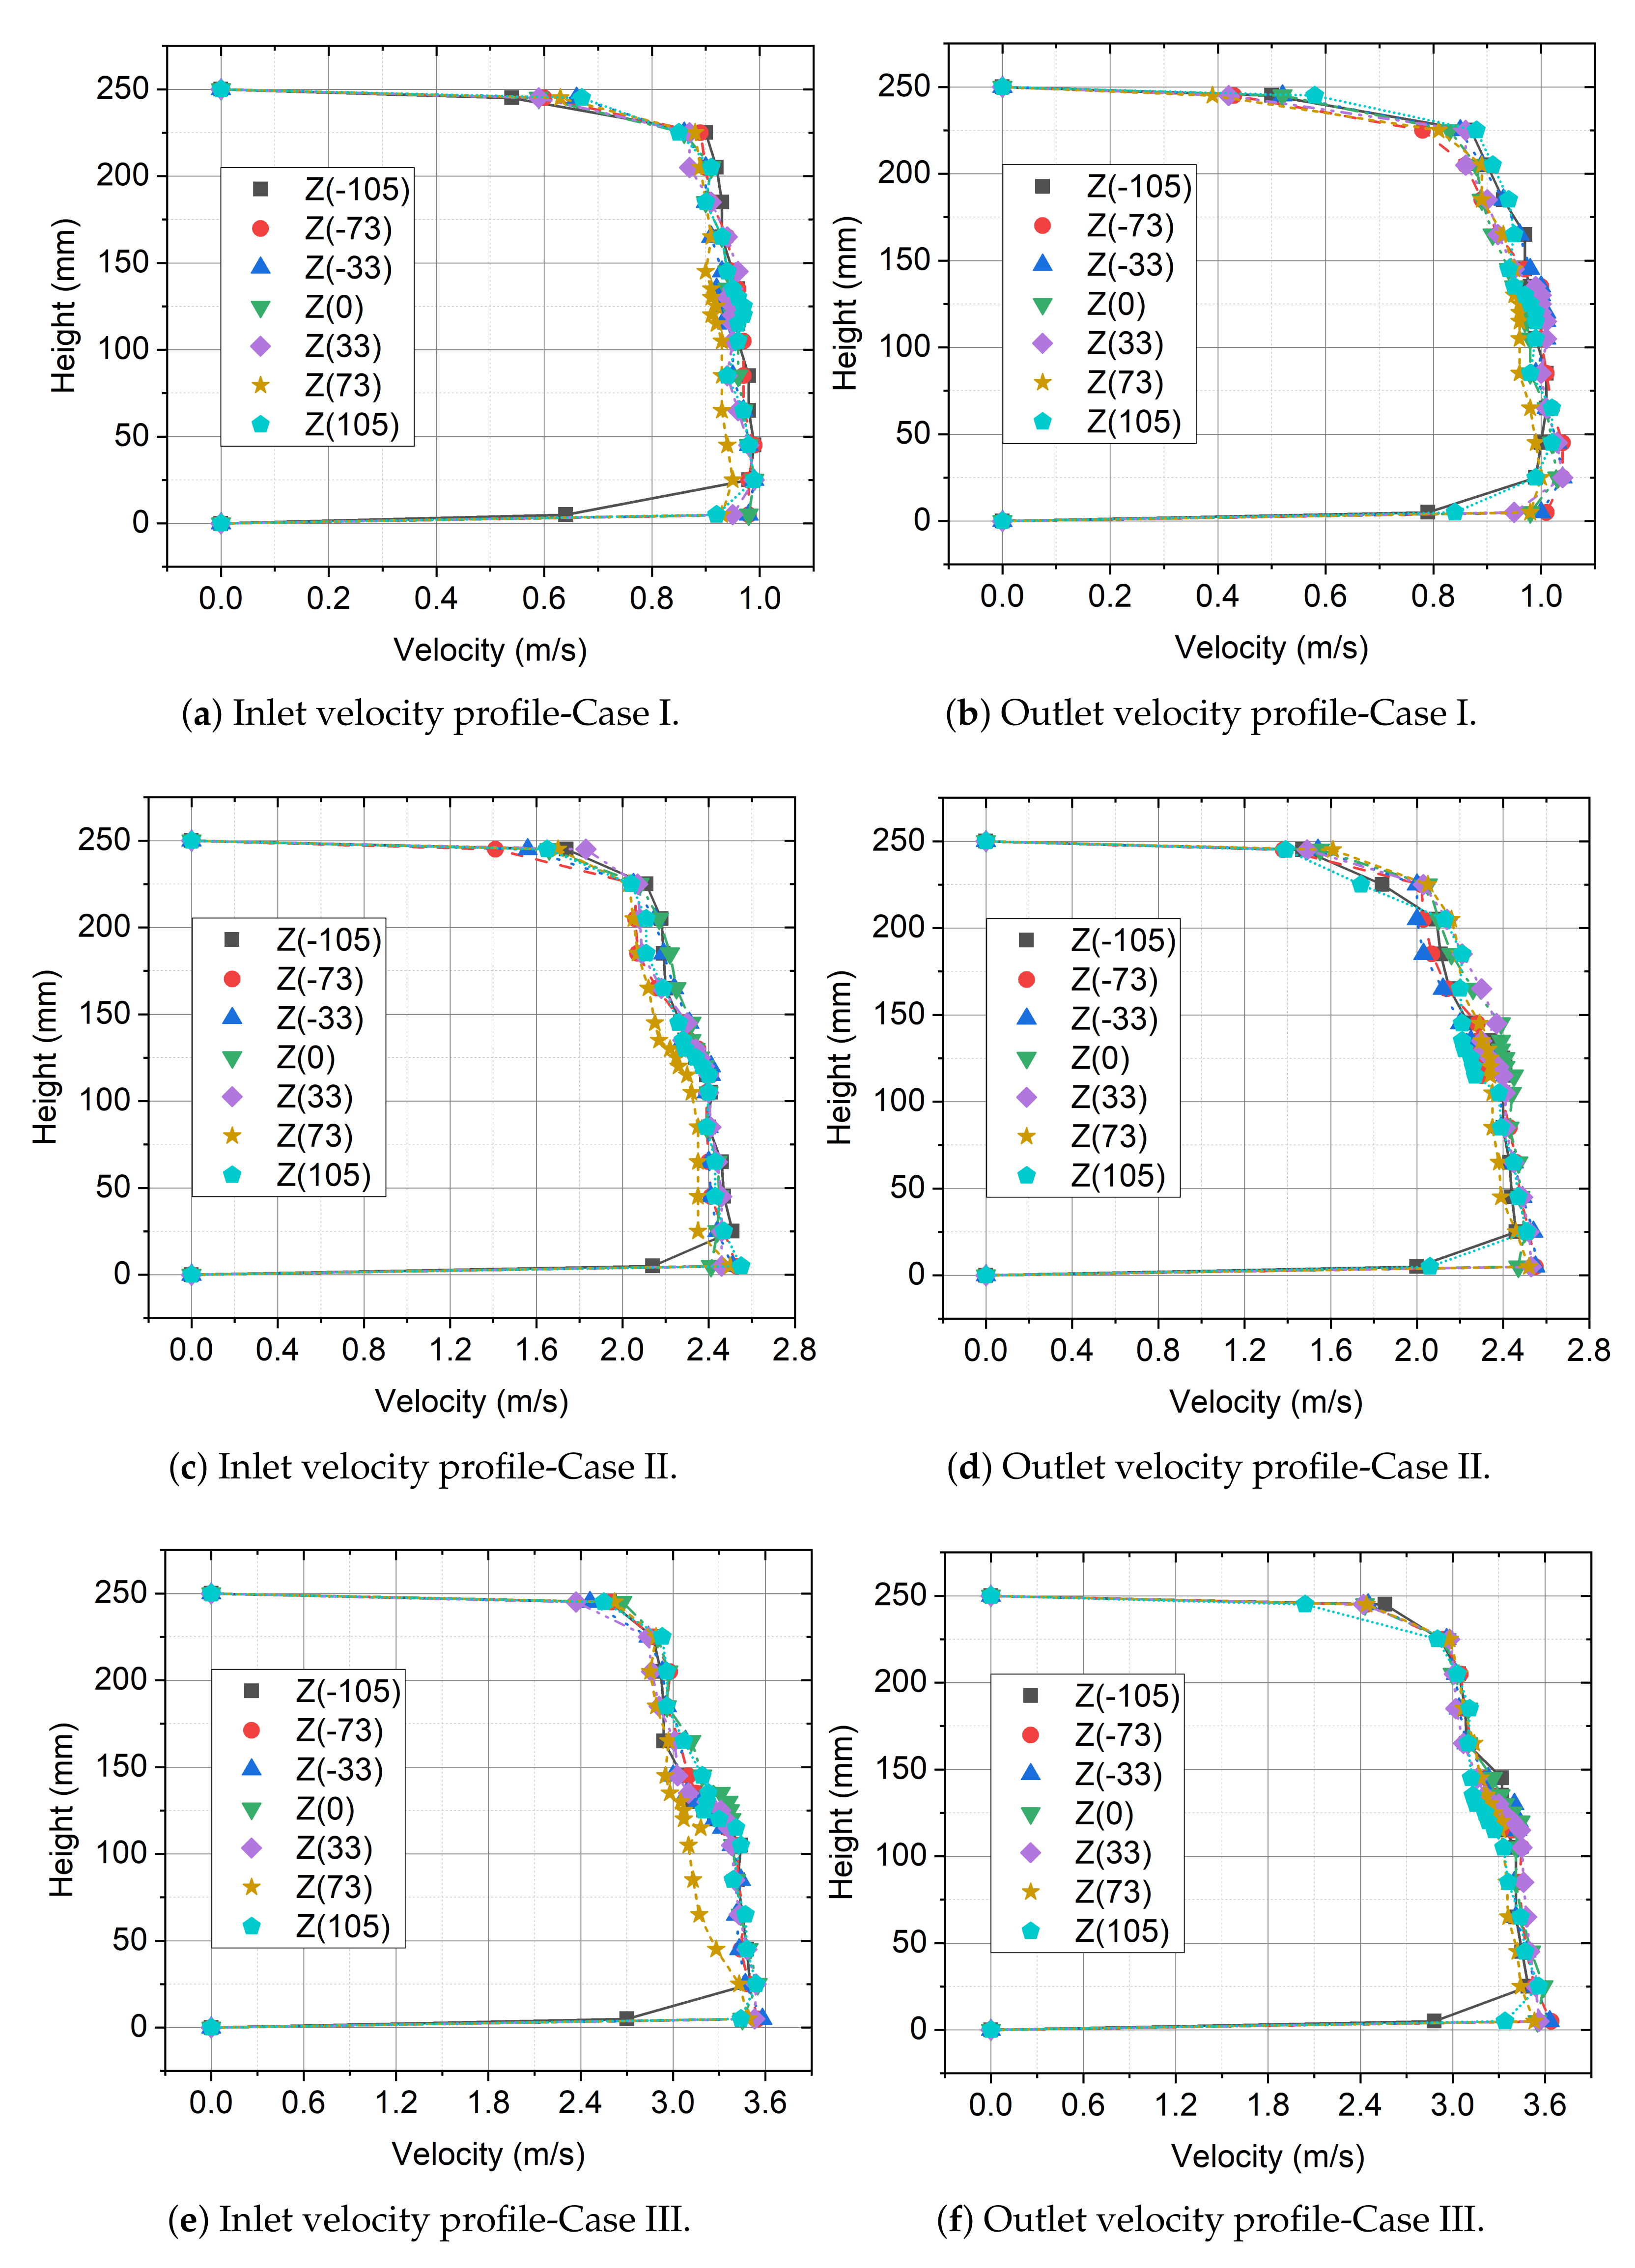
3.5. Velocity Profiles at the Inlet and Outlet of the Measurement Section

A special construction of the inlet section with the installed Witoszyński nozzle contributes to the formation of quasi-uniform thermal and velocity profiles in the measurement section, as mentioned in Section 3.
Before the measurement campaign, the velocity profiles at the inlet and outlet were determined. The measurements of the velocity profile were carried out at a distance of 20 mm from the inlet and outlet edges of the measuring section. The velocity profiles were determined at measuring points 33, 73, and 105 mm from the channel’s symmetry axis.
In total, seven holes have been made in the top of the measuring section cover for measurement purposes. The thermal flow velocity probe that was connected to the Testo 480 module has been inserted into these holes, mounted on a special measuring instrument. A measuring device, similar to a caliper allowed for precise measurement of the velocity profile along with the channel height with an accuracy of ±0.1 mm. In total, one profile was determined while using 19 measurements, concentrated in the central part of the channel. The results of the obtained profiles at the inlet and outlet of the measuring section for different powers of the fan are presented in Figure 7, where a larger number represents higher air velocity.
The measurements that are presented in Figure 7 showed that, for all the tested ranges of fan power, the velocity profiles are characterised by a flat profile. The obtained flat velocity profile is a consequence of the use of a specially shaped inlet contraction section designed according to the Witoszynski curve equation [41]. The analysis points out that the differences between the average values determined do not exceed 7.4% of the local value of velocity. Table 3 summarises the test results. In addition, for further analysis, each analysed value of average speed: 0.0, 0.92, 2.18, and 3.18 m/s was defined as Case 0, Case I, Case II, and Case III, respectively.

4. Numerical Modeling of the Analyzed System with PCM

4.1. Process Governing Equations

The thermal-flow behaviour in the PCM and flowing air can be described by a standard set of equations [42,43] and for the three-dimensional case, comes down to solutions of Partial Differential Equations, (PDEs), which include a mass, a momentum, and an energy equation [44]. In this context, for solving the set of equations, one of the most frequently used numerical methods, called the Finite Volume Method (FVM), [45,46] was applied.
In order to solve transport equations of mass, momentum and energy, the commercial CFD tool-Ansys Fluent has been utilised [47]. To take the phase change of the PCM into account, an enthalpy-porosity technique [48] has been used, which is already implemented in Ansys Fluent software module. Using this technique, the interface is not explicitly tracked, but the liquid fraction for each domain cell is solved in each iteration. The cells that contain a liquid fraction β between 0 and 1 create an interface region, called the mushy zone. This region is treated as a porous medium with porosity ranging from 1 for a liquid to 0 for the solid. The porosity is equal to the liquid fraction.
The liquid fraction is calculated knowing the balance of the enthalpy H. The enthalpy of a material is computed as a sum of sensible enthalpy h and the latent heat content Δ H
H = h + Δ H
where sensible enthalpy h is defined as follows
h = h r e f + T r e f T c p d T
h r e f and T r e f are reference to enthalpy and temperature, respectively, and c p is specific heat at constant pressure. Regarding the liquid fraction, it is defined in the following manner:
β ( T ) = { 0 i f   T < T s o l i d u s T T s o l i d u s T l i q u i d u s T s o l i d u s i f   T s o l i d u s < T < T l i q u i d u s 1 i f   T > T l i q u i d u s
Knowing the latent heat L of the material used, the latent heat content in Equation (1) is calculated as
Δ H = β L
where Δ H varies between 0 for a solid and L for a liquid. Based on the liquid fraction distribution, the enthalpy is calculated and then inserted into the energy equation, where the temperature distribution is solved via an iterative manner.

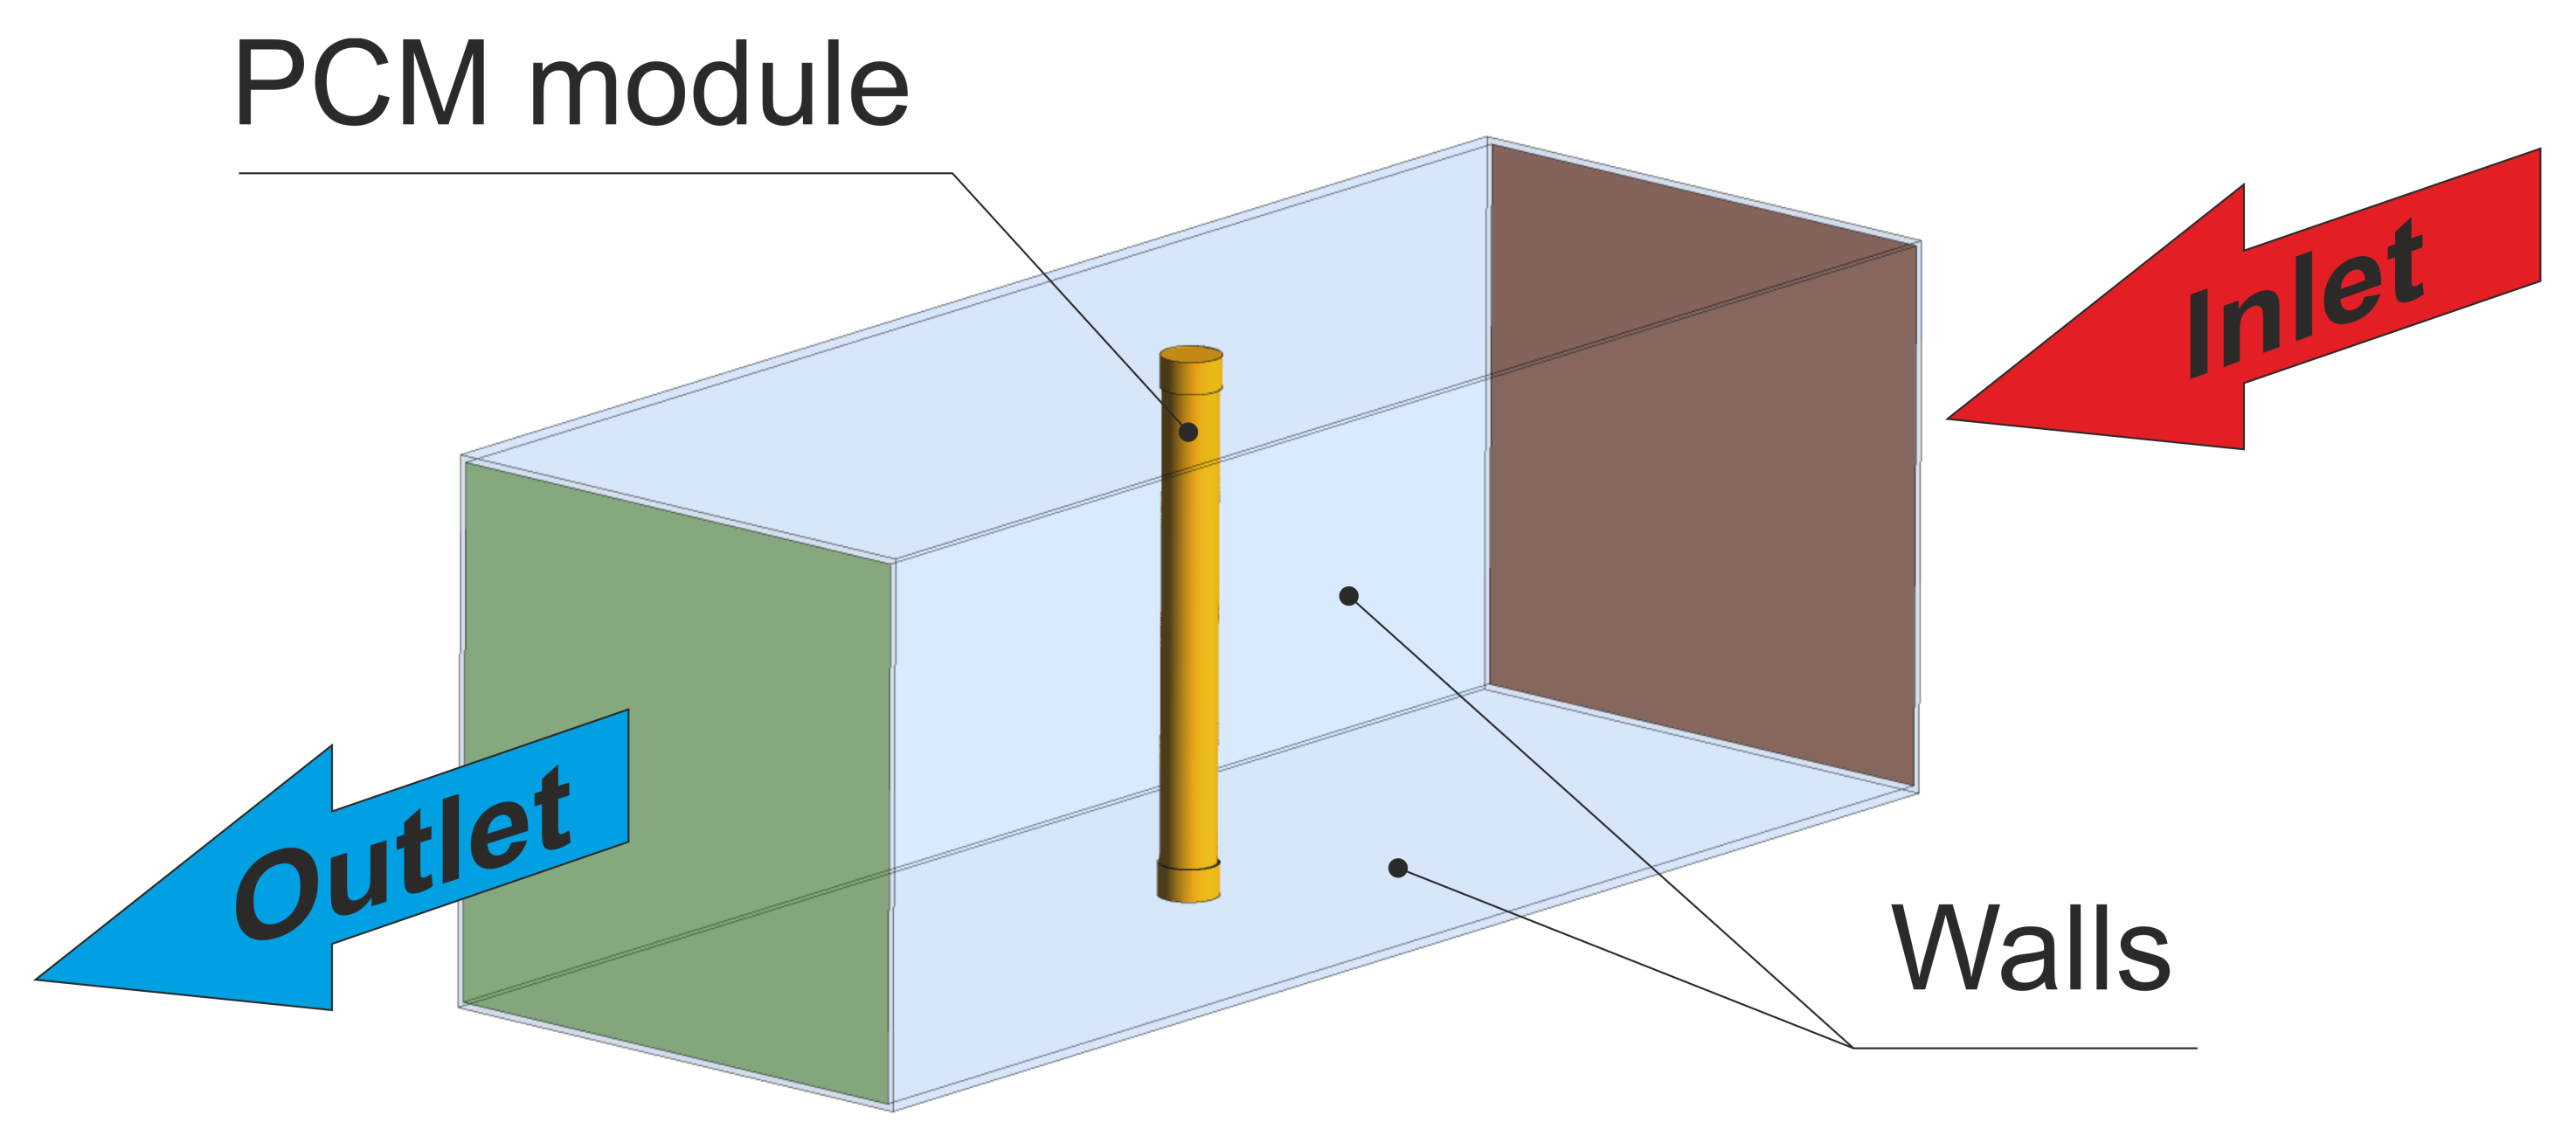
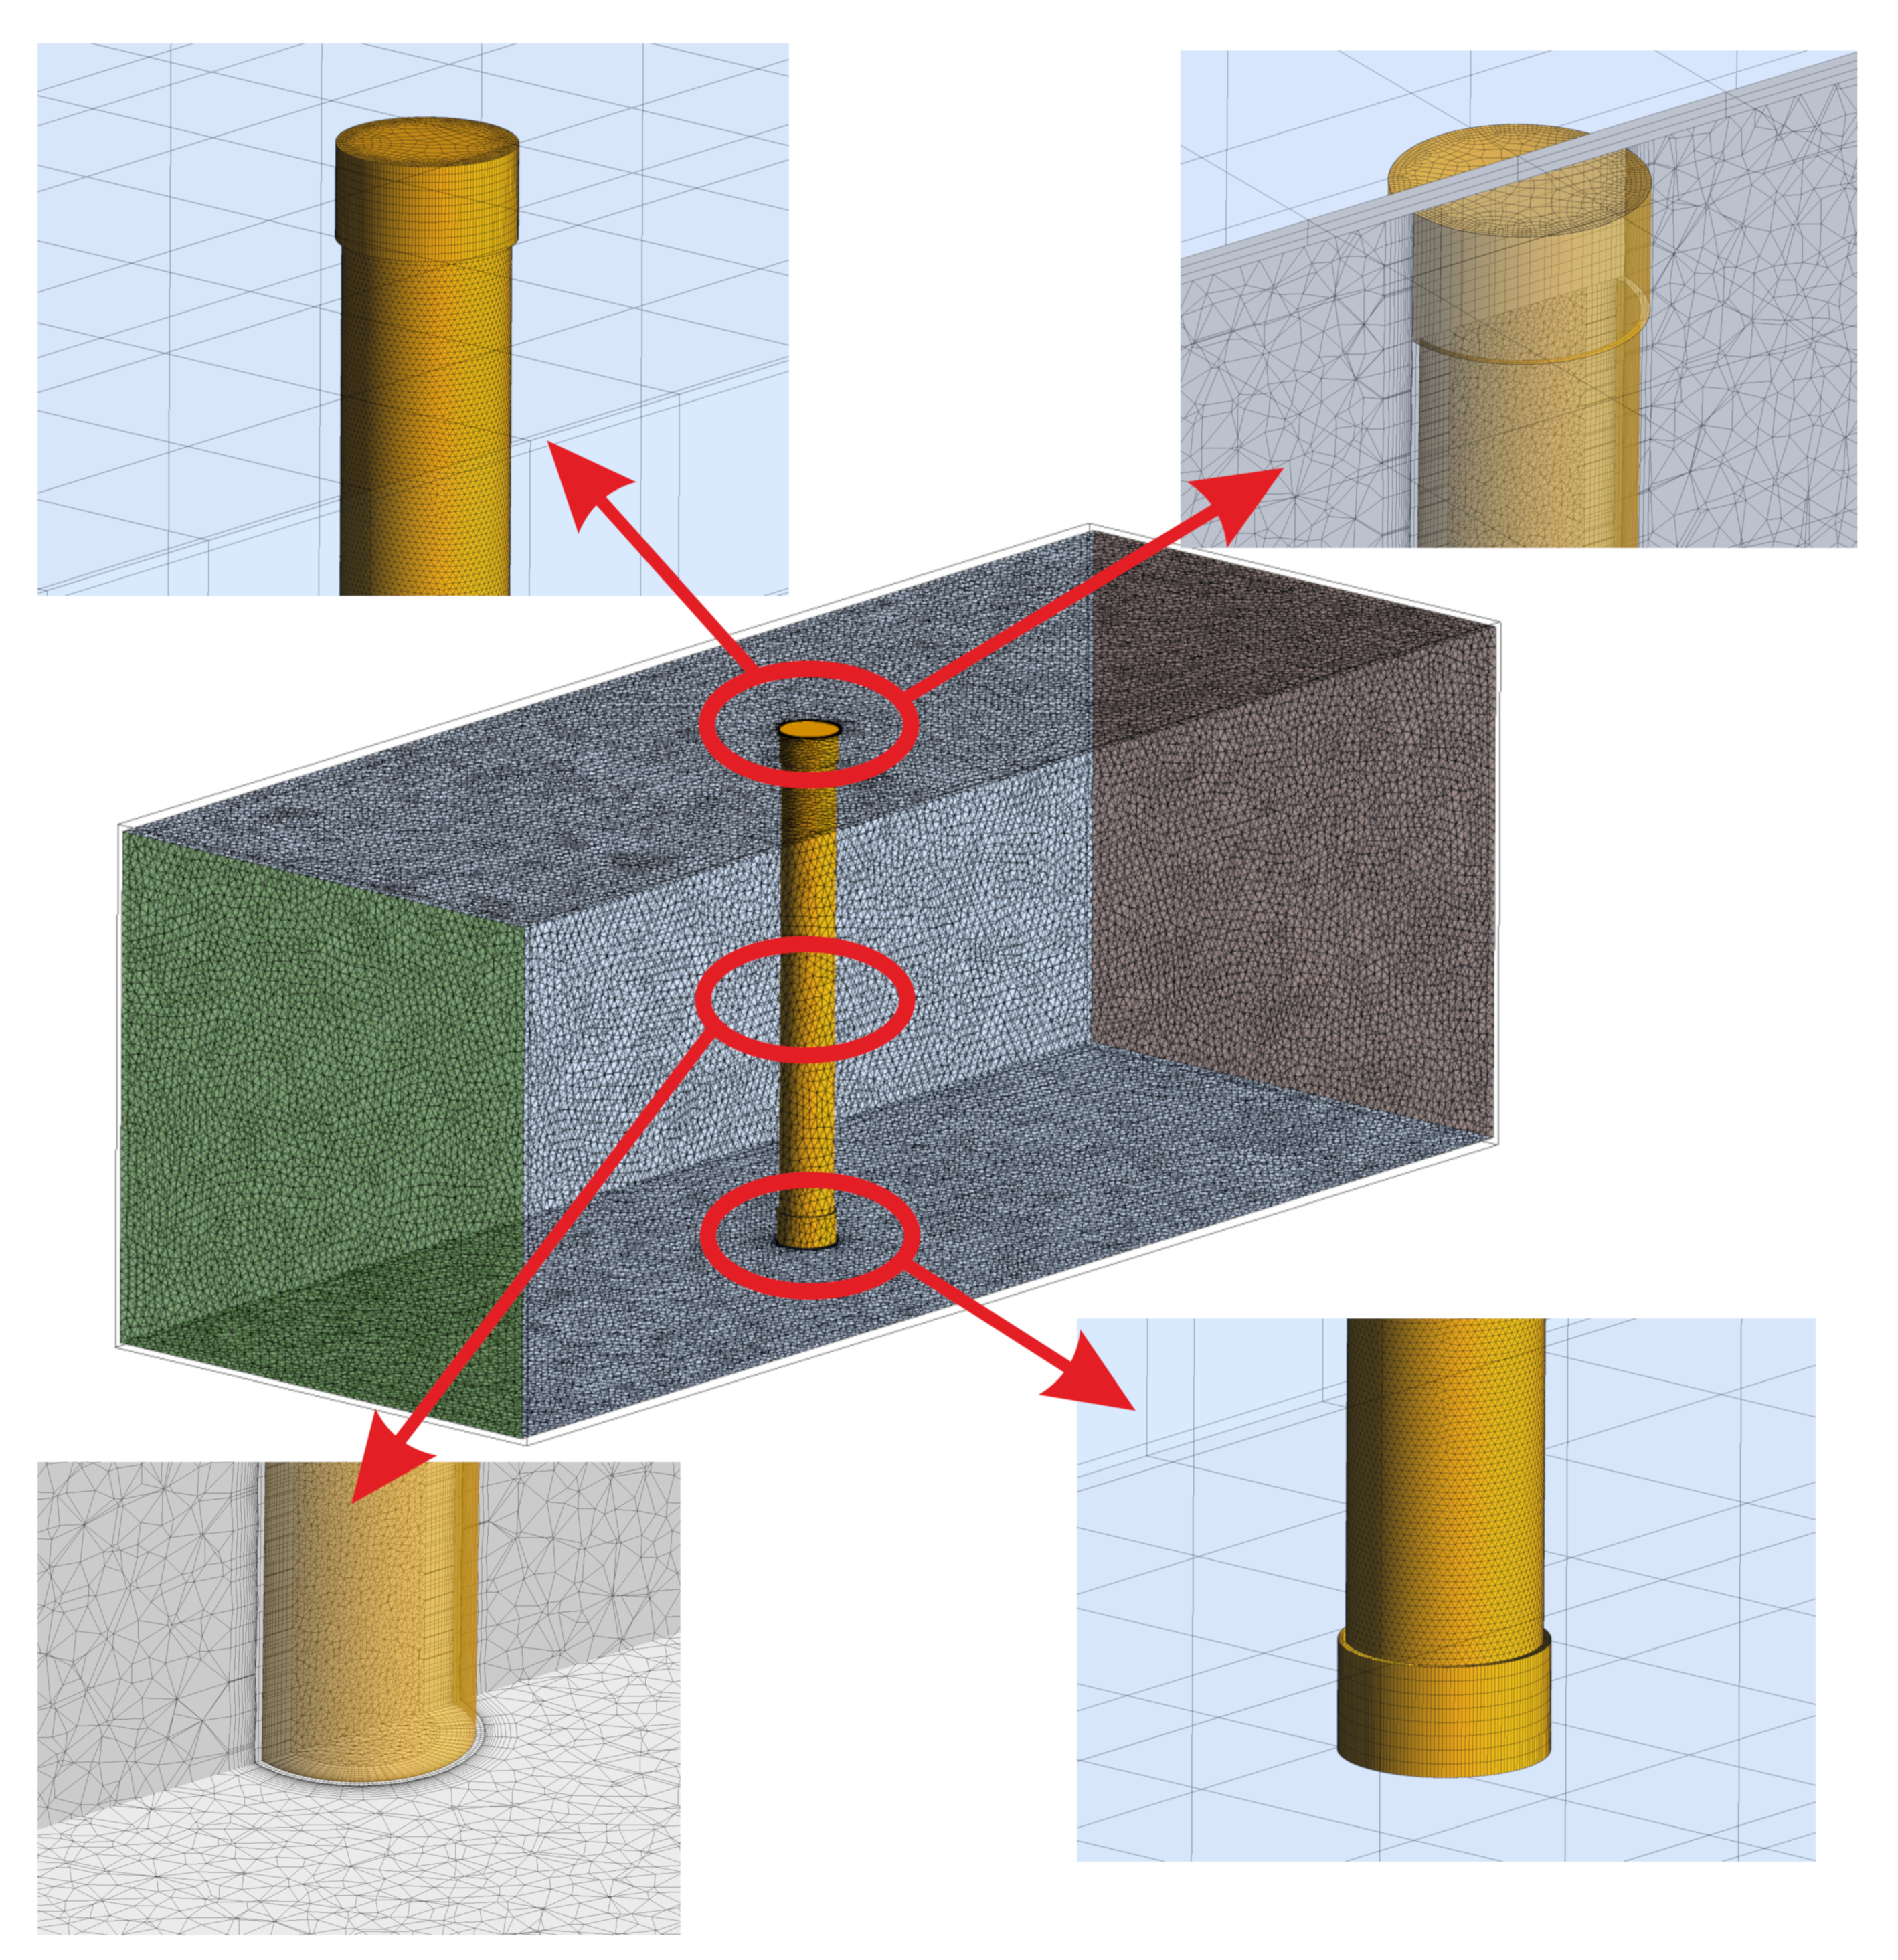
4.2. Geometry, Boundary and Initial Conditions and Numerical Schemes

The geometry used during numerical calculation is based on the experiments that are described in Section 3. For the purpose of simplifying the calculations, only the measuring section is modelled. Figure 8 presents a scheme of the studied case. During the simulation, to the rectangular duct, made of plexiglass, hot air of a temperature 24 °C inflows according to the experimentally obtained uniform velocity changing in a range of 0.92 ÷ 3.18 m/s. The duct is 0.7 m long and the inlet surface is a square, with a side length of 0.25 m. The wall thickness of the duct is 3 mm. In the middle of the duct, the copper cylinder with an outer diameter of 15 ÷ 28 mm and 250 mm long is set. To close the module, pipe caps that were made of copper, 15 mm long and 15 ÷ 28 mm in diameter, were mounted at the ends of the test element. The cylinder and bases are hollowed and the wall thickness is 1 mm. The inside of the cylinder is filled with the tested PCM. The air outflow has an atmospherical pressure of 1 bar.
For the air, plexiglass and copper materials constant thermophysical properties are assumed. For the real PCM, physical properties, such as heat capacity or thermal conductivity, vary with temperature [49]. Thermal conductivity k is higher in the solid than in the liquid phase. In the case of the PCM, the density, thermal conductivity, and dynamic viscosity are regarded as temperature-dependent and calculated via Equations (5)–(7), respectively. Table 4 describes the thermophysical properties of all materials that are used during the numerical simulations.
Density of the PCM:
f o r T < T s o l i d u s ρ = 910 kg m 3 f o r T T s o l i d u s ρ = 790 kg m 3
Thermal conductivity of the PCM:
f o r T < T l i q u i d u s k = 0.5 W m K f o r T T l i q u i d u s k = 0.4 W m K
Dynamic viscosity of the PCM [50]:
η = 0.001 exp 4.25 + 1700 T Pa s
For all analysed cases, the axis of the cylinder is parallel to the gravity vector. The ratio of the module height to the inside diameter is large and it varies from 8.93 to 16.67, in the PCM volume, natural convection current occurs, which has an important impact on heat transfer and fluid flow behaviour in PCM. To take this phenomenon into account, the Boussinesq approximations that are shown in Equation (8) have been made in the PCM domain using UDF procedure. The following term has been added to the y-momentum equation for cells with liquid fraction higher than 0 within PCM domain:
S v = ρ l i q u i d u s g β T T s o l i d u s
where: the thermal expansion coefficient of the paraffin equalled β = 0.000778 1/K has been included in the numerical calculation procedures [51].
The geometrical model that is presented in Figure 8 was discretized in space with the use of Ansys Meshing software. A tetragonal mesh was used within the air and PCM space. Solid elements were discretized while using hexahedral elements. Additionally, on the outer and inner surfaces of the cylinder 12 inflation layers have been applied. The thickness of the first element adjacent to the wall was set to 0.1 mm. In order to ensure energy transfer between solid and fluid regions, the applied meshes were non-conformal and were connected with the use of coupled wall boundary condition [47]. Figure 9 presents the employed mesh with details.
Table 5 summarises the complex boundary conditions applied during the simulations.
Air and PCM were both modelled as incompressible fluids. In order to account for turbulence, in the air region a standard k ε turbulence model with enhanced wall treatment was employed. In the PCM region, laminar flow is assumed. The boundary conditions used in the model are depicted in Figure 8. A no-slip boundary condition was utilised on all walls. The initial temperature of the tunnel walls and the air was set to 24 °C, while the PCM, cylinder, and lower and upper bases to 2 °C.
Calculations have been performed in a transient mode with a time-step of 0.01 s with the first-order implicit treatment. The total time of the simulation was 1440 s. The SIMPLE algorithm with the second-order scheme was used for pressure-velocity coupling. Transport equations of momentum, turbulent kinetic energy, turbulent dissipation, and energy were discretized while using the second order upwind scheme. Gradients were calculated with the use of a least-square cell-based scheme [47]. The solution in each time-step was considered as converged if the residuals were less than 10−6; however, a maximum of 30 iterations per time-step was done. For energy, liquid fraction, and turbulence equations the under-relaxation of 0.5 was applied. For other equations, the default values were set. The calculations were conducted in a parallel mode on a cluster with the use of 16 Intel Xeon E5-2670 v3 2.3 GHz (Haswell) processors. The time of the calculations was approximately two weeks.

5. Results

5.1. Experimental Results

The experimental tests were carried out for the outer diameters of 15, 22, and 28 mm, and the thermal-flow conditions obtained in the wind tunnel, as defined in Table 3. This combination of the outer diameters and air tunnel conditions necessitated 12 measurements. Figure 10 shows a representative example of the heating process for a module with an outer diameter of 28 mm and an air flow rate of 0.92 m/s (Case I).
Generally, from the performed experiments, it can be concluded that the heating process of a module filled with the PCM can be divided into five phases. This solution is unique in comparison to homogeneous PCM systems, where only three phases can be observed [49,52,53]. In the first phase, starting with a uniform initial temperature of −18 °C throughout, the mixture of paraffin wax and water coexisted in solid form is heated. This phase that is presented in Figure 10 as Phase I is characterised by a linear temperature change with a high value of the inclination angle of the characteristic. There are two reasons why temperature increases rapidly. The first reason is related to the fact that in this temperature range there is the highest temperature gradient between the tested module and the air flowing outside; therefore, the highest temperature driving force occurred. The second reason may also be that ice has half of the specific heat lower than water.
Additionally in this temperature range, mention should be made of the condensation of water vapour that is contained in the humid air. This phenomenon also affects the thermal processes that take place during the heating of the module. Subsequently, starting from approximately −3 °C to 0 °C, flattened temperature curves can be observed (the first area marked in yellow called Phase II), and the temperature stratification process in the module begins. This phase is directly related to the process of changing the water phase from ice to water. The stratification of temperature curves also indicates the convective flow term in the module itself. Figure 10 shows the third phase as Phase III between the phase transitions of water and paraffin wax. It is characterised by an increase to a temperature of about 4 °C. From this temperature the fourth phase starts (Phase IV indicated in Figure 10 as the second area marked as the yellow). The curves reach a plateau and can be treated as a process associated with the phase transformation of the paraffin wax contained in the emulsion. This phase ends when the temperature reaches 6 °C. Subsequently, during the rest of the process, described as the fifth phase (Phase V), the temperature of the mixture steadily increases to an ambient condition.
The phase analysis performed above is mainly conducted for the temperature evolution recorded by the T 3 thermocouple. However, during the measurements, some differences between the individual thermocouples were observed. Despite the fact that the design of the wind tunnel ensures the achievement of homogeneous thermal and flow conditions on the outer surface of the cylinder, in the upper part of the measuring section, as shown in Figure 7, the velocity values are decreased and, thus, the heat flux to PCM is also decreasing. A second major reason for the temperature evolution discrepancy may be that the thermocouples are not positioned in the module axis. This applies to the two bottom thermocouples, which were the most difficult to install in the module and during the cooling process of the module, could have moved closer to the inside of the module wall. However, regardless of the differences, all of the curves have similar trends and phases.
The identification of the aforementioned phase transitions for ice-water and paraffin wax can also be observed in Figure 11. If a derivative of the temperature function dT/dτ versus time is determined, then the first two “valleys” of the function with values smaller than 0.005 °C/s can be interpreted as the phase transitions (areas marked in yellow in Figure 11). The rest of the derivative close to zero starting around 6000 s describes the so-called steady-state process, i.e., the temperature in the module reached about 90% of the ambient value.
Figure 12 shows the comparison of the changes in the recorded values of T 3 thermocouple for different velocity and external diameters of the module. As the airflow rate flowing around the module increases, the heat transfer to the PCM also increases. This is evident in the dynamics of temperature increase and the time of phase transitions, and it can be seen that, for higher velocity values, the temperature increase is faster. However, as the outside diameter of the module increases, the amount of PCM used increases and, hence, the amount of cold accumulated. For this reason, the increase in temperature is less dynamic.
From a practical point of view, it is important to assess how fast the process is going through the characteristic phase. In the case of the tested module, two characteristic temperature ranges were selected: the first temperature range is the range from −4 °C to 0 °C (phase marked in Figure 10 and Figure 11 as Phase II-ice–water phase transition region), the second is the phase change range of the tested PCM contained in temperatures from 4 °C to 6 °C, showed in Figure 10 and Figure 11 as Phase IV-paraffin wax phase transition region. Table 6 presents the measured time interval for the various velocity and module diameter values that are defined in Table 3 as Case 0, Case I, Case II, and Case III for the water in the mixture, while Table 7 specifies this for paraffin wax.
It is obvious that the longest time of phase transitions will occur for processes in which the velocity value is zero (Case 0) and it will increase with increasing diameter, i.e., mass of PCM. In order to show this process in a graphical form, it would be advisable to refer to the longest process (Case 0) and when a system with forced convection is used (Case I-yellow, Case II-cyan, and Case III-grey). In the article, a dimensionless parameter called Relative Time Increase (RTI) was introduced and defined by the following formula:
R T I = τ 0 τ τ 0 100 % ,
where τ 0 -time of phase change for Case 0 and τ-time of phase change.
In the case of the phase transitions of water that are shown in Figure 13a, the smallest time increments occur for the lowest velocities and amount from 42% to 50%. With an increase in the value of the velocity of the flowing air, the time needed to achieve the phase changes is reduced from 66% to 71%, respectively.
For paraffin wax, as presented in Figure 13b, the situation is very similar, only the values of the RTI are different. For the smallest air velocities, the RTI varies from 55% to 61%, and for the highest velocities from 85% to 87%.
Figure 13 also shows how effectively the time of the melting process changes. The analysis presents that for paraffin it is more "sensitive" than for water to alterations in external conditions, i.e., heat transfer coefficients. Interestingly, the effect of changing the diameter is less effective and it only causes a change in the accumulated heat value, not in the phase transition time.

5.2. Numerical Results

In Figure 14, Figure 15 and Figure 16, the comparison of the experimental and numerical results for the analysed values of air velocity 0.92 (Figure 14), 2.27 (Figure 15), and 3.18 m/s (Figure 16) and module diameters (a) 15, (b) 22, and (c) 28 mm are presented. All of the comparisons were carried out up to 1440 s, which allowed for the analysis of mainly phase changes taking place in the paraffin wax, due to the long computing time. Additionally, the initial temperature for all cases was 2 °C, because of the fact that the considered model did not take the ice-water phase change into account.
It is visible that, especially for low diameter (d = 15 mm) of the cylinder (see Figure 14a, Figure 15a, and Figure 16a), the numerical model agrees quite well with the experimental data. At the beginning of the simulation, an inaccurate prediction can be caused by the initial conditions for the temperature and velocity contours. In the experiment, the flow is fully developed while in the model, uniform distributions of velocity and temperature are assumed. For larger diameters, the time of heating is higher and the initial influence of the conditions is slightly larger. For d = 28 mm (Figure 14c, Figure 15c, and Figure 16c) numerical errors are marginally higher than in the case of d = 22 mm (Figure 14b, Figure 15b, and Figure 16b).
For the higher velocity of v = 2.27 m/s and diameter of d = 15 mm (Figure 15a), the accuracy of the model is similar to the case of v = 0.92 m/s (Figure 14a). The numerical errors slightly increase with the increase of the cylinder diameter.
With the increase of the inlet velocity to 3.18 m/s (see Figure 16), higher discrepancies between the experimental and model results were recorded. In the case of a small diameter (d = 15 mm, Figure 16a), the model agrees fairly well with the experiment. For larger diameters, i.e., d = 22 (Figure 16b) and d = 28 mm (Figure 16c), the accuracy is still satisfactory and the model predicts the temperature evolution well; however, the errors are more visible. For higher velocities, the turbulence model may also have a greater impact on the results. On the other hand, probably, the influence of the turbulence model was not the goal of this work and further studies should be conducted.
Figure 17 and Figure 18 show the exemplary numerical results of temperature distributions in the vertical and horizontal middle plane, respectively, for different times. It is visible from Figure 17a–d that the heating of the PCM firstly takes place in the top and bottom space of the cylinder. This is caused by the conduction heat flux at the contact surfaces of the cylinder and direct contact with the tunnel walls. Moreover, more mass is melted in the upper part of the cylinder when compared to the bottom one. The reason of this is natural convection that intensifies thermal-flow processes in the upper part of the solid [54]. Similar results and observations are also presented in the literature [55,56,57,58].
Over time, the isotherms of high temperature propagate into the interior of the PCM. Behind the cylinder, a wake is developing, which gives rise to change temperature distribution in the front of, as well as in the back, of the cylinder (see Figure 18). The differences in temperature distribution around cylinder are caused by increasing local heat transfer coefficient, which was described by Cengel [59] and Incropera et al. [60]. At the beginning (Figure 18a,b), behind the cylinder, one large area of lower temperature exists. For greater times (Figure 18c,d), this area slightly shrinks and its length behind the cylinder is shortened. This process is caused by changes in temperature difference between the cylinder and air. With an increase of the PCM temperature, the temperature difference decrease; therefore, the air faster reach surrounding temperature.
As it results from the comparison of the results that were experimentally obtained with the results obtained from the proposed numerical model, presented in Figure 19, the relative error in a wide temperature range does not exceed 10%. However, it has been observed that at the beginning of the heating process and in the temperature region where the phase change occurs, this error can reach even 20% (see enlarged analysis region in Figure 19 in the upper left corner). A few factors could cause the observed differences between the numerical and experimental results, in particular, in the initial heating phase and in the phase change region. During the numerical calculations, only pure paraffin wax was analysed. In the experiment, paraffin wax that was capsuled in the melamine-formaldehyde membrane micro-capsules was used. Such an interior structure is difficult to model and it was not considered in the simulations. Moreover, during the preparing of the experimental set-up, unintentional human errors could occur, e.g., imperfect placement of the thermocouples in the module axis or its movement due to a melted PCM, which can result, in particular, in the region of phase change. In the numerical investigations, boundary conditions were averaged and stable during the heat transfer processes. On the other hand, in the experiment, chiller hysteresis caused unstable inlet air temperature and, therefore, unstable boundary conditions. Another thing could be the air humidity impact on the heat transfer when the air dew point temperature was higher than the module temperature. During this situation, vapour from the air condensed on the module walls, which probably caused an intensification of heat transfer.

6. Conclusions

The thermal-flow processes taking place in the low-temperature phase-change material, which was a mixture of paraffin wax that was capsuled in a melamine-formaldehyde membrane and water, were presented and analysed in the article. The experimental and numerical investigations during transient processes were carried out for the copper modules filled with a PCM for three different outer diameters (15, 22, and 28 mm) and a fixed height of 250 mm. A total of four cases i.e., for stagnant condition (0.0 m/s) and for three different mean velocity values of 0.92, 2.27, and 3.18 m/s for each module were tested. The experiment was performed in a wind tunnel, especially designed for this purpose. In addition, the internal structure of the tested PCMs was also analysed while using a SEM. The following conclusions can be drawn from the research carried out:
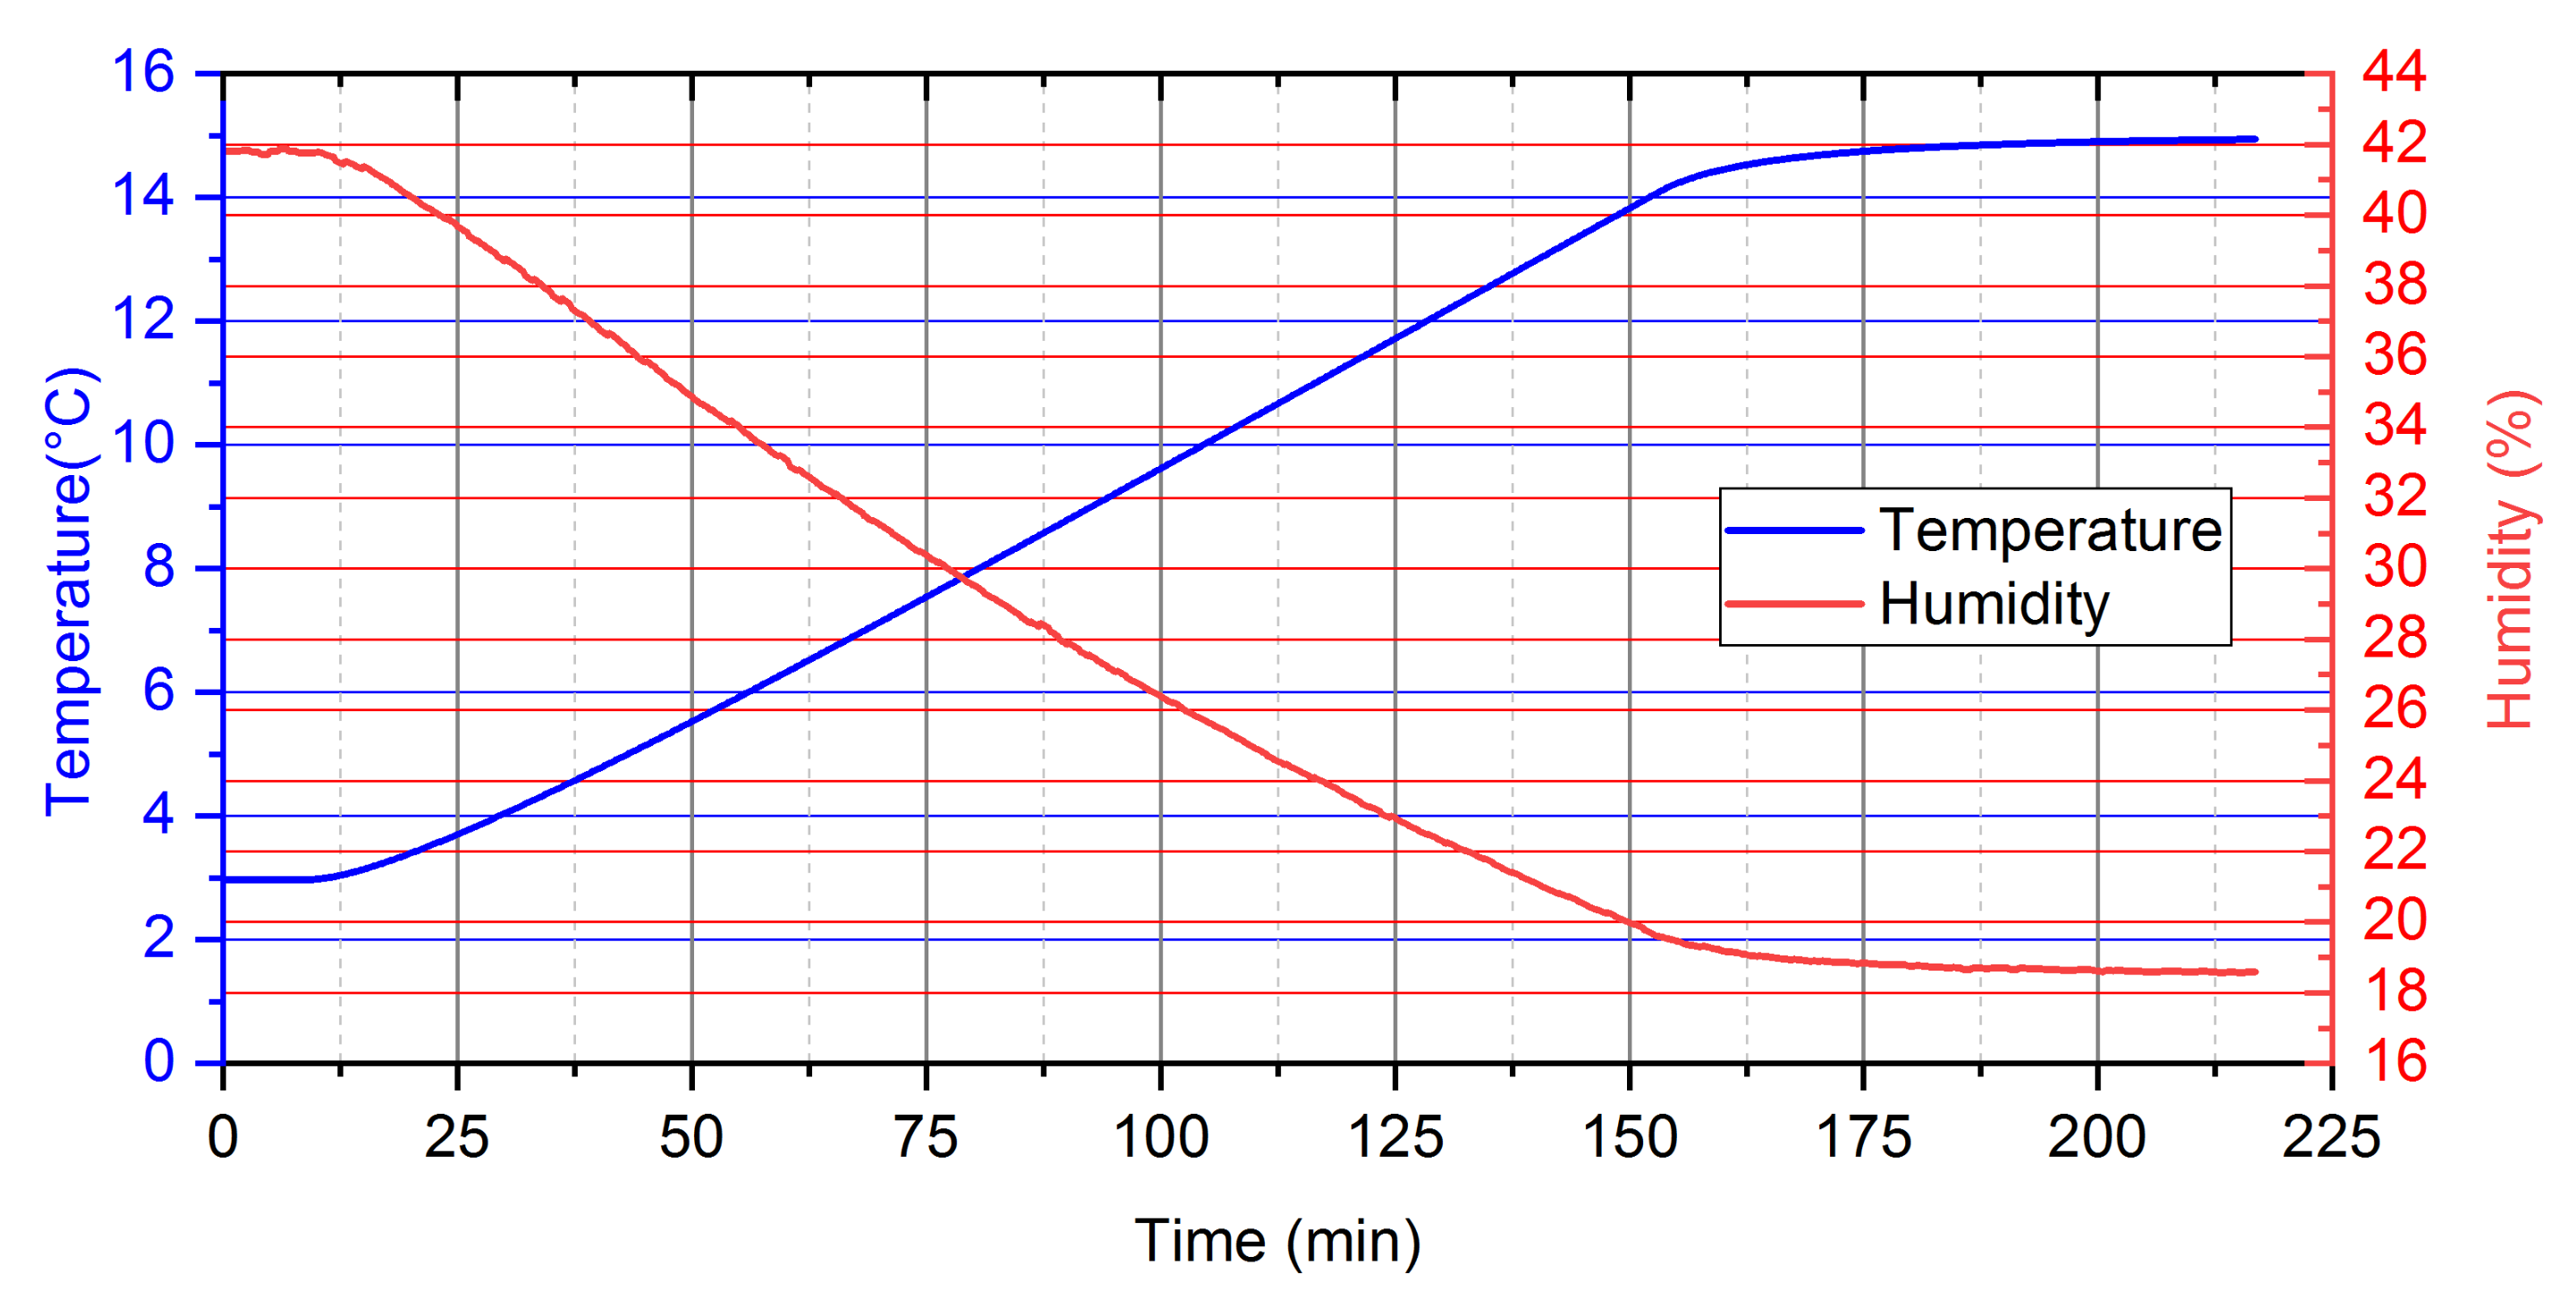
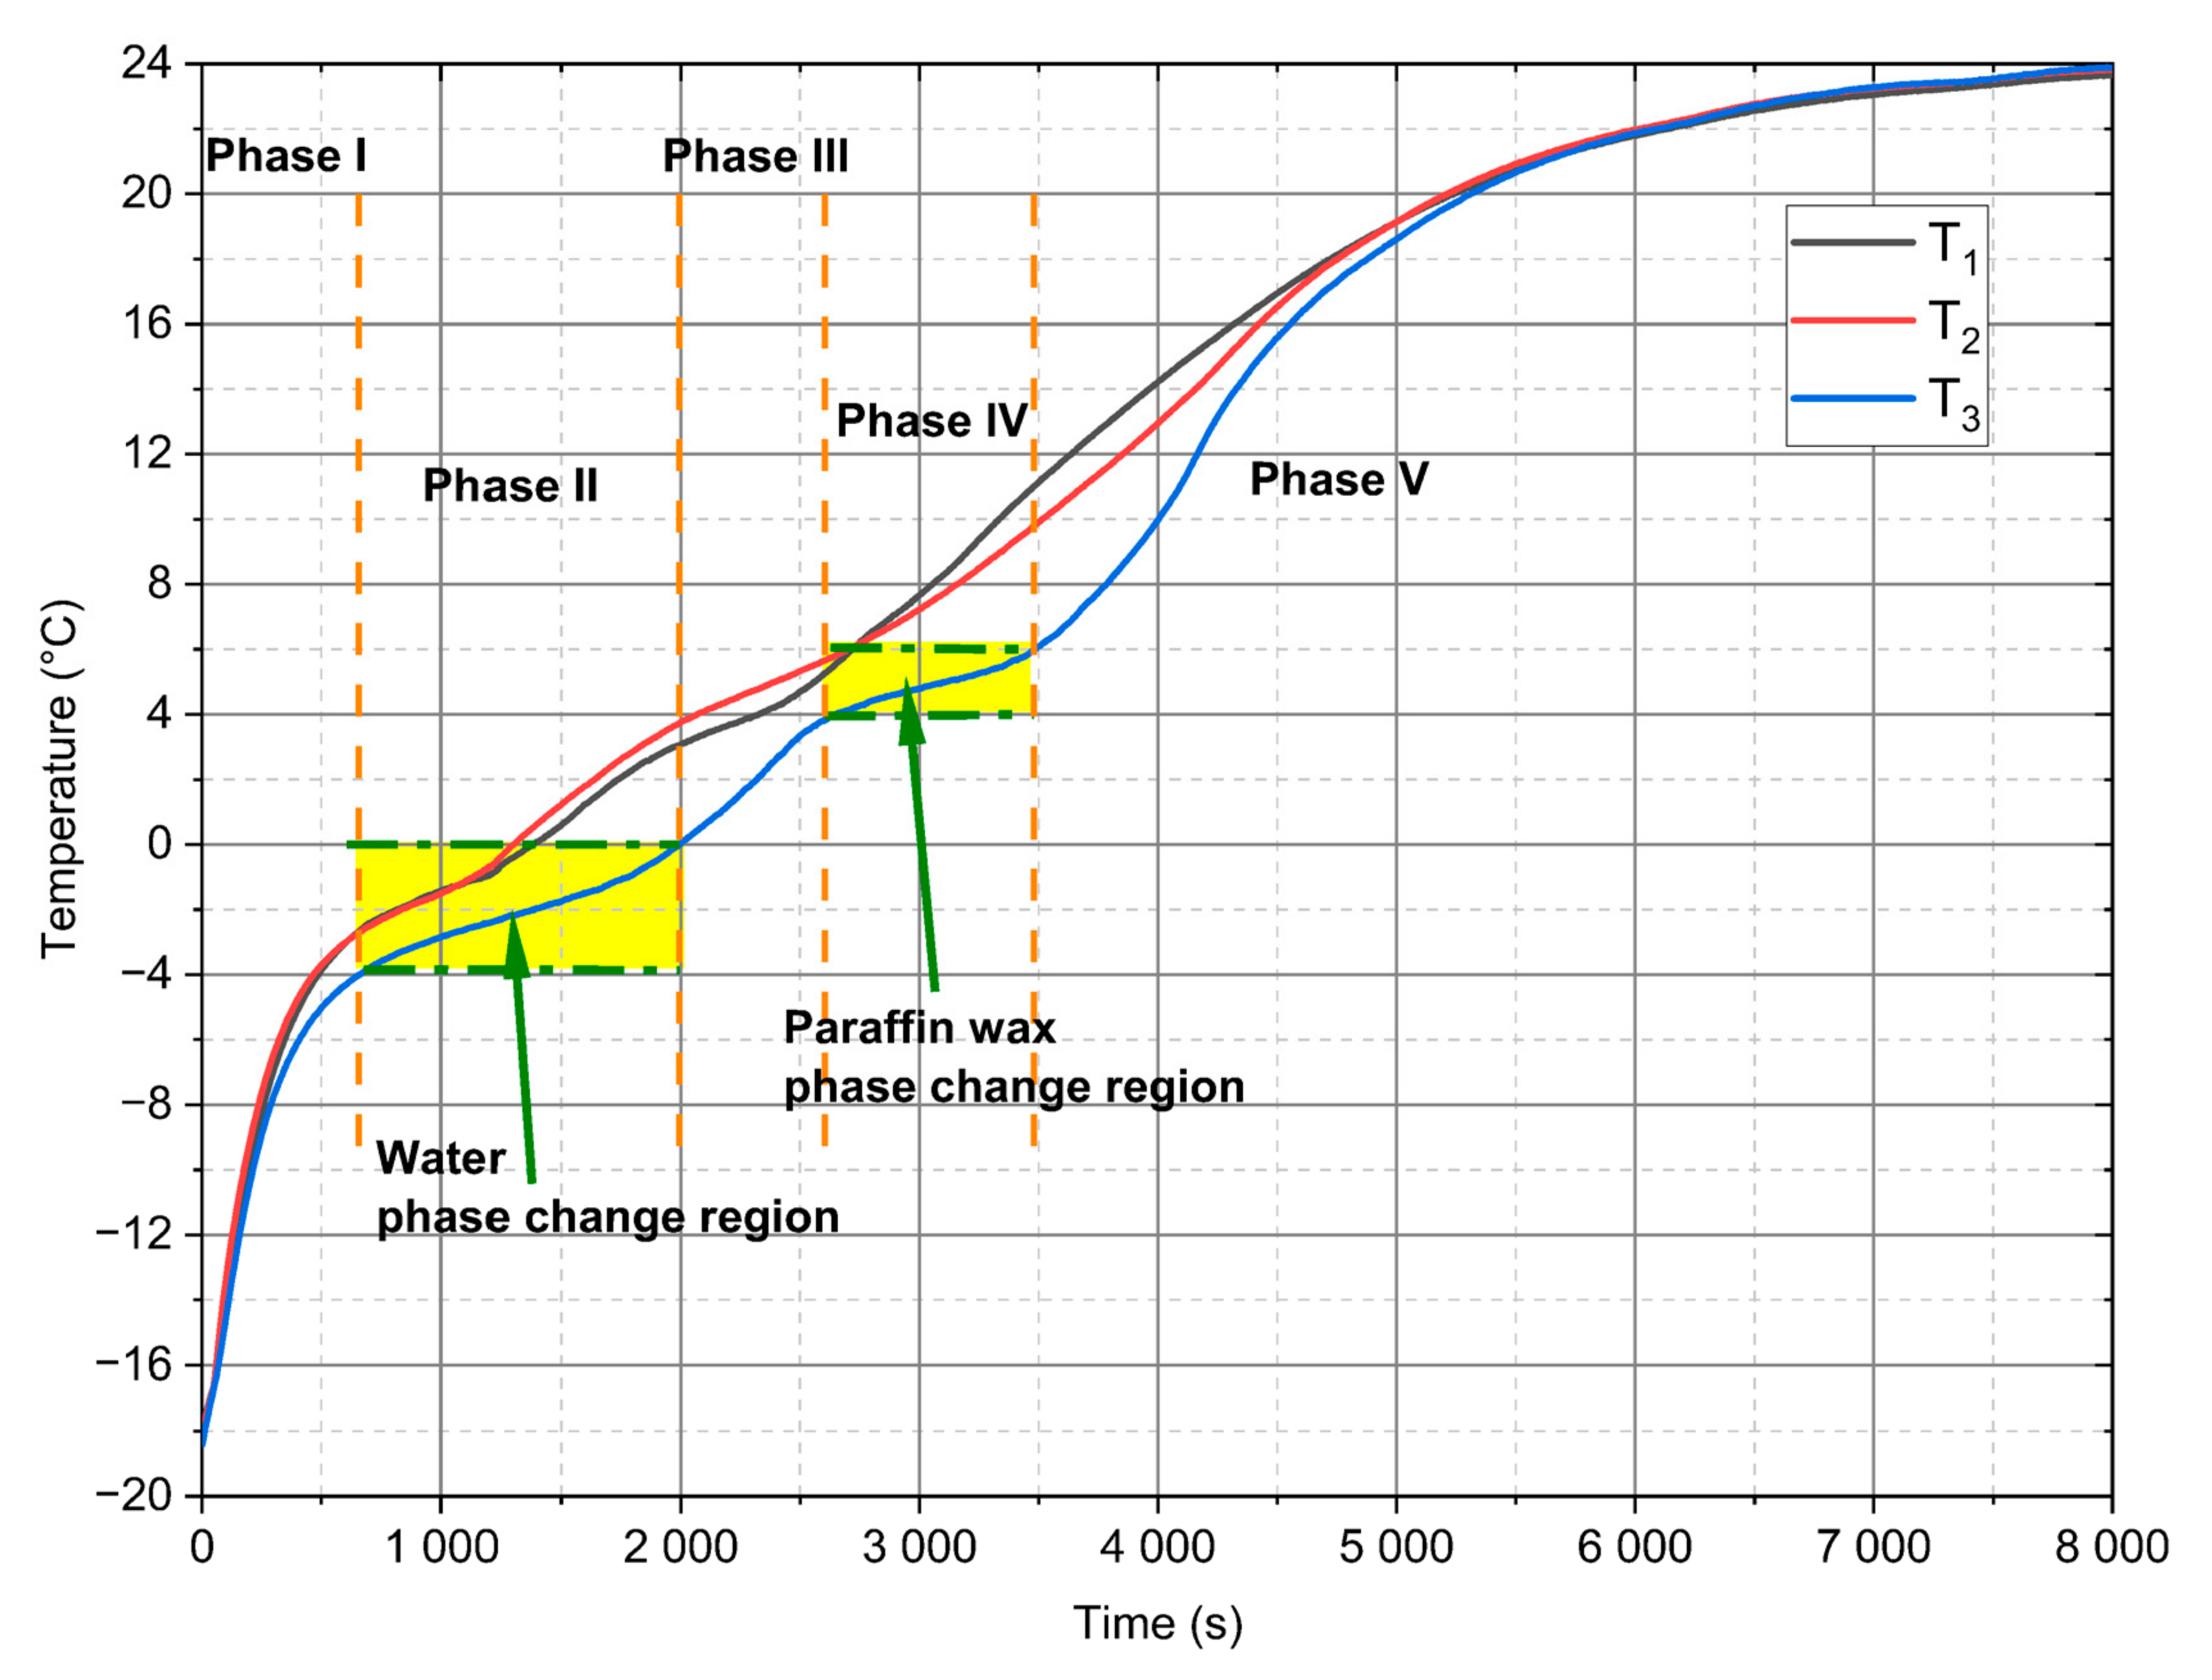
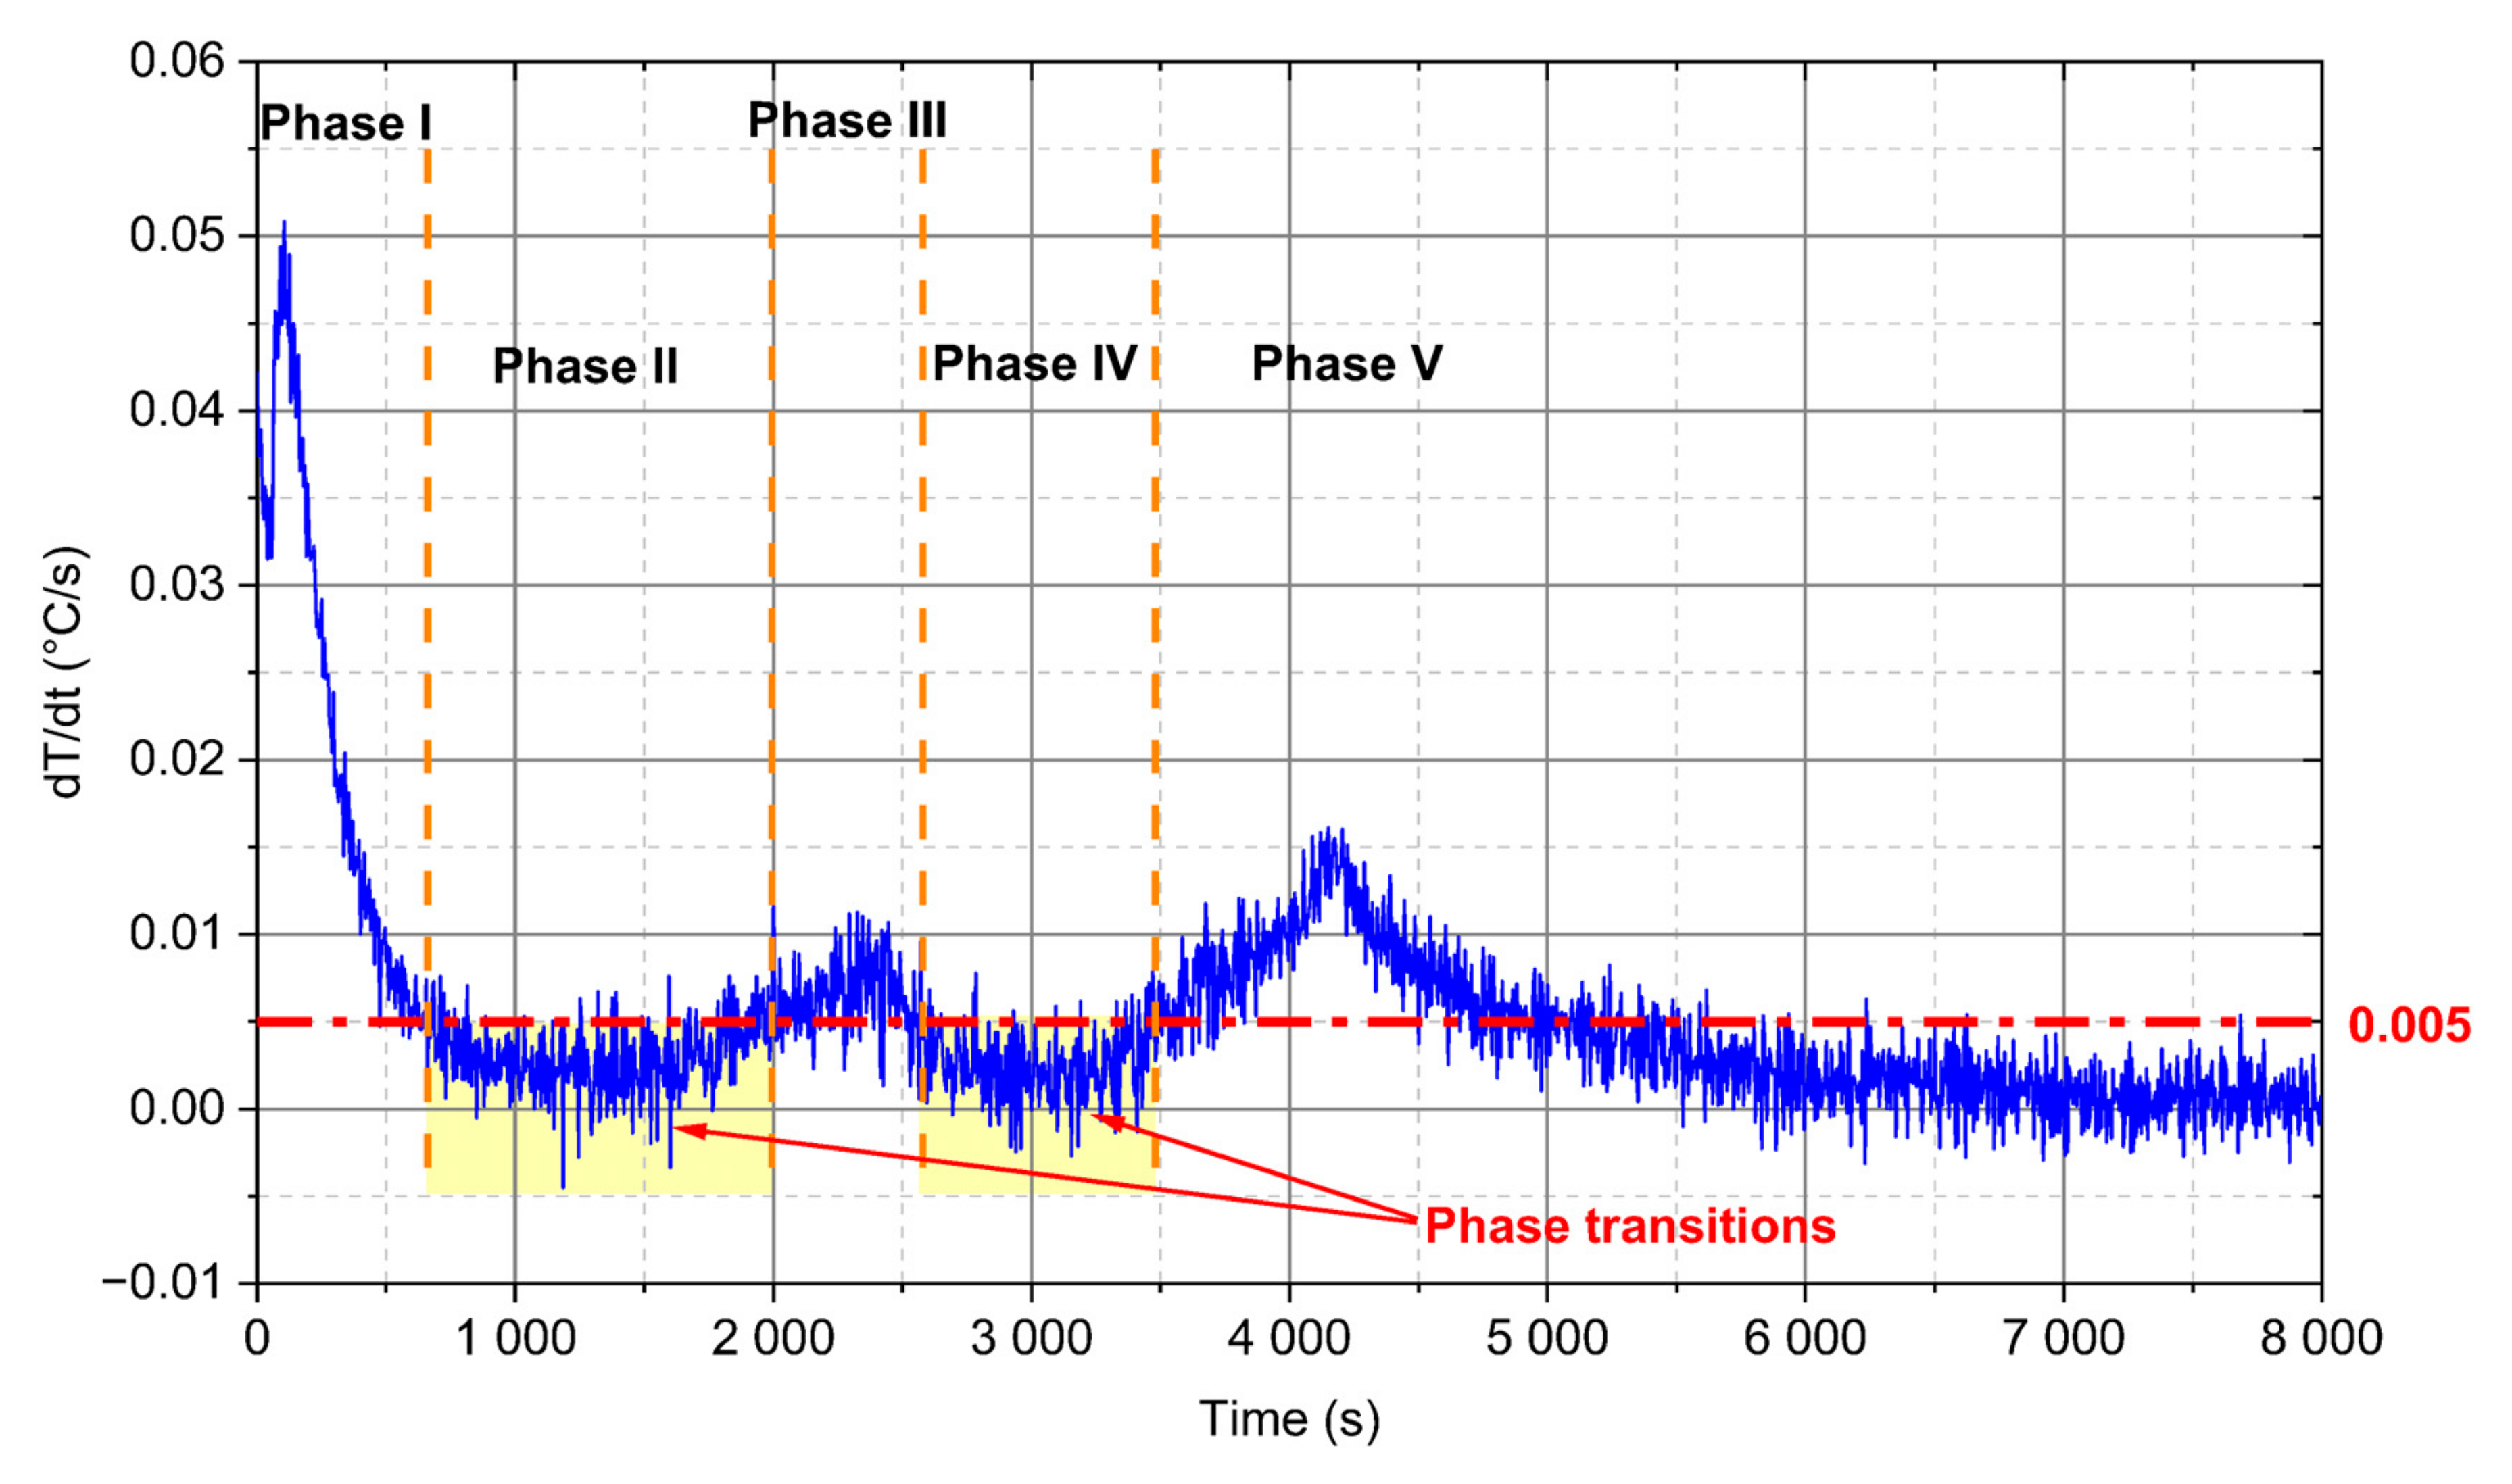
  • For analysed PCM, five distinct phases during the heating process can be observed (Figure 10). Two of these phases are a phenomenon, in which phase change processes can be singled out. The first transformation is characteristic for water in the temperature range from −4 °C to 0 °C and the second is identified for paraffin from 4 °C to 6 °C.
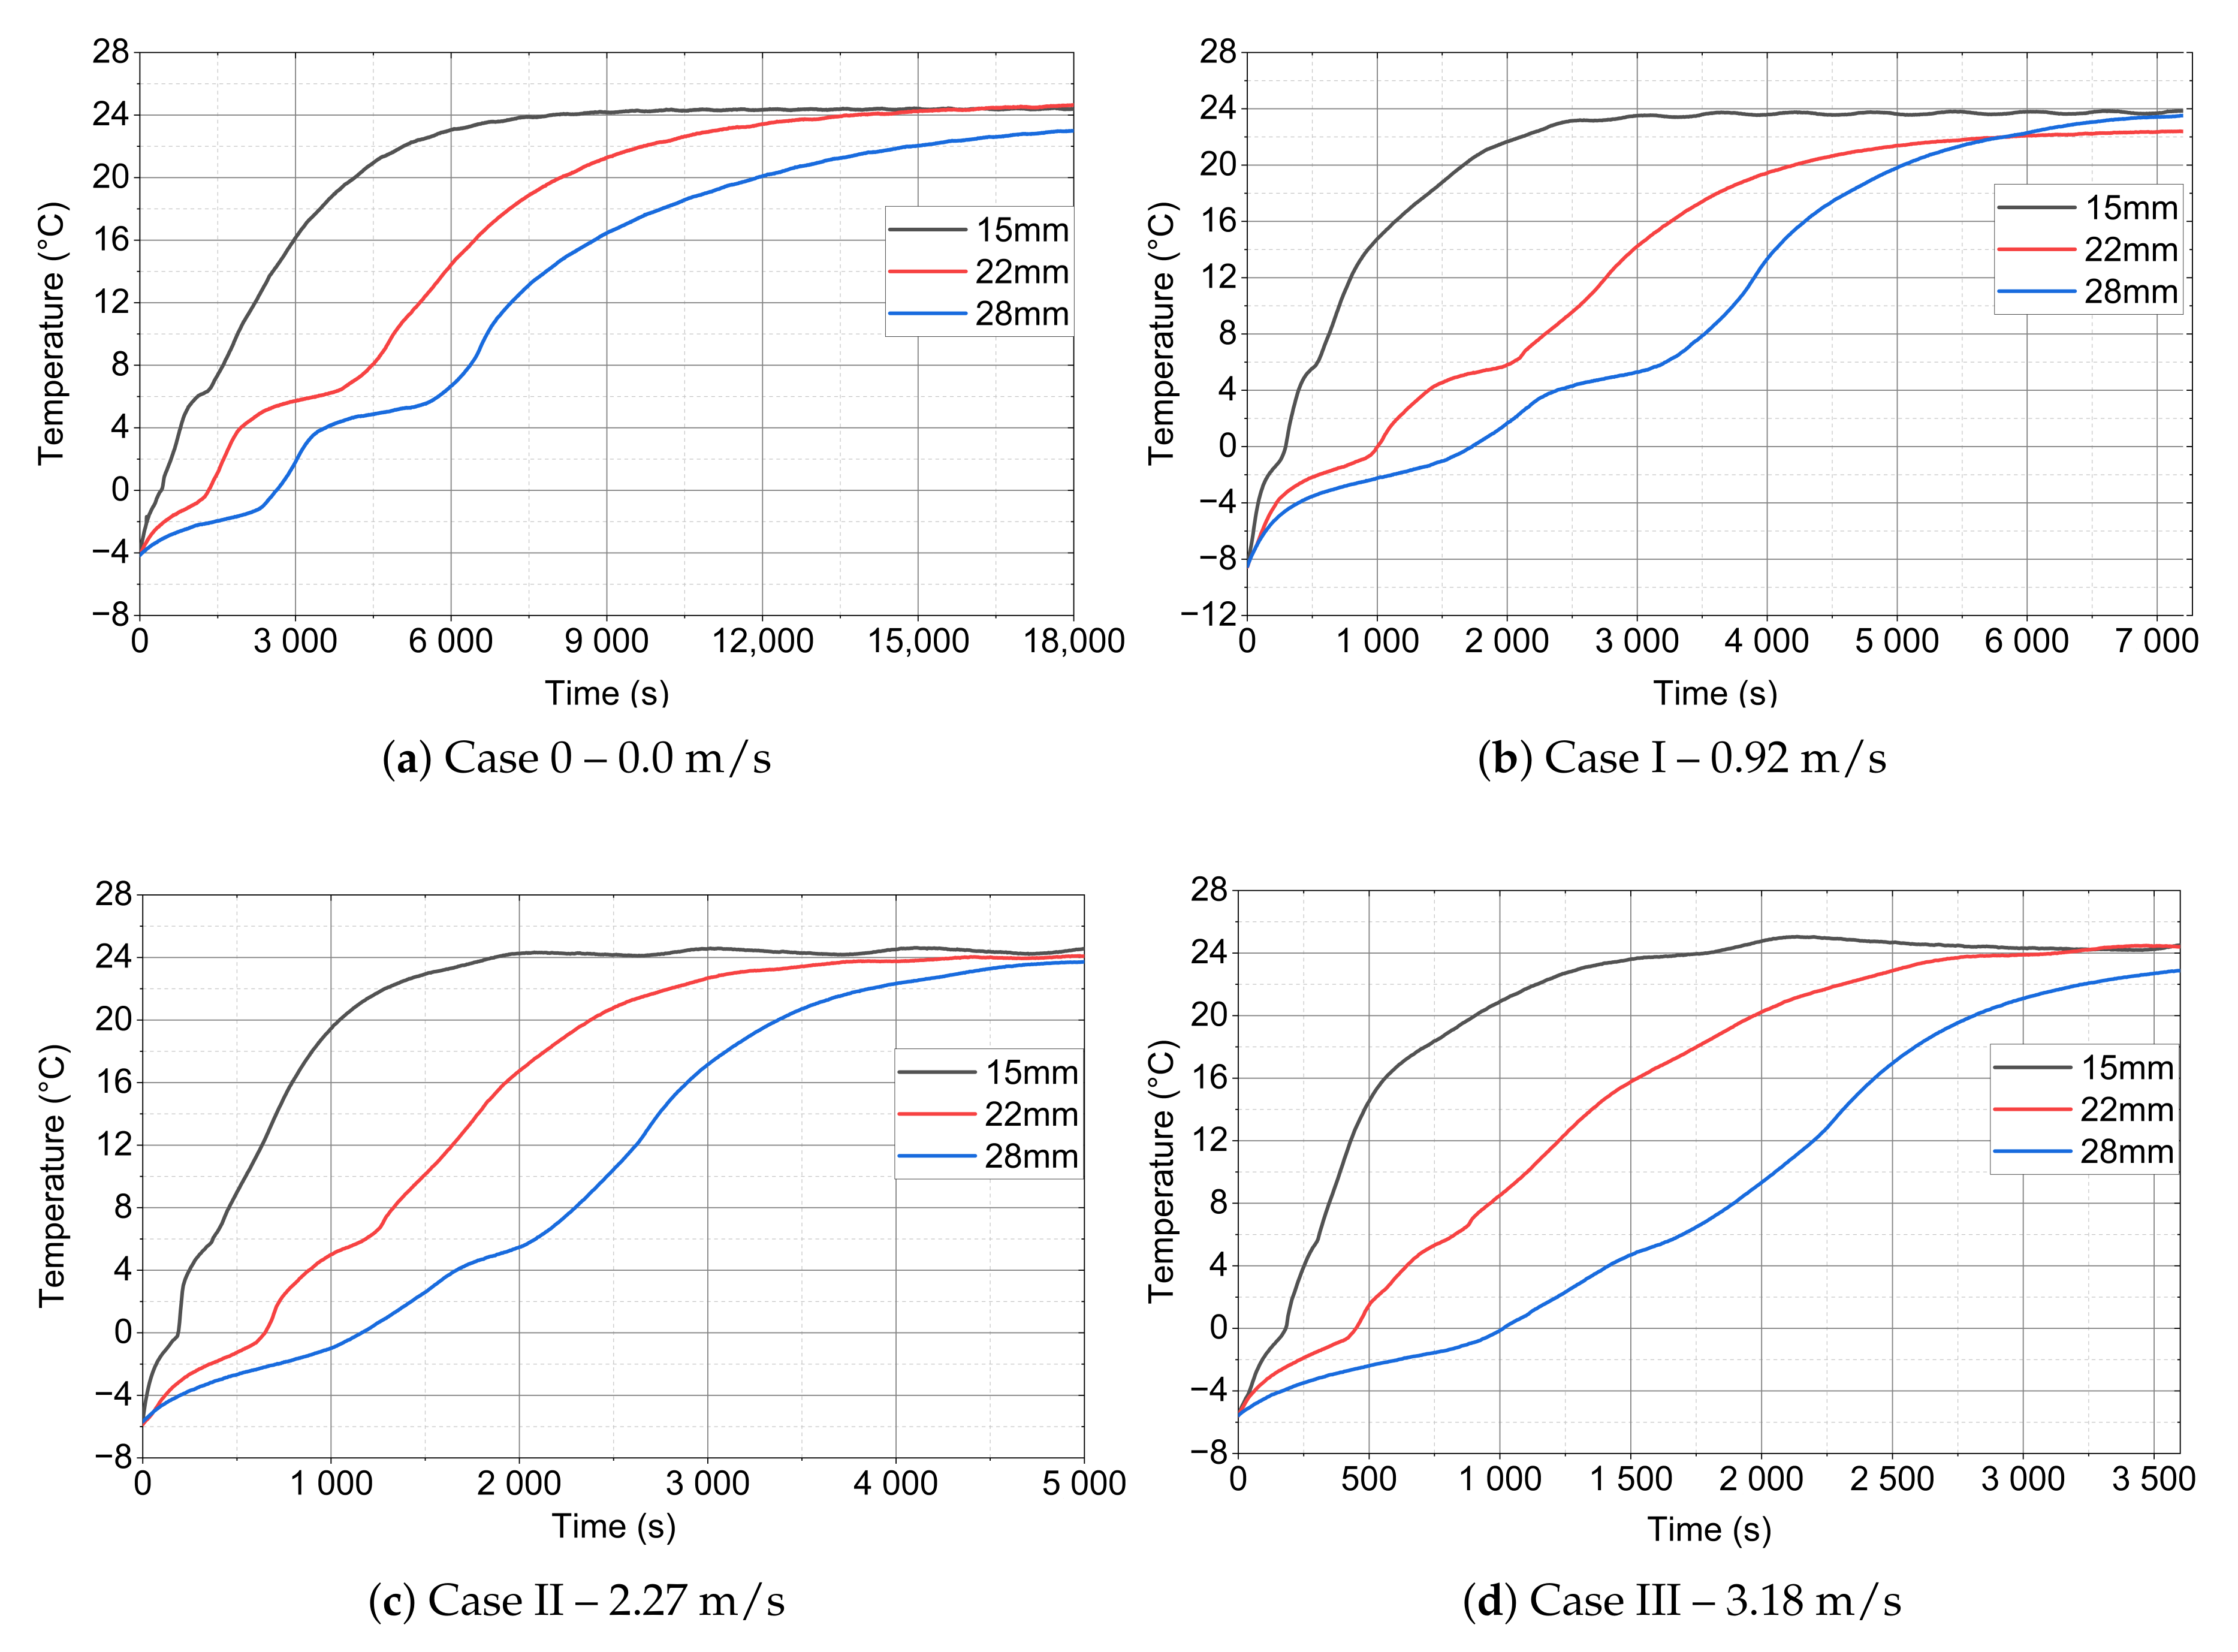
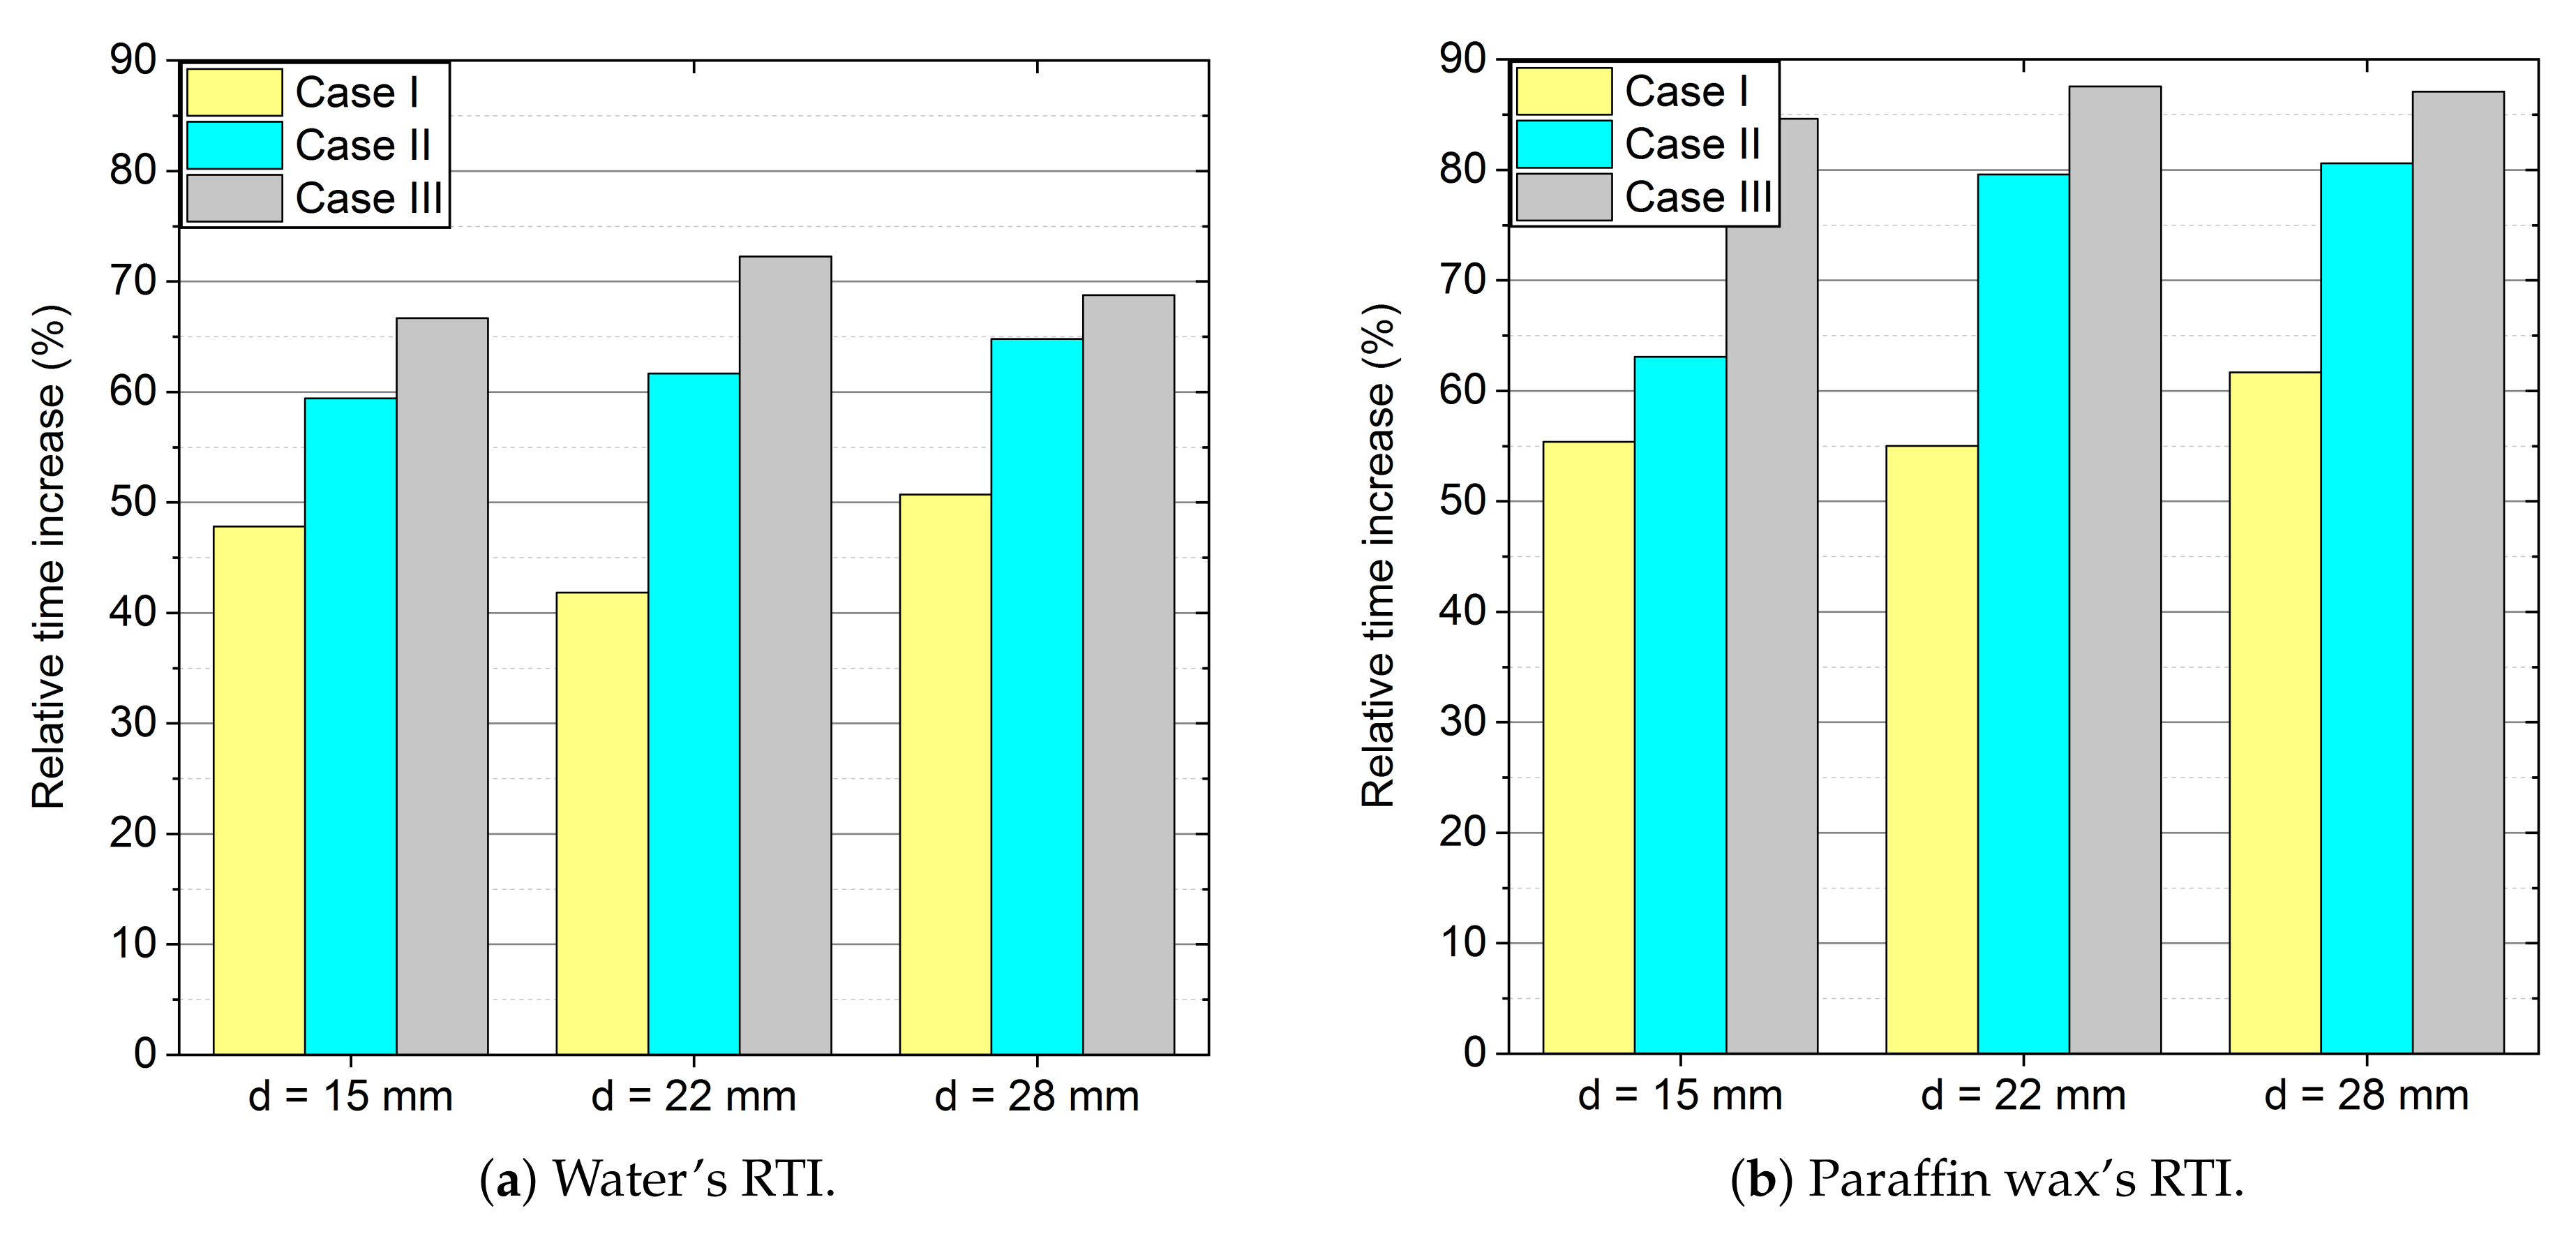
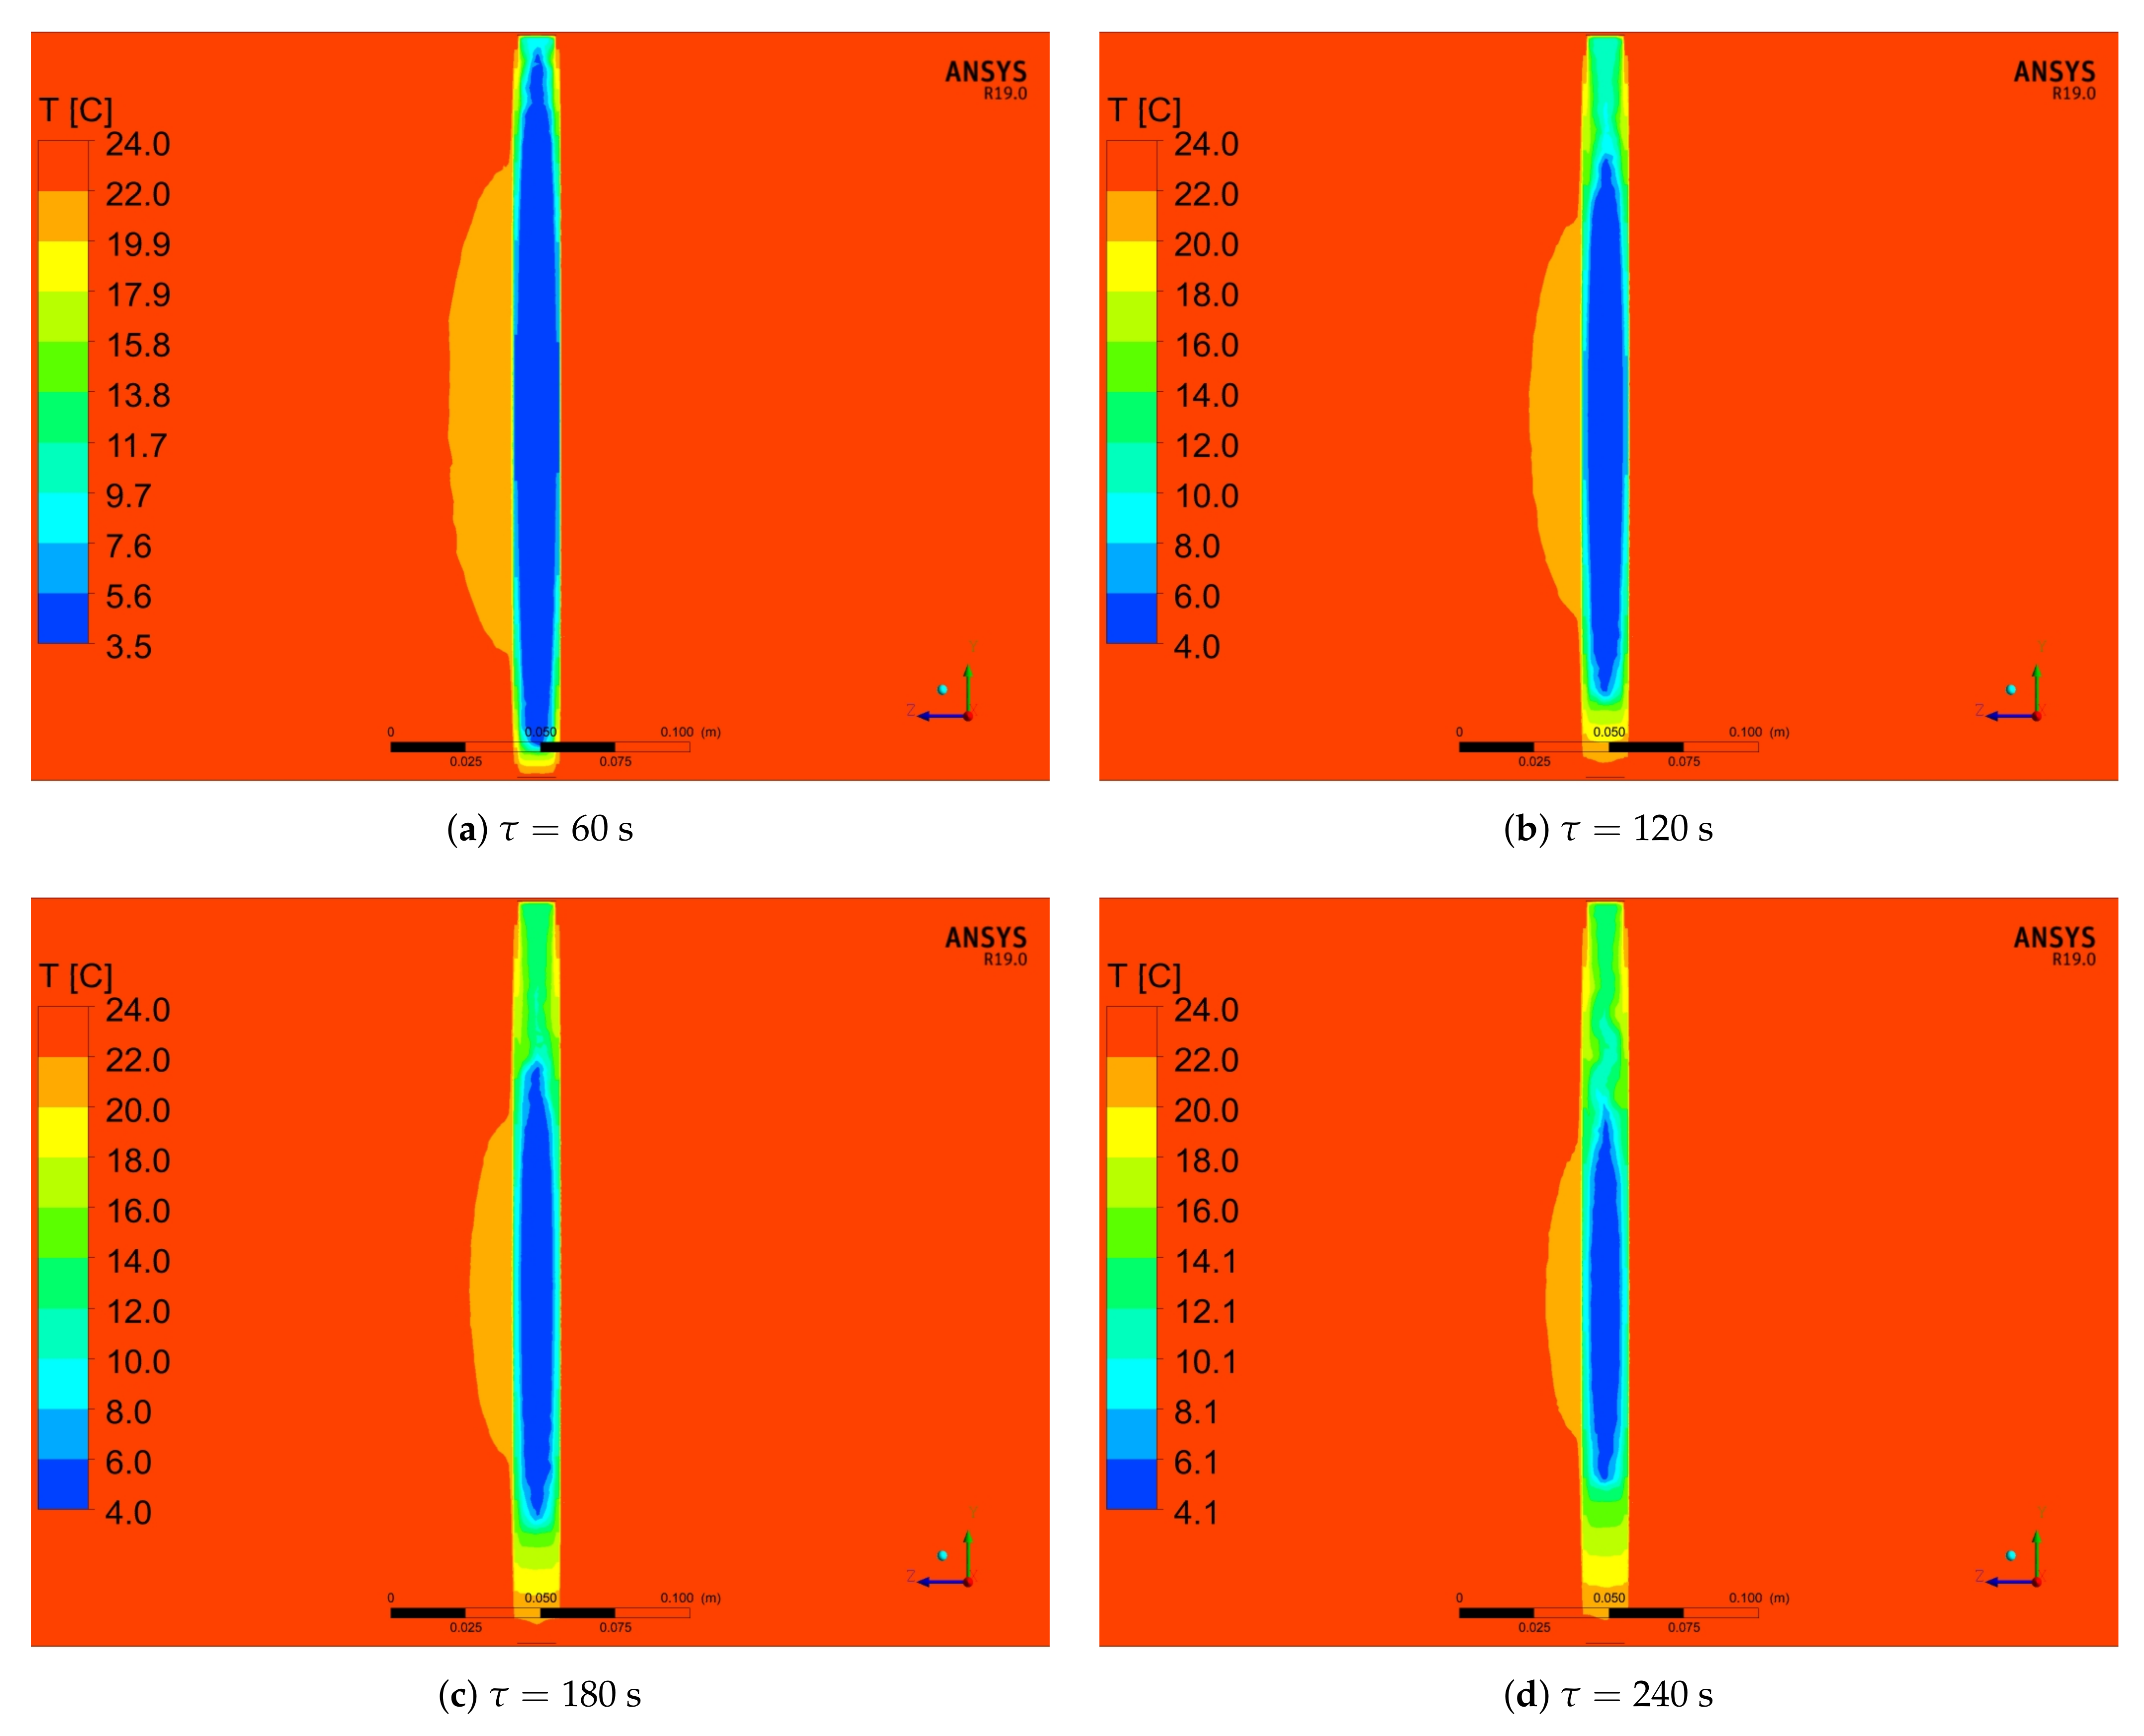
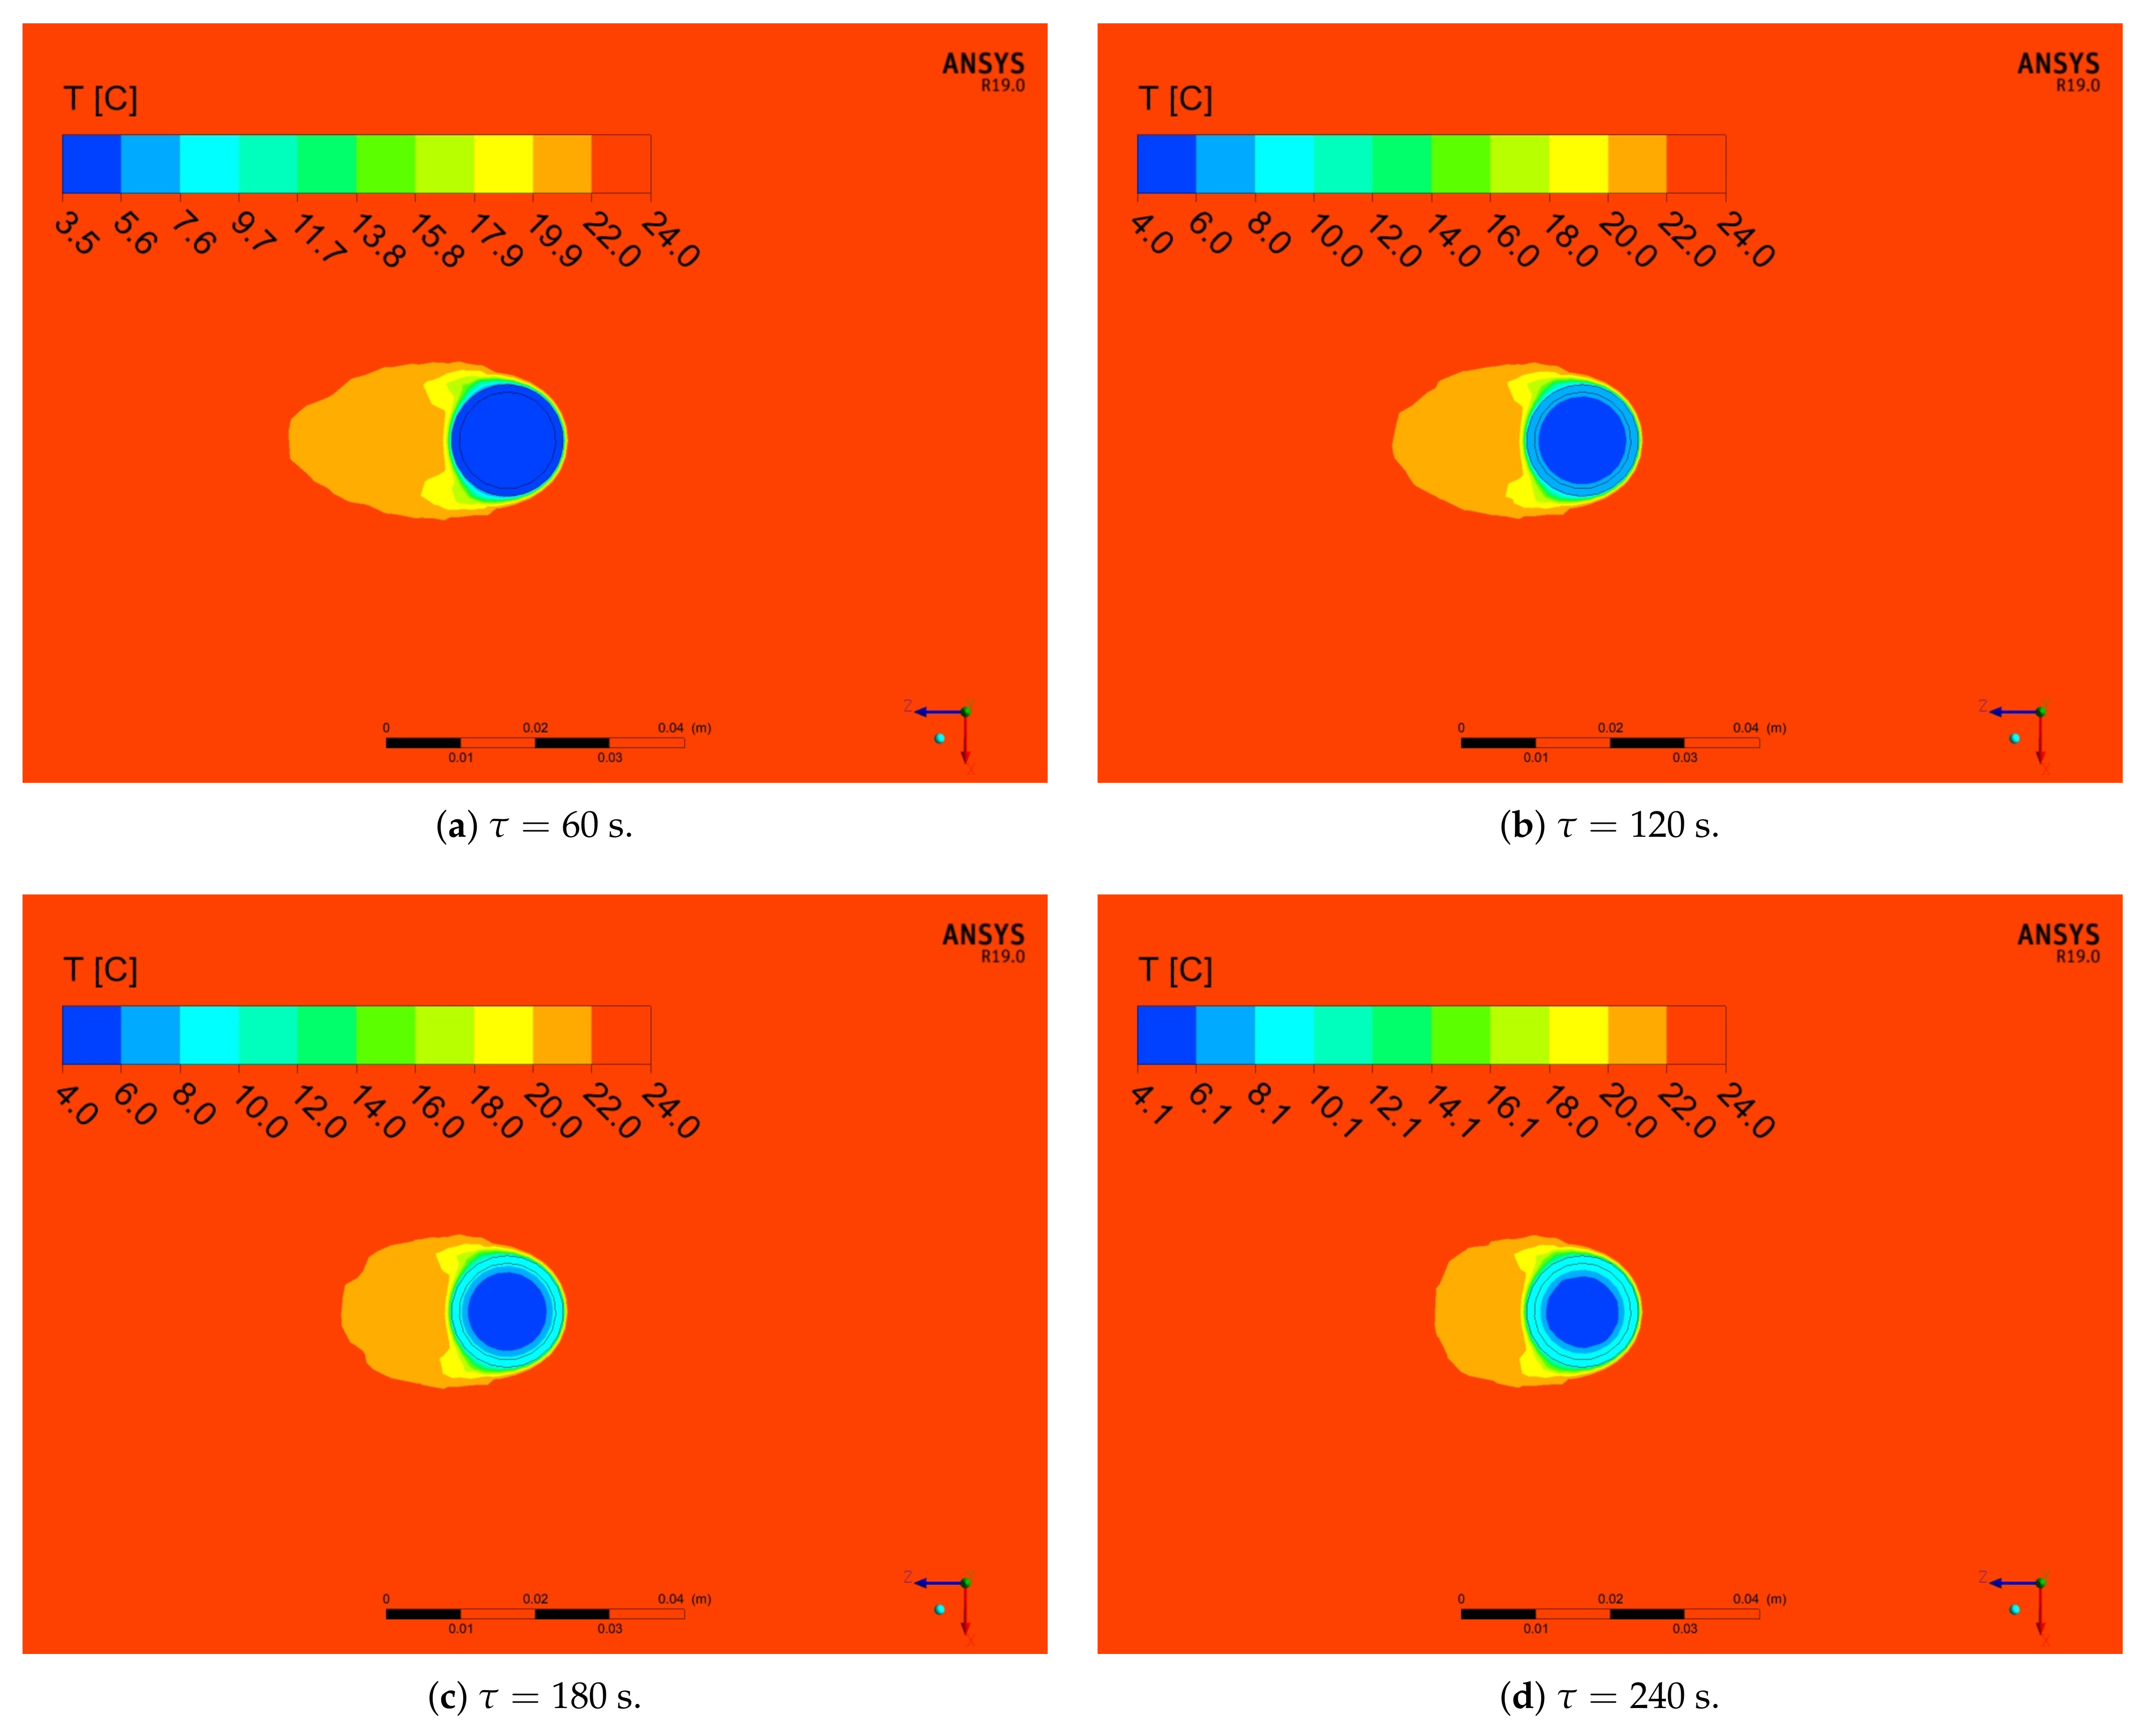
  • Because of the use of forced convection, the time of the melting process can be reduced by even up to 87% (RTI) as compared to stagnation conditions, as shown in Table 6 and Table 7 and Figure 13. It is also worth emphasising that, when changing the outer diameter from the module from 22 to 28 mm, these changes are less noticeable than for the diameters of 18 to 22 mm.
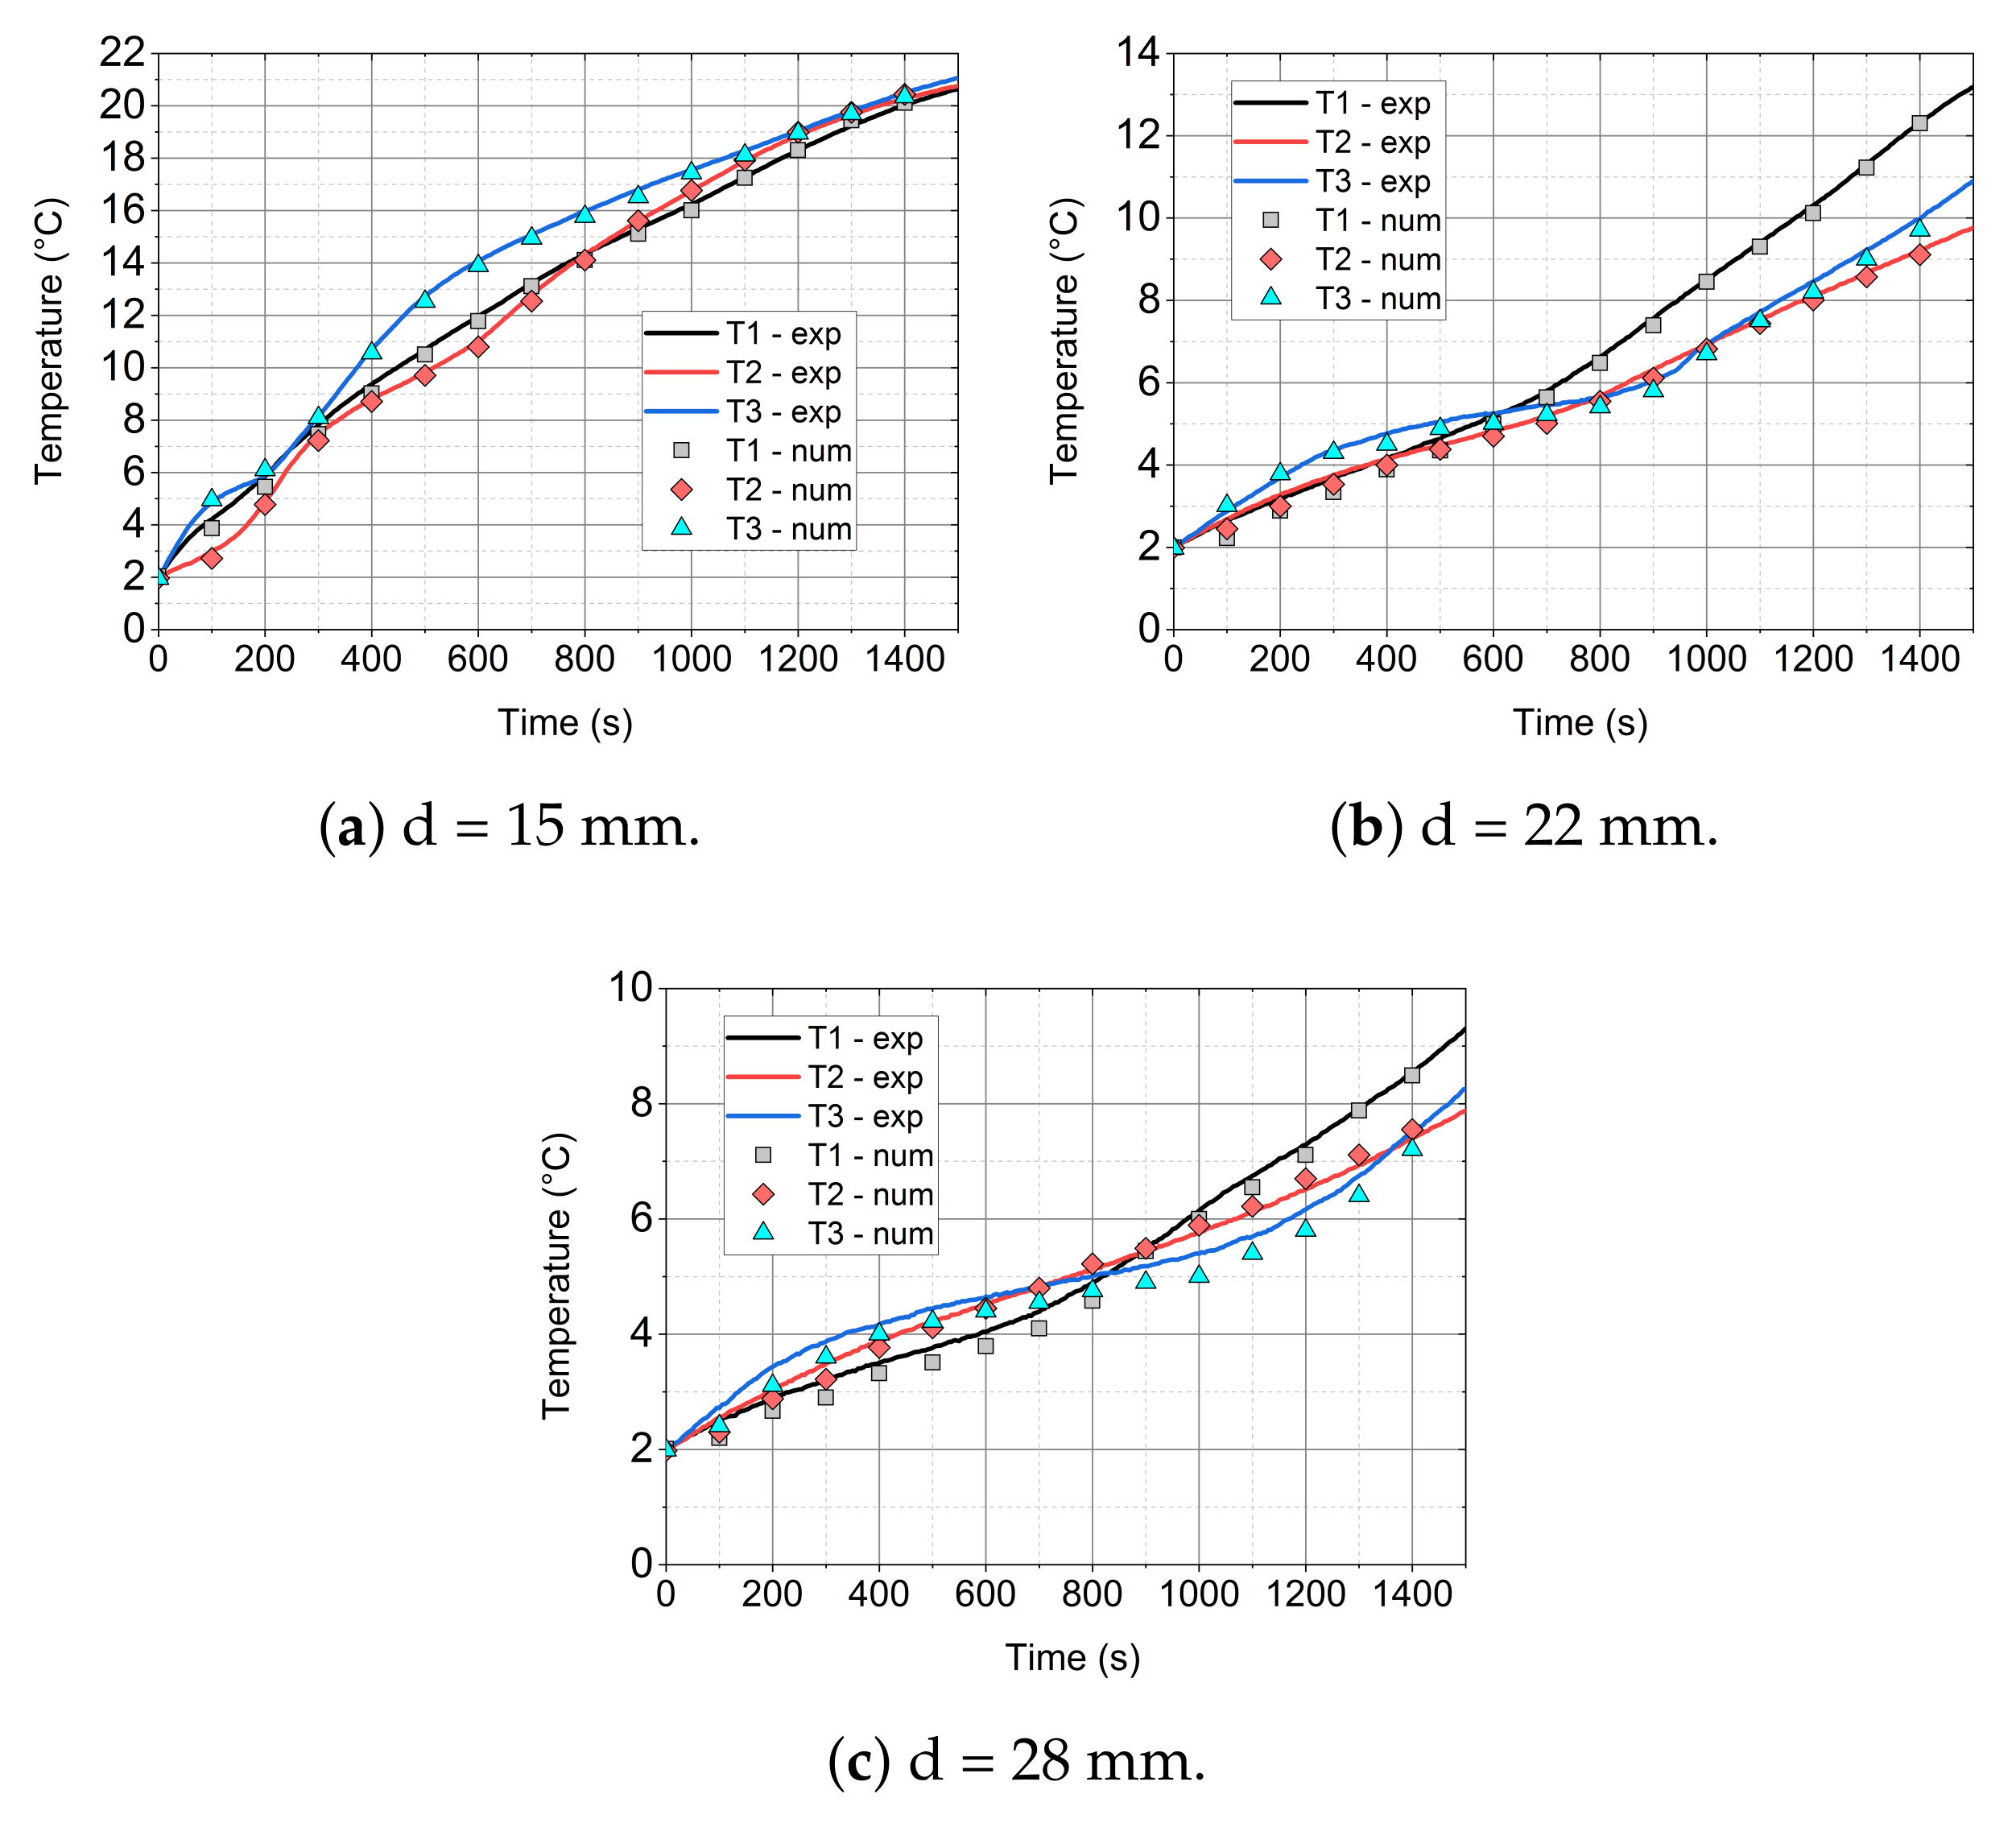
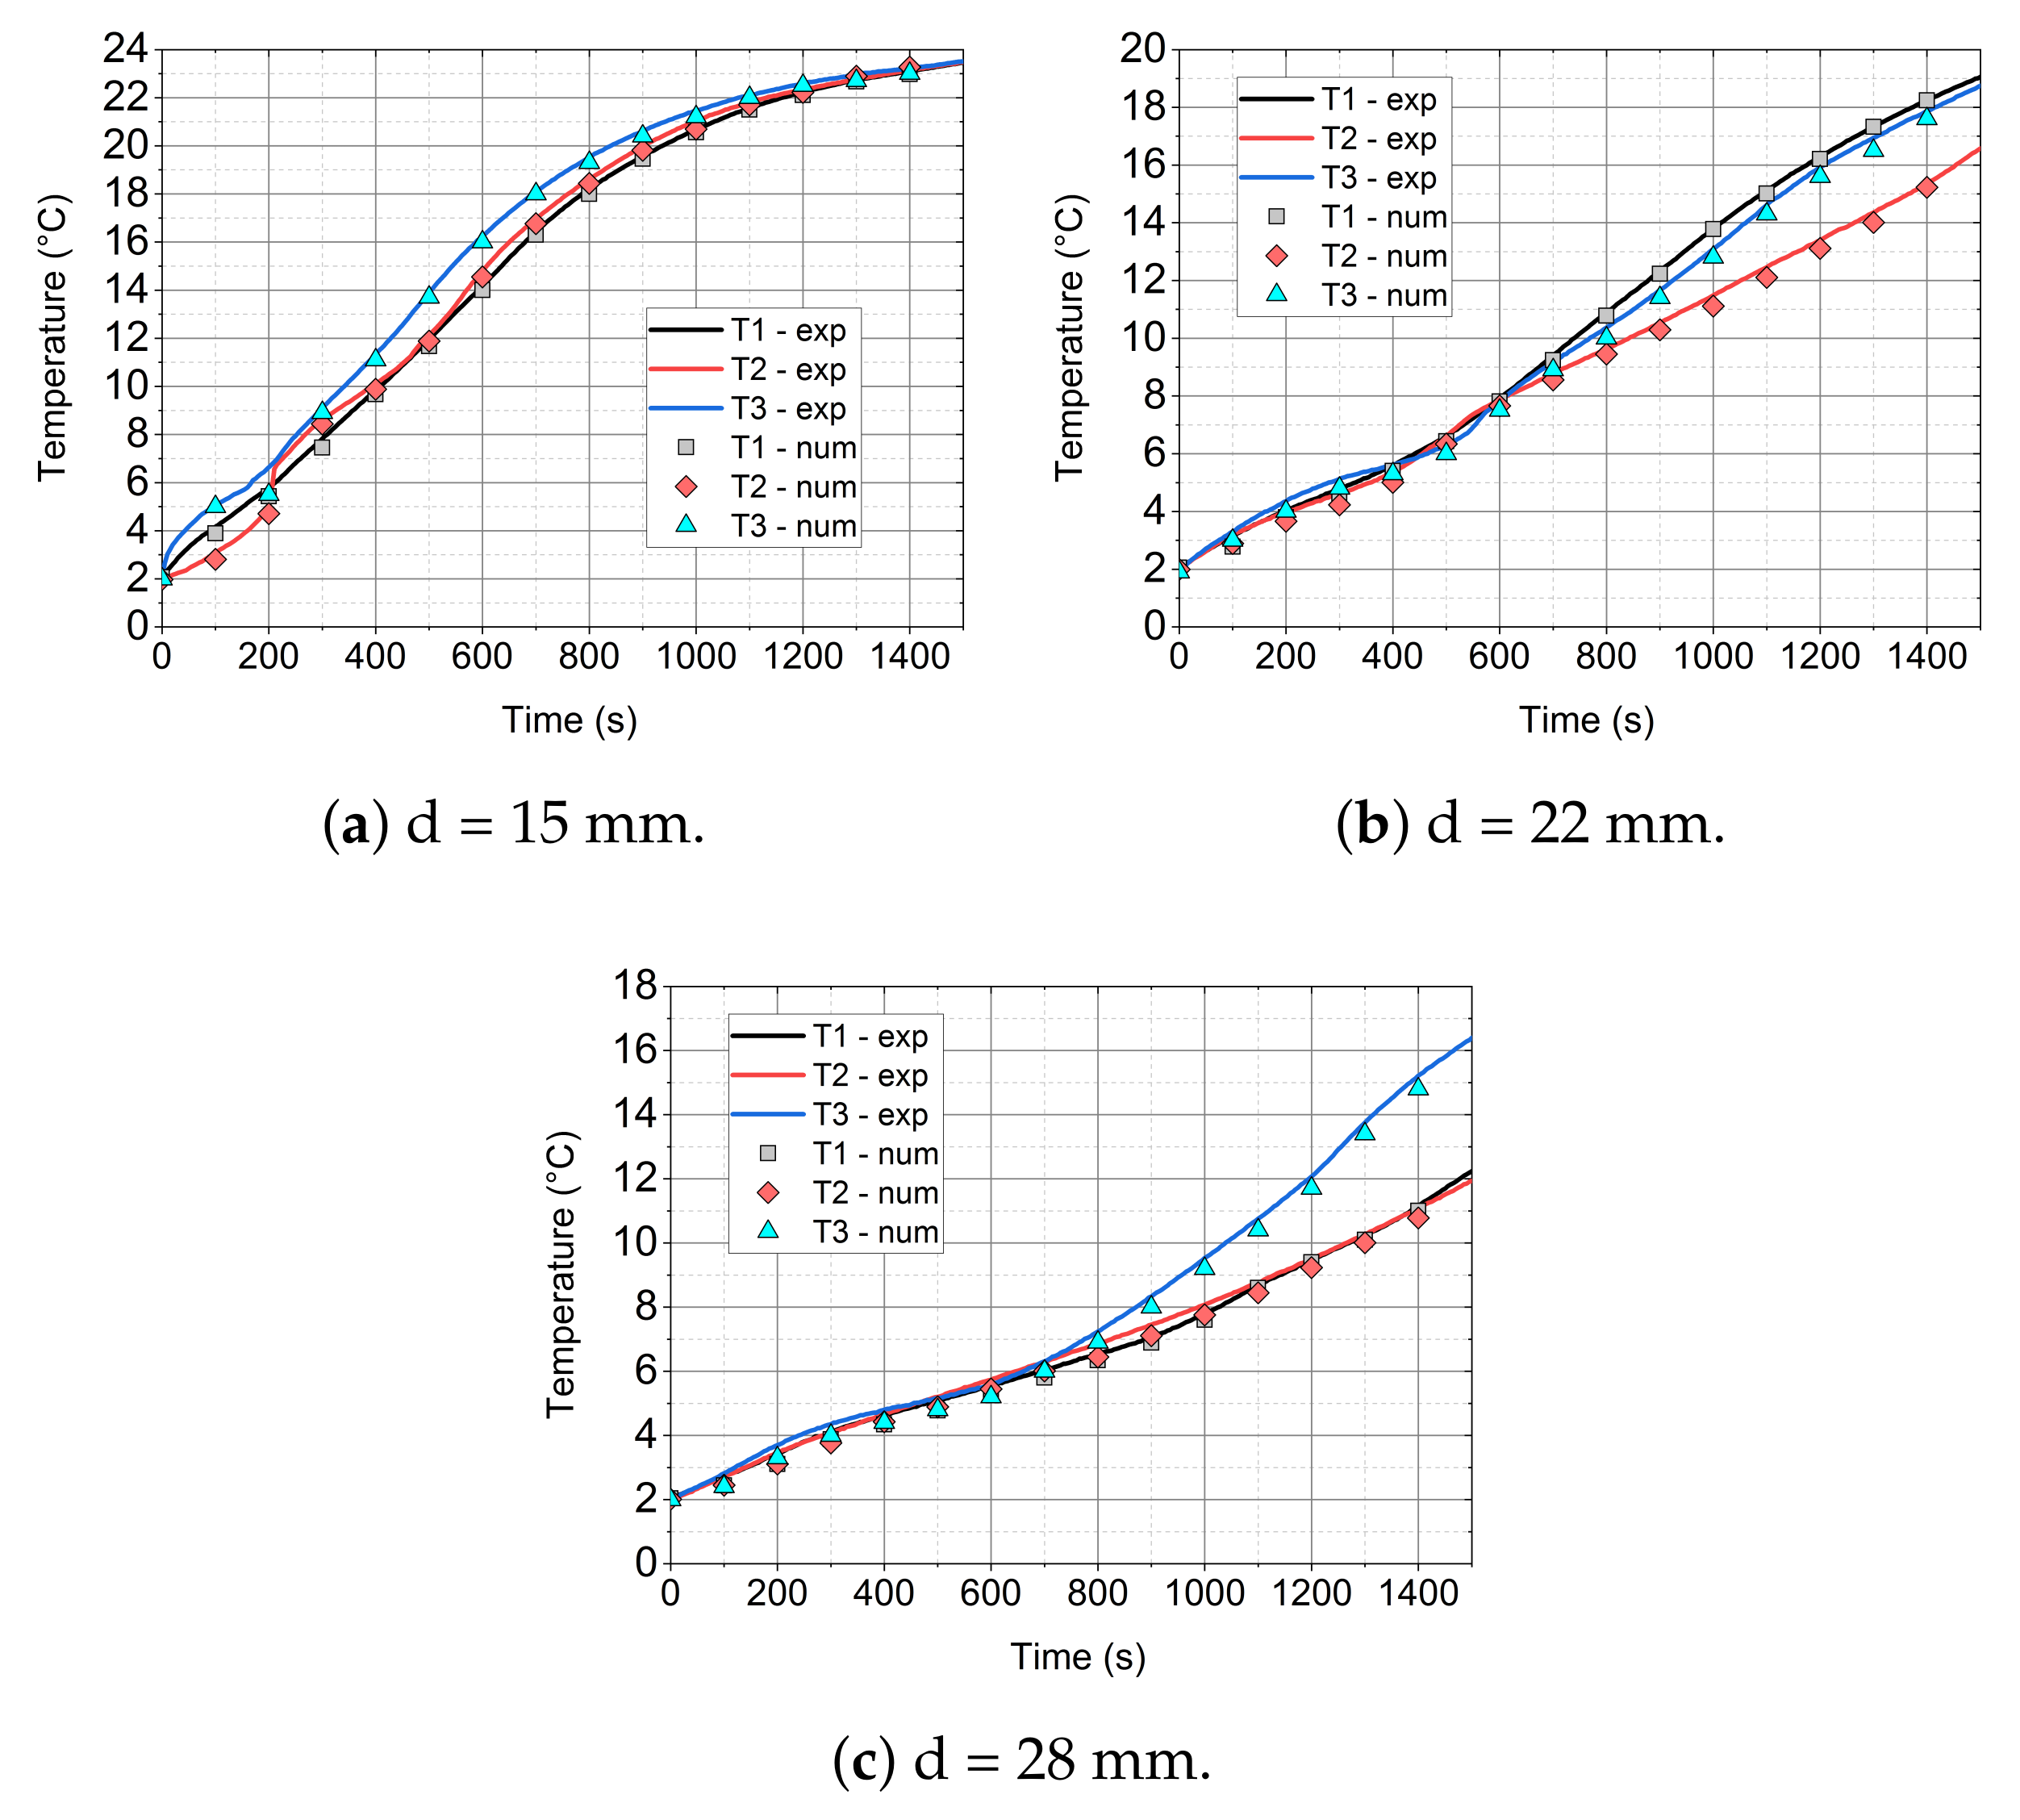
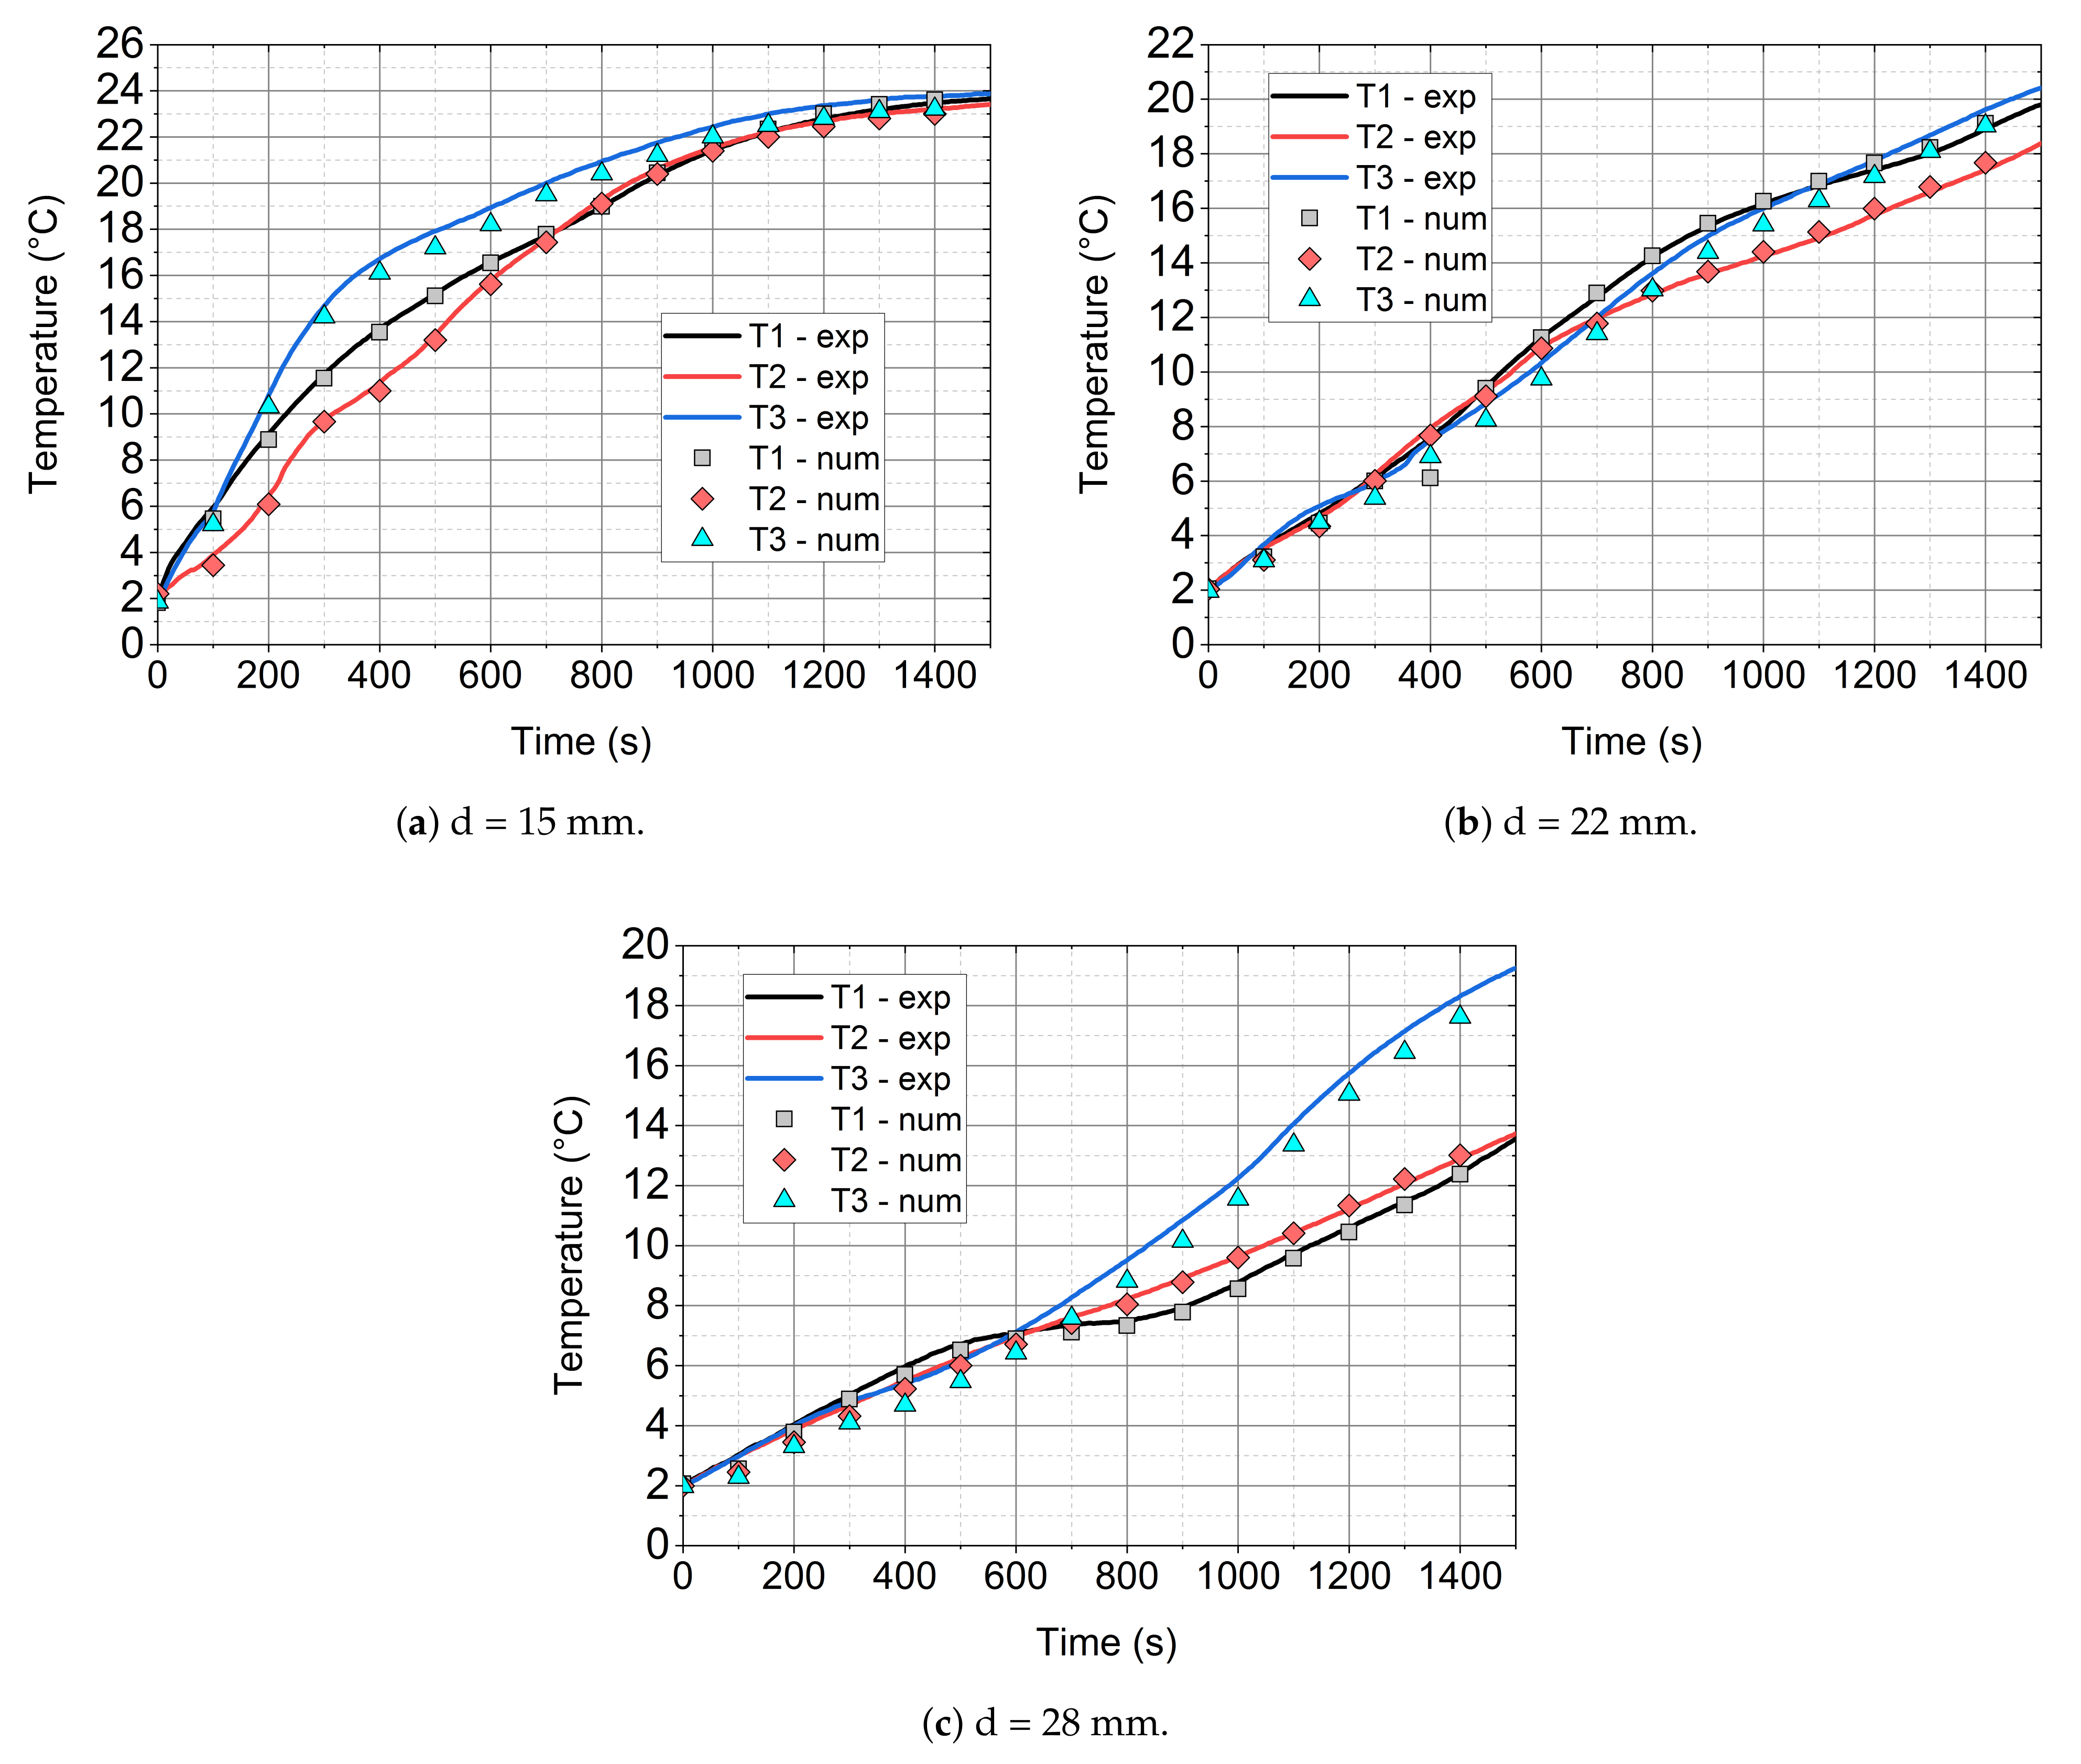
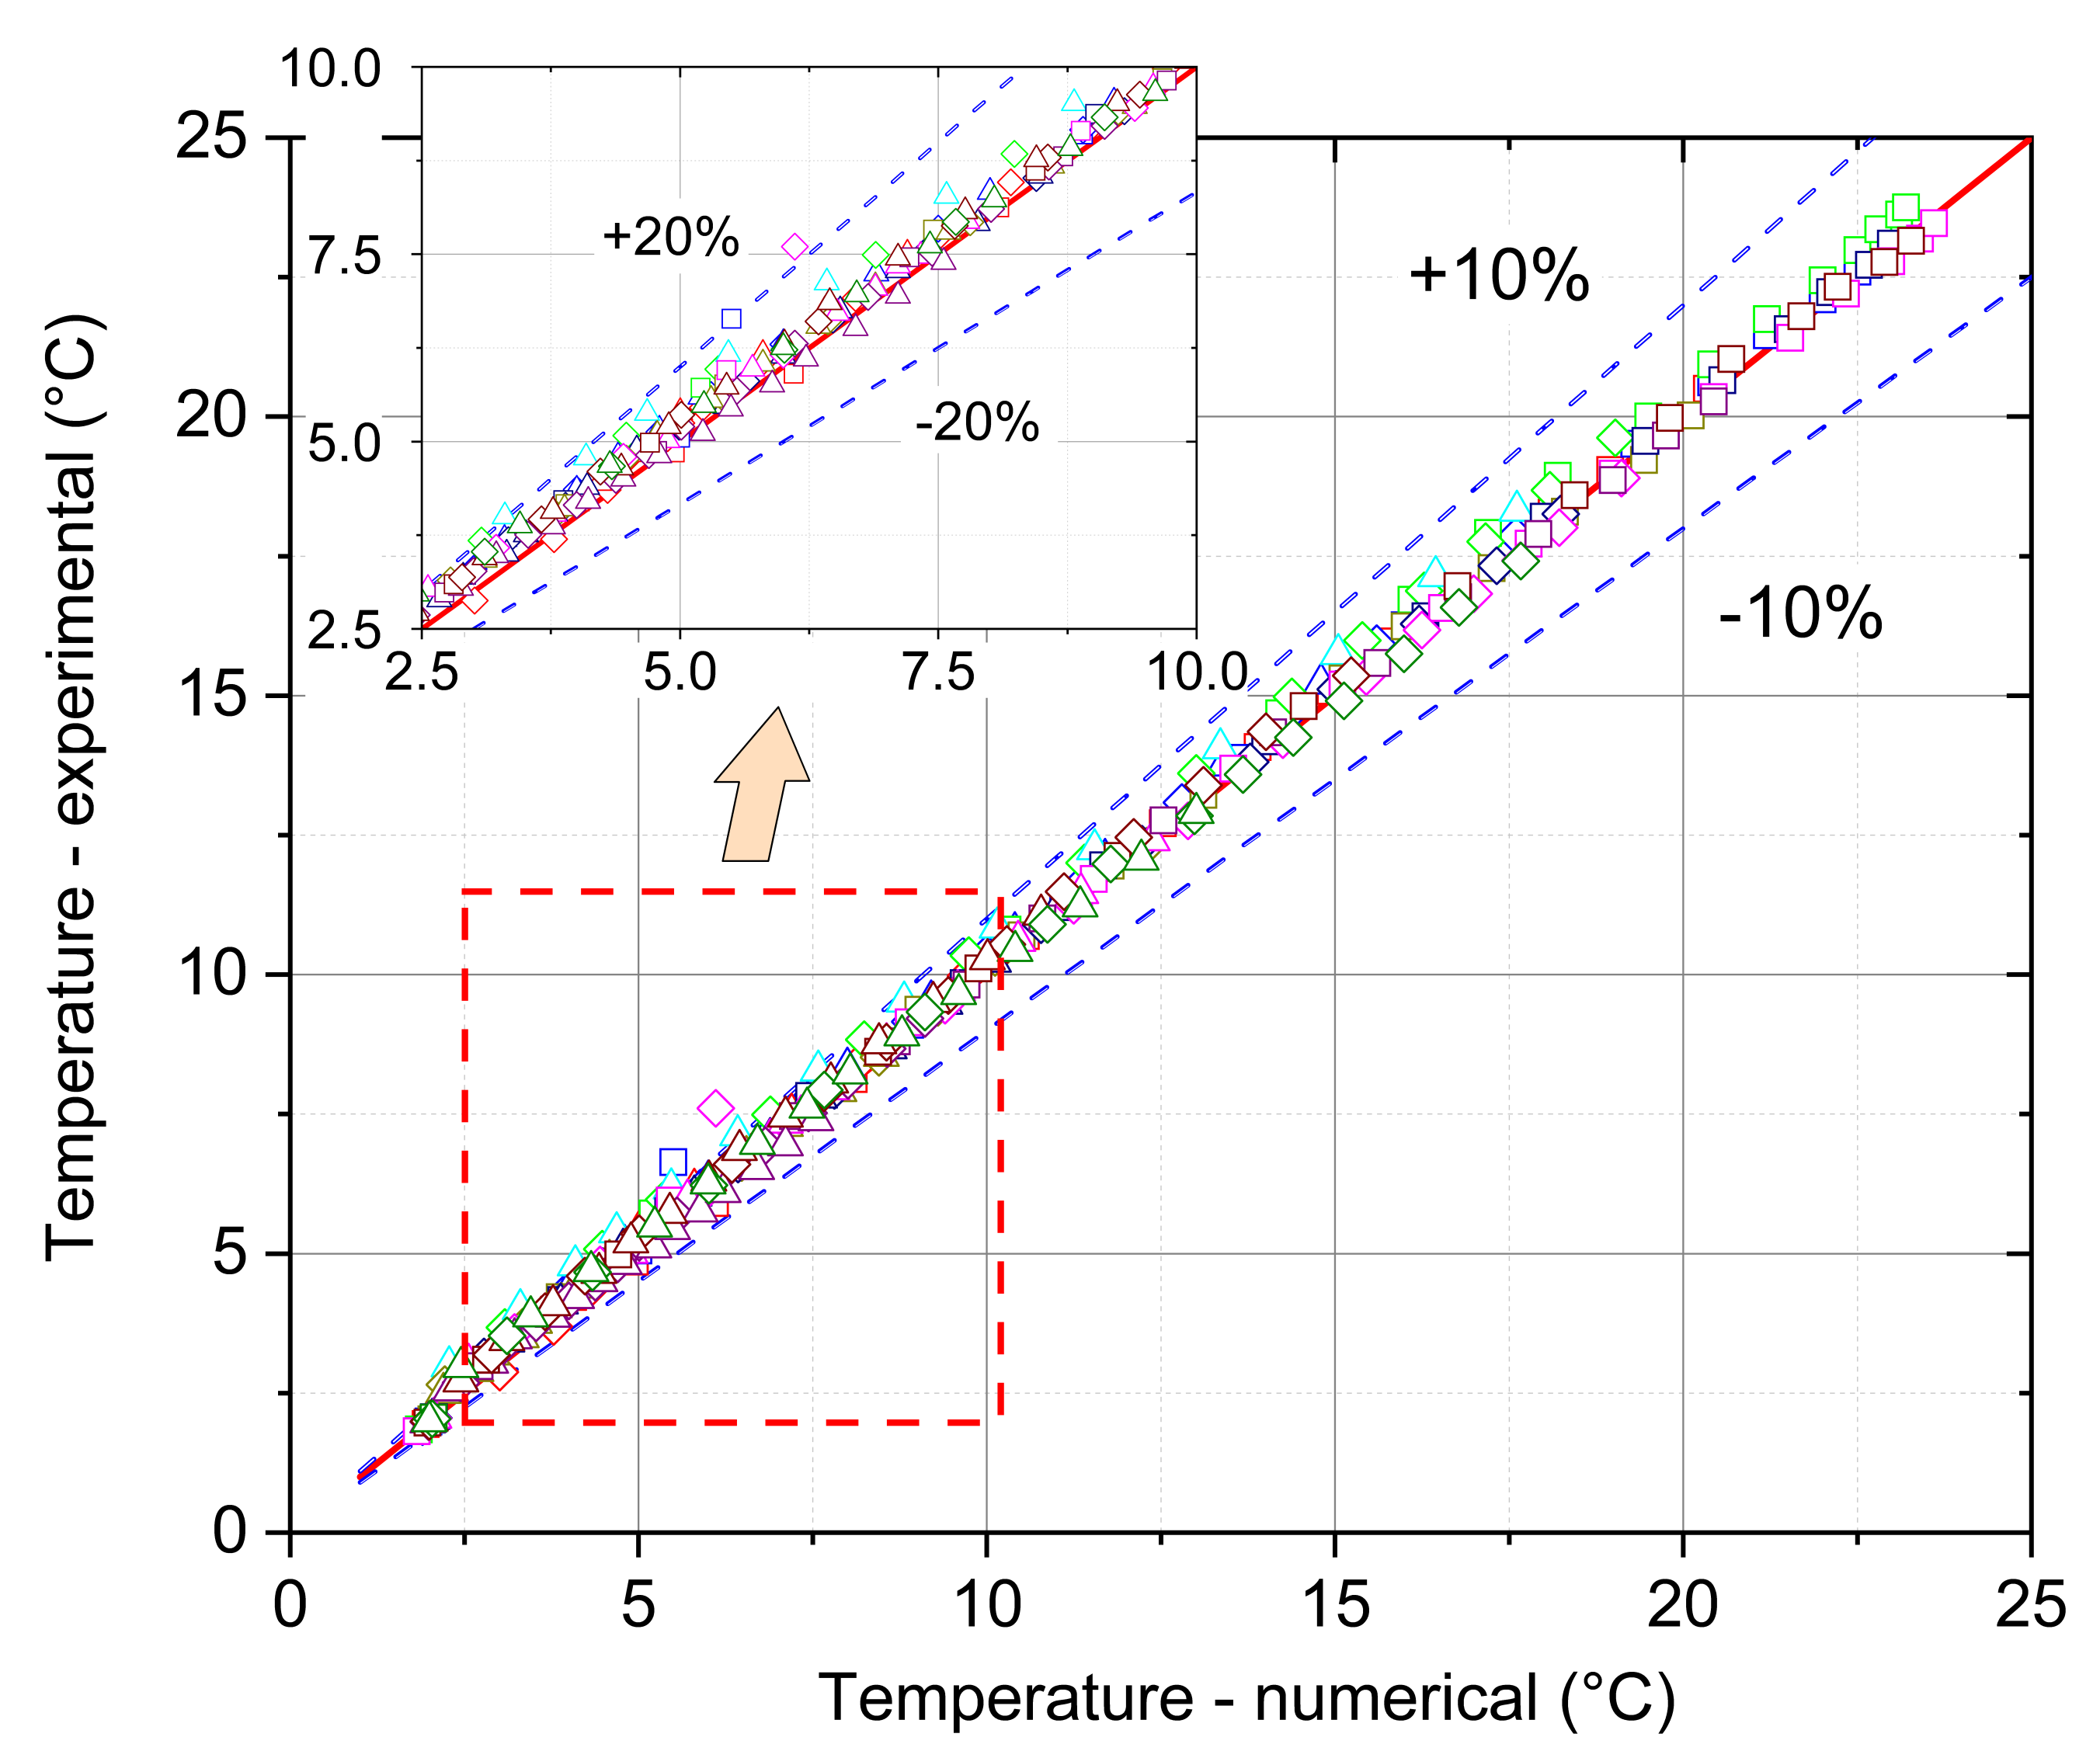
  • The mathematical model that is based on the enthalpy porosity method (Equations (1)–(4)) reproduces the conditions in the phase change material during the heating process with a maximum error of up to 20%. (Figure 14, Figure 15 and Figure 16 and Figure 19). It is very important that the proposed model should be implemented in the numerical code, together with variable thermophysical properties (Equations (5)–(7)).
  • The SEM tests confirmed the homogeneous structure of the mixture and the lack of changes in the internal structure during phase transformations at characteristic temperatures (Figure 3).

Author Contributions

Conceptualisation, A.O., W.-Q.C., P.B., M.P. and S.P.; methodology, A.O., W.-Q.C., P.B. and S.P.; software, W.-Q.C. and P.B.; validation, A.O., W.-Q.C., P.B. and S.P.; formal analysis, A.O., W.-Q.C., P.B., M.P. and S.P.; investigation, A.O. and W.-Q.C.; resources, S.P.; writing—original draft preparation, A.O., W.-Q.C., P.B., M.P. and S.P.; writing—review and editing, A.O., W.-Q.C., P.B., M.P. and S.P.; visualisation, A.O., W.-Q.C., P.B. and S.P.; supervision, S.P.; project administration, S.P., funding acquisition, S.P. All authors have read and agreed to the published version of the manuscript.

Funding

This research was partly funded by National Centre for Research and Development of Poland grant number POIR.04.01.04-00-0037/15 and partly supported by the internal research funds of the Department of Thermodynamics and Renewable Energy Sources at Wrocław University of Science and Technology, Poland, No. 8201003902 (MPK 9090750000). Calculations have been carried out using resources provided by Wrocław Center for Networking and Supercomputing (http://wcss.pl), grant Nos. 202 and 309.

Institutional Review Board Statement

Not applicable.

Informed Consent Statement

Not applicable.

Acknowledgments

The authors would like to thank Halina Pawlak-Kruczek and Michał Czerep from Wrocław University of Science and Technology for providing and assistance in conducting tests using a Scanning Electron Microscope (SEM) for PCM analysis.

Conflicts of Interest

The authors declare no conflict of interest.

Abbreviations

The following abbreviations are used in this manuscript:
CFD Computational Fluid Dynamics
FSOHP Flower Shape Oscillating Heat Pipe
FVM Finite Volume Method
LHTES Latent Heat Thermal Energy Storage
PCM Phase Change Material
PDE Partial Differential Equation
RTI Relative Time Increase
SEM Scanning Electron Microscope
TES Thermal Energy Storage

References

  1. Edenhofer, O.; Pichs-Madruga, R.; Sokona, Y.; Seyboth, K.; Kadner, S.; Zwickel, T.; Eickemeier, P.; Hansen, G.; Schlömer, S.; von Stechow, C.; et al. Renewable Energy Sources and Climate Change Mitigation: Special Report of the Intergovernmental Panel on Climate Change; Cambridge University Press: Cambridge, UK, 2011. [Google Scholar]
  2. Paksoy, H.Ö. Thermal Energy Storage for Sustainable Energy Consumption, Fundamentals, Case Studies and Design; Springer: Dordrecht, The Netherlands, 2007. [Google Scholar]
  3. Zalba, B.; Marín, B.; Cabeza, J.; Mehling, H. Review on thermal energy storage with phase change: Materials, heat transfer analysis and applications. Appl. Therm. Eng. 2003, 23, 251–283. [Google Scholar] [CrossRef]
  4. Jiji, L.M.; Gaye, S. Analysis of solidification and melting of PCM with energy generation. Appl. Therm. Eng. 2006, 26, 568–575. [Google Scholar] [CrossRef]
  5. An, C.; Su, J. Lumped parameter model for one-dimensional melting in a slab with volumetric heat generation. Appl. Therm. Eng. 2013, 60, 387–396. [Google Scholar] [CrossRef]
  6. Kalaiselvam, S.; Veerappan, M.; Arul Aaron, A.; Iniyan, S. Experimental and analytical investigation of solidification and melting characteristics of PCMs inside cylindrical encapsulation. Int. J. Therm. Sci. 2008, 47, 858–874. [Google Scholar] [CrossRef]
  7. Cheng, R.; Wang, X.; Zhang, Y.P. Energy-Efficient Building Envelopes with Phase-Change Materials: New Understanding and Related Research. Heat Transf. Eng. 2014, 35, 970–984. [Google Scholar] [CrossRef]
  8. Shi, X.; Memon, S.A.; Tang, W.C.; Cui, H.Z.; Xing, F. Experimental assessment of position of macro encapsulated phase change material in concrete walls on indoor temperatures and humidity levels. Energy Build. 2014, 71, 80–87. [Google Scholar] [CrossRef]
  9. Qu, M.L.; Xia, L.; Deng, S.M.; Jiang, Y.Q. Improved indoor thermal comfort during defrost with a novel reverse-cycle defrosting method for air source heat pumps. Build. Environ. 2010, 45, 2354–2361. [Google Scholar] [CrossRef]
  10. Mondal, S. Phase change materials for smart textiles—An overview. Appl. Therm. Eng. 2008, 28, 1536–1550. [Google Scholar] [CrossRef]
  11. Alehosseini, E.; Jafari, S.M. Micro/nano-encapsulated phase change materials (PCMs) as emerging materials for the food industry. Trends Food Sci. Technol. 2019, 91, 116–128. [Google Scholar] [CrossRef]
  12. Najjar, A.; Hasan, A. Modeling of greenhouse with PCM energy storage. Energy Convers. Manag. 2008, 49, 3338–3342. [Google Scholar] [CrossRef]
  13. Kenisarin, M.; Mahkamov, K. Solar energy storage using phase change materials. Renew. Sustain. Energy Rev. 2007, 11, 1913–1965. [Google Scholar] [CrossRef]
  14. Farid, M.M.; Khudhair, A.M.; Razack, S.A.K.; Al-Hallaj, S. A review on phase change energy storage: Materials and applications. Energy Convers. Manag. 2004, 45, 1597–1615. [Google Scholar] [CrossRef]
  15. Sarı, A.; Biçer, A. Thermal energy storage properties and thermal reliability of some fatty acid esters/building material composites as novel form-stable PCMs. Sol. Energy Mater. Sol. Cells 2012, 101, 114–122. [Google Scholar] [CrossRef]
  16. Liu, M.; Saman, W.; Bruno, F. Review on storage materials and thermal performance enhancement techniques for high temperature phase change thermal storage systems. Renew. Sustain. Energy Rev. 2012, 16, 2118–2132. [Google Scholar] [CrossRef]
  17. Liu, M.; Steven Tay, N.H.; Bell, S.; Belusko, M.; Jacob, R.; Will, G.; Saman, W.; Bruno, F. Review on concentrating solar power plants and new developments in high temperature thermal energy storage technologies. Renew. Sustain. Energy Rev. 2016, 53, 1411–1432. [Google Scholar] [CrossRef]
  18. Javier Batlles, F.; Gil, B.; Ushak, S.; Kasperski, J.; Luján, M.; Maldonado, D.; Nemś, M.; Nemś, A.; Puertas, A.M.; Romero-Cano, M.S.; et al. Development and Results from Application of PCM-Based Storage Tanks in a Solar Thermal Comfort System of an Institutional Building—A Case Study. Energies 2020, 13, 3877. [Google Scholar] [CrossRef]
  19. Amin, N.A.M.; Bruno, F.; Belusko, M. Effectiveness—NTU correlation for low temperature PCM encapsulated in spheres. Appl. Energy 2012, 93, 549–555. [Google Scholar] [CrossRef]
  20. Yang, D.; Shi, S.L.; Xiong, L.; Guo, H.J.; Zhang, H.R.; Chen, X.F.; Wang, C.; Chen, X.D. Paraffin/Palygorskite composite phase change materials for thermal energy storage. Sol. Energy Mater. Sol. Cells 2016, 144, 228–234. [Google Scholar] [CrossRef]
  21. Drissi, S.; Ling, T.C.; Mo, K.H. Thermal efficiency and durability performances of paraffinic phase change materials with enhanced thermal conductivity—A review. Thermochim. Acta 2019, 673, 198–210. [Google Scholar] [CrossRef]
  22. Dogkas, G.; Koukou, M.K.; Konstantaras, J.; Pagkalos, C.; Lymperis, K.; Stathopoulos, V.; Coelho, L.; Rebola, A.; Vrachopoulos, M.G. Investigating the performance of a thermal energy storage unit with paraffin as phase change material, targeting buildings’ cooling needs: An experimental approach. Int. J. Thermofluids 2020, 3–4, 100027. [Google Scholar] [CrossRef]
  23. Du, K.; Calautit, J.; Wang, Z.H.; Wu, Y.P.; Liu, H. A review of the applications of phase change materials in cooling, heating and power generation in different temperature ranges. Appl. Energy 2018, 220, 242–273. [Google Scholar] [CrossRef]
  24. Shamsundar, N.; Sparrow, E.M. Effect of Density Change on Multidimensional Conduction Phase Change. J. Heat Transf. 1976, 98, 550–557. [Google Scholar] [CrossRef]
  25. Bareiss, M.; Beer, H. An analytical solution of the heat transfer process during melting of an unfixed solid phase change material inside a horizontal tube. Int. J. Heat Mass Transf. 1984, 27, 739–746. [Google Scholar] [CrossRef]
  26. Bilir, L.; İlken, Z. Total solidification time of a liquid phase change material enclosed in cylindrical/spherical containers. Appl. Therm. Eng. 2005, 25, 1488–1502. [Google Scholar] [CrossRef] [Green Version]
  27. Verma, P.; Varun; Singal, S.K. Review of mathematical modeling on latent heat thermal energy storage systems using phase-change material. Renew. Sustain. Energy Rev. 2008, 12, 999–1031. [Google Scholar] [CrossRef]
  28. Al-Abidi, A.A.; Mat, S.; Sopian, K.; Sulaiman, M.Y.; Mohammad, A.T. Numerical study of PCM solidification in a triplex tube heat exchanger with internal and external fins. Int. J. Heat Mass Transf. 2013, 61, 684–695. [Google Scholar] [CrossRef]
  29. Li, Z.X.; Sheikholeslami, M.; Shah, Z.; Shafee, A.; Al-Qawasmi, A.R.; Tlili, I. Transient process in a finned triplex tube during phase changing of aluminum oxide enhanced PCM. Eur. Phys. J. Plus 2019, 134, 173–183. [Google Scholar] [CrossRef]
  30. Shah, Z.; Hajizadeh, M.R.; Ikramullah; Alreshidi, N.A.; Deebani, W.; Shutaywi, M. Entropy optimization and heat transfer modeling for Lorentz forces effect on solidification of NEPCM. Int. Commun. Heat Mass Transf. 2020, 117, 104715. [Google Scholar] [CrossRef]
  31. Jourabian, M.; Farhadi, M. Melting of nanoparticles-enhanced phase change material (NEPCM) in vertical semicircle enclosure: Numerical study. J. Mech. Sci. Technol. 2015, 29, 3819–3830. [Google Scholar] [CrossRef]
  32. Dubovsky, V.; Ziskind, G.; Letan, R. Analytical model of a PCM-air heat exchanger. Appl. Therm. Eng. 2011, 31, 3453–3462. [Google Scholar] [CrossRef]
  33. Darzi, A.R.; Farhadi, M.; Sedighi, K. Numerical study of melting inside concentric and eccentric horizontal annulus. Appl. Math. Model. 2012, 36, 4080–4086. [Google Scholar] [CrossRef]
  34. Mahdaoui, M.; Kousksou, T.; Blancher, S.; Ait Msaad, A.; El Rhafiki, T.; Mouqallid, M. A numerical analysis of solid–liquid phase change heat transfer around a horizontal cylinder. Appl. Math. Model. 2014, 38, 1101–1110. [Google Scholar] [CrossRef]
  35. Regin, A.F.; Solanki, S.C.; Saini, J.S. Latent heat thermal energy storage using cylindrical capsule: Numerical and experimental investigations. Renew. Energy 2006, 31, 2025–2041. [Google Scholar] [CrossRef]
  36. Czajkowski, C.; Nowak, A.I.; Pietrowicz, S. Flower Shape Oscillating Heat Pipe—A novel type of oscillating heat pipe in a rotary system of coordinates—An experimental investigation. Appl. Therm. Eng. 2020, 179, 115702. [Google Scholar] [CrossRef]
  37. Pietrowicz, S.; Błasiak, P.; Czajkowski, C.; Nowak, A.I.; Rak, J.; Żuraw, A.; Barylak, S. Dispergating Mixer with Pulsating Heat Exchanger. Patent No. PL 234579, 31 March 2020. [Google Scholar]
  38. Ochman, A.; Pietrowicz, S. The thermal behaviour of a special heat exchanger filled with the phase change material dedicated for low-temperature storage applications. EPJ Web Conf. 2019, 201, 01003. [Google Scholar] [CrossRef] [Green Version]
  39. Pietrowicz, S.; Błasiak, P.; Czajkowski, C.; Nowak, A.I.; Rak, J.; Żuraw, A.; Barylak, S. Heat Storage with Phase Change Bed. Patent No. PL 234838, 30 April 2020. [Google Scholar]
  40. MikroCaps d.o.o., Zasavska Cesta 95, SI-1231 Ljubljana, Slovenia. Available online: https://www.mikrocaps.com/products/microencapsulated-paraffin/ (accessed on 5 January 2018).
  41. Shen, J.M.; Dong, J.G.; Li, R.Q.; Zhang, J.; Chen, X.; Qin, Y.M.; Ma, H.D. Integrated supersonic wind tunnel nozzle. Chin. J. Aeronaut. 2019, 32, 2422–2432. [Google Scholar] [CrossRef]
  42. Mazzeo, D.; Oliveti, G.; Arcuri, N. A Method for Thermal Dimensioning and for Energy Behavior Evaluation of a Building Envelope PCM Layer by Using the Characteristic Days. Energies 2017, 10, 659–677. [Google Scholar] [CrossRef] [Green Version]
  43. Zastawna-Rumin, A.; Kisilewicz, T.; Berardi, U. Novel Simulation Algorithm for Modeling the Hysteresis of Phase Change Materials. Energies 2020, 13, 1200–1214. [Google Scholar] [CrossRef] [Green Version]
  44. Zhang, P.; Xiao, X.; Ma, Z.W. A review of the composite phase change materials: Fabrication, characterization, mathematical modeling and application to performance enhancement. Appl. Energy 2016, 165, 472–510. [Google Scholar] [CrossRef]
  45. Duan, J.; Xiong, Y.L.; Yang, D. Melting Behavior of Phase Change Material in Honeycomb Structures with Different Geometrical Cores. Energies 2019, 12, 2920–2938. [Google Scholar] [CrossRef] [Green Version]
  46. Duan, J.; Xiong, Y.L.; Yang, D. On the Melting Process of the Phase Change Material in Horizontal Rectangular Enclosures. Energies 2019, 12, 3100–3120. [Google Scholar] [CrossRef] [Green Version]
  47. ANSYS, Inc. Ansys® Academic Research Fluent, Release 19.0, Theory Guide; ANSYS, Inc., Southpointe: Canonsburg, PA, USA, 2019. [Google Scholar]
  48. Voller, V.R.; Swaminathan, C.R. General source-based method for solidification phase change. Numer. Heat Transf. Part B Fundam. 2007, 19, 175–189. [Google Scholar] [CrossRef]
  49. Mehling, H.; Cabeza, L.F. Heat and Cold Storage with PCM; Springer: Berlin/Heidelberg, Germany, 2008. [Google Scholar]
  50. Kean, T.H.; Che Sidik, N.A. Numerical investigation on melting of various nanoparticles enhanced phase change material inside a square enclosure. In Proceedings of the International Conference on Sustainable Energy and Green Technology, Bangkok, Thailand, 11–14 December 2019. [Google Scholar] [CrossRef]
  51. Elsayed, A.O. Numerical investigation on PCM melting in triangular cylinders. Alex. Eng. J. 2018, 57, 2819–2828. [Google Scholar] [CrossRef]
  52. Gasia, J.; Miró, L.; de Gracia, A.; Barreneche, C.; Cabeza, L.F. Experimental Evaluation of a Paraffin as Phase Change Material for Thermal Energy Storage in Laboratory Equipment and in a Shell-and-Tube Heat Exchanger. Appl. Sci. 2016, 6, 112–123. [Google Scholar] [CrossRef]
  53. Pagkalos, C.; Dogkas, G.; Koukou, M.K.; Konstantaras, J.; Lymperis, K.; Vrachopoulos, M.G. Evaluation of water and paraffin PCM as storage media for use in thermal energy storage applications: A numerical approach. Int. J. Thermofluids 2020, 1–2, 100006. [Google Scholar] [CrossRef]
  54. Bejan, A. Convection Heat Transfer; John Wiley & Sons, Ltd.: Hoboken, NJ, USA, 2013; Chapter 10; pp. 469–477. [Google Scholar] [CrossRef]
  55. Sparrow, E.M.; Broadbent, J.A. Inward Melting in a Vertical Tube Which Allows Free Expansion of the Phase-Change Medium. J. Heat Transf. 1982, 104, 309–315. [Google Scholar] [CrossRef]
  56. Menon, A.S.; Weber, M.E.; Mujumdar, A.S. The dynamics of energy storage for paraffin wax in cylindrical containers. Can. J. Chem. Eng. 1983, 61, 647–653. [Google Scholar] [CrossRef]
  57. Katayama, K.; Saito, A.; Utaka, Y.; Saito, A.; Matsui, H.; Maekawa, H.; Saifullah, A.Z.A. Heat transfer characteristics of the latent heat thermal energy storage capsule. Sol. Energy 1981, 27, 91–97. [Google Scholar] [CrossRef]
  58. Del Rosario, M.D.L.Á.O.; Bruneau, D.; Sébastian, P.; Nadeau, J.P.; Sommier, A.; Lopez, J. Experimental study of an air-PCM heat exchanger: Melting in a cylindrical container. In Proceedings of the ESTEC Conference Proceedings 6th Engineering, Science and Technology Conference, Panama City, Panama, 11–13 October 2017; pp. 403–413. [Google Scholar] [CrossRef] [Green Version]
  59. Cengel, Y.A. Heat Transfer: A Practical Approach, 2nd ed.; McGraw-Hill: New York, NY, USA, 2002. [Google Scholar]
  60. Incropera, F.P.; DeWitt, D.P.; Bergman, T.L.; Lavine, A.S. Fundamentals of Heat and Mass Transfer; John Wiley & Sons Ltd.: Hoboken, NJ, USA, 2007; pp. 423–433. [Google Scholar]
Figure 1. Description of the Scanning Electron Microscope (SEM) chamber and the prepared sample.
Energies 14 00538 g001
Figure 2. Temperature and relative humidity profiles maintained during measurement.
Energies 14 00538 g002
Figure 3. Analysis of the PCM internal structure, made for different temperatures and magnifications obtained while using the SEM.
Energies 14 00538 g003
Figure 4. General view of the wind tunnel with installed PCM module.
Energies 14 00538 g004
Figure 5. Tested module of a PCM.
Energies 14 00538 g005
Figure 6. PCM module placed in the wind tunnel.
Energies 14 00538 g006
Figure 7. Velocity profiles of cross section at different power.
Energies 14 00538 g007
Figure 8. Three-dimensional geometrical model used during numerical calculation.
Energies 14 00538 g008
Figure 9. Mesh with details used during numerical calculations.
Energies 14 00538 g009
Figure 10. Measured temperatures evolution for d = 28 mm PCM module and 0.92 m/s value of the velocity.
Energies 14 00538 g010
Figure 11. Derivation evolution of T 3 thermocouple for d = 28 mm PCM module and 0.92 m/s value of the velocity.
Energies 14 00538 g011
Figure 12. T 3 thermocouple evolution for different diameter of PCM module and velocity: (a) Case 0–0.0 m/s, (b) Case I–0.92 m/s, (c) Case II–2.27 m/s, and (d) Case III–3.18 m/s.
Energies 14 00538 g012
Figure 13. Relative time increase (RTI) for analysed Cases: (a) water and (b) paraffin wax.
Energies 14 00538 g013
Figure 14. Comparison of the experimental and numerical results for the inlet velocity of 0.92 m/s and different cylinder diameters.
Energies 14 00538 g014
Figure 15. Comparison of the experimental and numerical results for the inlet velocity of 2.27 m/s and different cylinder diameters.
Energies 14 00538 g015
Figure 16. Comparison of the experimental and numerical results for the inlet velocity of 3.18 m/s and different cylinder diameters.
Energies 14 00538 g016
Figure 17. Numerical results of temperature distribution in the middle vertical plane for the inlet velocity of 0.92 m/s and cylinder diameter of 15 mm and different times of the simulation.
Energies 14 00538 g017
Figure 18. Numerical results of temperature distribution in the middle horizontal plane for the inlet velocity of 0.92 m/s and cylinder diameter of 15 mm and different times of the simulation.
Energies 14 00538 g018
Figure 19. The comparison of numerical and experimental temperatures and obtained relative error.
Energies 14 00538 g019
Table 1. The thermophysical properties of the Phase Change Material (PCM) used during the experiments [40].
PropertyUnitMinimumMaximum
PCM content in the dispersion%2530
PCM content in dry capsule%7580
Dry content in the dispersion%3538
PCM melting range°C46
Heat storage capacity (of slurry)kJ/kg6072
Heat storage capacity (of dried microcapsules)kJ/kg180192
pH7.09.0
Densitykg/m3900970
Dynamic viscosity (at 25 °C)kg/(m s)0.10.5
Average particles sizeμm1030
Table 2. Contributions of the module components in heat transfer.
Outer Diameter of Module mm 152228
PCM/module mass fraction%25.2331.5337.82
Copper/module mass fraction%74.7768.4762.18
Sensible heat of copper kJ 1.622.663.71
Sensible heat of PCM kJ 2.875.4610.19
Latent heat of PCM kJ 2.464.688.74
PCM/module heat fraction%76.6979.2283.63
Copper/module heat fraction%23.3120.7816.37
Table 3. The summarised results that were obtained from profile measurements.
ParameterUnitCase 0Case ICase IICase III
Power of the fanW06080150
Mean velocitym/s0.000.922.273.18
Maximum deviation from the average value%7.367.155.19
Table 4. Thermophysical properties of materials used during calculations.
MaterialDensity
kg/m3
Specific
Heat
J/(kg K)
Thermal
Conductivity
W/(m K)
Dynamic
Viscosity
kg/(m s)
Melting
Heat
J/kg
Solidus
Temperature
°C
Liquidus
Temperature
°C
Paraffin waxEquation (5)2500Equation (6)Equation (7)72,00046
Air1.1251006.430.02421.7894 × 10−5---
Plexi-glass100010000.2----
Copper8978381387.6----
Table 5. Boundary conditions employed during calculations.
Domain/MaterialLocationBoundaryUnitValue
Duct/plexi-glassExternal wallsWall-temperature°C24
Internal wallsInterfaceCoupled wall [47]
Air/airDuct wet wallsInterfaceCoupled wall [47]
Upper base wet wallsInterfaceCoupled wall [47]
Lower base wet wallsInterfaceCoupled wall [47]
Cylinder base wet wallsInterfaceCoupled wall [47]
InletInlet-velocitym/s0.92,2.27,3.18
Inlet-temperature°C24
OutletOutlet-pressurebar1
Upper base/copperExternal and internal wallsInterfaceCoupled wall [47]
Lower base/copperExternal and internal wallsInterfaceCoupled wall [47]
Cylinder/copperExternal and internal wallsInterfaceCoupled wall [47]
PCM module/paraffin waxExternal wallsInterfaceCoupled wall [47]
Table 6. Water melting time.
CasePCM 15 mmPCM 22 mmPCM 28 mm
Case 005 min 45 s18 min 55 s35 min 30 s
Case I03 min 00 s11 min 00 s17 min 30 s
Case II02 min 20 s07 min 15 s12 min 30 s
Case III01 min 55 s05 min 15 s11 min 05 s
Table 7. Paraffin melting time.
CasePCM 15 mmPCM 22 mmPCM 28 mm
Case 005 min 25 s24 min 05 36 min 5 s
Case I02 min 25 s10 min 50 s13 min 50 s
Case II02 min 00 s04 min 55 s07 min 00 s
Case III00 min 50 s03 min 00 s04 min 40 s
Publisher’s Note: MDPI stays neutral with regard to jurisdictional claims in published maps and institutional affiliations.

