1. Introduction
Many factors influence the operation of PV (photovoltaic) panels. As most of the factors are related to the weather conditions, they are frequently variable, which makes them difficult to predict. For monitoring and controlling the operation of power plants, many solutions may be used, and the solutions are now part of the family of IoT systems.
There are plenty of recent articles that report and prove that the accuracy and performance of the solar PV system can be improved by employing an efficient solar PV monitoring system [
1,
2,
3,
4,
5].
Renewable energy is important because it is clean and may also be cheap. The most popular renewable energy sources are biomass, moving water, tidal energy, wind and solar energy. Solar energy in particular is attractive due to its wide availability. Solar energy can be used at a relatively low cost. Effective use of solar energy can be a challenge because of the fluctuation of available energy throughout the day and night, season, weather conditions, and cleanliness of the panels. The operating conditions vary depending on the location of the power plant. The important parameters vary for each location, such as temperature, solar global horizontal irradiation, solar diffuse horizontal irradiation, sunshine hours, speed and wind direction, humidity, pressure, precipitation, day length, geographical location and setting angle. Almost all these parameters vary over time and can often change randomly, therefore the photovoltaic panels cannot work all the time at a fixed operating point [
6,
7,
8,
9,
10,
11,
12,
13]. Other important factors are mounting location and possibility of shading of the PV panels, proper installation in the appropriate geographical direction, appropriate distances between successive rows of PV panels to limit mutual shading, choice of type of the photovoltaic modules, choice of the operating strategy and storage method for periodic surplus energy, and accumulating or transferring into the power grid.
Changes in working conditions are impossible to predict, therefore automatic supervision systems should determine the current parameters on an ongoing basis and take specific actions to increase the overall efficiency of the entire system [
13,
14,
15,
16,
17,
18,
19].
This paper presents a comprehensive study on effective maintenance of a solar power plant based on the implementation of a dedicated IoT system. The paper is divided into five sections. First, a short introduction is given. Then,
Section 2 describes selected problems related to the effective management of a solar farm.
Section 3 is dedicated to important parameters that have a considerable influence on the performance of solar panels. The
Section 4 describes IoT solutions for maintenance of the PV systems.
Section 5 presents interesting results acquired at the solar power plant of Bialystok University of Technology.
Section 6 forms final conclusions of the application of the IoT architecture described in the paper, which allows for a comprehensive analysis of the plant operation in real time.
2. Problems Related to the Management of a Solar Farm
The solar panel efficiency highly depends on the deposition of dust particles [
20,
21,
22,
23,
24,
25]. This can be improved with automatic cleaning systems or cleaning robots. Generally, the PV panels in our local conditions (Bialystok, Poland) are not becoming dusty fast and this is not a primary problem for us, but in other locations, it may be a problem. For example, the rate of contamination of the panels is related to the angle of their inclination, which affects the possibility of self-cleaning, e.g., during rain and snowfall, and their location in the vicinity of production plants or trees shedding leaves.
Because the photovoltaic panel is a power source with a variable output power depending on the current conditions, to maximize energy extraction under all conditions a maximum power point tracking (MPPT) mechanism should be implemented as well. Another problem is the non-overlapping time periods for the energy demand of the connected loads and the availability of solar energy and the period of effective energy generation. Related to this fact is the need to use local energy storage for an installation working as an island when it is not connected to the power network. If the photovoltaic system is connected to the utility grid, the surplus power that exists at any given moment can be fed back into the grid and there is no need for storage. However, this is only possible in the case of appropriate legal regulations related to the possibility of transmitting energy to the grid.
Due to the frequently occurring maladjustment of the power grid to the collection of the energy generated in PV power plants, there may be problems with the surplus energy. The growing number of PV installations becomes a heavy burden, especially for local networks. Therefore, it is necessary to introduce intelligent energy management systems that would allow to increase the level of self-consumption or local consumption. For the operation of such systems, it is necessary to constantly monitor the operating conditions of the PV power plant and the power grid. There are proposals for the cooperation of the power grid with devices operating in a cyclic manner, such as refrigerators and heating or cooling systems. Their operating cycle can be quickly adapted to the changing conditions of the power grid operation. This is aimed at effective usage of temporary power surpluses and thus stabilization of the grid operation and improvement of electricity quality. Another challenge or opportunity is the adaptation of the power grid to cooperate with electro-mobility. The challenge is to manage vehicle charging systems cooperating in a global power network. At the same time, because the statistical vehicle is parked 92% of the time, it is a chance to use them to stabilize the operation of the power grid. This led to the proposition of the Vehicle-to-Grid (V2G) concept in which BEV (Battery Electric Vehicle) and PHEV (Plug-in Hybrid Electric Vehicle) became an active element of the power grid.
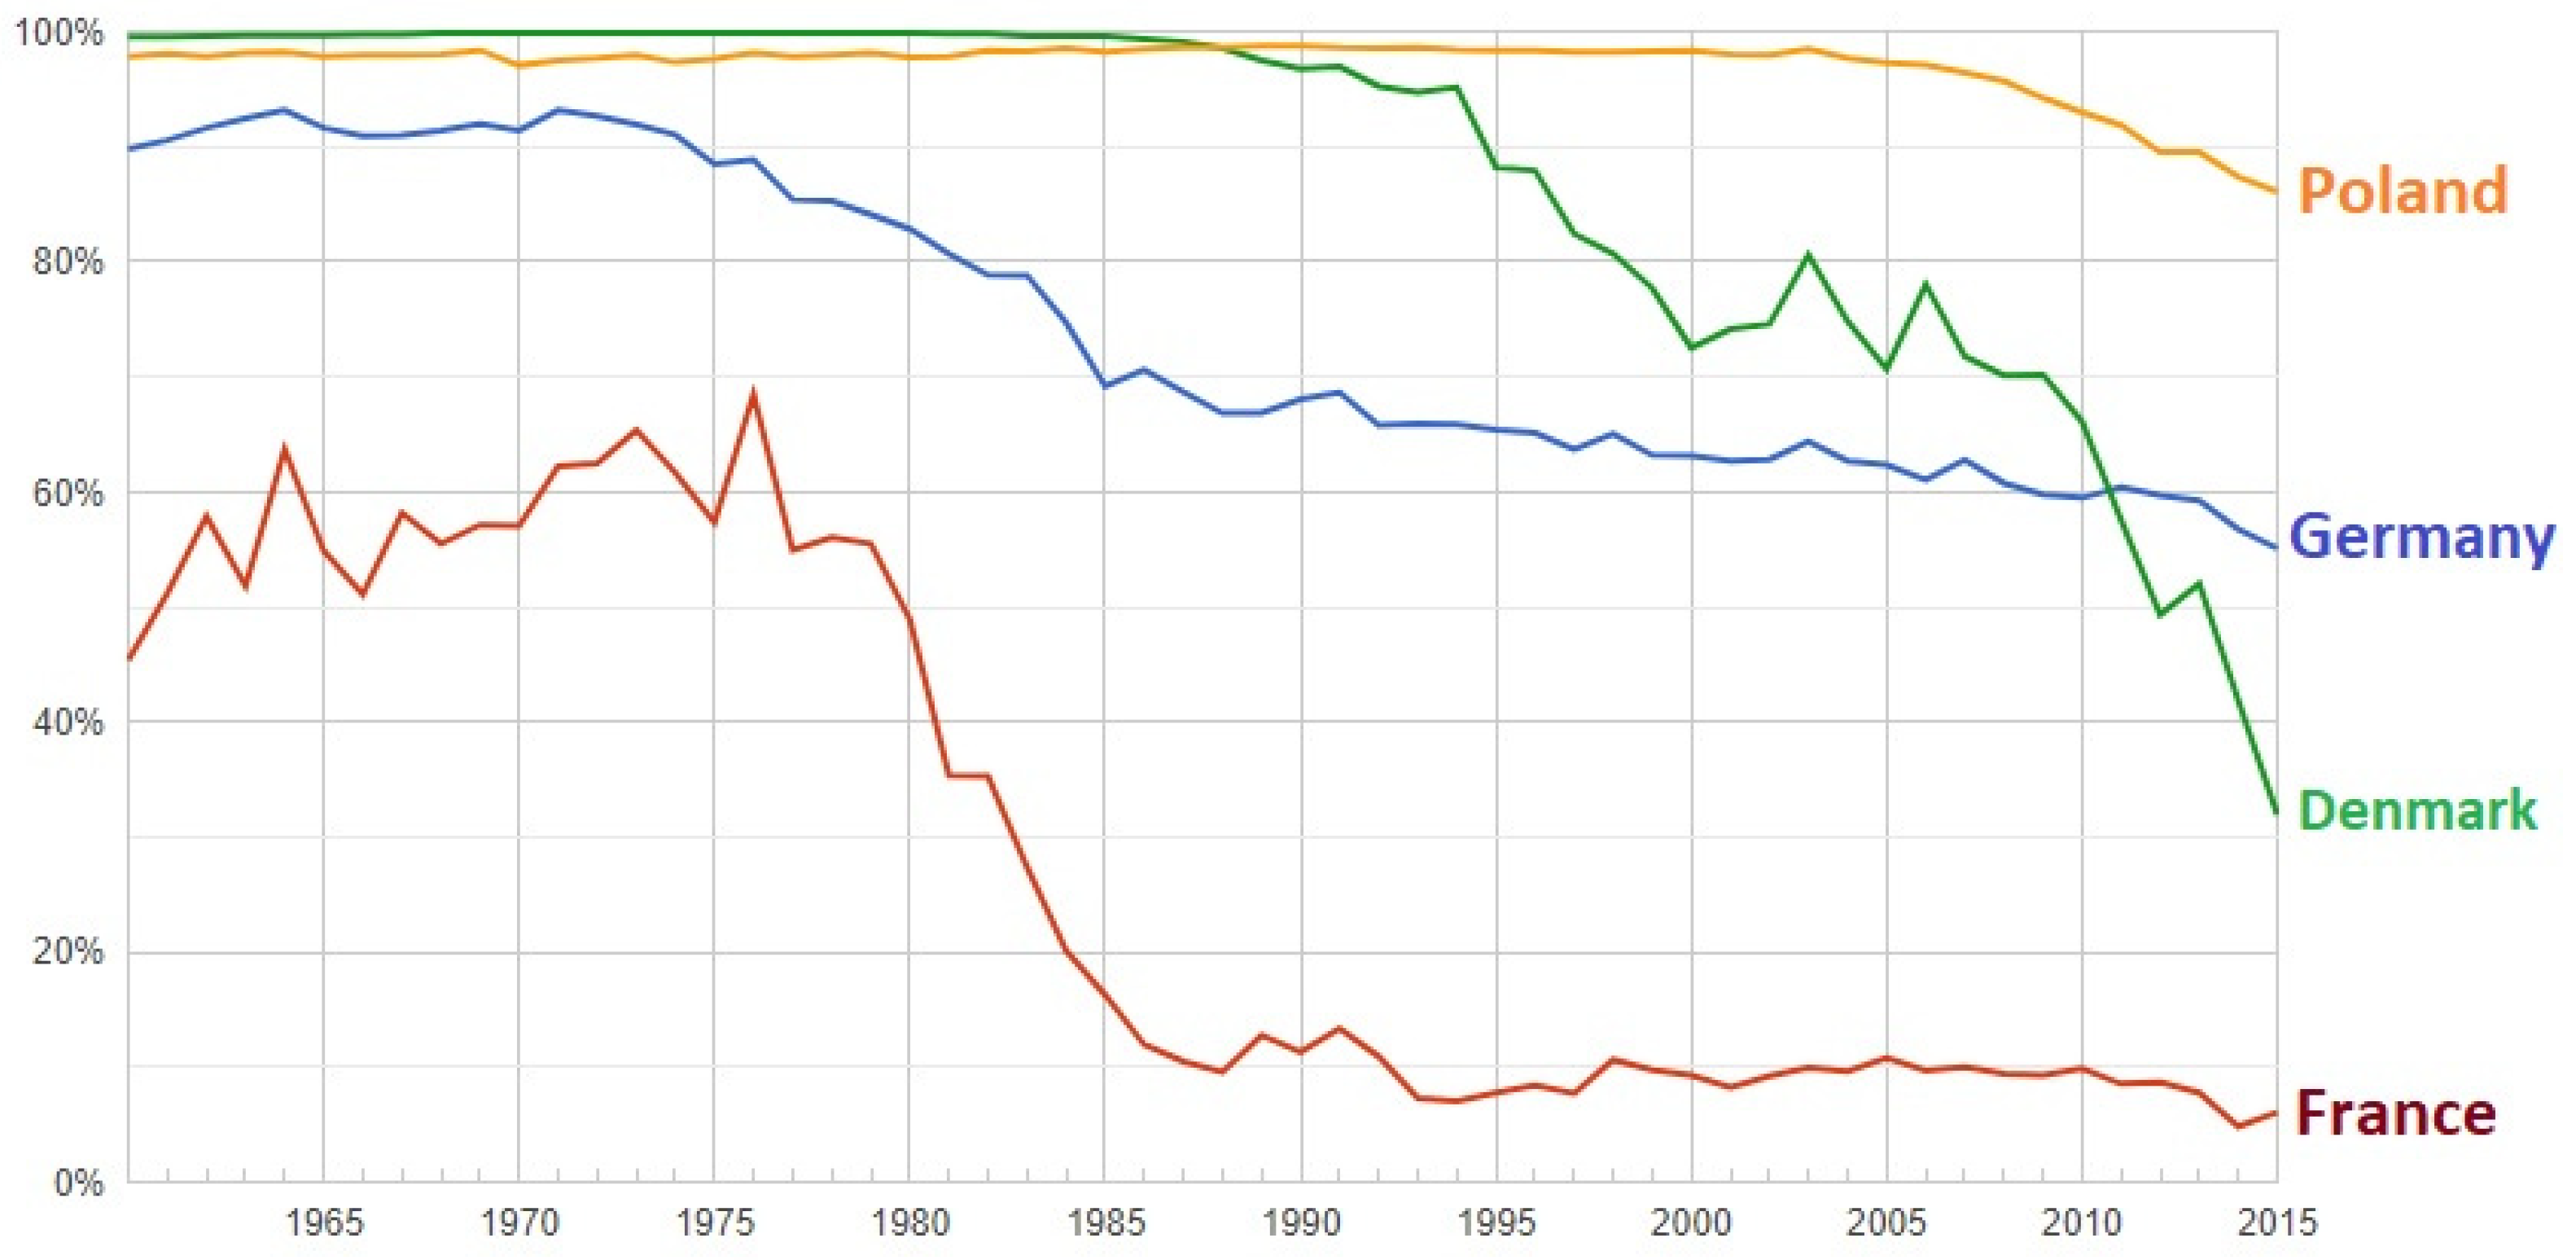
The requirements and challenges faced by different countries are completely different (
Figure 1 and
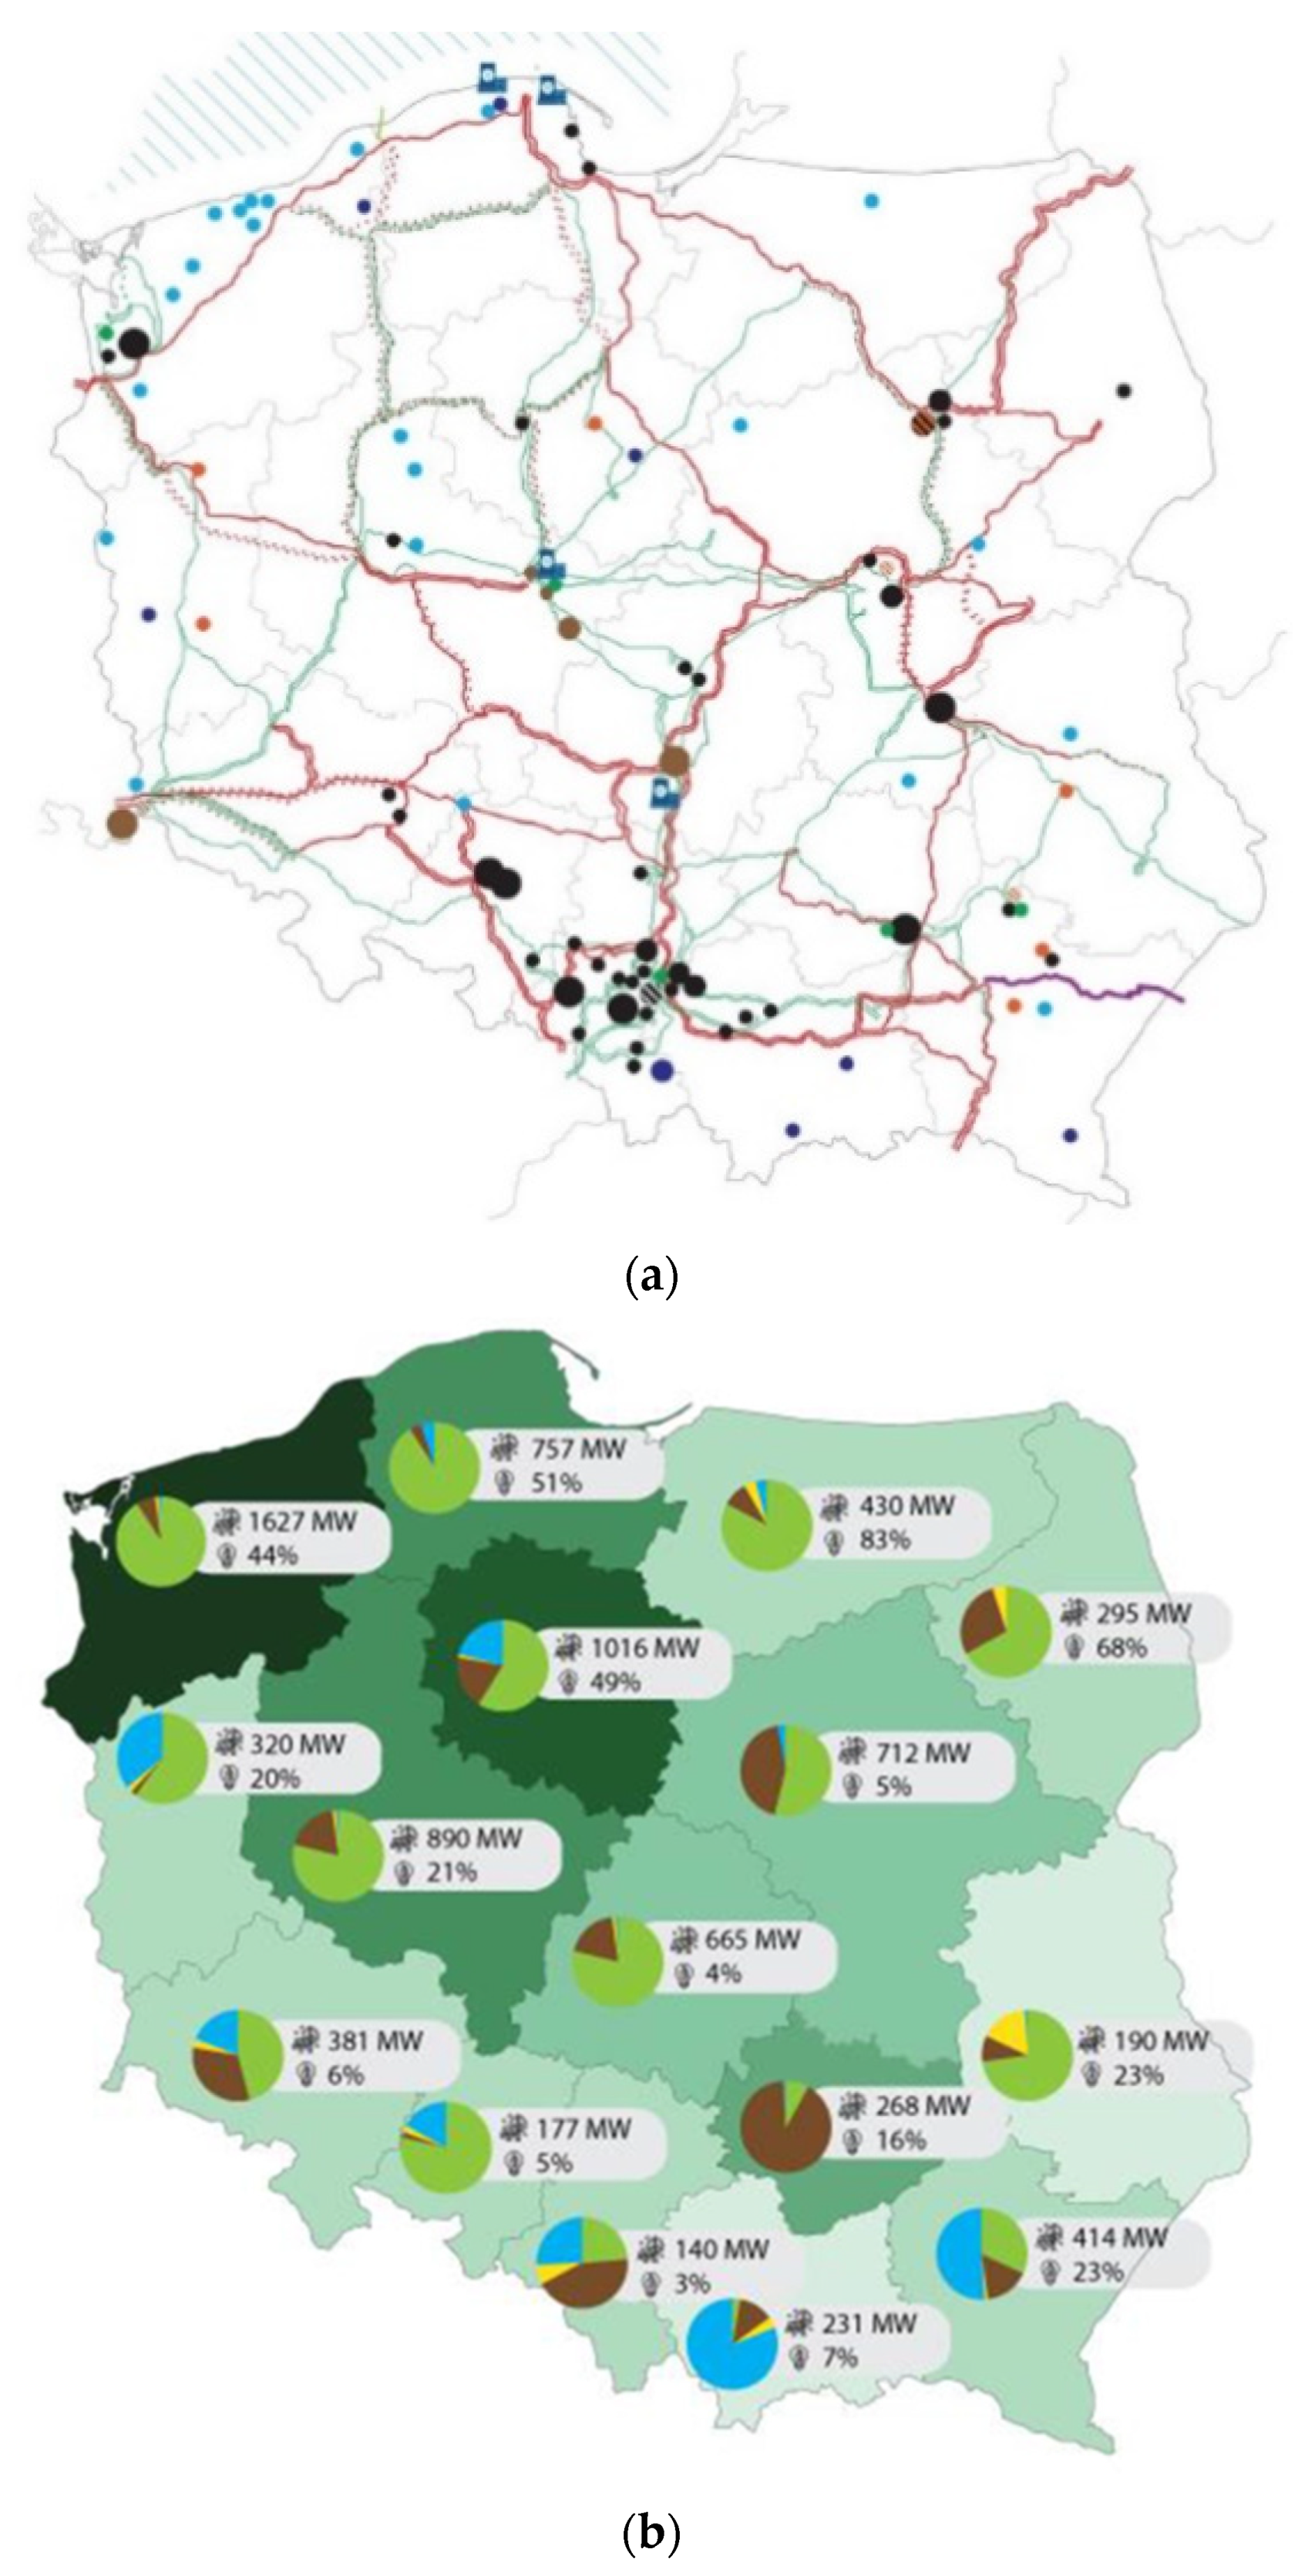
Figure 2). The implementation of the smart-grid idea must therefore correspond to the local conditions, possibilities and needs. Therefore, it is not possible to propose one solution, and each investment should be considered while taking into account local conditions. As a result, the power grid must be transformed from a centralized system to a system based to a greater extent on distributed sources. As an example, the map of the condition and development of the power system in Poland, the location of the coal power plants, and the installed capacity and the electricity produced from renewable sources in 2020 is depicted in
Figure 3. The installed capacity and electricity produced from renewable sources in Poland in 2020 is presented in
Table 1. It is important to use flexible solutions that can be easily modified in response to changing technical, organizational and economic conditions [
26,
27].
Table 1.
Installed capacity and electricity produced from renewable sources in Poland in 2020 [
28].
Table 1.
Installed capacity and electricity produced from renewable sources in Poland in 2020 [
28].
| Province | The Total Capacity of RES Plants (MW) | Share of RES in Electricity Production |
|---|
| Dolnośląskie | 381 | 6% |
| Kujawsko-Pomorskie | 1016 | 49% |
| Lubelskie | 190 | 23% |
| Lubuskie | 320 | 20% |
| Łódzkie | 665 | 4% |
| Małopolskie | 231 | 7% |
| Mazowieckie | 712 | 5% |
| Opolskie | 177 | 5% |
| Podkarpackie | 414 | 23% |
| Podlaskie | 295 | 68% |
| Pomorskie | 757 | 51% |
| Śląskie | 140 | 3% |
| Świętokrzyskie | 268 | 16% |
| Warmińsko-Mazurskie | 430 | 83% |
| Wielkopolskie | 890 | 21% |
| Zachodnio-Pomorskie | 1627 | 44% |
In many cases, an adjustment of photovoltaic cell inclination angle to the position of the sun may deliver additional profits [
29,
30]. The instantaneous values of the generated power of PV panels facing south and inclined at the optimal angle (PV1), which in the case of our location (Bialystok) is 38°, are similar to the values obtained on identical panels placed on the tracker (PV3). We can observe this in the results presented in
Figure 4 and
Figure 5.
The instantaneous power values of the individual sections may be similar, but there are significant differences in the time of work. Taking the PV1 (PV panels facing south and inclined at the optimal angle) section as a reference, the PV3 section (the panels are identical to the PV1 section) placed on the tracker generated 40% more than PV1 energy in the period of March 2015–July 2021 (
Figure 4 and
Figure 5). The annual energy consumption of the tracking system is 110 kWh, which is 2.5% of the total production in this section.
In general, the use of solar energy is generally simple and can be inexpensive; however, when maximum efficiency is needed, the complexity of the photovoltaic system becomes much bigger.
To use the photovoltaic installation effectively, automation systems are needed that allow the current parameters of the installation to be adapted to the existing conditions to obtain the maximum efficiency of processing and storing the available energy. If the photovoltaic installation covers a large area, the automation system must be dispersed and consist of many cooperating, measuring and executive devices. For greater efficiency, the whole system must be coordinated, which causes a need for mutual communication and information transfer. In some applications, it is important to be able to remotely monitor or control the installation over a longer distance. These types of systems are now classified as the Internet of Things. By applying some already available solutions, it is possible to utilize photovoltaic installations more effectively. Characteristic for IoT are software solutions that enable remote monitoring of large amounts of data, its storage, and visualization in a direct form or processed using a dedicated application or website. This type of information can be very useful for the plant operator or can be the basis for automated decision making by dedicated decision systems. They also enable a detailed analysis of the profitability of a given installation or group of installations over a given period.
3. Characteristics of Factors Influencing a PV Power Plant
The analysis carried out in this chapter uses NOCT standard (nominal operating cell temperature) measurement data from the weather station and hybrid power plant of the Faculty of Electrical Engineering of the Bialystok University of Technology (BUT). In this study, data from the period February 2015–July 2021 were used. In addition, data from meteorological databases were used to determine the climatic conditions in the analyzed power plant dating back to 2007.
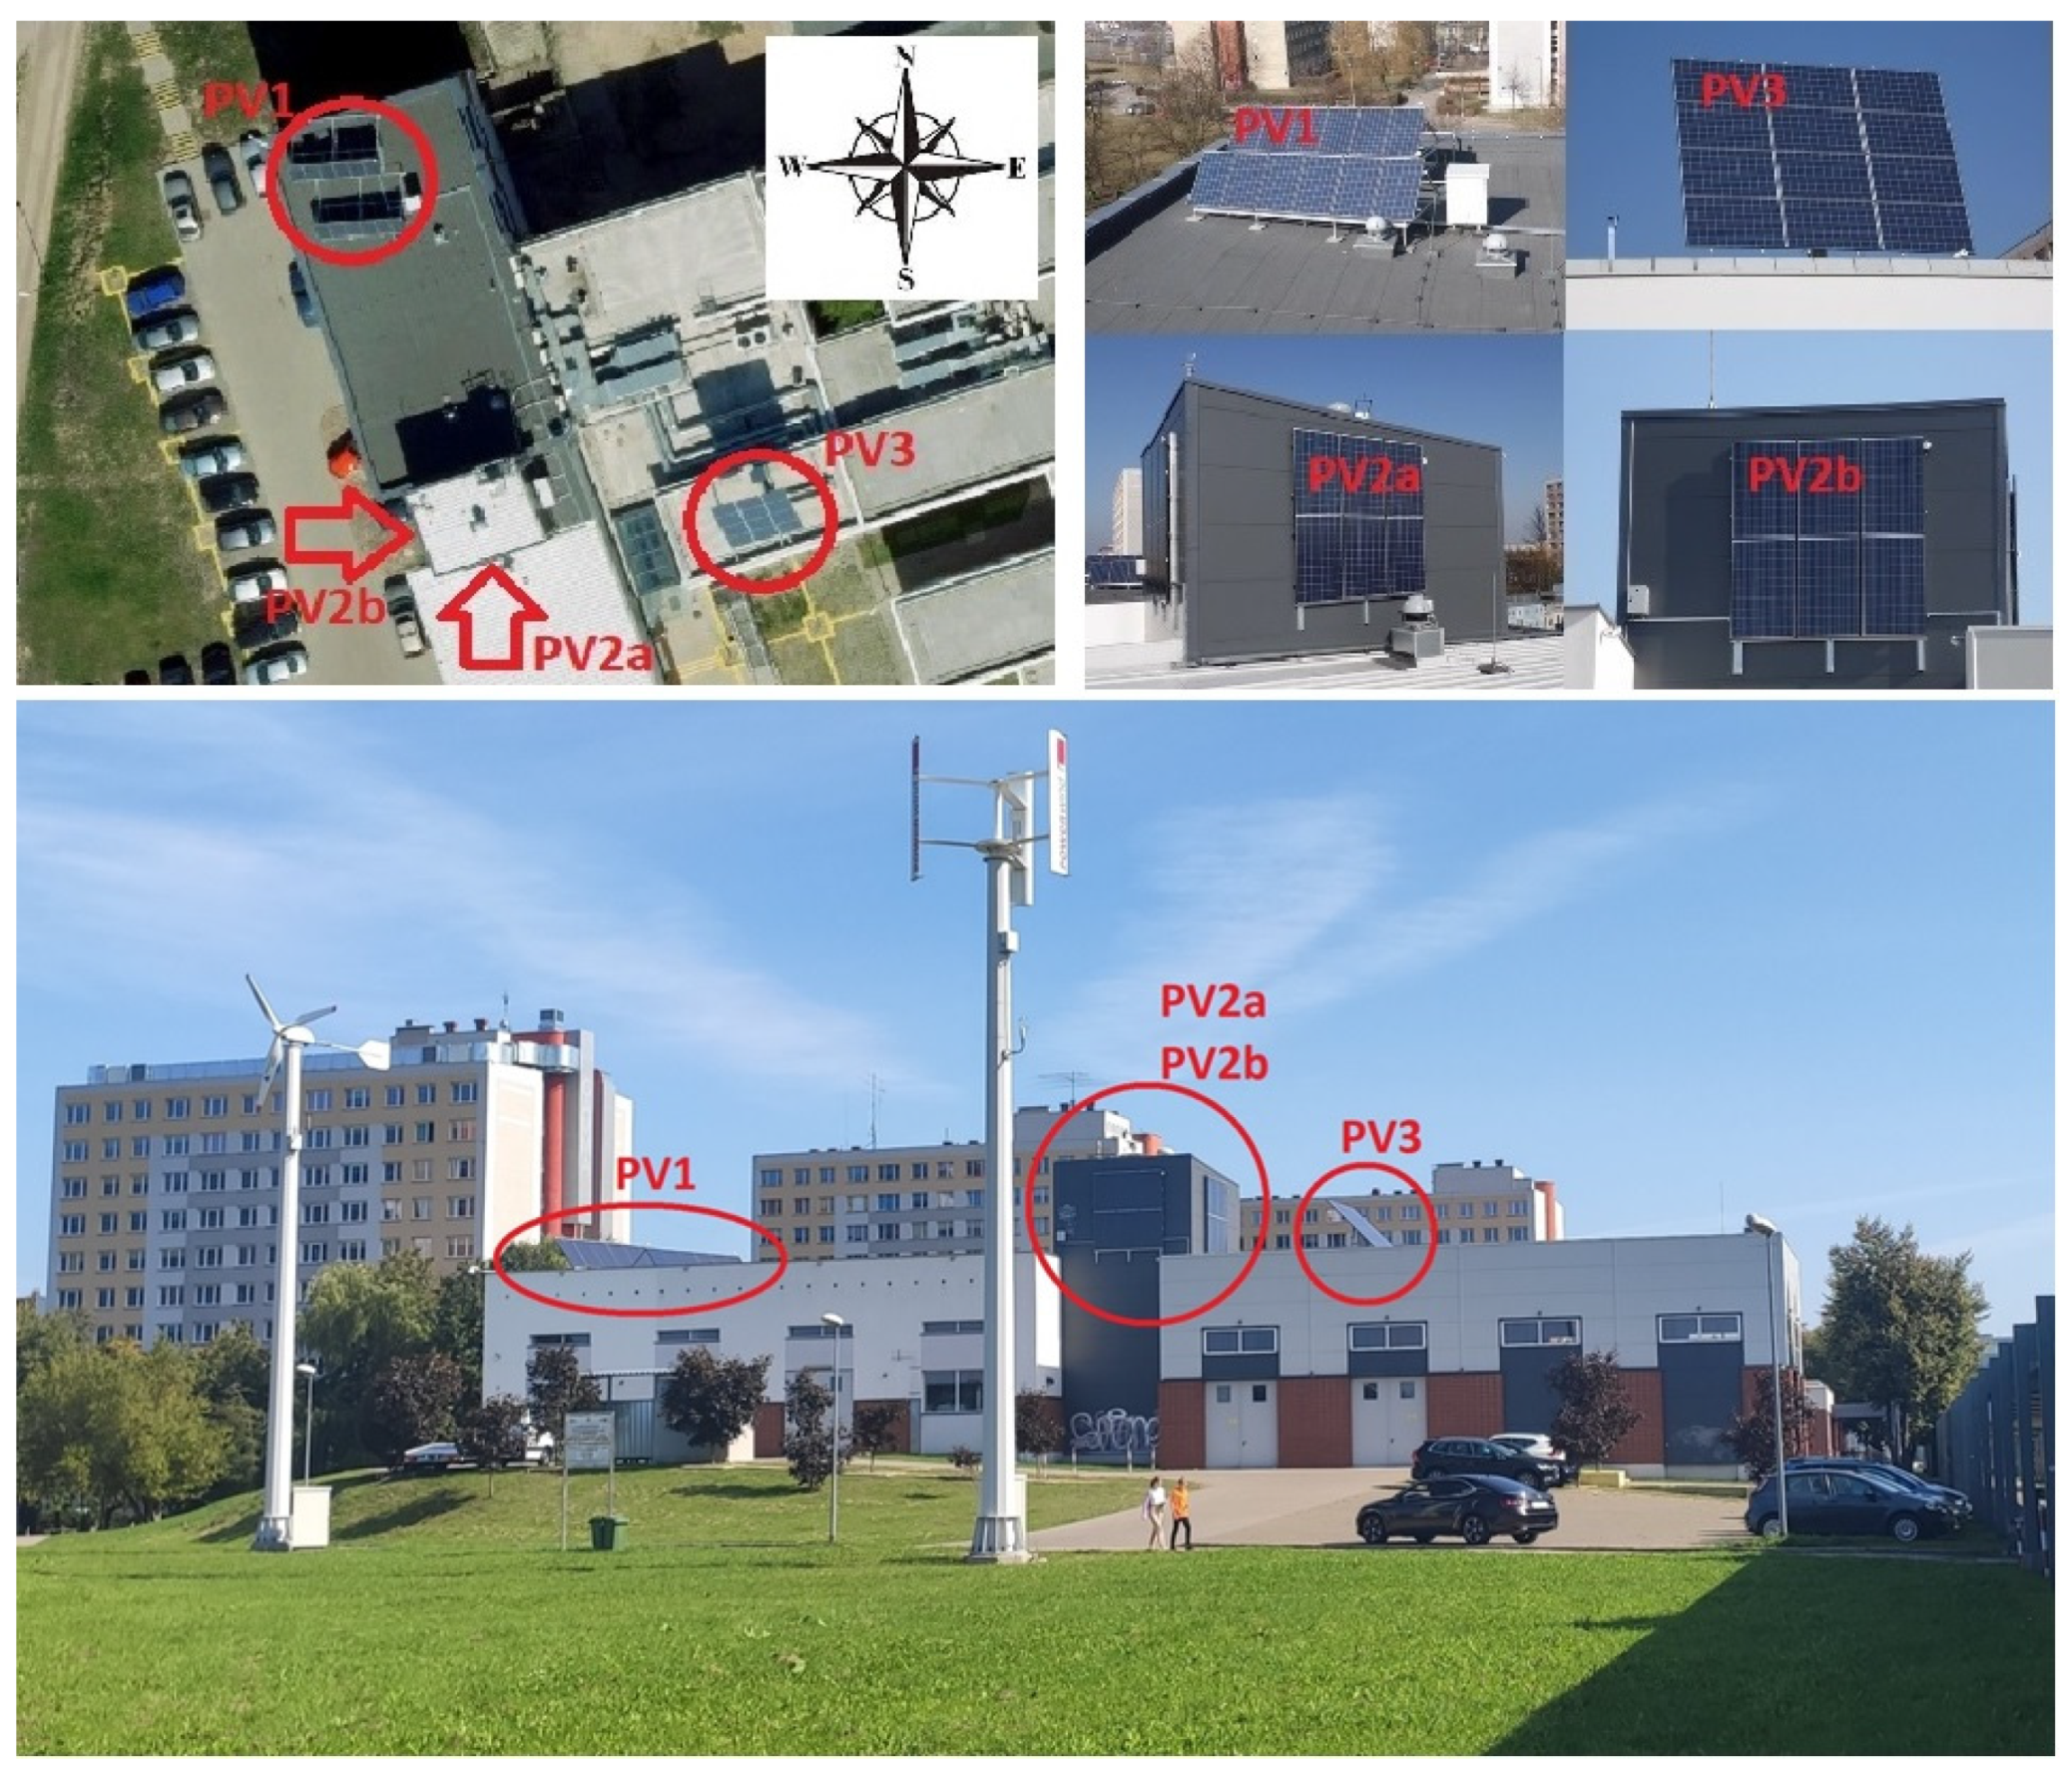
The facility is located on BUT campus in Bialystok. The photovoltaic power plant consists of four sets of photovoltaic panels in different configurations (
Figure 6,
Table 2). All of them use the same ESP 250 6P polycrystalline modules with parameters presented in
Table 3. The tracker of the PV3 set tracks the movement of the Sun in the sky in a biaxial fashion according to the astronomical clock. The geographic coordinates of the location of the power plant are 53°07′ N 23°08′ E.
Table 2.
Elements of the hybrid power plant system of the Faculty of Electrical Engineering of the BUT.
Table 2.
Elements of the hybrid power plant system of the Faculty of Electrical Engineering of the BUT.
| The Installation Setup | PV1 | PV2a |
| Location | On the roof of the building | On the southeastern facade |
| Arrangement | At 38° | At 90° |
| Azimuth | 180° | 160° |
| DC Power | 3.0 kWp | 1.5 kWp |
| Inverter | SMA typ SUNNY BOY 3000 HF,
Max. power 3.15 kWp DC [31] | Goodwe NS-1500,
Max. power 1.8 kWp DC [32] |
| The number of PV modules | 12 | 6 |
| PV modules type | ESP 250 6P | ESP 250 6P |
| | PV3 | PV2b |
| Location | On the roof of the building | On the southwest facade |
| Arrangement | 0–80° | at 90° |
| Azimuth | 45–315° | 250° |
| DC Power | 3.0 kWp | 1.5 kWp |
| Inverter | SMA typ SUNNY BOY 3000 HF,
Max. power 3.15 kWp DC | Goodwe NS-1500,
Max. power 1.8 kWp DC |
| The number of PV modules | 12 | 6 |
| PV modules type | ESP 250 6P | ESP 250 6P |
Table 3.
Data sheet parameters of the used PV module [
33].
Table 3.
Data sheet parameters of the used PV module [
33].
| Symbol | ESP 250 6P |
|---|
| Producer | Europe Solar Production |
| Type | Polycrystalline |
| Module Efficiency | 15.3% |
| Peak Power STC | 250 Wp |
| Peak Power NOCT | 182 Wp |
| Temperature Coefficients of Pmax | −0.46 ± 0.02%/K |
| Temperature Coefficients of VOC | −0.34 ± 0.01%/K |
| Temperature Coefficients of ISC | +0.07 ± 0.02%/K |
| Module Dimension | 1640 × 990 × 40 mm |
| 12 years guarantee module performance | Min 90% |
| 25 years guarantee module performance | Min 80% |
Determining the potential of available solar radiation energy is related to the local topography, the influence of the surrounding buildings and trees, and the direction and angle of installation of the PV panels. These factors have to be determined for each installation independently. Other factors related to the environment are subject to constant changes related to the course of the seasons of the day and weather conditions. They have a significant impact on the efficiency and durability of PV cells. Operation of the PV power plant is only possible during the day (from sunrise to sunset). This causes changes in the daily operating time of the PV power plant between 17 h during the longest day of the year and 7 h and 37 min in the winter. The working time, therefore, varies between 70% and 30% of the duration of the day. At the same time, the position of the Sun in the sky changes every day of the year. Depending on the season, the maximum altitude ranges from 60.3° in the summer to 13.5° in the winter. The azimuth position also changes from 47° to 312° in June and from 130° to 250° in December. Changes in the position of the Sun in the sky result in changes in the value of the radiation power reaching the surface of the panels. They both result from the change of the angle of incidence as well as the length of the path that the radiation travels through the atmosphere. In the atmosphere, the radiation is partially absorbed and dispersed. This depends on the degree of cloud cover and the type and thickness of clouds (
Figure 7). These relationships are described in detail by Roger G. Barry and Richard Chorley in “Atmosphere, weather and climate” [
6] and by John L. Moneith and Mike H. Unsworth in “Principle of Environmental Physics” [
7].
A thick layer of stratus clouds can reflect 70% of the incident radiation off its upper surface. Additionally, another 20% may be absorbed inside them. That limits the radiation reaching the earth’s surface by 90% [
7].
Changing the degree of absorption and dispersion in the atmosphere also changes the spectrum of solar radiation reaching the earth’s surface. These are undoubtedly factors influencing the change in the efficiency of the photovoltaic conversion and the amount of electricity produced by the PV power plant. As the spectrum of solar radiation changes, the value of the average photon energy (APE) changes. Thus, the APE value characterizes the shape of the spectrum of the incident radiation. This indicator is calculated from the Equation (1) [
34,
35,
36,
37]:
where:
E(λ) (Wm−2nm−1) is the spectral irradiance;
Φ(λ) (m−2nm−1s−1) is the spectral photon flux density;
a (nm) and b (nm) are the lower and upper limits of the spectrum.
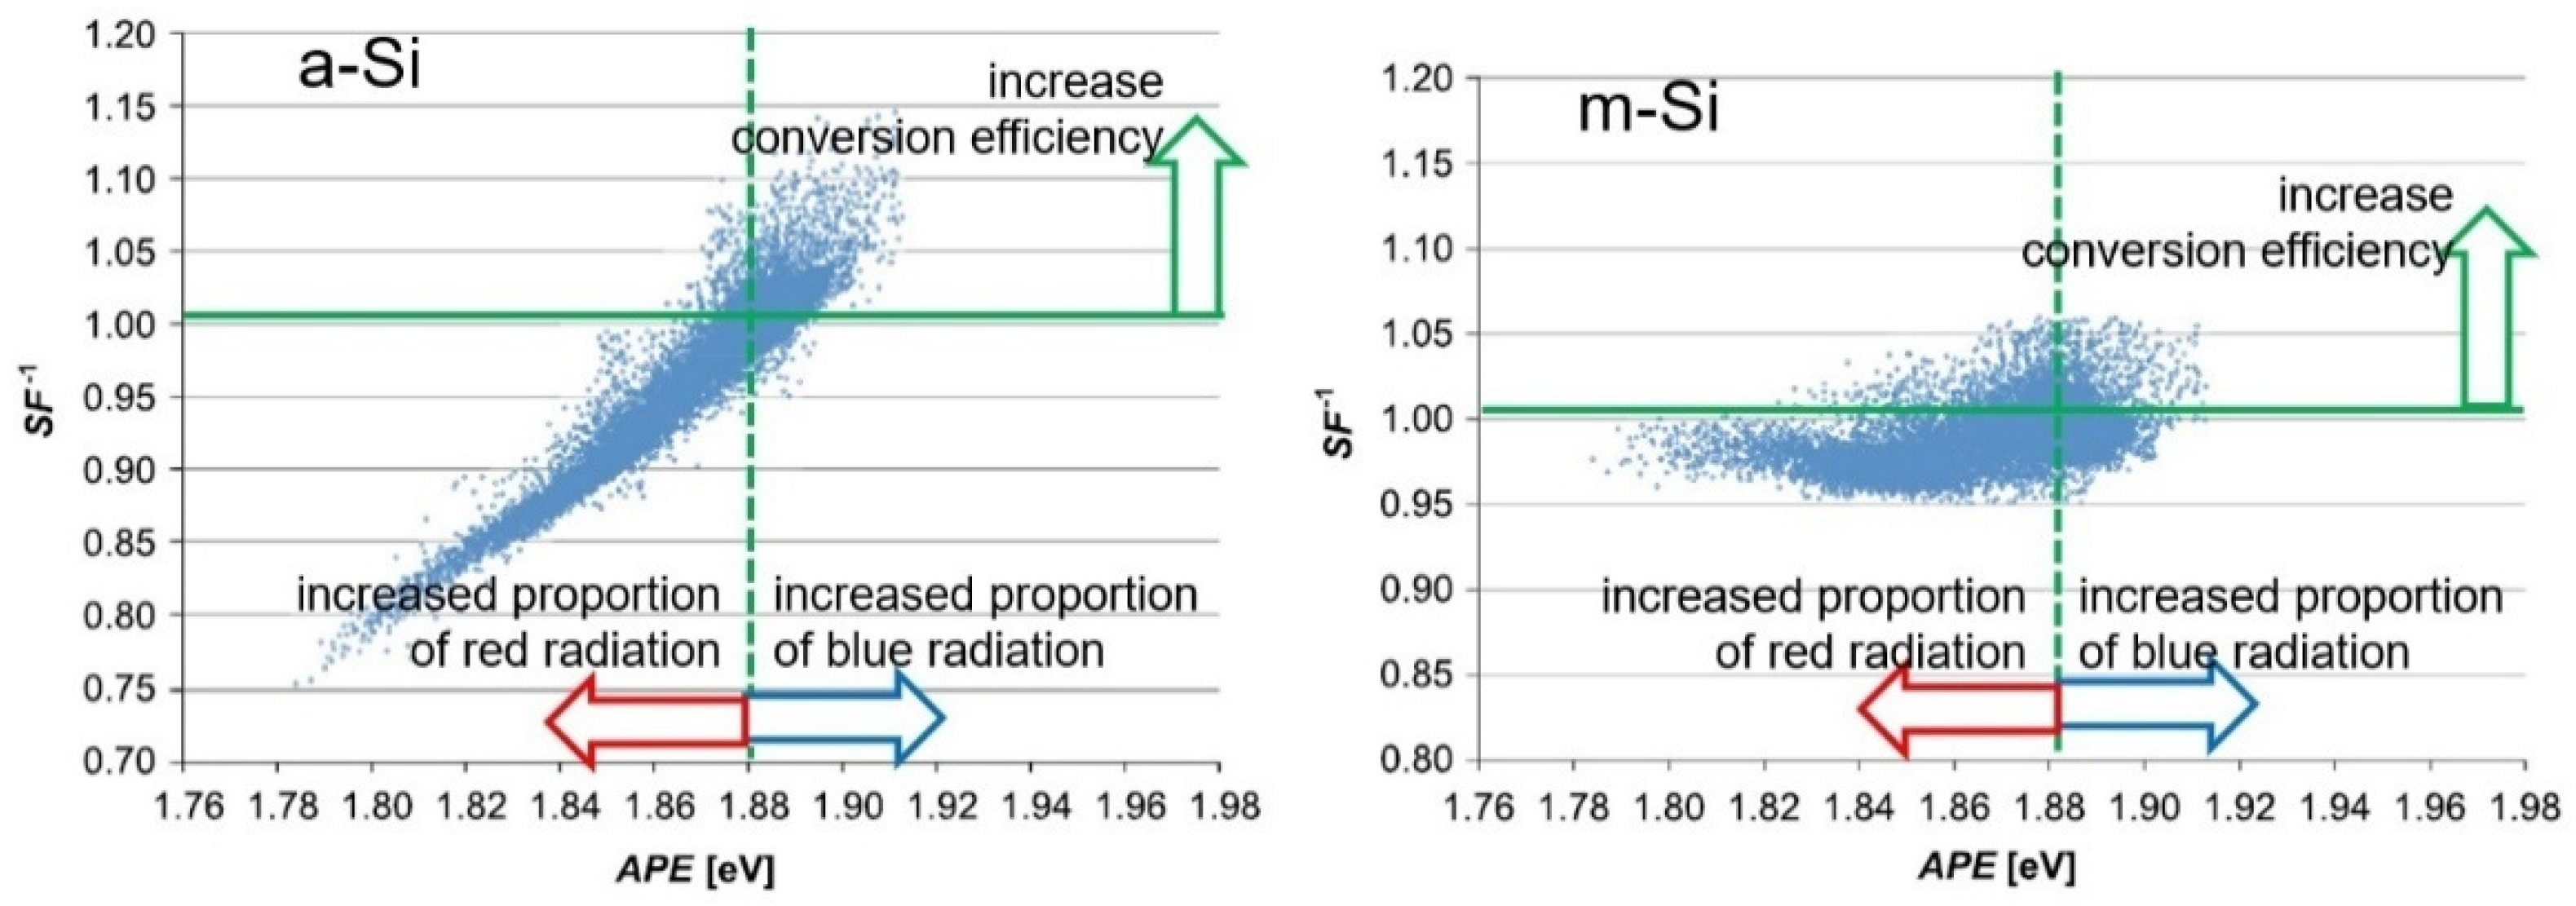
The APE value of the reference spectrum according to IEC 60904-3 (350–1050 nm) is 1.88 eV. Higher APE values indicate an increased amount of blue radiation in the spectrum, while values lower than 1.88 indicate an increased amount of red radiation. The spectral factor (SF) is a parameter that allows comparing the efficiency of PV cells [
34,
35,
36,
37]:
where:
An SF-1 value above 1 indicates an increase in the photon conversion efficiency, while a value below 1 indicates a decrease in efficiency (
Figure 8).
Figure 8.
Changes in the SF-1 value in the average photon energy (APE) function (developed based on [
34,
35,
36,
37]).
Figure 8.
Changes in the SF-1 value in the average photon energy (APE) function (developed based on [
34,
35,
36,
37]).
To estimate the amount of light coming from the atmosphere, CIE (International Commission on Illumination) developed 15 models of the sky. The models listed in
Table 4 and
Figure 9 show how large the variability of the cloud cover can be. This determines the amount and nature of radiation that can reach PV panels. They can be used in modelling the operation of a photovoltaic power plant (
Figure 9,
Table 4).
Table 4.
Type of skies models according to CIE [
38,
39,
40].
Table 4.
Type of skies models according to CIE [
38,
39,
40].
| Type | Description of Luminance Distribution |
|---|
| 1 | CIE Standard Overcast Sky, steep luminance gradation towards zenith, azimuthal uniformity |
| 2 | Overcast, with steep luminance gradation and slight brightening towards the sun |
| 3 | Overcast, moderately graded with azimuthal uniformity |
| 4 | Overcast, moderately graded and slight brightening towards the sun |
| 5 | Sky of uniform luminance |
| 6 | Partly cloudy sky, no gradation towards the zenith, slight brightening towards the sun |
| 7 | Partly cloudy sky, no gradation towards the zenith, brighter circumsolar region |
| 8 | Partly cloudy sky, no gradation towards the zenith, distinct solar corona |
| 9 | Partly cloudy, with the obscured sun |
| 10 | Partly cloudy, with a brighter circumsolar region |
| 11 | White-blue sky with a distinct solar corona |
| 12 | CIE Standard Clear Sky, low atmospheric turbidity |
| 13 | CIE Standard Clear Sky, polluted atmosphere |
| 14 | Cloudless turbid sky with a broad solar corona |
| 15 | White-blue turbid sky with a broad solar corona |
Figure 9.
Skies models according to CIE [
38,
39,
40,
41,
42].
Figure 9.
Skies models according to CIE [
38,
39,
40,
41,
42].
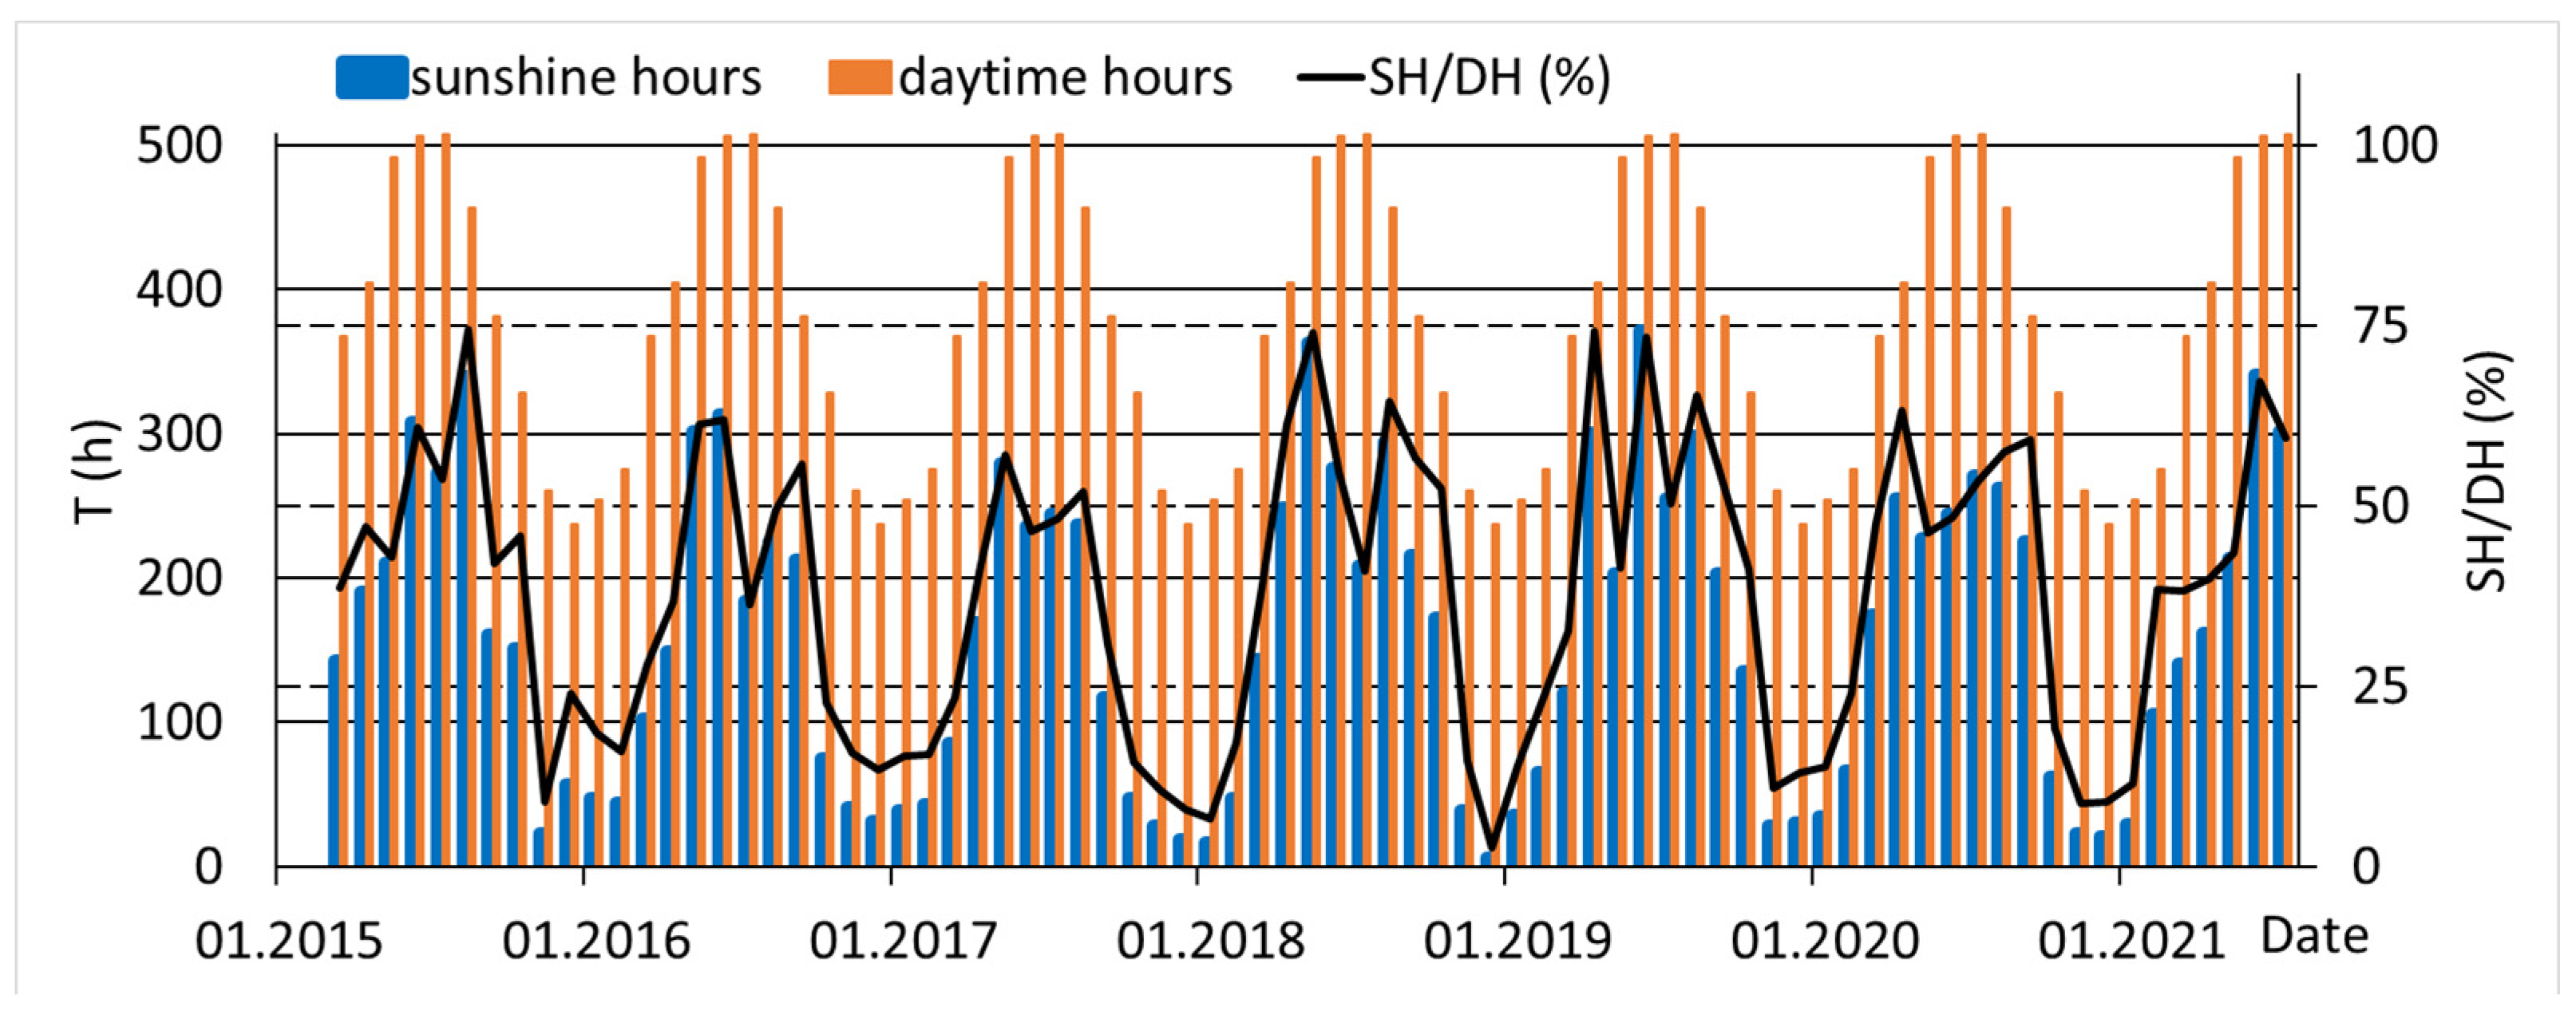
The type of sky that occurs affects the amount of sunshine. In Bialystok, based on observations carried out in the period from May to September, the number of sunny hours usually ranges from 50 to 70%, while in the period from November to March only from 20 to 40% (
Figure 10 and
Figure 11). It follows that 80% of energy is obtained in summer.
Figure 10.
Sunshine hours in Bialystok (developed based on [
43]).
Figure 10.
Sunshine hours in Bialystok (developed based on [
43]).
Figure 11.
Sunshine hours, daytime hours and percentage of sunshine hours (SH/DH) in Bialystok (developed based on [
43]).
Figure 11.
Sunshine hours, daytime hours and percentage of sunshine hours (SH/DH) in Bialystok (developed based on [
43]).
The factors listed in the article make it very difficult to predict the amount of radiation that will reach the panels and will be converted into electricity. Therefore, to optimize the operating point of a photovoltaic power plant, it is necessary to track the changes in these quantities. Automatic maintenance systems can help control and manage a power plant, storage, and energy flow to the power grid. That concept is compatible with the Energy 4.0 concept. This terminology refers to the era of digitalization of the energy sector which represents the deployment of IoT infrastructure in the energy sector [
40]. The key principles of IIoT (Industrial IoT) are interconnection, information, transparency, technical assistance, and decentralized decisions. The incorporation of IIoT (including “big data” acquisition for sensor data harnessing, data mining, M2Mcommunication, IoT-based automation) enhances the manufacturing process and improves real performance [
44].
4. IoT Solutions for PV System Maintenance
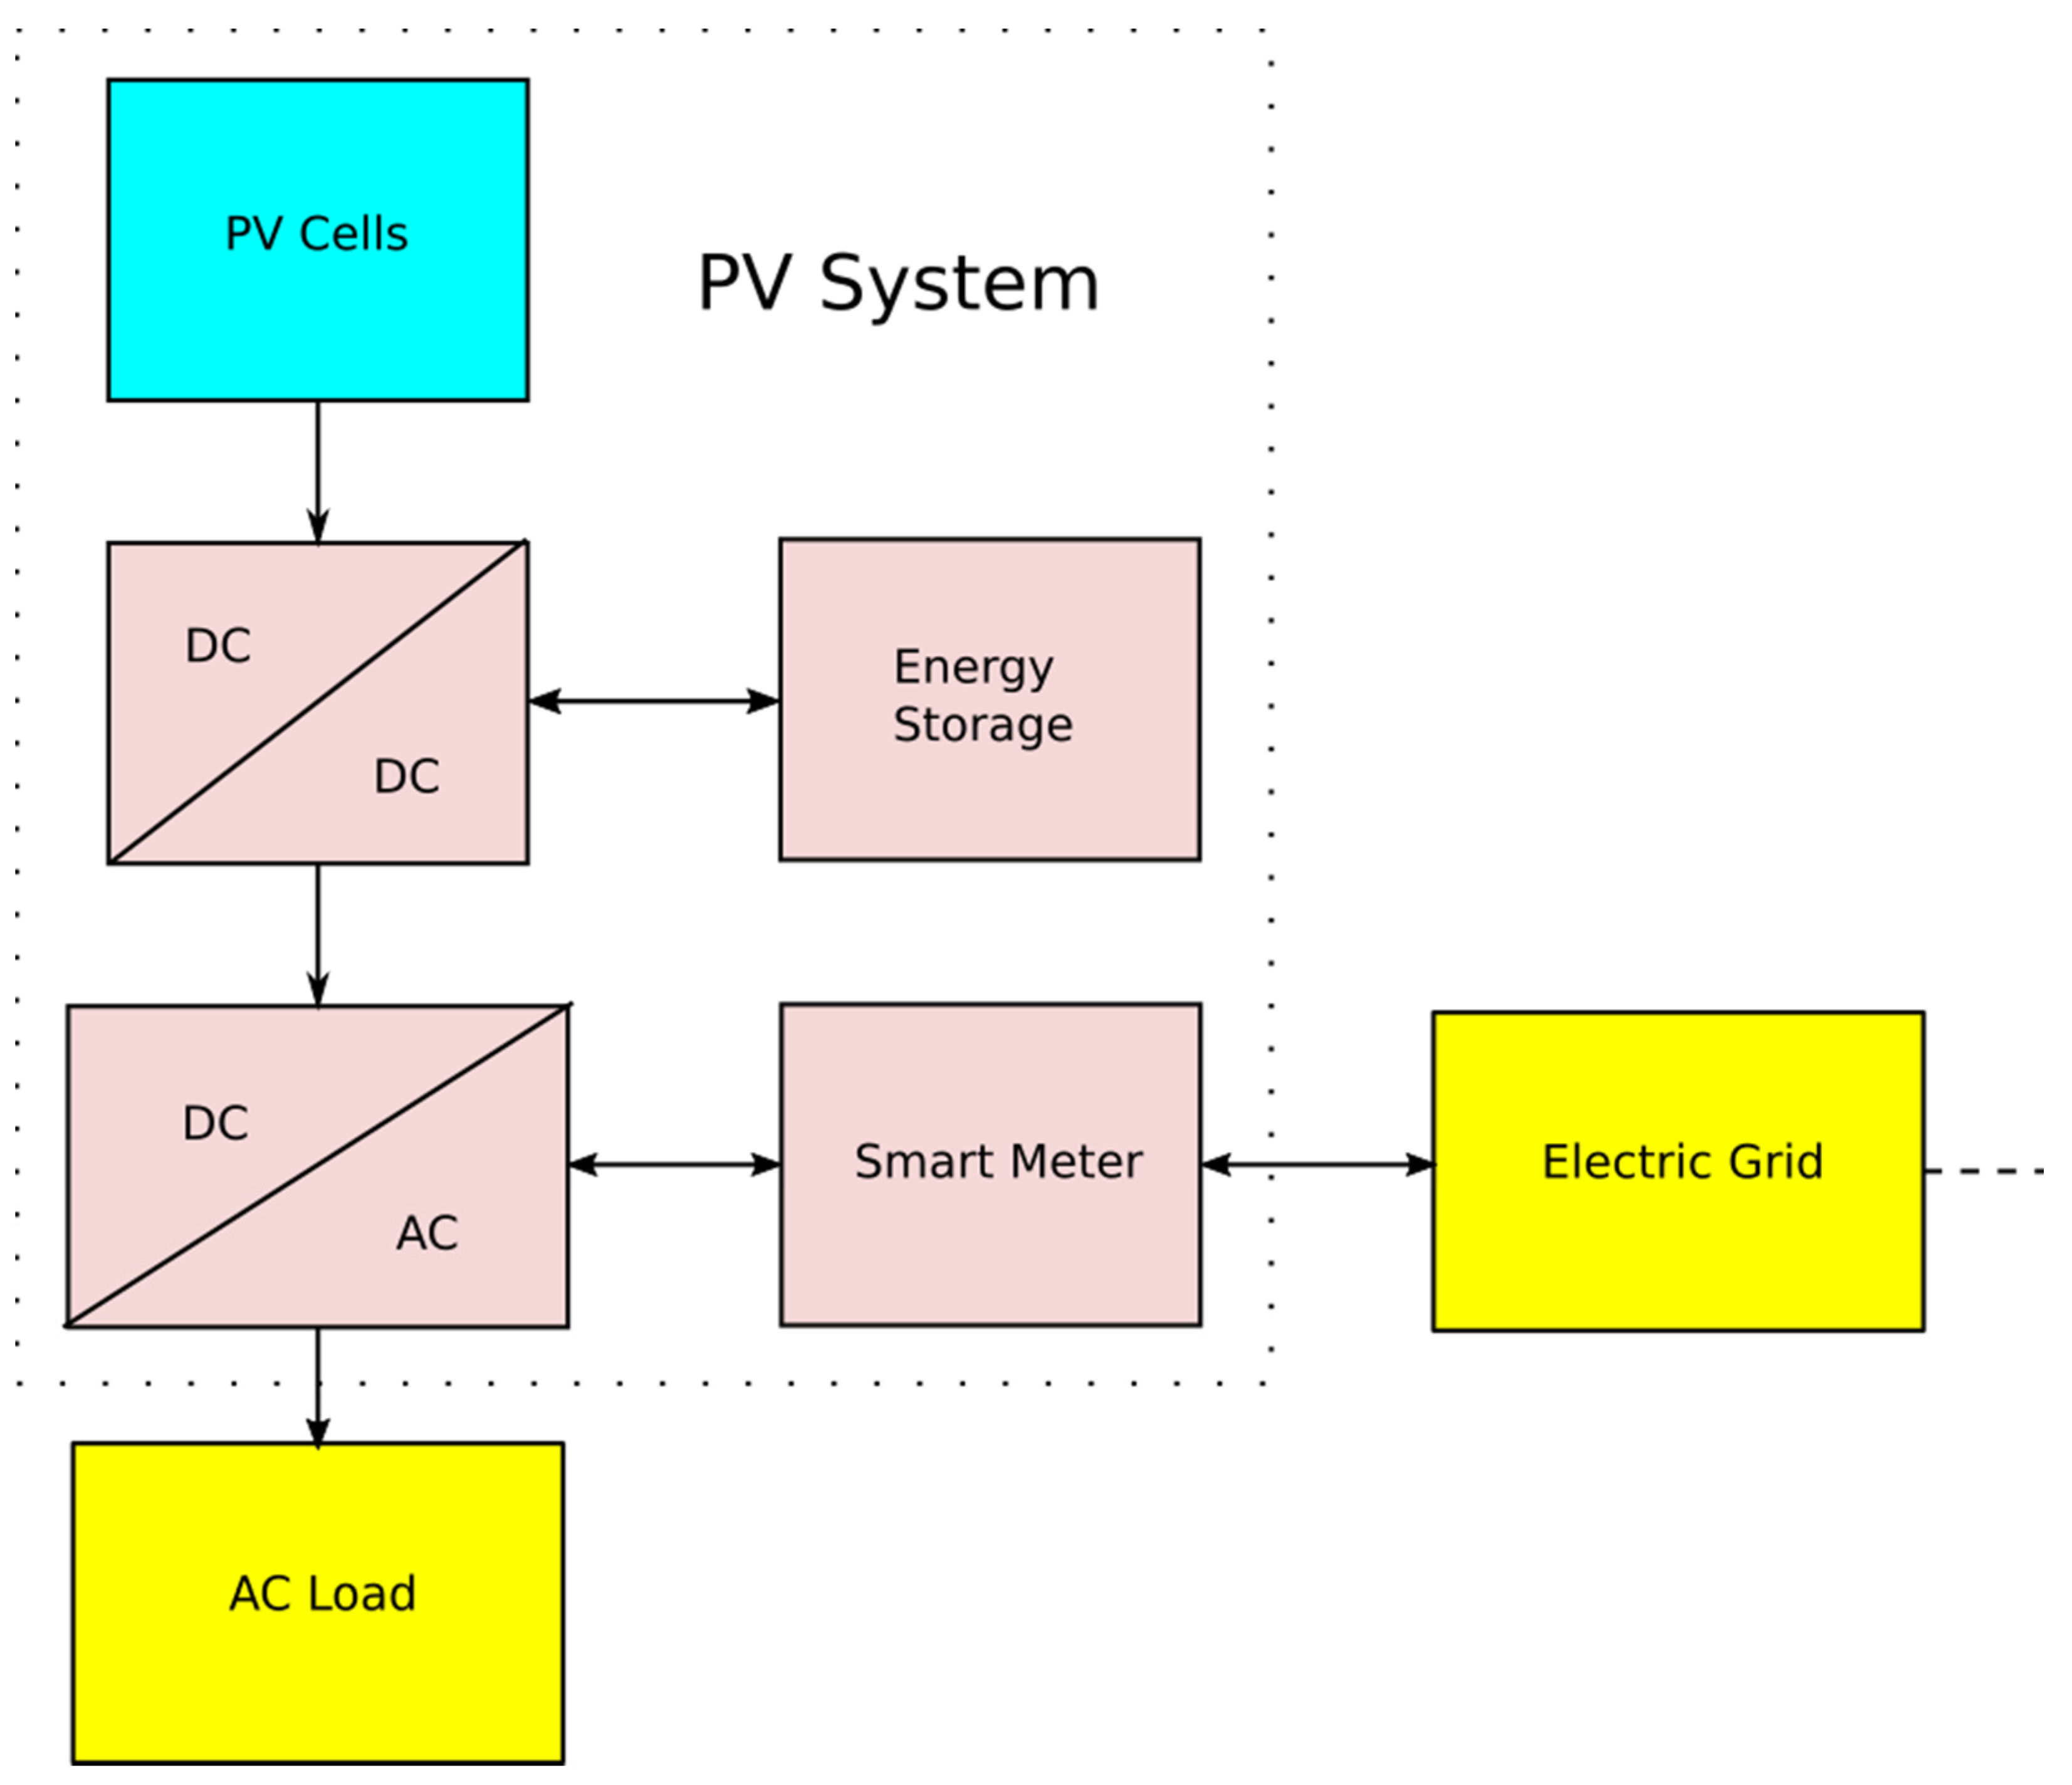
A photovoltaic plant consists of a few standard elements. It is depicted in
Figure 12. There are photovoltaic cells or panels (photovoltaic arrays), semiconductor switches, DC/DC converters, DC/AC inverters, and storage (e.g., battery stack). More complicated solutions may deliver better performance thanks to the usage of additional technologies delivering more efficient harvesting of solar energy. One example is a maximum power point tracking (MPPT), but also a GPS solar tracker coupled with a mechanical positioner, solar irradiance sensors, wind sensor and a cooling system. Modern solar systems consist of many different subsystems, electronic, mechanical, and even hydraulic. These systems consist of many important elements and interconnections. For instance, they are typically connected with a set of different sensors. Best results may be achieved if the plant cooperates with efficient loads such as LED lamps and high-efficiency power converters [
45,
46,
47,
48]. Special requirements may be necessary when the plant supplies industrial equipment. They are classified as sensitive loads which demand a more reliable power supply than residential, commercial, or agricultural consumptions. In addition, better quality of power in terms of voltage regulation, frequency stabilization, and harmonics may be required [
44]. Photovoltaic systems are frequently mounted on buildings’ rooftops, so it is not always easily reachable. The periodical monitoring and maintenance of the system may be difficult. To achieve high performance and to act quickly in case of any failures, the photovoltaic systems should be constantly monitored and tuned all the time depending on the operating conditions and should automatically generate alarm signals for service personnel.
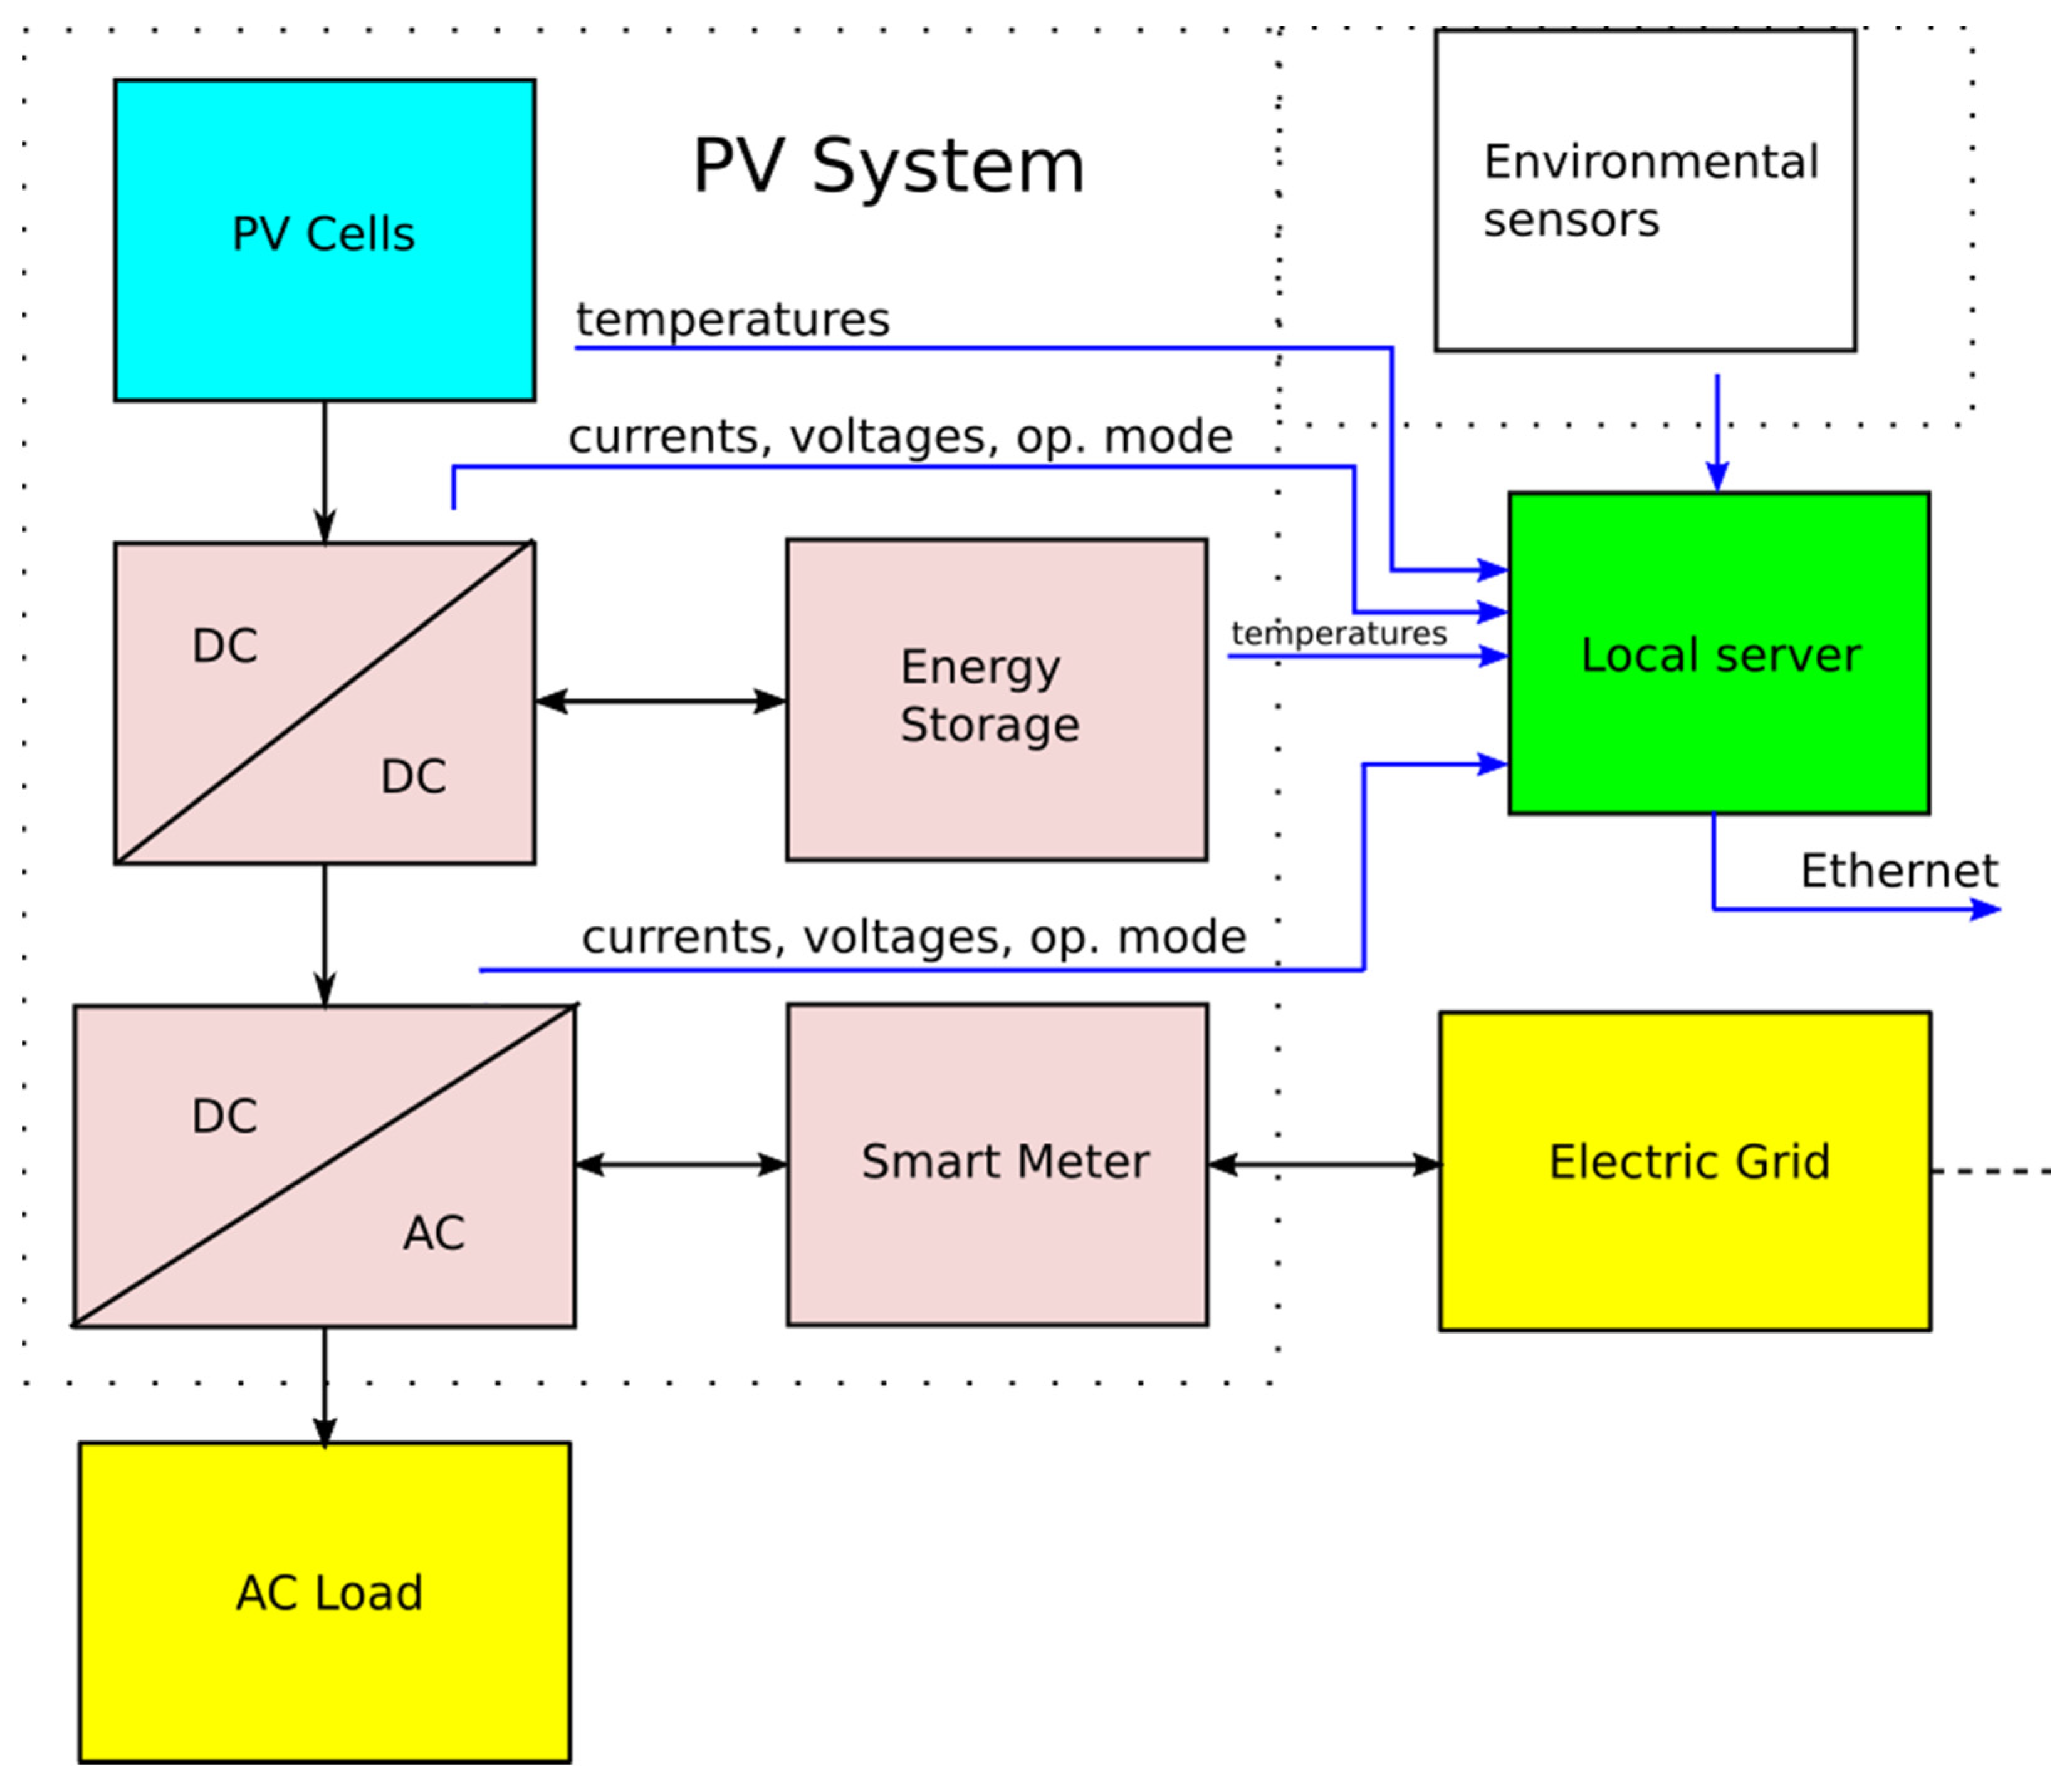
Another complication is related to the type of operation. Many current PV installations are connected to the grid and may not be equipped with local energy storage. That depends on legal restrictions and needs an additional piece of equipment—a smart energy meter. The smart meter should count the outgoing (to the grid) and incoming energy, which is later a basis for a financial settlement. Such meters may be also connected to the Internet for convenient operation. When a PV installation is not connected to the grid, it needs local energy storage, consisting typically of a battery stack. The battery stack should be monitored to avoid over-voltage, under-voltage, over-temperature and over-current. The temperature and voltages should be monitored on each battery cell individually and it is necessary to increase the number of implemented measuring channels and sensors. All these features make the system increasingly complicated for monitoring by a person. It needs an additional automatic and remote monitoring system. In the case when the PV should be controlled remotely, an additional communication system is necessary. Such a system collects data from the connected sensors and stores the data on the local server which is connected to the Internet. The local server does not have to have a static IP address, because the system may communicate with a remote server connected to the Internet with a static IP. Any authorized user may communicate with the remote server to get access to all the data collected on the plant. Communication is possible in both directions, so remote control is also possible. The local server may act as a computing machine and may calculate important parameters and trends locally, but the calculations may be redirected to the remote server or the commercial cloud (a rented server). The local server, a set of different sensors connected to elements of the PV system and environmental sensors, compose a maintenance system. A simplified block diagram of a photovoltaic system featuring a local server is depicted in
Figure 13.
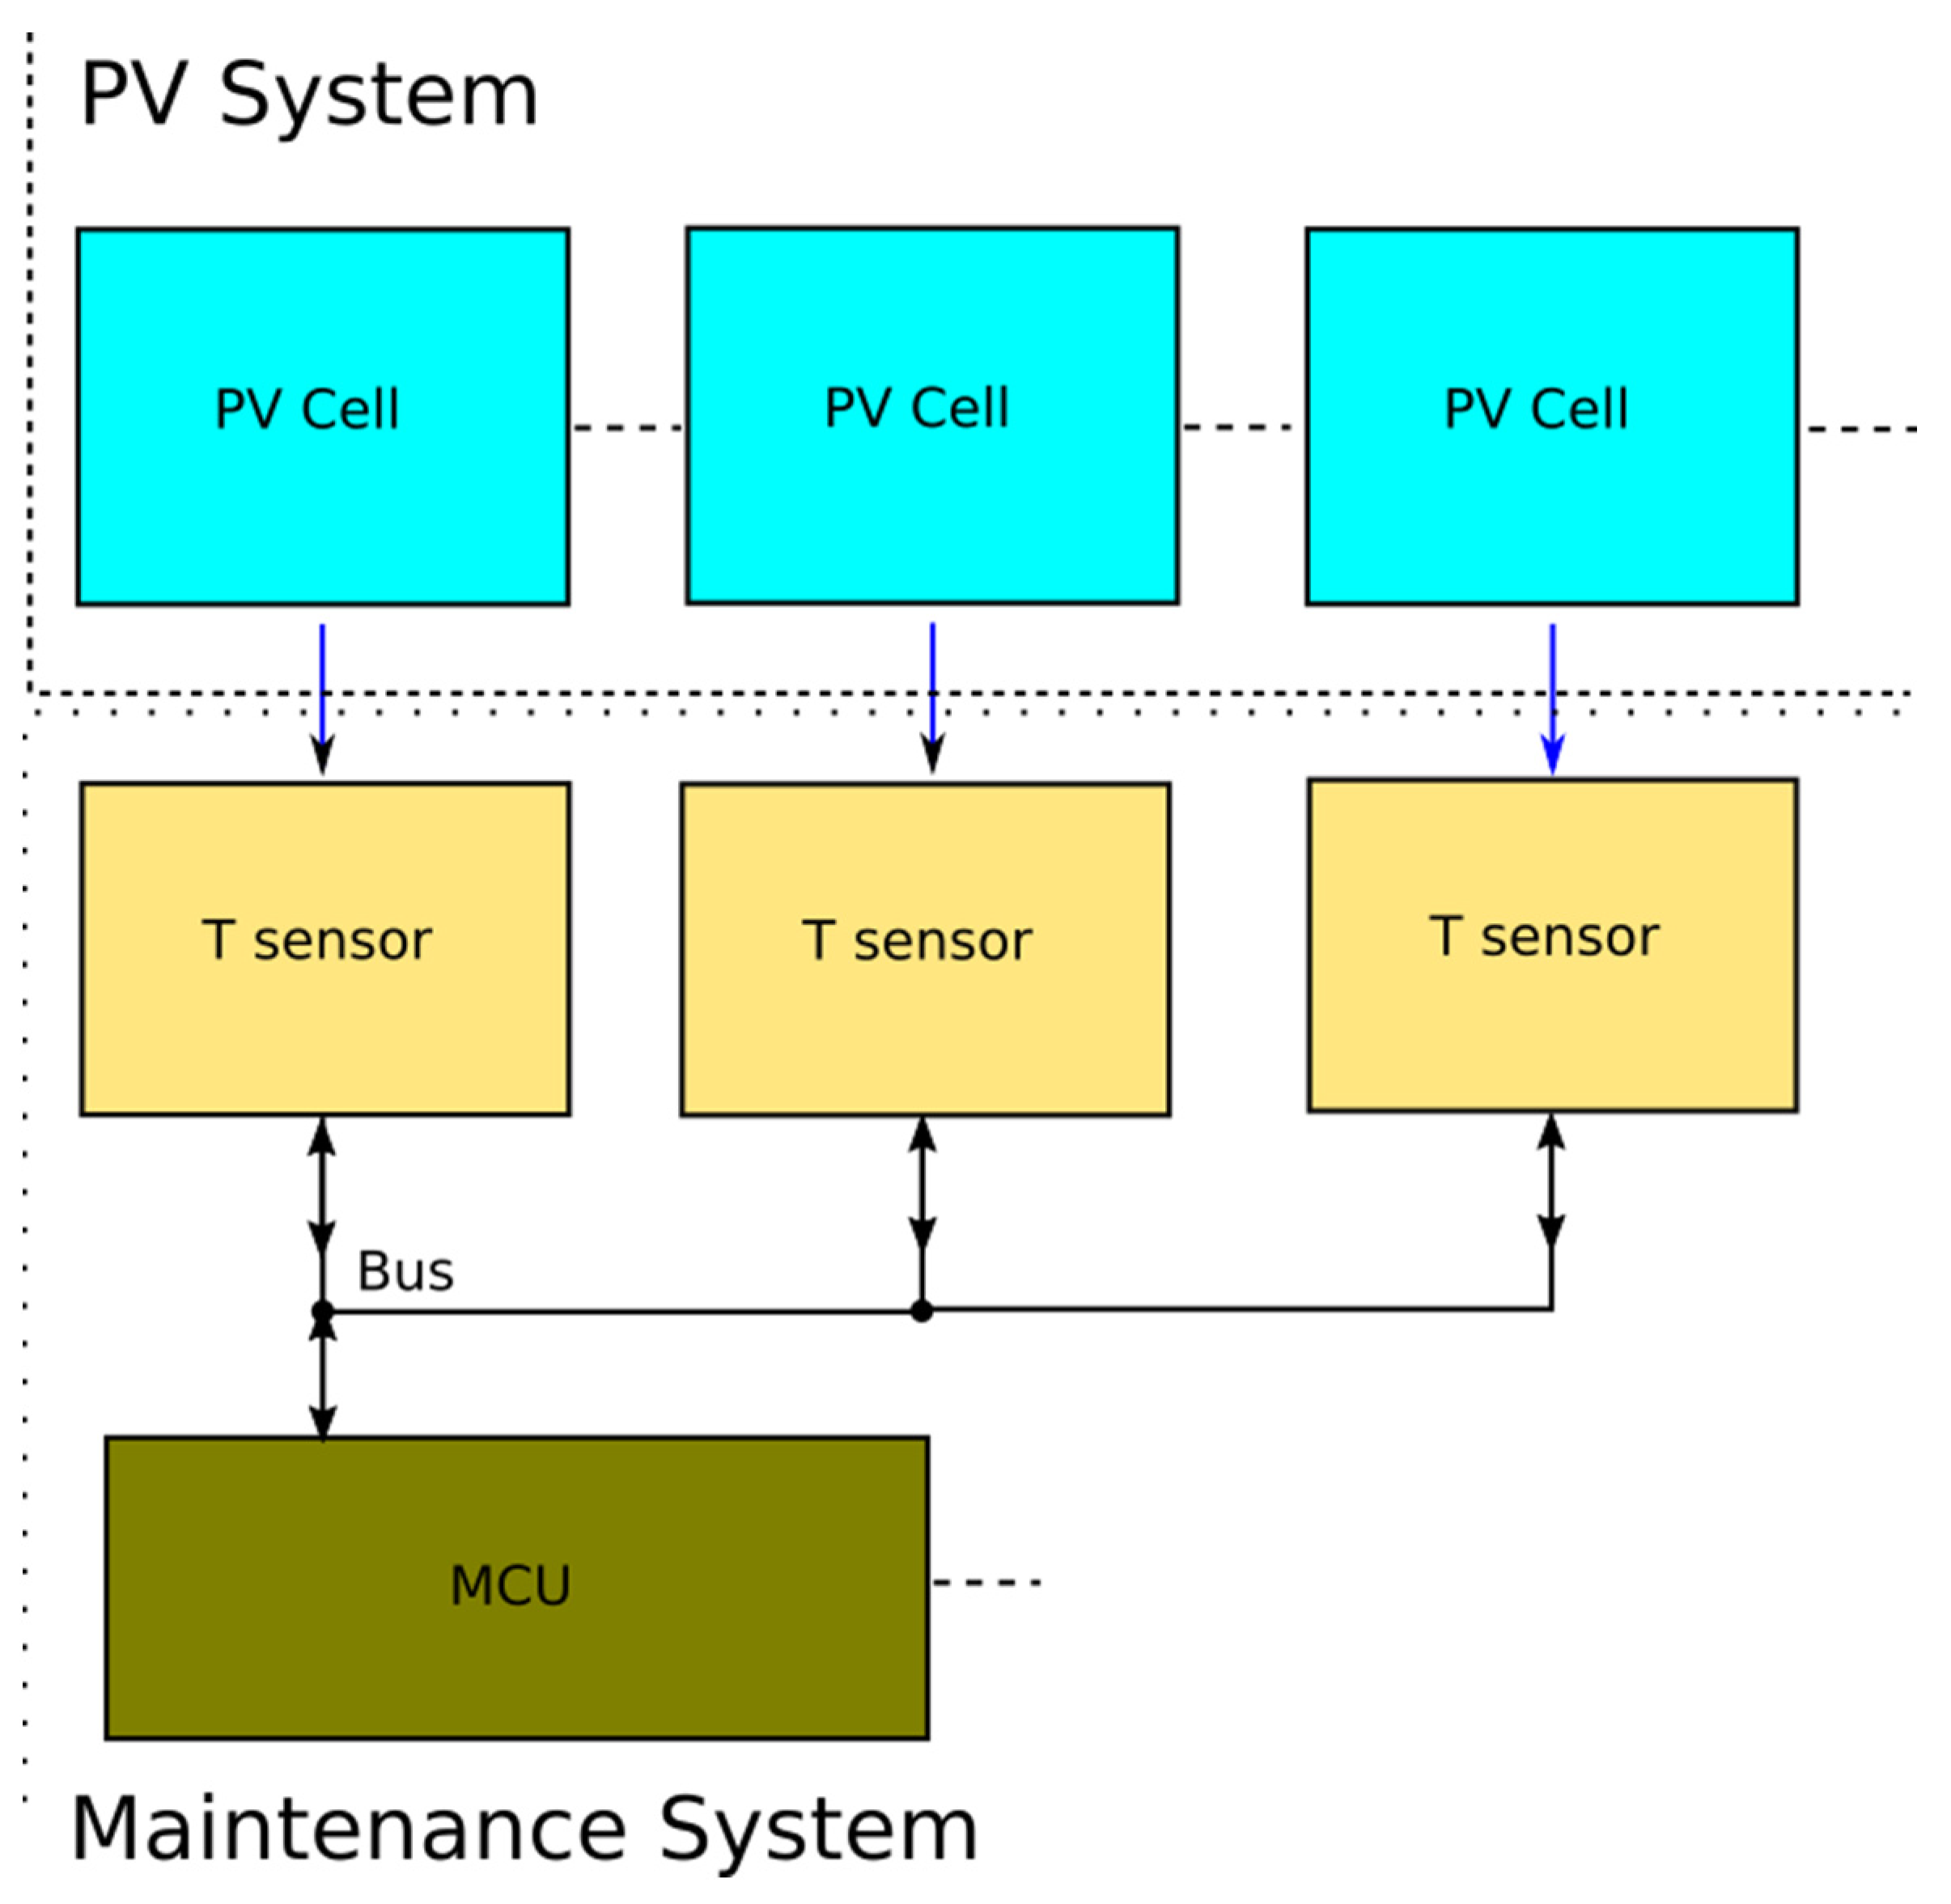
Important information about PV panels may be delivered by a temperature sensor. Each PV panel should be equipped with such a sensor, therefore the number of necessary sensors depends on the number of PV panels in the PV system. This is shown in
Figure 14. Because of the high number of implemented temperature sensors, it is good to reduce the number of cable connections. This can be done by connecting the sensors to the same serial data bus or using sensors with a digital interface. The information from the temperature sensors may go directly to the MCU (
Figure 14)—a microcontroller unit that reads several sensors existing in a single cluster. A typical digital temperature sensor cannot work at temperatures higher than about 125 °C, which is acceptable for measuring PV panels temperature. An exemplary solution is to use DS18B20 which has good accuracy and resolution and communicates by 1-Wire serial bus. Additionally, the sensor may be supplied through the data line (parasitic supply), so the number of connections is reduced to just two wires (ground and data) as shown in
Figure 15. Transistor Q1 (
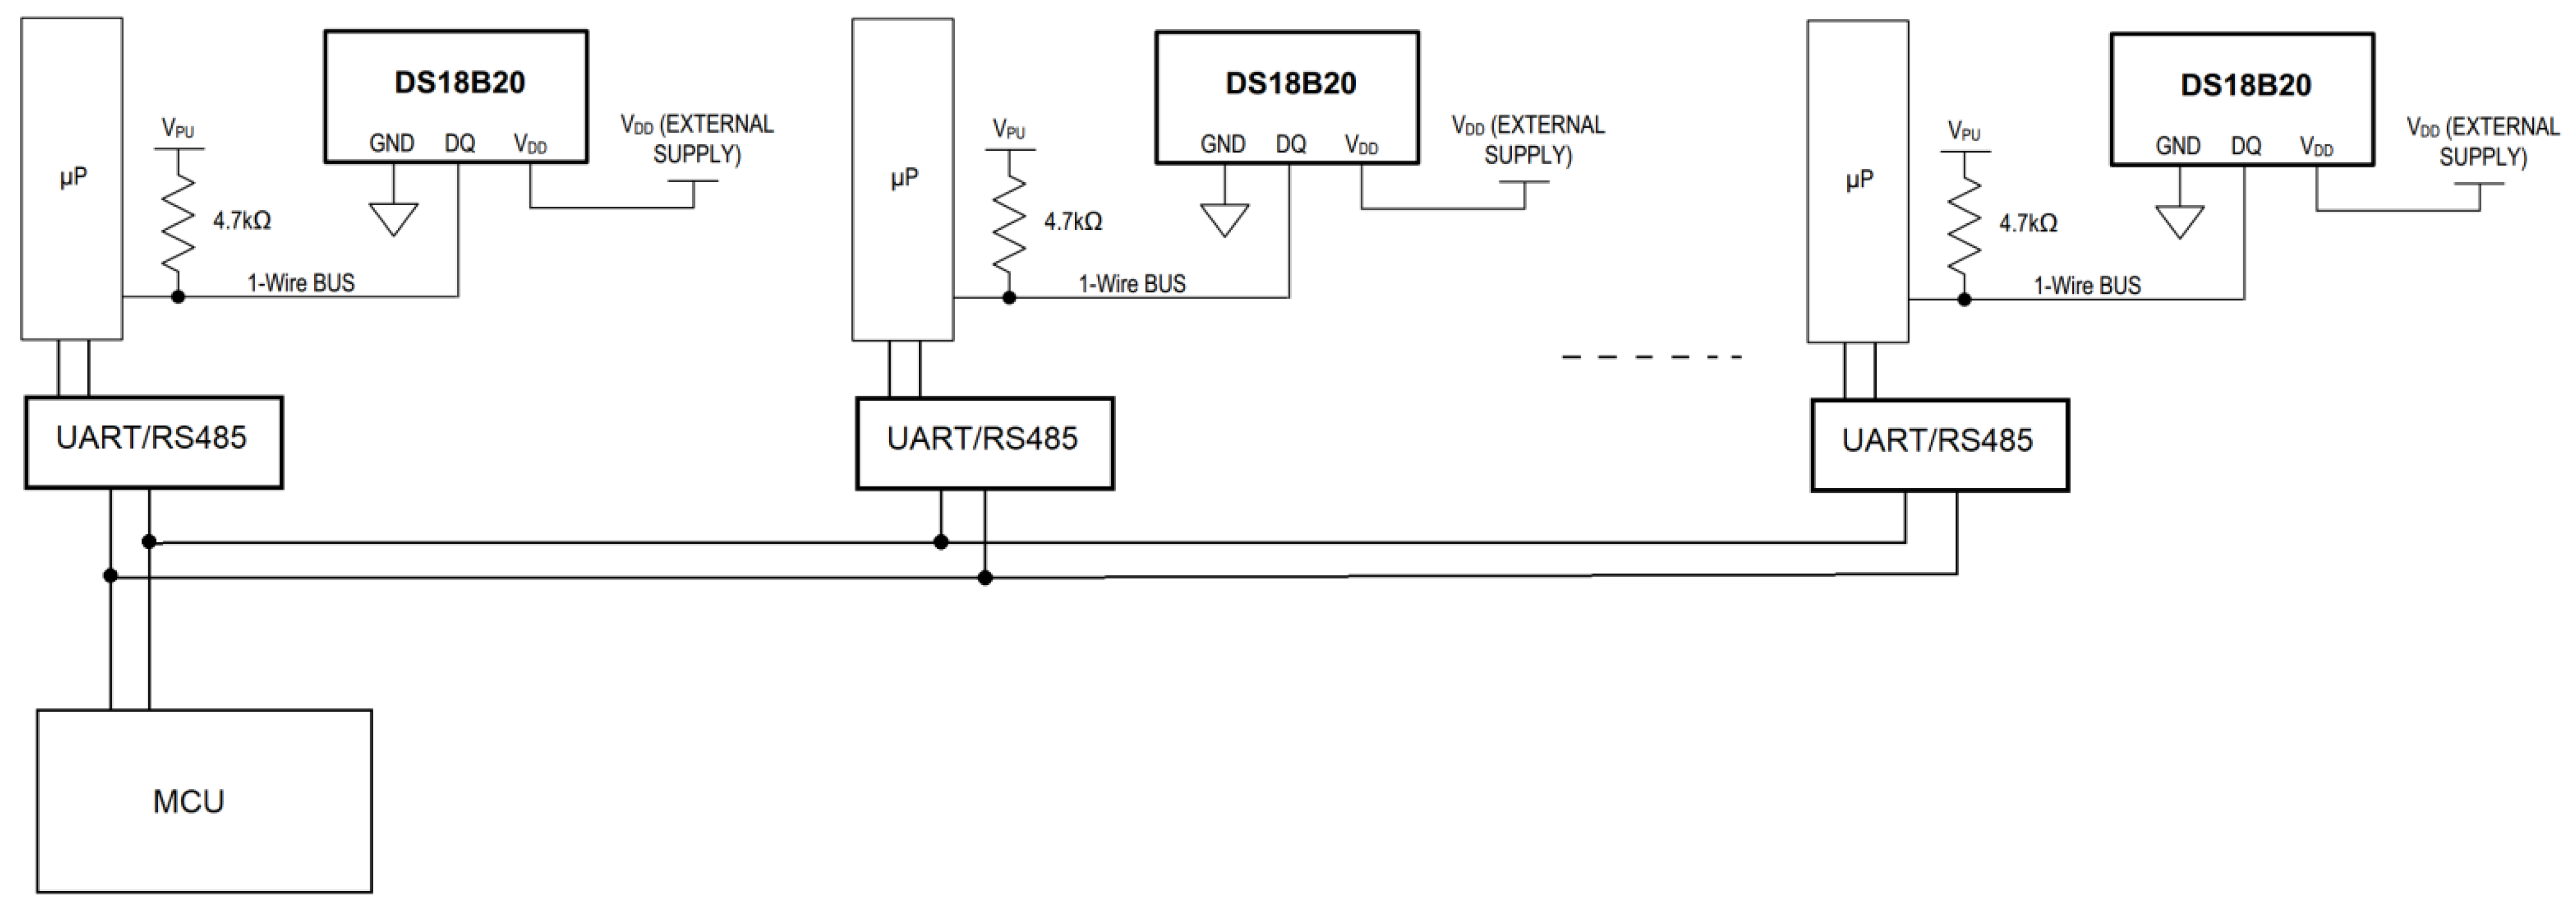
Figure 15) is necessary in the case when the number of connected sensors is large, but the acceptable number also depends on the length of connections. Generally, 1-Wire interface is not suitable for long distances. In that case, an additional differential bus such as RS-485 should be used (
Figure 16). It needs additional microcontrollers and RS485 transceivers.
Figure 16 shows that the temperature measurement system alone may be quite complicated, but it is perfectly useful for optimization of the PV panels’ work. In case of rising temperatures, a particular section of panels may be less loaded, or an additional cooling system may be activated.
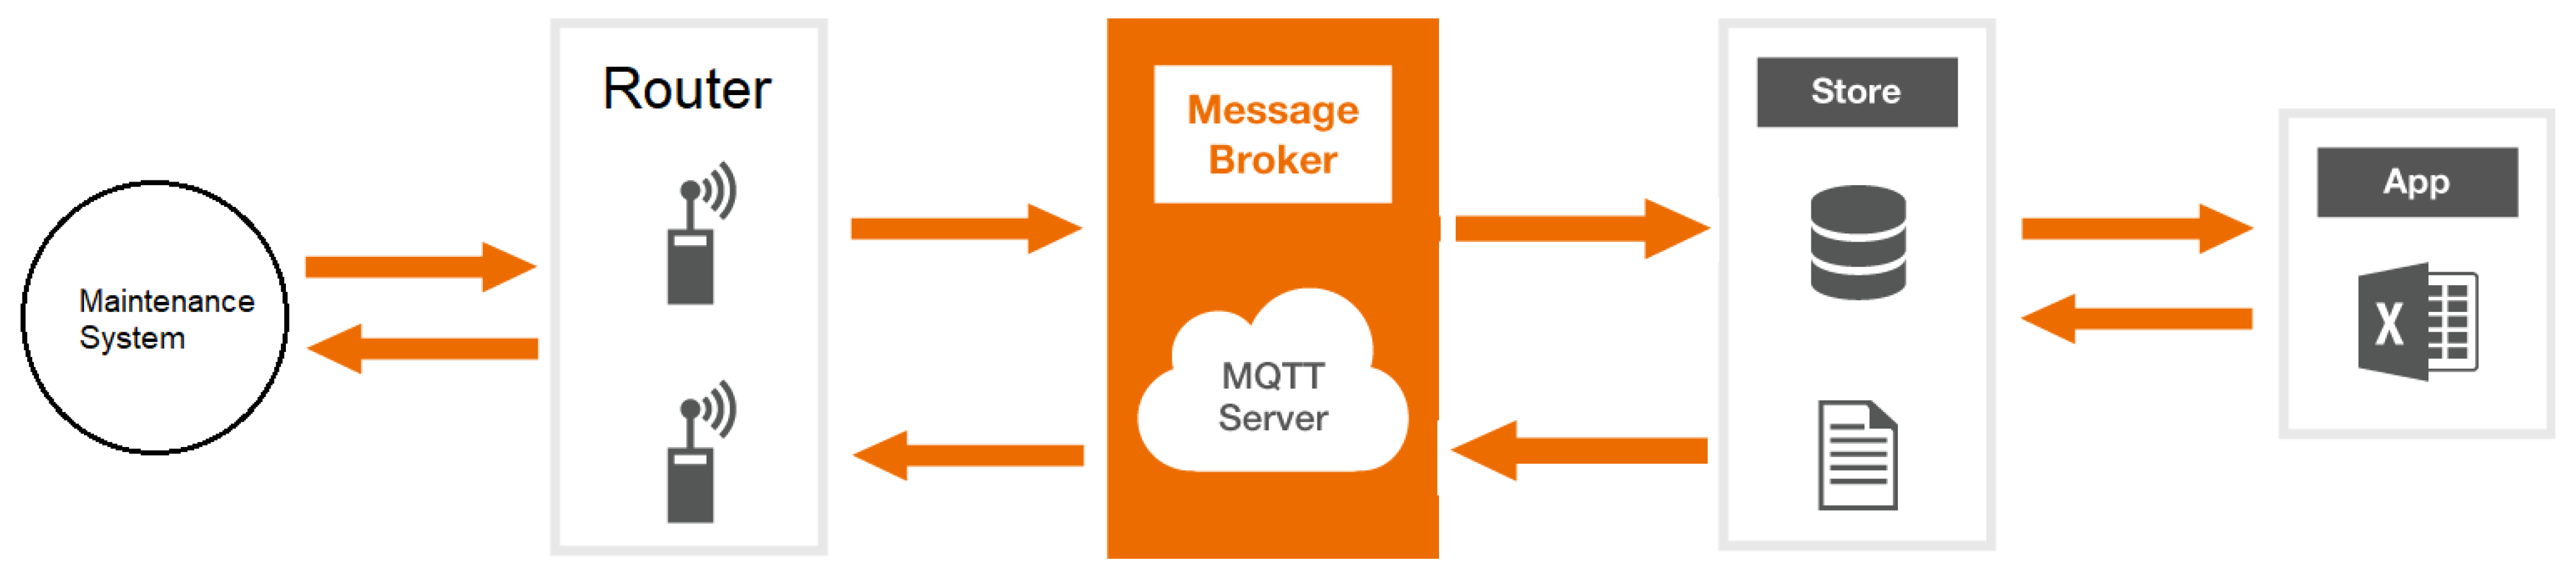
Remote control and monitoring are possible thanks to the implemented IoT structure. The local maintenance system is connected to a router (
Figure 17) and can access the Internet. It should be equipped with hardware and software elements that form an MQTT client. MQTT (Message Queuing Telemetry Transport) is one of the available data protocols used in IoT systems. It is very convenient for spreading communication between many communicating nodes when the speed and amount of the transferred data are relatively low. The nodes do not communicate directly but use a special message broker (
Figure 17). The broker must have a static IP address to be accessible from the Internet. The broker may be located on the PV farm or may be located far away or in a commercial cloud. For a medium-sized system, not crossing a few hundred nodes, a single board microcomputer such as Raspberry PI is sufficient to effectively carry the MQTT communication and may act as an MQTT broker. The broker allows for bidirectional communication and a connected app may read the data from the plant and may control actuators as well. The data from the plant may be stored on the cloud server for later analysis. An intensive computing process may be carried out on the cloud as well. The user app has access to the computed results stored on the cloud server.
The simplified IoT system depicted in
Figure 17 may in reality be quite complicated. The IoT technology may be divided into specific functions forming a kind of a stack. We may distinguish the following layers: device, data, business, and user layer. From the hardware point of view, the device layer—in this case, the maintenance system—consists of actuators, embedded systems, intelligent devices (with the ability to compute), microcontroller units, transceivers and sensors. The data layer regards data protocols and connectivity. The connectivity is also divided into local and long-distance. Each type of connectivity has its specific transfer protocols. Each protocol may be divided into communication model layers such as application layer, transport and network layers, data link and physical layers. Each layer may be implemented in many different ways. Depending on the assumed restrictions an optimal combination of IoT solutions should be taken into account.
The application of the IoT architecture described in this section, for maintenance of the solar power plant of Bialystok University of Technology, allows for a comprehensive analysis of the plant operation in real time and potentially may deliver better overall performance and effective maintenance. The system is extensive and for the purpose of wide studies it also consists of these devices: National Instruments NI PXIe-8108 (2.53 GHz Dual-Core Embedded Controller for PXI Express), NI-9148 external measurement modules (8-Slot, Spartan-3 FPGA and Ethernet Compact RIO Chassis), NI 9213, a high-density thermocouple module + K-type NiCr-NiAl thermocouples, and the global solar radiation (NI-9219+ LP PYRA 03 sensors). Environmental parameters are also monitored with WS501-UMB (Lufft, Fellbach, Germany) meteorological station, which is connected to an NI PXIe-8108 computer through an RS485 interface [
49,
50,
51,
52,
53,
54].
5. Results
The hybrid power plant of the Faculty of Electrical Engineering of the BUT campus is equipped with a maintenance system that allows recording many important parameters related to the weather conditions, solar tracker position, electrical parameters, and generated energy. The IoT architecture presented in
Section 4 was experimentally applied to achieve the presented results. The results are very important for a comprehensive analysis of the operation of the plant and ways of its optimization. The graph in
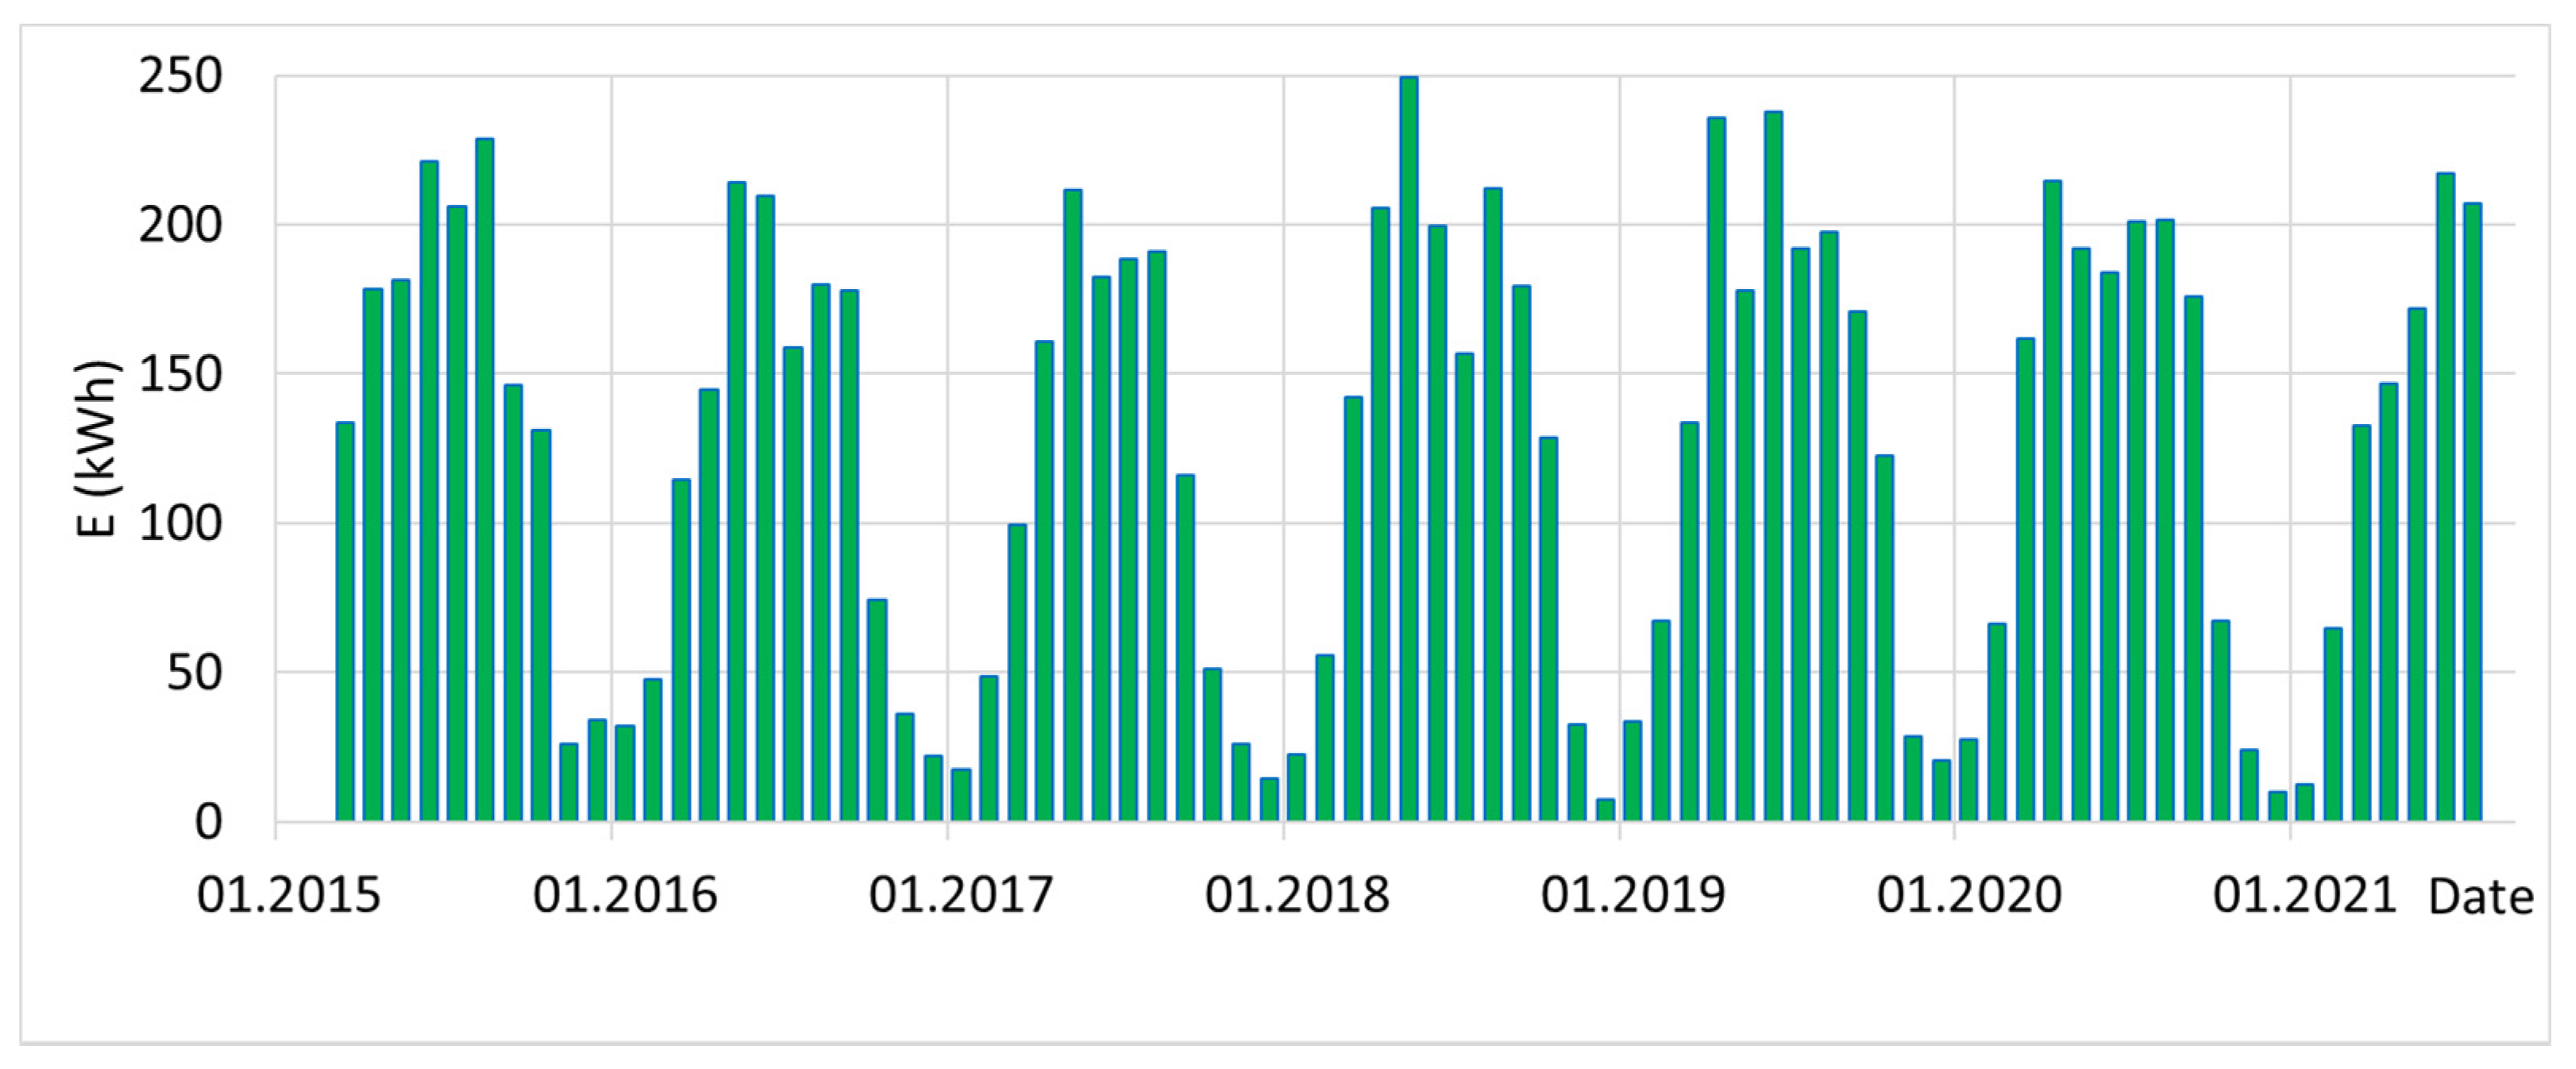
Figure 18 shows that the amount of energy generated in a PV1 power plant closely depends on the amount of sunshine. One can notice the high similarity of the shape of the sunshine hours (
Figure 11) to energy generated by the PV1 plant (
Figure 18).
The chart in
Figure 18 also shows significant differences between the same months in subsequent years.
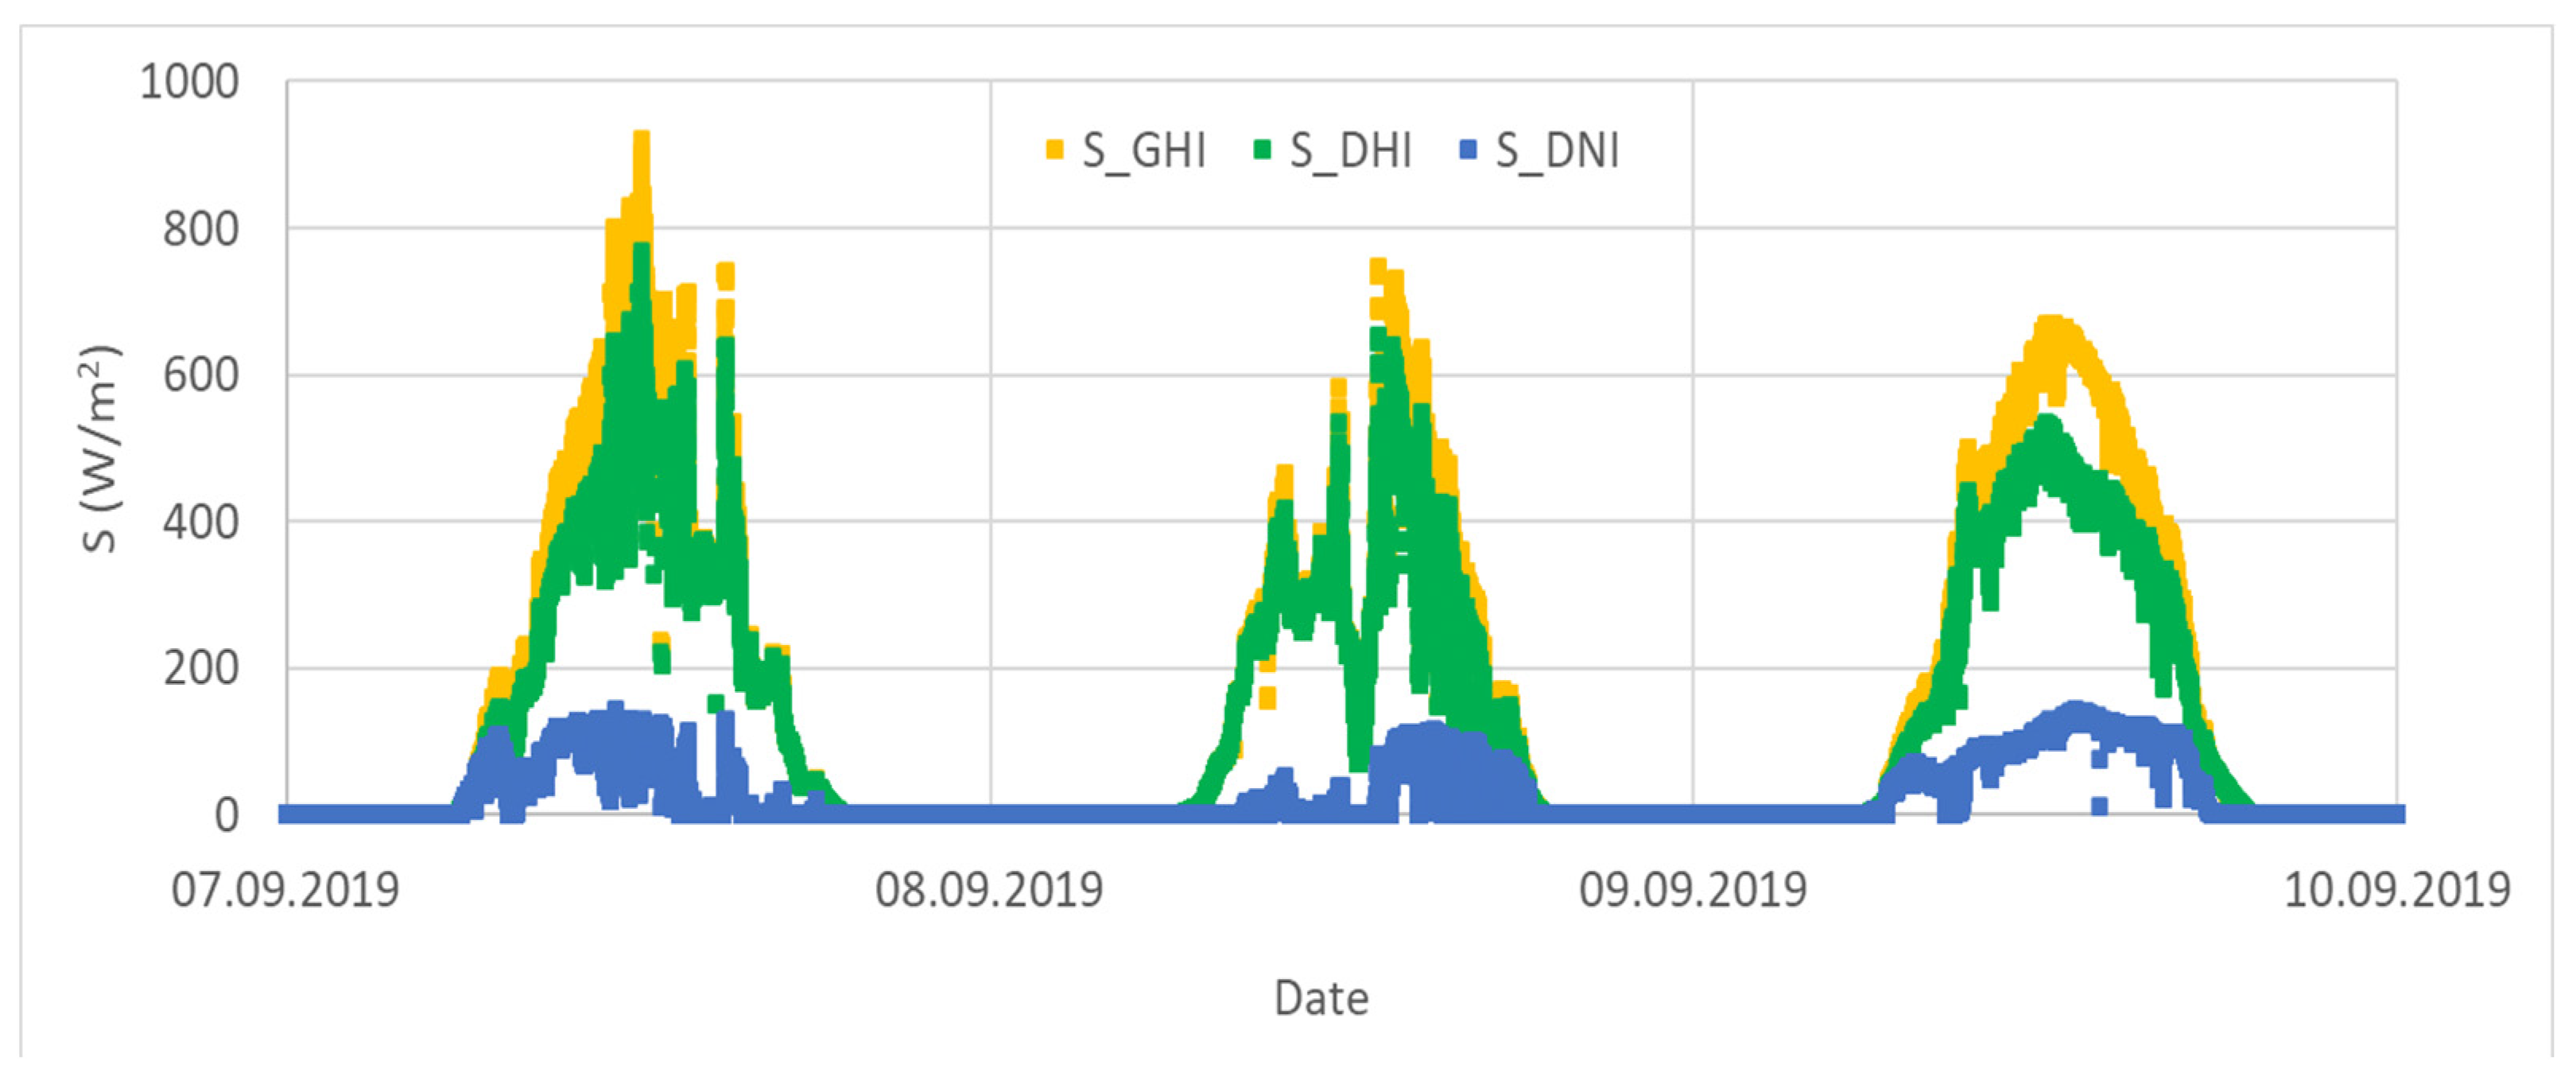
The values of global insolation, temperature and other climatic factors change very dynamically. This is due to the rapid changes related to the level of cloud cover, wind and ambient temperature. Changes in the instantaneous values of the above-mentioned quantities are shown in
Figure 19 and
Figure 20.
Figure 21 shows the power obtained on PV1 panels and the power fed into the grid at that time.
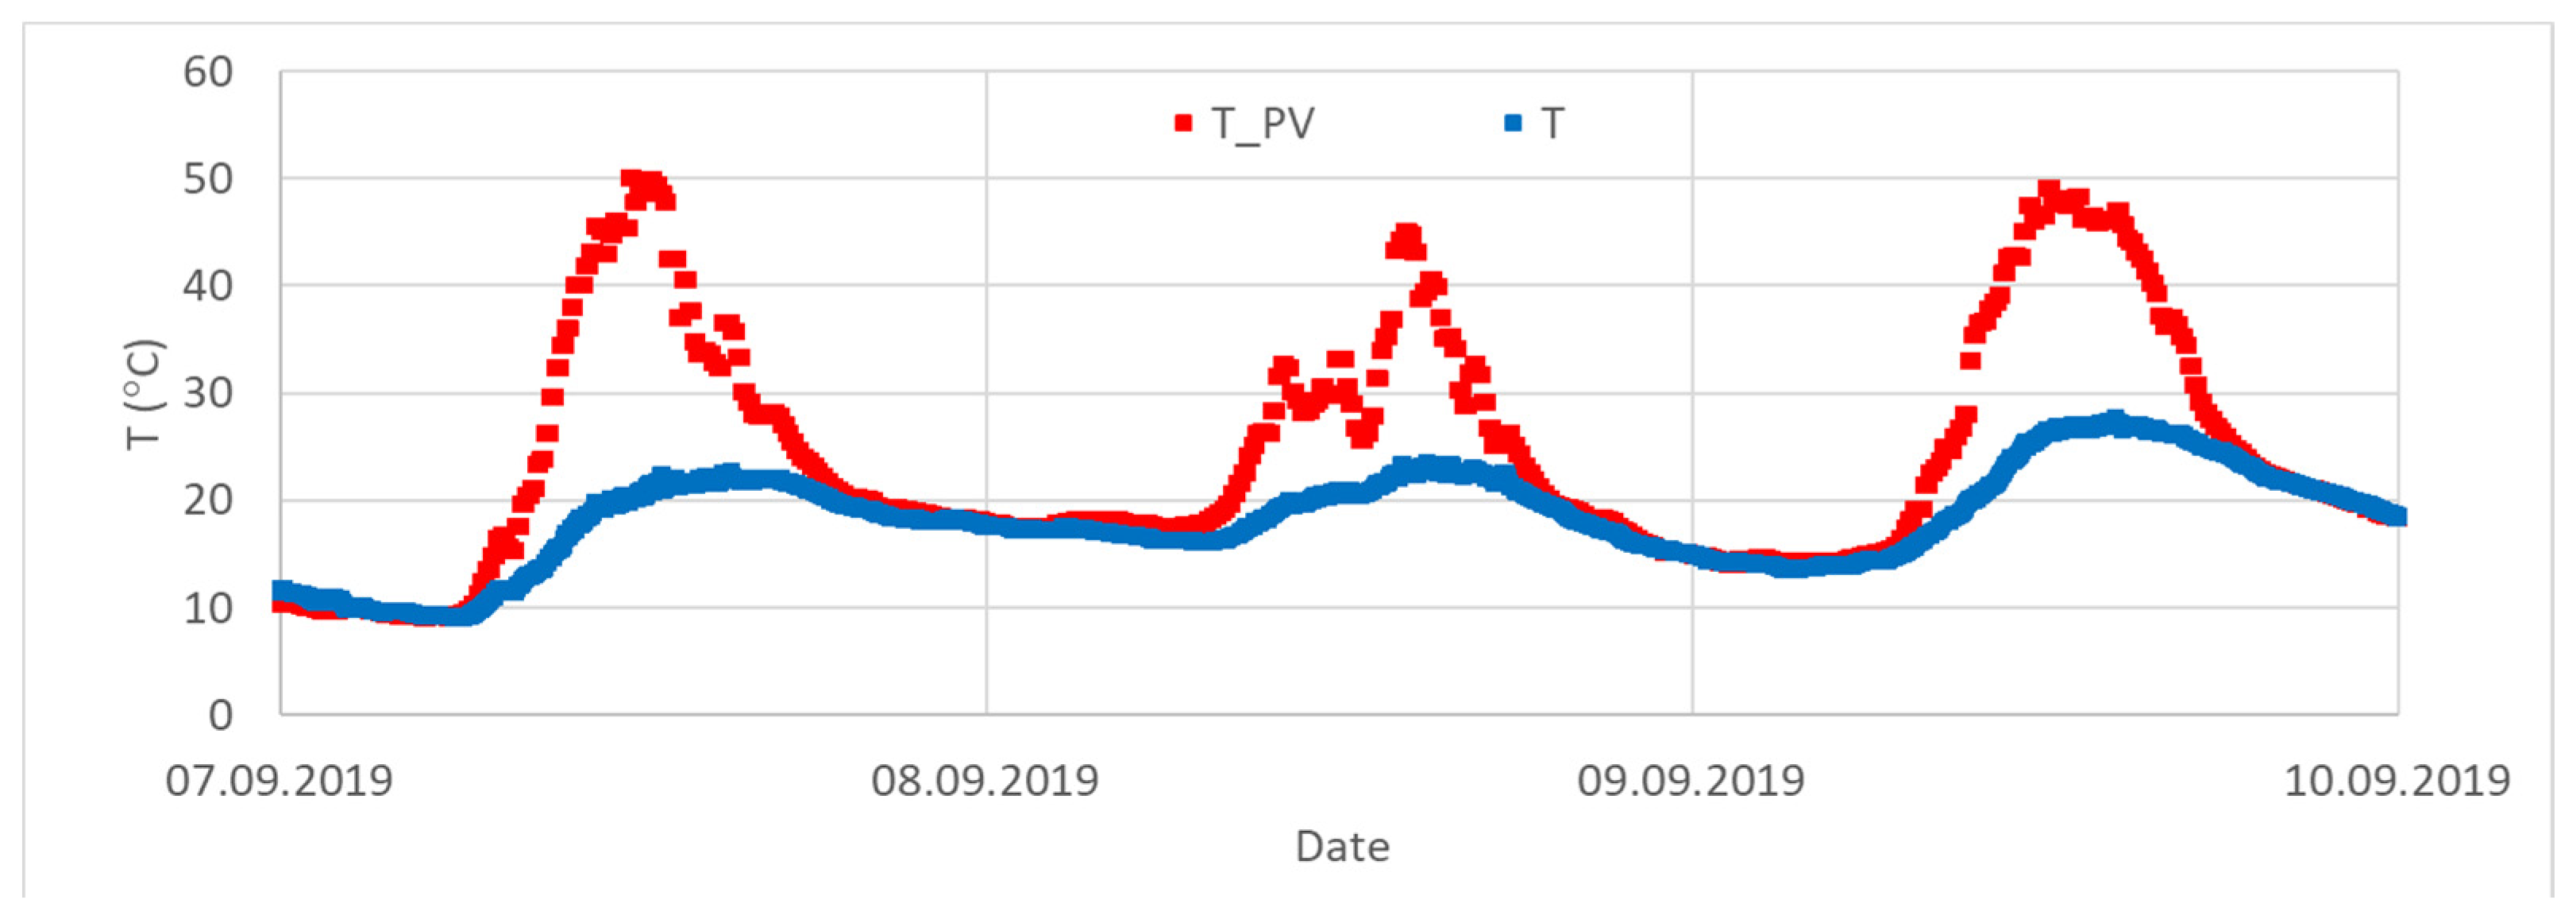
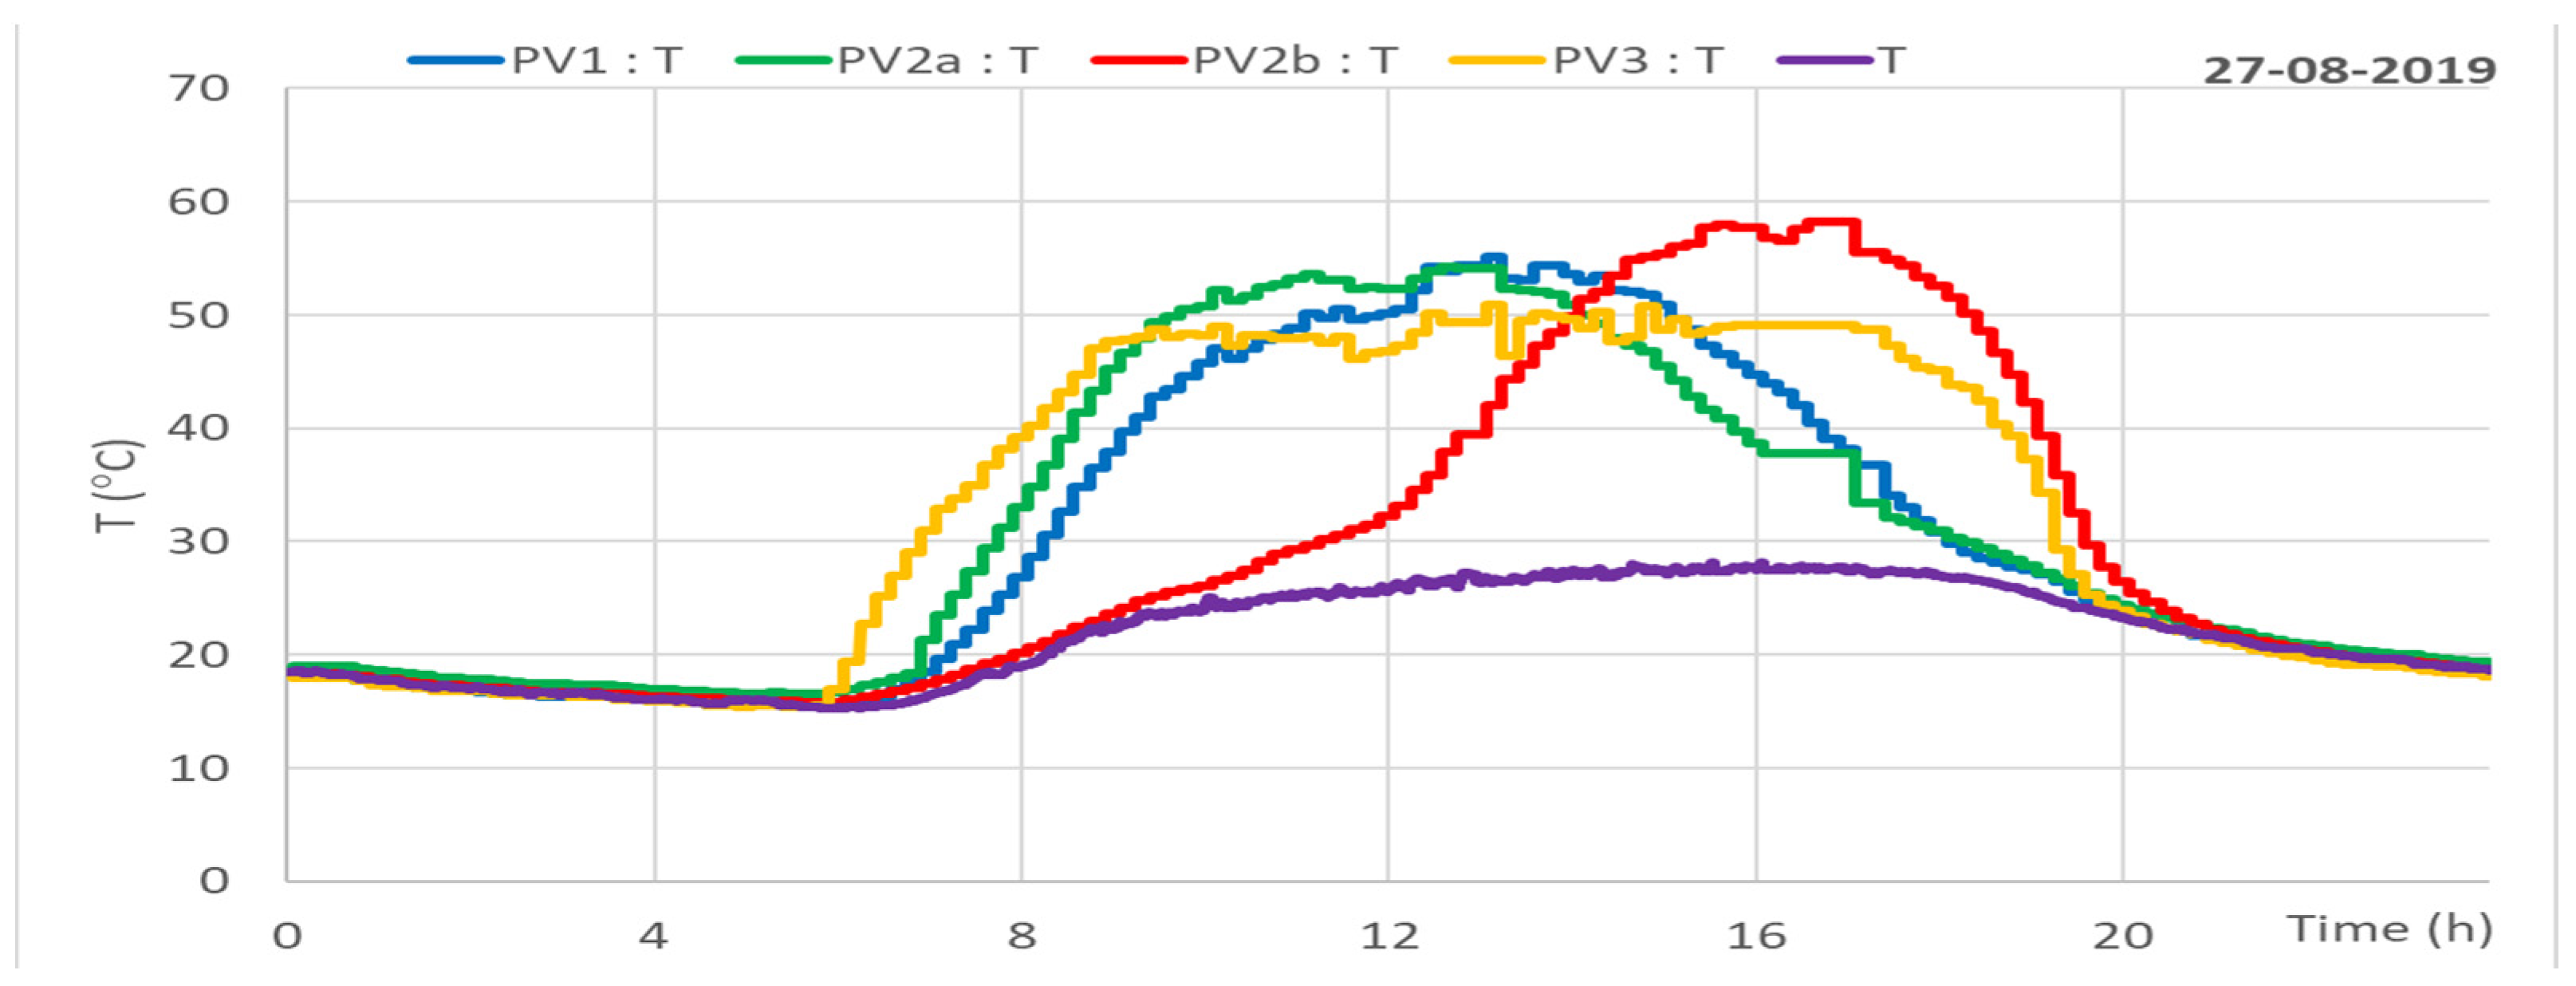
The atmospheric factors analyzed in this section significantly affect the operating point of PV1 panels. The parameter that has the greatest impact on the efficiency of the photovoltaic conversion is the temperature of the PV1 panels. The actual temperature of the module depends on material properties, method and quality of panel assembly, ambient temperature, solar irradiation, speed and wind direction, humidity, and location. Typically, during operation, the temperature of the PV panels becomes 30 °C higher than the ambient temperature (
Figure 20). Temperature control is therefore a key factor in improving the performance of a PV system. A detailed analysis of this issue and mathematical models for temperature determination are discussed in detail in the article by A. Idzkowski, K. Karasowska, and W. Walendziuk [
55].
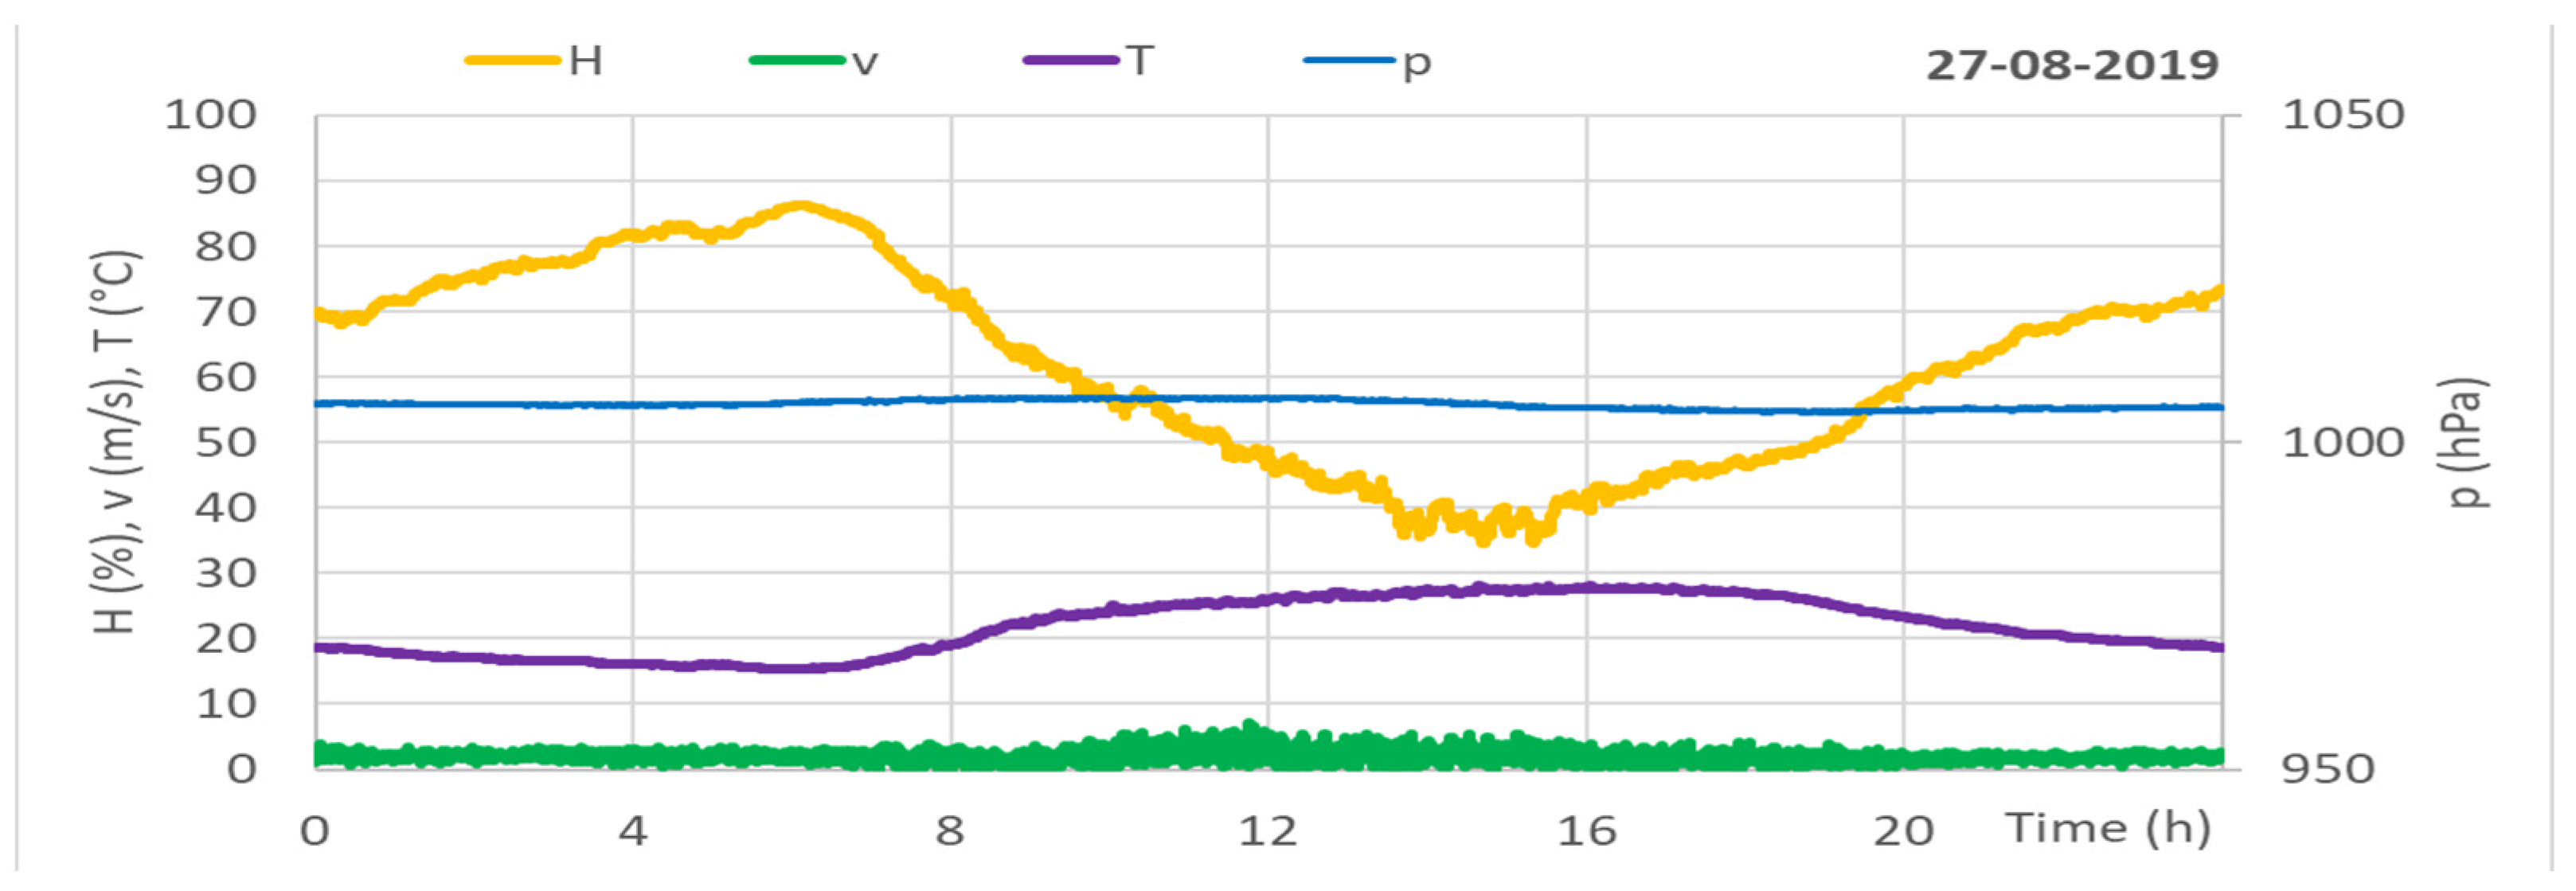
The influence of humidity, wind speed, ambient temperature, and pressure on the temperature of PV panels on a sunny summer day is shown in
Figure 22 and
Figure 23 and on a winter day in
Figure 24 and
Figure 25. The above-mentioned atmospheric factors influence the temperature of the PV modules of the tested hybrid power plant. The efficiency with which the plant worked exceeded the rated value and amounted to 16.4%, with an ambient temperature of 20 °C and solar global horizontal irradiation of 800 W/m
2. The change of the wind speed from 0 to 10 m/s resulted in the decrease of the average temperature of the PV1 modules from 44 °C to 33 °C. This resulted in an increase in the generated power by about 5%. The greatest impact on the module operating temperature was observed for: solar global horizontal irradiation, ambient temperature, and wind speed. The applied measurement system allowed for the control of the above-mentioned atmospheric factors. On the other hand, air pressure and humidity are factors largely related to the level of cloud cover.
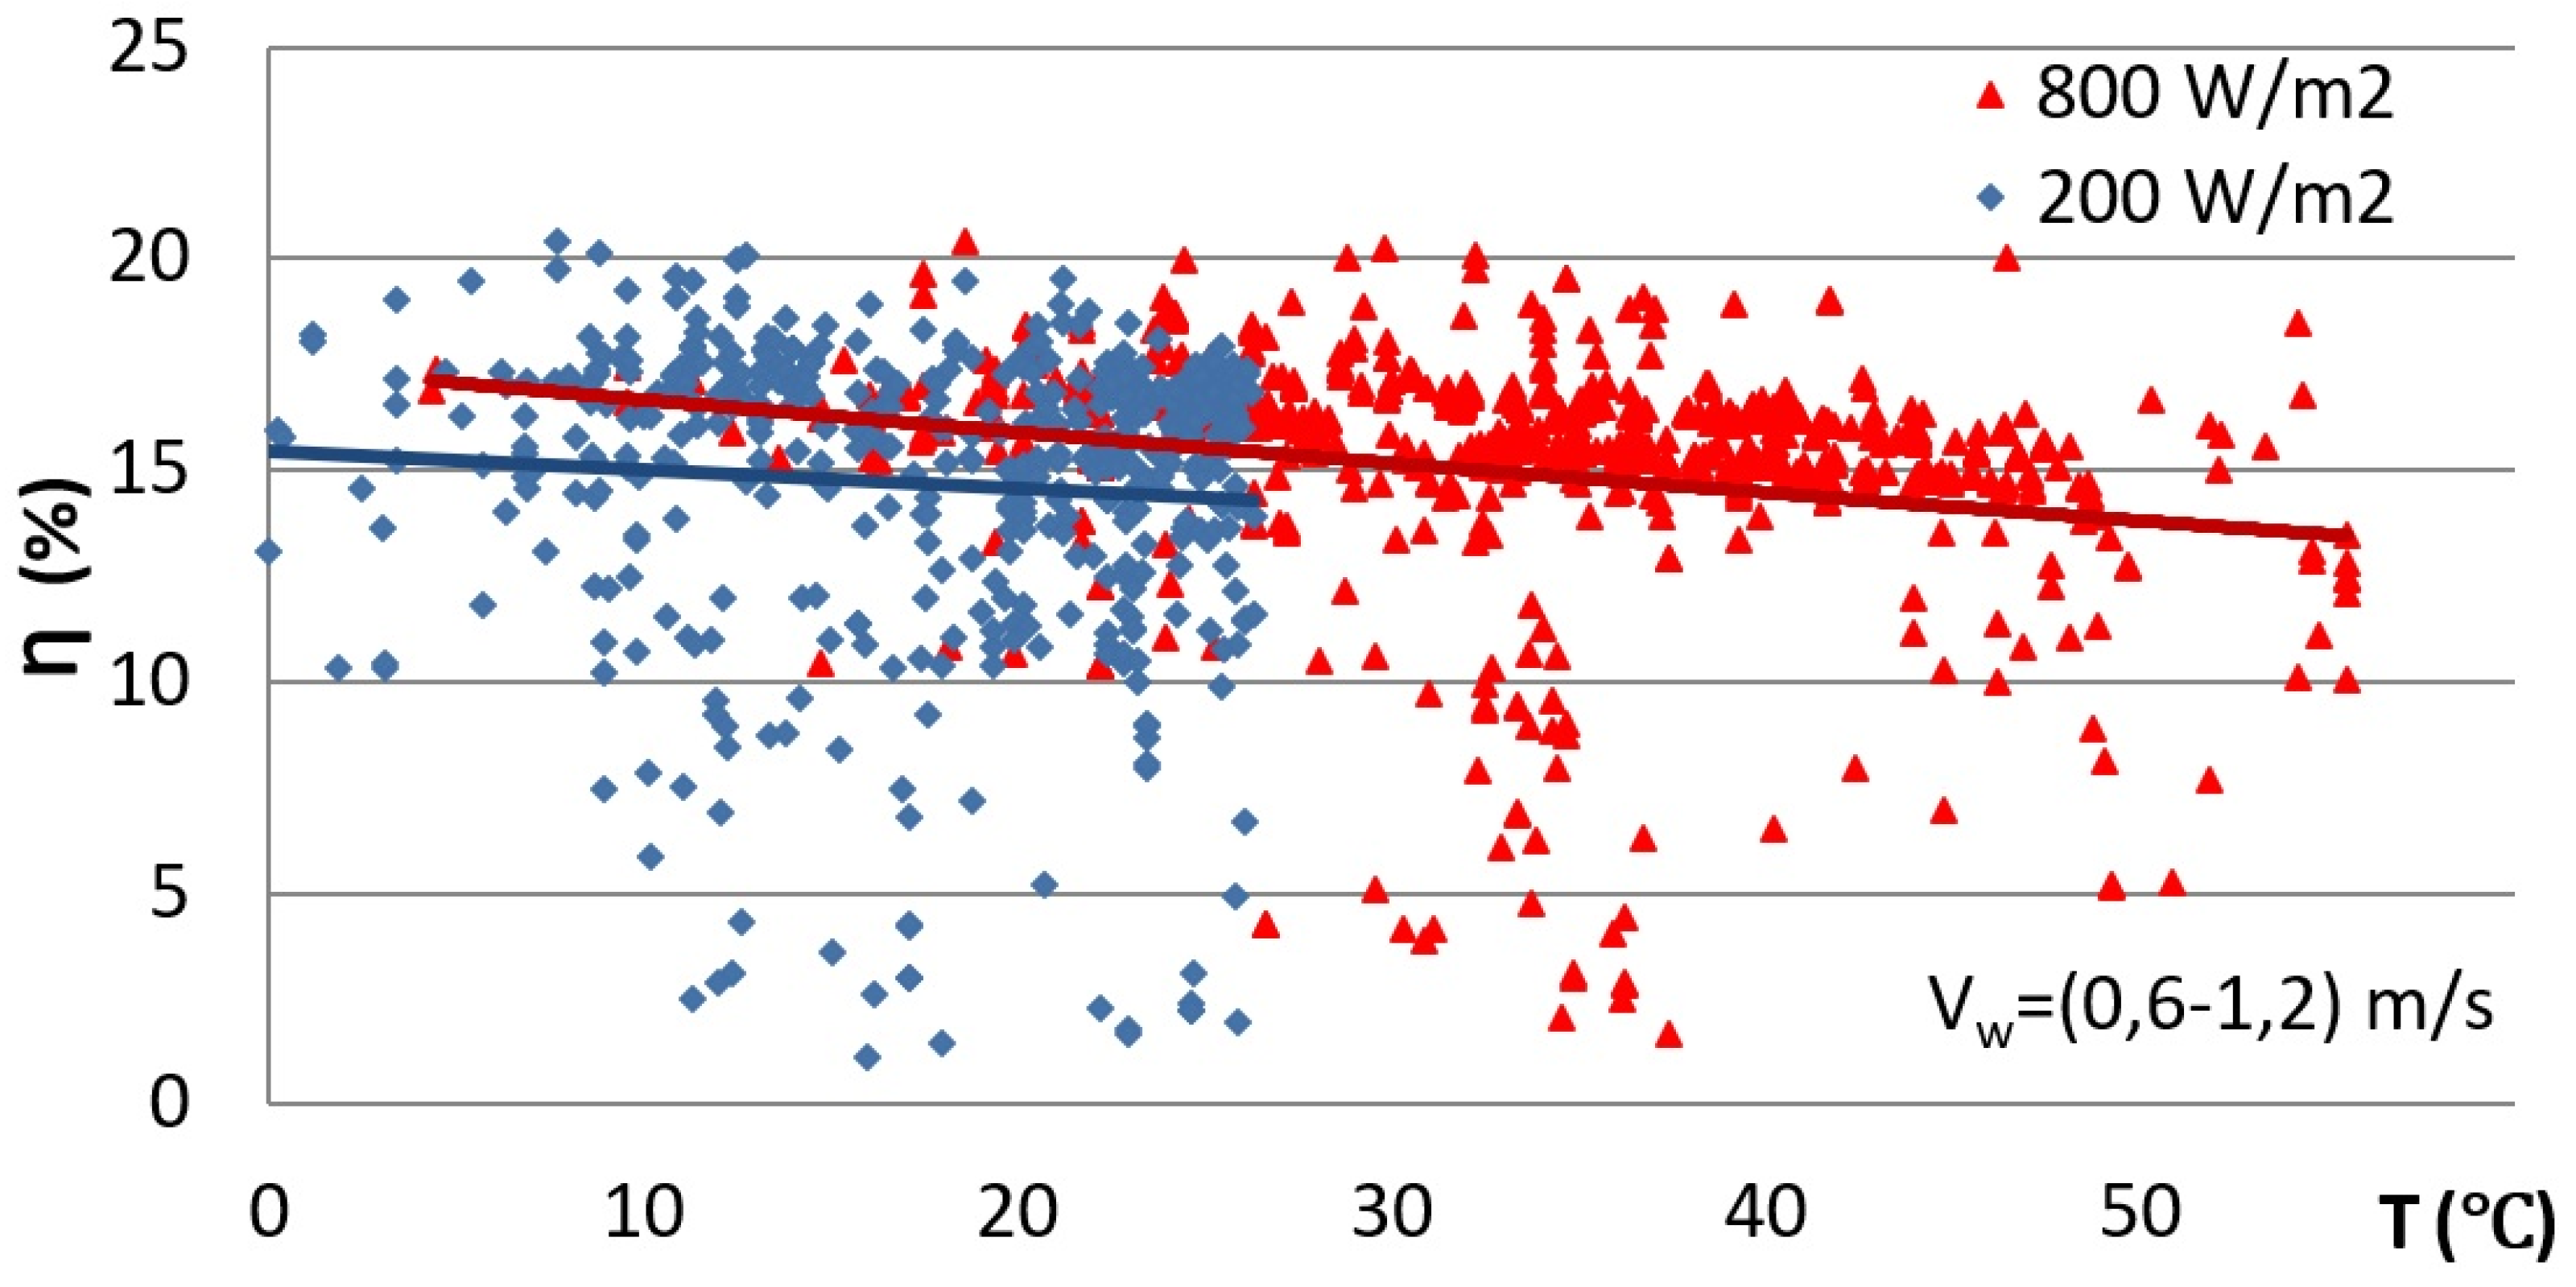
The impact of the factors analyzed in the chapter may cause significant changes in the efficiency of the photovoltaic conversion. In the tested power plant, increasing the module temperature by 30 °C resulted in a 10% decrease in its power (
Figure 30). The dependence of the efficiency on the module temperature presented in the graph was determined at two values of solar global horizontal irradiation on the basis of the measurement results obtained at the almost constant wind speed (0.6–1.2 m/s). The equations describing the temperature dependence of the efficiency in the tested range take the form:
where:
and
where:
Therefore, the temperature coefficient of Pmax is equal −0.35%/K.
6. Discussion and Final Remarks
The application of the IoT architecture described in the paper, for maintenance of the solar power plant of Bialystok University of Technology, allows for a comprehensive analysis of the plant operation in real time, and the plant delivers better overall performance. The results recorded at the hybrid power plant of the Faculty of Electrical Engineering of the BUT campus are interesting and useful for a comprehensive analysis of the operation of the plant and ways of its optimization. It is shown that implementation of an automatic maintenance system may deliver extensive important information regarding the PV plant installation. Based on the daily generation during a year, it is obvious that there are periods when an additional power source may be necessary (depending on the power needs). During the winter months, when the solar radiation reaching the PV panels is weaker, an alternative source such as a wind turbine may be taken into account. Additionally, as the analysis of wind force across a year shows, the wind is stronger in the winter months and thus may fill the gap in available solar energy for the overall electricity generation.
The authors of the paper are going to compare and present in a future work possible profits related to the implementation of the IoT systems to control the Bialystok University PV power plant and a PV power plant in general, as well as calculations of additional costs of the installation (hardware and software). Another aspect worth considering is the cost of maintenance of the IoT system and its participation in the total investment.
The analyzed atmospheric factors affect the operating point of the photovoltaic power plant. Solar global horizontal irradiation and ambient temperature have a direct influence on the generated power. On the other hand, the influence of other factors (wind speed, humidity) mainly affects the module temperature.
The possibility of measuring the temperatures of the PV panels gives information if an additional cooling system is necessary. The information may as well be used in a control process, which is related to the MPPT controller.
The IoT and maintenance systems may, in reality, be complicated and sophisticated, which was partly enlightened in the paper. It is the user responsibility to choose wisely the necessary structure, functionality, and components to achieve balanced profits and desired results. It is easy to overinvest in such installation and some functions may not be used in all circumstances or only used rarely, which makes their utilization questionable.
Author Contributions
Conceptualization, J.K. and W.W.; methodology, J.K. and W.W.; software, J.K. and W.W.; validation, J.K. and W.W.; formal analysis, J.K. and W.W.; investigation, J.K. and W.W.; resources, J.K. and W.W.; data curation, J.K.; writing—original draft preparation, J.K. and W.W.; writing—review and editing, J.K. and W.W.; visualization, J.K. and W.W.; supervision, J.K.; project administration, J.K.; funding acquisition, J.K. and W.W. All authors have read and agreed to the published version of the manuscript.
Funding
This research was funded by the Bialystok University of Technology as part of the work WZ/WE-IA/3/2020.
Institutional Review Board Statement
Not applicable.
Informed Consent Statement
Not applicable.
Data Availability Statement
Not applicable.
Acknowledgments
The research could take place thanks to the earlier realization of two projects: a hybrid system of small wind and photovoltaic power designed to supply electricity to the Research and Teaching Center of the Electrical Faculty at Zwierzyniecka Street 10, the project No. WND-RPPD. 05. 02. 00-20-034/12, entitled “Improving the energy efficiency of the infrastructure of the Bialystok University of Technology using renewable energy sources”, Priority Axis V. Development of environmental infrastructure, Action 5.2 Development of local environmental infrastructure, co-financed by the European Regional Development Fund under the Regional Operational Programme of the Podlasie Region. Additionally, the operation of the production system in urban (urbanized) conditions is examined in the framework of project No. WND-RPPD. 01. 01. 00-20-015/12, entitled “Study of the effectiveness of active and passive methods of improving the energy efficiency of infrastructure using renewable energy sources” Priority Axis I. Increase innovation and support entrepreneurship in the region, Action 1.1 Creating conditions for the development of innovation, co-financed by the European Regional Development Fund and the state budget under the Regional Operational Programme of the Podlasie Region.
Conflicts of Interest
The authors declare no conflict of interest.
References
- Ansari, S.; Ayob, A.; Lipu, M.S.H.; Saad, M.H.M.; Hussain, A. A Review of Monitoring Technologies for Solar PV Systems Using Data Processing Modules and Transmission Protocols: Progress, Challenges and Prospects. Sustainability 2021, 13, 8120. [Google Scholar] [CrossRef]
- González, I.; Portalo, J.M.; Calderón, A.J. Configurable IoT Open-Source Hardware and Software I-V Curve Tracer for Photovoltaic Generators. Sensors 2021, 21, 7650. [Google Scholar] [CrossRef]
- Melo, G.C.G.d.; Torres, I.C.; Araújo, Í.B.Q.d.; Brito, D.B.; Barboza, E.d.A. A Low-Cost IoT System for Real-Time Monitoring of Climatic Variables and Photovoltaic Generation for Smart Grid Application. Sensors 2021, 21, 3293. [Google Scholar] [CrossRef]
- Gomes, L.; Vale, Z.; Corchado, J.M. Microgrid management system based on a multi-agent approach: An office building pilot. Measurement 2020, 154, 107427. [Google Scholar] [CrossRef]
- Vargas-Salgado, C.; Aguila-Leon, J.; Chiñas-Palacios, C.; Hurtado-Perez, E. Low-cost web-based Supervisory Control and Data Acquisition system for a microgrid testbed: A case study in design and implementation for academic and research applications. Heliyon 2019, 5, 9. [Google Scholar] [CrossRef] [Green Version]
- Barry, R.G.; Chorley, R.J. Atmosphere, Weather and Climate, 9th ed.; Routledge: London, UK; New York, NY, USA, 2010. [Google Scholar]
- Monteith, J.L.; Unsworth, M.H. Principles of Environmental Physics, 4th ed.; Elsevier: Amsterdam, The Netherlands, 2008. [Google Scholar]
- Scharmer, K.; Greif, J. The European Solar Radiation Atlas, Vol. 1: Fundamentals and Maps; Les Presses de l’École des Mines: Paris, France, 2000. [Google Scholar]
- Warner, T.T. Numerical Weather and Climate Prediction; Cambridge University Press: Cambridge, UK, 2010. [Google Scholar]
- Holton, J.R. An Introduction to Dynamic Meteorology, 4th ed.; Elsevier Academic Press: Amsterdam, The Netherlands, 2004. [Google Scholar]
- Bellia, L.; Blaszczak, U.; Fragliasso, F.; Gryko, L. Matching CIE illuminants to measured spectral power distributions: A method to evaluate non-visual potential of daylight in two European cities. Sol. Energy 2020, 208, 830–858. [Google Scholar] [CrossRef]
- Jacobson, M.Z. Fundamentals of Atmospheric Modeling, 2nd ed.; Cambridge University Press: Cambridge, UK, 2005. [Google Scholar]
- Wang, F.; Zhen, Z.; Wang, B.; Mi, Z. Comparative Study on KNN and SVM Based Weather Classification Models for Day Ahead Short Term Solar PV Power Forecasting. Appl. Sci. 2017, 8, 28. [Google Scholar] [CrossRef] [Green Version]
- Dec, G.; Drałus, G.; Mazur, D.; Kwiatkowski, B. Forecasting Models of Daily Energy Generation by PV Panels Using Fuzzy Logic. Energies 2021, 14, 1676. [Google Scholar] [CrossRef]
- Nespoli, A.; Ogliari, E.; Leva, S.; Pavan, A.M.; Mellit, A.; Lughi, V.; Dolara, A. Day-Ahead Photovoltaic Forecasting: A Comparison of the Most Effective Techniques. Energies 2019, 12, 1621. [Google Scholar] [CrossRef] [Green Version]
- Mo, J.Y.; Jeon, W. How Does Energy Storage Increase the Efficiency of an Electricity Market with Integrated Wind and Solar Power Generation?—A Case Study of Korea. Sustain. J. Rec. 2017, 9, 1797. [Google Scholar] [CrossRef] [Green Version]
- Kudo, M.; Takeuchi, A.; Nozaki, Y.; Endo, H.; Sumita, J. Forecasting electric power generation in a photovoltaic power system for an energy network. Electr. Eng. Jpn. 2009, 167, 16–23. [Google Scholar] [CrossRef]
- Powell, K.M.; Hedengren, J.D.; Edgar, T.F. Dynamic optimization of a solar thermal energy storage system over a 24 hour period using weather forecasts. In Proceedings of the 2013 American Control Conference, Washington, DC, USA, 17–19 June 2013; pp. 2946–2951. [Google Scholar] [CrossRef] [Green Version]
- Huang, Y.; Lu, J.; Liu, C.; Xu, X.; Wang, W.; Zhou, X. Comparative study of power forecasting methods for PV stations. In Proceedings of the 2010 International Conference on Power System Technology, Hangzhou, China, 24–28 October 2010; pp. 1–6. [Google Scholar] [CrossRef]
- Said, S.A.M.; Walwil, H.M. Fundamental studies on dust fouling effects on PV module performance. Sol. Energy 2014, 107, 328–337. [Google Scholar] [CrossRef]
- Sarver, T.; Al-Qaraghuli, A.; Kazmerski, L.L. A comprehensive review of the impact of dust on the use of solar energy: History, investigations, results, literature, and mitigation approaches. Renew. Sustain. Energy Rev. 2013, 22, 698–733. [Google Scholar] [CrossRef]
- Costa, S.C.S.; Diniz, A.S.A.C.; Kazmerski, L.L. Dust and soiling issues and impacts relating to solar energy systems: Literature review update for 2012–2015. Renew. Sustain. Energy Rev. 2016, 63, 33–61. [Google Scholar] [CrossRef] [Green Version]
- Costa, S.C.S.; Diniz, A.S.A.C.; Kazmerski, L.L. Solar energy dust and soiling R&D progress: Literature review update for 2016. Renew. Sustain. Energy Rev. 2018, 82, 2504–2536. [Google Scholar] [CrossRef]
- Gupta, V.; Sharma, M.; Pachauri, R.K.; Babu, K.D. Comprehensive review on effect of dust on solar photovoltaic system and mitigation techniques. Sol. Energy 2019, 191, 596–622. [Google Scholar] [CrossRef]
- Qasem, H.; Betts, T.R.; Müllejans, H.; AlBusairi, H.; Gottschalg, R. Dust-induced shading on photovoltaic modules. Prog. Photovolt. Res. Appl. 2014, 22, 218–226. [Google Scholar] [CrossRef] [Green Version]
- Iglinski, B.; Cichosz, M.; Kujawski, W.; Plaskacz-Dziuba, M.; Buczkowski, R. Helioenergy in Poland—Current state, surveys and prospects. Renew. Sustain. Energy Rev. 2016, 58, 862–870. [Google Scholar] [CrossRef]
- Paska, J.; Surma, T. Electricity generation from renewable energy sources in Poland. Renew. Sustain. Energy Rev. 2014, 71, 286–294. [Google Scholar] [CrossRef]
- Ministry of Climate and Environment. Energy Policy of Poland Until 2040; Ministry of Climate and Environment: Warsaw, Poland, 2021.
- Kusznier, J.; Wojtkowski, W. Impact of climatic conditions on PV panels operation in a photovoltaic power plant. In Proceedings of the 2019 15th Selected Issues of Electrical Engineering and Electronics (WZEE), Zakopane, Poland, 8–10 December 2019. [Google Scholar] [CrossRef]
- Kusznier, J.; Wojtkowski, W. Impact of climatic conditions and solar exposure on the aging of PV panels. In Proceedings of the 2019 15th Selected Issues of Electrical Engineering and Electronics (WZEE), Zakopane, Poland, 8–10 December 2019. [Google Scholar] [CrossRef]
- SMA Solar Technology AG. Sunny Boy 2000HF/2500HF/3000HF—Installation Guide. Available online: https://www.solartradesales.co.uk/Cache/Downloads/SunnyBoy-HF-Installation-guide-3.pdf (accessed on 24 August 2021).
- Solahart Goodwe Single Phase Small Domestic Inverter. GW1500-NS & GW3000-NS. Available online: https://www.solahart.com.au/media/5305/ih0113_gw1500-ns-gw3000-ns_single-phase-inverters_june-2019_web.pdf (accessed on 24 August 2021).
- ESP 6P 250-265 Wp, Moduły Fotowoltaiczne Polikrystaliczne o Grubościramy 40 mm, Europe Solar Production. Available online: https://www.europe-solarproduction.com/media/2963/ESP-Polycrystalline-250-265WP_PL.pdf (accessed on 24 August 2021).
- Nofuentes, G.; García-Domingo, B.; Muñoz, J.V.; Chenlo, F. Analysis of the dependence of the spectral factor of some PV technologies on the solar spectrum distribution. Appl. Energy 2014, 113, 302–309. [Google Scholar] [CrossRef]
- Ishii, T.; Otani, K.; Takashima, T.; Xue, Y. Solar spectral influence on the performance of photovoltaic (PV) modules under fine weather and cloudy weather conditions. Prog. Photovolt. Res. Appl. 2013, 21, 4–481. [Google Scholar] [CrossRef]
- Cornaro, C.; Andreotti, A. Influence of Average Photon Energy index on solar irradiance characteristics and outdoor performance of photovoltaic modules. Prog. Photovolt. Res. Appl. 2013, 21, 996–1003. [Google Scholar] [CrossRef]
- Minemoto, T.; Fukushige, S.; Takakura, H. Difference in the outdoor performance of bulk and thin-film silicon-based photovoltaic modules. Sol. Energy Mater. Sol. Cells 2009, 93, 1062–1065. [Google Scholar] [CrossRef]
- Commission Internationale de l’Éclairage. CIE Standard General Sky Guide; CIE 215: Vienna, Austria, 2014. [Google Scholar]
- Darula, S.; Kittler, R. Standard sky calculations for daylighting design and energy performance purposes. In Building Physics in Theory and Practice; Intytut Fizyki Budowli Katarzyna i Piotr Klemm: Łódź, Poland, 2009; pp. 23–28. [Google Scholar]
- Darula, S.; Kittler, R. CIE general sky standard defining luminance distributions. In Proceedings of the 2002 IBPSA Conference (Proceedings eSim), Montreal, QC, Canada, 12 September 2002. [Google Scholar]
- García, I.; de Blas, M.; Torres, J.L. The sky characterization according to the CIE Standard General Sky: Comparative analysis of three classification methods. Sol. Energy 2020, 196, 468–483. [Google Scholar] [CrossRef]
- CIE Sky Generator. Available online: http://andrewmarsh.com/software/cie-sky-web/ (accessed on 24 August 2021).
- Weather Online. Available online: https://www.weatheronline.pl/weather/maps/city (accessed on 24 August 2021).
- Shahinzadeh, H.; Moradi, J.; Gharehpetian, G.B.; Nafisi, H.; Abedi, M. IoT Architecture for Smart Grids. In Proceedings of the 2019 International Conference on Protection and Automation of Power System (IPAPS), Tehran, Iran, 8–9 January 2019; pp. 22–30. [Google Scholar] [CrossRef]
- Wojtkowski, W. Multi-channel LED light intensity control using FPGA programmable logic devices. Prz. Elektrotechniczny 2009, 85, 310–312. [Google Scholar]
- Wojtkowski, W.; Karpiuk, A. The Influence of the PWM frequency and duty cycle of a RGB LED driver on the optical spectrum of the emitted light. Prz. Elektrotechniczny 2012, 88, 217–219. [Google Scholar]
- Kusznier, J.; Wojtkowski, W. Spectral properties of smart LED lamps. Photonics Lett. Pol. 2020, 12, 16–18. [Google Scholar] [CrossRef]
- Kusznier, J. Influence of spectral properties of light sources on perceived and recorded images. Photonics Lett. Pol. 2021, 13, 40–42. [Google Scholar] [CrossRef]
- 2.53 GHz Dual-Core Embedded Controller for PXI Express. Available online: https://s1.dtsheet.com/store/data/000681604.pdf?key=c128e36c3df8ba5f178f111c61bafab4&r=1 (accessed on 24 August 2021).
- National Instruments NI-9148 Compact RIO Chassis, Ethernet Expansion Chassis for C Series Modules. Available online: https://www.ni.com/pdf/manuals/375519c.pdf (accessed on 24 August 2021).
- National Instruments. NI 9213 Datasheet. Available online: https://www.ni.com/pdf/manuals/378021a_02.pdf (accessed on 24 August 2021).
- National Instruments. NI 9219 Datasheet. Available online: https://www.ni.com/pdf/manuals/377223a_02.pdf (accessed on 24 August 2021).
- Delta OHM. LP Pyra 02—LP Pyra 03—LP Pyra 12. Available online: https://www.deltaohm.com/wp-content/uploads/document/DeltaOHM_LPPYRA03_manual_ENG.pdf (accessed on 24 August 2021).
- Compact Weather Sensors—WS501-UMB Smart Weather Sensor. Available online: https://www.lufft.com/products/compact-weather-sensors-293/ws501-umb-smart-weather-sensor-1839/productAction/outputAsPdf/ (accessed on 24 August 2021).
- Idzkowski, A.; Karasowska, K.; Walendziuk, W. Temperature Analysis of the Stand-Alone and Building Integrated Photovoltaic Systems Based on Simulation and Measurement Data. Energies 2020, 13, 4274. [Google Scholar] [CrossRef]
Figure 1.
Electricity production from fossil fuels—oil, gas and coal (developed based on World Bank data).
Figure 1.
Electricity production from fossil fuels—oil, gas and coal (developed based on World Bank data).
Figure 2.
Energy production from renewable fuels and nuclear energy (developed based on World Bank data).
Figure 2.
Energy production from renewable fuels and nuclear energy (developed based on World Bank data).
Figure 3.
Map of the condition and development of the power system in Poland (
a), the black and brown points show the location of the coal power plants, and the map of the installed capacity and electricity produced from renewable sources (
b) in 2020 [
28].
Figure 3.
Map of the condition and development of the power system in Poland (
a), the black and brown points show the location of the coal power plants, and the map of the installed capacity and electricity produced from renewable sources (
b) in 2020 [
28].
Figure 4.
Instantaneous power of individual sections of the PV plant on a sunny summer day 27 August 2019, panels facing south and inclined at the optimal angle 38°—PV1, panels placed on the tracker—PV3, on the southeastern facade of the building—PV2a, on the southwest facade of the building—PV2b (based on own research).
Figure 5.
Solar global horizontal irradiation (S_GHI), solar diffuse horizontal irradiation (S_DHI) and solar direct normal irradiance (S_DNI) measured in the location of the PV plant on a sunny summer day (based on own research).
Figure 5.
Solar global horizontal irradiation (S_GHI), solar diffuse horizontal irradiation (S_DHI) and solar direct normal irradiance (S_DNI) measured in the location of the PV plant on a sunny summer day (based on own research).
Figure 6.
Location of the hybrid power plant of the Faculty of Electrical Engineering of the BUT campus.
Figure 6.
Location of the hybrid power plant of the Faculty of Electrical Engineering of the BUT campus.
Figure 7.
Percentage of reflection, absorption and transmission of solar radiation by cloud layers of different thicknesses (developed based on [
6]).
Figure 7.
Percentage of reflection, absorption and transmission of solar radiation by cloud layers of different thicknesses (developed based on [
6]).
Figure 12.
Basic elements of a photovoltaic system.
Figure 12.
Basic elements of a photovoltaic system.
Figure 13.
A simplified block diagram of a photovoltaic system featuring a local server.
Figure 13.
A simplified block diagram of a photovoltaic system featuring a local server.
Figure 14.
A block diagram of the temperature sensors connected to the maintenance system.
Figure 14.
A block diagram of the temperature sensors connected to the maintenance system.
Figure 15.
The temperature sensors connected to the maintenance system by 1-Wire bus.
Figure 15.
The temperature sensors connected to the maintenance system by 1-Wire bus.
Figure 16.
A block diagram of the temperature sensors connected to the maintenance system by RS-485.
Figure 16.
A block diagram of the temperature sensors connected to the maintenance system by RS-485.
Figure 17.
IoT elements connected to the maintenance system.
Figure 17.
IoT elements connected to the maintenance system.
Figure 18.
Energy generated by the PV1 plant with optimal settings—PV1 (based on own research).
Figure 18.
Energy generated by the PV1 plant with optimal settings—PV1 (based on own research).
Figure 19.
Solar global horizontal irradiation (S_GHI), diffuse horizontal irradiation (S_DHI) and direct normal irradiation (S_DNI) at the location of the PV power plant (based on own research).
Figure 19.
Solar global horizontal irradiation (S_GHI), diffuse horizontal irradiation (S_DHI) and direct normal irradiation (S_DNI) at the location of the PV power plant (based on own research).
Figure 20.
Changes in ambient temperature (T) and the temperature of PV1 panels (T_PV) of the power plant (based on own research).
Figure 20.
Changes in ambient temperature (T) and the temperature of PV1 panels (T_PV) of the power plant (based on own research).
Figure 21.
Instantaneous power obtained (U*I) and power fed into the grid (P_AC) values of the PV1 power plant (based on own research).
Figure 21.
Instantaneous power obtained (U*I) and power fed into the grid (P_AC) values of the PV1 power plant (based on own research).
Figure 22.
Instantaneous humidity (H), wind speed (v), ambient temperature (T) and atmospheric pressure (p) on a sunny summer day (based on own research).
Figure 22.
Instantaneous humidity (H), wind speed (v), ambient temperature (T) and atmospheric pressure (p) on a sunny summer day (based on own research).
Figure 23.
Instantaneous ambient temperature values and individual PV sections on a sunny summer day (based on own research).
Figure 23.
Instantaneous ambient temperature values and individual PV sections on a sunny summer day (based on own research).
Figure 24.
Instantaneous humidity (H), wind speed (v), ambient temperature (T) and atmospheric pressure (p) on a sunny winter day (based on own research).
Figure 24.
Instantaneous humidity (H), wind speed (v), ambient temperature (T) and atmospheric pressure (p) on a sunny winter day (based on own research).
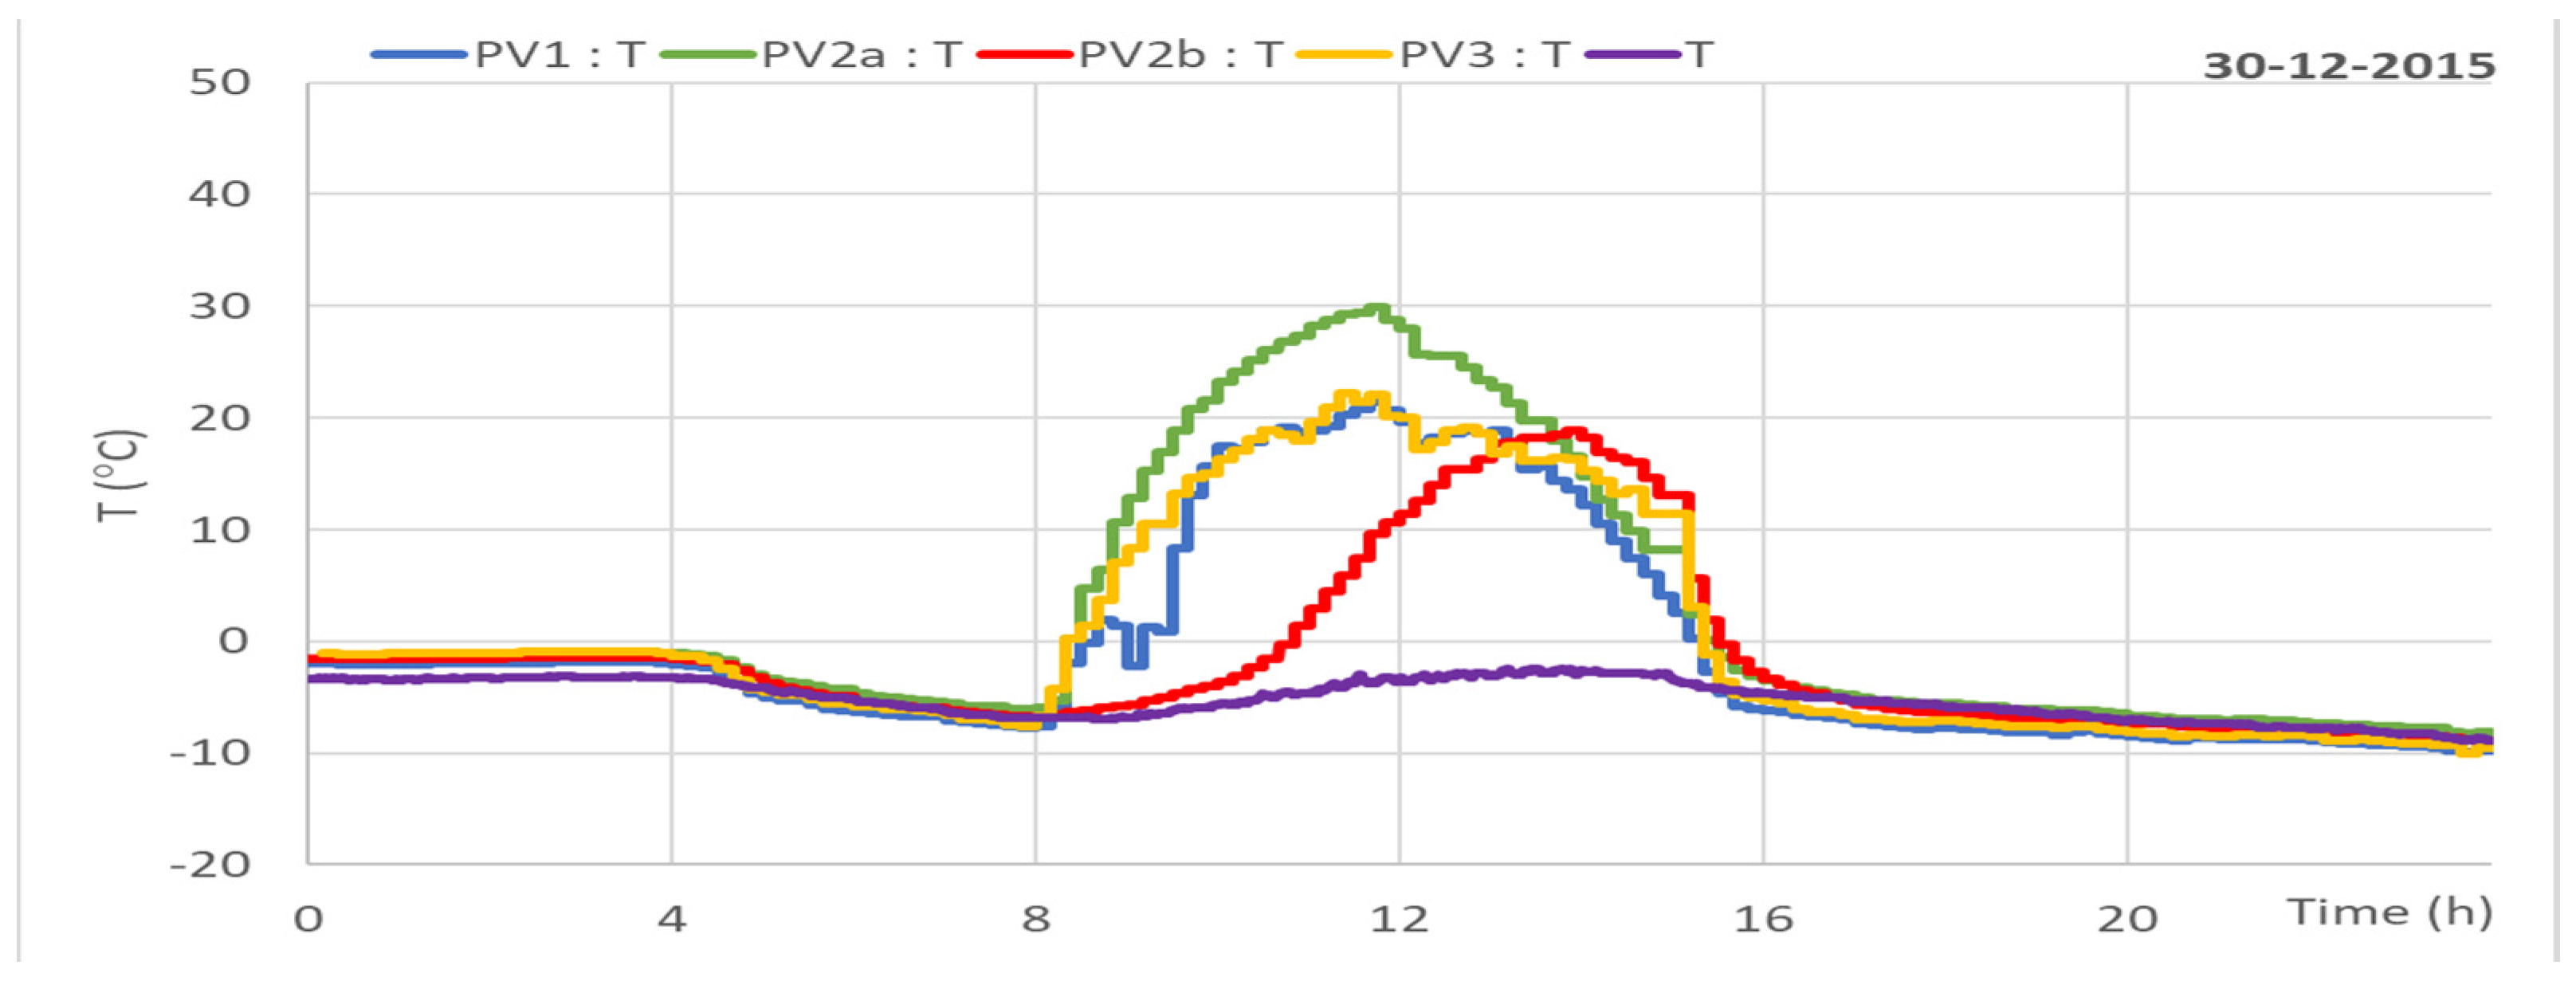
Figure 25.
Instantaneous ambient temperature values and individual PV sections on a sunny winter day (based on own research).
Figure 25.
Instantaneous ambient temperature values and individual PV sections on a sunny winter day (based on own research).
Figure 26.
Instantaneous temperature values of individual panels of PV1 section on a sunny summer day (based on own research).
Figure 26.
Instantaneous temperature values of individual panels of PV1 section on a sunny summer day (based on own research).
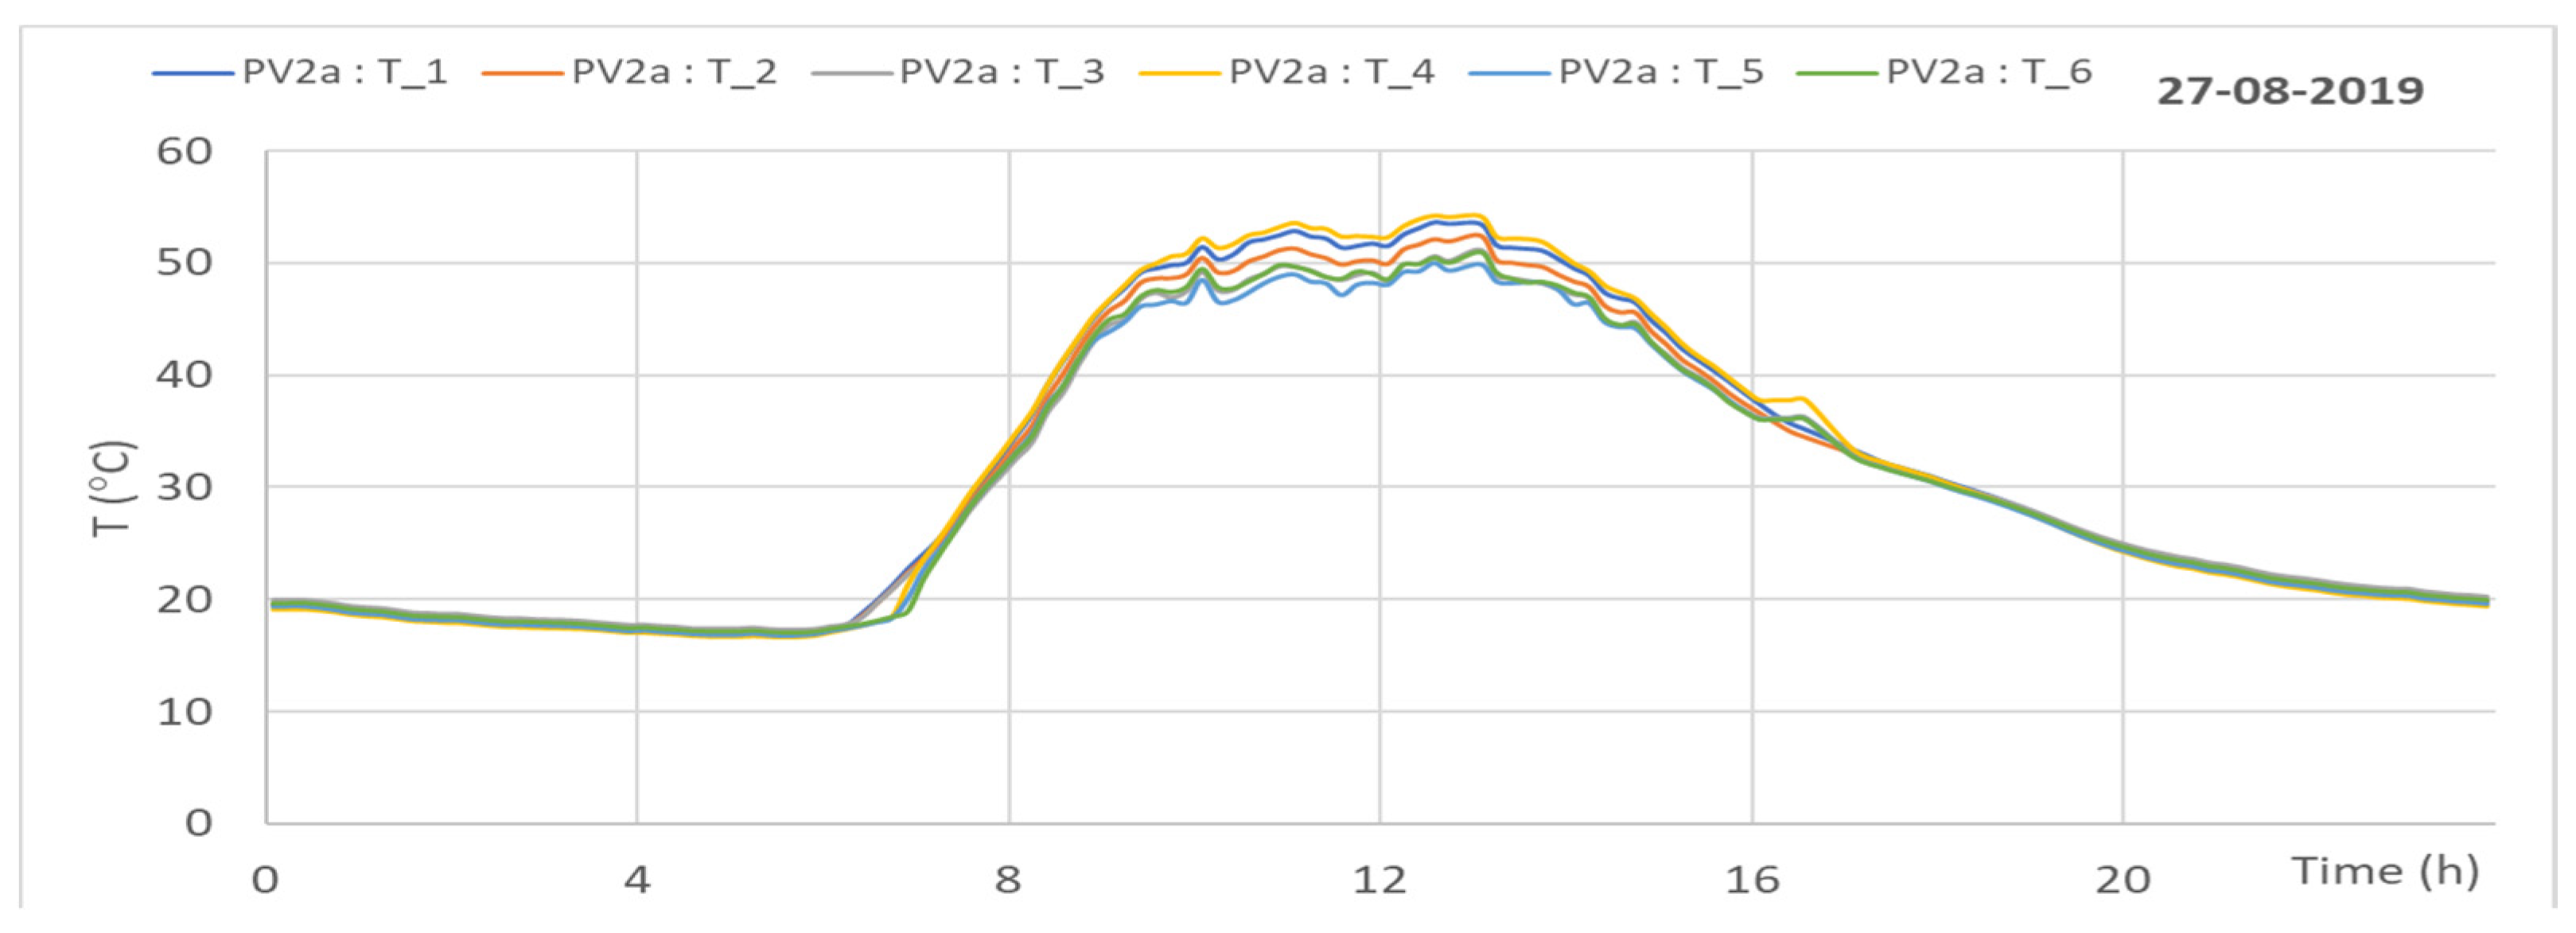
Figure 27.
Instantaneous temperature values of individual panels of PV2a section on a sunny summer day (based on own research).
Figure 27.
Instantaneous temperature values of individual panels of PV2a section on a sunny summer day (based on own research).
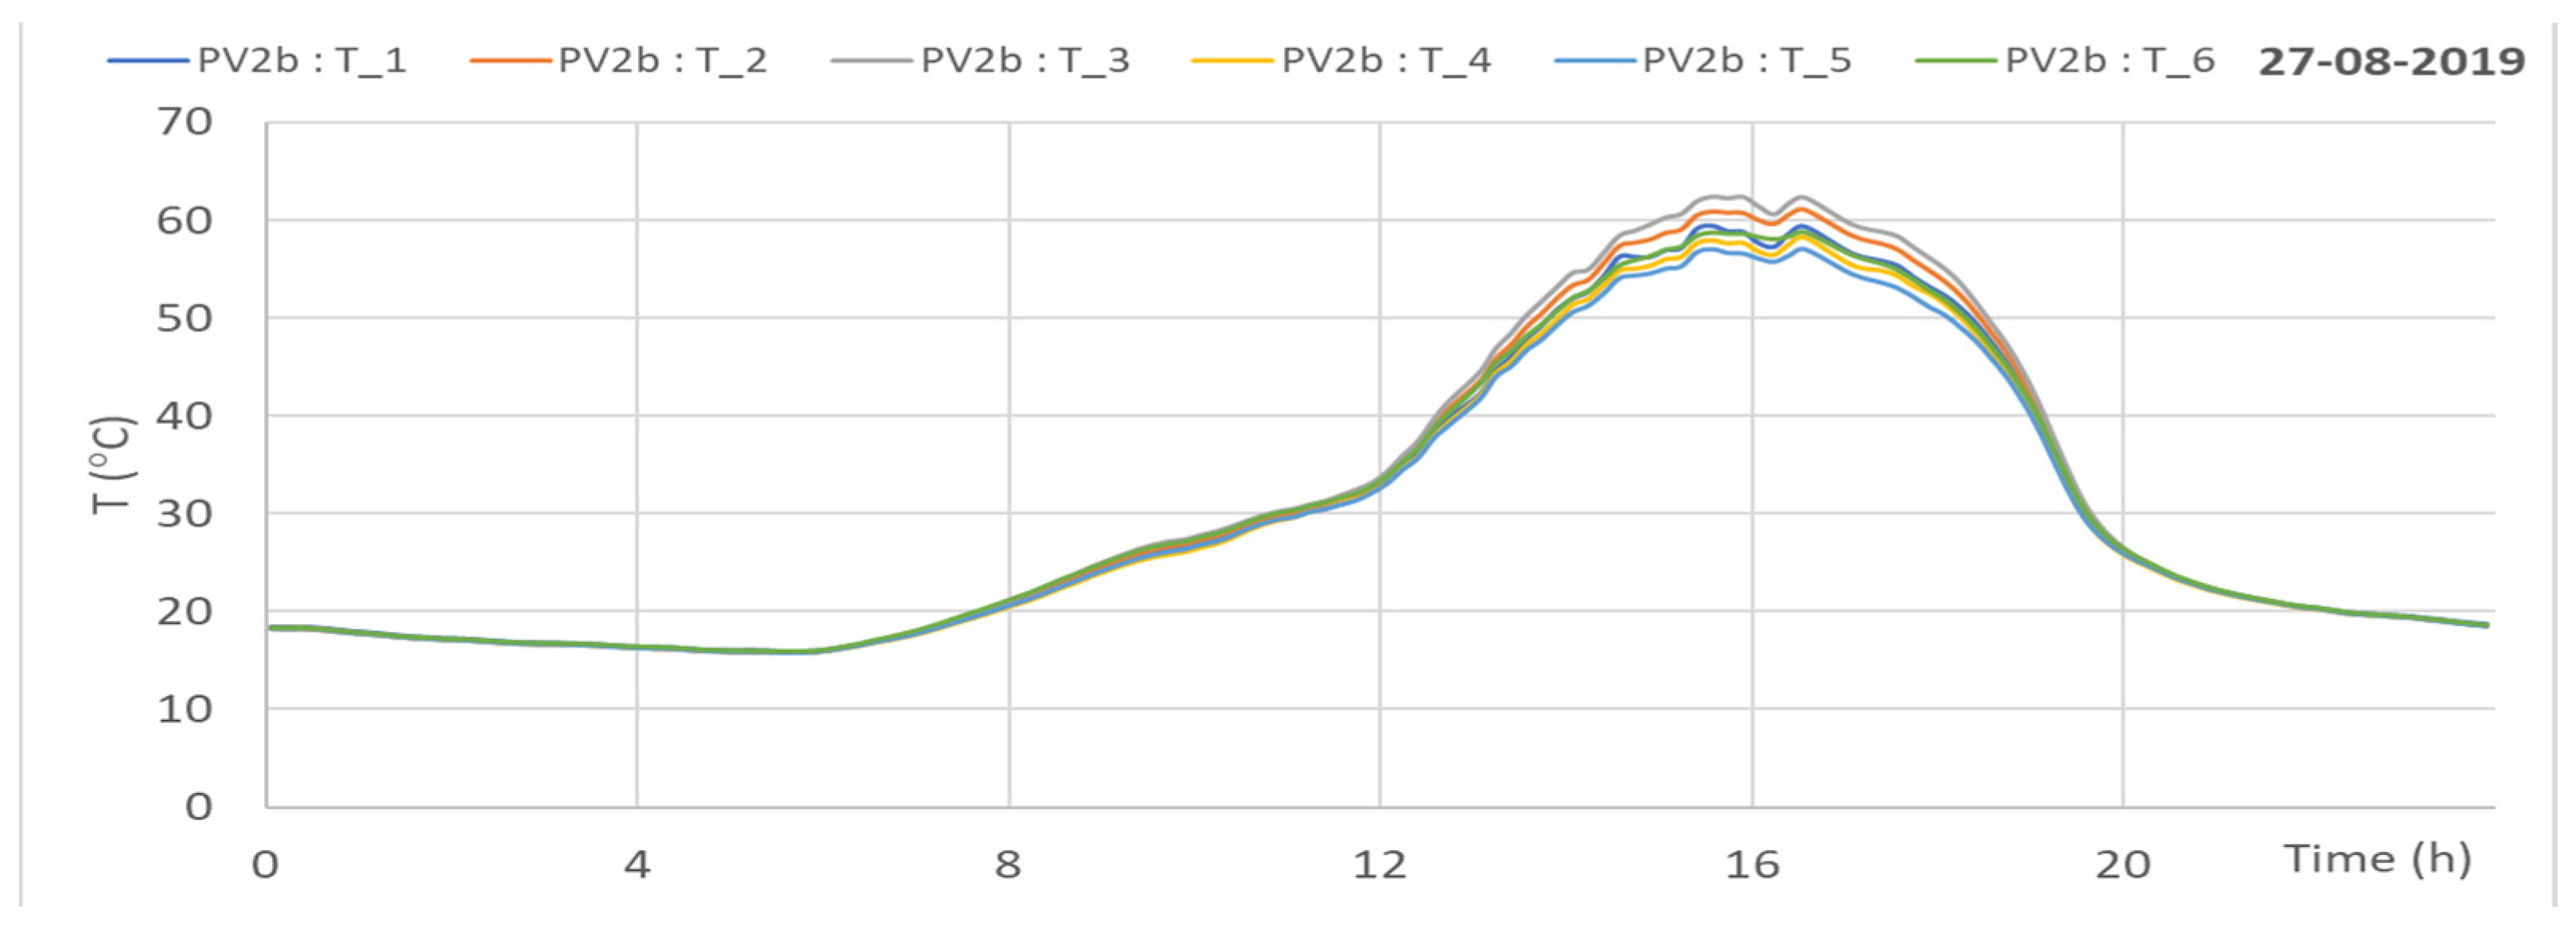
Figure 28.
Instantaneous temperature values of individual panels of PV2b section on a sunny summer day (based on own research).
Figure 28.
Instantaneous temperature values of individual panels of PV2b section on a sunny summer day (based on own research).
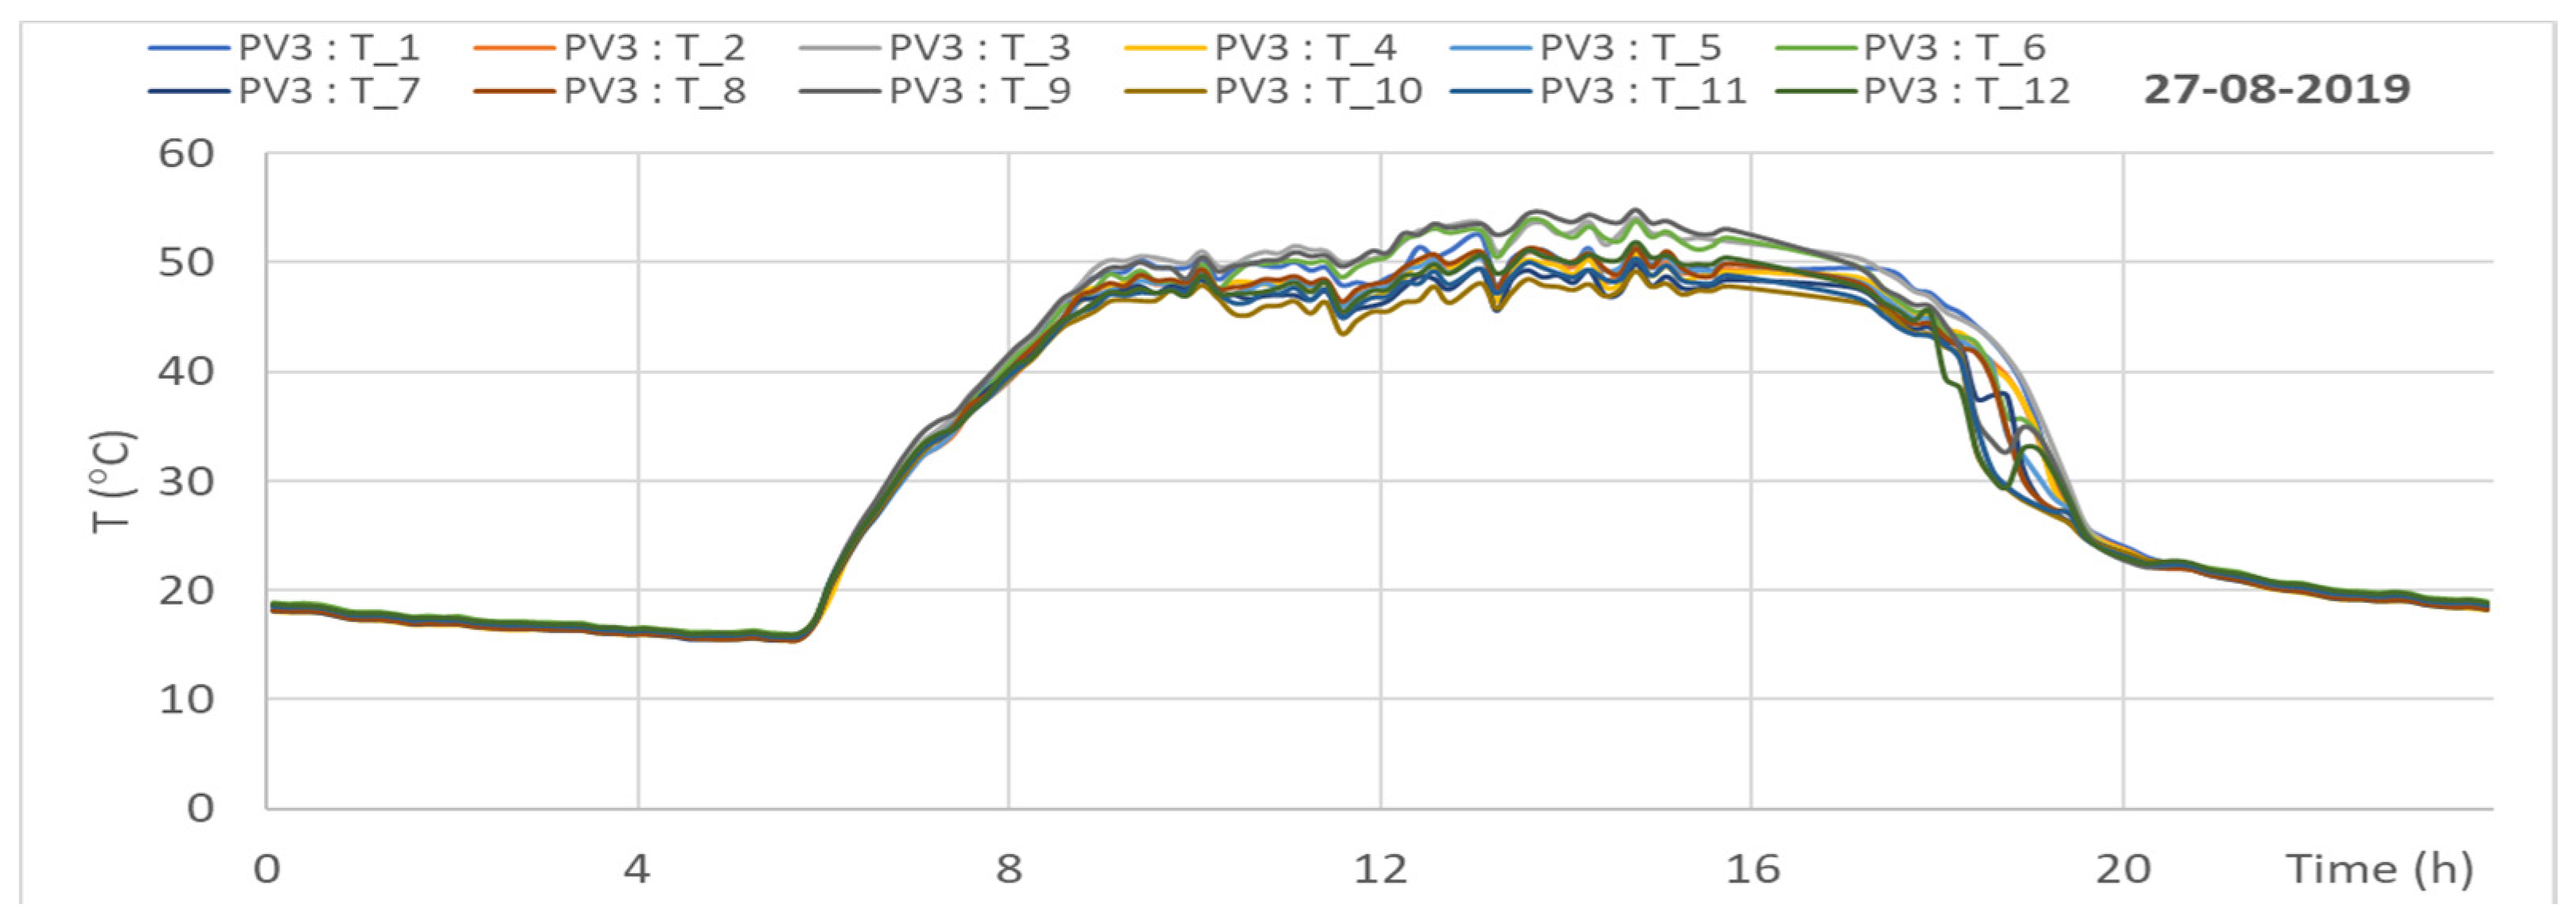
Figure 29.
Instantaneous temperature values of individual panels of PV3 section on a sunny summer day (based on own research).
Figure 29.
Instantaneous temperature values of individual panels of PV3 section on a sunny summer day (based on own research).
Figure 30.
Influence of module temperature on achieved efficiency (based on own research).
Figure 30.
Influence of module temperature on achieved efficiency (based on own research).
| Publisher’s Note: MDPI stays neutral with regard to jurisdictional claims in published maps and institutional affiliations. |
© 2021 by the authors. Licensee MDPI, Basel, Switzerland. This article is an open access article distributed under the terms and conditions of the Creative Commons Attribution (CC BY) license (https://creativecommons.org/licenses/by/4.0/).


