
Profitability of Prosumers According to Various Business Models—An Analysis in the Light of the COVID-19 Effect


Abstract
:1. Introduction
- (1)
- power not exceeding 10 kW—feeding into the network (production) in relation to off-take (consumption) at a 1:0.8 ratio;
- (2)
- power exceeding 10 kW and not exceeding 50 kW—feeding into the network (production) in relation to off-take (consumption) at a 1:0.7 ratio [31];
- (3)
- power not exceeding 1 MW for power cooperatives—feeding into the network (production) in relation to off-take (consumption) at a 1:0.6 ratio [32].
- (1)
- Verification of which of the models of billing and support for the development of the prosumer market proposed in Poland would be the most beneficial to entities consuming and producing energy (prosumers).
- (2)
- Assessment of how the COVID-19 pandemic could affect individual types of prosumers depending on the billing model applied.
2. Materials and Methods
2.1. Research Scenarios—Billing and Support Models
- CASE_0—A baseline scenario mapping the mechanism currently functioning in Polish law. This assumes the billing of the prosumer based on the “discount model”. In this model, the energy produced by the prosumer and unused at a given moment is fed into the distribution network acting as a deposit, from which the prosumer can take 70% or 80% of the accumulated volume. This level depends on the power of the source and amounts to 80% for installed power up to 10 kW and 70% for power ranging from 10 to 50 kW. The off-take of energy from the deposit may be made at any time within the annual billing period when the prosumer’s production source does not cover the demand. The off-take of energy from the deposit is not subject to any fees, and any costs to the distribution network operator and the obligated seller (the entity that has to buy and settle the energy from RES) [34] are covered in the discount volume. If the amount deposited is not sufficient to cover the prosumer’s energy demand, the missing part is purchased in accordance with the tariff or price list of the seller with whom the prosumer has signed a comprehensive agreement and in accordance with the tariff of the distribution network operator to whose network the prosumer is connected.
- CASE_1—A scenario in which the discount does not apply. Electricity consumption at times coinciding with production under self-consumption is not subject to any fees. Surplus energy is resold to the obligated seller at the Competitive Market Price (PL: CRK), which is calculated and published quarterly by the President of the Energy Regulatory Office [35]. Electricity taken from the distribution network is subject to fees in accordance with the tariff or price list of the seller with whom the prosumer has signed a comprehensive agreement and in accordance with the tariff of the distribution network operator to whose network the prosumer is connected.
- CASE_2—A scenario similar to CASE_0. Electricity consumption at times coinciding with production under self-consumption is not subject to any fees. Surplus energy is fed into the distribution network under a deposit from which the full 100% can be taken at any time within the billing period. The energy taken from the deposit is subject only to distribution fees in accordance with the tariff of the distribution network operator in the area where the prosumer is connected. If the amount deposited is not sufficient to cover the prosumer’s energy demand, the missing part is purchased in accordance with the tariff or price list of the seller with whom the prosumer has signed a comprehensive agreement and in accordance with the tariff of the distribution network operator to whose network the prosumer is connected.
- CASE_3—A scenario aimed at marketizing the resale of surplus energy production by the prosumer. In this model, electricity self-consumption as in the previous scenarios is not subject to any fees. Surplus electricity is resold by the prosumer in the daily and hourly market at “fixing prices”. There is no discount mechanism or network deposit in this model. By reselling the surplus, the prosumer earns proceeds from the sale of energy. In situations of deficit, the energy demand is covered by the purchase of energy from the seller with whom the prosumer has signed a comprehensive agreement. This purchase is made at the applicable tariff or price list price. The energy purchased in this way is also subject to a full distribution fee consistent with the tariff of the local distribution network operator.
- CASE_4—A scenario proposed and promoted by energy trading companies and aimed at marketizing the resale of surplus energy production by the prosumer. The scenario’s assumptions are identical to those of CASE_3, the difference being the inclusion of a different set of prices in the sale process. The surplus is resold at the Market Energy Price (PL: RCE) [36] calculated and published by the Transmission System Operator. The RCE is equivalent to the monthly average of the hourly prices weighted by the volume of surplus energy sold by the prosumer. This price is therefore fixed within each month of the billing period, which facilitates the handling of settlements in billing systems.
2.2. Assumptions and Sample Selection
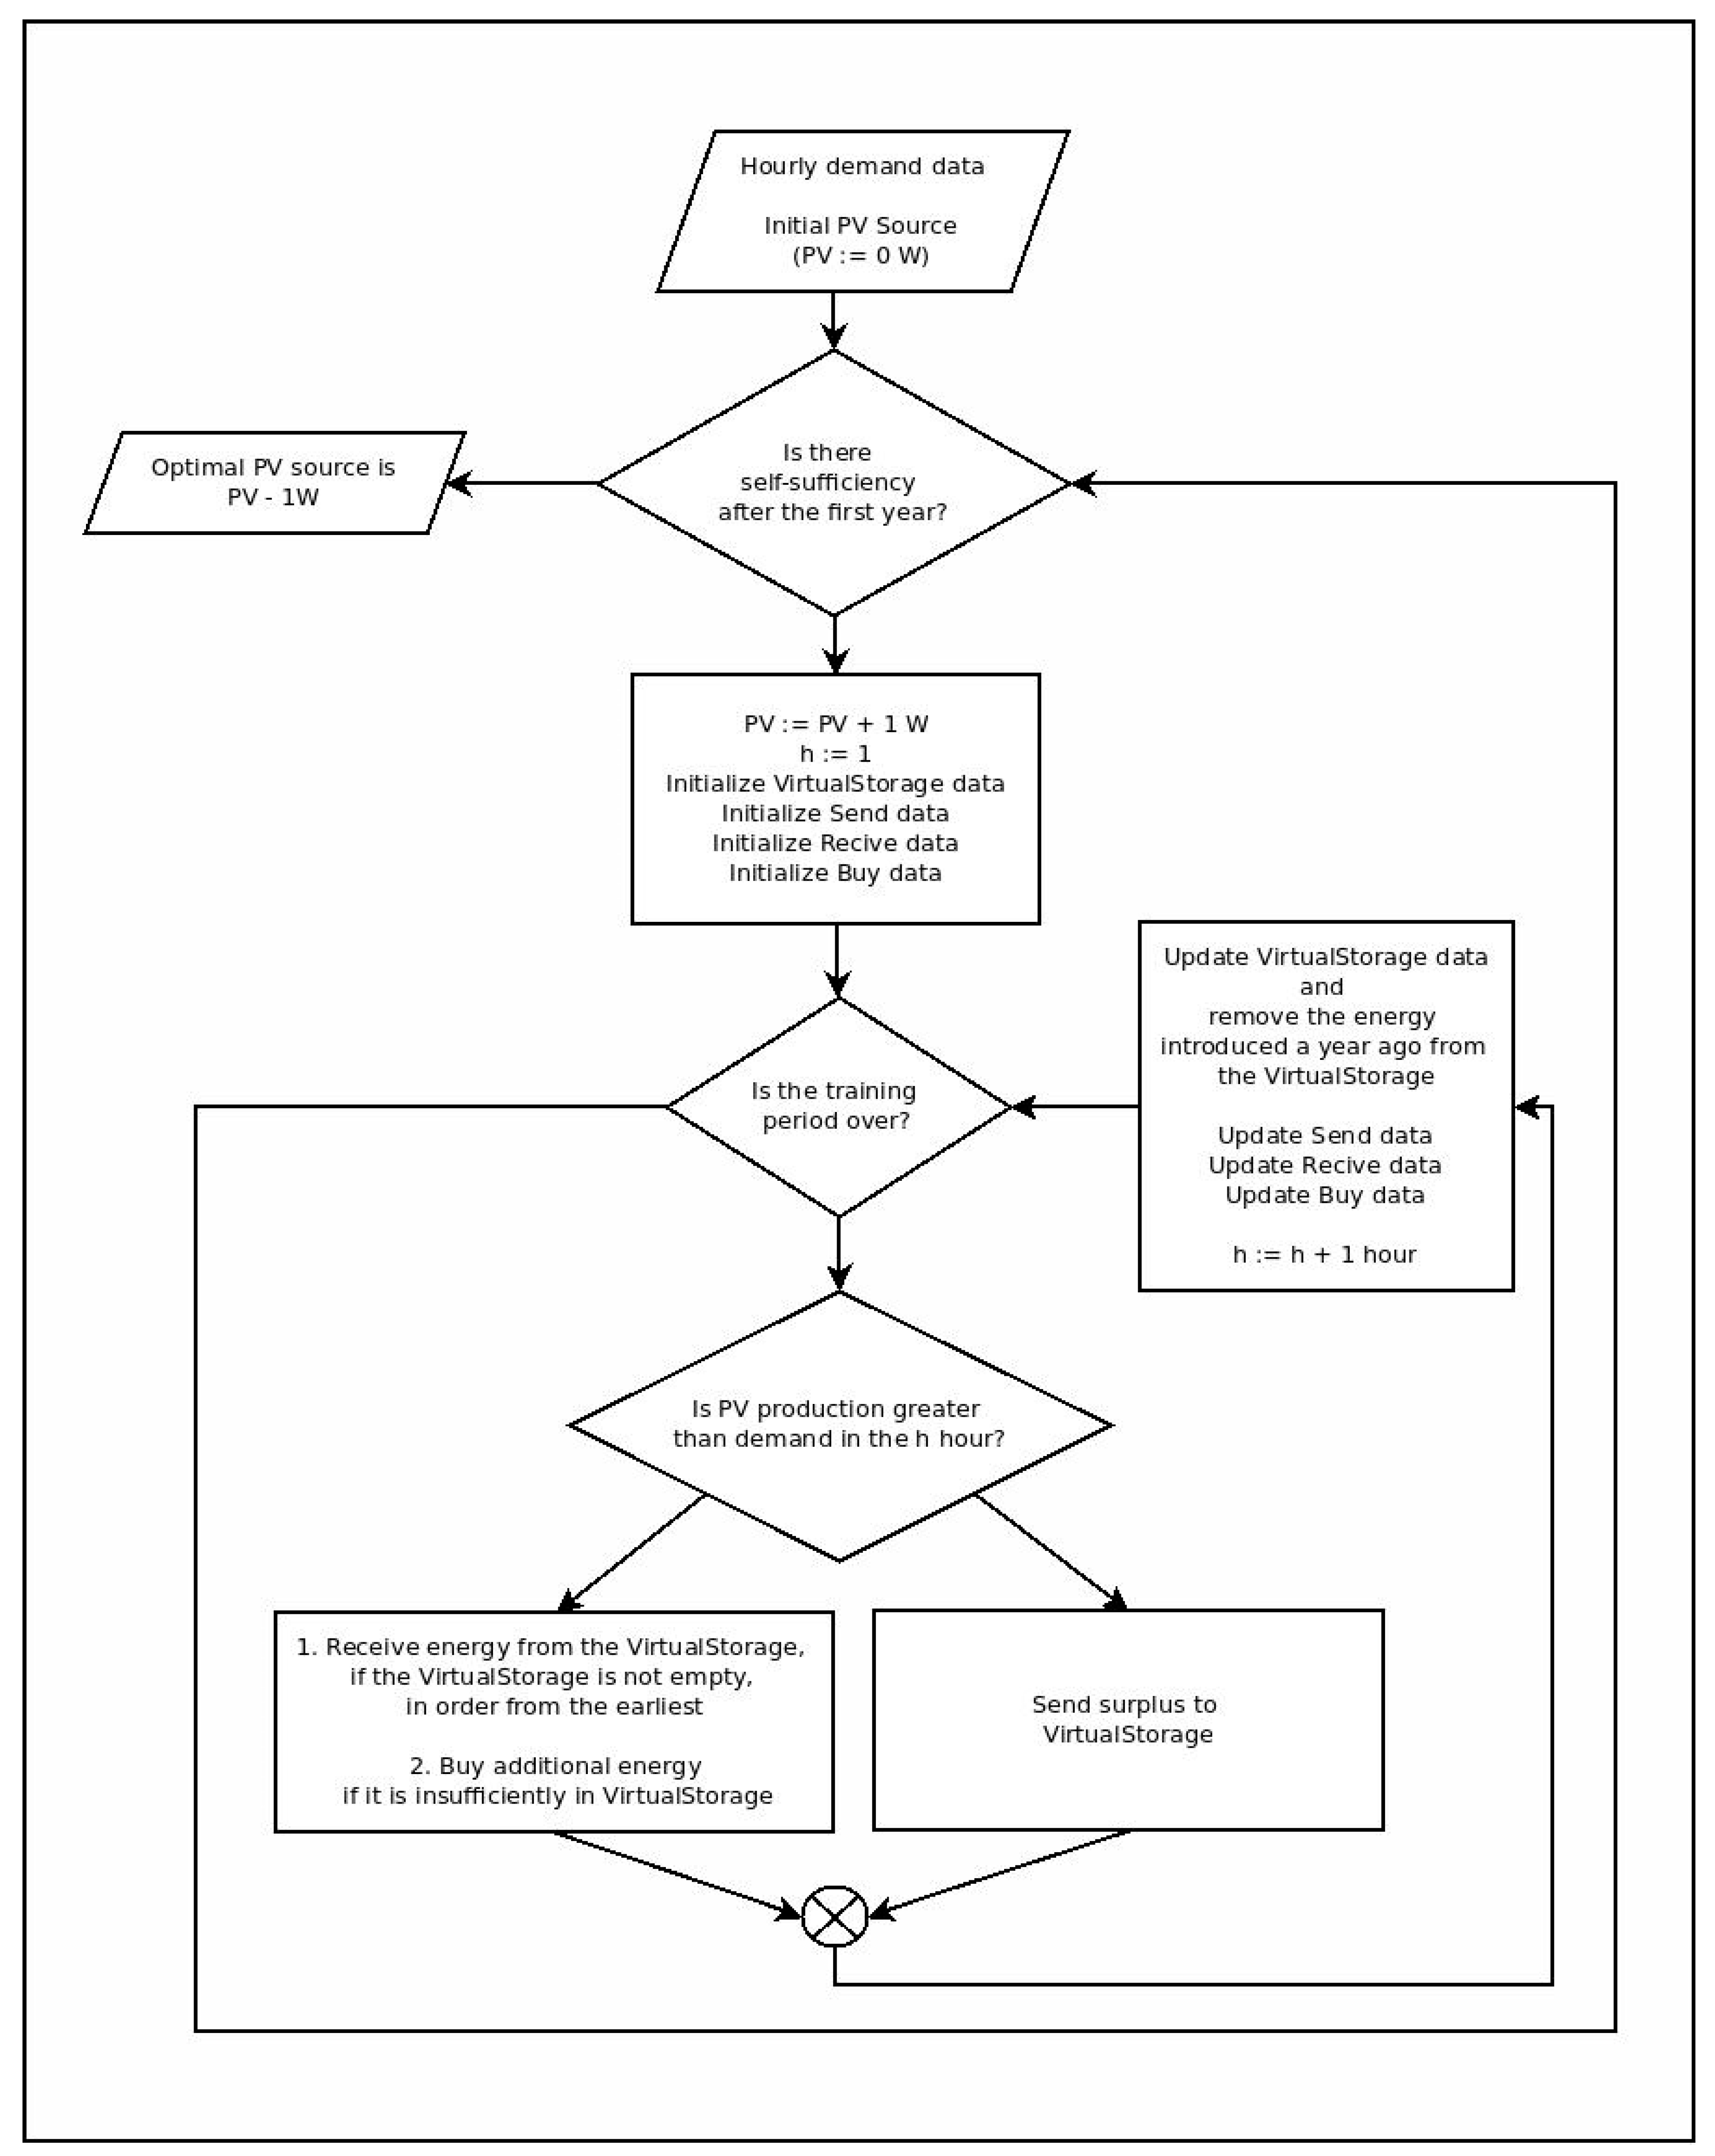
- Optimization assumption: minimization of off-take from the network and maximization of the use of the network deposit (energy fed into the network and available for off-take by the prosumer). It is necessary to stress that the energy fed into the network must be used (taken) by the prosumer within one year of its introduction.
- Assumption regarding the period analyzed: The first lockdown in Poland took place in March 2020. The availability of actual electricity consumption metering data in the period from March 2018 to March 2021 made it possible to move the “analysis window” to the period from March to March. This assumption was made for the purpose of easier interpretation of the results of the analyses.
- Assumptions regarding prices—depending on the scenario analyzed, the following price and cost indicators were considered:
- RCE (Market Energy Price) [36]—the price at which the prosumer sells surplus energy under the CASE_4 scenario.
- FIXING_I price [37]—the price at which the prosumer sells surplus energy under the CASE_3 scenario.
- CRK (Competitive Market Price) [38]—the price at which the prosumer sells surplus energy under CASE_1.
- distribution cost [39]—the components of distribution rates valid for a given year (2018, 2019 and 2020) were taken into account: (i) variable component of the network rate, (ii) quality rate, (iii) cogeneration fee charged to the consumer when purchasing electricity from the network. For the analyses, the rates specific to the operator to the network of which the analyzed consumers are connected were used. Due to the NDA with the operator, its identity remains undisclosed. The distribution cost was used in CASE_0 and 2 scenarios to settle the purchase of energy from outside the network deposit and in CASE_1, 3 and 4 scenarios to settle the purchase of energy from the network.
- purchase cost [39]—the rates of electricity selling prices incurred by the analyzed customers, applicable to a given year (2018, 2019 and 2020), were taken into account. The analyses were based on rates specific to the sales company with which the given consumer had signed a comprehensive electricity sales agreement. Due to the NDA concluded with the sales company, its identity remains undisclosed. The price was used in CASE_0 and 2 scenarios to settle the purchase of energy from outside the network deposit and for CASE_1, 3 and 4 scenarios to settle the purchase of energy from the network.
- Assumption regarding the sample—consumption input data: The consumers were selected for analyses taking into account the following criteria:
- location in rural and urban-rural areas within various administrative districts and within a single voivodeship (the area administered by a voivode, commonly known as the region—Poland consists of sixteen voivodeships [40]), in order to address both location diversity and the impact of implementing COVID-19 pandemic restriction zones.
- availability of actual daily-hourly electricity consumption data for each consumer.
- reflection of the varied nature of the economic activity pursued. The consumers were selected based on their affiliation with one of the following categories: (i) trade and sales, (ii) tourism and sport, (iii) services, (iv) education, (v) food production, (VI) household, (VII) others. This diversity made it possible to assess the mapping of the impact of the COVID-19 pandemic at the level of energy demand for individual sectors and to describe and assess the benefits/losses resulting from implementing one of the four scenarios of prosumer support considered under normal conditions before the pandemic and under stress-test conditions during the COVID-19 pandemic.
- technical and location conditions making it possible to construct a photovoltaic power generation source.
- Assumption concerning the sample-generation input data:
- the selection of the power of the photovoltaic source was based on a numerical algorithm described in the further part of the paper aimed at achieving the consumer’s energy self-sufficiency.
- the analyses for each year assume a zero initial stock of network storage. For this reason, there is increased power consumption from the network in March in every year analyzed.
2.3. Optimization Model
- 1.
- FromVirtualStorage <- function (tmpDemand,VirtualStorage,h){
- 2.
- 3.
- tmpRecive <− 0
- 4.
- idx <- max(1, h--365 × 24)
- 5.
- 6.
- While (tmpReceive < = tmpDemand & idx < h){
- 7.
- if (VirtualStorage[idx>0]){
- 8.
- tmpReceive <- tmpReceive + VirtualStorage[idx]
- 9.
- VirtualStorage[idx] <- 0
- 10.
- }
- 11.
- idx <- idx + 1
- 12.
- }
- 13.
- 14.
- if(tmpReceive>tmpDemand){
- 15.
- VirtualStorage[idx-1] <- (tmpReceive-tmpDemand)
- 16.
- tmpReceive <- tmpDemand
- 17.
- }
- 18.
- 19.
- return(
- 20.
- list(Receive = tmpReceive,
- 21.
- VirtualStorage = VirtualStorage)
- 22.
- )
- 23.
- 24.
- }
- 25.
- retList <- list()
- 26.
- 27.
- for(Multiplier in seq(1:50,000)){
- 28.
- 29.
- Production <- ProductionProfile*Multiplier
- 30.
- VirtualStorage <- rep(0,length(hours))
- 31.
- Send <- rep(0,length(hours))
- 32.
- Receive <- rep(0,length(hours))
- 33.
- Buy <- rep(0,length(hours))
- 34.
- Demand <- DemandProfile
- 35.
- 36.
- for(h in hours){
- 37.
- 38.
- if(h>24*365)
- 39.
- VirtualStorage [1:(h-365*24)] <- 0
- 40.
- 41.
- if(Demand[h]<=Production[h]){
- 42.
- 43.
- Send[h] <- (Production[h]-Demand[h])
- 44.
- VirtualStorage[h] <- ifelse(Multiplier>10,0,7,0,8)*(Production[h]-Demand[h])
- 45.
- 46.
- }else{
- 47.
- 48.
- ret <- FromVirtualStorage((Demand[h]-Production[h]), VirtualStorage, h)
- 49.
- Receive[h] <- ret$Receive
- 50.
- VirtualStorage <- ret$VirtualStorage
- 51.
- Buy[h] <- max(0, ((Demand[h]-Production[h])—ret$Receive[h]) )
- 52.
- 53.
- }
- 54.
- }
- 55.
- 56.
- retList[[Multiplier]] <- list(
- 57.
- Production = Production,
- 58.
- Demand = Demand,
- 59.
- VirtualStorage = VirtualStorage,
- 60.
- Send = Send,
- 61.
- Receive = Receive,
- 62.
- Buy = Buy
- 63.
- )
- 64.
- }
- 65.
- }
3. Results and Discussion
- The COVID-19 pandemic had a very clear impact on the decrease in the energy demand. Different dynamics of change were recorded depending on the category and type of consumer presented in Table 2. The demand in the pandemic period, i.e., March 2020–March 2021, in relation to the average demand for the period of March 2018–March 2020, decreased for the following types of business activities: (i) Trade and sales—15%, (ii) Tourism and sport—39%, (iii) Services—58%, (iv) Education—19%, (v) Food production—6%, (VI) Others—2%. The only group that recorded an increase in the energy demand was Household—5%. The impact of COVID, visible at the level of individual recipients and branches of the economy, is a global phenomenon [46]. On a national scale, it manifests both in the context of the decline in energy demand [47] and the price implications for the wholesale electricity market [48,49].
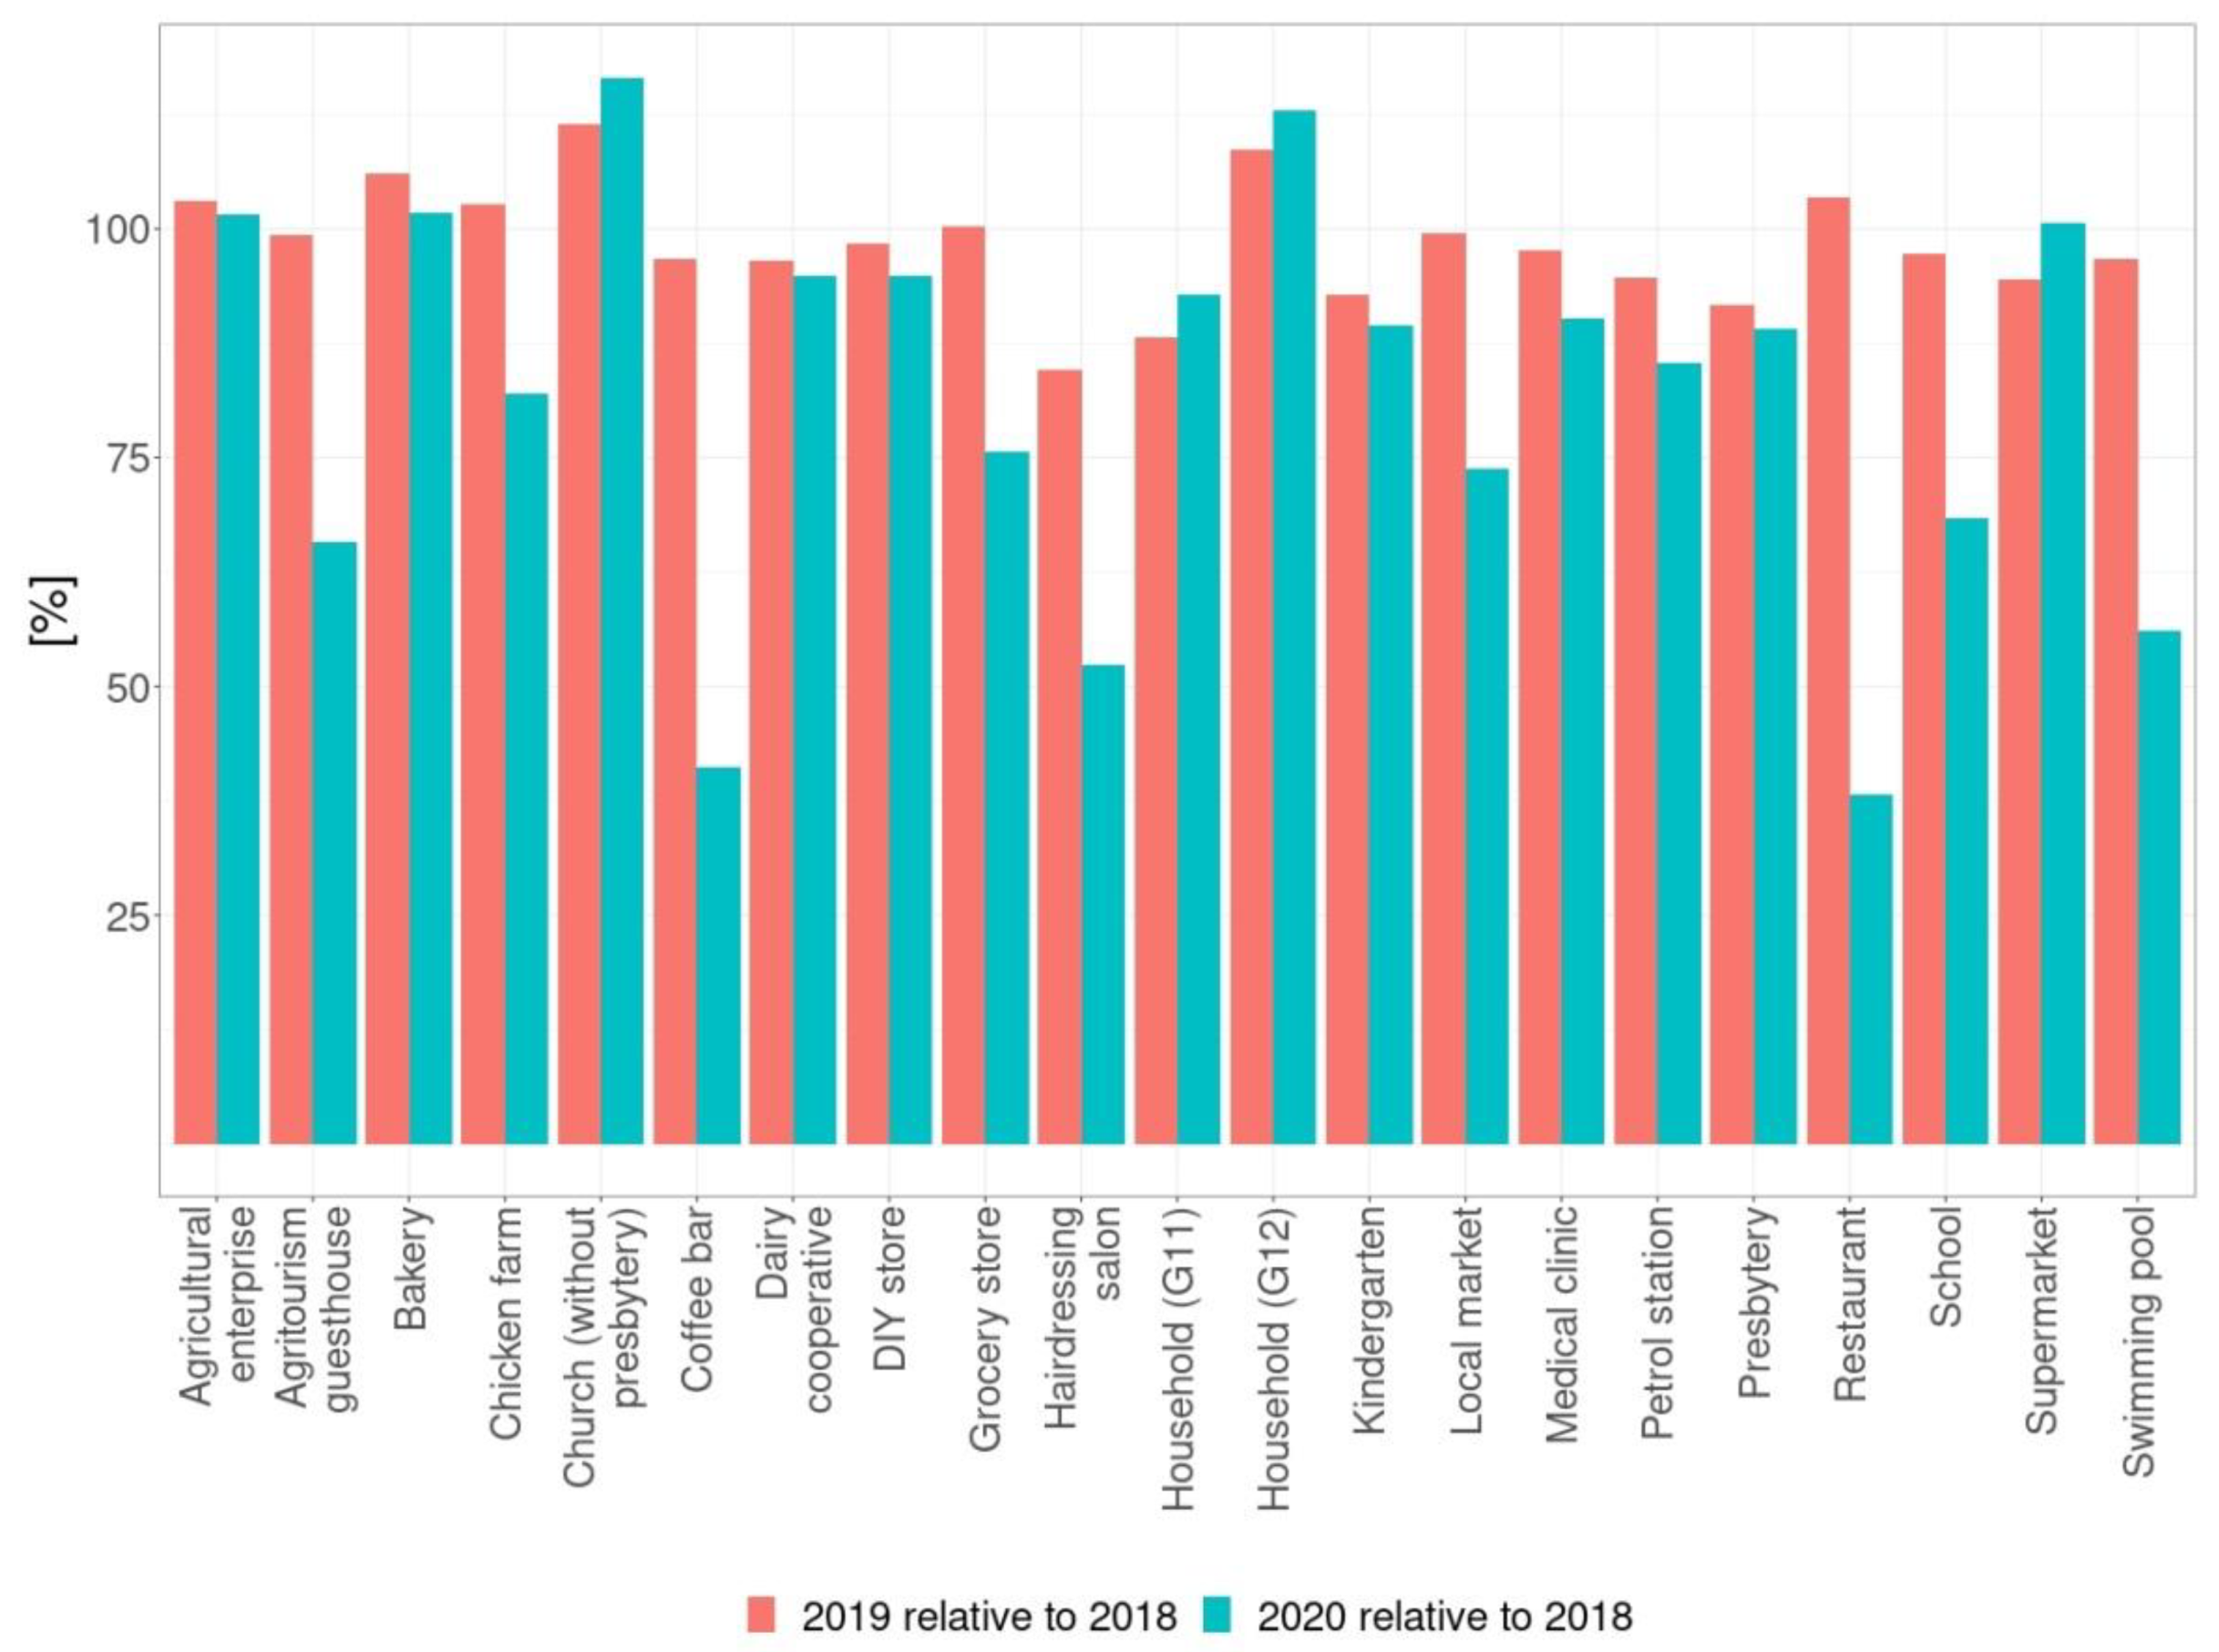
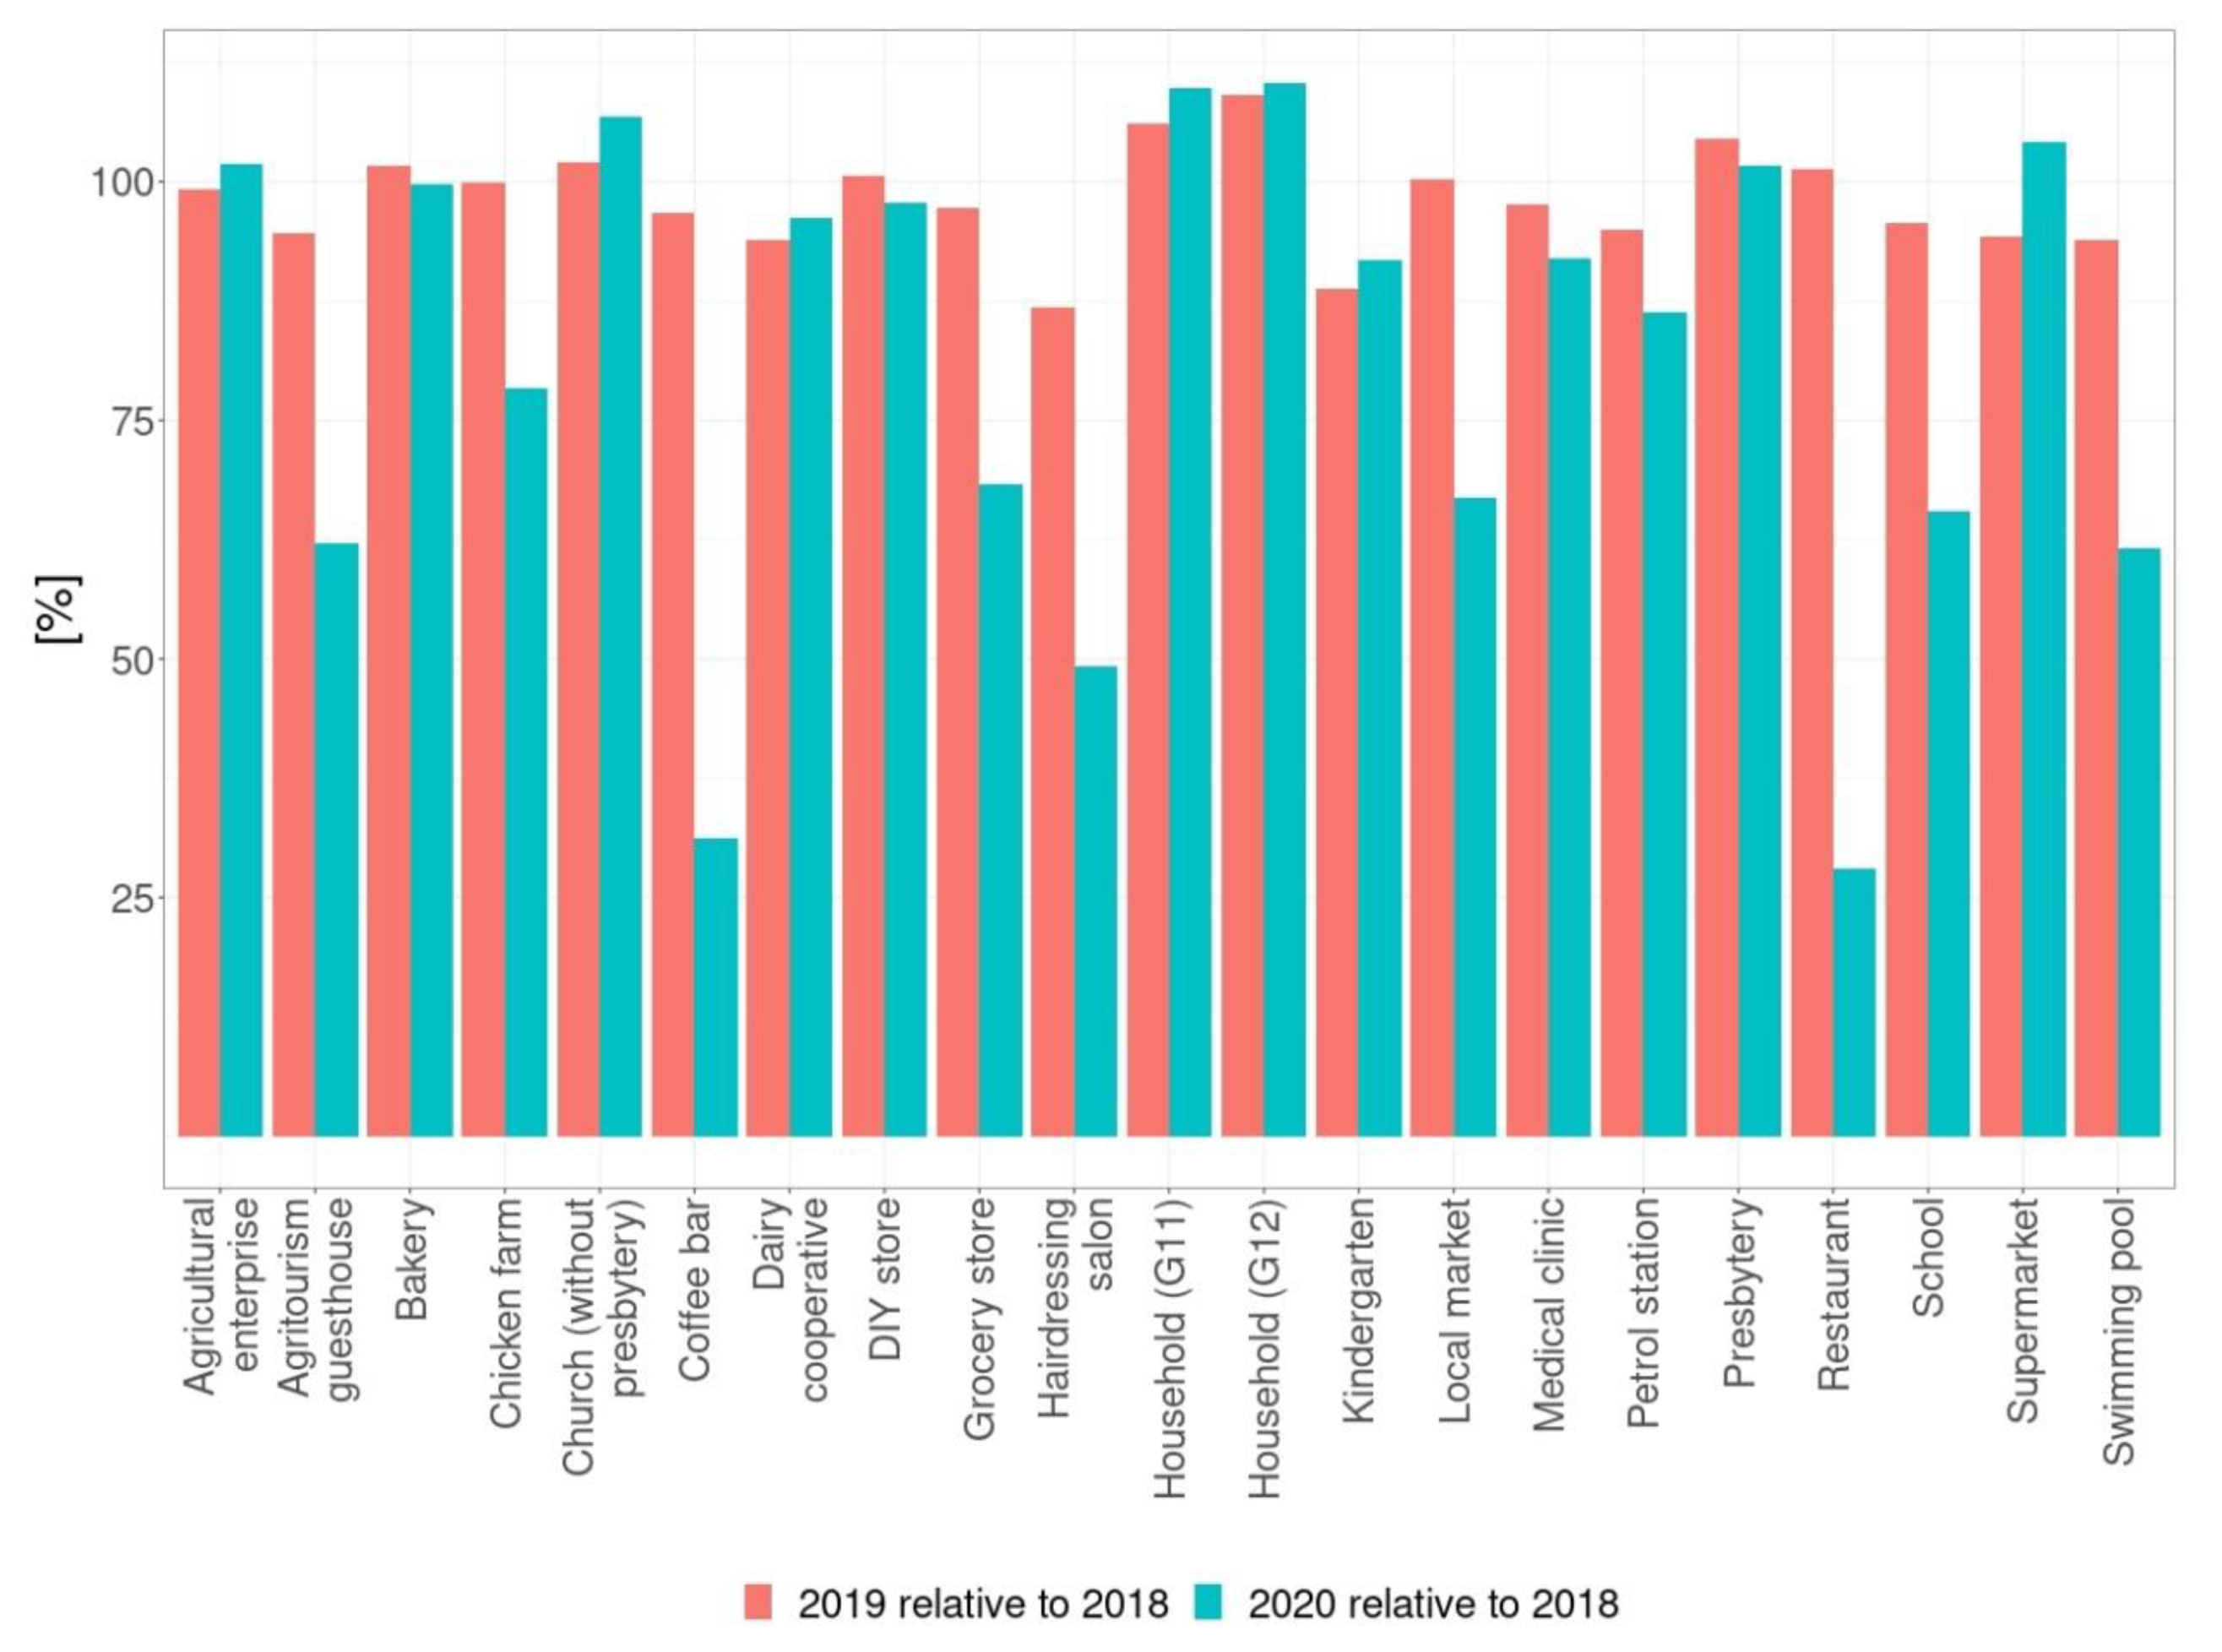
- The in-depth analysis of changes in the electricity consumption structure presented in Figure 2 indicates the existence of large disparities depending on the type of economic activity pursued. The decrease in the consumption was directly affected by the temporary closure of some industries. The highest decreases in demand were recorded for the service sector, including 62% for restaurants, 58% for coffee shops and 43% for hairdressing salons. The lockdown imposed on the tourist and sports sector resulted in energy consumption reduced by 43% for swimming pools and by 34% for agritourism guesthouses. The third most affected group of consumers belongs to the education sector, where schools and kindergartens saw a decrease in energy consumption of 30% and 7%, respectively. An increase in consumption was also observed during the pandemic, in particular in households, up by 9%, as well as in churches by 11% and small supermarkets by 4%.
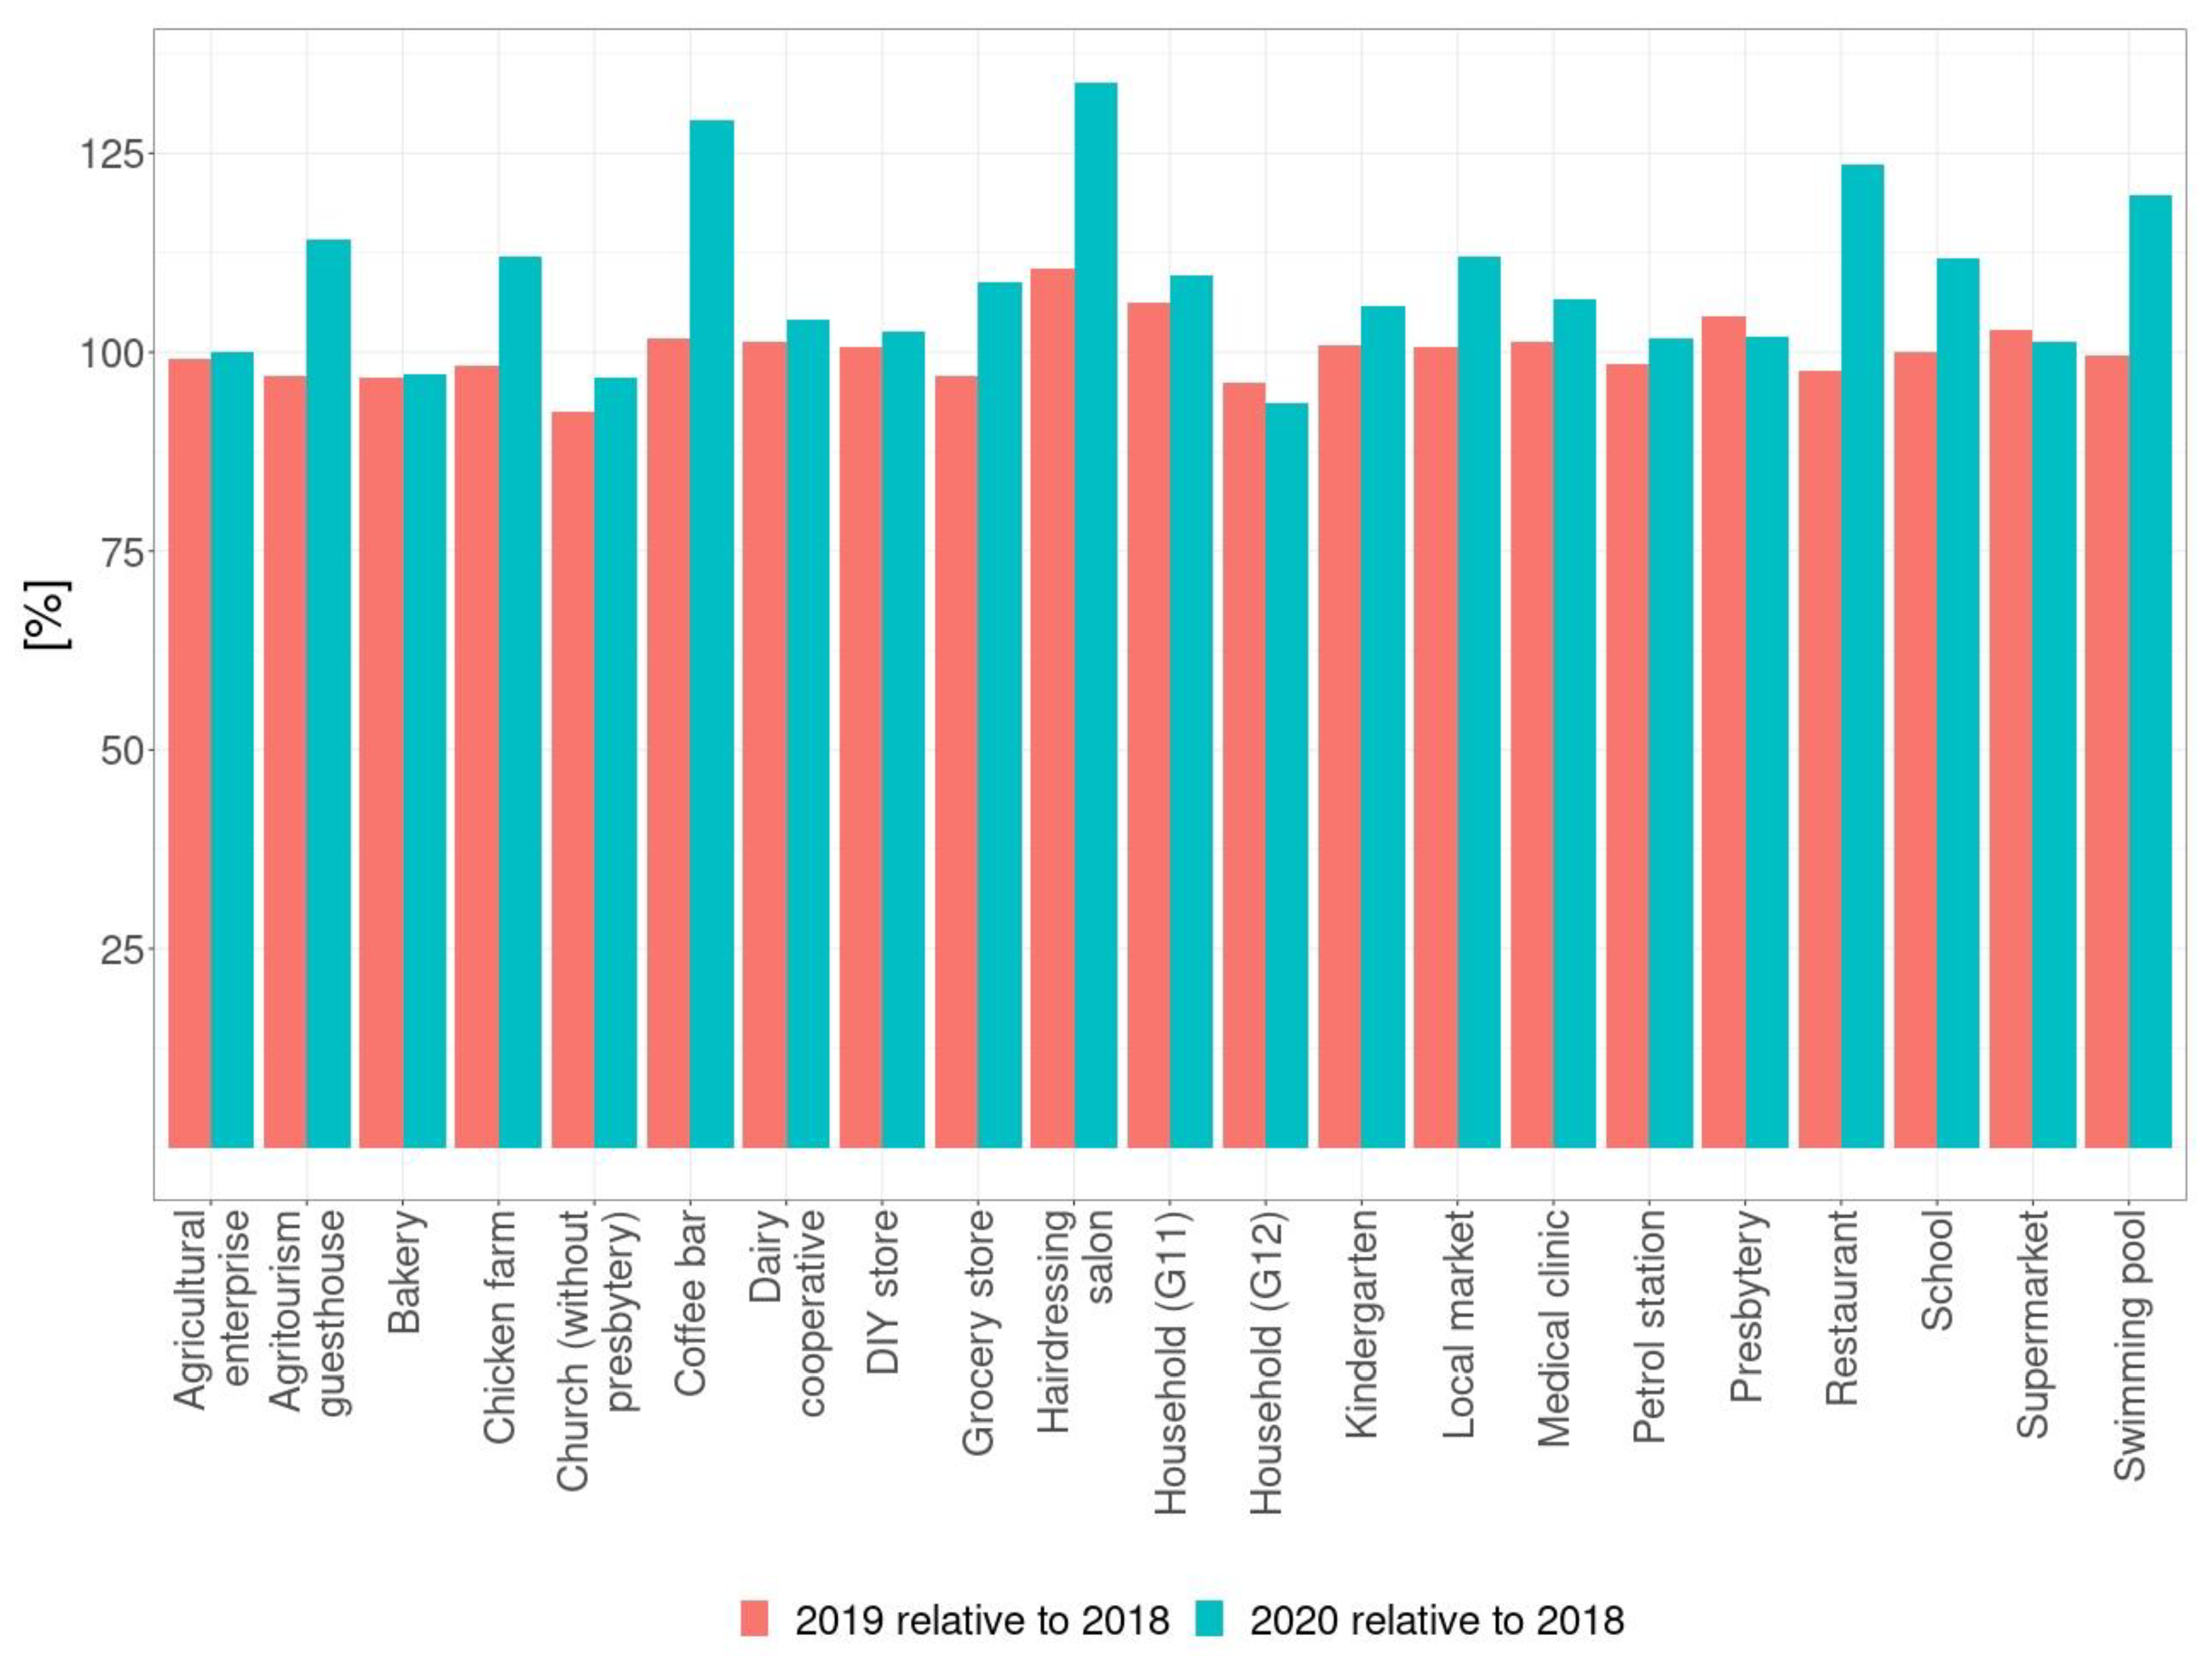
- In addition, the analysis of the energy demand of individual consumers indicates the natural volatility of electricity consumption as illustrated in Figure 3. Increases or decreases in consumption from March 2018 to March 2020 ranged from −12% (decrease for households consuming energy based on a single zone tariff) to +11% (increase for churches—religious buildings). The results of the dynamics of consumption from March 2020 to March 2021 compared to March 2018 to March 2019 are also interesting. The largest decrease, by 62% was for restaurants; its profile is presented in Figure 4. The highest increase in consumption, by as much as 17%, was for church buildings. This increase can be explained by a rise in the number of services in order to allow worshippers to attend mass and to meet the government’s attendance quotas.
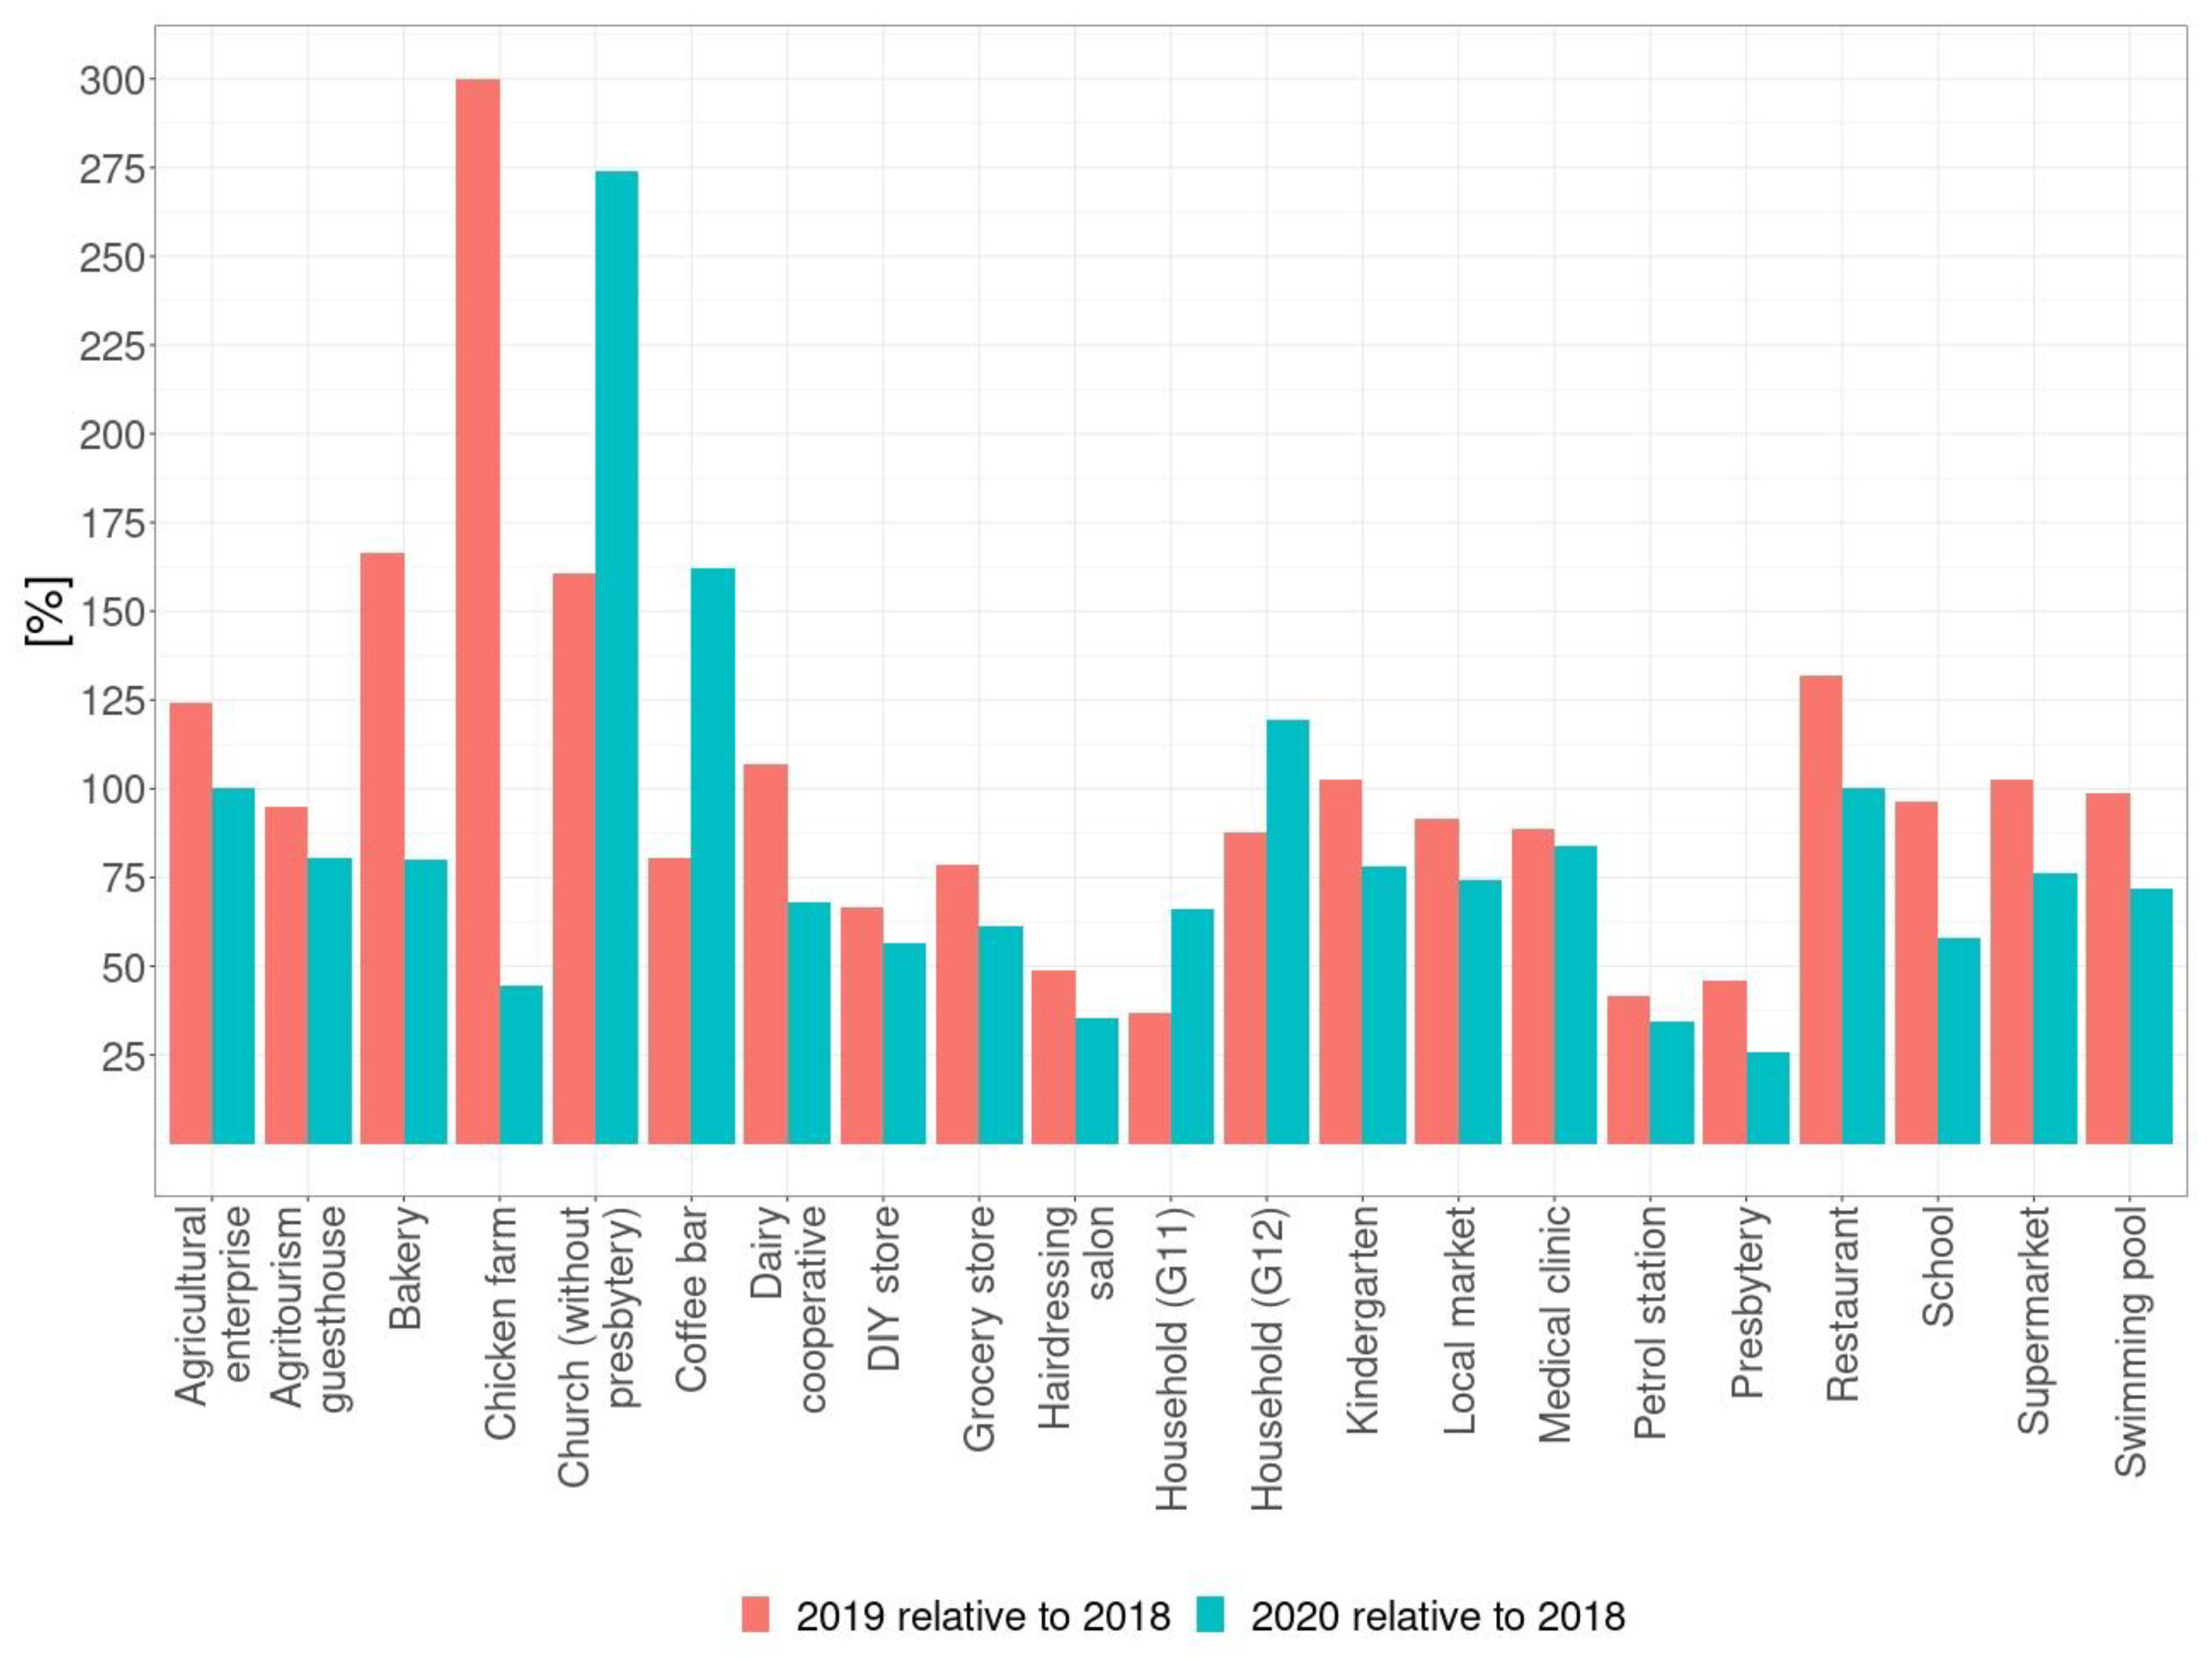
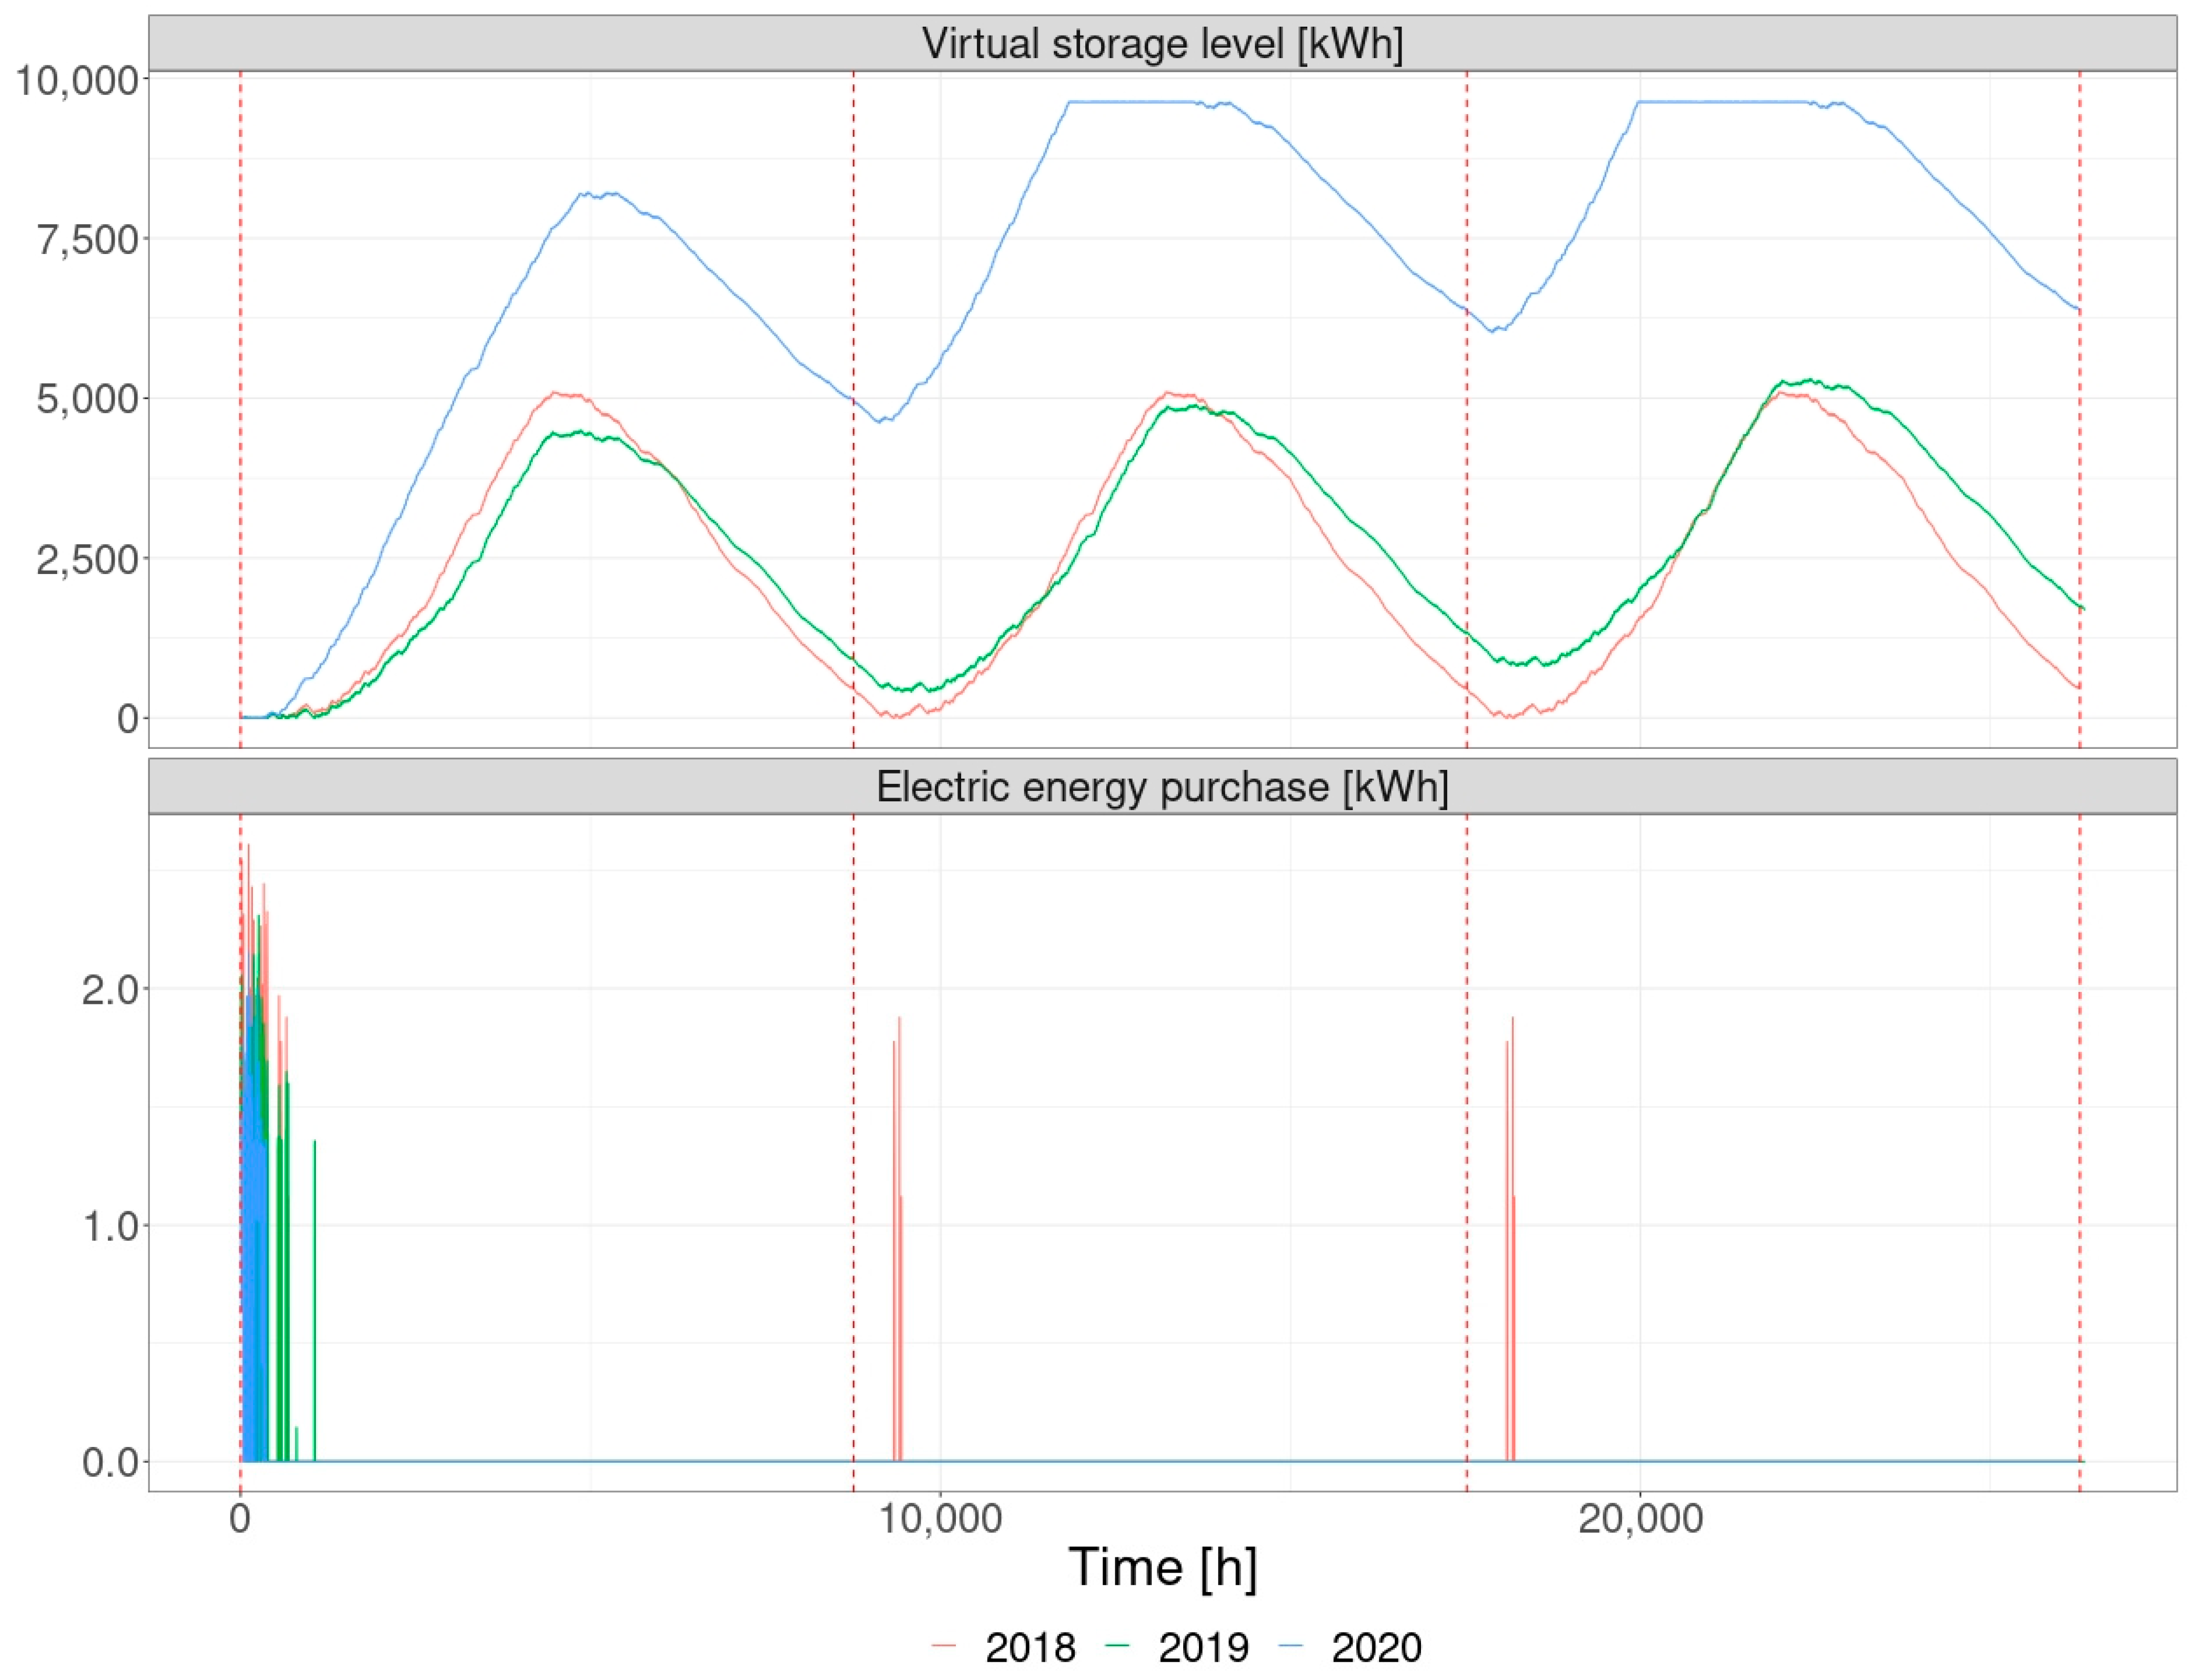
- When affecting the level of electricity demand, the COVID-19 pandemic also resulted in the impossibility of fully using the energy generated from prosumers’ sources, which is illustrated in Figure 5. For March 2020–March 2018 compared to March 2019–March 2018, there is a stabilization of energy exchange with the network. The differences result from the natural volatility and nature of energy consumption in individual sectors of the economy.

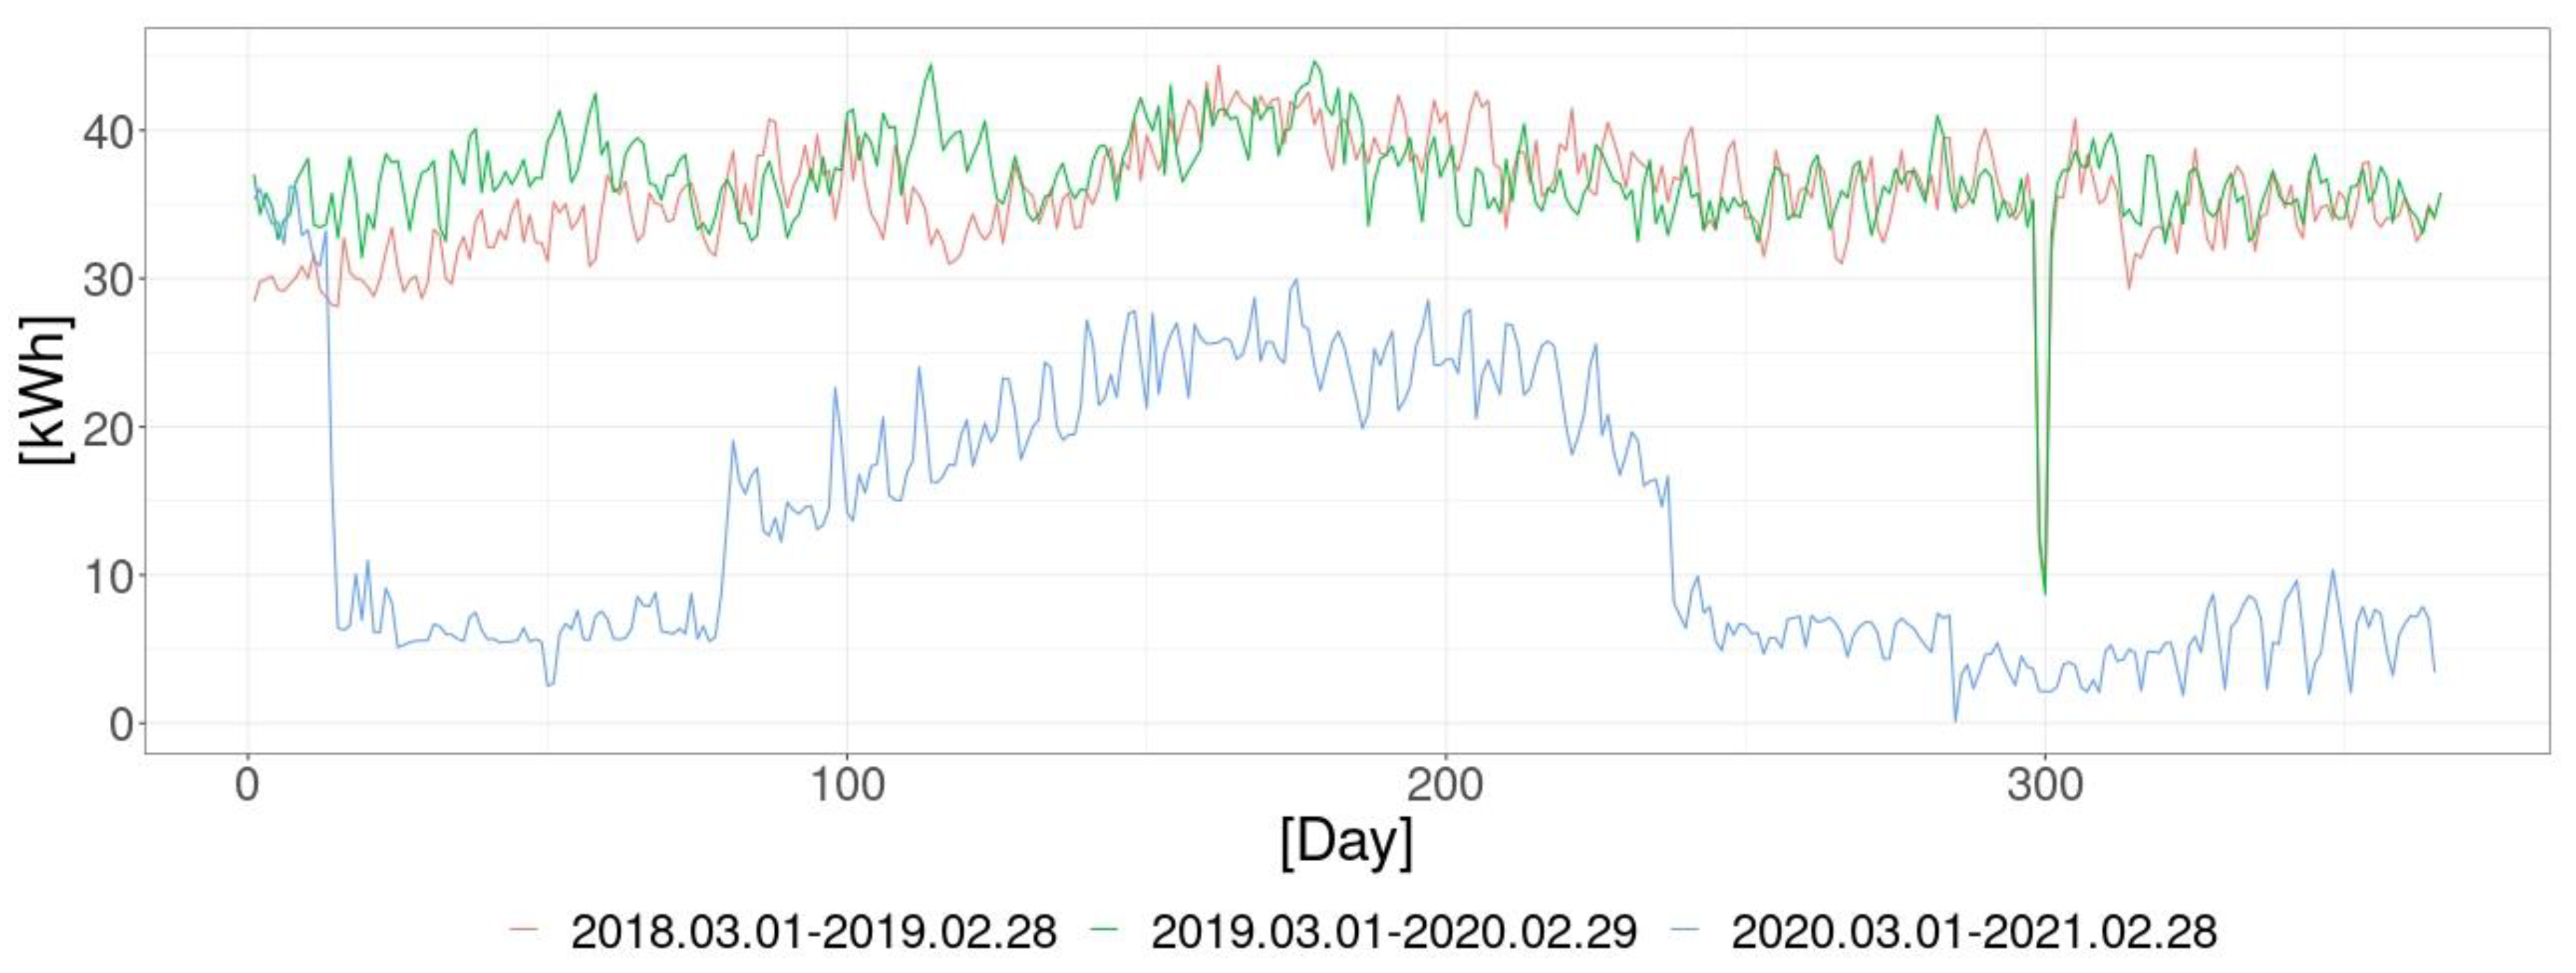
- Simulation of the selection of the generating source to energy self-sufficiency of consumers with a set and actual electricity consumption profile made it possible to map their actual behavior seen both from the technical and economic perspective. An energy consumer with a generating source functions as a prosumer, returning the surplus energy to the network storage (virtual storage) [33] or reselling it to the market under a specific market participation scheme. In each of the scenarios analyzed, there is a bidirectional exchange of electricity with the network. The surplus is either sent to the network storage or resold to the market, and shortages are taken from the network storage at no cost or purchased from the market. The scale of this exchange depends on the energy consumption within the annual billing period and on the correct selection of the generating source’s power. In the cases analyzed, the source’s power was selected so as to minimize the purchase of energy from outside the network storage for the discount model (case_0). Figure 6 shows the consumption/purchase of electricity from the distribution network. It is worth noting that despite the pandemic and reduction in the electricity consumption, some prosumers are experiencing an increase in the purchase of energy from the network, which is a consequence of consumption in low generation periods.
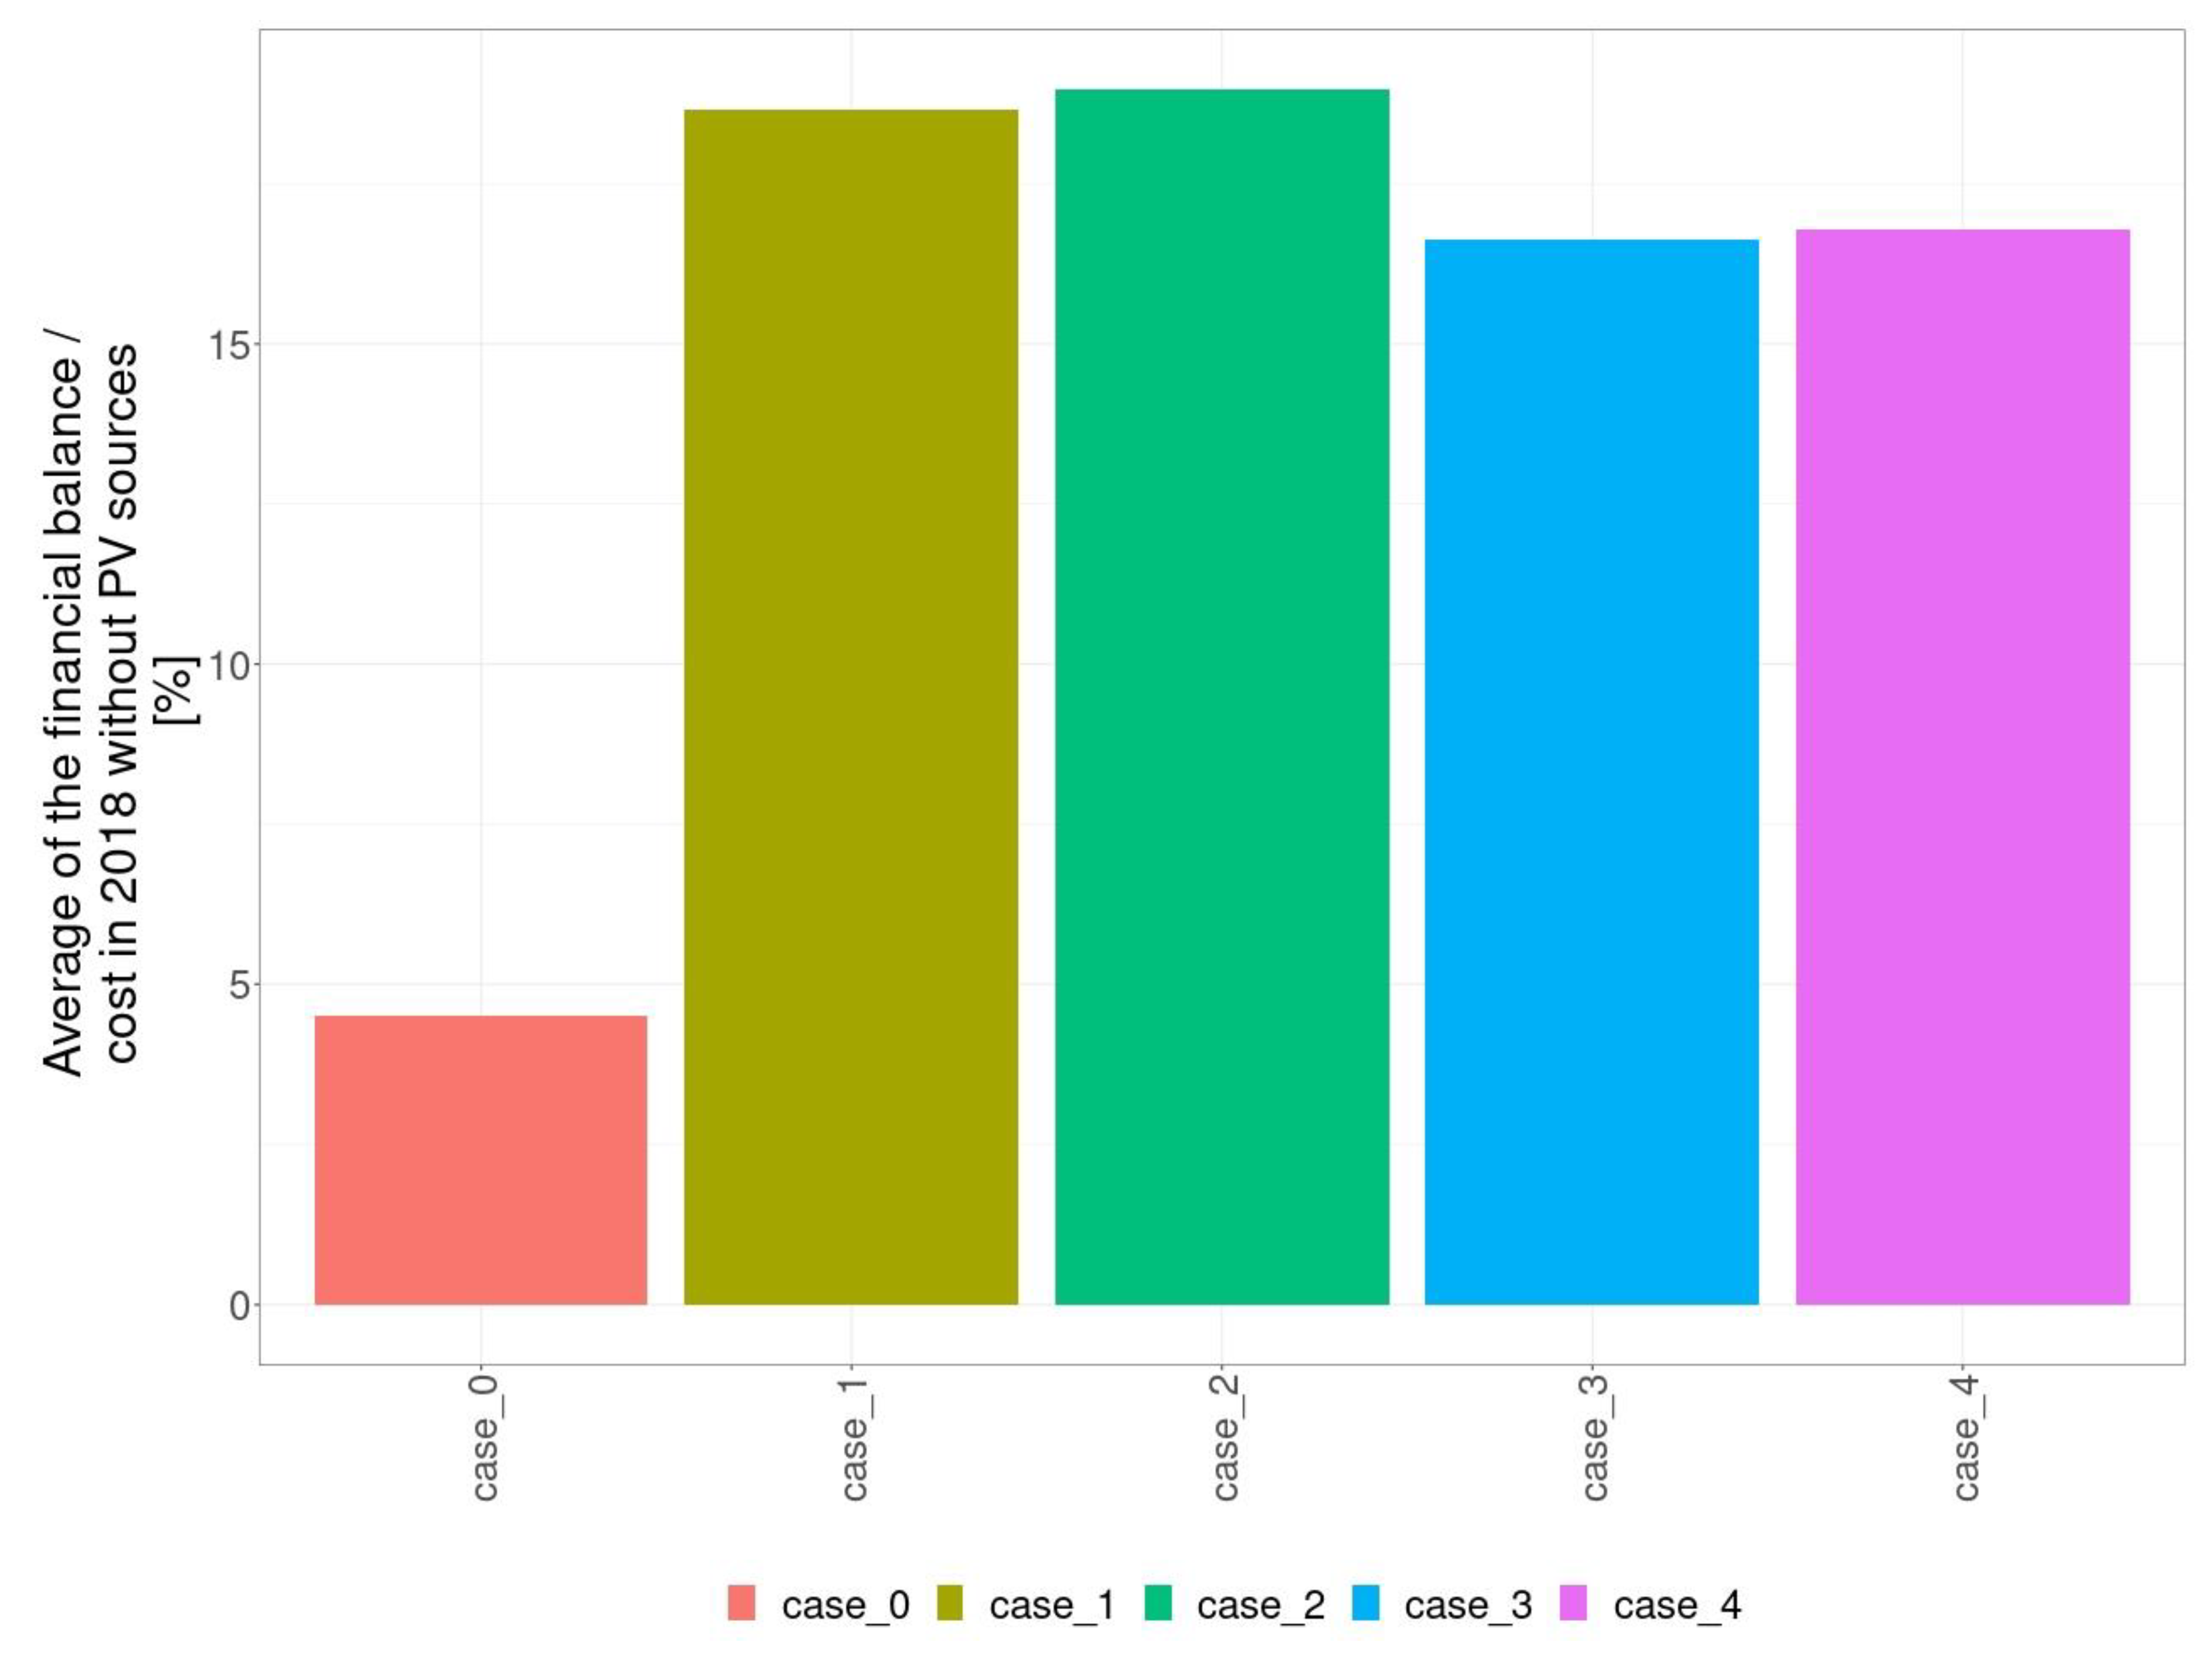
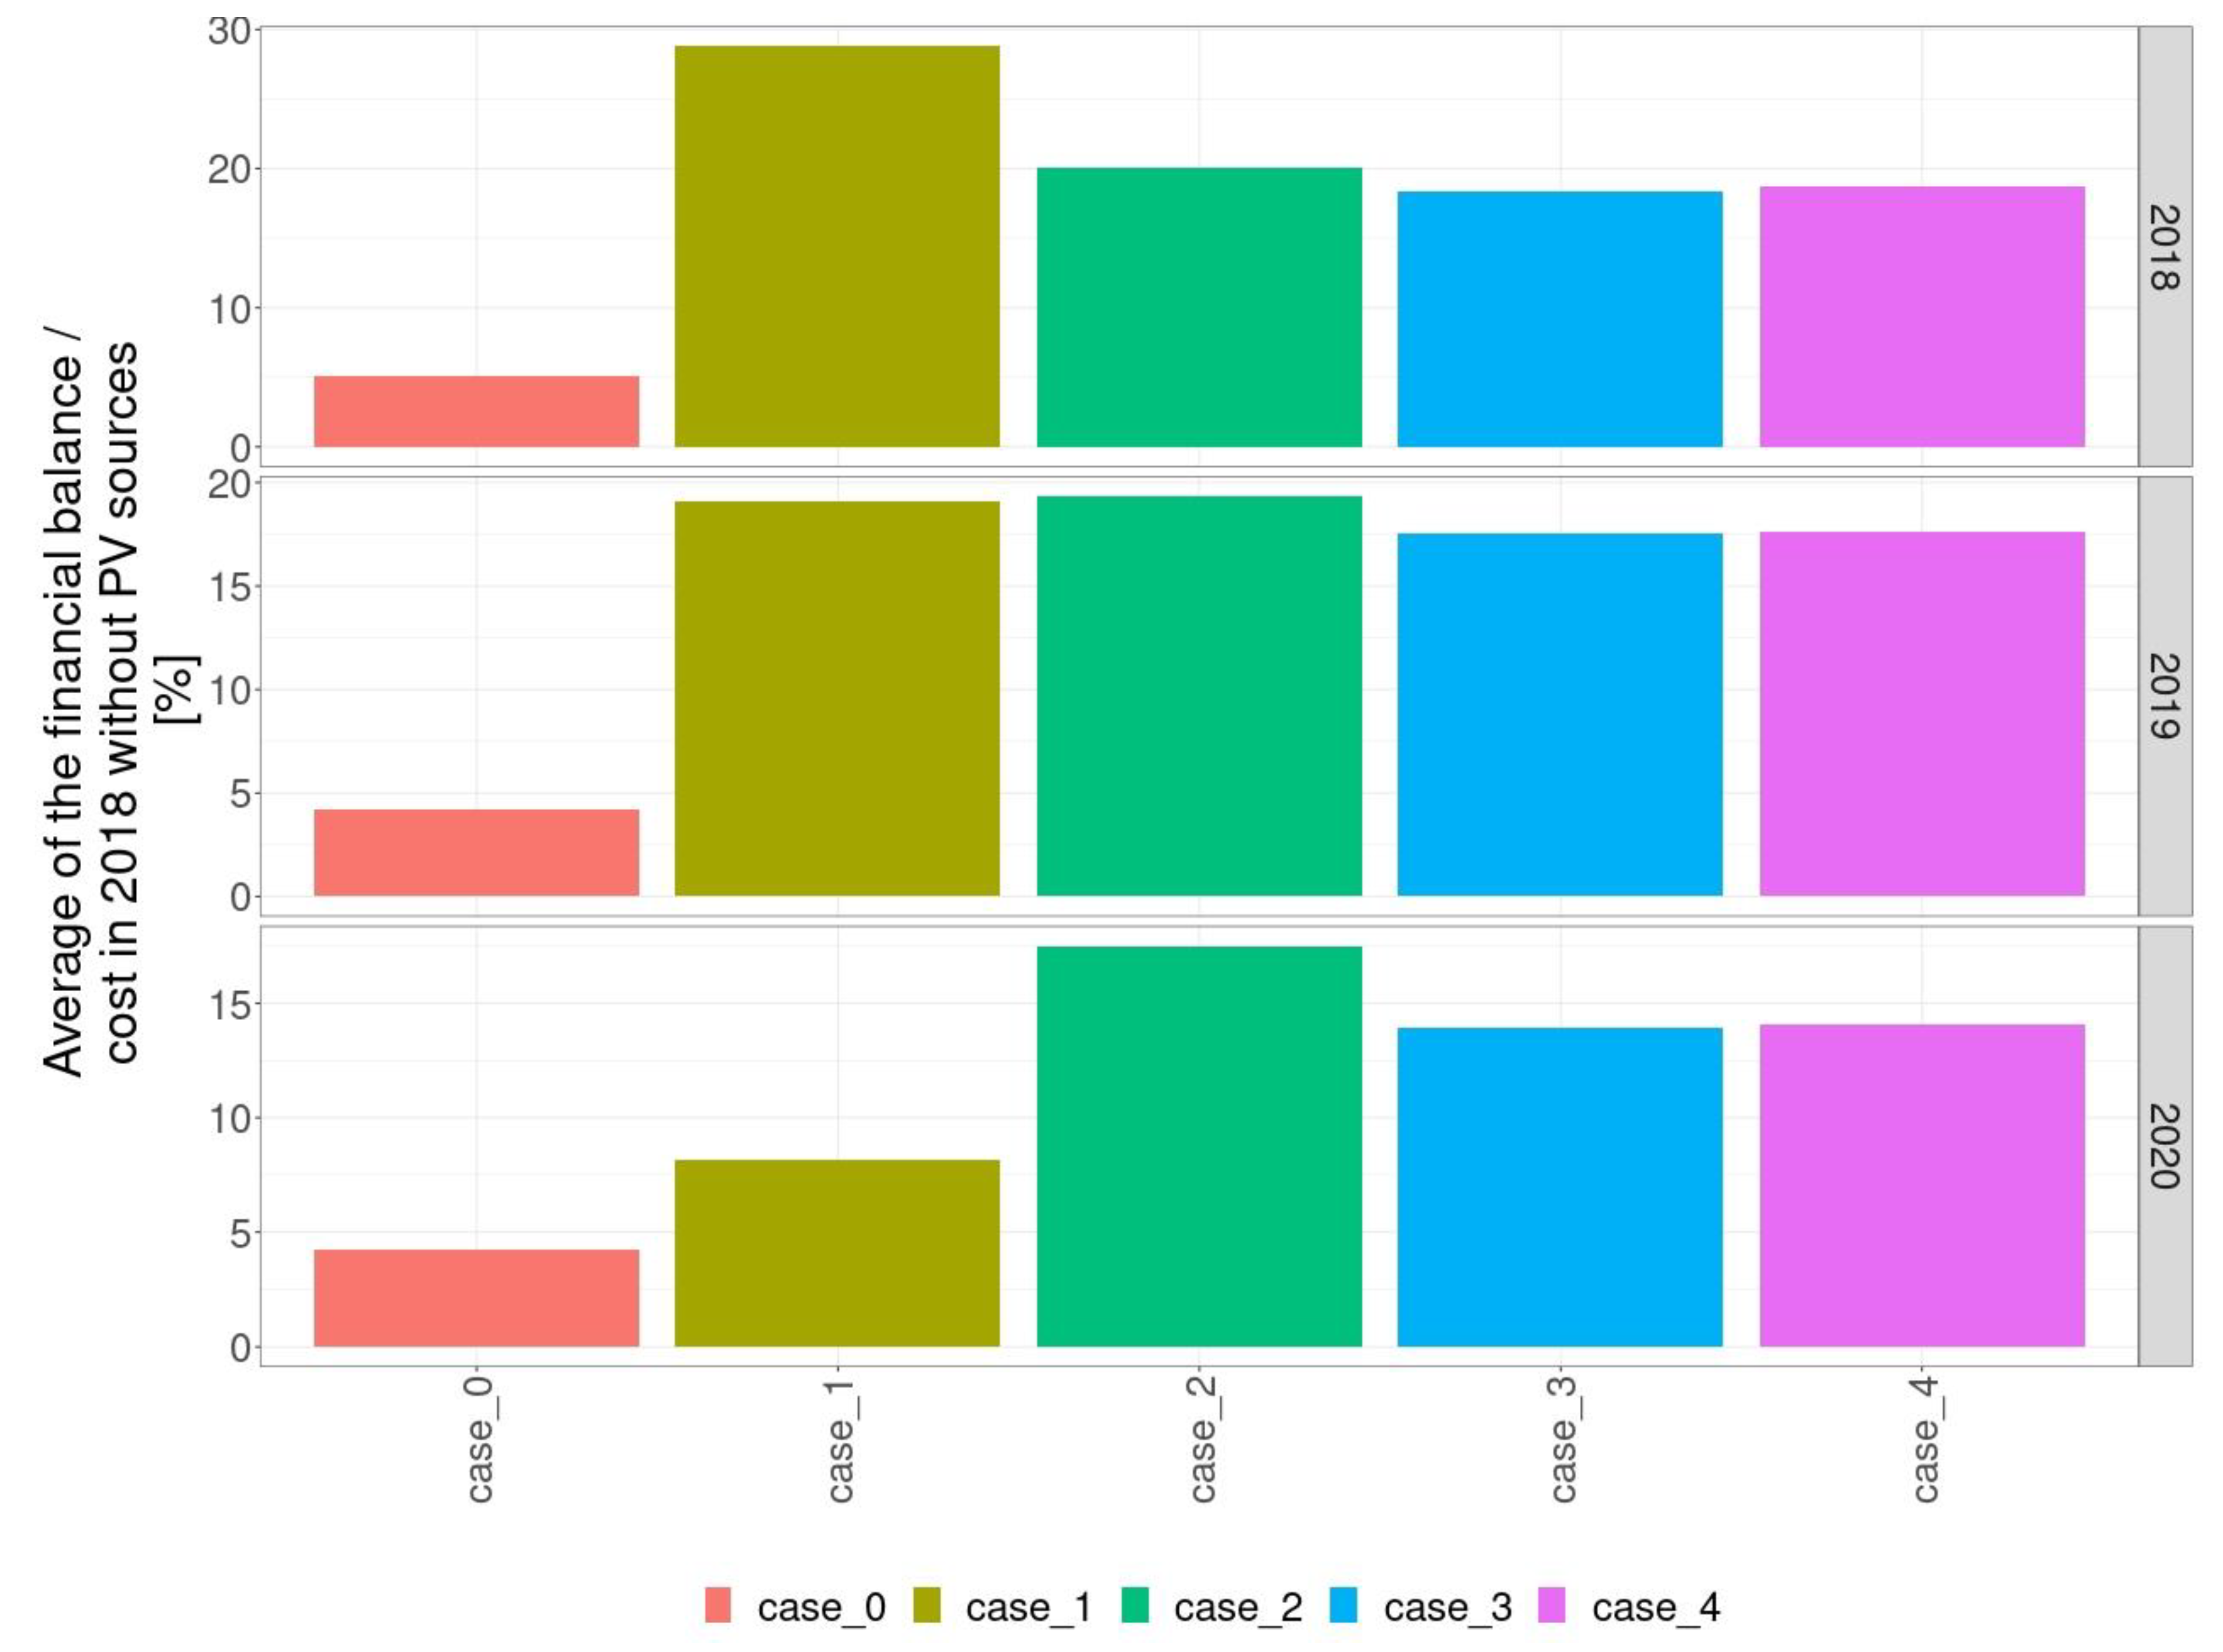
- In Poland, the distribution and transmission network operators diagnosed a negative impact of prosumers using photovoltaic sources on the network’s operation. The consequence of this diagnosis is the emergence of mechanisms alternative to the current prosumer support model and aimed at marketizing the functioning model. On the one hand, there is therefore mention of the high operating costs of the existing support model, which are cross-subsidized and transferred to consumers who are not prosumers, and, on the other hand, it is declared that the new model is to be more beneficial to prosumers. Is a win-win model possible? Figure 8 shows the energy purchase cost for each scenario averaged for the period from March 2018 to March 2021, and for all prosumers analyzed representing various industries in relation to the averaged energy purchase cost by consumers before they became prosumers. The most beneficial effect is the case_0 scenario, reflecting the currently applicable discount model. In this scenario, the average prosumer reduces the electricity purchase cost by 95.5% (only 4.5% of the original cost is left). The least beneficial scenarios include migration to the 1:1 discount model, where the prosumer incurs the full distribution cost for the energy taken (case_2) and the scenario of reselling surplus energy at the CRK and purchase of energy at tariff prices (case_1). For these variants, the average prosumer reduces the electricity purchase cost by 81.5%, still incurring about 18.5% of the original level of energy purchase costs. Nor does the resale of energy at market prices improve the economic performance observed by the prosumer either in the case_3 or case_4 scenarios.
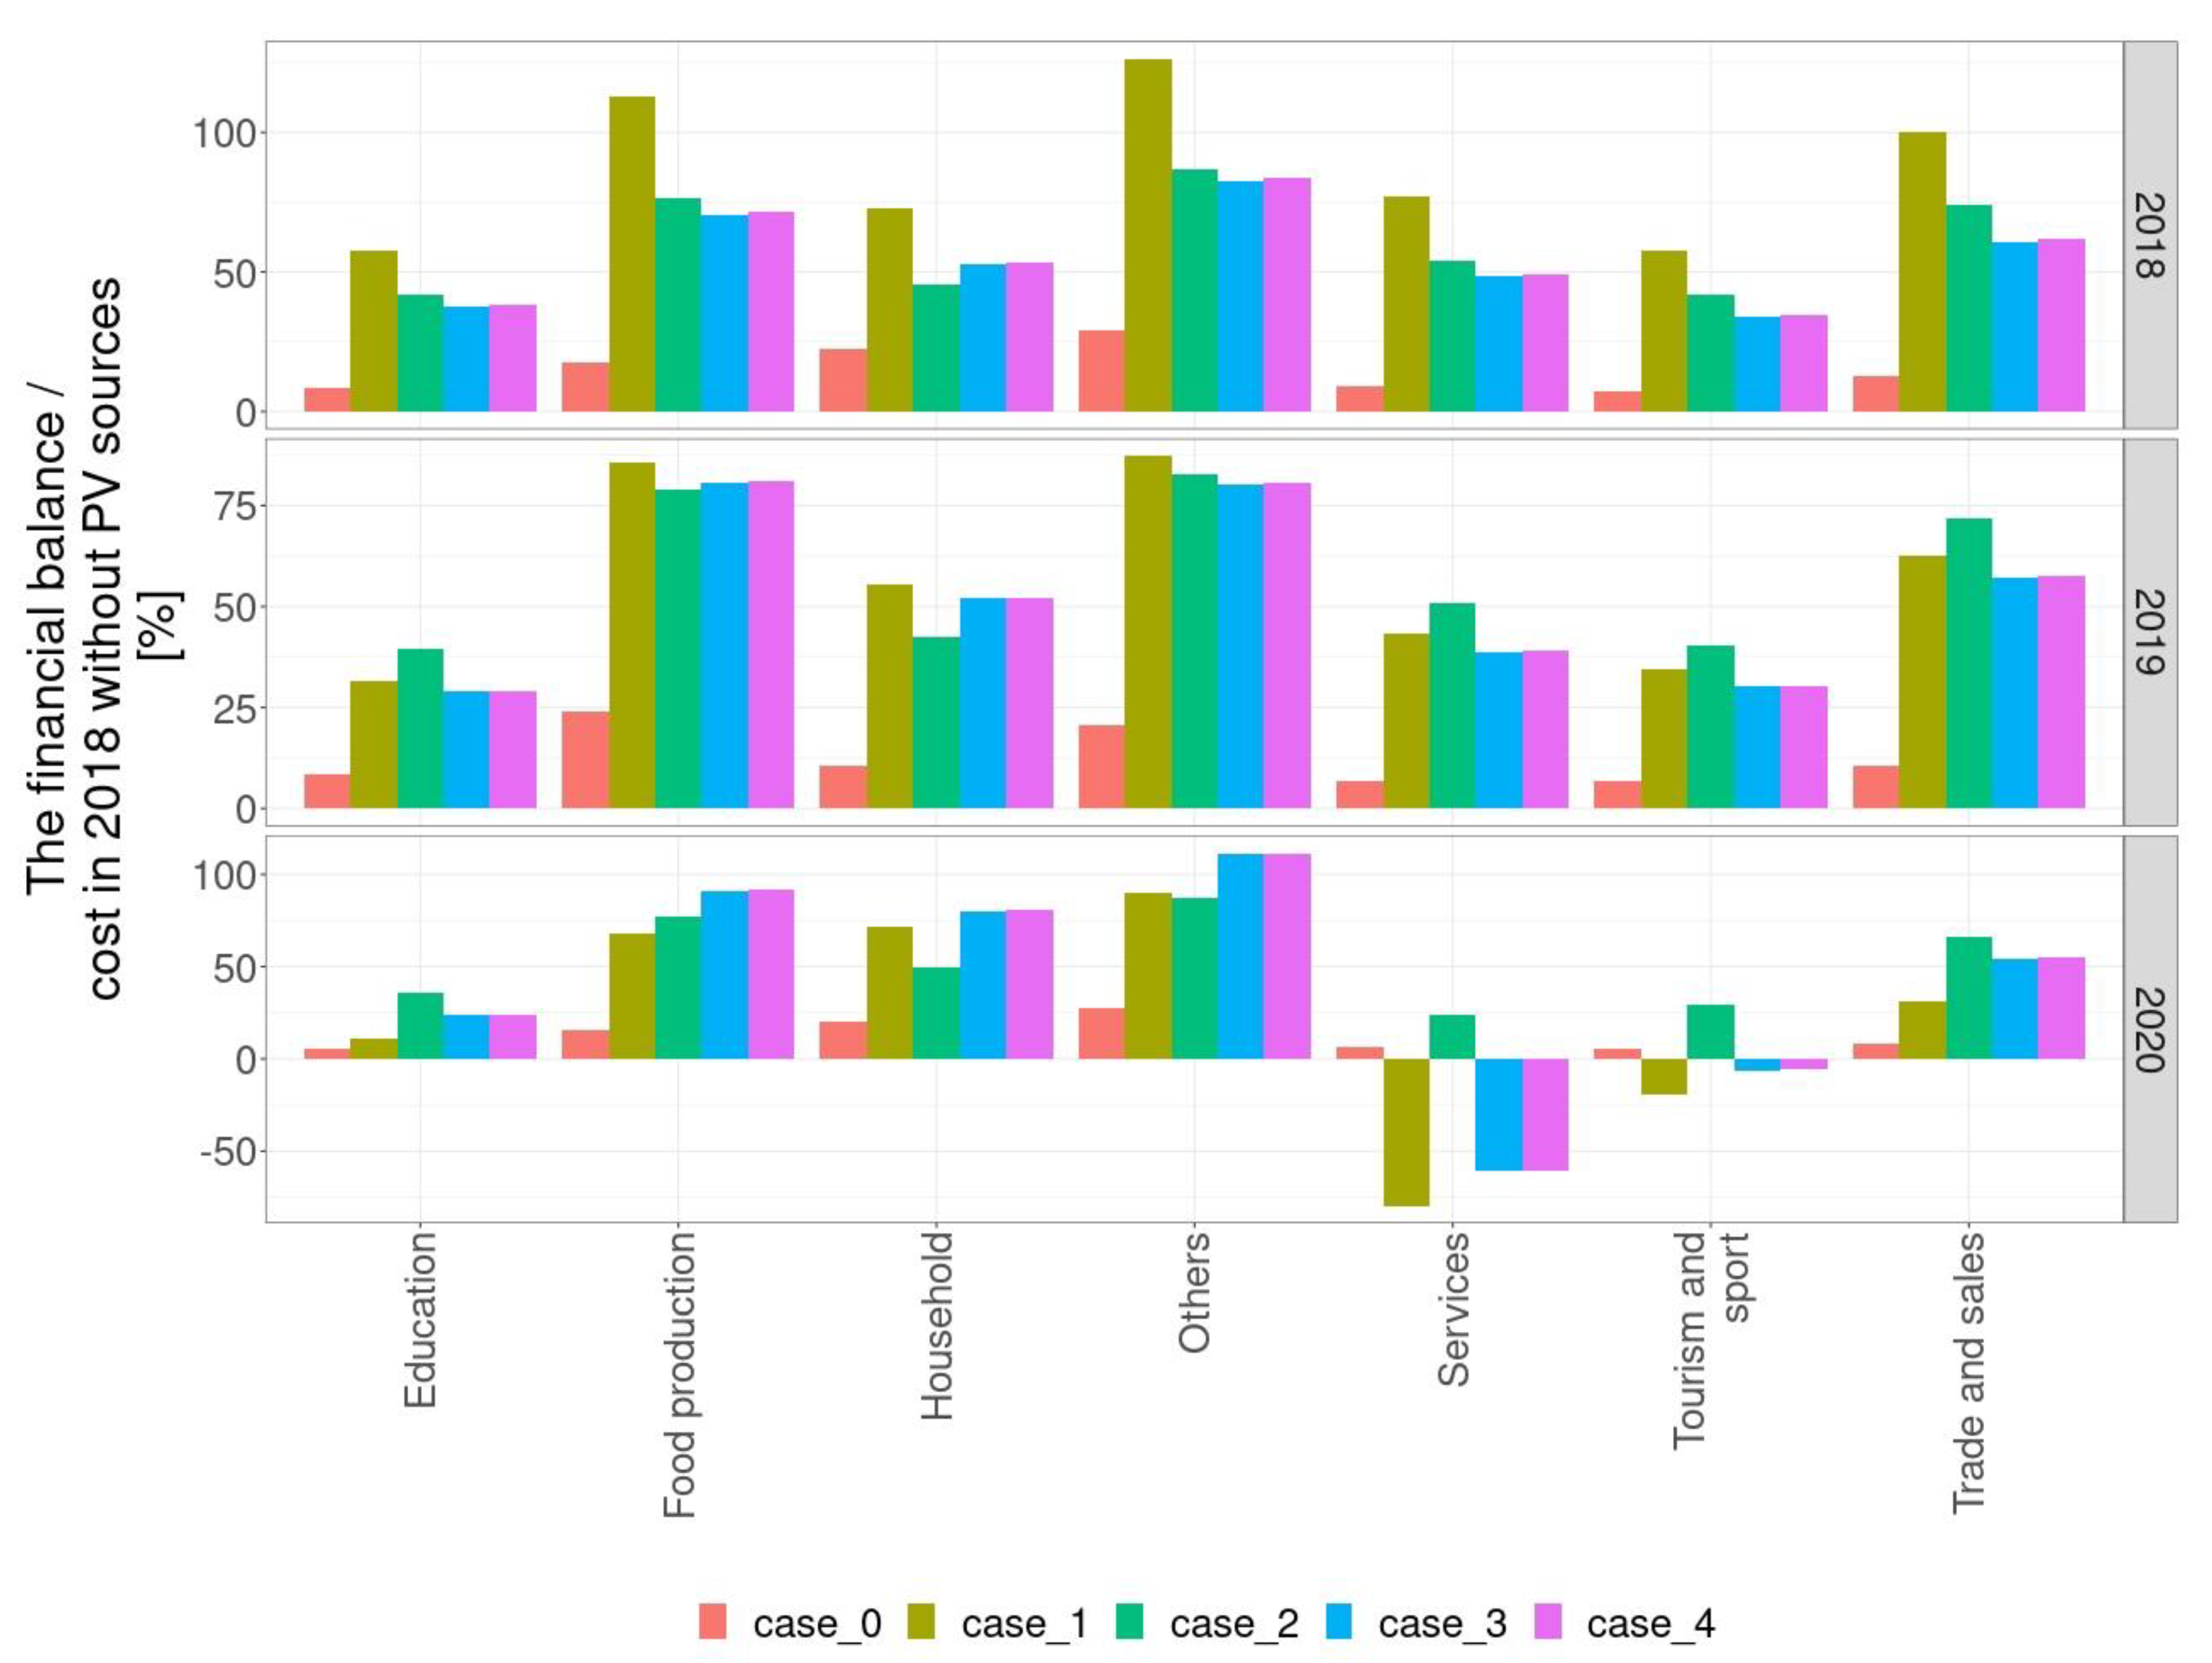
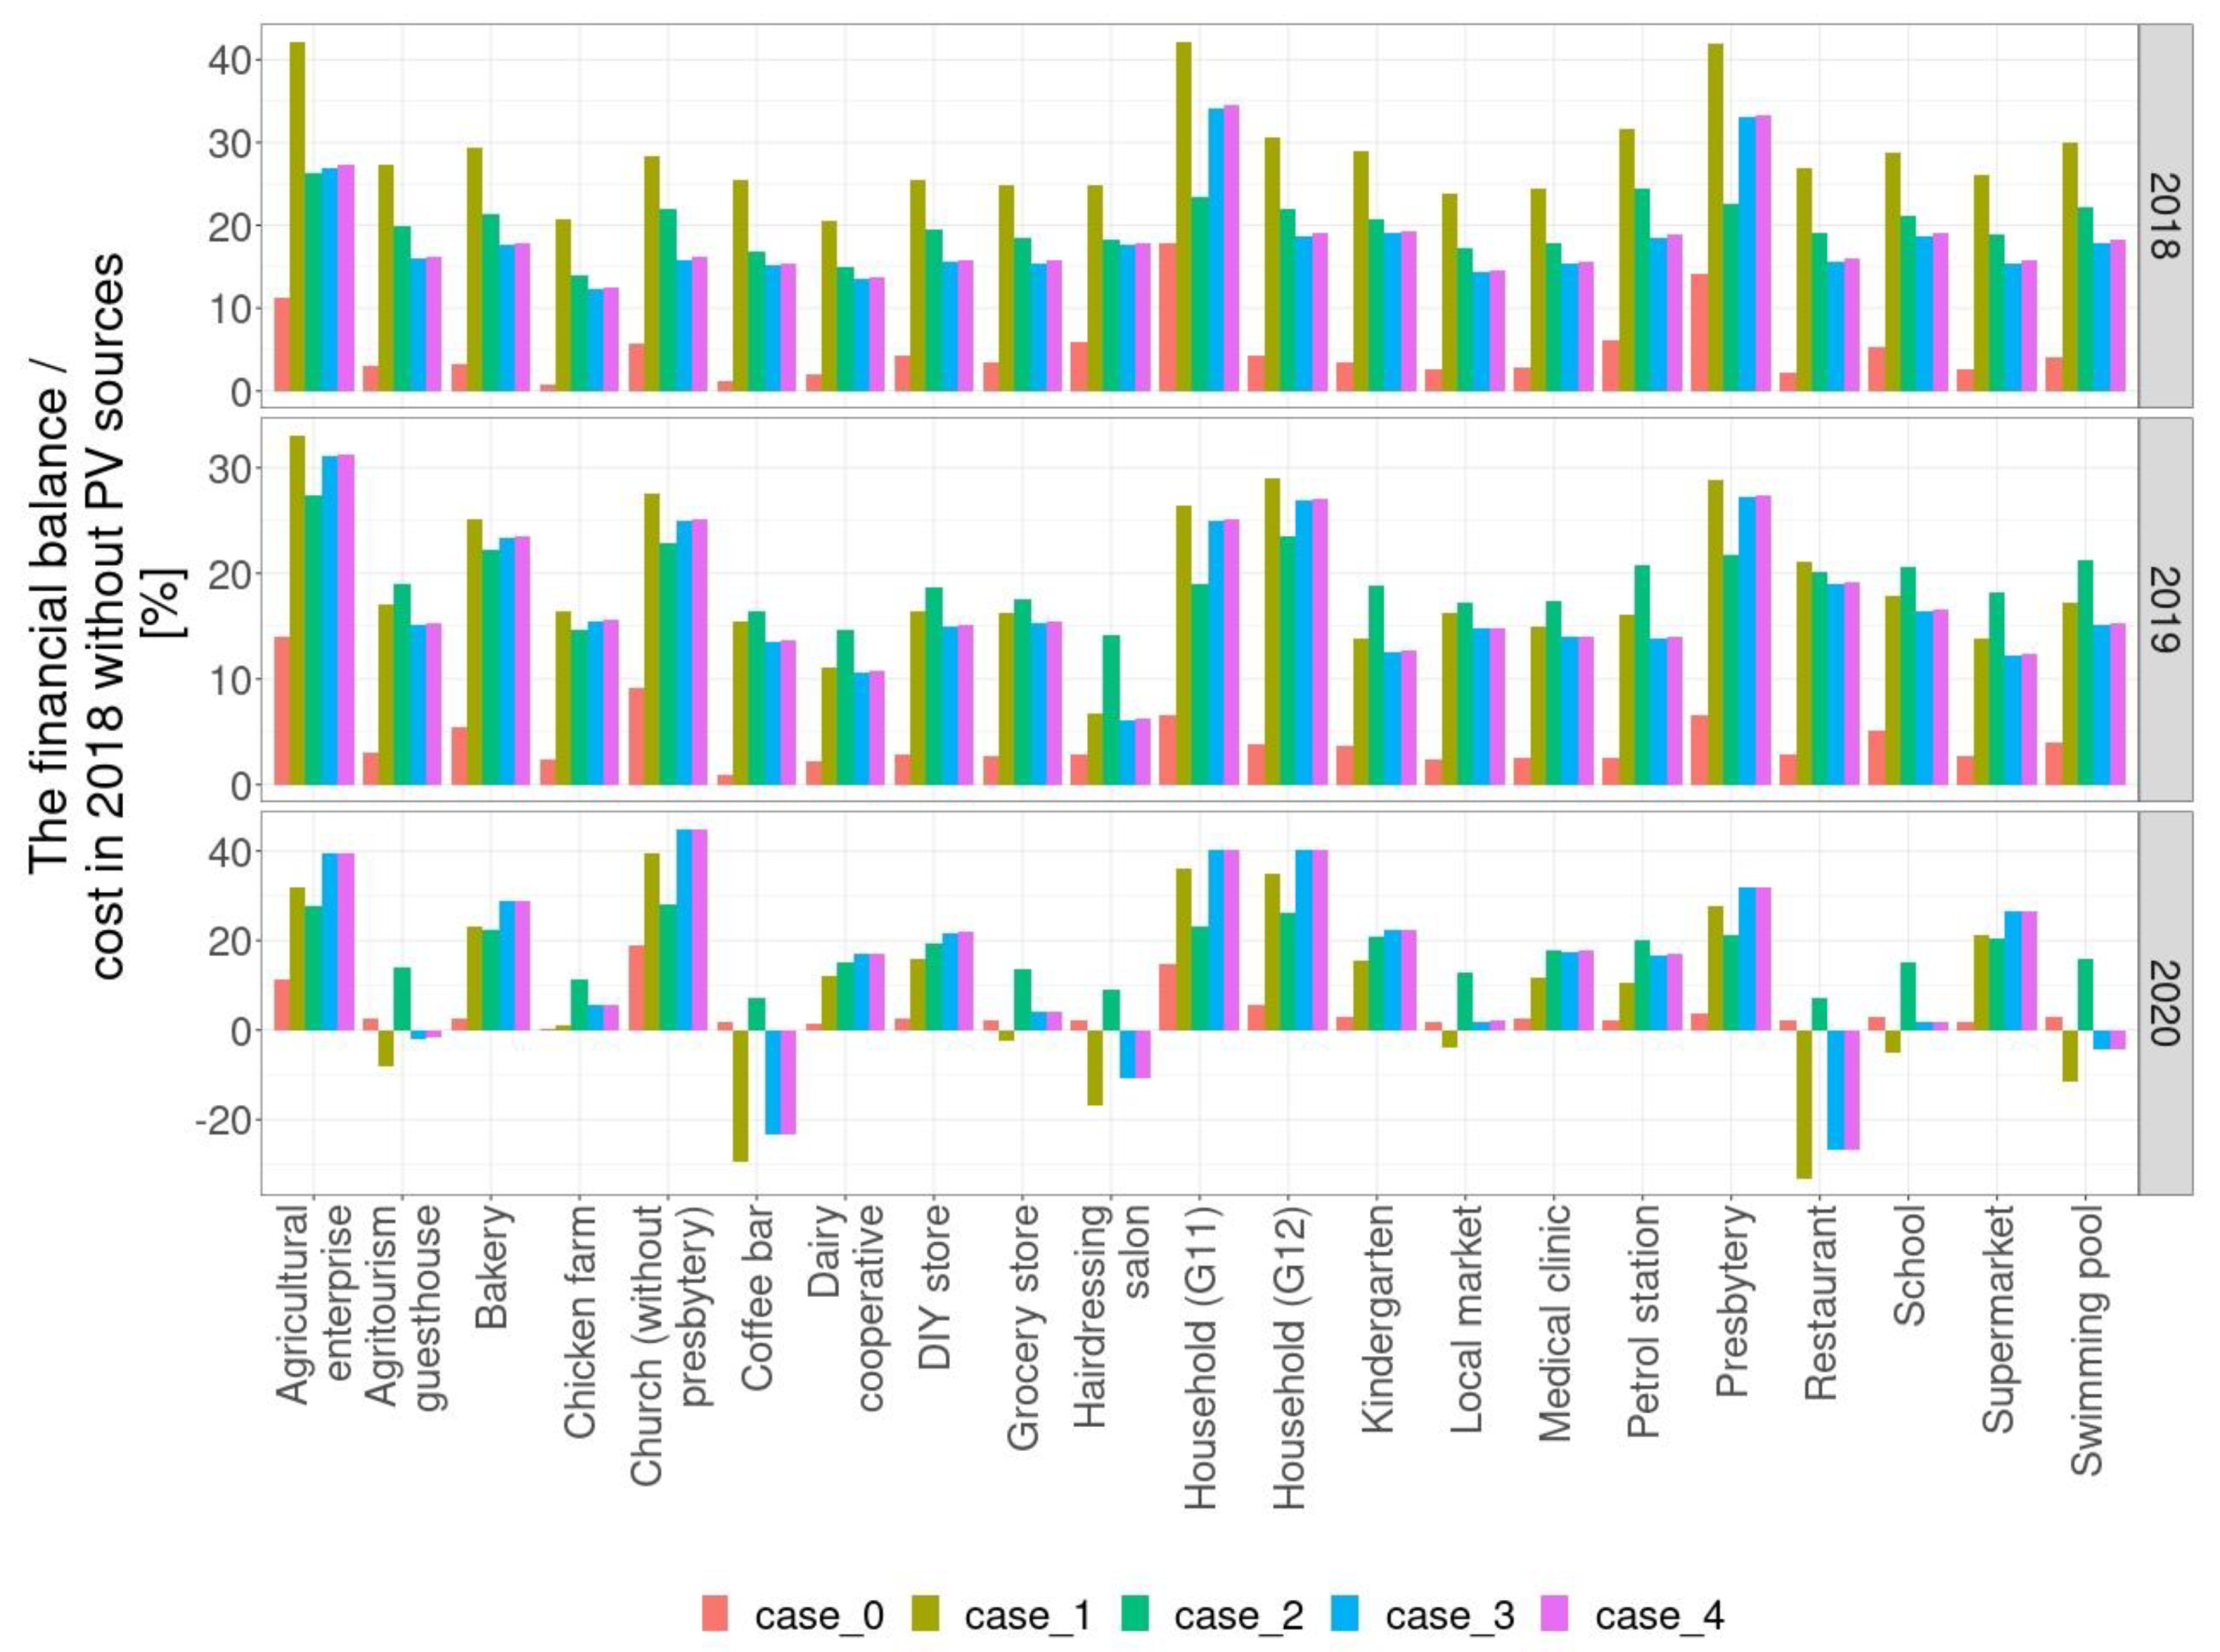
- The results obtained make it possible to assess the effectiveness of the proposed models of support for prosumers by referring to particular areas of the economy, as shown in Figure 10, and individual prosumers representing individual sectors of the economy, as shown in Figure 11. In each case, for the years when the energy consumption was stable and corresponded to the level for which the PV source power was selected, the most beneficial prosumer support scenario is the existing discount model-case_0.
4. Conclusions
- The basic conclusion to be drawn on the basis of the research is that the prosumer benefits most from participating in the currently applicable discount mechanism (case_0), in which the unused energy is fed into a network storage, from which 70% or 80% of the stored volume can be taken by the prosumer. These benefits result from the fact that the off-take of energy from the deposit is not subject to any fees. Possible costs occur only if the energy collected is in excess of that stored, which does not happen in practice with a well-selected generation source. This mechanism does not make it possible to resell surplus energy to the market and generate revenue, which seems to be consistent with the overarching objective of prosumerism, namely, building energy self-sufficiency, and not gaining profits from the sale of energy.
- At the level of the averaged financial effect for all prosumers, the analysis of the period from March 2018 to March 2021 makes it possible to conclude, that the least beneficial would be the implementation of the discount model (case_2) assuming the existence of a network storage allowing prosumers to deposit surplus energy and collect it in full, i.e., without discount coefficients. Unfortunately, any off-take of energy from the network is encumbered by a distribution cost, which translates into reduced benefits for the prosumer. For the case_2 scenario (similar for case_1) the average prosumer reduces the electricity purchase cost by 81.5%, still incurring about 18.5% of the original level of energy purchase costs.
- Other mechanisms (case_1, case_3, case_4) allowing the prosumer to participate in the market and settle at market prices generate revenue that, however, in most cases do not cover the energy purchase costs in periods where no energy is generated. The financial effect and any potential benefit to the prosumer are strictly dependent on the market price levels and the volatility of energy demand. Therefore, in exceptional situations (COVID-19)—even for a well-designed capacity of a PV source guaranteeing energy self-sufficiency—there may be situations where profit is generated from the sale of energy on the market.
- In Poland, the COVID-19 pandemic has had a very significant impact on the level and profile of energy demand, which resulted from the government policy and introduction of limitations and restrictions on selected areas and sectors of the economy. This is particularly visible in the education, tourism and sport service sectors. It is worth emphasizing that in relation to the average demand from March 2018 to March 2020, demand in the pandemic period, i.e., March 2020–March 2021, decreased for the following types of business activities: (i) Trade and sales—15%, (ii) Tourism and sport—39%, (iii) Services—58%, (iv) Education—19%, (v) Food production—6%, (VI) Others—2%. The only group that recorded an increase in the energy demand was Household—5%.
- The COVID-19 pandemic did not affect different sectors of the economy equally. The restrictions introduced by the government were both national and regional or local— at the lower administrative levels (in voivodeships or poviats), restrictions generally applied only to selected industries. In the case of a full lockdown, some entrepreneurs repeatedly tried to act on the edge of the law, minimizing the effects of restrictions on their business. This resulted in a certain asymmetry in the economic impact of restrictions on entrepreneurs, which directly influenced their better or worse financial condition. Scaling this effect at national level, it had a different impact on the financial result of entire branches and sectors of the economy. Good examples are gyms and fitness centers, which were formally closed for a long time. However, there were no restrictions on training centers for sports competitions, which meant that many gyms and fitness clubs formally functioned as sports preparation centers, without changing their current business profile.
- Due to the scale and diversity of the problem, the results of analyses and research presented in the article treat the issues of the influence of COVID-19 on the development of the economy only in a fragmentary manner. In the opinion of the authors, it is worth continuing research in this area, in particular taking account of the sensitivity analyses and in the context of the impact of random global events on the network of sectoral connections, their interdependence and resistance to crises.
- Long-term or recurring economic and social restrictions related to COVID-19 resulted in difficulties in restoring the functioning of the economy and sparked a great deal of political controversy and social opposition. In the context of these experiences, it should be noted that during the fourth wave of the pandemic (which started in October 2021), the Polish authorities did not announce a nationwide lockdown and only intervened locally. Unlike this so far, this scenario of the government’s actions implies an interesting field for the continuation of research and assessment of the impact of the COVID-19 on the functioning of economic sectors without introducing national restrictions. A comparative analysis of the state of different countries’ economies with dissimilar approaches to restrictions might also be interesting.
Author Contributions
Funding
Institutional Review Board Statement
Informed Consent Statement
Conflicts of Interest
References
- Clean Energy for All Europeans Package. Available online: https://ec.europa.eu/energy/topics/energy-strategy/clean-energy-all-europeans_en (accessed on 18 November 2020).
- European Commission. Renewable Energy Progress Report; European Commission: Brussels, Belgium, 2020. [Google Scholar]
- European Commission. A Clean Planet for All. A European Strategic Long-Term Vision for a Prosperous, Modern, Competitive and Climate Neutral Economy; European Commission: Brussels, Belgium, 2018. [Google Scholar]
- European Parliament. Directive (EU) 2018/2001 of the European Parliament and of the Council of 11 December 2018 on the Promotion of the Use of Energy from Renewable Sources (Text with EEA Relevance); European Parliament: Strasbourg, Farance, 2018. [Google Scholar]
- United Nations. Paris Agreement; United Nations: Paris, France, 2015. [Google Scholar]
- Paska, J.; Surma, T.; Terlikowski, P.; Zagrajek, K. Electricity Generation from Renewable Energy Sources in Poland as a Part of Commitment to the Polish and EU Energy Policy. Energies 2020, 13, 4261. [Google Scholar] [CrossRef]
- European Commission. The European Green Deal Communication from the Commission; European Commission: Brussels, Belgium, 2019. [Google Scholar]
- Wójcik-Jurkiewicz, M.; Czarnecka, M.; Kinelski, G.; Sadowska, B.; Bilińska-Reformat, K. Determinants of Decarbonisation in the Transformation of the Energy Sector: The Case of Poland. Energies 2021, 14, 1217. [Google Scholar] [CrossRef]
- Zamasz, K.; Stęchły, J.; Komorowska, A.; Kaszyński, P. The Impact of Fleet Electrification on Carbon Emissions: A Case Study from Poland. Energies 2021, 14, 6595. [Google Scholar] [CrossRef]
- Brown, D.; Hall, S.; Davis, M.E. What is prosumerism for? Exploring the normative dimensions of decentralised energy transitions. Energy Res. Soc. Sci. 2020, 66, 101475. [Google Scholar] [CrossRef]
- Ritzer, G.; Dean, P.; Jurgenson, N. The Coming of Age of the Prosumer. Am. Behav. Sci. 2012, 56, 379–398. [Google Scholar] [CrossRef]
- Milčiuvienė, S.; Kiršienė, J.; Doheijo, E.; Urbonas, R.; Milčius, D. The Role of Renewable Energy Prosumers in Implementing Energy Justice Theory. Sustainability 2019, 11, 5286. [Google Scholar] [CrossRef] [Green Version]
- Kaczmarzewski, S.; Olczak, P.; Sołtysik, M. The Impact of Electricity Consumption Profile in Underground Mines to Cooperate with RES. Energies 2021, 14, 5775. [Google Scholar] [CrossRef]
- European Economic and Social Committee Opinion: “Prosumer Energy and Prosumer Power Cooperatives: Opportunities and Challenges in the EU Countries” (Own-Initiative Opinion) 2017. pp. 44–52. Available online: https://eur-lex.europa.eu/legal-content/EN/TXT/?uri=uriserv%3AOJ.C_.2017.034.01.0044.01.ENG&toc=OJ%3AC%3A2017%3A034%3ATOC (accessed on 10 November 2021).
- Mucha-Kuś, K.; Sołtysik, M.; Zamasz, K.; Szczepańska-Woszczyna, K. Coopetitive Nature of Energy Communities—The Energy Transition Context. Energies 2021, 14, 931. [Google Scholar] [CrossRef]
- Czakon, W.; Mucha-Kuś, K.; Sołtysik, M. Coopetitive Platform: Common Benefits in Electricity and Gas Distribution. Energies 2021, 14, 7113. [Google Scholar] [CrossRef]
- Cader, J.; Olczak, P.; Koneczna, R. Regional dependencies of interest in the “My Electricity” photovoltaic subsidy program in Poland. Polityka Energ.—Energy Policy J. 2021, 24, 97–116. [Google Scholar] [CrossRef]
- Horstink, L.; Wittmayer, J.M.; Ng, K. Pluralising the European energy landscape: Collective renewable energy prosumers and the EU’s clean energy vision. Energy Policy 2021, 153, 112262. [Google Scholar] [CrossRef]
- European Commission. 2020 Report on the State of the Energy Union Pursuant to Regulation (EU) 2018/1999 on Governance of the Energy Union and Climate Action (Annex 2—Energy Subsidies in the EU); European Commission: Brussels, Belgium, 2020. [Google Scholar]
- Alderete, M.V. The Age of Prosumerism: Some Micro-Economic Analysis. J. Theor. Appl. Electron. Commer. Res. 2017, 12, 1–12. [Google Scholar] [CrossRef] [Green Version]
- RES LEGAL Europe—Renewable Energy Policy Database and Support (Information on the Main Support Schemes). Available online: http://www.res-legal.eu/search-by-country/ (accessed on 11 October 2021).
- Andrychowicz, M. RES and ES Integration in Combination with Distribution Grid Development Using MILP. Energies 2021, 14, 383. [Google Scholar] [CrossRef]
- Andrychowicz, M. The Impact of Energy Storage along with the Allocation of RES on the Reduction of Energy Costs Using MILP. Energies 2021, 14, 3783. [Google Scholar] [CrossRef]
- Seyfang, G.; Park, J.J.; Smith, A. A thousand flowers blooming? An examination of community energy in the UK. Energy Policy 2013, 61, 977–989. [Google Scholar] [CrossRef]
- Palm, J.; Eidenskog, M.; Luthander, R. Sufficiency, change, and flexibility: Critically examining the energy consumption profiles of solar PV prosumers in Sweden. Energy Res. Soc. Sci. 2018, 39, 12–18. [Google Scholar] [CrossRef]
- Yildiz, Ö. Financing renewable energy infrastructures via financial citizen participation—The case of Germany. Renew. Energy 2014, 68, 677–685. [Google Scholar] [CrossRef]
- Zarębski, P.; Krupin, V.; Zwęglińska-Gałecka, D. Renewable Energy Generation Gaps in Poland: The Role of Regional Innovation Systems and Knowledge Transfer. Energies 2021, 14, 2935. [Google Scholar] [CrossRef]
- Rokicki, T.; Bórawski, P.; Gradziuk, B.; Gradziuk, P.; Mrówczyńska-Kamińska, A.; Kozak, J.; Guzal-Dec, D.J.; Wojtczuk, K. Differentiation and Changes of Household Electricity Prices in EU Countries. Energies 2021, 14, 6894. [Google Scholar] [CrossRef]
- European Commission. Commission Implementing Regulation (EU) 2020/1294 of 15 September 2020 on the Union Renewable Energy Financing Mechanism (Text with EEA Relevance); European Commission: Brussels, Belgium, 2020. [Google Scholar]
- Brown, D.; Hall, S.; Davis, M.E. Prosumers in the post subsidy era: An exploration of new prosumer business models in the UK. Energy Policy 2019, 135, 110984. [Google Scholar] [CrossRef]
- Ustawa z dnia 20 lutego 2015 r. o odnawialnych źródłach energii (Act of 20 February 2015 on Renewable Energy Sources) (Dz.U. 2020 poz. 261). Available online: http://isap.sejm.gov.pl/isap.nsf/DocDetails.xsp?id=WDU20200000261 (accessed on 11 November 2021).
- Jasiński, J.; Kozakiewicz, M.; Sołtysik, M. Determinants of Energy Cooperatives’ Development in Rural Areas—Evidence from Poland. Energies 2021, 14, 319. [Google Scholar] [CrossRef]
- Jasiński, J.; Kozakiewicz, M.; Sołtysik, M. The Effectiveness of Energy Cooperatives Operating on the Capacity Market. Energies 2021, 14, 3226. [Google Scholar] [CrossRef]
- Energy Regulatory Office Register of Obligated Sellers (Lista Sprzedawców Zobowiązanych). Available online: https://bip.ure.gov.pl/bip/rejestry-i-bazy/sprzedawcy-zobowiazani/3713,Lista-sprzedawcow-zobowiazanych.html (accessed on 10 November 2021).
- Energy Regulatory Office—Tarrifs and Electricity Market Characteristics. Available online: https://www.ure.gov.pl/en (accessed on 11 November 2021).
- PSE S.A.—The Polish Power System Market Energy Price—Rynkowa cena Energii Elektrycznej (RCE). Available online: https://www.pse.pl/dane-systemowe/funkcjonowanie-rb/raporty-dobowe-z-funkcjonowania-rb/podstawowe-wskazniki-cenowe-i-kosztowe/rynkowa-cena-energii-elektrycznej-rce (accessed on 11 November 2021).
- TGE Day-Ahead Market and Intra-Day Market SIDC (XBID)—Spot Market for Electricity in Poland. Available online: https://tge.pl/electricity-dam (accessed on 11 November 2021).
- Energy Regulatory Office Average Selling Price of Electricity on the Competitive Market (Annual and Quarterly)—Średnia cena Sprzedaży Energii Elektrycznej na Rynku Konkurencyjnym (Roczna i Kwartalne). Available online: https://www.ure.gov.pl/pl/energia-elektryczna/ceny-wskazniki/7852,Srednia-cena-sprzedazy-energii-elektrycznej-na-rynku-konkurencyjnym-roczna-i-kwa.html (accessed on 11 November 2021).
- Energy Regulatory Office Electricity Tariffs—Taryfy Energii Elektrycznej. Available online: https://bip.ure.gov.pl/bip/taryfy-i-inne-decyzje-b/energia-elektryczna (accessed on 11 November 2021).
- Kaczmarek, T. Administrative division of Poland—25 years of experience during the systemic transformation. EchoGéo 2016, 35. [Google Scholar] [CrossRef]
- Rataj, M.; Berniak-Woźny, J.; Plebańska, M. Poland as the EU Leader in Terms of Photovoltaic Market Growth Dynamics—Behind the Scenes. Energies 2021, 14, 6987. [Google Scholar] [CrossRef]
- Zakeri, B.; Gissey, G.C.; Dodds, P.E.; Subkhankulova, D. Centralized vs. distributed energy storage—Benefits for residential users. Energy 2021, 236, 121443. [Google Scholar] [CrossRef]
- The Comprehensive R Archive Network. Available online: https://cran.r-project.org/ (accessed on 30 October 2021).
- Bivand, R.S.; Pebesma, E.J.; Gómez-Rubio, V. Applied Spatial Data Analysis With R, 2nd ed.; Use R! Springer: New York, NY, USA, 2013; ISBN 978-1-4614-7618-4. [Google Scholar]
- Heumann, C.; Schomaker, M.; Shalabh. Introduction to Statistics and Data Analysis: With Exercises, Solutions and Applications in R, 1st ed.; Springer International Publishing: Cham, Germany, 2016; ISBN 978-3-319-46162-5. [Google Scholar]
- López-Sosa, L.B.; Alvarado-Flores, J.J.; del Niño Jesús Marín-Aguilar, T.; Corral-Huacuz, J.C.; Aguilera-Mandujano, A.; Rodríguez-Torres, G.M.; Morales-Máximo, M.; del Carmen Rodríguez-Magallón, M.; Alcaraz-Vera, J.V.; Ávalos-Rodríguez, M.L.; et al. COVID-19 Pandemic Effect on Energy Consumption in State Universities: Michoacan, Mexico Case Study. Energies 2021, 14, 7642. [Google Scholar] [CrossRef]
- Malec, M.; Kinelski, G.; Czarnecka, M. The Impact of COVID-19 on Electricity Demand Profiles: A Case Study of Selected Business Clients in Poland. Energies 2021, 14, 5332. [Google Scholar] [CrossRef]
- Christopoulos, A.G.; Kalantonis, P.; Katsampoxakis, I.; Vergos, K. COVID-19 and the Energy Price Volatility. Energies 2021, 14, 6496. [Google Scholar] [CrossRef]
- Oviedo-Gómez, A.; Londoño-Hernández, S.M.; Manotas-Duque, D.F. Effects of the COVID-19 Pandemic on the Spot Price of Colombian Electricity. Energies 2021, 14, 6989. [Google Scholar] [CrossRef]

| Discount | Network Deposit | Resale of Energy | Purchase of Energy | |
|---|---|---|---|---|
| CASE_0 |
| Yes | No |
|
| CASE_1 | No | No | At the CRK determined quarterly by the President of the Energy Regulatory Office (URE) |
|
| CASE_2 | 1/1 | Yes | No |
|
| CASE_3 | No | No | At fixing prices from the energy exchange |
|
| CASE_4 | No | No | At the RCE (monthly average of the hourly prices weighted by the volume of resold surplus energy) |
|
| Electricity Consumption (Description for the Analyzed Period 1 March 2018–28 February 2019) | PV Power | ||||||
|---|---|---|---|---|---|---|---|
| Min. | Avr | Median | Max. | Total | |||
| kWh | MWh/Year | kW | |||||
| Trade and sales | Local market | 0 | 1.526 | 1.322 | 3.121 | 13,365.847 | 49.0 |
| Supermarket | 0 | 0.745 | 0.746 | 1.342 | 6521.986 | 24.5 | |
| DIY store | 0 | 1.517 | 1.929 | 5.595 | 13,291.612 | 49.6 | |
| Grocery store | 0 | 1.343 | 1.412 | 3.176 | 11,767.56 | 43.5 | |
| Tourism and sport | Agritourism guesthouse | 0 | 1.185 | 1.218 | 2.008 | 10,382.808 | 39.0 |
| Swimming pool | 0 | 1.379 | 1.408 | 3.19 | 12,077.8 | 46.5 | |
| Services | Restaurant | 0 | 1.483 | 1.666 | 2.987 | 12,987.894 | 49.0 |
| Coffee bar | 0 | 0.888 | 0.752 | 2.501 | 7781.909 | 28.5 | |
| Hairdressing salon | 0 | 0.266 | 0.02 | 2.643 | 2329.799 | 8.0 | |
| Education | School | 0 | 1.511 | 0.892 | 7.174 | 13,233.069 | 49.0 |
| Kindergarten | 0 | 1.505 | 0.912 | 11.339 | 13,184.113 | 49.0 | |
| Food production | Dairy cooperative | 0 | 1.383 | 0.66 | 4.923 | 12,111.603 | 43.8 |
| Bakery | 0 | 1.459 | 1.5 | 2.561 | 12,783.102 | 49.0 | |
| Chicken farm | 0 | 1.43 | 1.083 | 6.266 | 12,523.479 | 45.0 | |
| Agricultural enterprise | 0 | 1.406 | 0.1 | 31.849 | 12,316.534 | 49.0 | |
| Household | Household (G11) | 0 | 0.202 | 0.147 | 1.808 | 1773.785 | 5.0 |
| Household (G12) | 0 | 0.275 | 0.298 | 1.107 | 2406.909 | 9.0 | |
| Others | Petrol station | 0 | 1.172 | 1.156 | 3.257 | 10,264.825 | 40 |
| Medical clinic | 0 | 1.177 | 0.886 | 3.104 | 10,309.523 | 38.0 | |
| Church (without presbytery) | 0 | 1.462 | 1.072 | 9.095 | 12,810.444 | 49.0 | |
| Presbytery | 0 | 0.192 | 0.146 | 2.512 | 1680.121 | 5.0 | |
Publisher’s Note: MDPI stays neutral with regard to jurisdictional claims in published maps and institutional affiliations. |
© 2021 by the authors. Licensee MDPI, Basel, Switzerland. This article is an open access article distributed under the terms and conditions of the Creative Commons Attribution (CC BY) license (https://creativecommons.org/licenses/by/4.0/).
Share and Cite
Sołtysik, M.; Kozakiewicz, M.; Jasiński, J. Profitability of Prosumers According to Various Business Models—An Analysis in the Light of the COVID-19 Effect. Energies 2021, 14, 8488. https://doi.org/10.3390/en14248488
Sołtysik M, Kozakiewicz M, Jasiński J. Profitability of Prosumers According to Various Business Models—An Analysis in the Light of the COVID-19 Effect. Energies. 2021; 14(24):8488. https://doi.org/10.3390/en14248488
Chicago/Turabian StyleSołtysik, Maciej, Mariusz Kozakiewicz, and Jakub Jasiński. 2021. "Profitability of Prosumers According to Various Business Models—An Analysis in the Light of the COVID-19 Effect" Energies 14, no. 24: 8488. https://doi.org/10.3390/en14248488
APA StyleSołtysik, M., Kozakiewicz, M., & Jasiński, J. (2021). Profitability of Prosumers According to Various Business Models—An Analysis in the Light of the COVID-19 Effect. Energies, 14(24), 8488. https://doi.org/10.3390/en14248488