Article

Regulation Characteristics and Load Optimization of Pump-Turbine in Variable-Speed Operation

1
China Institute of Water Resources and Hydropower Research, Beijing 100038, China
2
School of Electrical and Information Engineering, Tianjin University, Tianjin 300072, China
*
Author to whom correspondence should be addressed.
Energies 2021, 14(24), 8484; https://doi.org/10.3390/en14248484
Submission received: 2 November 2021 / Revised: 4 December 2021 / Accepted: 7 December 2021 / Published: 15 December 2021
(This article belongs to the Topic Sustainable Energy Technology)

Abstract

:
In order to improve the operating and regulation characteristics of the hydropower unit and to stabilize the load fluctuations, variable-speed pumped storage technology based on converters has been proposed and given more attention recently. However, different from the conventional units, due to the variability of operation conditions, variable-speed units need to develop a load optimization strategy in terms of operating parameter identification to ensure state matching for operation. Therefore, this paper proposes an optimization search step based on the model test curve, and the process of parameter optimization search is elaborated and calculated in the turbine operating condition and pump operating condition, respectively. A mathematical model of the turbine regulation system is established to analyze the influence of speed and guide vane related parameters on the regulation characteristics, and the achievable operating range and regulation capacity in the variable-speed condition is pointed out based on pump-turbine model test, as well as the advantages over the fixed-speed operation. The results show that by applying the load optimization method, the variable-speed unit can be significantly improved in terms of operating efficiency, especially at low head and low power conditions. Meanwhile, a certain range of active power regulation can be realized by the decoupling control of the converter and measuring the guide vane opening in both modes. The analysis of the model test verifies the effectiveness of the variable-speed regulation operation of pump-turbine and provides a reference for the design and operation of the variable-speed hydropower units.

Graphical Abstract

1. Introduction

Power generation technology and the application systems of renewable energy have grown rapidly for the past several years in China, which has brought huge challenges to the grid stability and a significant structural change of electrical power production. The discontinuity of renewable energy and the inconsistency between power generation supply limits the large-scale integration of energy systems, especially in autonomous systems where renewable energy is the main source [1,2,3]. Usually, these composite renewable systems employ rechargeable storage devices to balance the inconsistency of power generation and supply, therefore, pumped storage plants are widely applied for this purpose [4,5,6]. As a giant natural battery, pumped hydro storage is the most effective technology in the energy storage system [7,8]. It can play a regulatory role as an energy storage tool, such as frequency regulation of the power grid [9], and load regulation of isolated power systems. Research on the improvement of pumped storage units in terms of efficiency and regulation characteristics has been the focus for many years [10,11,12]. Due to the reversibility of pumped storage units, the hydraulic design cannot meet the parameter requirements in both operating modes, Therefore, the unit is likely to operate at the off-design point for a long time, resulting in low efficiency, which is not conducive to the service life of the runner [13,14]. To solve this problem, the key technology of variable-speed pumped storage units with fast response capability and wide adjustment range has been proposed and studied [15,16,17]. Several studies have revealed that pumped storage stations with up to 70% can be operated efficiently by applying variable-speed technology [18]. To realize the variable-speed operation of hydropower plants and maintain the constant-frequency connection to the grid—the power electronic component frequency converter, which is more commonly used in wind power plants—is used [19]. Then, several variable-speed methods are proposed, and the structures of the two connection methods of variable speed hydropower units, which are more frequently used at present, are shown in Figure 1 and Figure 2.
Both types of units can achieve variable-speed and constant-frequency operation of pumped-turbines, and other functional characteristics should be considered to select each type of unit, including construction sites and the required capacity. The literature survey on the regulation performance of pumped storage units shows that many articles are dedicated to the advantages of application and technical investigation in the integration of renewable energy. The performance-evaluation, which is based on the time-scale of seconds in power regulation for variable-speed hydro units, is studied in [20], and a case study is researched to verify the superiority of variable-speed technology on ancillary service markets. The economic benefit of applying variable-speed units as energy storage devices for the hybrid system is appraised in [21]. From the perspective of the internal state of the unit, the inherent S-shaped region of the pump-turbine has also been emphatically analyzed, and the mechanism of using variable-speed characteristics to avoid the S-shaped area is revealed [22]. In addition to the functions related to regulating the power grid, variable-speed technology is also used in hydraulic energy harvesting and recovery [23,24], which deepens the understanding of the energy matching relationship of pump-turbine. Operational stability is also an important research element of hydroelectric units, where an analytical study on the transient stability of large doubly-fed variable-speed units is made [25].
To improve the regulation performance of hydropower units, some studies have optimized and improved the control method from the perspective of controller design, and applied fuzzy control theory and fractional order theory for the turbine regulation system [11,26,27], while the transmission characteristics of variable-speed have not been further considered and studied. Through the discussion of the advantages of doubly-fed variable-speed units versus conventional units highlighted in [26], we can draw certain conclusions of superiority in frequency regulation, harmonic distortion and grid oscillation. It is worth mentioning that the regulation ranges for different operating conditions are clearly given in [28], which gives a great guide for the methodological analysis in variable-speed pump-turbines. However, the parameter identification and optimization process of variable-speed pump-turbines are not mentioned. For the variable-speed unit with the full-size converter, the modeling of electrical and mechanical components with high applicability and accuracy is refined [29], but the neural network algorithm applied in the efficiency optimization process of hydraulic turbines requires a large number of operating point data, and the parameter matching relationship is unclear, which is not conducive to the analysis of the transition process. In [30], the concept of a “steady operation area in non-optimum condition” is proposed for variable-speed units, which is based on the non-linear characteristics of pump-turbine, then simplified steady state models are developed and tested. However, there is not much explanation of the time-domain response performance and the influence on the regulating system during the transmission process.
These research results have enabled variable-speed hydropower plants to store great quantities of immediately available potential electricity, providing better flexibility and stability for the power system and grid [31]. In general, for the research of variable-speed hydropower units, few papers have focused directly on the variable-speed regulation capability based on load optimization process from the perspective of pump-turbines, and research on the regulation system of variable-speed units is very limited. Moreover, there is no practical engineering application of a variable-speed pumped storage unit in China. A large gap in the empirical parameter identification of a variable-speed unit is yet to be explored. The load optimization process based on characteristic curves proposed in this paper has high reliability and a wide range of applications. It can provide a modelling basis for further parameter identification and control method improvement of variable-speed units. For some hydropower stations that can be refitted, this method can be used to predict the operation effect and evaluate the transformation cost. Therefore, a comprehensive study of this topic is meaningful and urgently needed.
In this paper, the load optimization process is proposed for the variable-speed operation hydropower unit under two working modes, and the regulation capacity and range are analyzed and discussed on the basis of dynamic simulation and model test. The structure is organized as follows: Section 2 presents the modeling approach of the mathematical model of the governing system, and further considers the response characteristic of the converter. In Section 3, the stability domain of the system is discussed and the effect of different parameters on the system is analyzed. Section 4 proposes the optimization process of speed and guide vane opening for two operating modes, which is not required in the conventional fixed-speed hydropower plants, but also the essence of the advantage for variable-speed operation. Meanwhile, the dynamic simulations of the regulating system at various working points are performed, and the time-domain response curves of the speed are obtained. The discussion in Section 5 is based on a model test case. The regulation capability and operating range of the pump-turbine are evaluated by considering its head boundaries, internal cavitation features, and power limitations. It can provide analysis methods for some refitted power stations and hydraulic design to predict the operation capacity. Section 6 presents the conclusion.
The present work in this paper attempts to highlight:
(1)
Through the establishment of the mathematical model, the influence of the variation coefficient of the guide vane opening and speed and the characteristics of the converter on the stability region of the regulation system is analyzed;
(2)
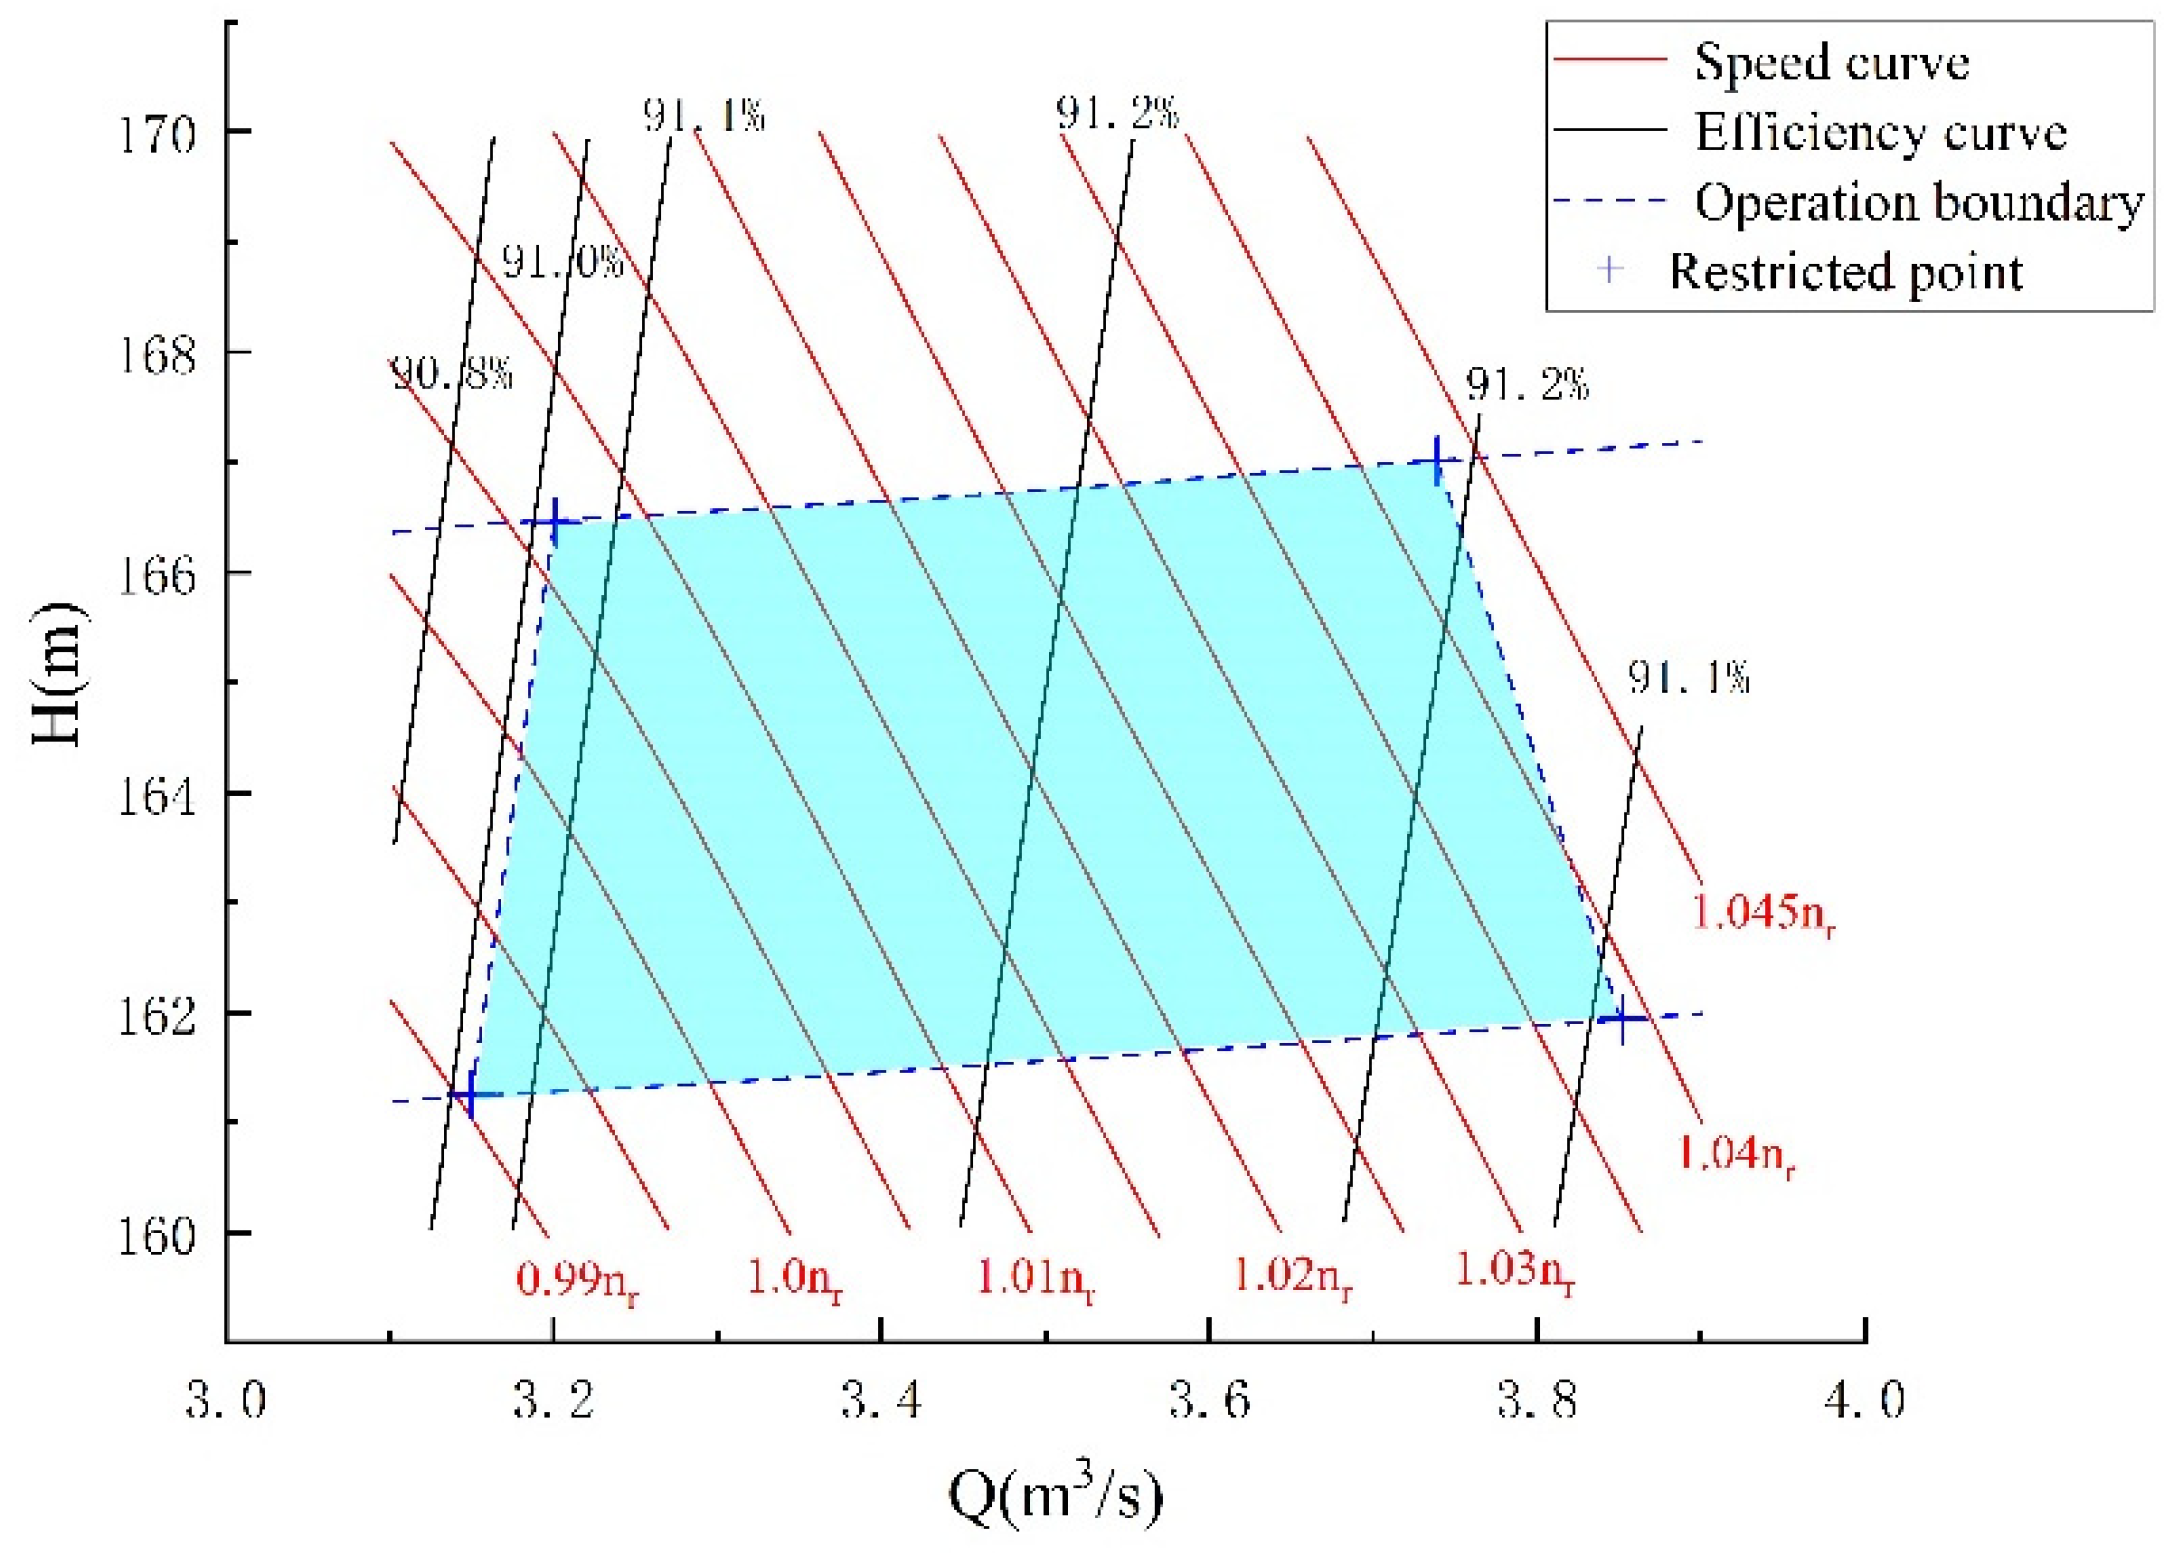
Using the parameter energy matching relationship of hydraulic machinery, the load optimization process is proposed, and the regional calculations are performed for the two operating modes, respectively. The level of efficiency improvement and the achievable operation range are determined through the model test curves.

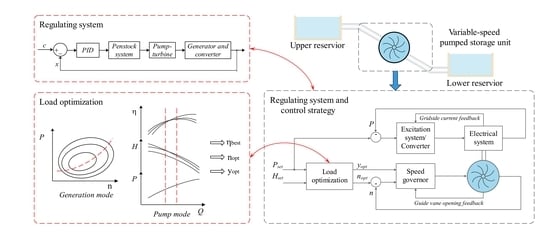
2. Mathematical Model of the Turbine Governing System

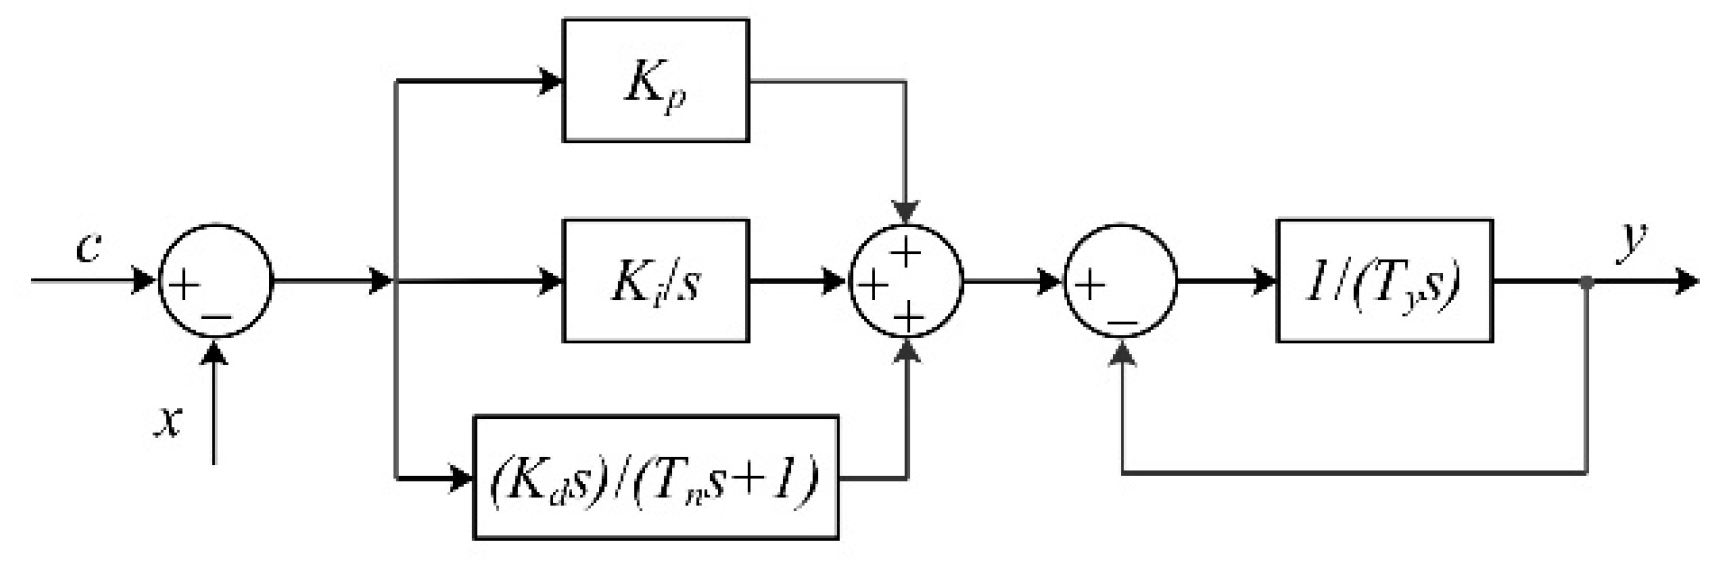
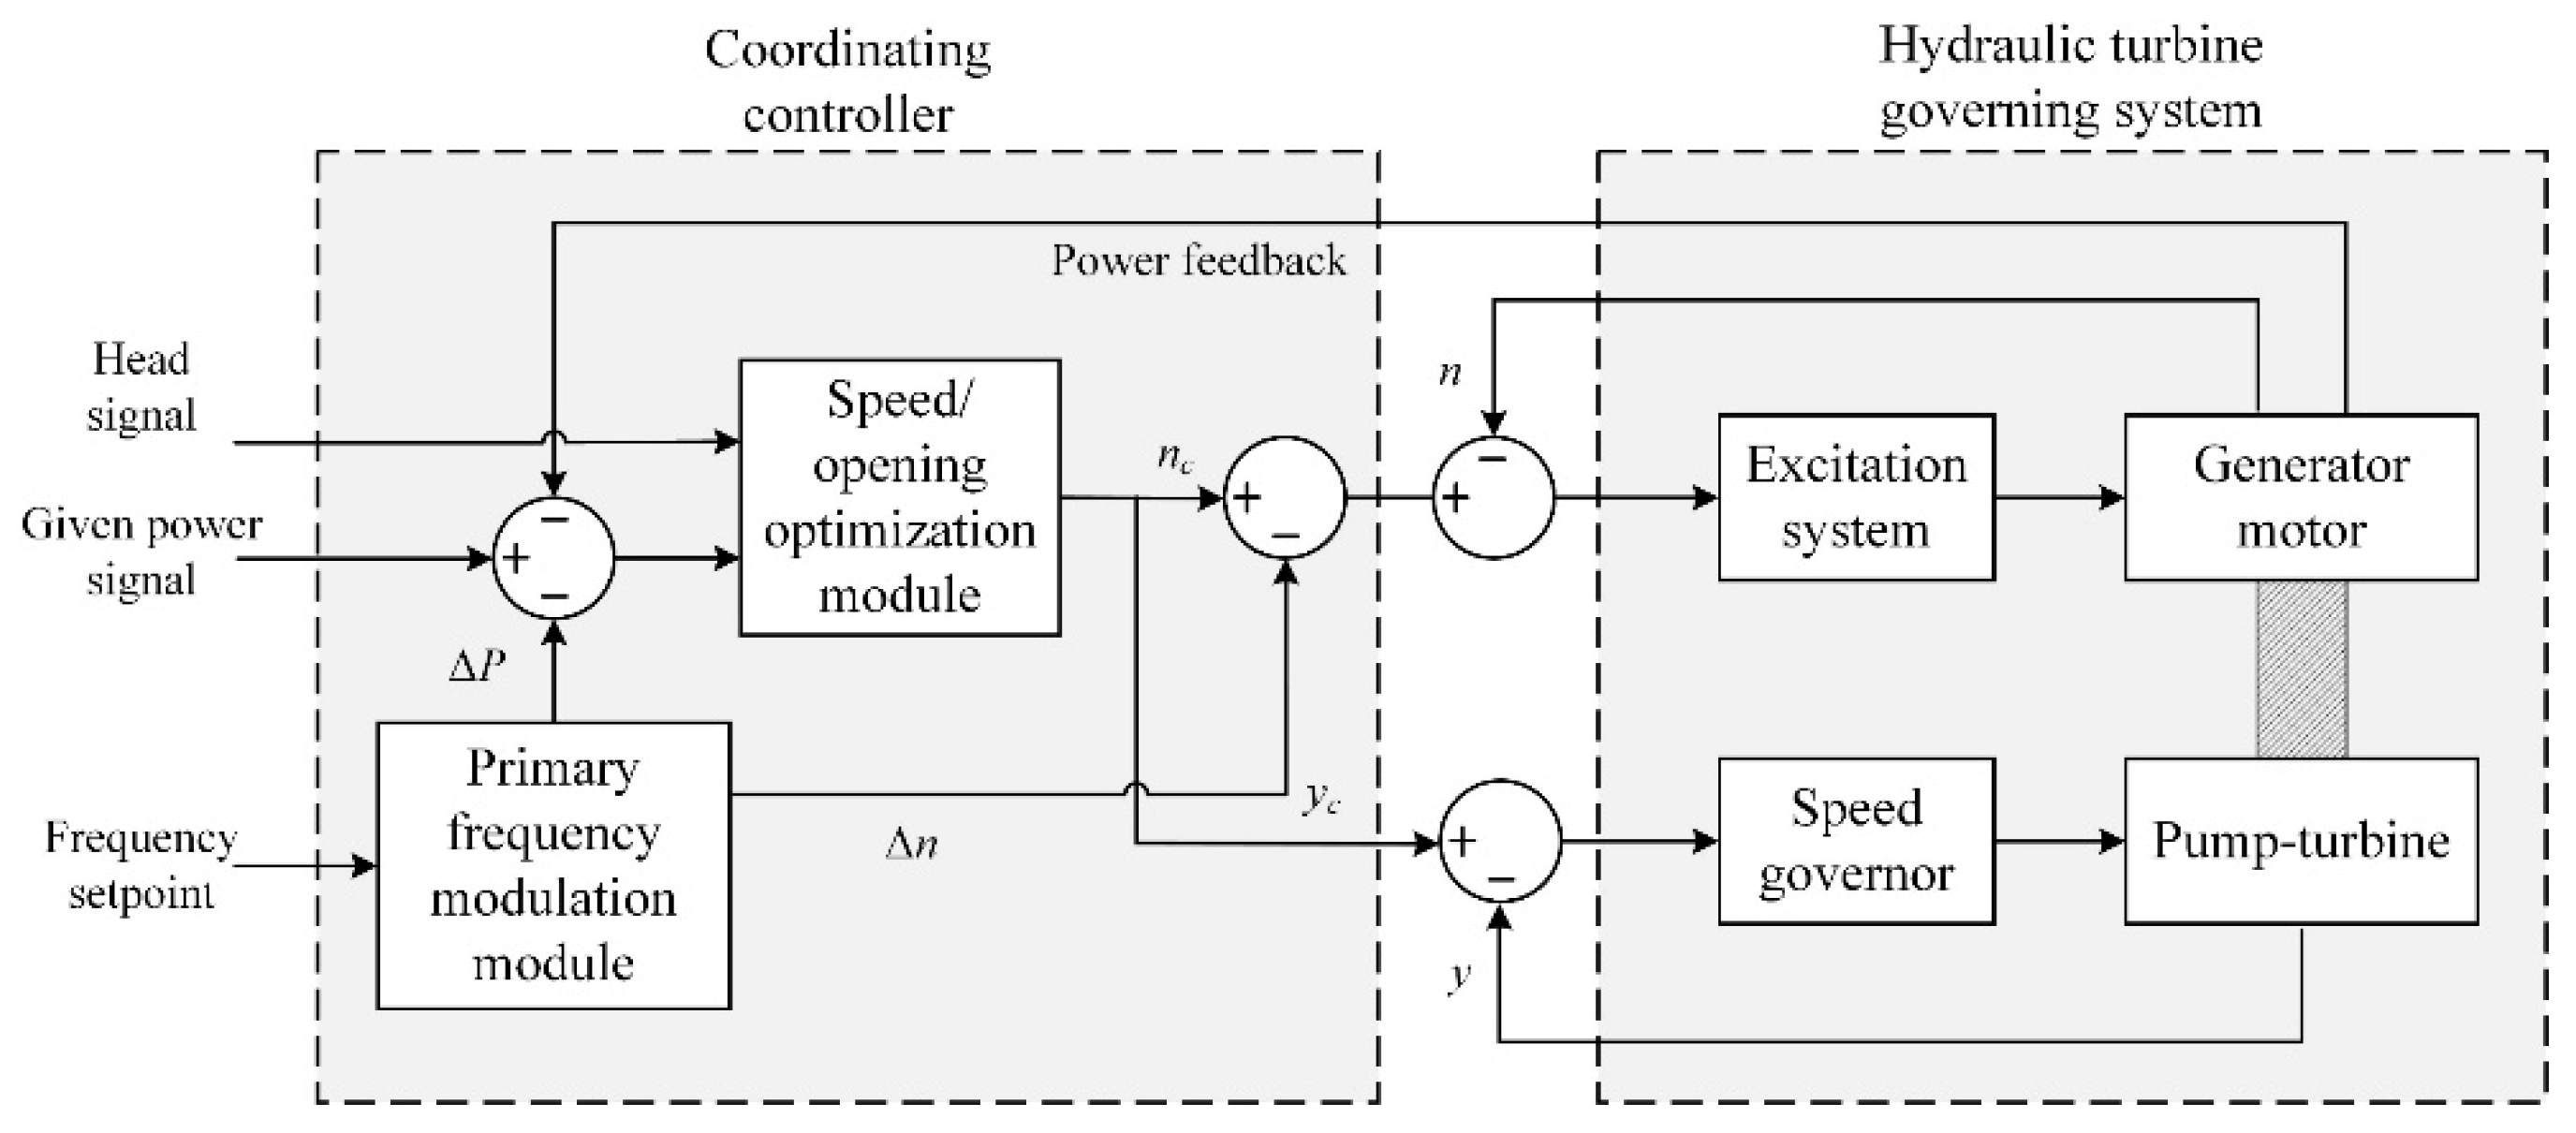
2.1. Turbine Governor

At present, the PID controller is widely used in the governor of hydroelectric generating sets. The control form and the structure of the electro-hydraulic servo system are shown in Figure 3. Theoretically, there is a dead-band of frequency before the speed signal in the model, which can be reflected in the simulations. Due to its nonlinear feature, it is omitted in the following Equations.
According to the block diagram, the transfer function between the relative speed deviation of the unit and the stroke deviation of the guide vane servo motor with a typical PID controller can be expressed as Equation (1):
G y ( s ) = ( K p + K i s + K d s 1 + T n s ) 1 1 + T y s ,
where K p , K i , and K d are the proportional gain, integral gain, and differential gain of the PID controller; s is the differential operator; T n is the derivate-action time constant; T y is the lag time of main servo motor.

2.2. Hydro-Turbine and Penstock System

With frequently changing operating conditions and the complex internal flow field, it is difficult to obtain a mathematical model that is consistent with the actual situation [32]. Generally, the model of a pump-turbine can be expressed quantitatively through model tests, where the model test is a simulation test on the test bench based on various conditions (including the switching process) that are actually possible, and the relevant data are recorded to form the full characteristic curve, as shown in Figure 4, in which the horizontal axis is unit speed and vertical axis is unit discharge or unit torque, respectively. According to the similarity law, unit speed n11, unit discharge Q11, unit power P11,and unit torque are defined in Equation (2) [33,34].
{ n 11 = n D 1 H           Q 11 = Q D 1 2 H       P 11 = P D 1 2 H 3 2   M 11 = M D 1 3 H         ,
where n is the mechanical speed; H is the head; Q is the flow; D1 is the runner diameter.
It is found that the discharge of the unit can be calculated at a certain time by means of interpolation or nonlinear function fitting [35]. In other words, it can be described as a torque function Mt and discharge function Q of guide vane opening y, speed n and head H, as shown in Equation (3).
{ M t = M t ( x , y , h ) Q = Q ( x , y , h ) ,
where x ,   y , and h are the deviation relative values of speed, opening, and head, respectively.
In the case of small fluctuations in the steady-state operating conditions, the model acquired by truncating appropriately the Taylor series expansion is expressed as Equation (4), namely the torque and discharge equations of turbine [16,36]. These transfer coefficients can be delivered by nonlinear expressions or obtained from the model characteristic curves by identifying the operating conditions (for the linear system, they are usually considered as certain constants), whose values represent the different operating state points.
{ m t = e y y + e x x + e h h q = e q y y + e q x x + e q h h ,
where e x , e y , and e h are the partial derivative of turbine power output pertaining to speed, guide vane opening, and head; e q x , e q y , and e q h are partial derivative of turbine discharge on speed, guide vane opening, and head; m t and q are relative values of torque and flow, respectively.
For small fluctuation systems, the application results of rigid and elastic penstock showed a very slight difference. Here, the mathematical model of a pressure penstock is represented by an expression for a rigid water hammer. The characteristics of penstock systems can be expressed as Equation (5).
h = T w d q d t ,
where T w is the water inertia time constant of the penstock.
According to Equations (3)–(5), taking the relative speed approximate to 1 ( e q x = 0 ) and the Laplace transformation, the expression of the transfer function of the pump-turbine and the penstock system can be expressed in Equation (6) [32,37].
{ G t ( s ) = e y 1 e T w s 1 + e q h T w s e = e q y e y e h e q h .

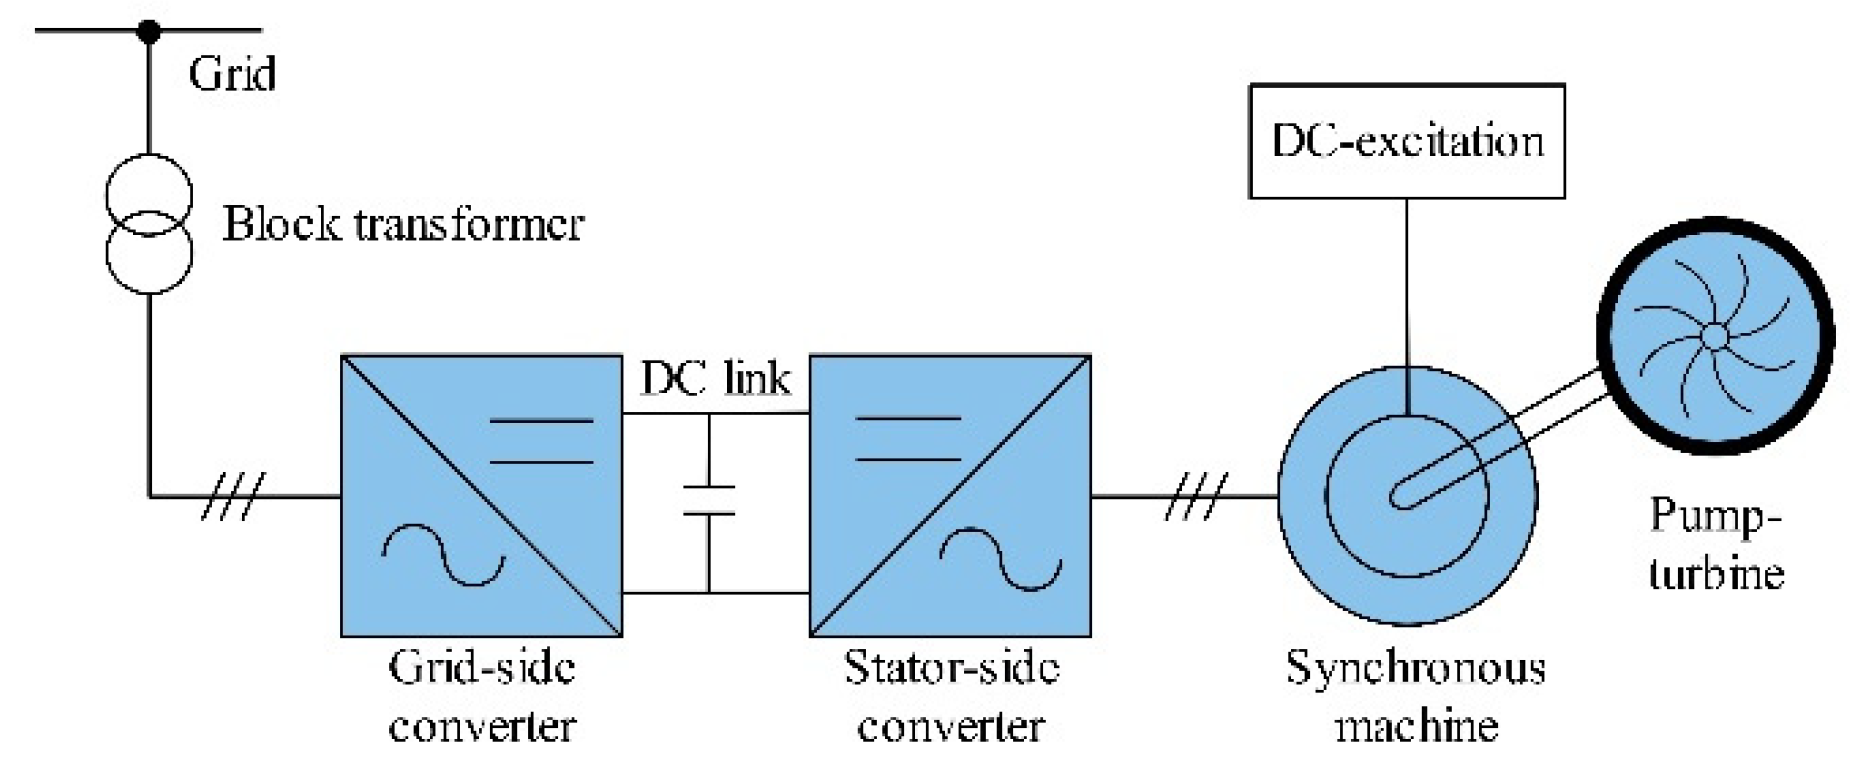
2.3. Generator Loading and Converter

Due to the change of unit operating conditions, the generator power angle oscillates, which requires consideration of complex models, i.e., third-order and higher models. On the basis of certain simplifications, it is assumed that the generator terminal voltage remains constant during the variable-speed operation. Considering the mechanical and electrical factors, the impact of electrical change process on the transition process is faster than the mechanical changing process. Under the premise of “rigid connection”, the rotor of the parallel-running units can be treated as a rigid body motion. The first derivative differential equation of the generator-motor is adopted in Equation (7):
T a d x d t = m t m g 0 e n x ,
where T a represents the inertia time constant of unit; m g 0 is the load disturbance; e n is the self-regulating coefficient of unit. It can be noticed that the load torque of the generator can be divided into two parts, the first term m g 0 indicates the load moment removed or input at t = 0, which is not involved in speed regulation but indicates the load disturbance moment of the regulating system; the second term e n x represents the moment of the regulating system into the dynamic process with the speed variation. The transfer function from the torque of the turbine to the speed of the generator is shown in Equation (8) [32]:
G h ( s ) = X ( s ) m t ( s ) m g 0 ( s ) = 1 T a s + e n .
Regarding the mathematical model of the converter, a simplified effect of the reactance resistance between the power electronics is used. The dynamic process of power response adjustment of small variable-speed hydroelectric units with load fluctuations is studied in [38]. The conversion between the electrical quantities inside the converter and the control strategy is not explored, so as the mathematical model of the converter is established, only the lag effect on the speed and power parameters of the unit is considered. The mathematical model of the converter is described by the first-order inertia link, and its transfer function can be written as Equation (9):
G c ( s ) = 1 T c s + 1 ,
where T c is the time constant of the converter.
According to the mathematical models of the above subsystems, the overall system control block diagram is shown in Figure 5.
The corresponding overall closed-loop transfer function of the governing system to the speed signal C x can be formulated in Equation (10):
G ( s ) = X ( s ) C x ( s ) = G y ( s ) G t ( s ) G h ( s ) G c ( s ) 1 + G y ( s ) G t ( s ) G h ( s ) G c ( s ) = b ( s ) a ( s ) .
The corresponding state space model can be expressed as:
{ X ˙ = [ 0 1 0 0 0 0 1 0 0 0 0 1 a 0 a 1 a 2 a n 1 ] X + [ 0 0 0 1 ] u Y = [ b 0 b 1 b n 2 b n 1 ] X ,
where X , Y , and u represent the state, output, and input of the overall control system, respectively; the remaining parameters are the matrix coefficients that elaborate the relationship between the output and state variables, some of which are determined by the parameters of self-system.
Different from the conventional hydropower regulating system, the control command c is not a fixed value, it can be varied with the head and power signal, calculated by the optimization module or the cooperative control device. The specific calculation process will be described in Section 4.2.

3. Stability of the Regulation System

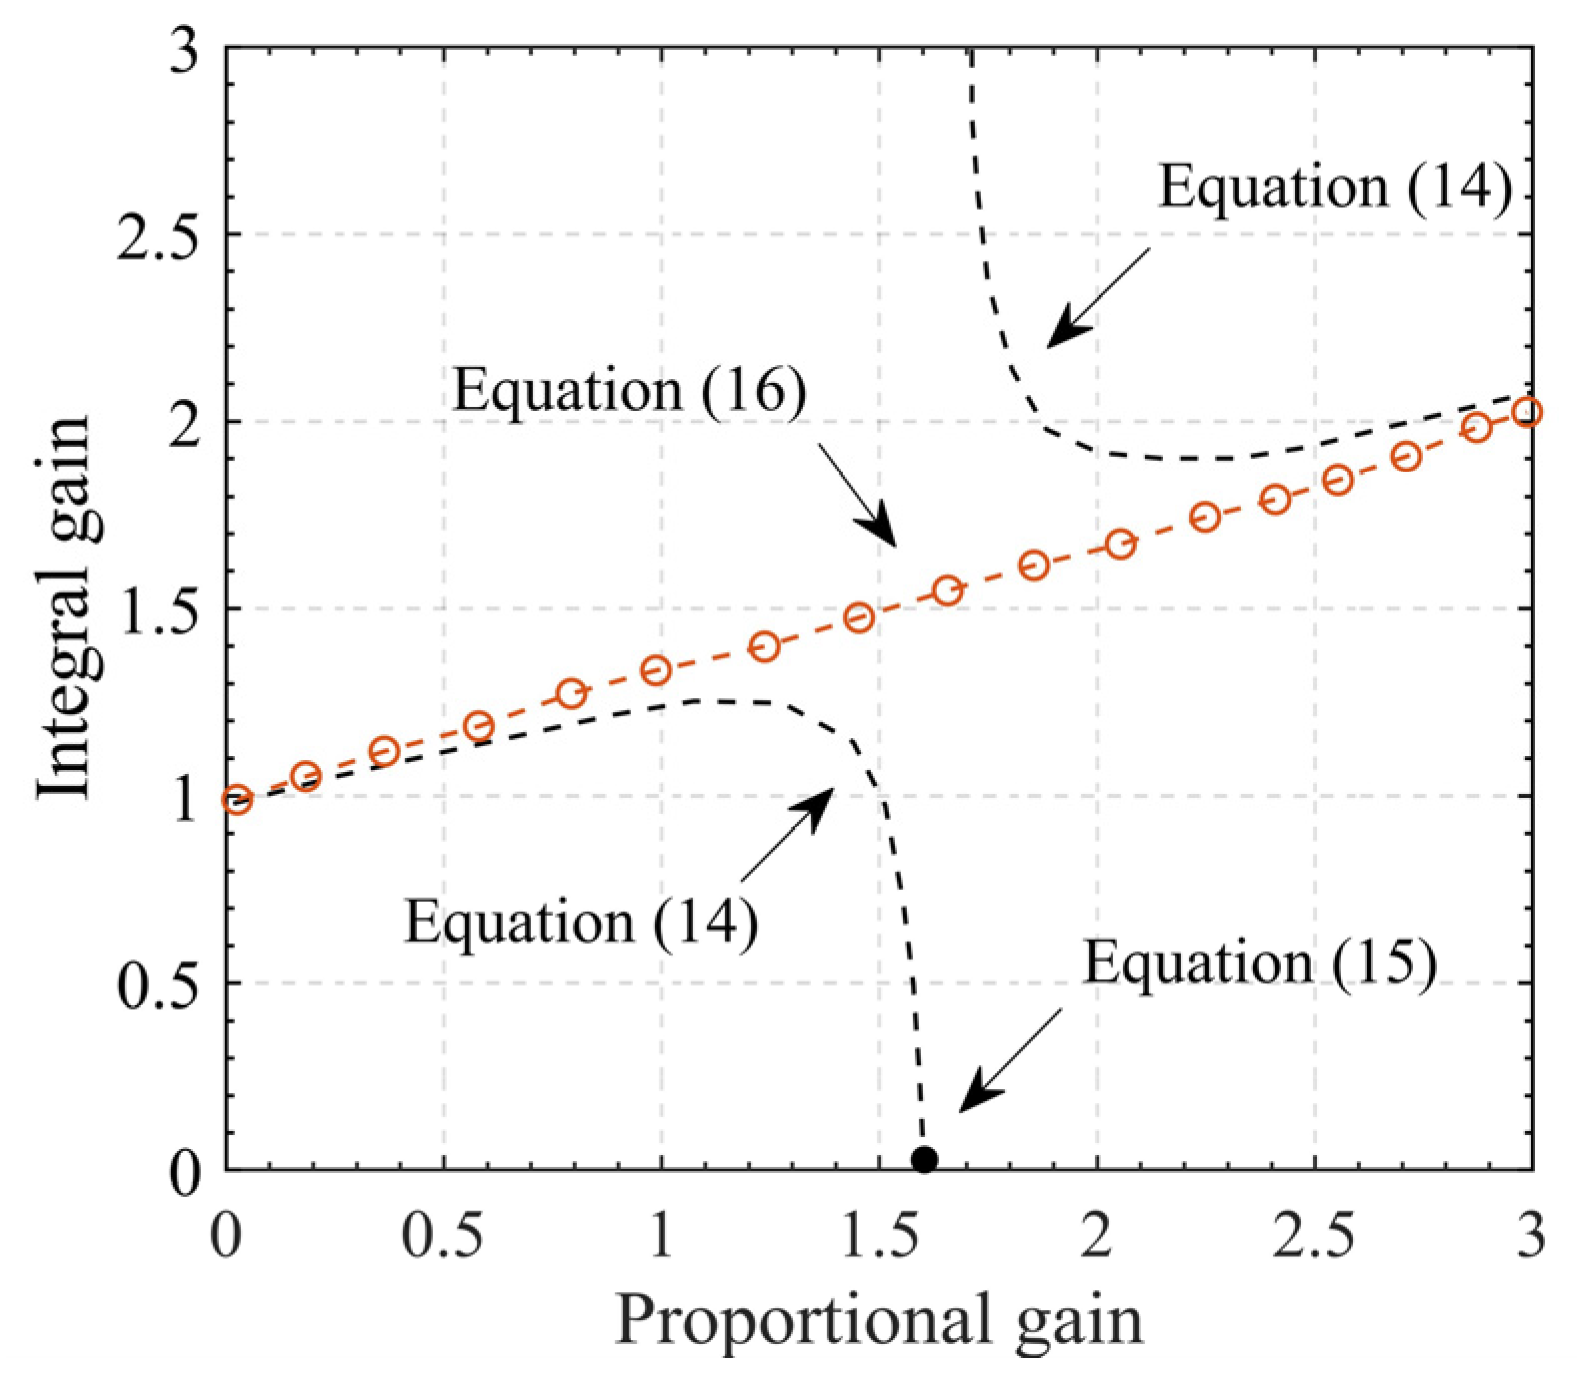
3.1. Stability Domain Calculation Formulation

In this section, a classical PI controller is used as an example to analyze the stability domain range of the regulating system, the specific expression of the overall transfer function of Equation (10) is shown in Equation (12):
G ( s ) = b 2 s 2 + b 1 s + b 0 a 5 s 5 + a 4 s 4 + a 3 s 3 + a 2 s 2 + a 1 s + a 0 ,
where b 2 = e e y k p T w ; b 1 = e y k p e e y k i T w ; b 0 = e y k i ; a 5 = e q h T w T c T a T y ; a 4 = T y ( T c ( T a + e n e q h T w ) + e q h T w T a ) +   e q h T w T c T a ; a 3 = T c ( T a + e n e q h T w ) + T y ( T a + e n T c + e n e q h T w ) + e q h T w T a ; a 2 = T a + e n ( T c + T y + e q h T w ) e e y k p T w ; a 1 = e n + e y k p e e y k i T w ; a 0 = e y k i .
To facilitate the analysis of system stability, the system is artificially reduced in order ( T y = 0 ) and the characteristic equation shown in Equation (13) is derived.
a 4 s 4 + a 3 s 3 + a 2 s 2 + a 1 s + a 0 = 0 .
According to the Liénard-Chipart criterion, the criteria for absolute stability of the system are: a i > 0 and Δ 3 > 0 , which lead to Equations (14)–(16).
a 1 a 2 a 3 a 1 2 a 4 a 0 a 3 2 > 0 ,
k p < T a + e n ( T c + e q h T w ) e y e T w ,
k i < e y k p + e n e y e T w .
Figure 6 illustrates the stability boundary lines of the unit, where the horizontal and vertical axes are the proportional gain and integral gain coefficients, respectively. The lower half branch of the hyperbola contains the region as the stability domain, the point on the lower half of the curve corresponds to the critical point of system stability. According to the stability domain theory of the dynamical system, the system will produce equal amplitude oscillation as the parameter is perturbed on the boundary line, whereas the fluctuation outside the stability domain will show a decentralized trend.

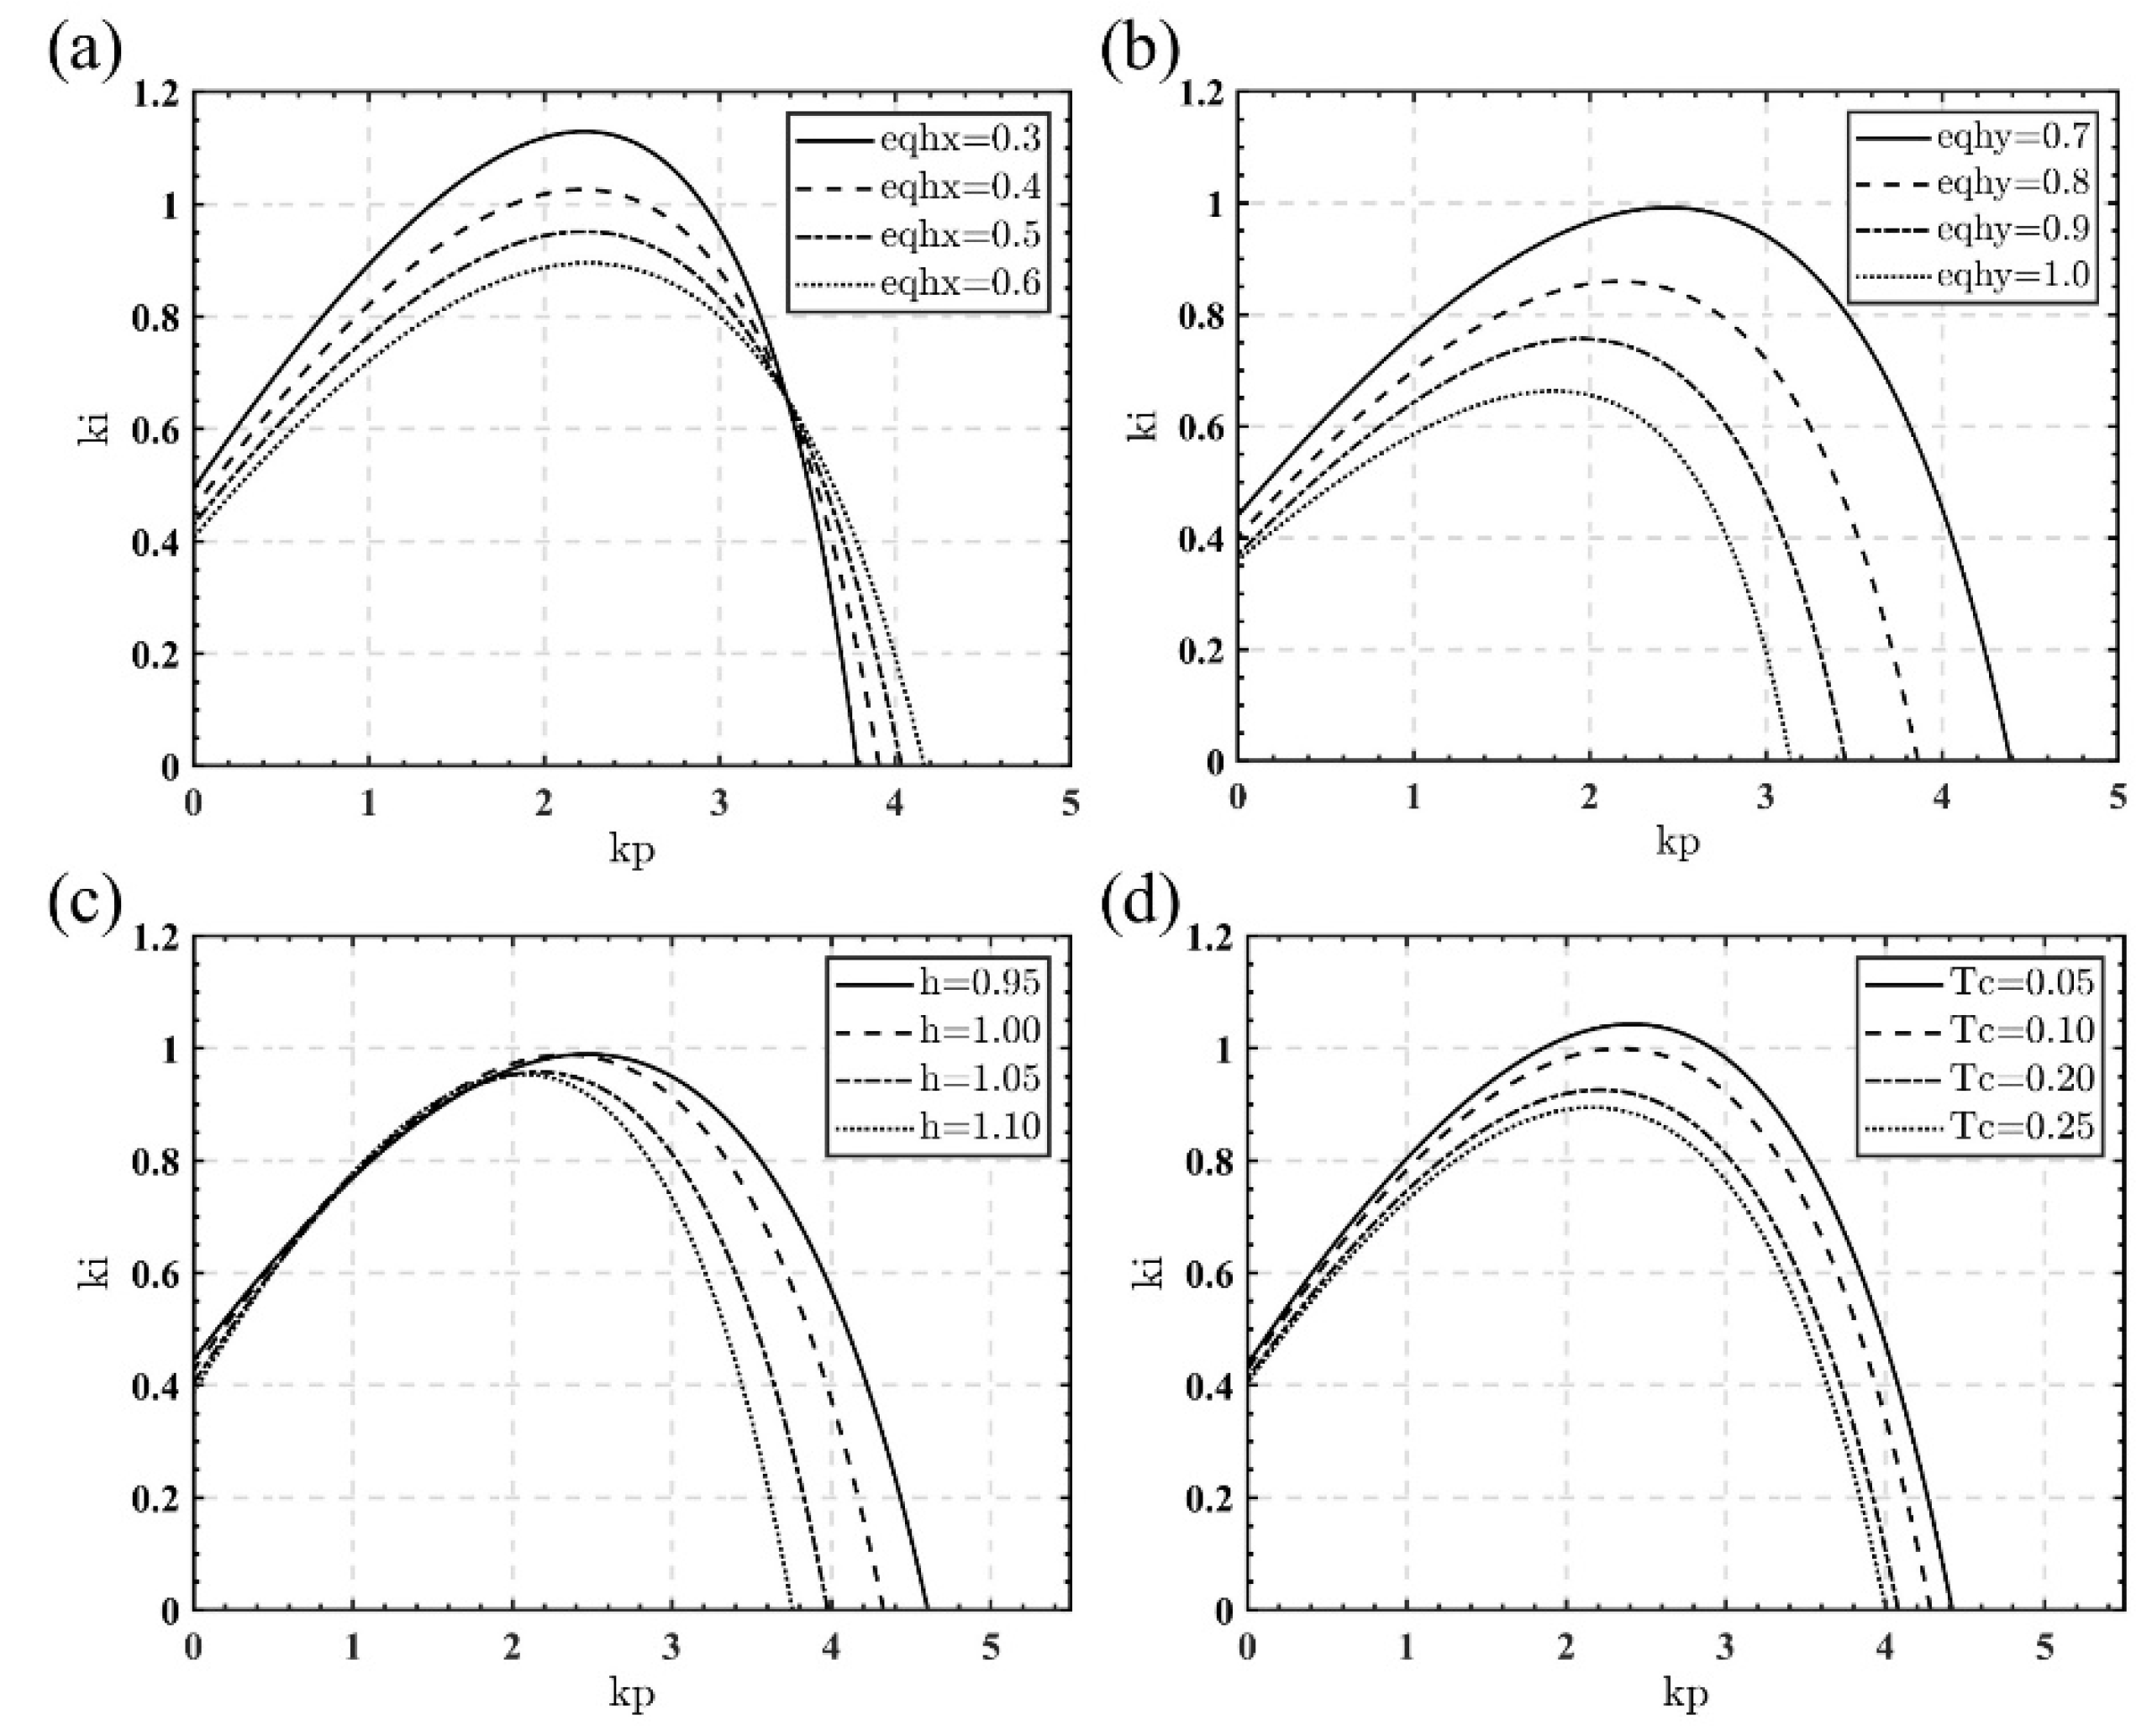
3.2. Effect of Variation of Variable-Speed Parameters

In terms of the calculation of the stability domain equations in the previous section, some specific visual representations of the stability boundary are illustrated. Set the unit inertia time constant   T a = 5   s , water flow inertia time constant T w = 2   s , and self-regulation coefficient e n = 1 [37]. Substitute into Equation (14); then, the effect of the parameters on the trends in the stability domain during the variable-speed process is analyzed. Two coefficients are defined here, which represent the effect of changes in speed and opening on the regulating system, respectively: e q h x = e n e q h + e q x e h ; e q h y = e q e h e y e q h . Figure 7 shows the variation of the stability domain for various parameters under different working conditions.
It can be observed that the boundary line moves slightly to the right of the intersection with the x-axis for a given range of e q h x , yet the stability domain still tends to shrink. In other words, the overall stability domain area decreases with the rise of e q h x . In contrast, e q h y has a more obvious influence on the stability domain, the boundary line of the stability domain shows an overall downward trend as e q h y increases. The value of e q h y is generally larger under the low-opening condition. Therefore, with the gradual increase of guide vane opening, the stability region of the system tends to expand monotonically. Figure 7c is the stability domain at different heads of a fixed opening, the transfer coefficient values in various heads are shown in Table 1. It can be noticed that with the increase of the head, the left half of the boundary lines nearly overlap, and the right part moves to the left gradually. Corresponding to the change of e q h y shown in Table 1, it can be confirmed that the increase of e q h y will have a negative impact on the system. The preliminary determination of unfavorable operating points can be considered based on the specific pump-turbine operating range and parameter distribution in the actual power plant. Since variable-speed pump-turbines operate for a longer time near the high efficiency region, the coefficient distribution near this area can be used as a necessary condition for the stability calculation of variable-speed plants. For the introduced converter time constant T c , the inertia coefficient of this part is generally taken as a small value due to the reason that the response of the current inner loop in the converter is much quicker than the transition process of the unit. Its variation within a certain range has less significant effect on the overall results. It can be found that the unit speed is larger at high-head conditions from the defining equation of unit speed: n 11 = n D 1 / H . For the variable-speed unit, the trend of change in specific speed will be more moderate due to the flexible adjustability of the unit, the transfer coefficients will also change relatively slowly, which is more favorable for the changing in stability region.

4. The Procedure of Load Optimization

Regarding the variation of the operating points of the pump-turbine during the variable-speed process, this section takes the operating area shown in the model curve as the experimental basis to explain the efficiency optimization process of pump-turbine within the achievable range. As mentioned before, the output power and speed parameters are related to the head, which will affect the efficiency of the unit (the input power setpoint is imposed by the grid conditions in pump mode). If the speed can be adjusted, it means that the unit can track the current best efficiency operating point with maximum advantage under any effective head, thereby improving the external performance of the unit and reducing the hazards caused by flow instability inside the machine [39]. This section focuses on the optimization process of speed and opening when the head/power changes under two working conditions. Several dynamic responses of the governing system are simulated based on the signal transmission and the data of the model test.

4.1. Control Strategies

The governing system of the variable-speed unit has the following two control strategies: speed priority control strategy and power priority control strategy, which are applicable to different working requirements, both of which are based on the current load and head to output the optimal speed and guide vane opening. The coordinated control diagram is reported in Figure 8, which is a feasible control method for variable-speed units. The operating characteristic curves of the generation and pump modes are contained in the coordinating controller, which includes the relationship between the guide vane opening, unit speed, and power. The optimal speed and guide vane opening of the unit can be calculated automatically by interpolation according to the load optimization steps, which can be used as the basis for power and speed control of the variable-speed unit. The optimization scheme can be calculated from the comprehensive characteristic curve of the pump-turbine model or optimized through the accumulation of actual operating data. This process will provide a parameter basis for the coordinated control of speed regulation and excitation system.

4.2. Load Optimization Process of Variable-Speed Pump-Turbine

The load optimization process is a procedure of adjusting the operating point according to the criterion of maximum efficiency in pump and generation mode. This section is based on the operating curves obtained from the model test (the parameters and details of the pump-turbine and the model test are described in Section 5). The specific steps for the optimization of speed and opening under two operating modes are mainly demonstrated below.

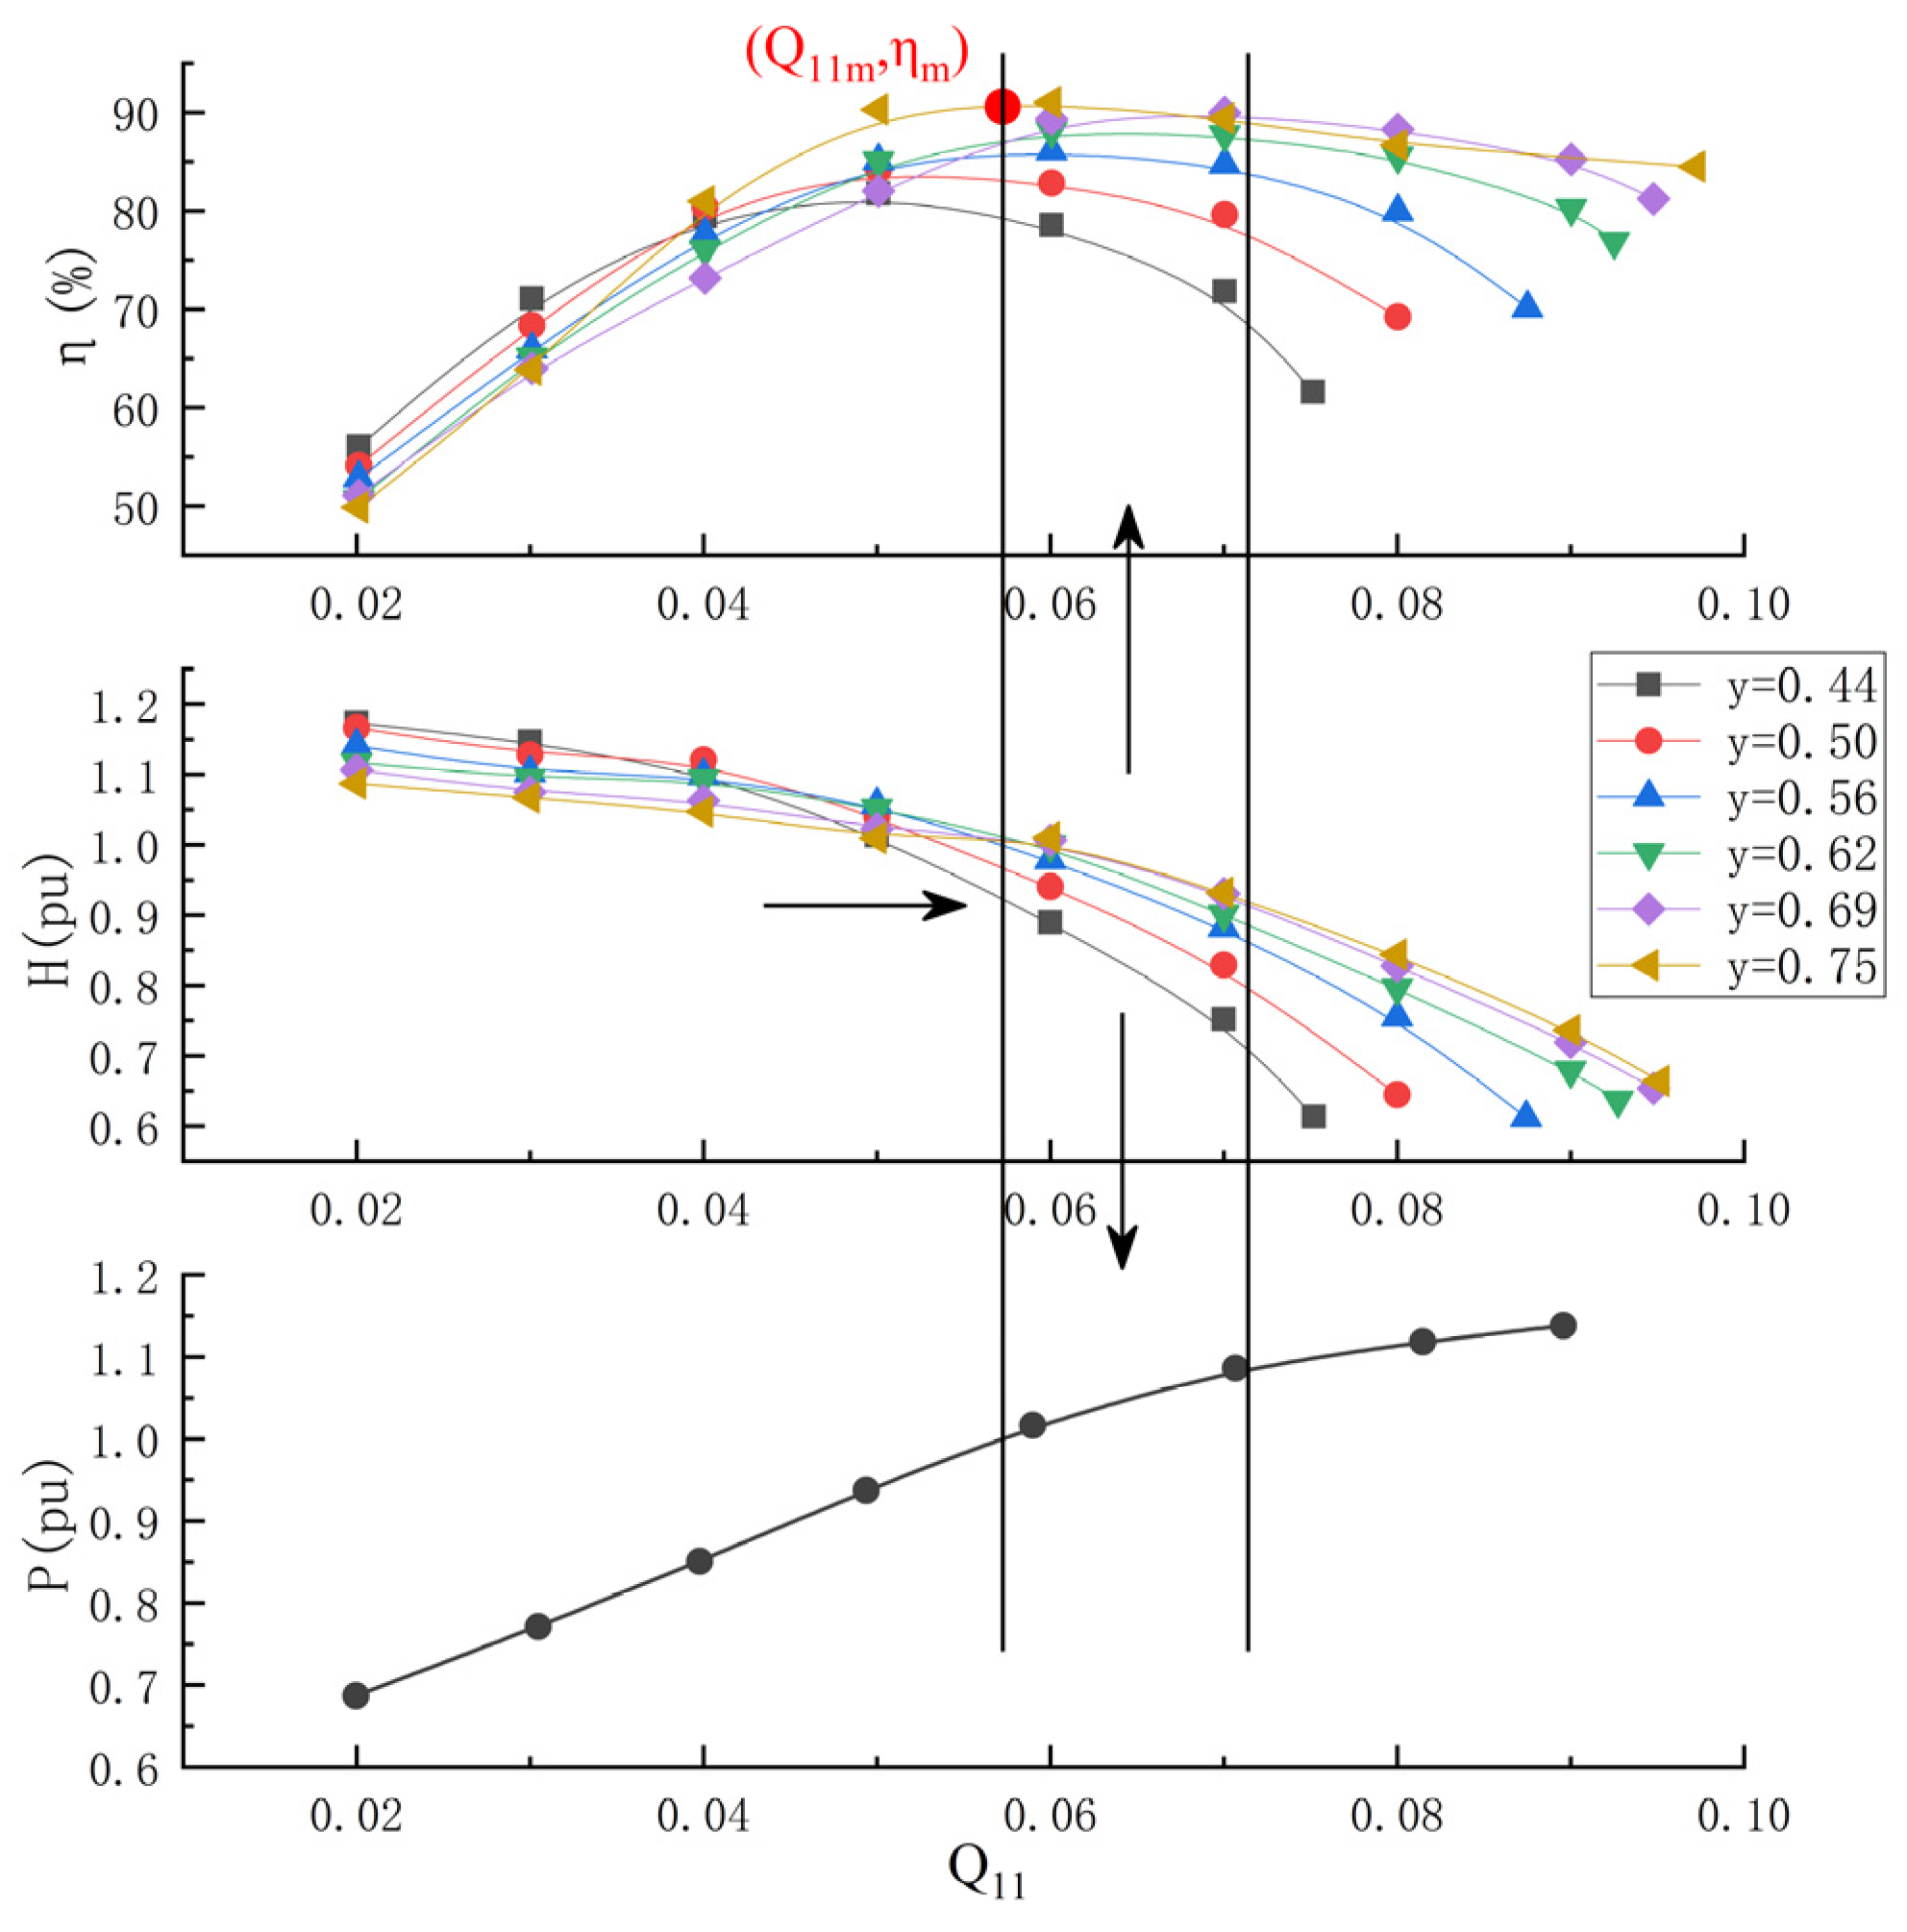
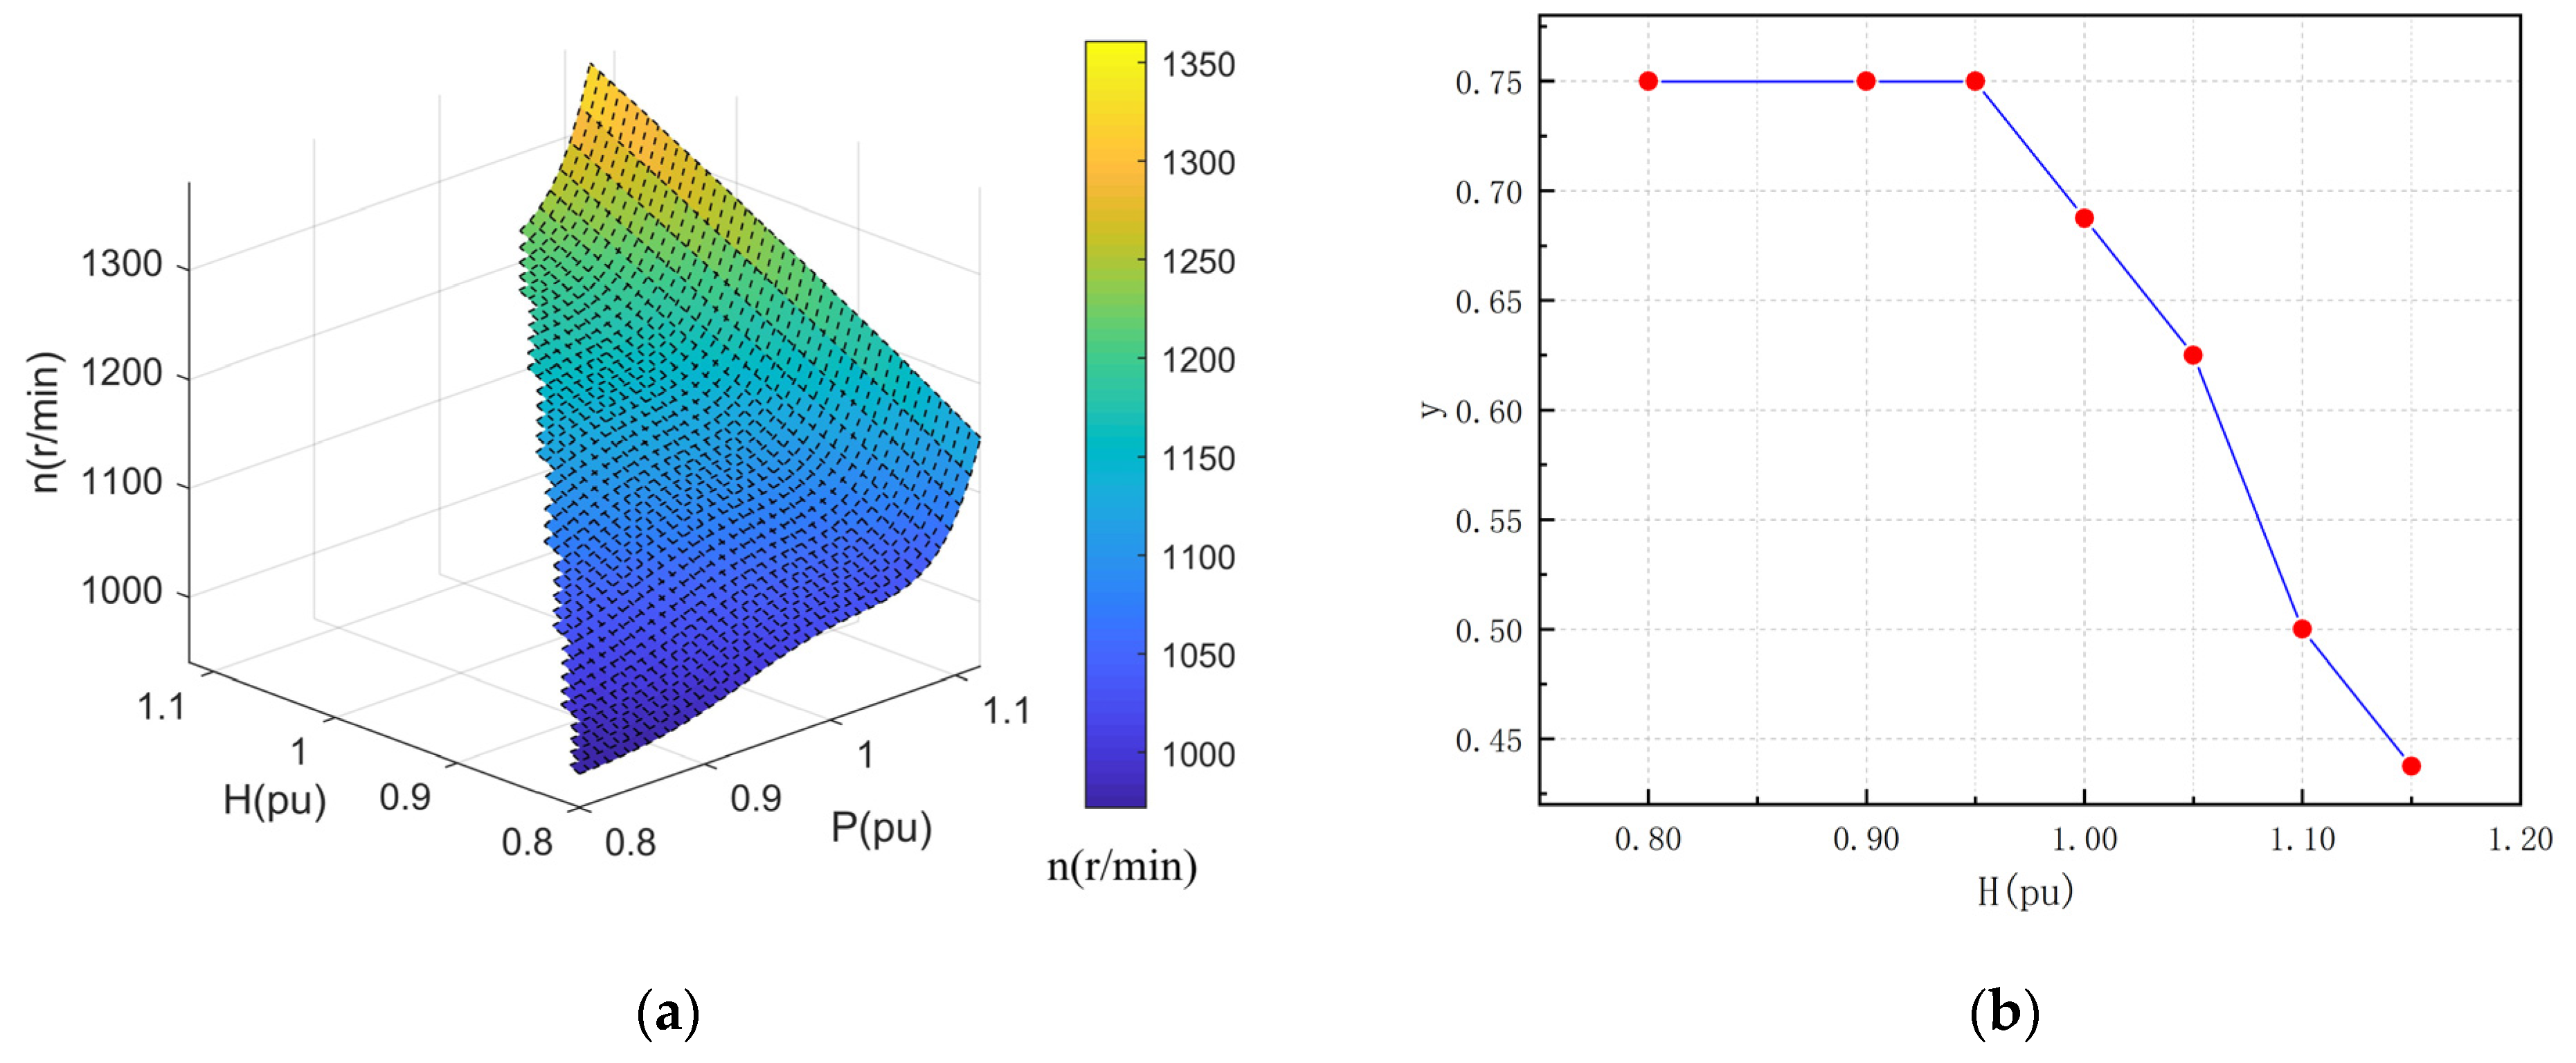
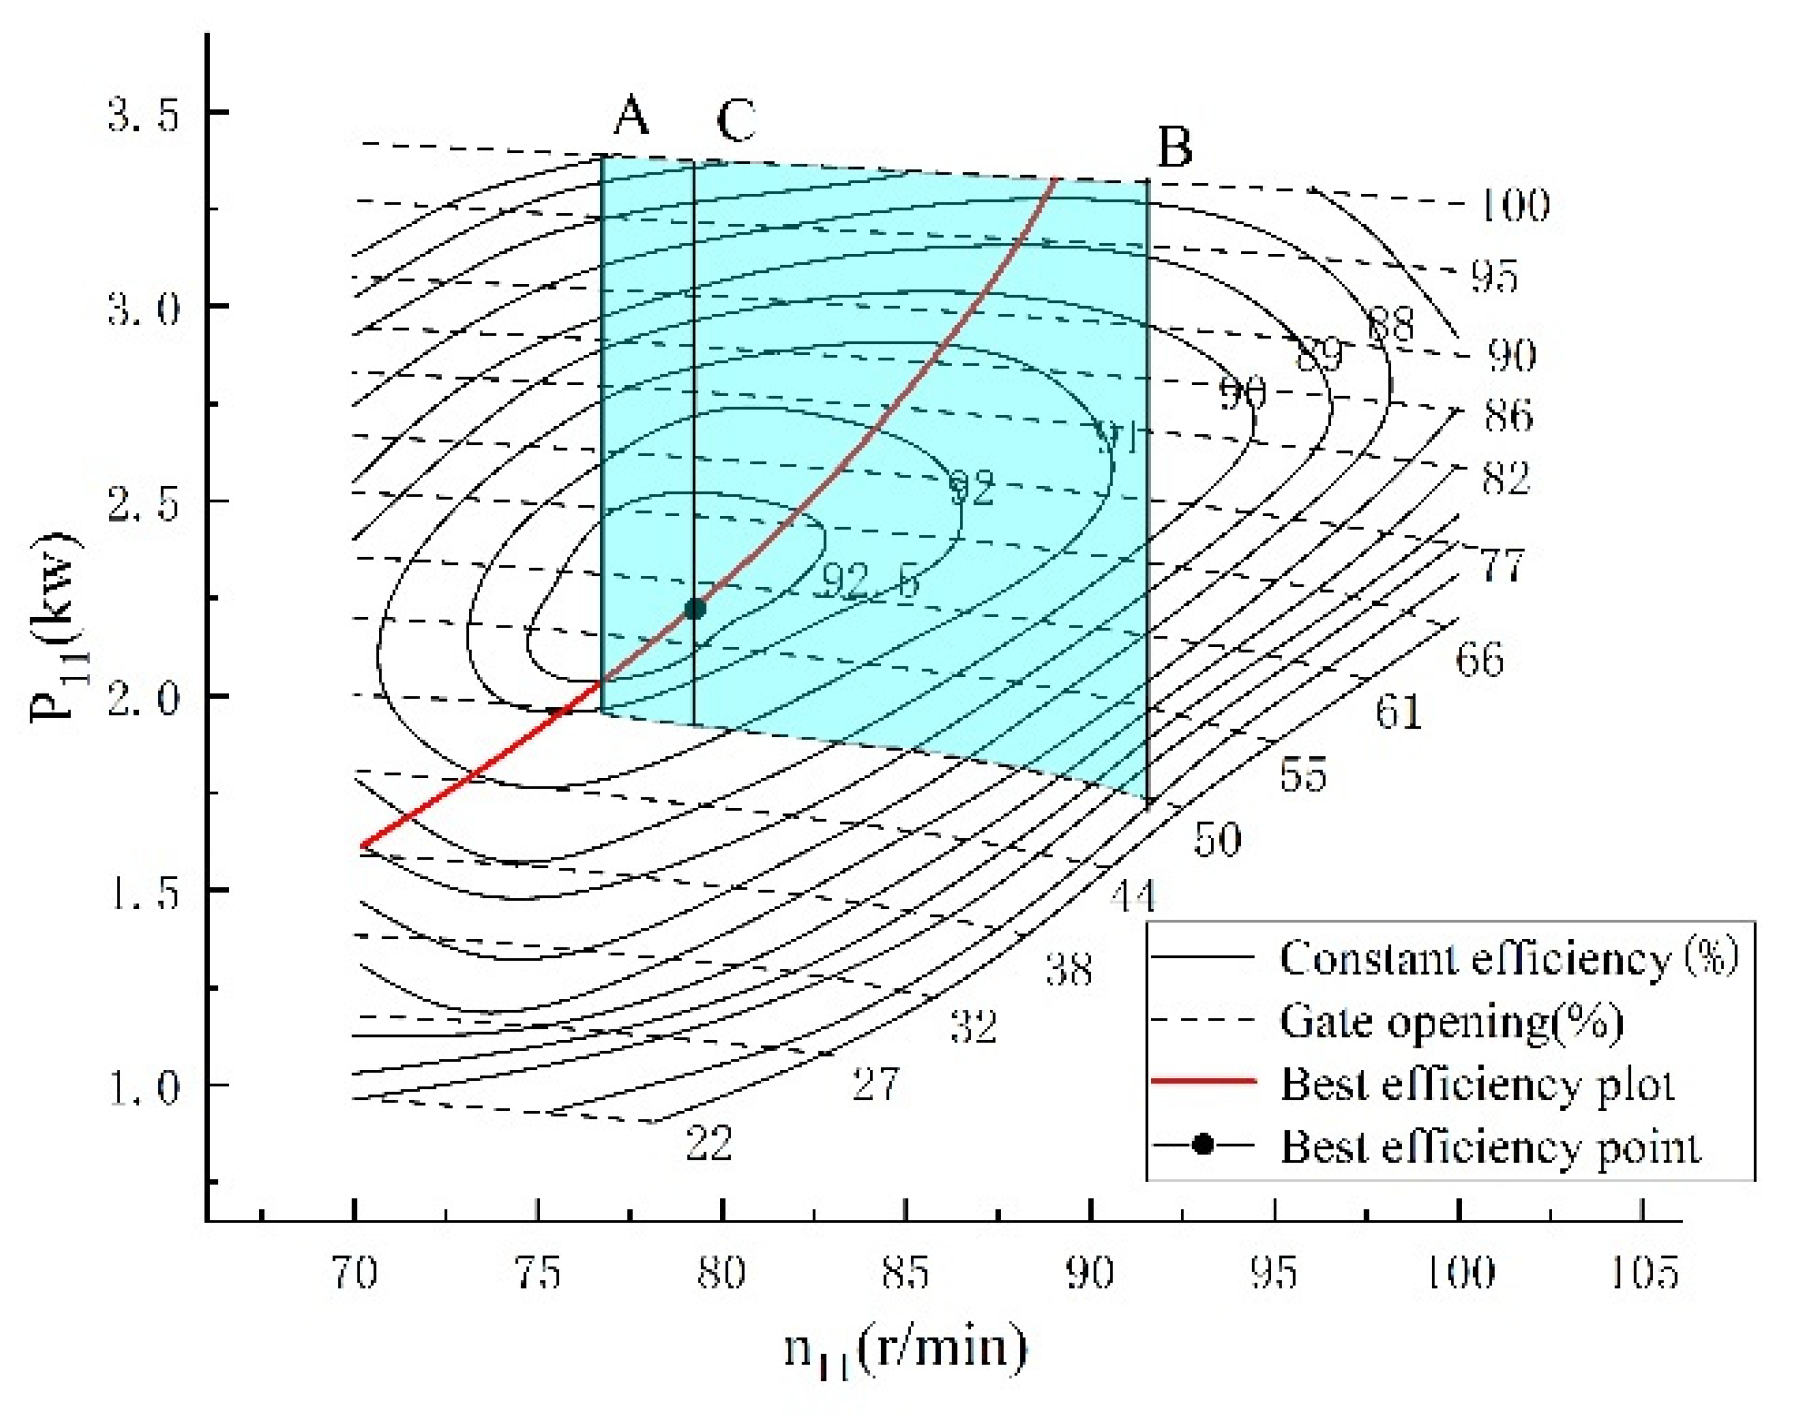
4.2.1. Efficiency Optimization in Generation Mode

According to the Hill diagram of the pump-turbine (see Figure 9), when the unit discharge Q11 is constant, the efficiency η will vary with n11, so that the best efficiency point corresponding to the pump-turbine to each unit speed n11 can be obtained, which is marked as the solid point in Figure 9, which is connected to obtain the optimal efficiency curve of pump-turbine: η best = f 1 ( Q 11 ) , substituted into Equation (2) to receive the maximum output curve of pump-turbine: P 11 max = 9.81 Q 11 η best = 9.81 Q 11 f 1 ( Q 11 ) = f 2 ( Q 11 ) ;
Now two function curves f 1 and f 2 are obtained, both with independent variables Q11. When the system receives the current output power Pc and head values Hc, the corresponding optimal efficiency ηc, unit speed n11c and unit discharge Q11c can be obtained according to the fitting calculation. In addition, the relationship between guide vane opening and other unit parameters is contained in Figure 9. Therefore, the optimization process of optimal unit speed and opening has been realized so far, the next step is to convert the unit speed to prototype rotational speed.
According to n 11 = n D 1 H in Equation (2), the current optimal speed of the prototype unit can be updated, which will become the regulation target value in the turbine regulation system.
Through the elaboration of the above process, Figure 10 shows the operation curve fitting processing results of a variable speed pump-turbine under a certain head and power range domain. Figure 10a can be seen as a look-up table, and the corresponding efficiency and opening values are shown in Figure 10b, which shows the efficiency increase during the variable-speed process, especially at high unit speed, i.e., low head conditions, where the efficiency increase is more obvious.

4.2.2. Calculation Process in Pump Mode

The determination of the optimal speed and opening in pump mode can also be resolved by tracking the operating characteristic curve. Unlike the situation in generation mode, the speed in pump mode is realized by the motor-side power control strategy where the head and power levels are specified. Therefore, the electric signal response could be used to achieve rapid power adjustment in pumping mode. Nevertheless, it is still possible to define an optimal guide vane opening to match the active power level of the current machine side to improve the external performance of the unit.
Similar to the generation mode, the process of load optimization calculation in pump mode is also based on the characteristic curve of the model test, as shown in Figure 11. The flow of the pump-turbine has a certain limiting relationship with the head and efficiency when the input power changes. First, the head of the prototype unit should be determined from the model unit according to the law of similarity [40], and then the efficiency and flow corresponding to different openings at the rated head can be found according to the arrows drawn in Figure 11. It is observed that the efficiency of the pump-turbine is a set of curves related to the opening at the rated head, and a maximum efficiency point can be found, recording the point (Q11m, ηm), and the optimal guide vane opening value is then obtained.
The calculation of the unit speed in pump mode requires the application of the full characteristic curve in Figure 4. The unit speed can be determined in the third quadrant curve based on Q11 and the opening, and the conversion from unit speed to prototype is the same as the last step in generation mode, which is not repeated here.
We then fitted and calculated for a certain head interval; the calculation results are shown in Figure 12, where Figure 12a is the speed calculation result and Figure 12b is the obtained guide vane determination curve.

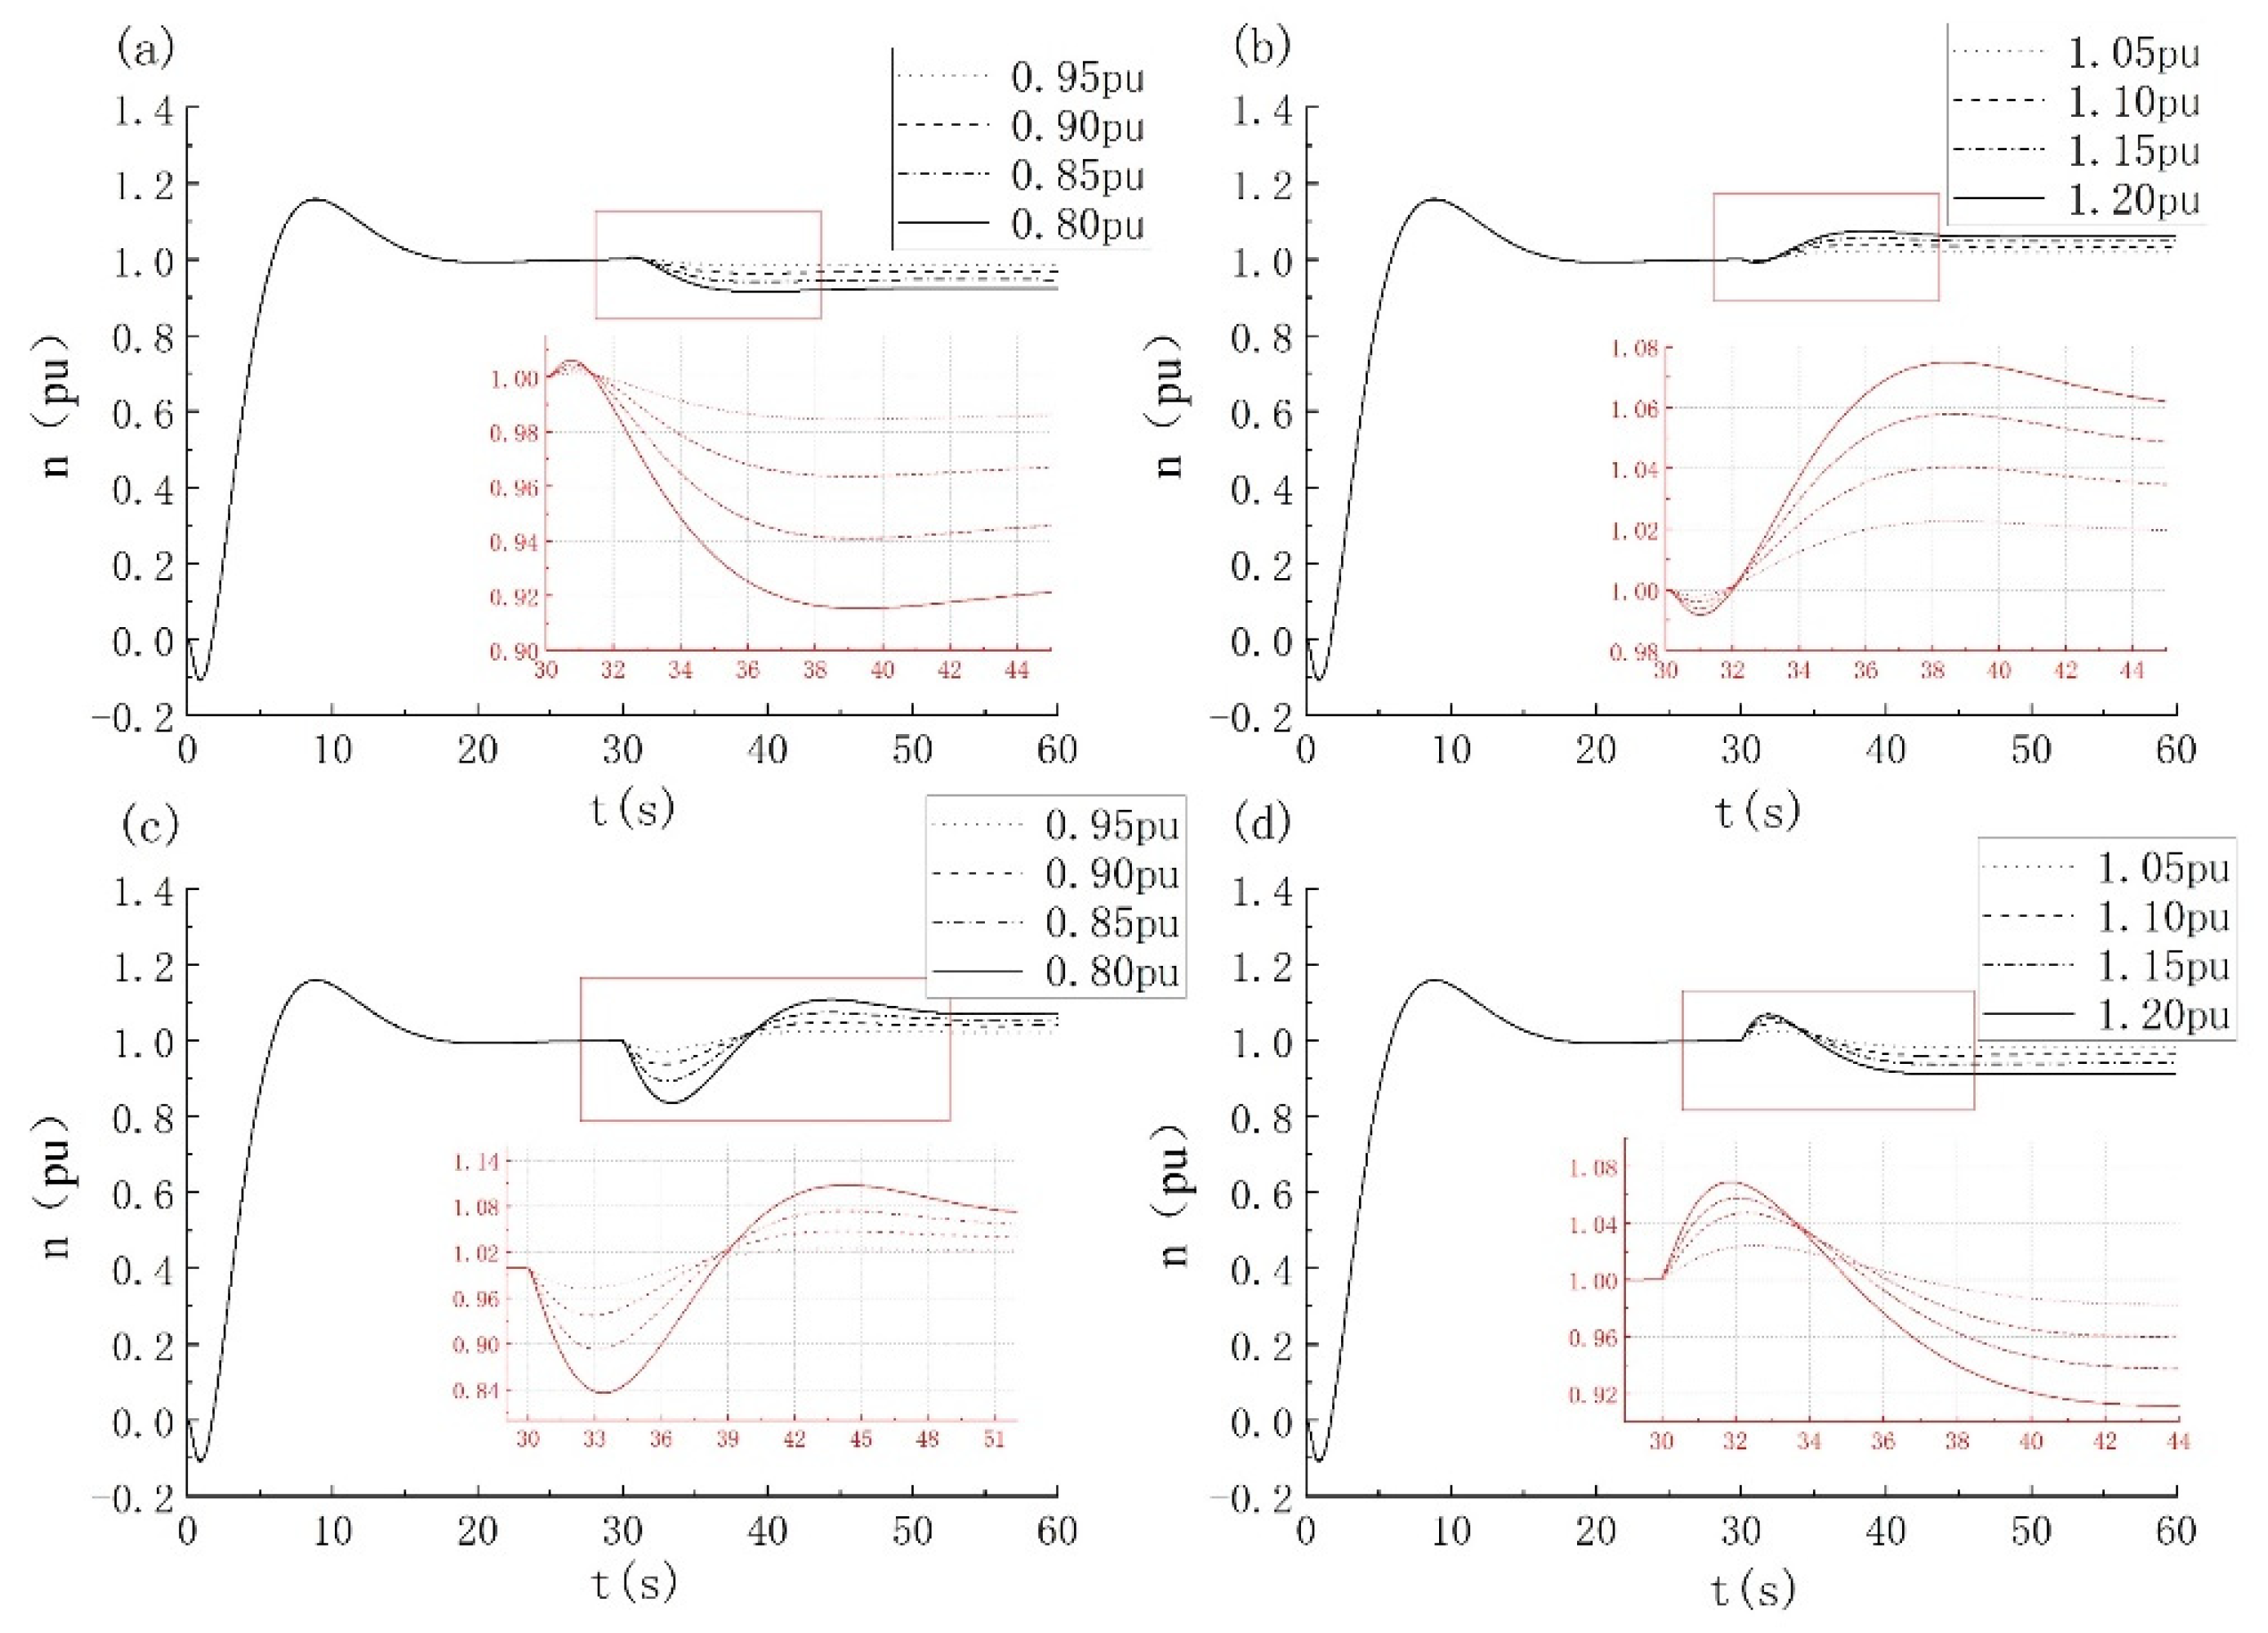
4.3. Simulation Results of the Control System

Applying the load optimization process, the simulation results of the regulating system are shown in Figure 13. Figure 13a,b shows the dynamic speed response curves, as the power setting value changes at 30 s, and Figure 13c,d shows the response curves of the head variation. It can be noticed that the operating point of the unit has a corresponding dynamic fluctuation as the power and head of the variable-speed unit change. Under the same initial and changing range conditions, the head variation has a greater impact on the control system. In addition, the adjustment system requires a longer stability time, which illustrates that the variable-speed hydroelectric unit has high requirements for the accuracy of the head measurement, and the setting of the governor dead zone should be considered. Take the increase of speed as an example: with the increase of power signal, the speed of the turbine increases. The rate of the turbine speed in Figure 13b is 1.925%, 3.405%, 4.803%, and 6.132%, respectively. Similarly, in the case of reduced head, the rate of increase is 2.192%, 3.953%, 5.642%, and 7.243%. The variation of the regulation system has less volatility at different power variations. Considering the actual head range and output limitation of the hydropower station, the speed range can be further revised.

5. Adjustable Performance of Variable-Speed Pump-Turbine

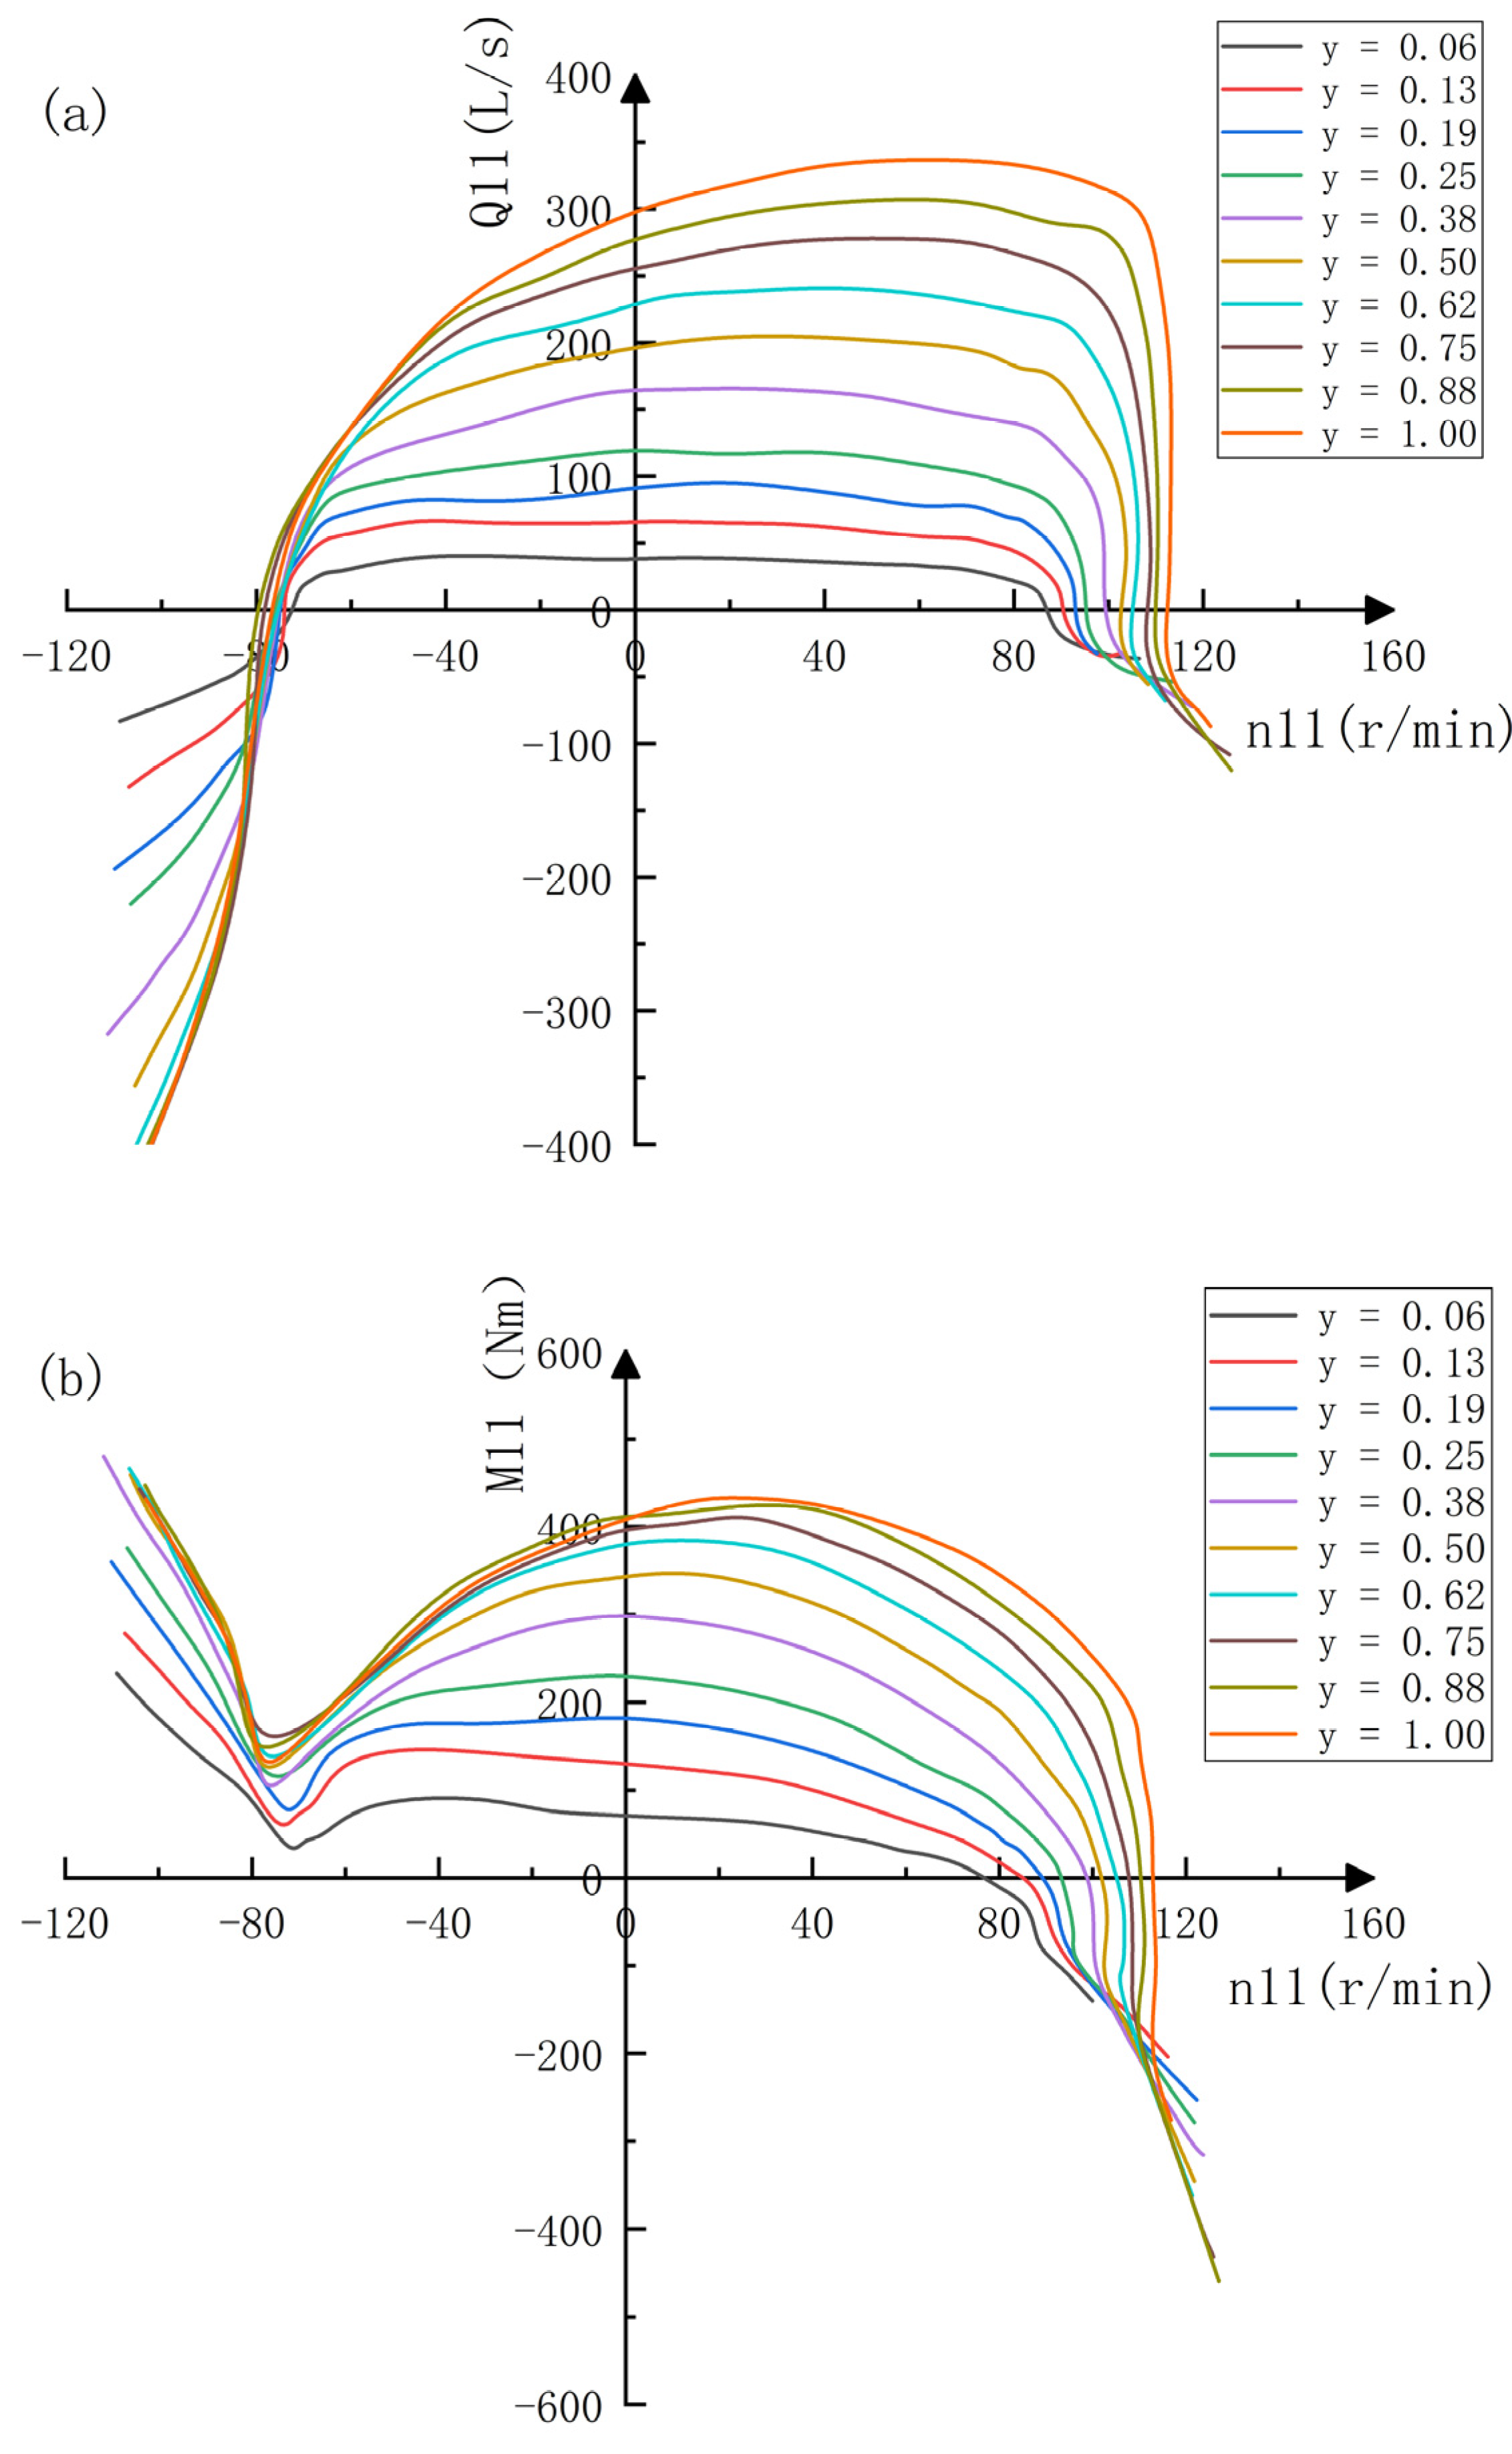
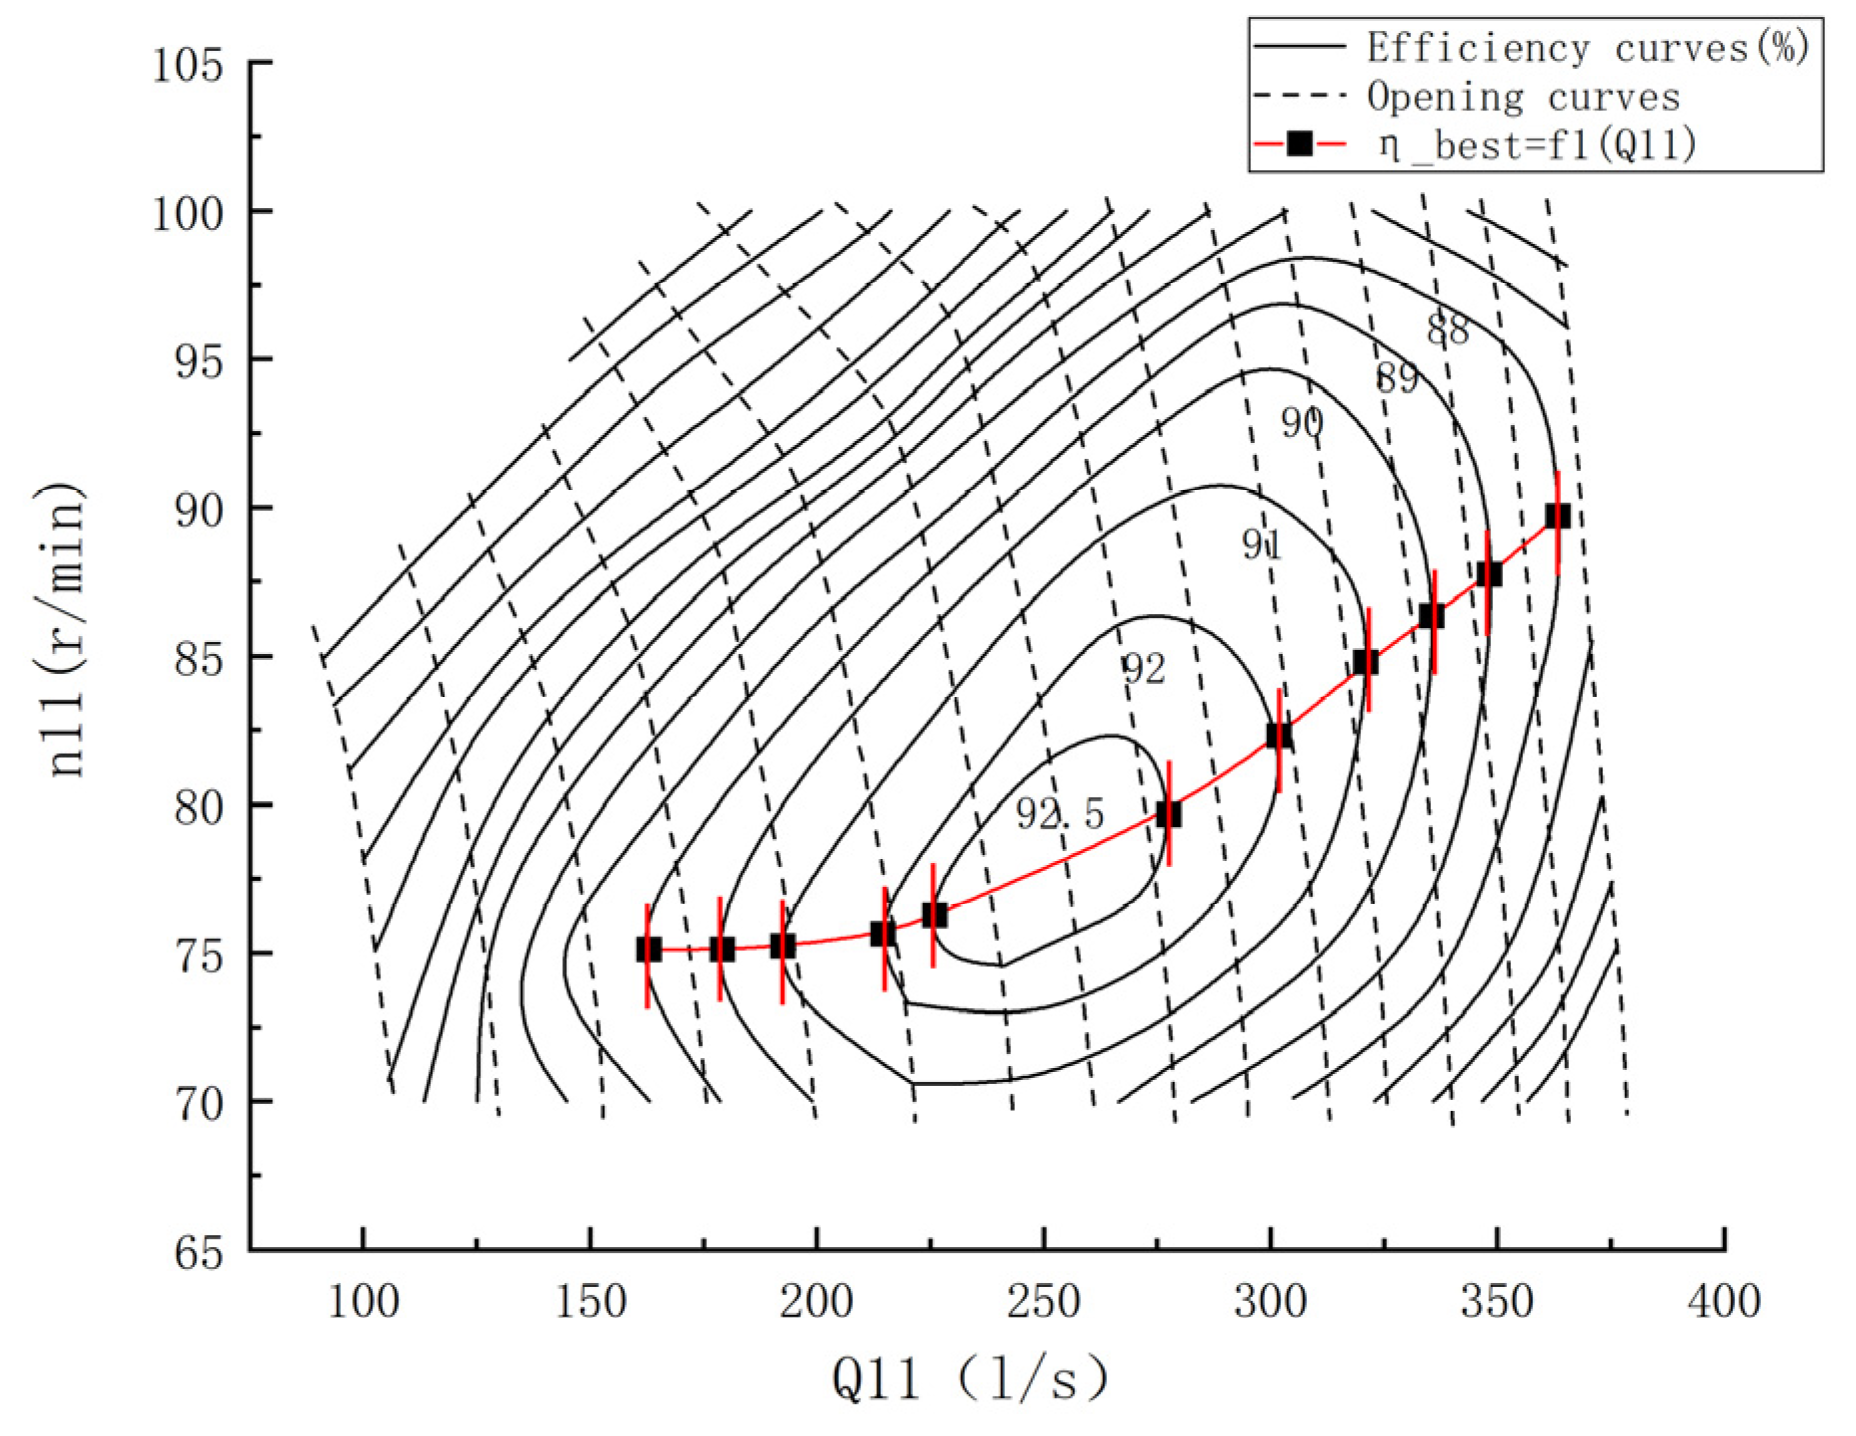
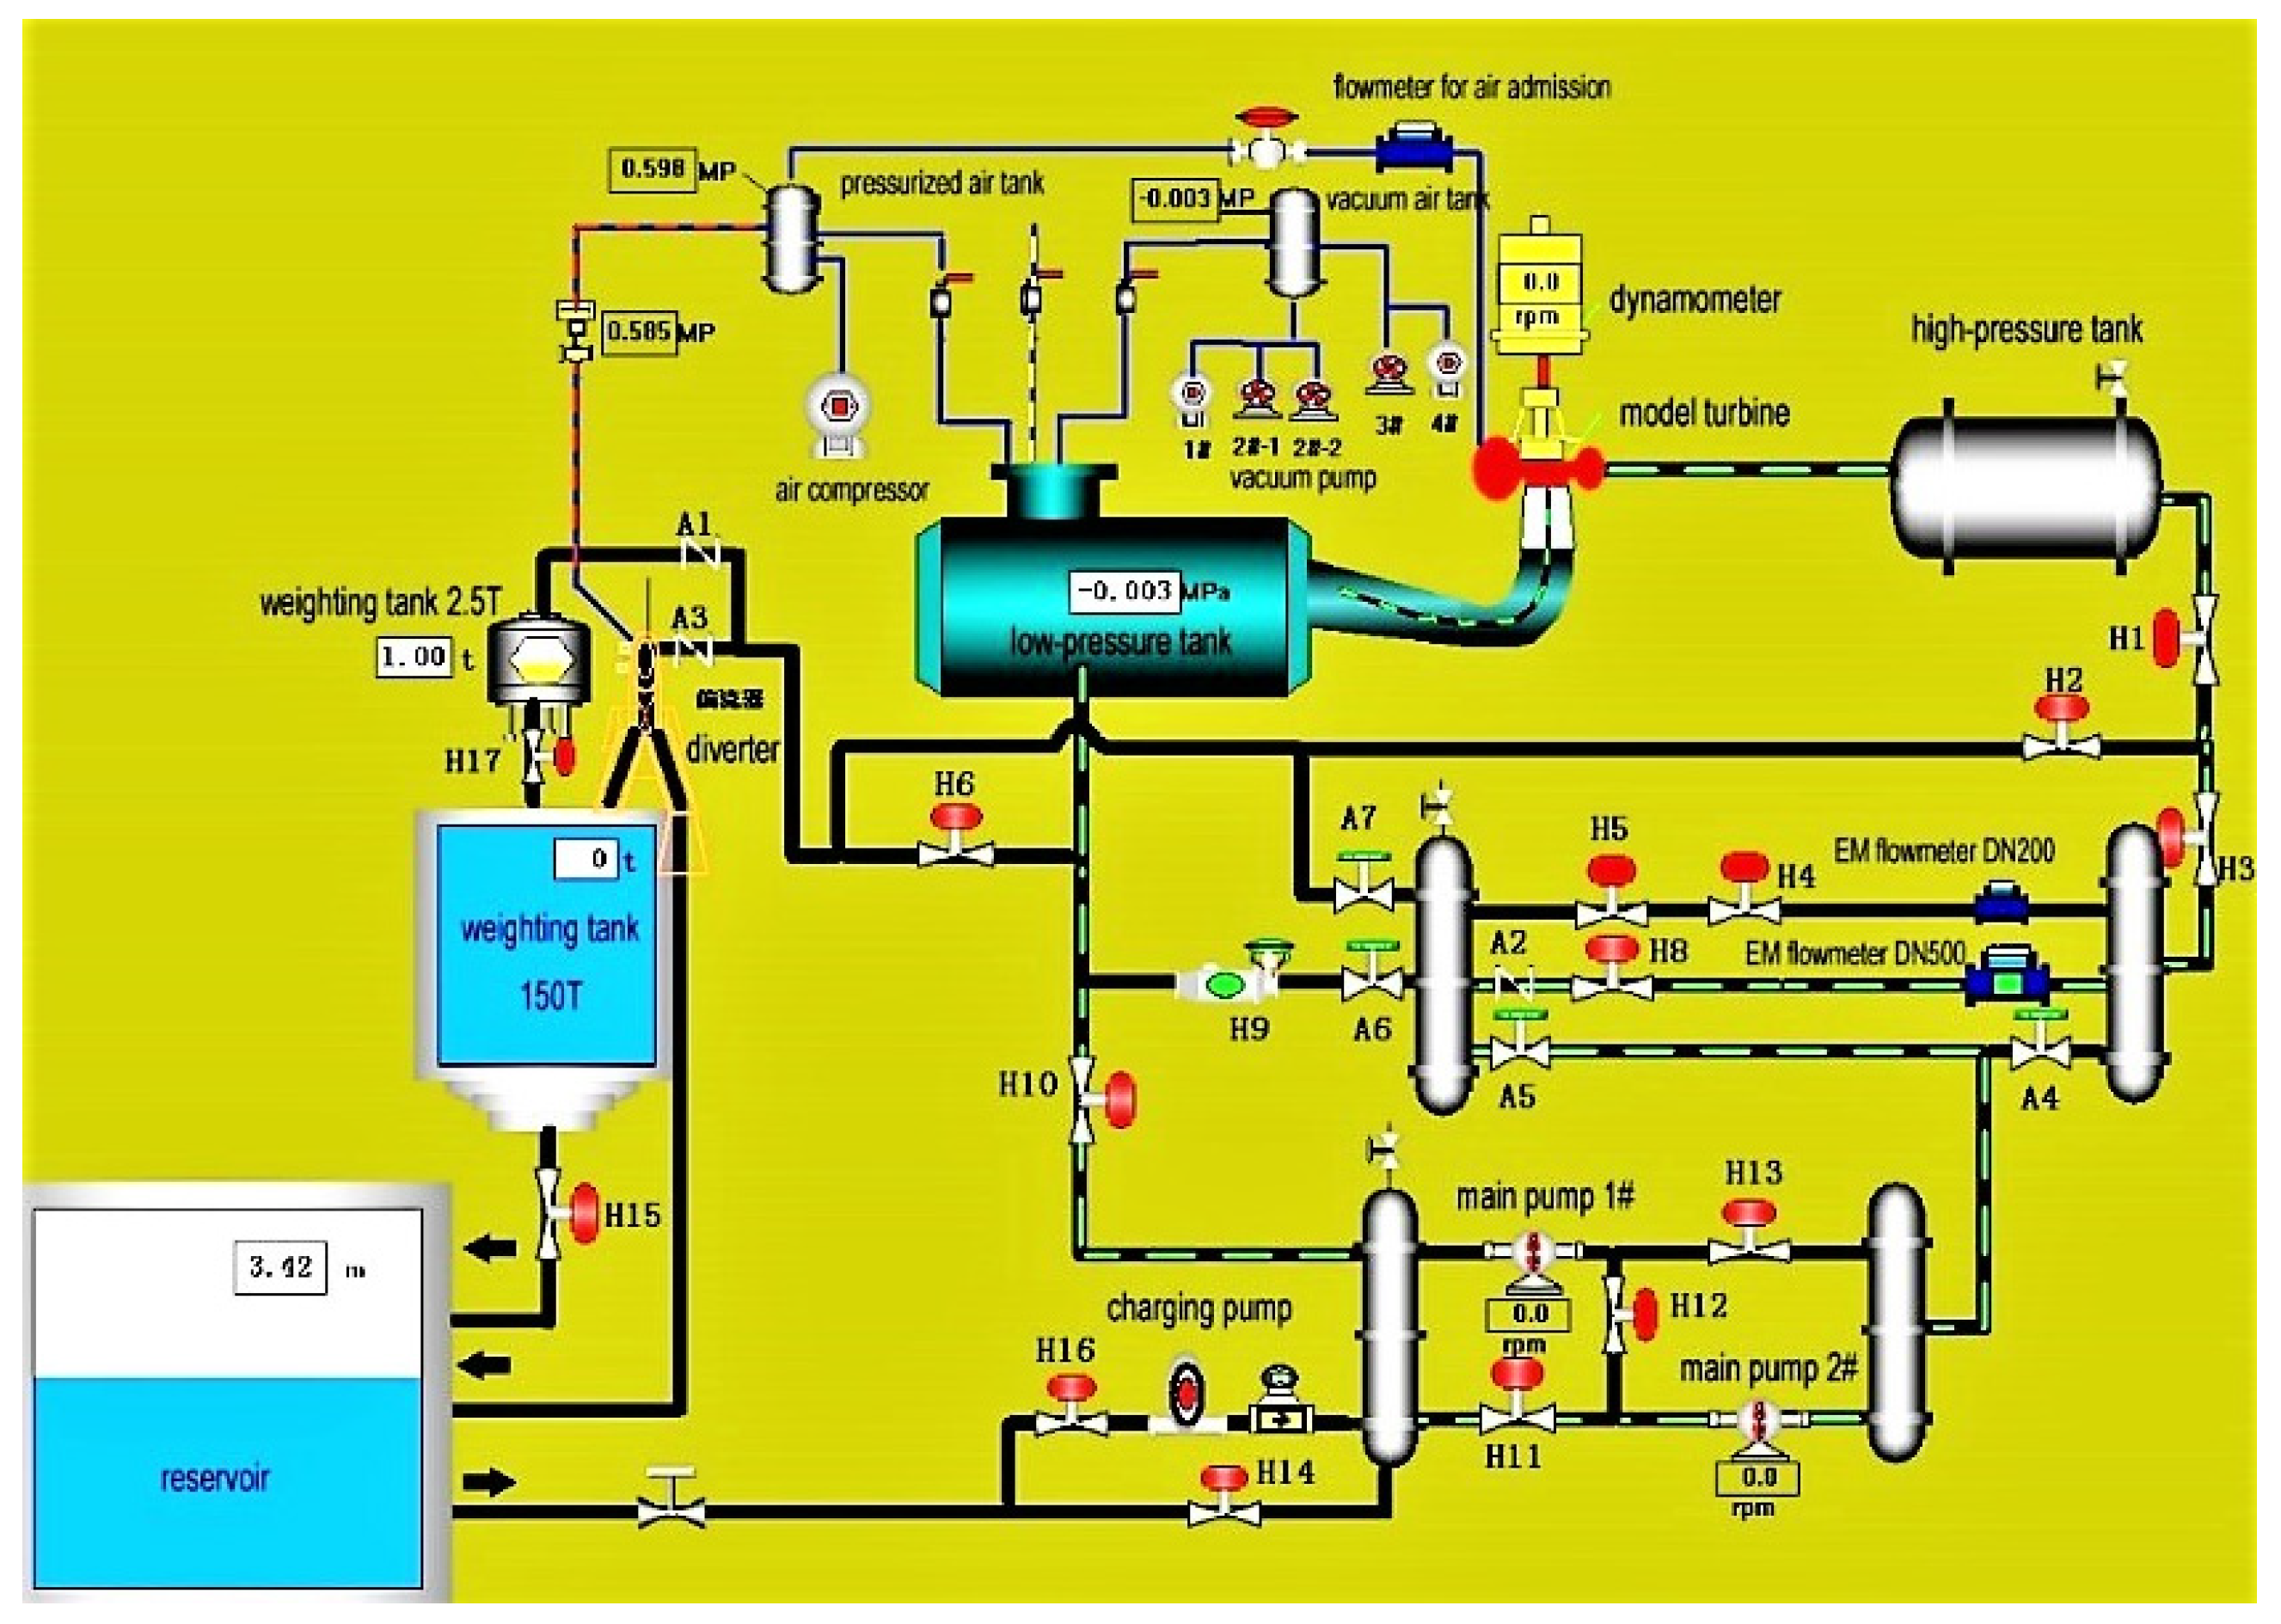
5.1. Introduction to the Test Bench

The experimental research is carried out on the Universal Test Rig for Hydraulic Machinery (UTR-HM). The UTR-HM is a closed-circuit system, with the capacity of testing head >100 m and discharge >2.0 m3/s [41]. As shown in Figure 14, the test system consists of a low-pressure tank, high-pressure tank, main pumps, dynamometer, electromagnetic flowmeter, and model turbine. The model turbine is installed between the high-pressure and low-pressure tanks, coupled with the speed regulating dynamometer. In order to adjust the system pressure, a pressure regulating system which provides pressurized air, vacuumed air, and ambient air is connected to the low-pressure tank. High precision transducers and systems are adopted to acquire data, and pump-turbine model tests generally take the best operating point for uncertainty analysis. The relative error corresponding to the uncertainty of this test bench is less than ±0.2%.
Taking the pump-turbine model test of JFP1252A as a study case, the data and the characteristic curves are analyzed on the TP1 test bench of the Hydraulic Machinery Laboratory of the Hydropower Equipment Quality Inspection and Testing Center of the Hydropower Station, as shown in Figure 15. The model unit is installed on the TP1 model universal test bench, the volute inlet is connected to the pressure tank through the connecting tube, the draft tube outlet is connected to the draft tank, and the pump-turbine model is connected by a motor-generator through the main shaft. The machine can be operated as a generator or a motor to meet the requirements of different test conditions in pump or turbine mode. Viewed from the generator to the pump-turbine from the working condition of the turbine, the rotation direction of the runner is counterclockwise. The rated parameters of the model turbine are given in Table 2.
As the energy transmission part of the rotating machinery of the hydropower unit, the pump-turbine can achieve a substantial increase in efficiency and wide-range adjustment ability according to the energy relationship between the speed and guide vane opening. By analyzing the characteristics of the regulating system in the time domain, the working characteristics and response performance on the time scale are obtained. To further explore its adjustment range, it is necessary to conduct spatial characteristics research corresponding to different working conditions. This section uses a model test as the data basis to realize the feasibility of the operating space. The phenomenon of the variable operating range under two operating modes is discussed.

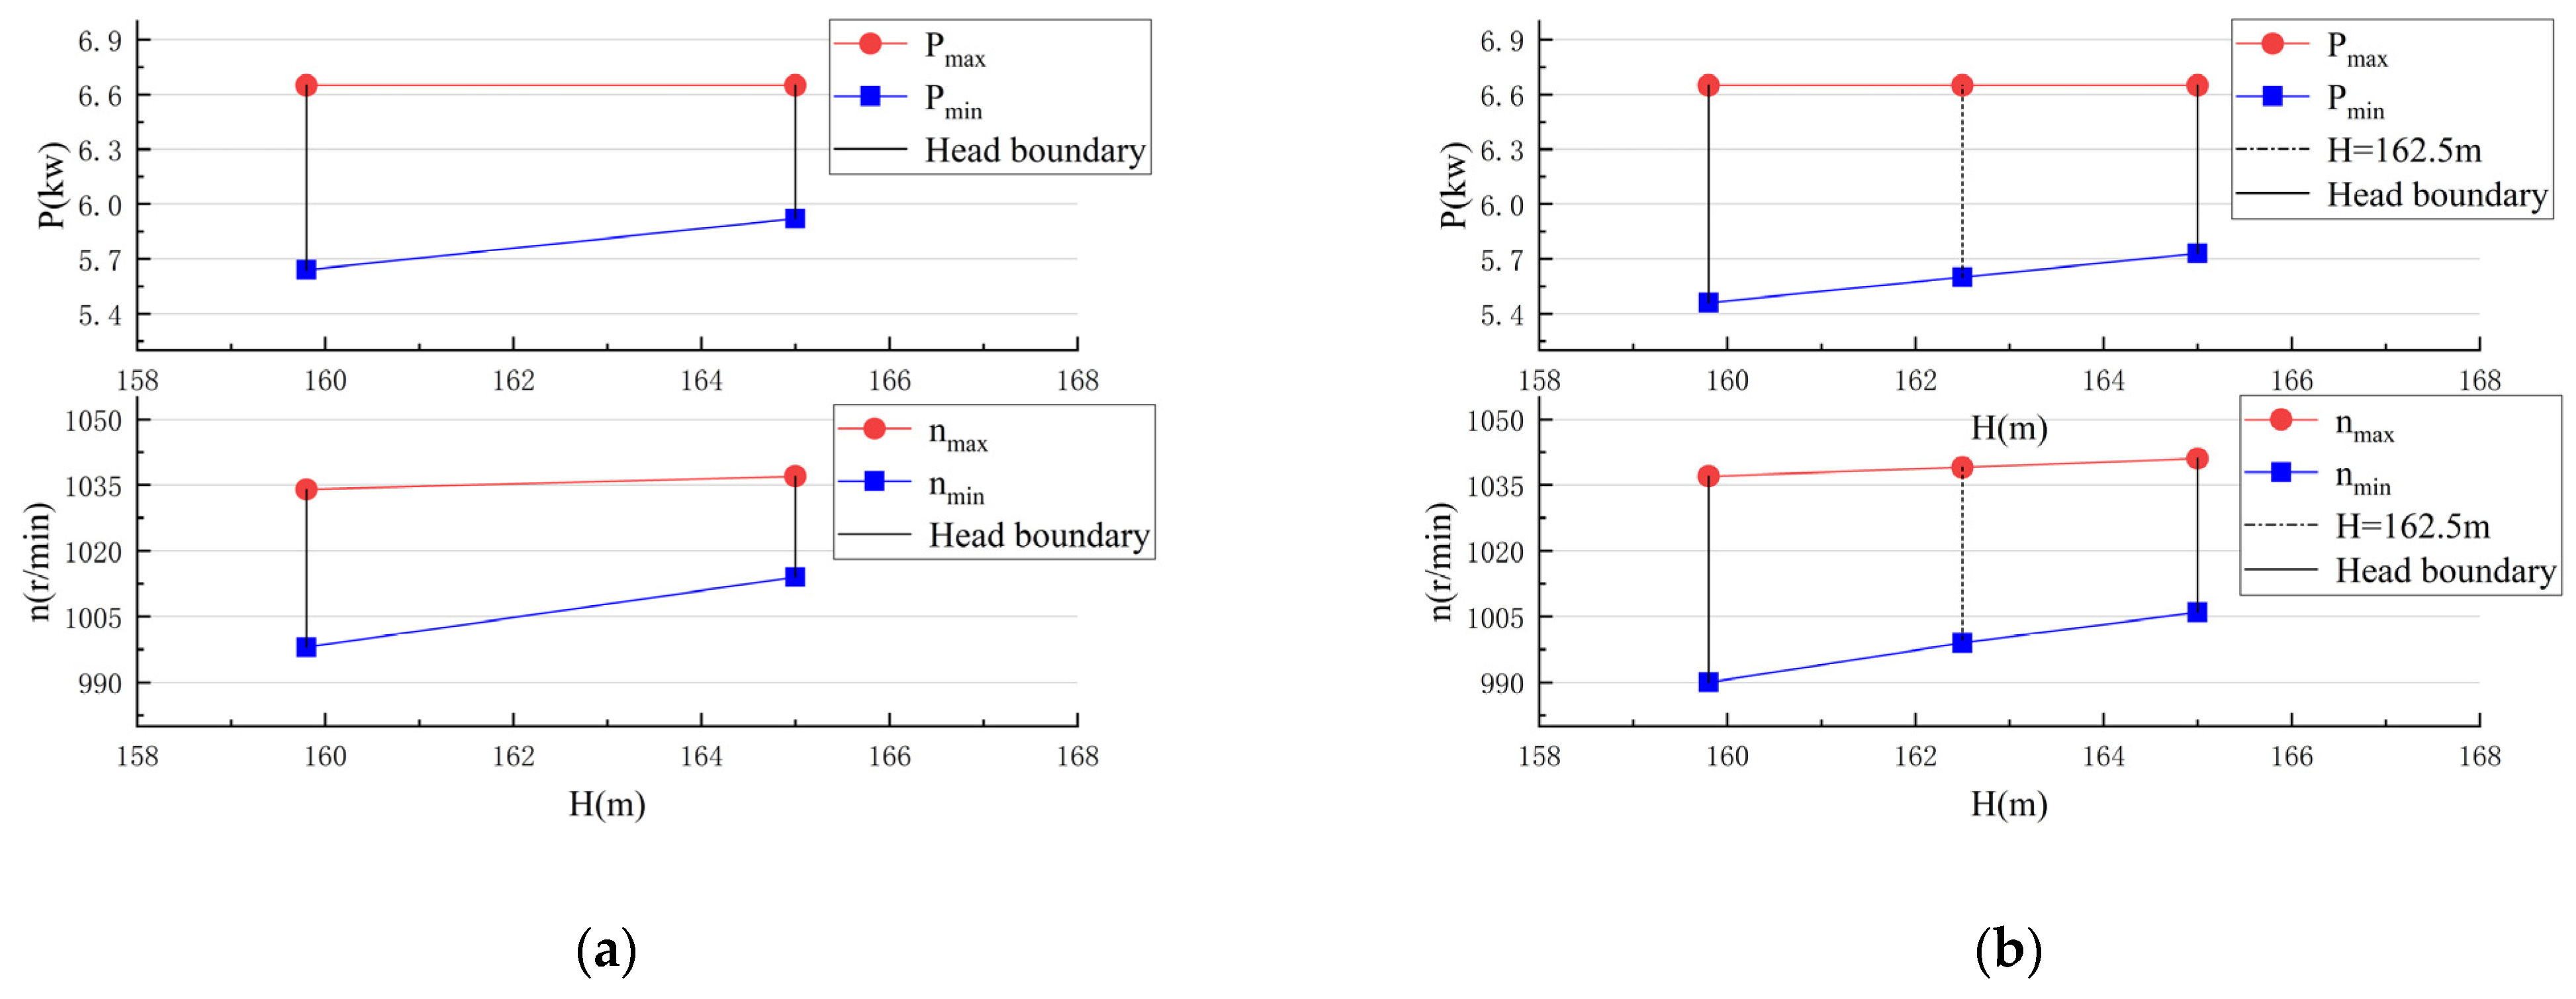
5.2. Generation Mode
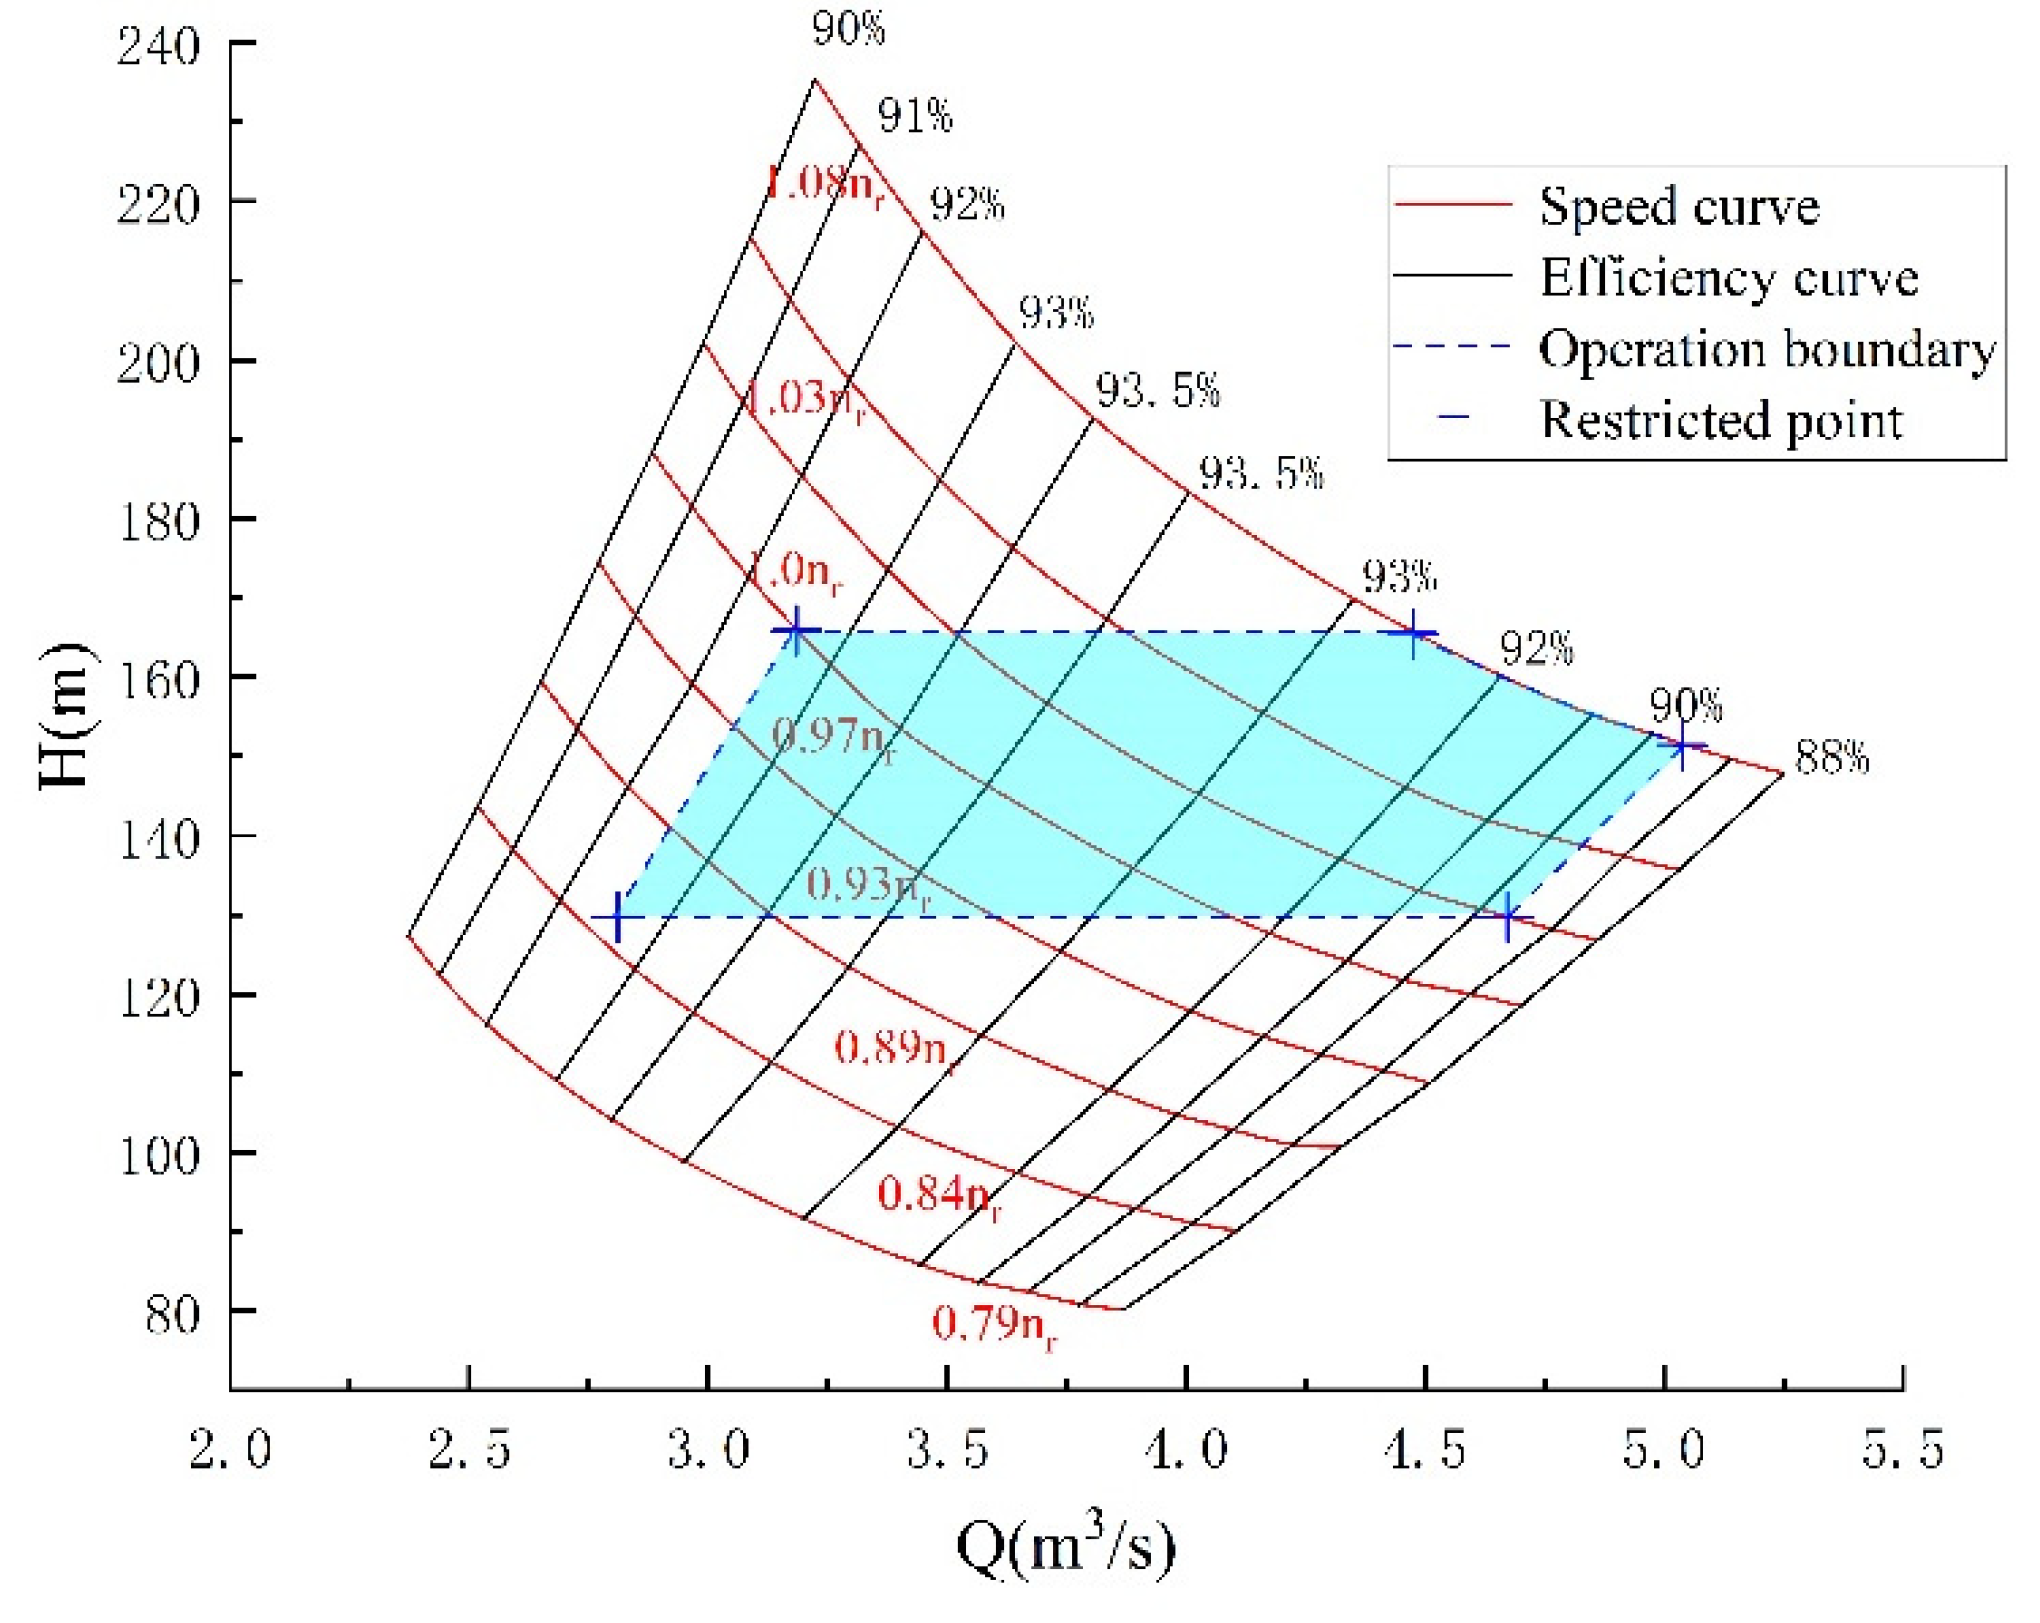
For typical Francis turbines, the efficiency hill diagram is drawn by the unit values N11-Q11 to highlight the characteristic relationship mentioned in Section 4. To facilitate the observation of the relationship between the rotational speed and output power, a new form of hill diagram is regenerated in this section to extract the optimal efficiency of the unit for various head and input power levels [42]. As shown in Figure 16, the solid lines represent various efficiency curves, which are from 85% to 92.5%. The dotted lines indicate different guide vane openings. The vertical axis represents the input power level, and the horizontal axis represents the unit speed of the model turbine.
As reported in Figure 16, it can be observed that the amplitude of the turbine output power changed with rotational speed is related to the slope of the guide vane opening line in the comprehensive characteristic curve of the turbine model and efficiency change rate under the same opening operating condition. However, the slope of the opening line of the guide vane is relatively small in generation mode, and the efficiency change is limited. Therefore, it is necessary to change the output power of the turbine by adjusting the guide vane opening, and obtain the largest possible kinetic energy variation depending on the change of speed. Similarly, the optimal efficiency of the turbine model under the rated head is 92.8%, and the guide vane opening of the turbine is 57%. Since the pump-turbine is designed and optimized on the premise of pump mode, and the working condition in generation mode is taken as the check situation, the pump-turbine always works at the off-design area when it is used as the prime mover in a conventional fixed-speed pumped storage power station. Line B in Figure 16 indicates the change relationship between guide vane opening and output power under a fixed-speed condition. It can be obtained that when the head is higher than the rated value, the efficiency of the turbine will show a slow decreasing trend as the opening of the guide vane increases, which is caused by the inverse relationship between the speed and the head. Considering the limitation of head and output power, the unit can eventually operate in the AB range. As the opening reaches 95%, the efficiency of the unit is only increased from 87% to 89% through a large change of the speed. It is further demonstrated that the adjustment effect of a fixed guide vane opening will not be particularly obvious in generation mode. Similarly, observing the area surrounded by BC, following the curve of the guide vane opening of 50% at the minimum power, a better efficiency up-gradation can be acquired while reducing the speed. Furthermore, if the guide vane opening can be adjusted to 66% while reducing the speed, a turbine efficiency of 92% can be easily obtained within a small range of speed changes.
Figure 17 shows the discharge-power ratio of conventional units and variable-speed units. It is observed that the discharge-power ratio of the two types of units overlap at the design head, while the difference at the left end is large, which indicates that the efficiency of the variable-speed pump-turbine is improved, resulting in the operation process producing less discharge with the same power (about 15% less discharge at 0.7 head) than the conventional unit at different heads, and it is applicable to various guide vane openings. It should be noted that for high head conditions, the effect of changing the speed to track the high efficiency of the unit is not obvious (two curves almost coincide at high head). Therefore, corresponding parameter requirements should be set to avoid frequent state changes of the unit under high head conditions.
Figure 18 is a partial enlarged view of the variable-speed operating curve in generation mode. It can be noticed that the variable-speed operating range is expanded compared with the fixed-speed unit. The marked points in Figure 18 are the boundary points of the efficient area, the achievable opening variation range is 55–92%, and the speed can be operated from 0.85 pu to 1.08 pu. From the above analysis, we can conclude that when the unit is in the state of high head and high power, the effect of tracking the high-efficiency point by adjusting the speed is not obvious. With the decrease of head and power value, the method of load optimization can achieve greater efficiency improvement (the increase and decrease trend of power and head is same). For loads with different heads and discharge in a certain range, the corresponding optimal state operation can be achieved by adjusting the operating point.

5.3. Pump Mode

For conventional pumped-storage power stations, the working condition of the unit depends on the grid supply. Due to the narrow high-efficiency area and the restriction of cavitation with large flow, the prevention of inlet backflow at small flow rates should also be considered. Accordingly, the best operating point is generally determined according to the head-opening coordination curve during the adjustment process. The adjustable capability of the variable-speed unit will be broadened by the control strategy of a motor-side converter, which realizes the rapid response of the electromagnetic torque of motor. However, it is still necessary to consider the adverse effects of the hump zone of the operating characteristics in pumping mode. In this section, under the condition that the shaft power is less than 6.7 mw and the hump safety factor is greater than 2%, the rotational speed, input power, and efficiency of the intersection of the head and the circuit characteristic curves at different guide vane openings are calculated. The variable-speed characteristics and the input power adjustment range of the fixed guide vane opening at 52.6% and 63.2% are reported in Figure 19. The results show that the smaller the opening of the guide vane is, the larger the input power adjustment range becomes, but the operating efficiency decreases, which is due to the aggravation of internal cavitation caused by the decrease of the total pressure. Besides, the model test shows that the cavitation performance of the input power adjustment range deteriorates as the opening decreases. In this case of the study, the optimal opening of the pump under the working condition of 63.2% is selected as a fixed value. It can be observed that the unit can realize the speed adjustment within the range of 0.99 pu to 1.045 pu in the ideal high-efficiency zone at this fixed opening.
Figure 20 shows the prototype of the working curves converted from the model test. Regarding the off-design behavior of the pump-turbine, the minimum speed is limited by the saddle-shaped characteristic of the pump flow-head, while the maximum speed is determined by the maximum input power and risk of cavitation performance. The intercepting head range of 161.2–166.4 m is used to analyze variable-speed characteristics such as input power and speed. The blue area is the ideal operation area of pumping mode (optimal operating area in fixed opening regulating mode, a larger regulation range can be pursued by adjusting the opening signal). The unit operating in this area has a higher efficiency and achievable variation range of input power. The speed variation range is 3.52–4.66%, and the power amplitude of adjustment can reach 18.4–23.8%. Therefore, the pump-turbine with variable-speed operation in pump mode has a wider receiving range of input power, which can meet the power demand of the grid and maintain the optimal operation of the unit itself, and has a great performance promotion compared to the conventional fixed-speed units.

6. Conclusions

In this paper, a model of the turbine regulating system is established and the dynamic effects of the variable-speed operating parameters on the system are analyzed, in which the stability domain boundaries are derived from calculations and the influence trends of some parameters are illustrated. A load optimization method based on the hill diagram and characteristic curves is proposed, with the goal of efficiency optimization in both modes. The variable-speed responses are simulated accordingly. Eventually, the working range and regulation capability of the pump-turbine are elaborated by a model test case, which provides an operational basis for the design and operation of the variable-speed unit to a certain extent. The main conclusions can be summarized as follows:
1.
The variation of the speed and guide vane opening of the hydropower unit have a certain influence on the stability domain of the regulating system. Due to the load optimization characteristics of the variable-speed unit, the working state near the high-efficiency zone within the head range should be set as a long-term consideration condition for better design of the controller;
2.
The optimization process of the optimal speed and opening in generation mode and pump mode are determined, respectively. This method can precisely improve the operation efficiency of the unit and provide evaluation and prediction for the modification of conventional hydropower plants;
3.
Taking the pump-turbine model test as an example, the controllable range and adjustment ability are analyzed, and the adjustable performance and working characteristics of the classic Francis turbine are obtained. It is proposed that in generation mode, the effect of tracking efficiency by changing the speed is more obvious when the unit is operating under the condition of low-head and low-power;
4.
In pump mode, an appropriate fixed guide vane opening can be selected in priority to stability and hump margin, which can also provide a certain adjustment ability of the unit under the fixed guide vane opening during the variable-speed operation.
As an important technology to improve unit efficiency and regulation characteristics, the variable-speed pumped storage unit has a great development space. The load optimization process proposed in this paper can be applied to different turbine types because it is based on the hill diagram of the model pump-turbine. At the same time, there are some inevitable limitations, such as the need for a test and measurement platform with high measurement accuracy, and this paper only analyzes the working conditions of small fluctuations, and does not discuss the transient transition process of large fluctuations. At present, the optimization process of hydraulic turbine analytical model needs to be further explored. In addition to the accurate load optimization process, the control method and parameter identification are still important factors affecting the regulation performance. Moreover, considering the output limit of the hydraulic turbine and the capacity of the converter, the speed change range that can be realized by the optimization process is usually less than 10%. Broadening this range will also become an important content of speed change technology in the future.

Author Contributions

Conceptualization, H.W. and Z.M.; methodology, H.W.; software, H.W; validation, H.W. and Z.M.; formal analysis, H.W.; investigation, H.W.; resources, H.W. and Z.M.; data curation, H.W.; writing—original draft preparation, H.W.; writing—review and editing, H.W. and Z.M.; visualization, H.W.; project administration, Z.M. All authors have read and agreed to the published version of the manuscript.

Funding

This research was funded by the National Key Research and Development Program of China, grant number 2018YFB0905203.

Data Availability Statement

Data available on request due to restrictions eg privacy or ethical. The data presented in this study are available on request from the corresponding author. The data are not publicly available due to the unfinished status of the research project.

Conflicts of Interest

The authors declare that there is no conflict of interest in the research results.

References

  1. Cheng, M.; Sami, S.S.; Wu, J. Benefits of using virtual energy storage system for power system frequency response. Appl. Energy 2017, 194, 376–385. [Google Scholar] [CrossRef] [Green Version]
  2. Beires, P.; Vasconcelos, M.H.; Moreira, C.L.; Peças Lopes, J.A. Stability of autonomous power systems with reversible hydro power plants. Electr. Power Syst. Res. 2018, 158, 1–14. [Google Scholar] [CrossRef]
  3. Sperstad, I.B.; Degefa, M.Z.; Kjølle, G. The impact of flexible resources in distribution systems on the security of electricity supply: A literature review. Electr. Power Syst. Res. 2020, 188, 106532. [Google Scholar] [CrossRef]
  4. Javed, M.S.; Zhong, D.; Ma, T.; Song, A.; Ahmed, S. Hybrid pumped hydro and battery storage for renewable energy based power supply system. Appl. Energy 2020, 257, 114026. [Google Scholar] [CrossRef]
  5. Rahmati, I.; Akbari Foroud, A. Pumped-storage units to address spinning reserve concerns in the grids with high wind penetration. J. Energy Storage 2020, 31, 101612. [Google Scholar] [CrossRef]
  6. Yang, W.; Norrlund, P.; Saarinen, L.; Witt, A.; Smith, B.; Yang, J.; Lundin, U. Burden on hydropower units for short-term balancing of renewable power systems. Nat. Commun. 2018, 9, 2633. [Google Scholar] [CrossRef] [PubMed] [Green Version]
  7. Beevers, D.; Branchini, L.; Orlandini, V.; De Pascale, A.; Perez-Blanco, H. Pumped hydro storage plants with improved operational flexibility using constant speed Francis runners. Appl. Energy 2015, 137, 629–637. [Google Scholar] [CrossRef] [Green Version]
  8. Yang, W.J.; Norrlund, P.; Chung, C.Y.; Yang, J.D.; Lundin, U. Eigen-analysis of hydraulic-mechanical-electrical coupling mechanism for small signal stability of hydropower plant. Renew. Energy 2018, 115, 1014–1025. [Google Scholar] [CrossRef]
  9. Xu, B.; Chen, D.; Venkateshkumar, M.; Xiao, Y.; Yue, Y.; Xing, Y.; Li, P. Modeling a pumped storage hydropower integrated to a hybrid power system with solar-wind power and its stability analysis. Appl. Energy 2019, 248, 446–462. [Google Scholar] [CrossRef]
  10. Bortoni, E.; de Souza, Z.; Viana, A.; Villa-Nova, H.; Rezek, A.; Pinto, L.; Siniscalchi, R.; Braganca, R.; Bernardes, J. The Benefits of Variable Speed Operation in Hydropower Plants Driven by Francis Turbines. Energies 2019, 12, 3719. [Google Scholar] [CrossRef] [Green Version]
  11. Huang, S.; Xiong, L.; Wang, J.; Li, P.; Wang, Z.; Ma, M. Fixed-time synergetic controller for stabilization of hydraulic turbine regulating system. Renew. Energy 2020, 157, 1233–1242. [Google Scholar] [CrossRef]
  12. Zhiwei, G.; Chihang, W.; Zhongdong, Q.; Xianwu, L.; Weipeng, X. Suppression of hump characteristic for a pump-turbine using leading-edge protuberance. Proc. Inst. Mech. Eng. Part A J. Power Energy 2019, 234, 187–194. [Google Scholar] [CrossRef]
  13. Binama, M.; Su, W.; Cai, W.; Li, F.; Wei, X.; Muhirwa, A.; Gong, R.; Wekesa, D.W. Investigation on reversible pump turbine flow structures and associated pressure field characteristics under different guide vane openings. Sci. China Technol. Sci. 2019, 62, 2052–2074. [Google Scholar] [CrossRef]
  14. Cavazzini, G.; Houdeline, J.-B.; Pavesi, G.; Teller, O.; Ardizzon, G. Unstable behaviour of pump-turbines and its effects on power regulation capacity of pumped-hydro energy storage plants. Renew. Sustain. Energy Rev. 2018, 94, 399–409. [Google Scholar] [CrossRef]
  15. Holzer, T.; Muetze, A.; Traxler-Samek, G.; Lecker, M.; Zerobin, F. Generator Design Possibilities for Full-Size Converter Operation of Large Pumped Storage Power Plants. IEEE Trans. Ind. Appl. 2020, 56, 3644–3655. [Google Scholar] [CrossRef]
  16. Zhao, G.P.; Ren, J.Y. Research on an Output Power Model of a Doubly-Fed Variable-Speed Pumped Storage Unit with Switching Process. Appl. Sci. 2019, 9, 3368. [Google Scholar] [CrossRef] [Green Version]
  17. Joseph, A.; Chelliah, T.R.; Lee, S.S.; Lee, K.B. Reliability of Variable Speed Pumped-Storage Plant. Electronics 2018, 7, 265. [Google Scholar] [CrossRef] [Green Version]
  18. Joseph, A.; Chelliah, T.R. A Review of Power Electronic Converters for Variable Speed Pumped Storage Plants: Configurations, Operational Challenges, and Future Scopes. IEEE J. Emerg. Sel. Top. Power Electron. 2018, 6, 103–119. [Google Scholar] [CrossRef]
  19. Yin, X. An up to date review of continuously variable speed wind turbines with mechatronic variable transmissions. Int. J. Energy Res. 2018, 42, 1442–1454. [Google Scholar] [CrossRef]
  20. Yang, W.J.; Yang, J.D. Advantage of variable-speed pumped storage plants for mitigating wind power variations: Integrated modelling and performance assessment. Appl. Energy 2019, 237, 720–732. [Google Scholar] [CrossRef]
  21. Feng, C.; Zheng, Y.; Li, C.; Mai, Z.; Wu, W.; Chen, H. Cost advantage of adjustable-speed pumped storage unit for daily operation in distributed hybrid system. Renew. Energy 2021, 176, 1–10. [Google Scholar] [CrossRef]
  22. Feng, C.; Li, C.S.; Chang, L.; Ding, T.; Mai, Z.J. Advantage analysis of variable-speed pumped storage units in renewable energy power grid: Mechanism of avoiding S-shaped region. Int. J. Electr. Power Energy Syst. 2020, 120, 105976. [Google Scholar] [CrossRef]
  23. Nygren, L. Hydraulic Energy Harvesting with Variable-Speed-Driven Centrifugal Pump as Turbine. Master’s Thesis, Lappeenranta University of Technology, Lappeenranta, Finland, 2017. [Google Scholar]
  24. Hyypiä, J. Hydraulic Energy Recovery by Replacing a Control Valve with a Centrifugal Pump Used as a Turbine. Ph.D. Thesis, Lappeenranta University of Technology, Lappeenranta, Finland, 2016. [Google Scholar]
  25. Azbe, V.; Mihalic, R. Transient stability of a large doubly-fed induction machine in a pumped-storage plant. Electr. Power Syst. Res. 2017, 142, 29–35. [Google Scholar] [CrossRef]
  26. Xu, Y.H.; Zhou, J.Z.; Xue, X.M.; Fu, W.L.; Zhu, W.L.; Li, C.S. An adaptively fast fuzzy fractional order PID control for pumped storage hydro unit using improved gravitational search algorithm. Energy Convers. Manag. 2016, 111, 67–78. [Google Scholar] [CrossRef]
  27. Chen, Z.; Yuan, Y.; Yuan, X.; Huang, Y.; Li, X.; Li, W. Application of multi-objective controller to optimal tuning of PID gains for a hydraulic turbine regulating system using adaptive grid particle swam optimization. ISA Trans. 2015, 56, 173–187. [Google Scholar] [CrossRef] [PubMed]
  28. Alizadeh Bidgoli, M.; Yang, W.; Ahmadian, A. DFIM versus synchronous machine for variable speed pumped storage hydropower plants: A comparative evaluation of technical performance. Renew. Energy 2020, 159, 72–86. [Google Scholar] [CrossRef]
  29. Borkowski, D. Analytical Model of Small Hydropower Plant Working at Variable Speed. IEEE Trans. Energy Convers. 2018, 33, 1886–1894. [Google Scholar] [CrossRef]
  30. Yao, W.W.; Deng, C.H.; Peng, P. Optimization Method and Reduced-Order Steady-State Model for Variable-Speed Pump-Turbine Unit. IEEE Access 2021, 9, 31130–31142. [Google Scholar] [CrossRef]
  31. Ramirez, D.; Martinez, S.; Carrero, C.; Platero, C.A. Improvements in the grid connection of renewable generators with full power converters. Renew. Energy 2012, 43, 90–100. [Google Scholar] [CrossRef]
  32. Tian, C.; Liu, R.; Yao, C.; Lv, Q.; Wang, H. An Improved Hydraulic Turbine Model and Its Impact on Fast Frequency Response. In Proceedings of the 2019 IEEE International Conference on Energy Internet (ICEI), Nanjing, China, 27–31 May 2019; pp. 13–18. [Google Scholar]
  33. IEC. Hydraulic Turbines, Storage Pumps and Pump-Turbines—Model Acceptance Tests. In IEC Standard 60193; IEC: Geneva, Switzerland, 2019. [Google Scholar]
  34. Macías Ávila, C.A.; Sánchez-Romero, F.-J.; López-Jiménez, P.A.; Pérez-Sánchez, M. Definition of the Operational Curves by Modification of the Affinity Laws to Improve the Simulation of PATs. Water 2021, 13, 1880. [Google Scholar] [CrossRef]
  35. Li, C.; Zhou, J. Parameters identification of hydraulic turbine governing system using improved gravitational search algorithm. Energy Convers. Manag. 2011, 52, 374–381. [Google Scholar] [CrossRef]
  36. Pan, W.X.; Zhu, Z.; Liu, T.C.; Liu, M.Y.; Tian, W. Optimal Control for Speed Governing System of On-Grid Adjustable-Speed Pumped Storage Unit Aimed at Transient Performance Improvement. IEEE Access 2021, 9, 40445–40457. [Google Scholar] [CrossRef]
  37. Zuyi, S. Hydro Turbine Regulation System Analysis; Water Resources and Hydropower Press: Beijing, China, 1996. [Google Scholar]
  38. Hiskens, I.A. Dynamics of Type-3 Wind Turbine Generator Models. IEEE Trans. Power Syst. 2012, 27, 465–474. [Google Scholar] [CrossRef] [Green Version]
  39. Mercier, T.; Hardy, C.; Van Tichelen, P.; Olivier, M.; De Jaeger, E. Control of variable-speed pumps used as turbines for flexible grid-connected power generation. Electr. Power Syst. Res. 2019, 176, 105962. [Google Scholar] [CrossRef]
  40. Simpson, A.R.; Marchi, A. Evaluating the Approximation of the Affinity Laws and Improving the Efficiency Estimate for Variable Speed Pumps. J. Hydraul. Eng. 2013, 139, 1314–1317. [Google Scholar] [CrossRef] [Green Version]
  41. Zhu, L.; Meng, X.C.; Zhang, J.G. Pressure fluctuation test and vortex observation in Francis turbines draft tube. In 29th IAHR Symposium on Hydraulic Machinery and Systems, Kyoto, Japan, 16–21 September 2018; IOP Publishing Ltd.: Bristol, UK, 2019; pp. 22–29. [Google Scholar]
  42. Sivakumar, N.; Das, D.; Padhy, N.P. Variable speed operation of reversible pump-turbines at Kadamparai pumped storage plant—A case study. Energy Convers. Manag. 2014, 78, 96–104. [Google Scholar] [CrossRef]
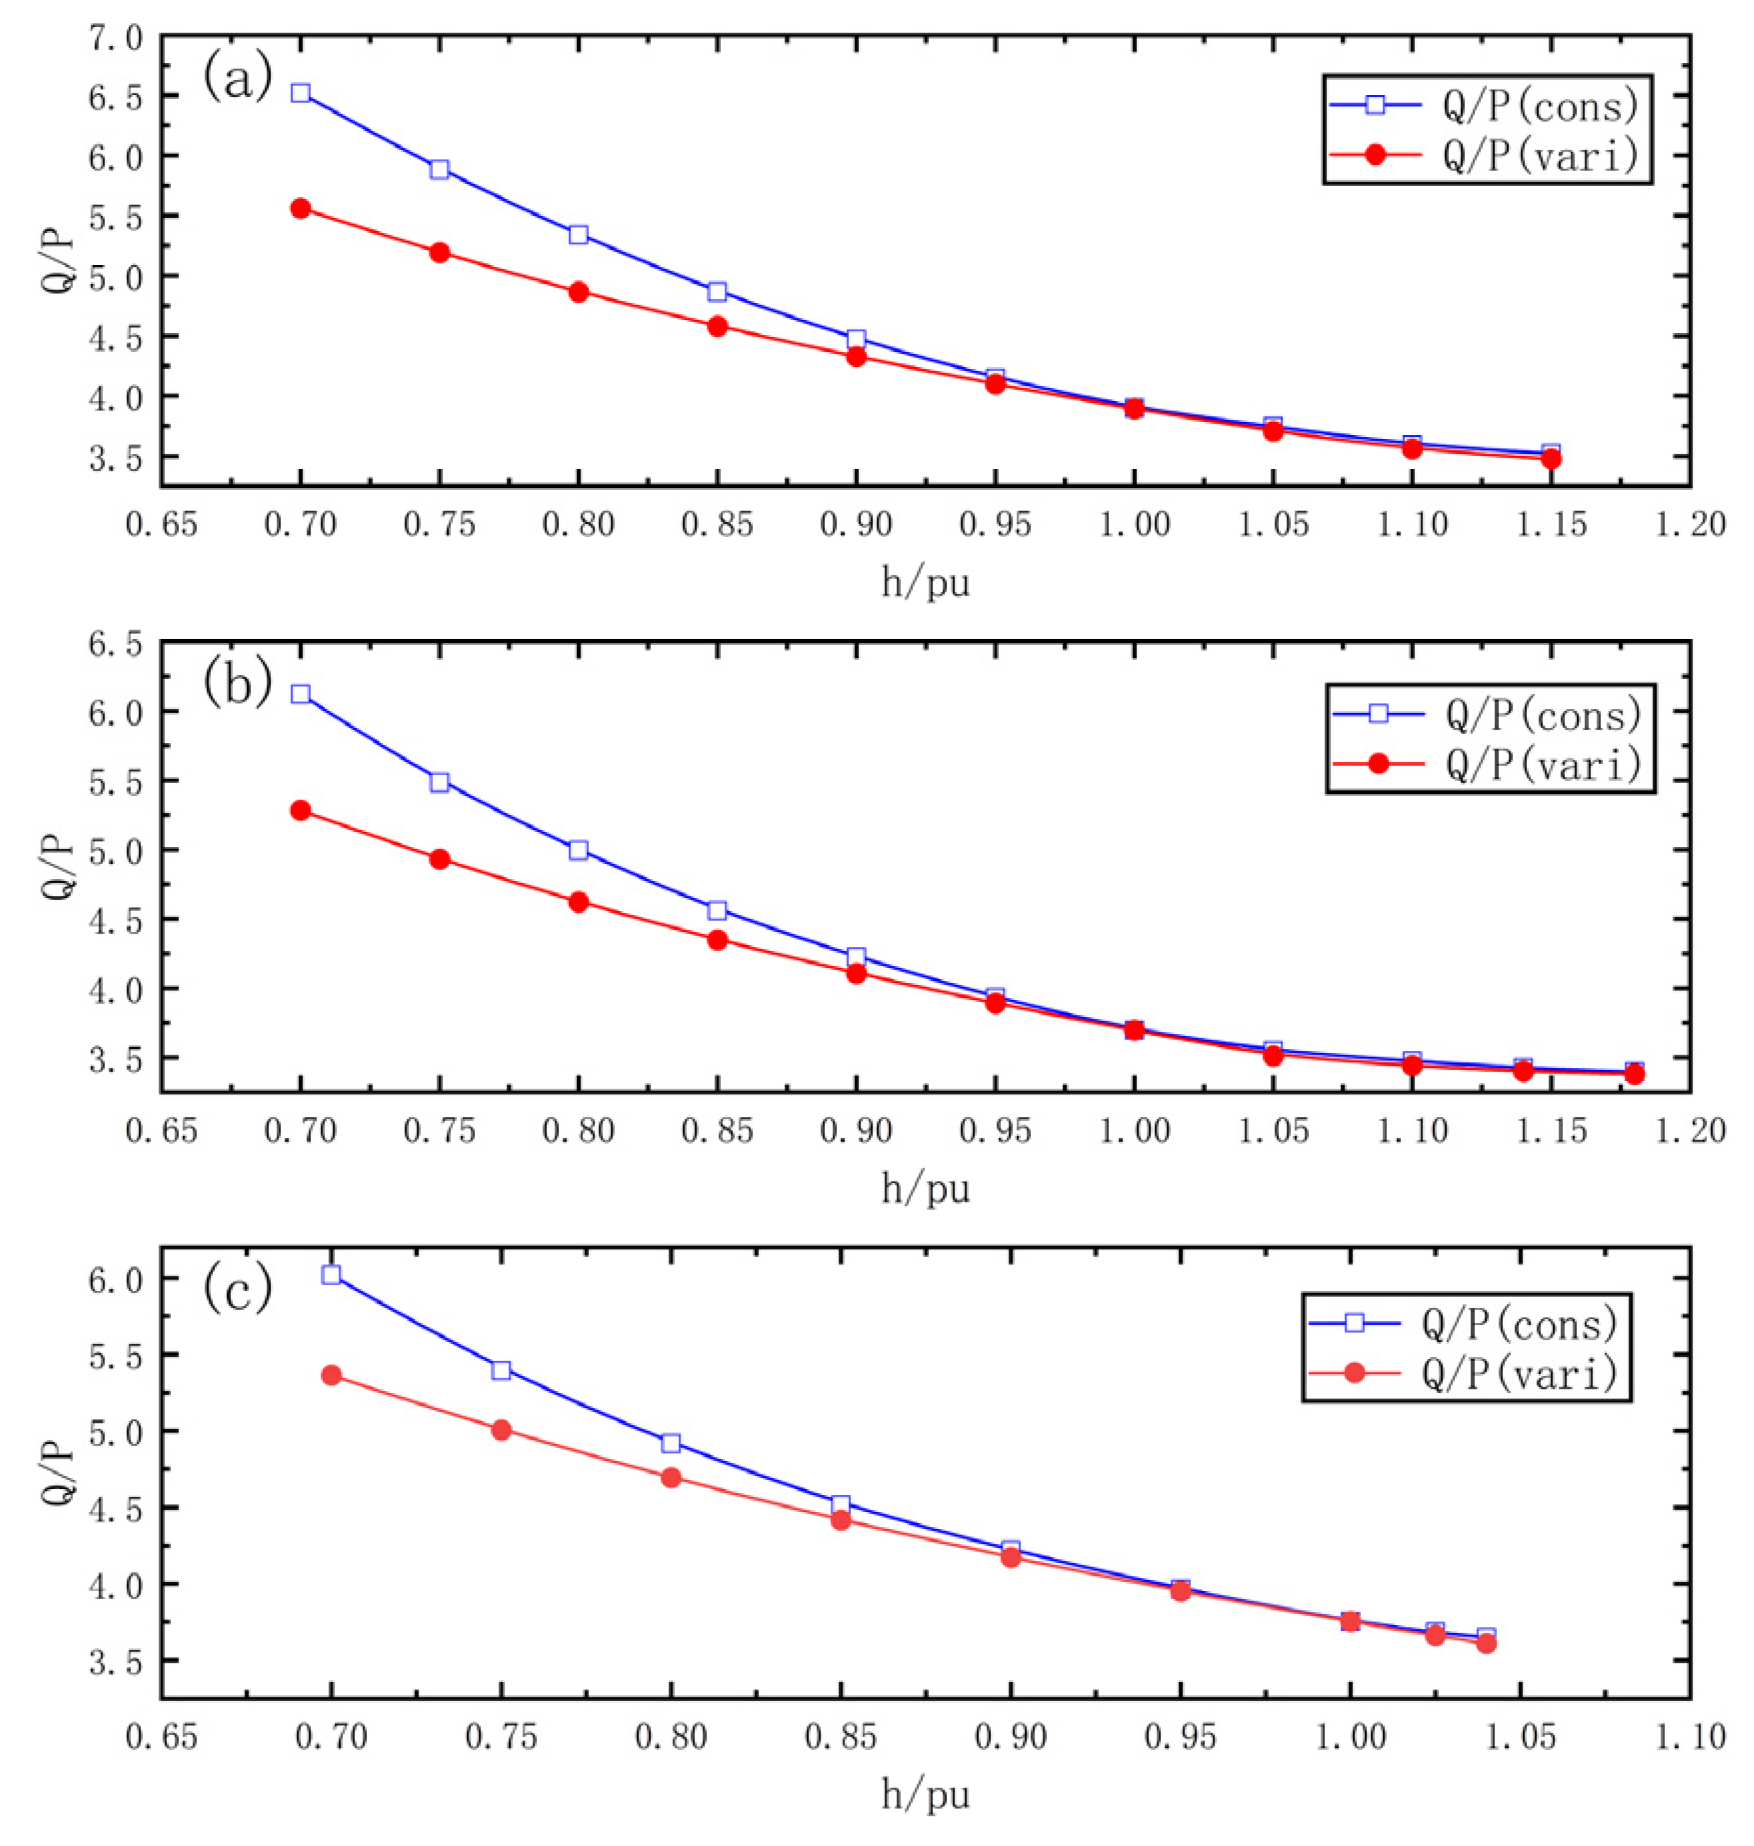
Figure 1. Unit based on the full-size converter.
Energies 14 08484 g001
Figure 2. Unit with doubly-fed induction machine.
Energies 14 08484 g002
Figure 3. Block diagram of PID-type controller.
Energies 14 08484 g003
Figure 4. Full characteristic curve of pump-turbine: (a,b) are the discharge and torque characteristics, respectively.
Energies 14 08484 g004
Figure 5. Control block diagram of governing system.
Energies 14 08484 g005
Figure 6. Stability boundary lines. The lower left side is the stability domain.
Energies 14 08484 g006
Figure 7. Stability regions at various parameters: (a,b) the effect of speed and opening parameters; (c) the stability domain variation curves of different heads at the design opening; (d) the effect of the time constant of the converter.
Energies 14 08484 g007
Figure 8. Schematic diagram of coordinated control of variable-speed unit.
Energies 14 08484 g008
Figure 9. Hill diagram of the model pump-turbine.
Energies 14 08484 g009
Figure 10. Optimization results in generation mode. (a) Optimal speed surface; (b) Optimal opening and efficiency.
Energies 14 08484 g010
Figure 11. Characteristic curve of the model test in pump mode.
Energies 14 08484 g011
Figure 12. Optimization results in pump mode. (a) Optimal speed surface; (b) Optimal opening with head.
Energies 14 08484 g012
Figure 13. Load dynamic response curves: (a,b) the response curves of power command; (c,d) the response curves of head variation.
Energies 14 08484 g013
Figure 14. Layout of the Universal Test Rig for Hydraulic Machinery (UTR-HM).
Energies 14 08484 g014
Figure 15. TP1 Hydraulic turbine model test bench: (a) test bench; (b) view of the model of the tested machine and its runner.
Energies 14 08484 g015
Figure 16. Hill diagram of the model pump-turbine.
Energies 14 08484 g016
Figure 17. Operating improvement in generation mode: (ac) represent the guide openings of 42%, 63%, and 84%, respectively.
Energies 14 08484 g017
Figure 18. Regulation characteristics in generation mode.
Energies 14 08484 g018
Figure 19. Relation graph of speed and input power variation: (a) opening at 52.6%; (b) opening at 63.2%.
Energies 14 08484 g019
Figure 20. Regulation characteristics in the pump mode.
Energies 14 08484 g020
Table 1. Transfer coefficients of the pump-turbine at different heads (opening at 63%).
Corresponding PictureHead (pu) e y e q h e e y e
(a)0.950.92590.51301.23661.1450
(b)1.051.07590.48800.80780.8619
(c)1.101.15370.47670.65030.7502
(d)1.151.23320.46630.52000.6412
Table 2. Model characteristics of the pump-turbine.
ParameterUnitValue
Generating ModePumping Mode
nmrpm10801200
Qmm3/s0.2170.224
Hmm30.10130.116
MmkN·m522.81578.41
Dmm0.4000.400
PmkW59.1672.72
Publisher’s Note: MDPI stays neutral with regard to jurisdictional claims in published maps and institutional affiliations.

