1. Introduction
One of the basic operations aimed at enriching mineral resources mined in Poland [
1] and in the world is the screening process. This process increases the utility value of the material [
2] and thus allows obtaining a homogeneous particle size distribution. Screening is used, among other things, for the control of crushing and grinding processes [
3,
4,
5], waste recycling [
6] or for the preparation of aggregate mixtures [
7,
8]. Screeners are used in stationary plants and mobile crushing or screening sets [
9]. In most mineral processing plants, the basic equipment used in the process are super-resonance vibrating screens [
10]. The trends in the development of vibrating screens and the nature of evolution over the years were presented in [
11]. Over the years, the structures of this type of screen have undergone numerous modifications, which enabled improving the quality of products (improvement in the accuracy of separation), increasing the efficiency of the process and reducing the process energy consumption. One of the ways to improve the process is modifying the vibration trajectory of the riddle [
12,
13,
14]. However, a no less important parameter taken into account by designers who modify screens is the impact of the machine on the environment. The negative effects of the operation are reduced by decreasing the noise level or dynamic effects on the ground or supporting structure [
15]. In the 21st century, the most common types of screens are vibrating devices with circular (WK) and rectilinear (WP) vibrations or, less frequently, with elliptical vibrations (PZ, PWE) [
16]. The manufacturers’ offer also includes vibrating flip-flow screens (VFFS)—widely used to separate high viscosity and fine materials [
17,
18].
The super-resonance screen is placed into vibrating motion by the drive system, which most often consists of an electric motor, flexible couplings and an inertial vibrator. In such solutions, the amplitude of vibrations depends on the centrifugal force from all unbalanced masses mounted on the vibrator shafts, whereas the frequency of vibrations is dependent on the type of motor or control system used (thyristor frequency converters). The majority of inertial vibrators can regulate the force driving the vibrations by subtracting or adding successive unbalanced masses or by changing the system of unbalanced masses [
16,
19]. Apart from classic drives, the literature also includes studies on the electromagnetic excitation of the vibrating screen [
20].
Many researchers deal with the problem of the steady-state operation of screens and numerical simulation DEM to simulate the material’s behaviour on the screening board [
21,
22,
23,
24,
25]. Some researchers have also attempted to develop a vibration measurement model that considers material disturbances [
26,
27]. Classic drive systems, due to flexible couplings, are characterized by a high value of vibration damping of the riddle, which significantly reduces the amplitude of vibrations during the transition through resonance. Using the drive system with vibration motors, we eliminate the damping system, which will affect the amplitude of oscillations during the transition through resonance, which has not been the subject of research by other researchers thus far. Conducting comparative tests of the screen vibration amplitude presented in this article aims to demonstrate whether it is possible to modernize the industrial over-resonance screen drives without the need to use additional damping systems [
28].
2. Theoretical Analysis of the Screen Work during Start-Up and Braking
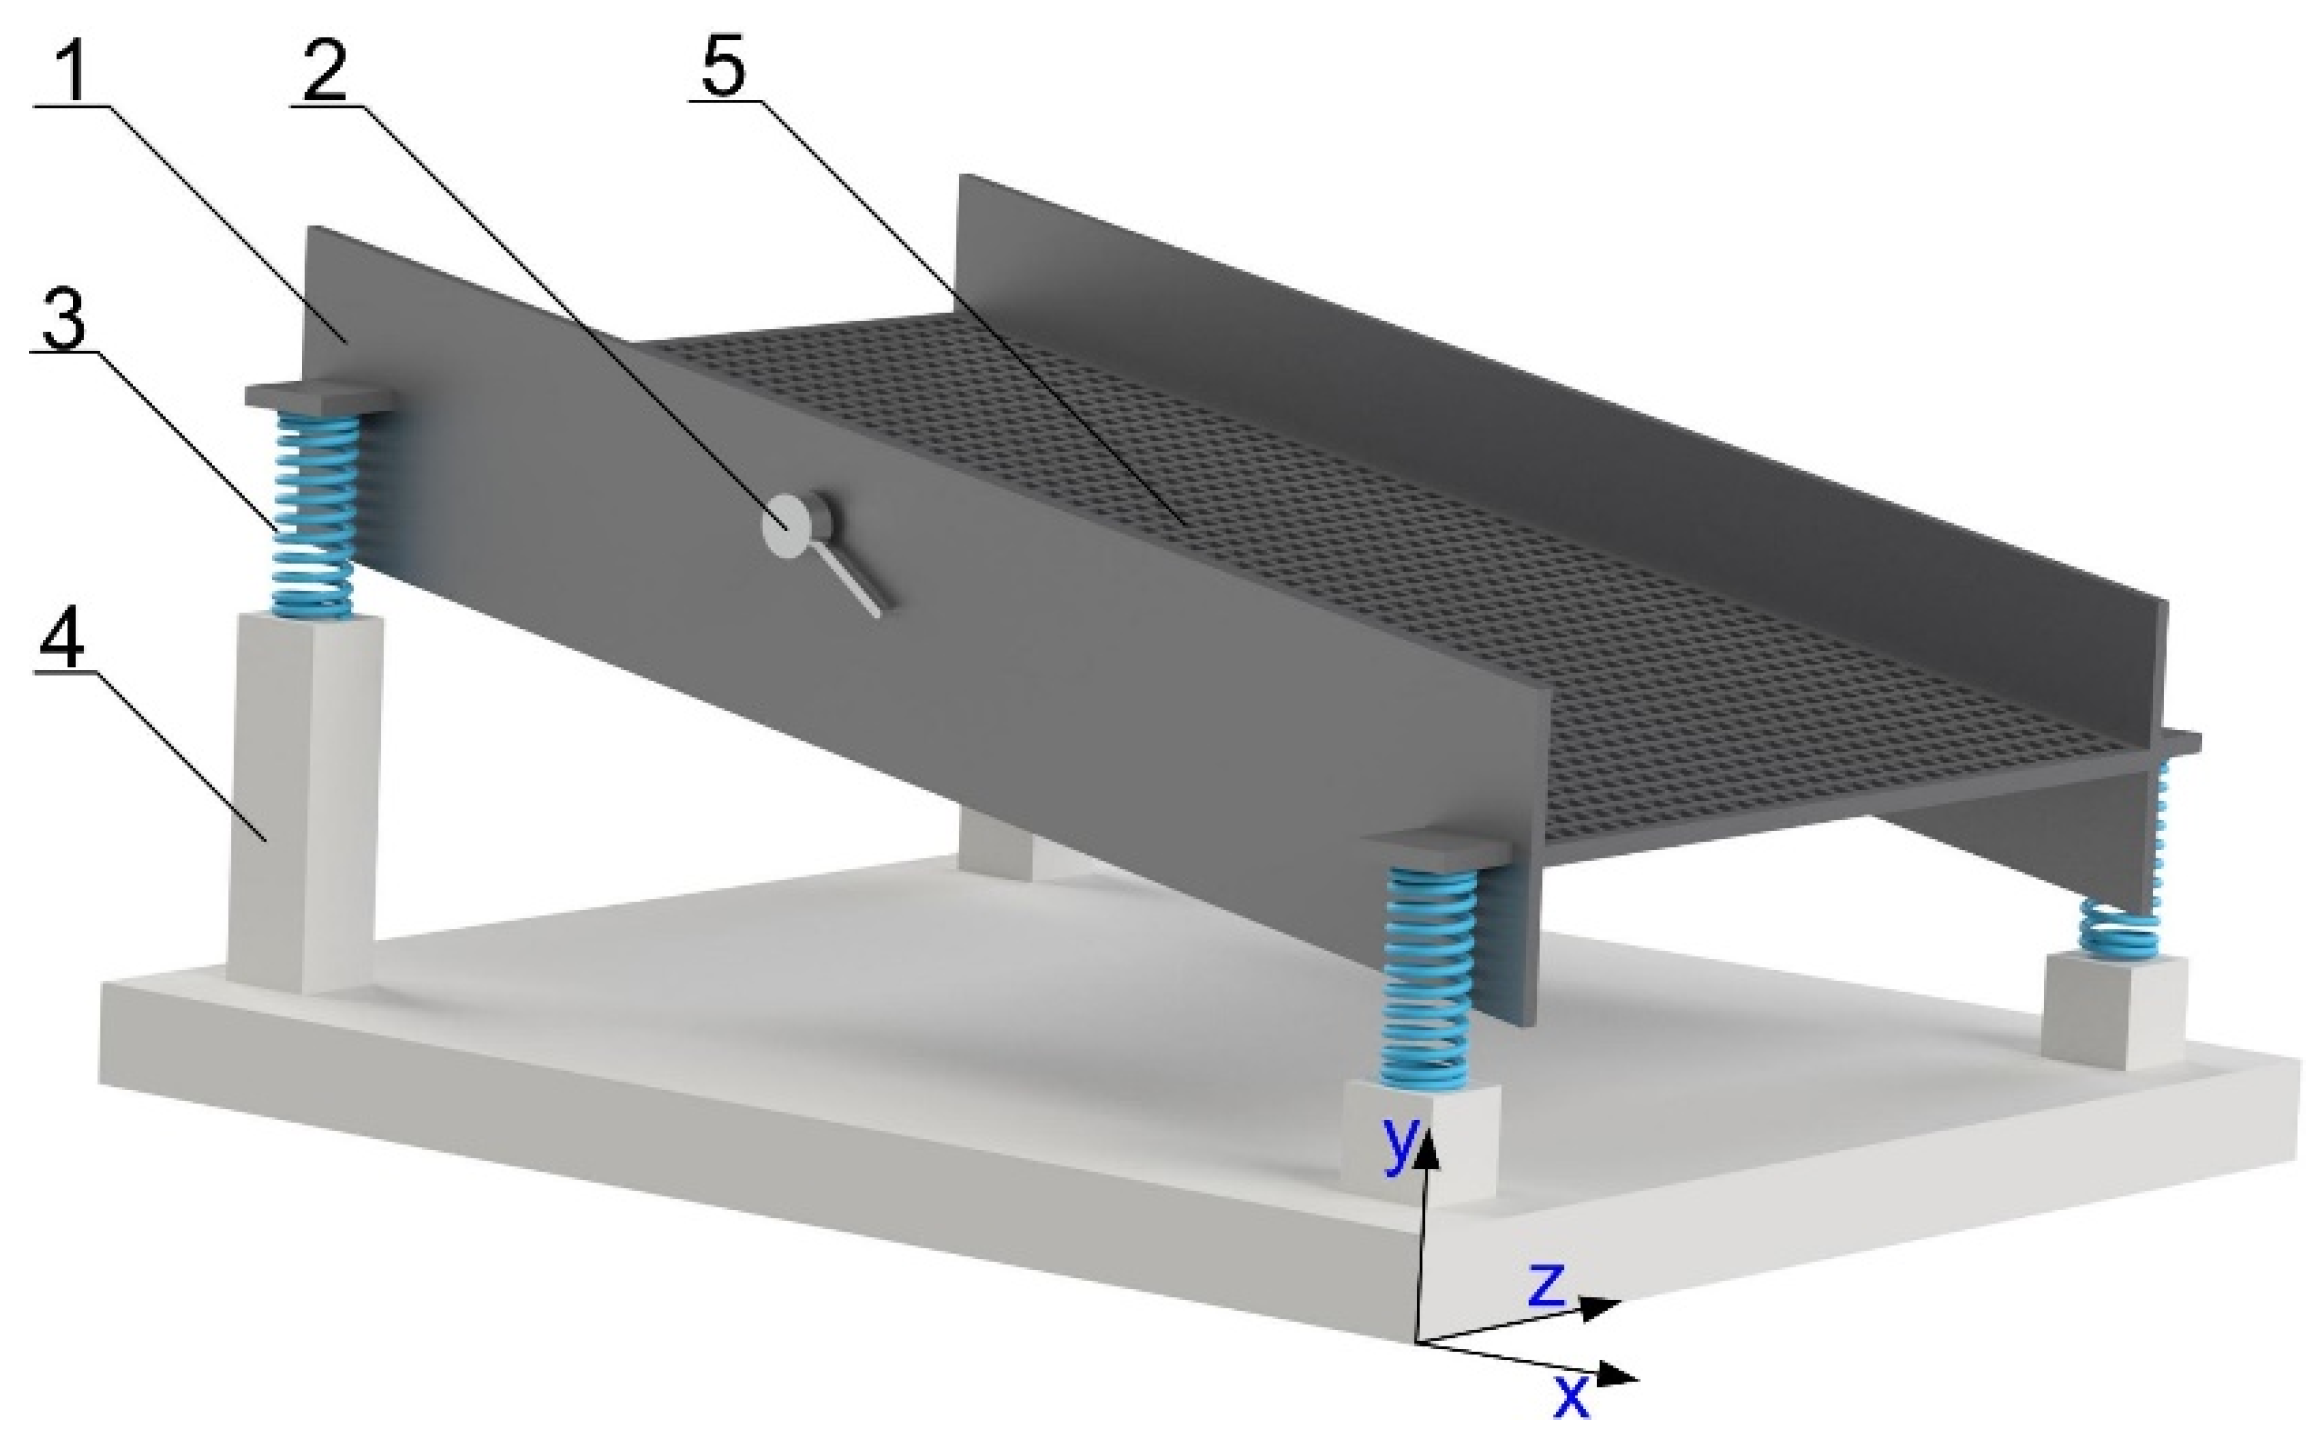
Super-resonant screens operate in a steady state at frequencies several times higher than the natural frequency of the system. This enables stable operation, with a constant amplitude of vibrations, which is to a small extent dependent on the variable vibrating mass resulting from the feed. Work in this range, however, necessitates going through the resonant frequency both during the start-up and braking of the system. This leads to a several-fold increase in the amplitude of vibrations compared to the steady state [
16]. The phenomena in question have been the subject of numerous analyses and studies, which allowed determining the basic relationships that enable the estimation of the maximum amplitude value. The determination of the maximum amplitude value allows selecting an appropriate support system (suspension) of the screen, which will enable its failure-free operation. As a starting point for such analyses, the physical model of the super-resonant screen with circular vibrations (WK) shown in
Figure 1 was adopted.
For the so-developed model, an analysis of the motion during machine start-up and braking was carried out. This model has been simplified to the diagram shown in
Figure 2, in which only two components of the motion (plane motion) are considered. For such a system, the equations of the motion of the screen’s centre of mass can be expressed as follows [
16]:
where (
Figure 2):
m1—mass of the riddle;
m0—unbalanced mass;
cx, cy—equivalent viscous damping coefficient along the x and y axes;
kx, ky—equivalent elastic modulus of the suspension along the x and y axes;
r0—eccentric radius of unbalanced mass;
I—moment of inertia of the screen in relation to the z axis;
ε—angular acceleration;
τ—time.
The analysis of these equations allowed determining the theoretical maximum value of amplitude during start-up and braking.
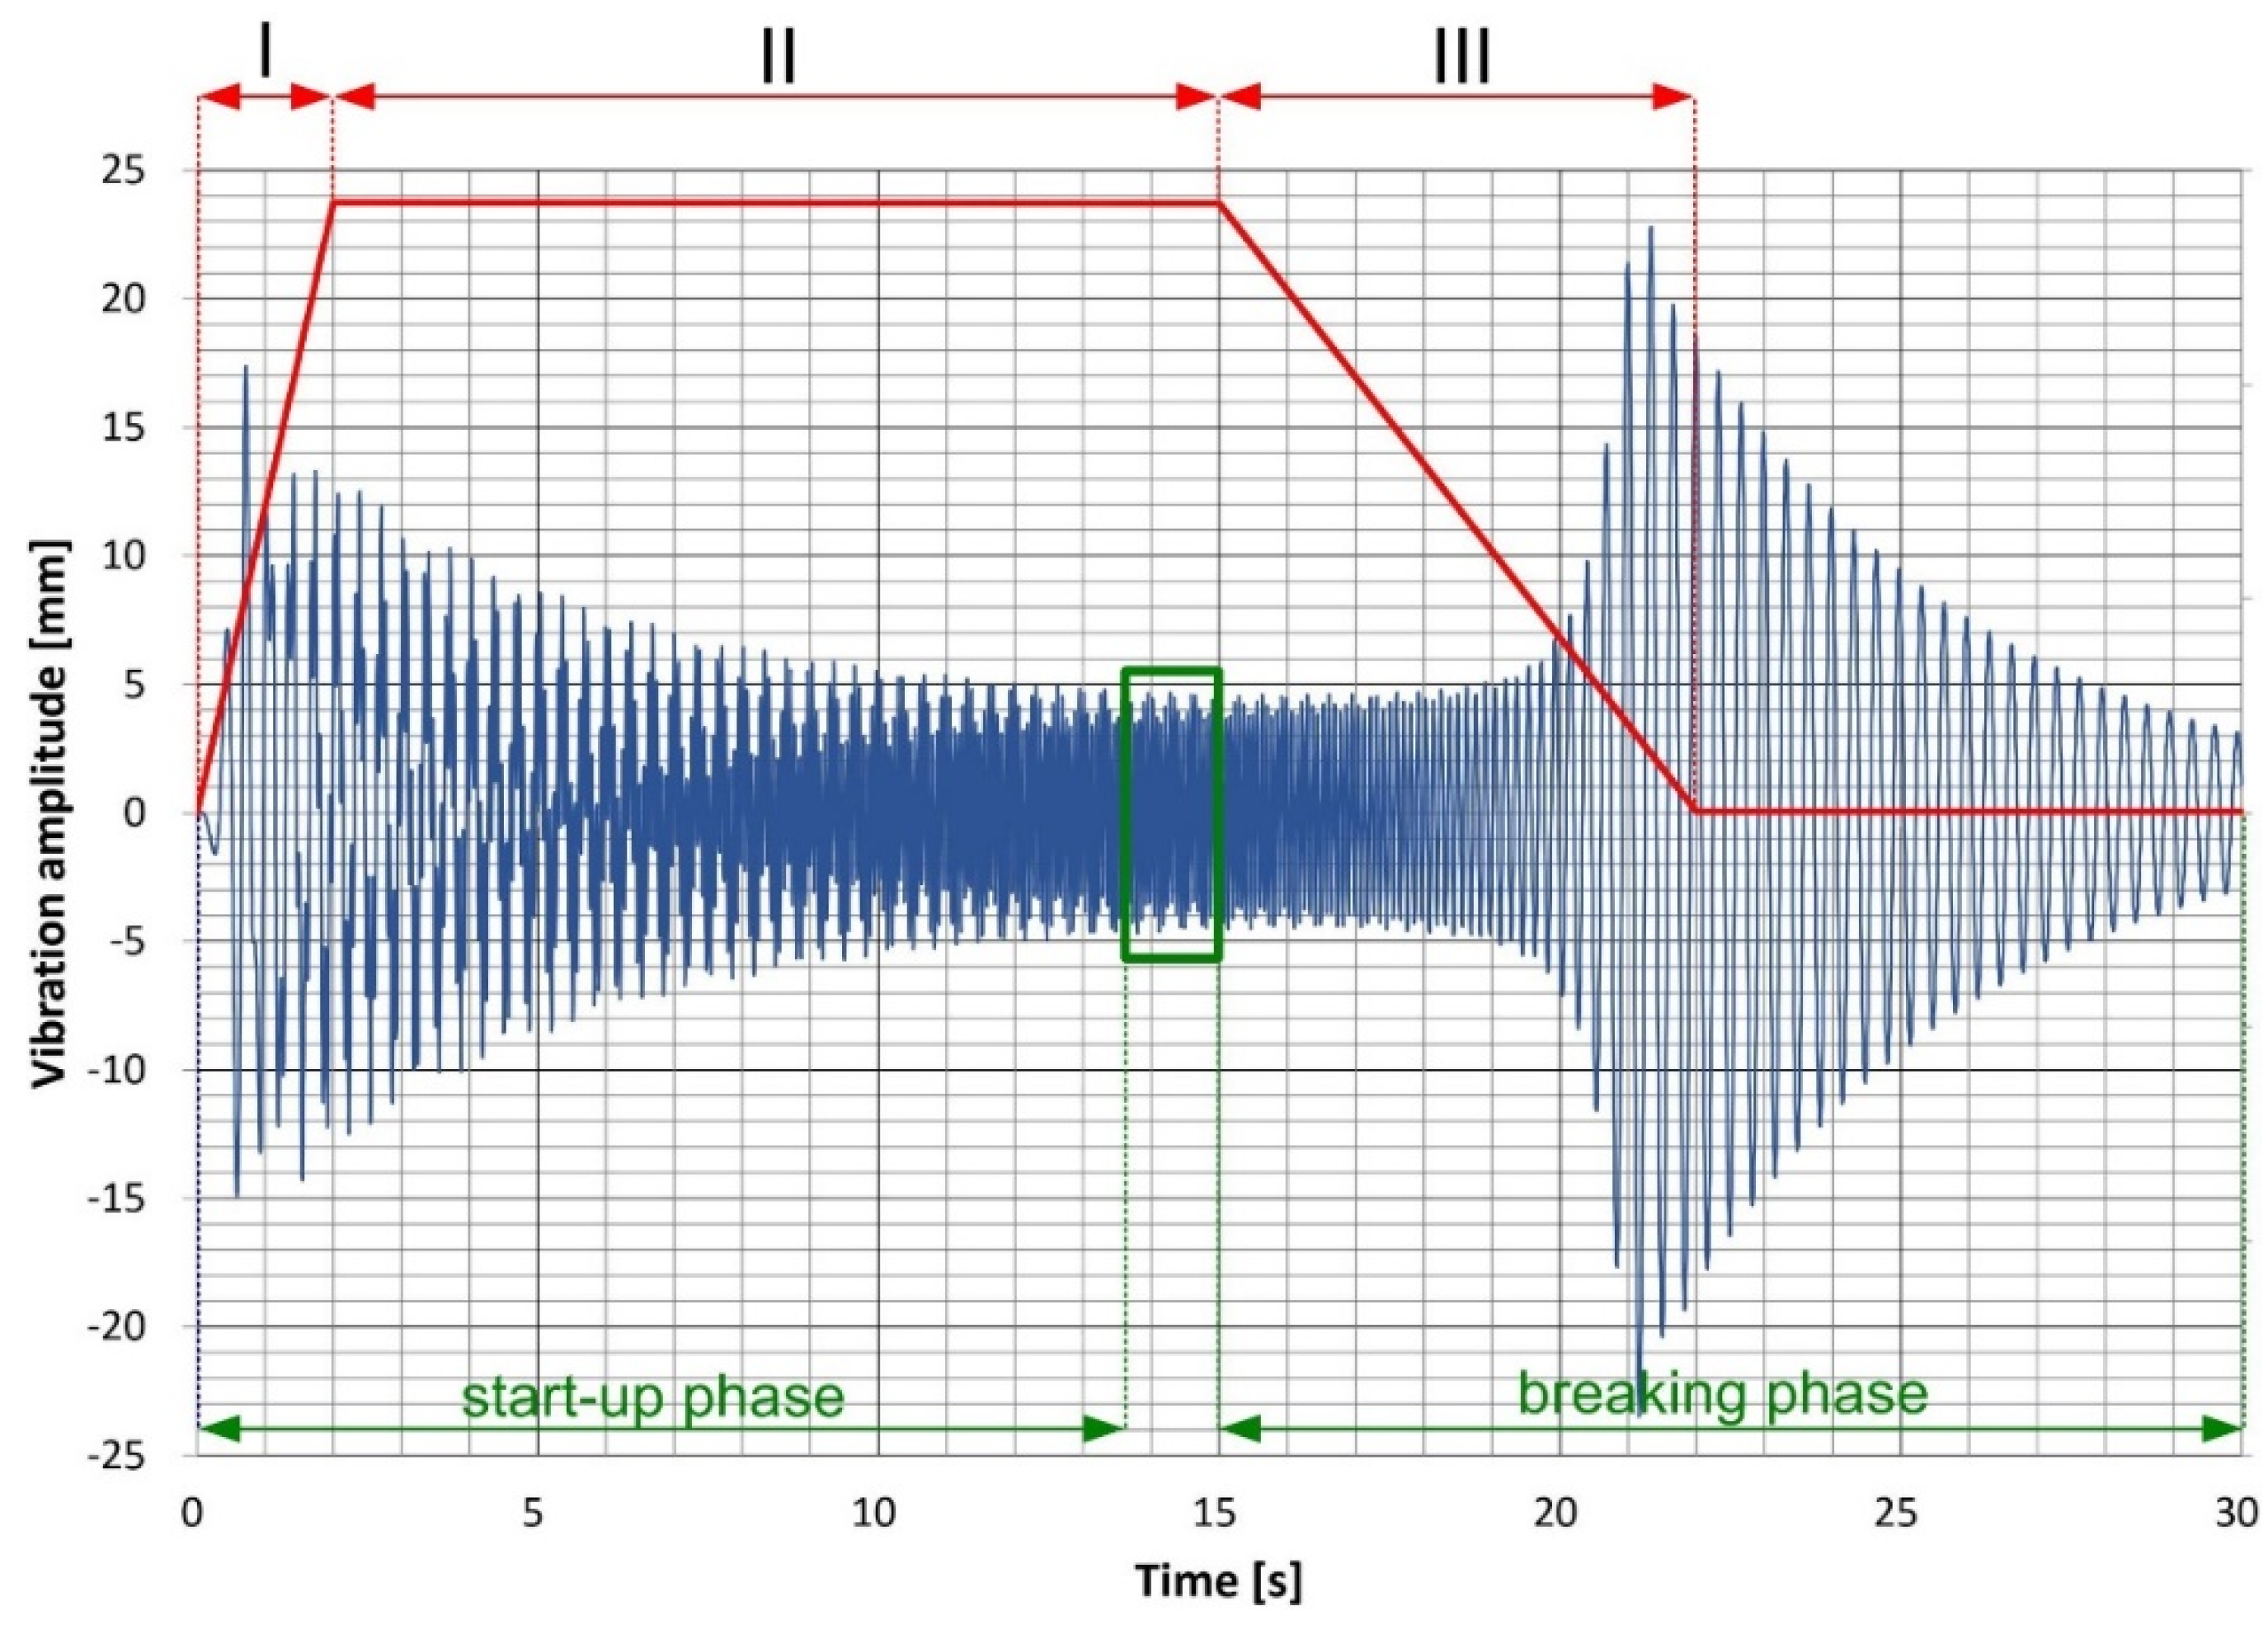
Figure 3 shows an example of the vibrations amplitude versus time based on a simulation performed in the Autodesk Inventor dynamic analysis environment. The rotational speed of the vibrator shaft has been marked in red. Individual phases of the motors’ operation are marked with Roman numerals: I—start-up (0–960 rpm), II—steady operation (960 rpm), III—braking (960–0 rpm). The duration of phases I and III corresponded to the average times measured during the experimental tests on the test bench, i.e., start-up 2 s, braking 7 s. In this figure, the ranges corresponding to the transient states of the screen’s operation and a short fragment of stable operation (13.5–15.0 s) have also been marked in green.
The conducted simulation clearly shows that the greatest increase in amplitude occurs during braking.
The verification of theoretical considerations on the test stand carried out at the Department of Mining, Processing and Transport Machines enabled obtaining simplified formulas for the maximum vibration amplitudes during start-up (4):
and braking (5):
where:
AyRmax—maximum vibration amplitude during start-up;
AyHmax—maximum vibration amplitude during braking;
ω0—natural frequency of the riddle;
λ—angular lag.
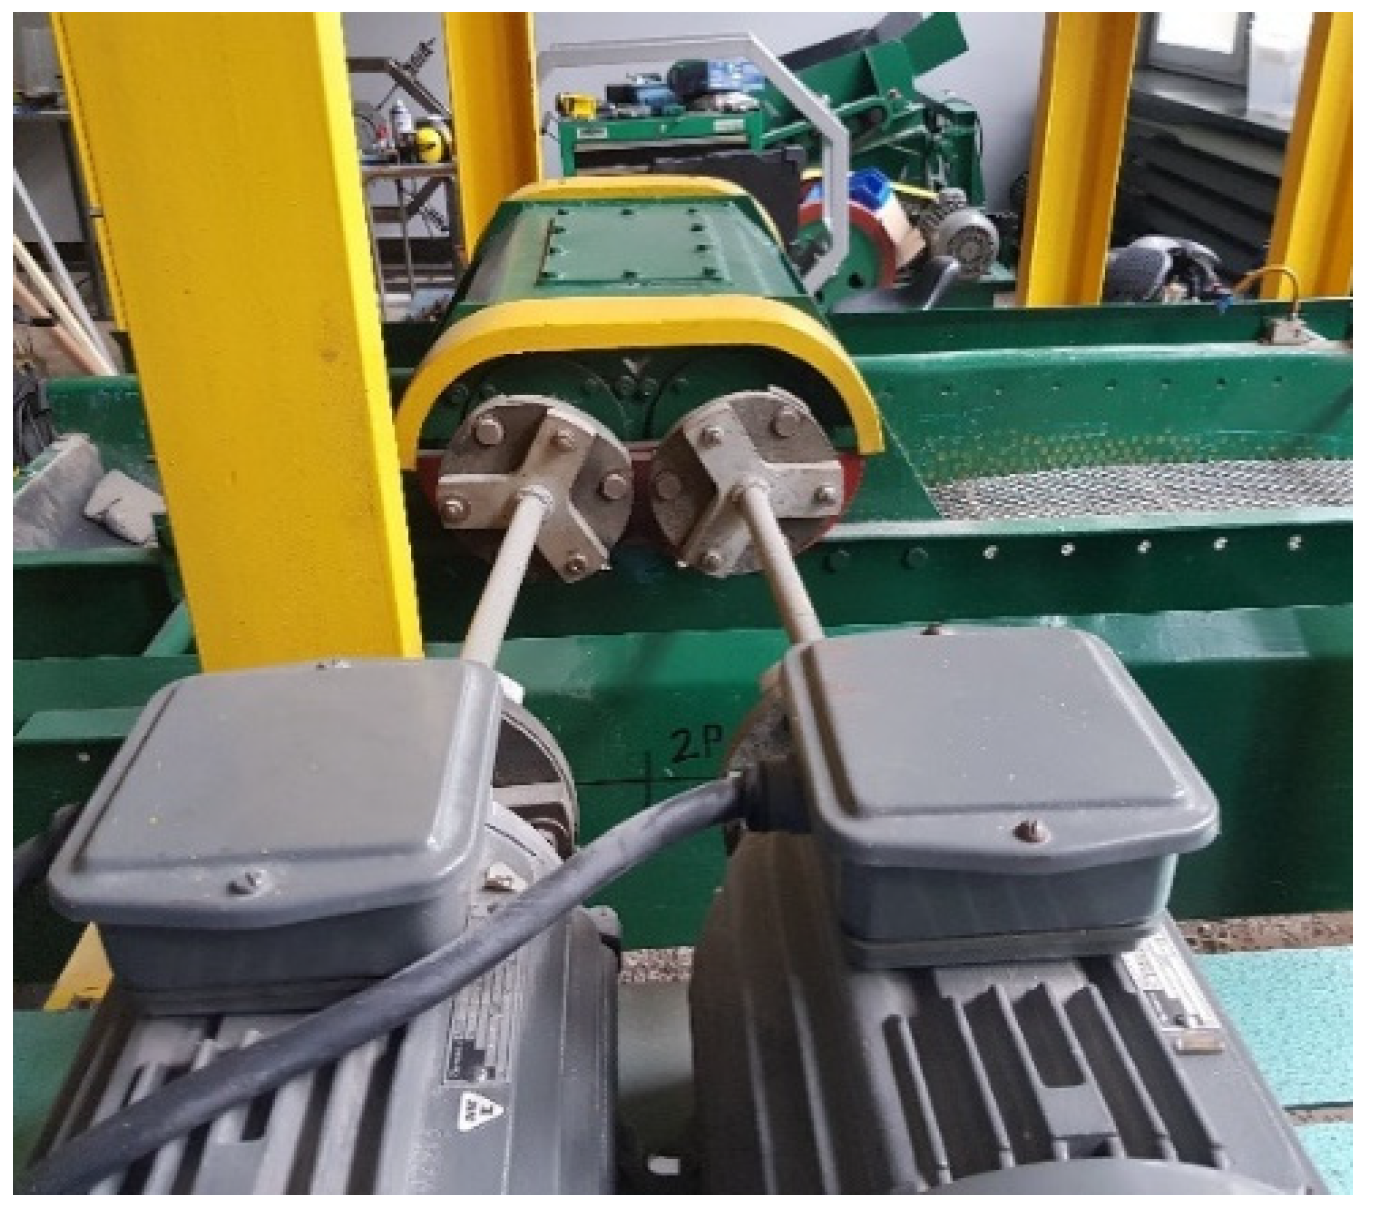
The above simplified formulas allow estimating the maximum value of amplitude for practical conditions. The determination of the maximum amplitude value is necessary to properly design the support system (suspension) of the riddle, allowing the impact on the supporting structure to be minimised. These values were determined for a laboratory WP screen with a classic drive system, in which flexible couplings used in the drive cause a significant damping of vibrations.
4. Investigation into Vibration Trajectories in Transient States
With this type of screen structure (elastic suspension of the riddle), the vibration amplitude in the vertical direction has the greatest impact on the required strength parameters of the supporting structure. Therefore, the measurement of amplitudes in this direction is the most important.
The investigations into the start-up and braking phases were carried out for the maximum value of amplitude obtained during tests in a steady state, which in the x direction, was A
x = 2,1 mm, and in the y direction reached A
y = 2.9 mm [
25,
26]. The variable parameter was the vibrators’ operating frequency (13.2, 16.5 and 19.8 Hz) obtained by changing the frequency of the asynchronous motors supply current.
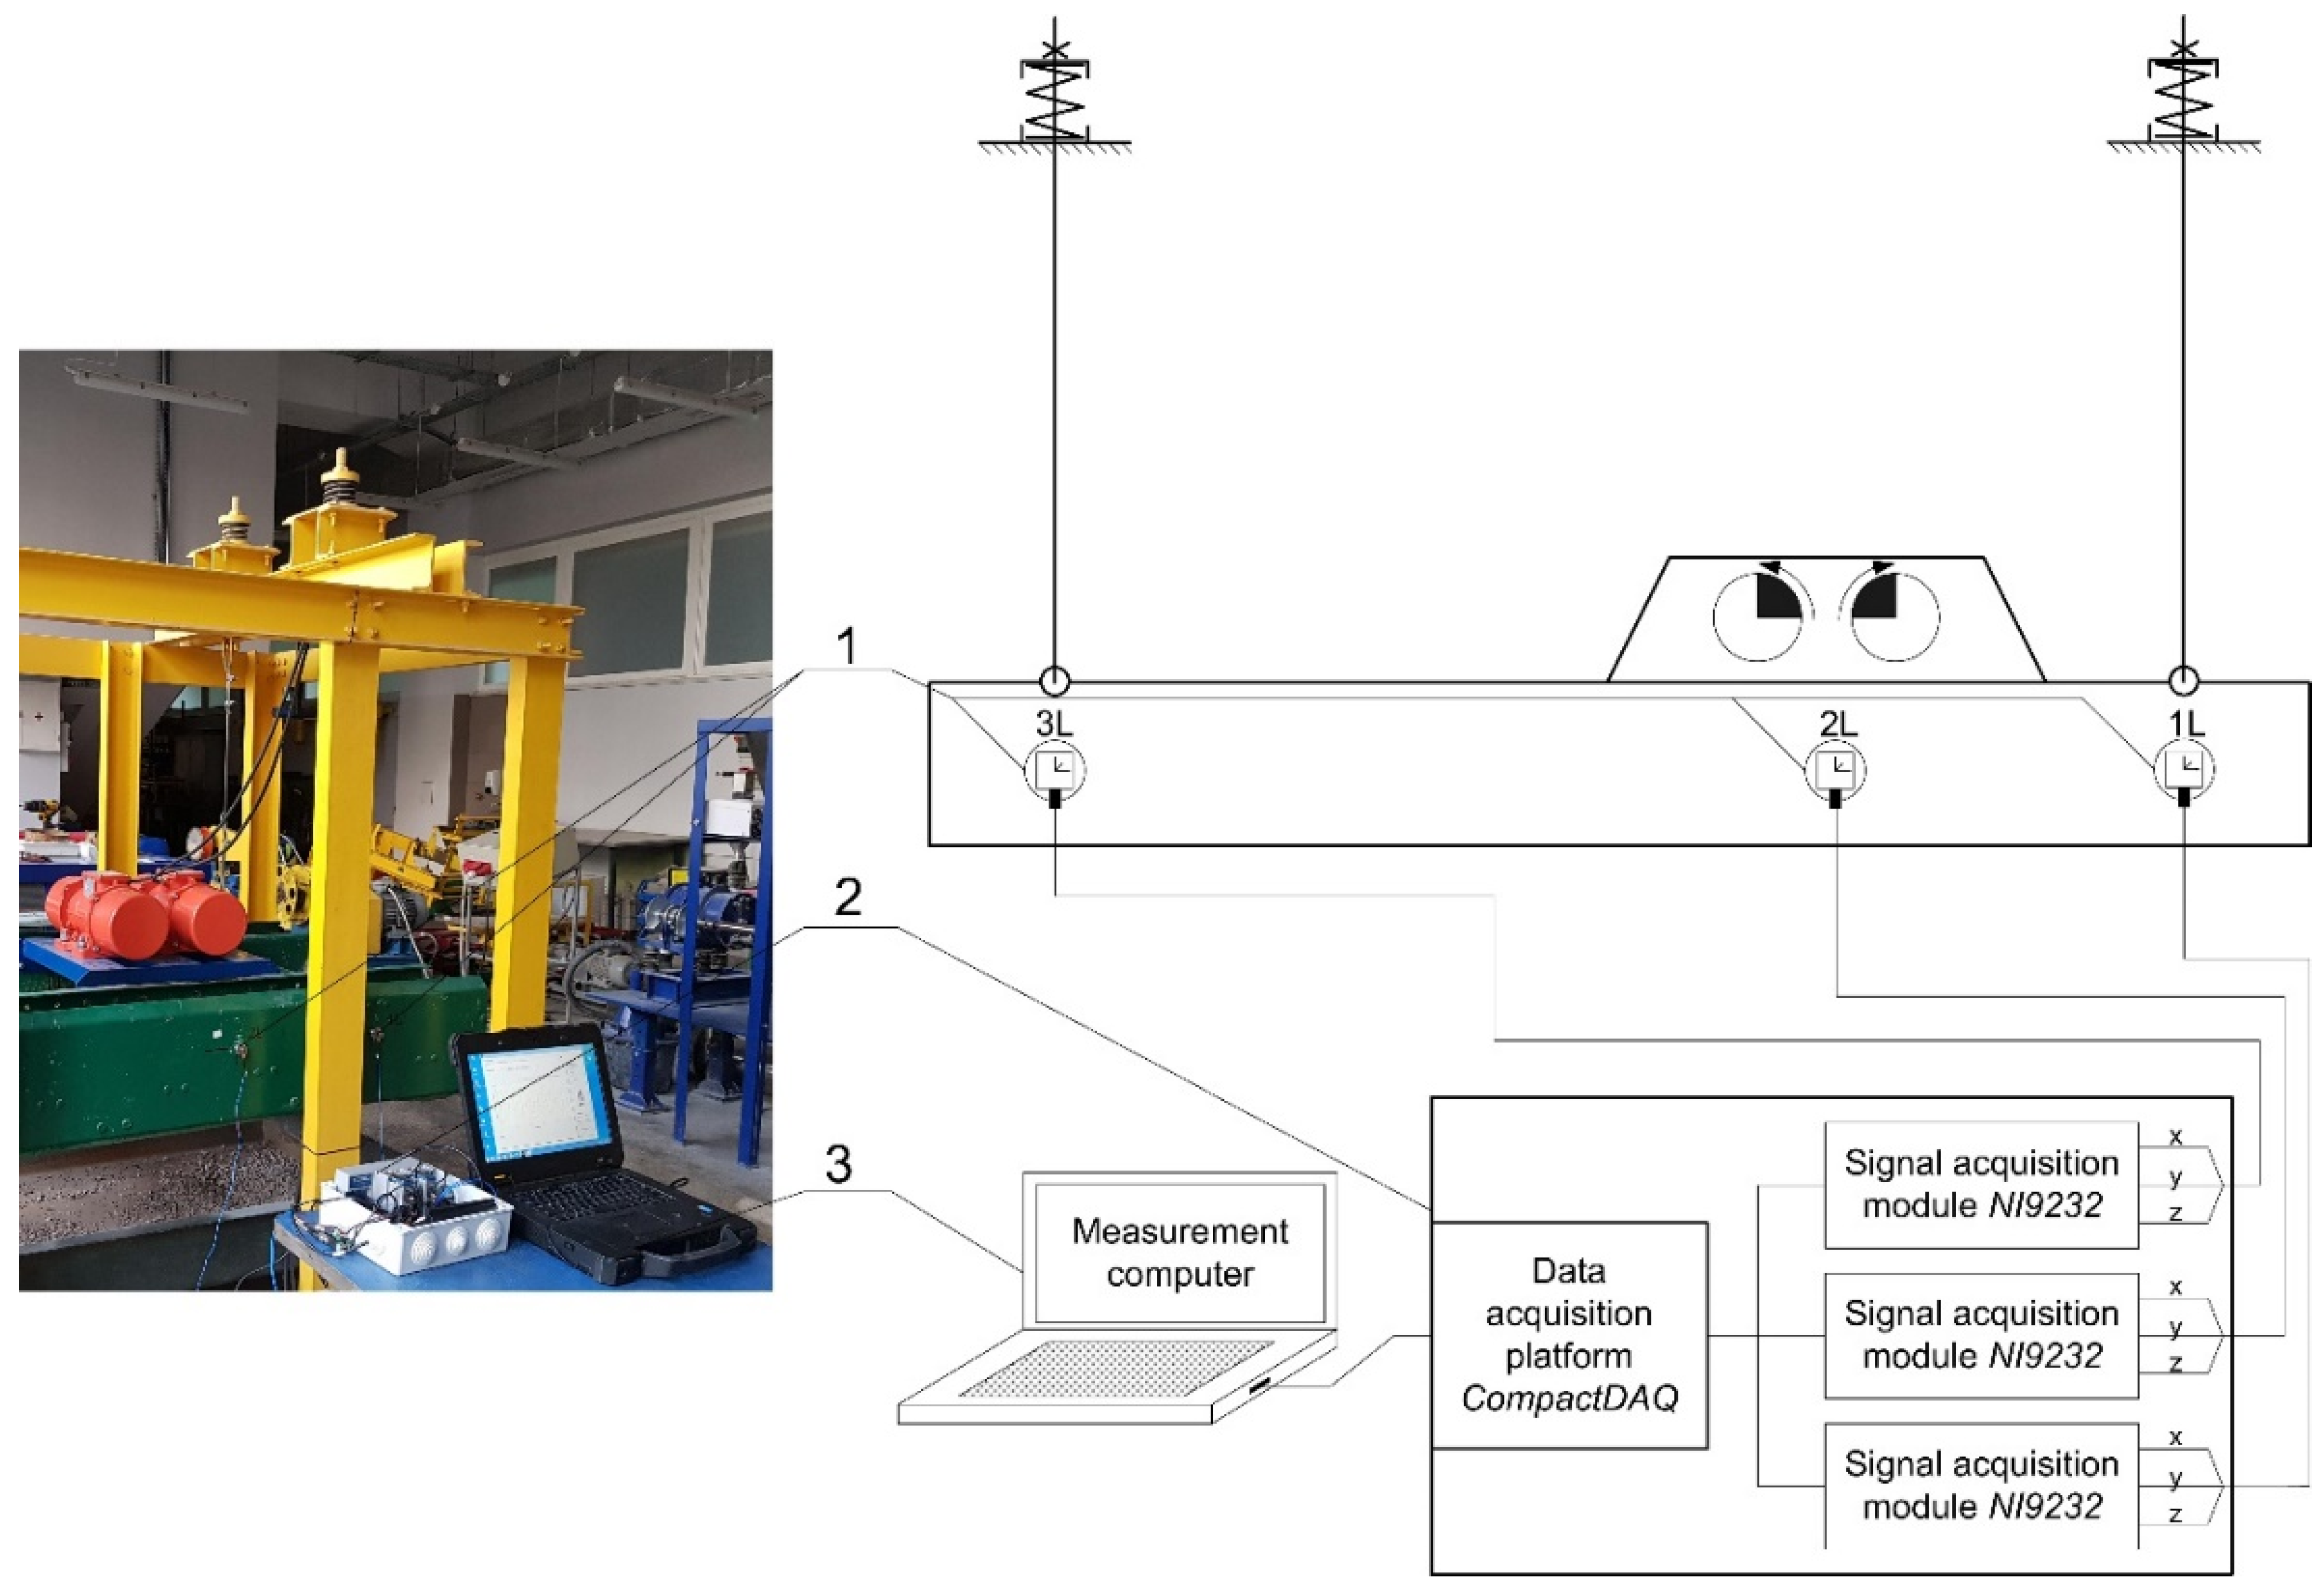
The tests of vibrating motion parameters were conducted using a measurement system based on three-axis acceleration sensors. The view of this station is shown in
Figure 7.
The main elements of the system include:
NI 9232 3-Ch measurement cards built into the CompactDAQ cDAQ-9174 housing;
Triaxial piezoelectric acceleration sensors PCB 356A02;
DELL Latitude Rugged Extreme 7404 measuring computer with the necessary software.
Proprietary (non-commercial) software developed in the LabView environment was used to record the measurements. All tests were performed at a sampling rate of 1000 Hz. The measurement error of the equipment used should be estimated at a max of 3%.
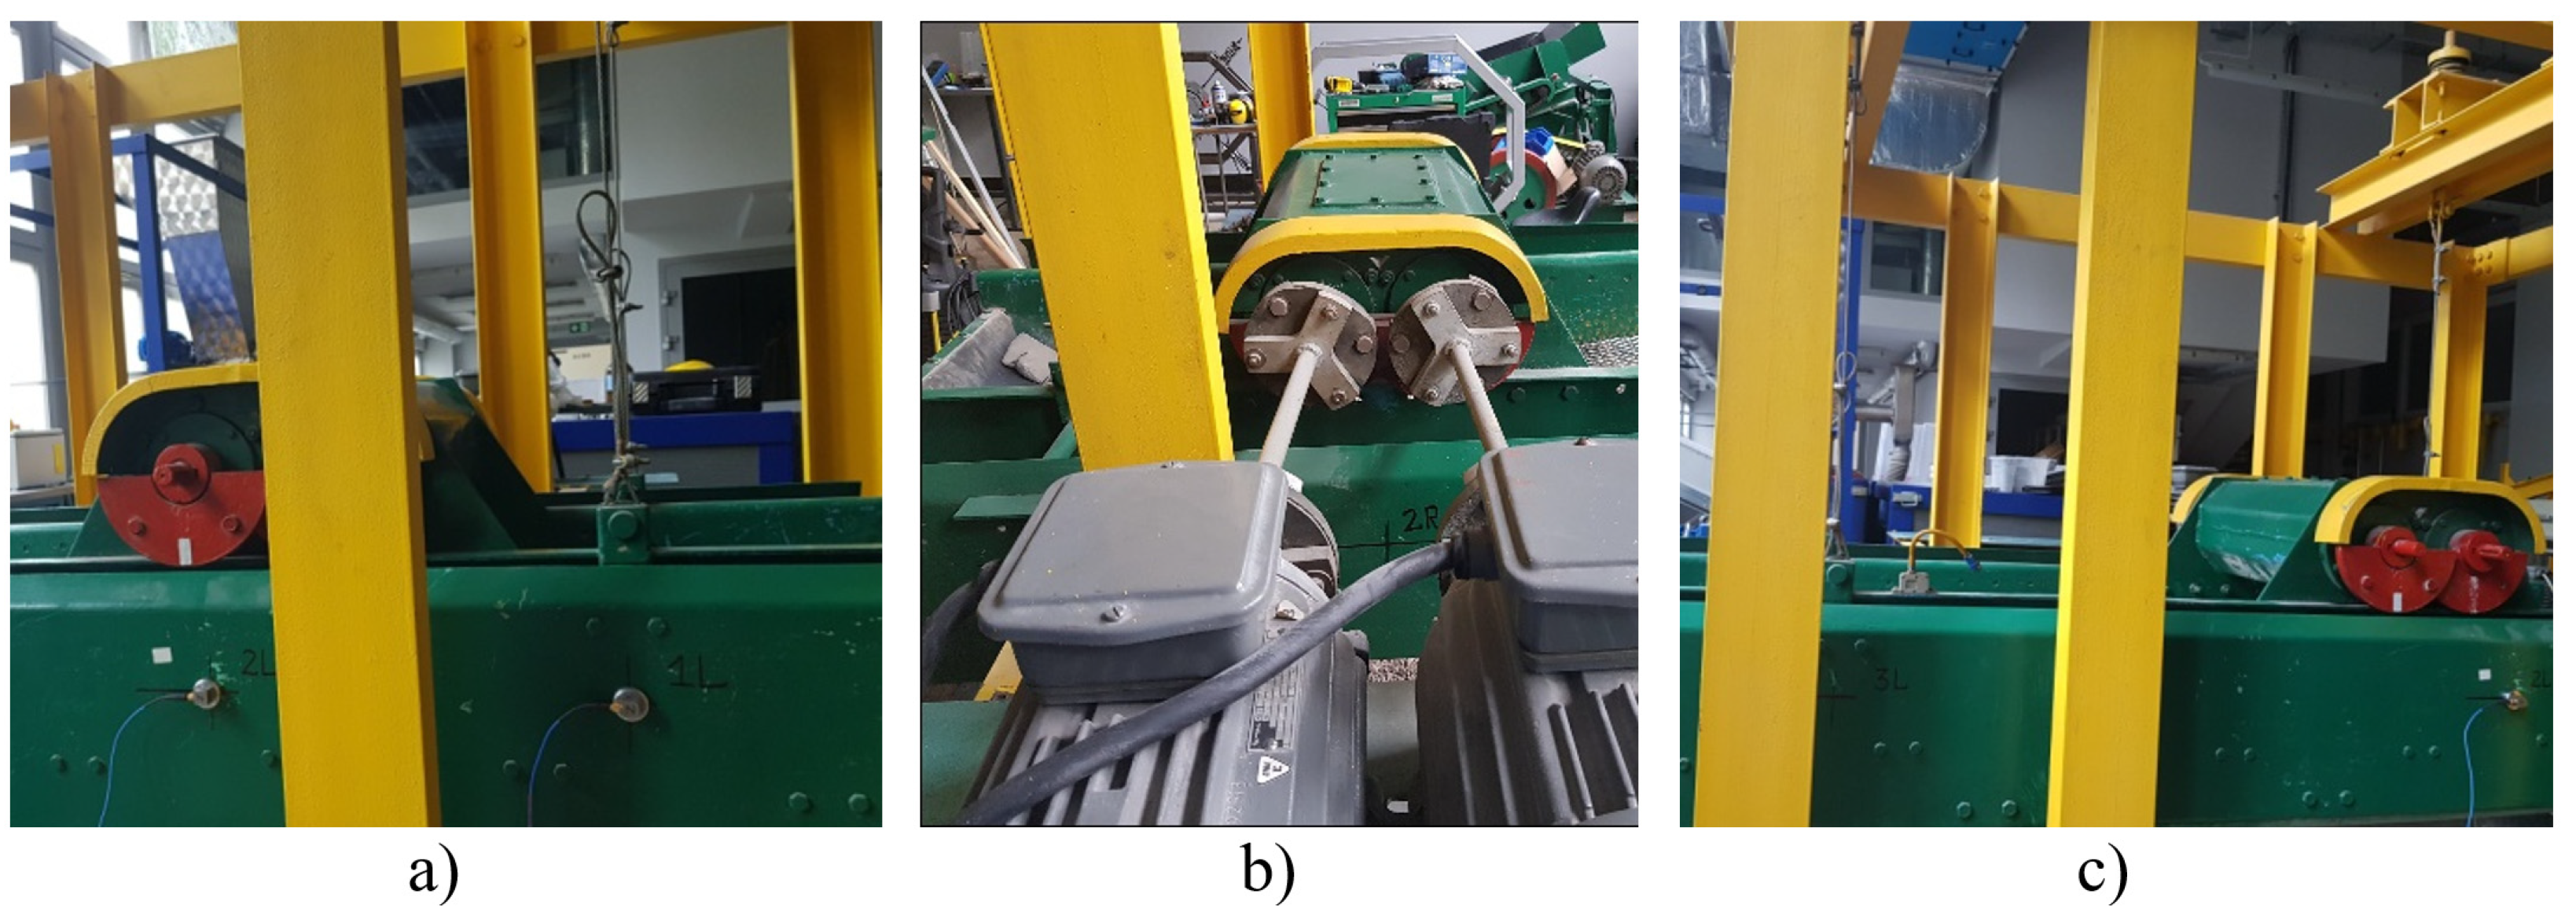
The parameters of the screen vibrating motion in transient states for both variants of the drive system were tested at three characteristic points on both sides of the riddle (symmetrically in relation to the plane of symmetry between the riddle’s sides—i.e., on the left and right sides of the riddle, looking from the side of the outlet of the product from the screen)—similarly to steady state investigations. These points were marked with numbers from 1 to 3 and with the letters “L” or “P”, e.g., 1L, 1P, depending on which side of the riddle they were located. All the points were situated on the level of the open grid plate in such a way that:
Points 1L and 1P coincided with the plane perpendicular to the riddle’s side passing through the riddle suspension points located closer to the unloading side of the screen;
Points 2L and 2P coincided with the plane perpendicular to the riddle’s side which was also the plane of symmetry of the drive system (parallel to the axis of the vibrators);
Points 3L and 3P coincided with the plane perpendicular to the riddle’s side passing through the riddle suspension points located on the side of the feed inlet to the open grid plate.
The view of some of the selected points is shown in
Figure 8.
The tests were carried out using software for visualizing the trajectory of vibrations based on acceleration time courses. During the investigations, the vibrating motors were powered by a system with a thyristor frequency converter, which enabled determining a constant start-up time and stopping the system in a natural way after the power supply was switched off. The vibration amplitude measurement tests were carried out for the rated frequency (50 Hz); the acceleration was recorded from the moment of switching on the power supply until the time when the vibration amplitude stabilized, and next, from the moment of switching off the power supply to the moment of stopping the riddle. The start-up and braking courses were analysed independently.
The analysis of the received vibration amplitude measurement waveforms allowed for determining the maximum value of the amplitude in the x and y directions. Then, the maximum multiples of vibration were calculated—which is the result of dividing the maximum value of the recorded amplitude by the amplitude value in the steady state.
4.1. Start-Up Tests
The first stage of the works involved start-up tests carried out in accordance with the research procedure described earlier. An example of a vibration amplitude time course for the classic drive system in the x, y and z directions has been shown in
Figure 9.
As shown in
Figure 9, the increase in the vibration amplitude occurs in the first two seconds after starting the drive, and then the screen stabilizes its operation. The full stabilization of the vibrations, which allowed the determination of the amplitude in the steady state, took place after approx. 60 s. Several times higher values of the maximum vibration amplitude were measured in the y direction (red line) compared to the x direction (blue line), for which, in most cases, the maximum amplitude value was equal to the steady state operating amplitude. In the z-direction perpendicular to the sieve of the screen, the vibrations disappear after the stabilization period.
The analysis of the obtained vibration courses allowed determining the maximum amplitude values and amplitude increase multiple in relation to the amplitude in a steady state. The results are presented in
Table 1 and
Table 2.
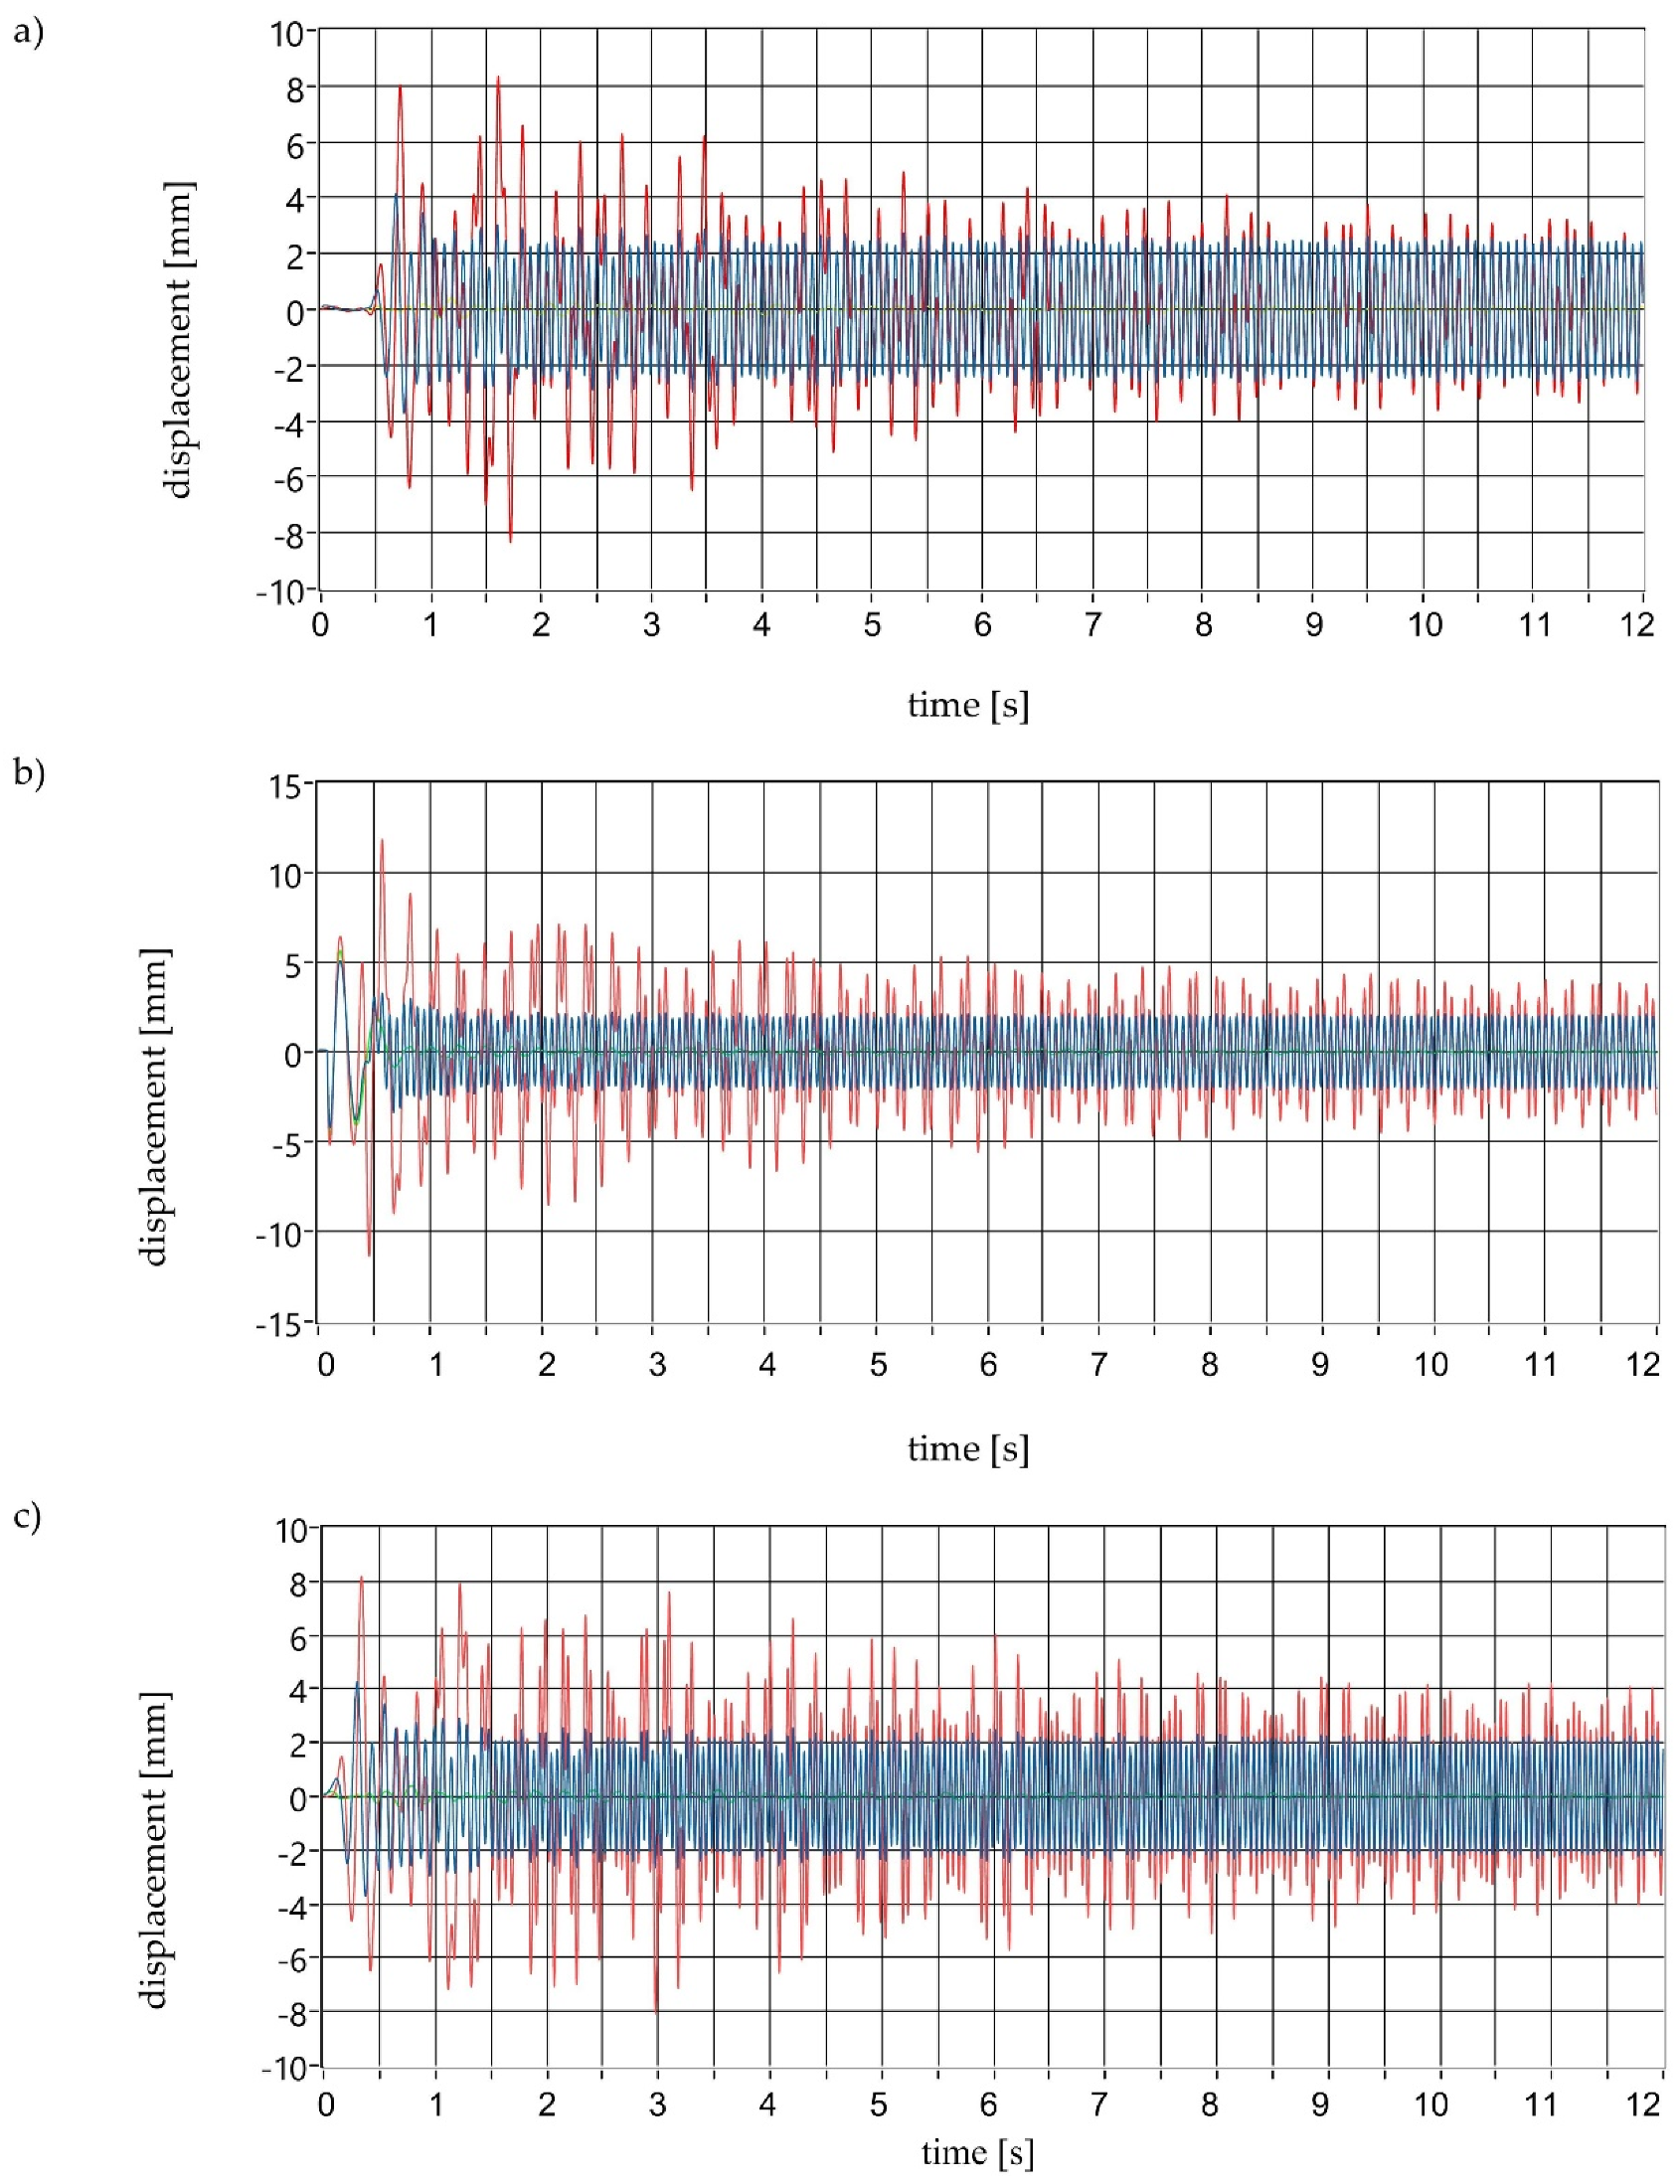
The second stage included screen start-up tests on a modernized stand, where the new drive based on vibrating motors was used. Examples of vibration amplitude courses for point 1L are shown in
Figure 10.
In the case of a start-up with a new drive (
Figure 10), the vibration amplitude increases in the first second after starting the movement. The full stabilization of the vibrations, which allowed the determination of the amplitude in the steady state, took place after approx. 2 min. As in the case of the classic drive, higher amplitude values were recorded in the y direction (red line). These values, however, are significantly lower compared to the old drive. In this case, an increase in the amplitude was also observed while passing through the resonance in the x direction.
The maximum amplitude values are several times higher in the y direction compared to the x direction, where there was no increase in vibration amplitude. The amplitude in the y direction is at least six times and, in some cases, up to nine times higher than the steady-state amplitude.
As in the case of the old drive system, the analysis of the obtained vibration courses allowed determining the maximum amplitude values and multiple of amplitude increase in relation to the amplitude in a steady state. The results are presented in
Table 3 and
Table 4.
The maximum amplitude values are more than twice as high in the y direction in comparison with the x direction. The greatest increase in amplitude at points 1L, 2L, 1P and 2P (points closest to the drive mounting point) was obtained for the frequency of 16.5 Hz, whereas the greatest increase in amplitude was recorded at points 3L and 3P (at the end of the screen) for an operating frequency of 19.8 Hz. The increase in amplitude in the x directions is at most two-fold in comparison with the steady-state amplitude, while in the y direction there is a maximum five-fold amplitude increase. The increase in vibration amplitude during the start-up of the screen with vibrating motors is significantly smaller than in the case of the start-up of the screen with a classic drive system.
The maximum amplitudes obtained from the measurements during the start-up are much lower than the values calculated based on the theoretical formula (4). According to this formula, for a classic drive system, with a start-up lasting 2 s and a rated speed of 960 rpm, the amplitude during resonance will increase 28.8 times. Experimental verification showed that the maximum amplitude increased 9.7 times (compared to the amplitude value in the steady state). In the case of the new drive, the start-up time was shorter and amounted to 1 s; here, according to formula (4), the increase in amplitude is 20.7, and in the experiment, it did not exceed 5.7. That proves that the existing theoretical formula significantly elevates the amplitude values during screen passes through resonance.
4.2. Braking Tests
The tests of the old drive braking were carried out in accordance with the procedure described earlier. Examples of courses are shown in
Figure 11.
The screening machine braking process can be divided into two stages. In the first one, the vibrator stops freely, which takes about 7 s; during this time, the increase in amplitude is practically invisible. In the second stage, during which vibrations are no longer forced from the rotating vibrator, resonant vibrations appear. Then the amplitude in the y direction (red line) is several times higher than the amplitude during steady operation. During braking, as during starting, no significant increase in the amplitude of vibrations occurred in the x direction (blue line). Vibrations appear in the z-direction (green line), and their amplitude is many times lower than in the x and y directions, and in principle, it has no effect on the operation of the screen.
The analysis of the obtained vibration courses allowed determining the maximum multiples of vibration amplitudes during braking. They are presented in
Table 5 and
Table 6.
As in the case of start-up, the maximum values of amplitude during braking on the y axis are many times higher than those on the x axis. However, there was no clear relationship between the maximum amplitude and the frequency of vibrators operation in steady states. During the braking of the classic drive system, the amplitude values are slightly lower than during its start-up. During starting, the maximum increase in amplitude was 9.7 and 6.9 (mm/mm) during braking.
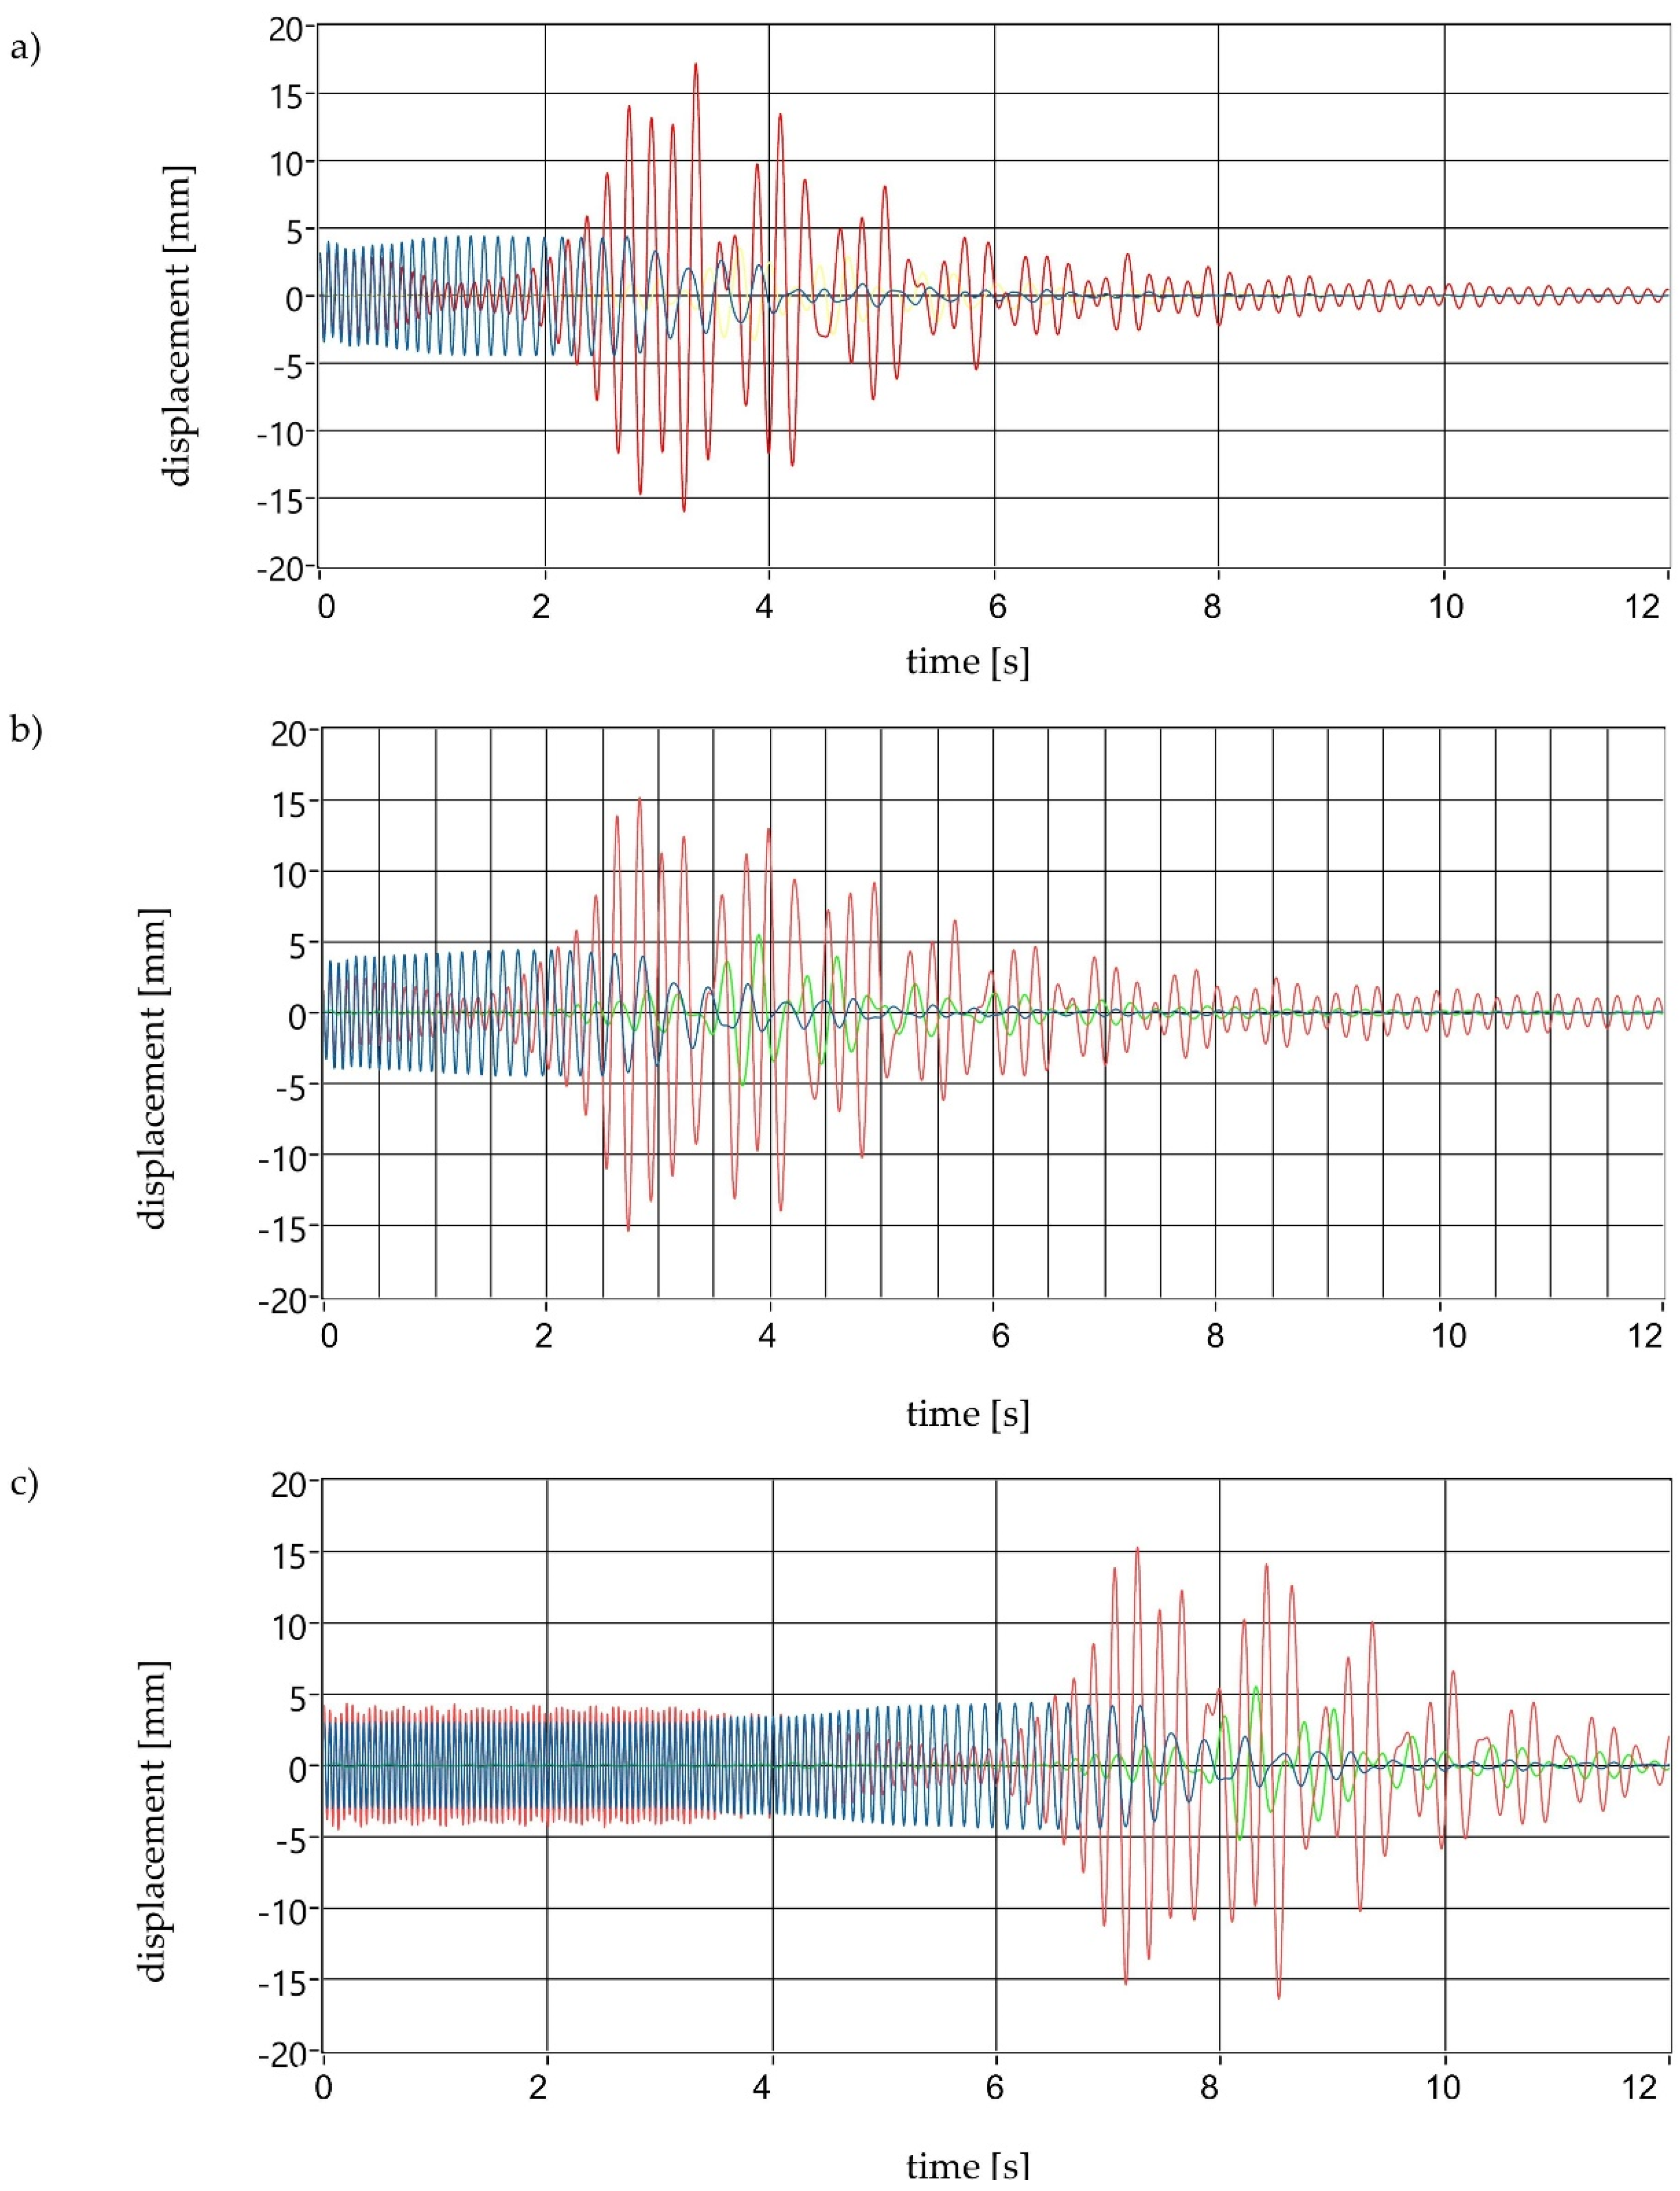
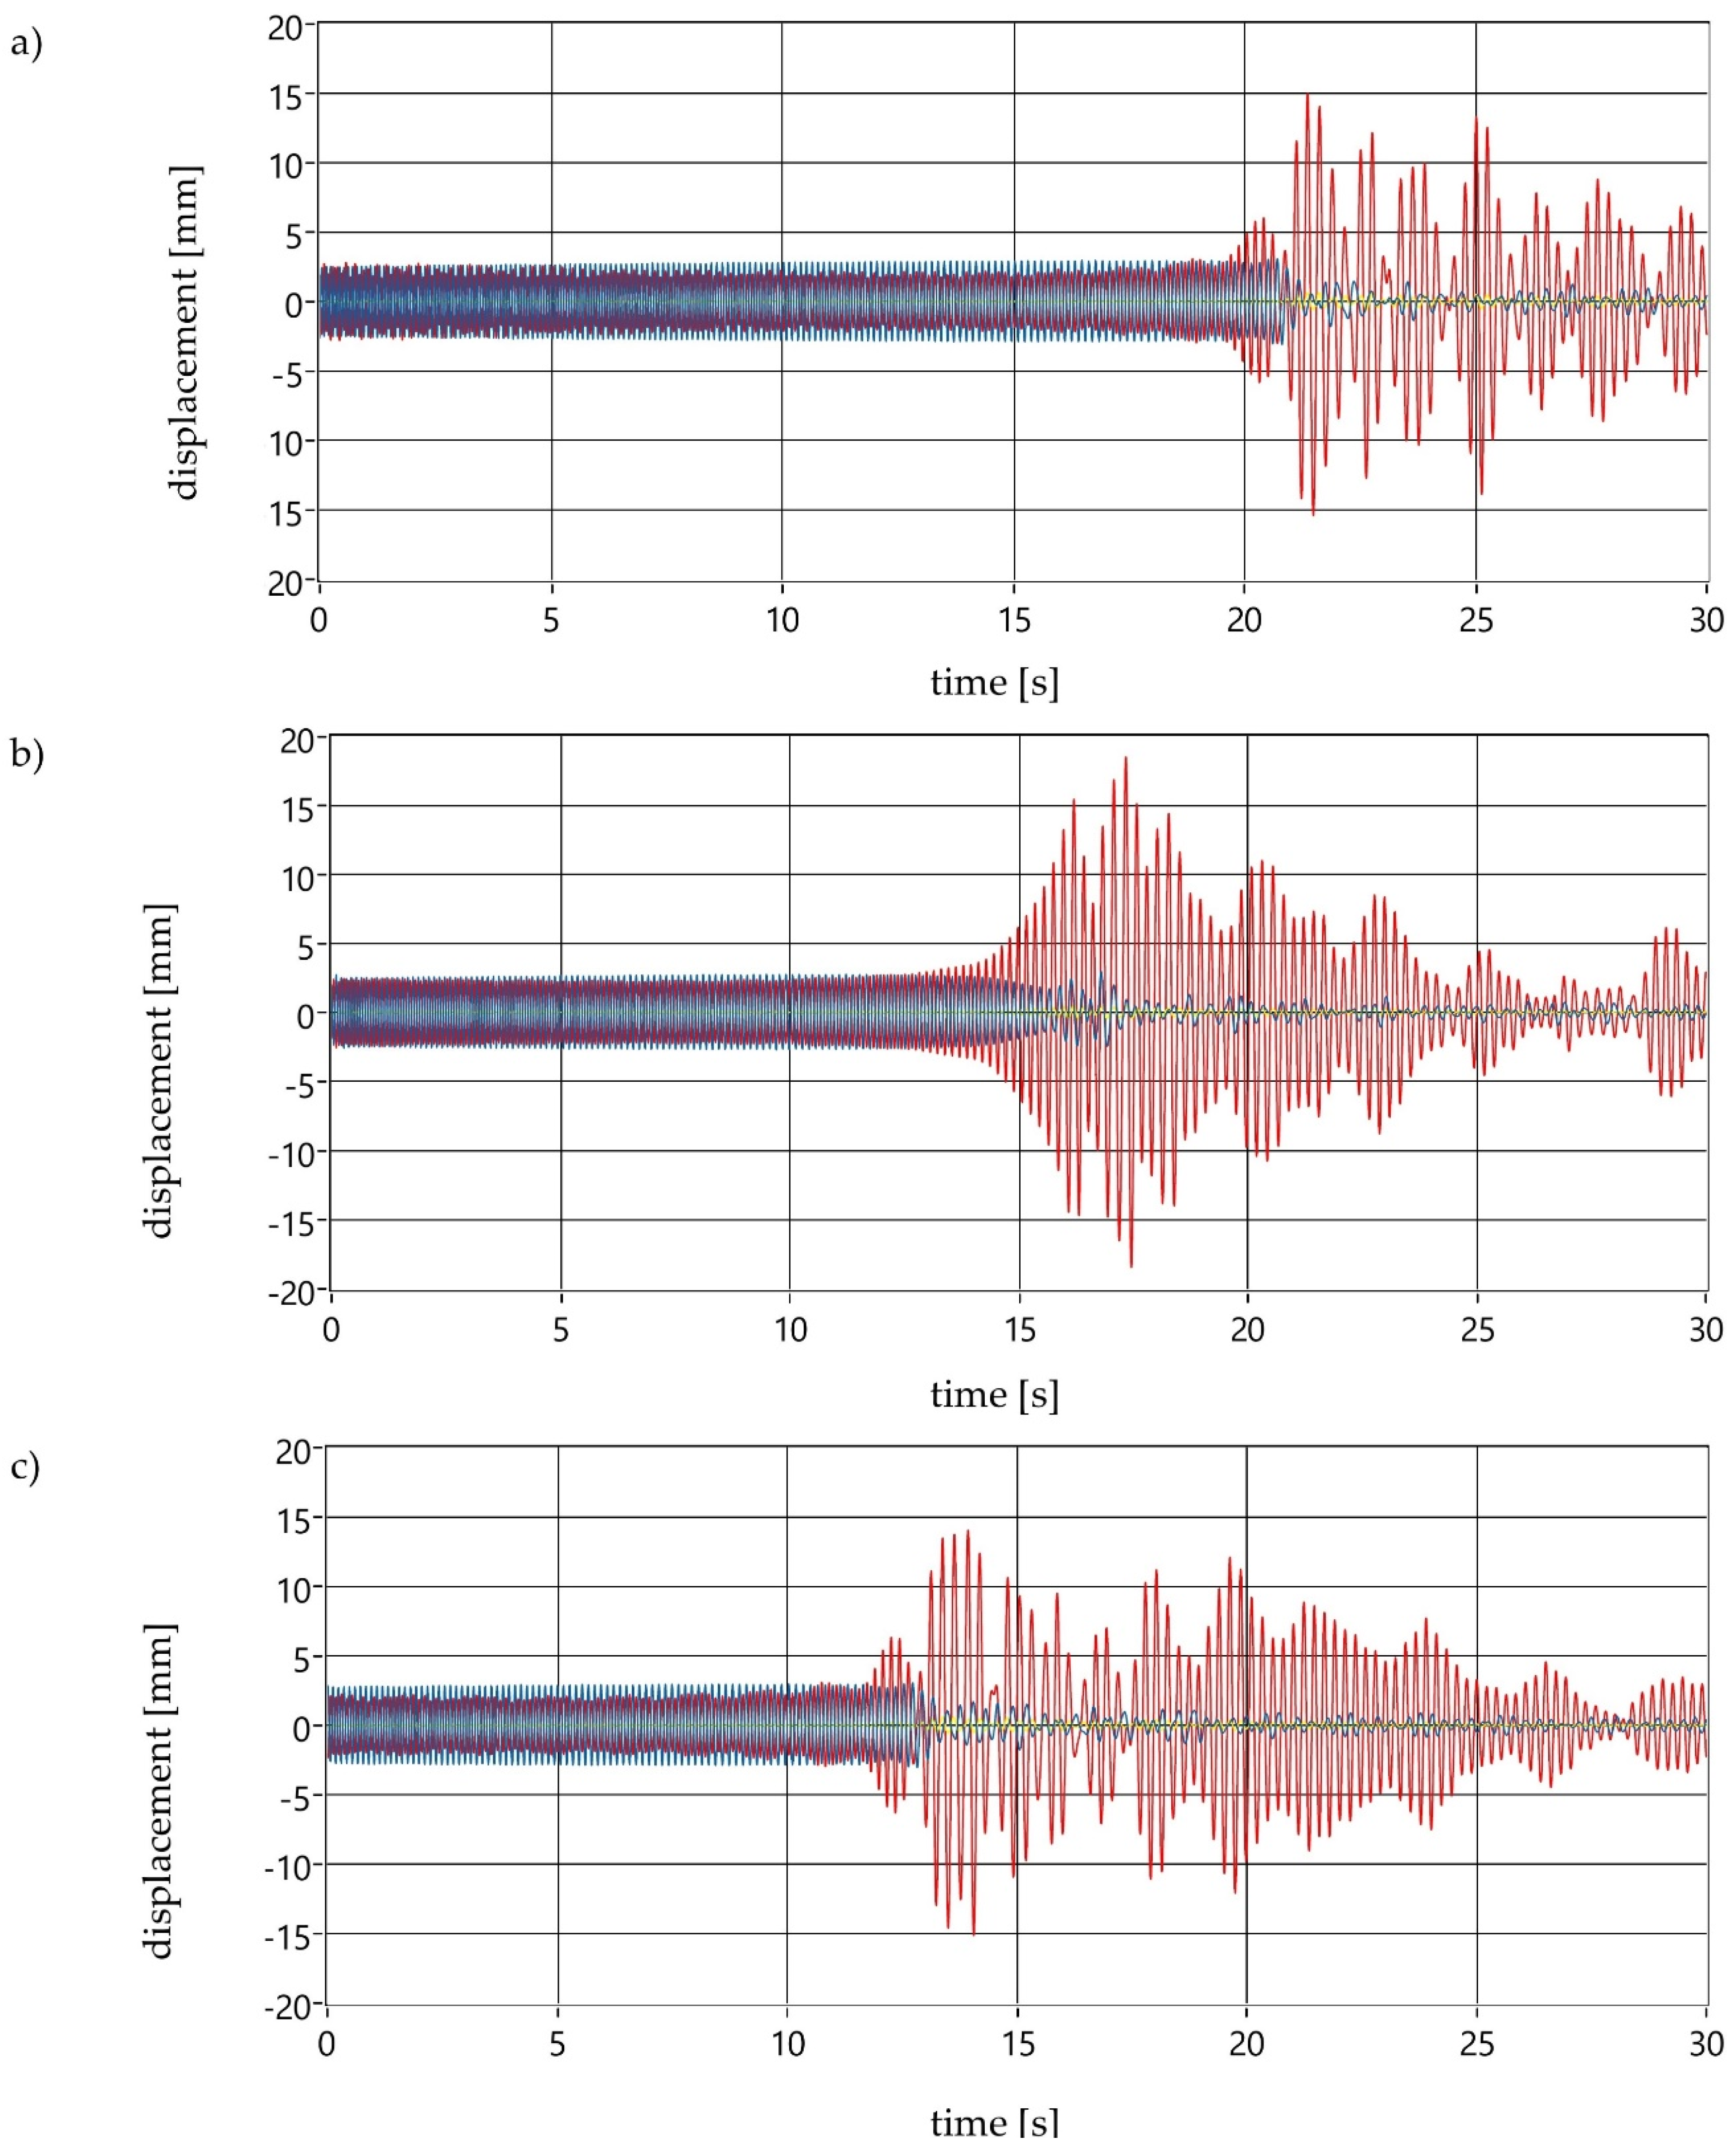
Another series of measurements was conducted on a test stand with the new drive system. Examples of courses of vibration amplitude measured for three different frequencies of operation in a steady state are shown in
Figure 12.
The time needed to reduce the engine speed for the new drive system is much longer than for a classic drive system. The vibration motor stopped in a dozen or so seconds, during which the vibration amplitude gradually increased. As in the case of braking with the classic drive system, the maximum amplitude value appeared when the rotational speed of the vibrator coincided with the natural frequency of the screen. As for the classical system, the amplitude is several times higher in the y direction (red line) than the x direction (blue line). In the z-direction (green line), vibrations appear with values much lower than in the other directions during braking; these vibrations do not significantly affect the screen’s operating parameters. Therefore, their further analysis was omitted.
The multiples of vibration amplitudes during braking for a drive system based on vibrating motors are shown in
Table 7 and
Table 8.
As in the case of start-up, the maximum values of amplitudes during braking on the y axis are many times higher than those on the x axis. However, there was no clear relationship between the maximum amplitude and the frequency of vibrations in steady states. A comparison of amplitude values during start-up and braking indicates an evident increase, reaching 100% in the case of the highest operating frequency.
The use of the new drive system resulted in higher vibration amplitude values during its breaking than for the classic drive system. The amplitude multiplication in the case of the classic system was a maximum of 6.9 (mm/mm), while for the new drive, it was 11.4 (mm/mm). The obtained amplitude values during braking are several times lower than those resulting from Equation (5), theoretical calculations. In the case of braking lasting 7 s, the multiplication of the amplitude for theoretical considerations should be 24; in fact, it was only 6.9. During braking with a new drive type, these values are 35 (based on calculations) and 11.4 (based on tests).
Measurements for each point and frequency were performed ten times, making it possible to calculate the measurement uncertainty of the maximum amplitude based on the normal distribution (2σ model). The maximum measurement error, depending on the measuring point and the vibration frequency, was:
- –
in the y direction: 7% during starting and 12% during braking;
- –
in the x direction: 18% during starting and 26% during braking.
The values of the amplitudes in the x direction are much lower than in the y directions. Therefore, the significant measurement error in this direction resulting from the screen’s operating characteristics (its oscillations) can be considered acceptable.
5. Conclusions
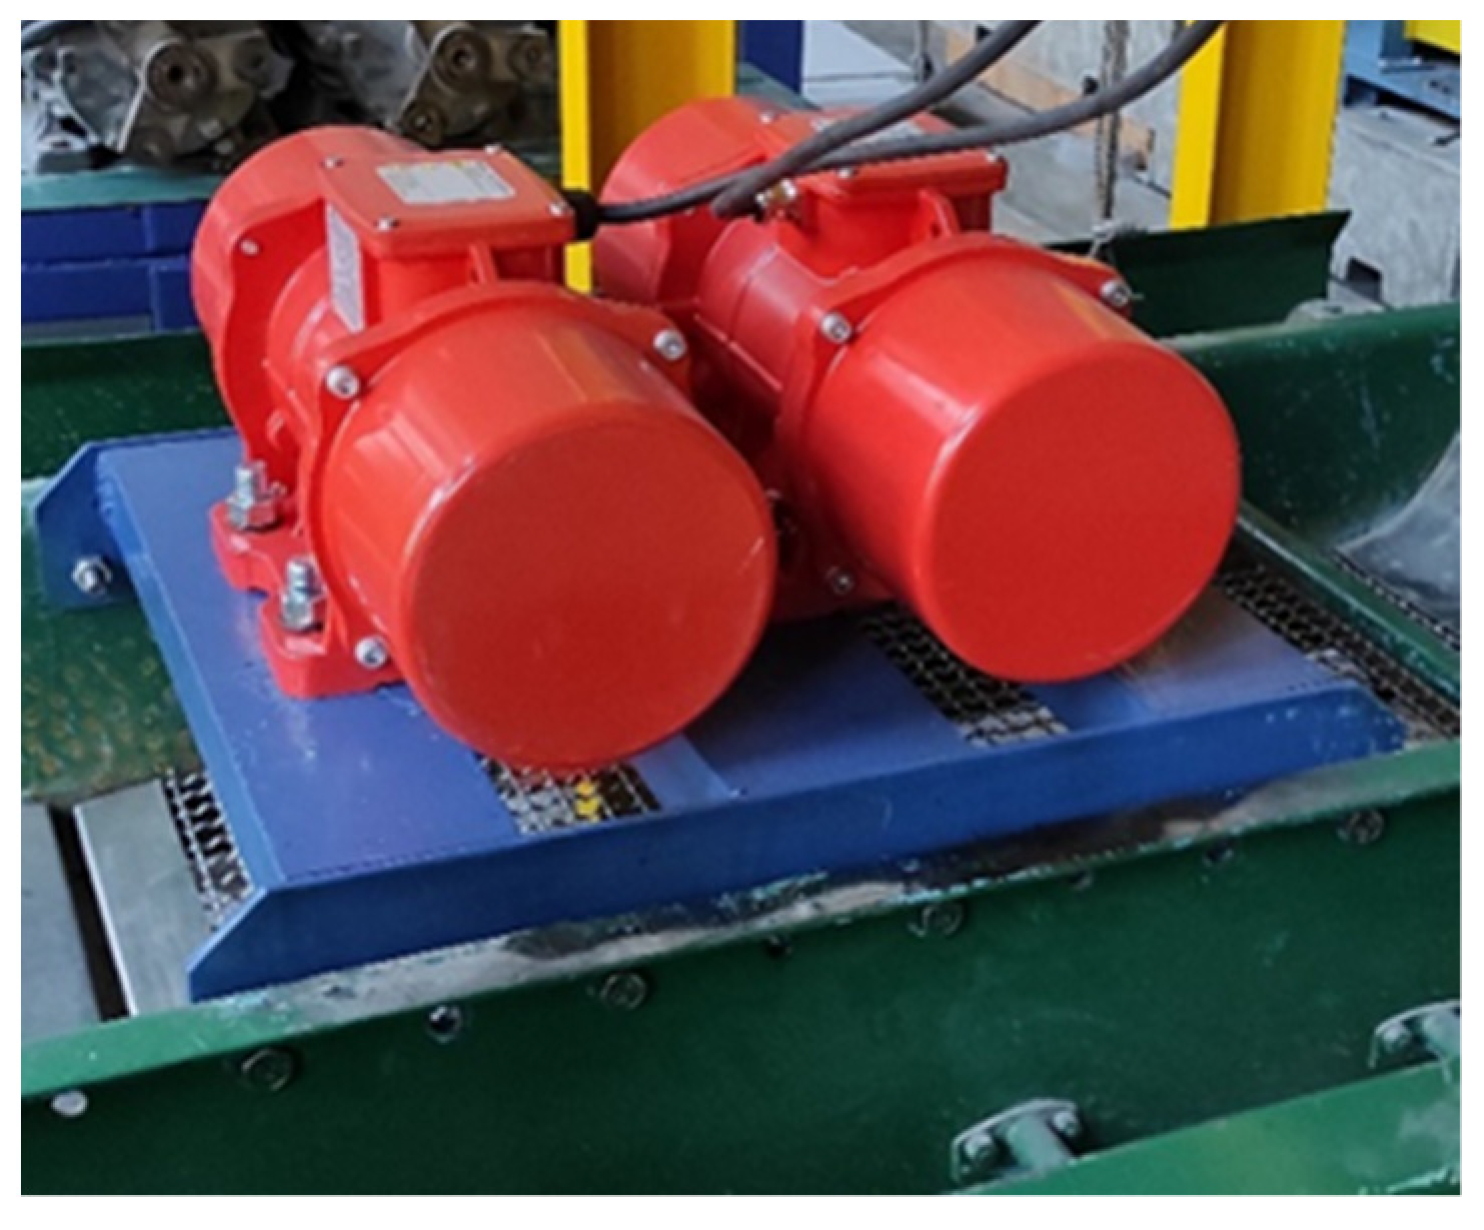
The conducted tests have proven that the new drive unit (two asynchronous vibrating motors) was selected in a proper manner, owing to which the previous characteristics of the machine’s operation have been maintained. The electric vibrators have been placed in a way enabling the self-synchronization effect to occur without any obstacles. Using a frequency converter in the power supply system makes it possible to set the machine’s operating parameters in a wide range of vibration frequencies, which significantly exceeds the one applied in conventional solutions.
The research on vibration amplitudes during start-up and braking have revealed that:
During start-up, an approximately two-fold increase in vibration amplitude is observed in the case of both the classic and new drive system.
The start-up of the screen causes the greatest amplitude increase at the measurement points which are the furthest from the drive (3L and 3P), only for the highest vibration frequency. In the remaining cases, the maximum increase is observed at the measuring points located near the drive.
The screen vibration amplitudes at the points that are located symmetrically in relation to the plane of symmetry of the riddle are identical, which proves the correct installation of the drive system and the vibrating system symmetry.
A comparison of the vibration amplitudes during the start-up of the new solution with a classic system (asynchronous motor—clutch—inertial vibrator) revealed a slight decrease in its value. This effect is due to the shorter time needed to reach the rated rotational speed of the motor.
Braking of the screen with the new drive system is associated with a significant increase in the amplitude of vibrations, which may reach ten times the rated values. This value is much higher than during start-up and approximately 30% higher compared to the classic solution. The increase is due to the elimination of a flexible (tyre) clutch in the design, which caused damping in the system.
The tests of the screen with the new solution of the drive system in transient states have revealed that the absence of flexible couplings in the drive system reduces the damping of vibrations and increases the amplitude value during the free braking of the machine. However, this does not have a significant impact on the correct operation of the machine in a steady state.
Modernizing the screen by applying the new drive system made the rated power has decreased by approximately 63%: from 2 × 1.5 kW to 2 × 0.55 kW. The drive power reduction did not extend the start-up time, which is of key importance for the increase in the amplitude of vibrations during the transition through resonance.
The conducted research allows stating that, due to the possibility of reducing energy demand as well as simplifying the structure, reduction of the sound pressure level [
31] and increasing the safety of operation while maintaining the desired operating parameters, it seems advisable to modernize the drives of industrial vibrating screens equipped with classic drive systems.


