Article

Accessibility of Pores to Methane in New Albany Shale Samples of Varying Maturity Determined Using SANS and USANS

1
School of Minerals and Energy Resource Engineering, Kensington, University of New South Wales, Sydney, NSW 2052, Australia
2
Australian Centre for Neutron Scattering, Australian Nuclear Science and Technology Organisation, New Illawarra Road, Lucas Heights, NSW 2234, Australia
3
WA School of Mines: Minerals, Energy and Chemical Engineering, Curtin University, Perth, WA 6102, Australia
4
Indiana Geological and Water Survey, Indiana University, Bloomington, IN 47405-2208, USA
*
Author to whom correspondence should be addressed.
Energies 2021, 14(24), 8438; https://doi.org/10.3390/en14248438
Submission received: 12 November 2021 / Revised: 3 December 2021 / Accepted: 9 December 2021 / Published: 14 December 2021
(This article belongs to the Special Issue Characterization of Unconventional Petroleum Reservoirs)

Abstract

:
The accessibility of pores to methane has been investigated in Devonian New Albany Shale Formation early-mature (Ro = 0.50%) to post-mature (Ro = 1.40%) samples. A Marcellus Shale Formation sample was included to expand the maturation range to Ro 2.50%. These are organic matter-rich rocks with total organic carbon (TOC) values of 3.4 to 14.4% and porosity values of 2.19 to 6.88%. Contrast matching small-angle neutron scattering (SANS) and ultra-small angle neutron scattering (USANS) techniques were used to generate porosity-related data before and after pressure cycling under hydrostatic (in a vacuum and at 500 bar of deuterated methane) and uniaxial stress (0 to ca. 350 bar) conditions. Our results showed that the accessible porosity was small for the samples studied, ranging from zero to 2.9%. No correlation between the accessible porosity and TOC or mineralogical composition was revealed, and the most likely explanation for porosity variation was related to the thermal transformation of organic matter and hydrocarbon generation. Pressure caused improvements in accessible porosity for most samples, except the oil window sample (Ro = 0.84%). Our data show that densification of methane occurs in nanopores, generally starting at diameters smaller than 20 nm, and that the distribution of methane density is affected by pressure cycling.

1. Introduction

Relating porosity to permeability in organic-matter-rich shales and determining how organic matter connectivity and accessibility to hydrocarbons influence reservoir properties are important aspects of shale studies that can help predict hydrocarbon producibility from unconventional shale reservoirs [1,2,3]. This is a complex issue due to the intricate multiscale geometry of the pore space, which is characterized by a very wide distribution of pore sizes (from nm to cm [4]) and the presence of fractures. The experimental structural data needed for the development of statistically relevant permeability models could be partly provided by X-ray tomography (for pore sizes larger than about 1 μm; [5,6,7]), including specific information pertaining to fractures [8,9]). However, for pore sizes in the range of nm to μm, SANS and USANS are more suitable for the investigation of volume-representative nano- and microstructural features [10,11,12,13] which are crucial for the generation and expulsion of hydrocarbons in unconventional reservoirs.
The Devonian New Albany Shale formation contains rocks that provide an opportunity to investigate changes in pore geometry and pore accessibility with the maturity of organic matter and to identify controlling factors, since: (1) it is a kerogen type II sequence rich in organic matter (OM); (2) the rocks cover a significant maturity range from immature to post-mature [4,5,6,7,8,9,10,11,12,13,14,15,16]; (3) this gas play formation has been extensively studied and a large body of geological and geochemical data is available [14,17,18]. Several studies have specifically focused on the porosity characteristics of New Albany Shale rocks. For example, a previous study by Mastalerz et al. [19] using a New Albany Shale suite of samples of OM maturity equivalent to a vitrinite reflectance (Ro) range of 0.50–1.41% documented complex changes in porosity and pore size distribution that were attributed to maturity-related organic matter transformation and hydrocarbon generation. Based on SANS and USANS experiments, Bahadur et al. [10] observed an initial decrease in total porosity with increased maturation, followed by reversal of this trend in post-mature samples. A recent study by Mastalerz et al. [20] used mercury injection capillary pressure (MICP) data to discuss controls on the pore systems with increasing maturity as they relate to drainage and imbibition. That study suggested that maturity variation influenced pore volumes throughout the entire pore size range detected by MICP; the correlation was strongest for pores smaller than 100 nm, and the lower-maturity shales hosted significantly larger pore volumes than the higher maturity samples.
Despite the general availability of geologic data on the New Albany Shale, the accessibility of pores to methane in these shales is largely unknown. It is an important issue because this formation has been attracting continued interest as a gas producer since the late 1800s [21]. Limited SANS data on the New Albany Shale samples with Ro values equal to 0.55% and 0.62% suggested very low volumes of pores accessible to methane and carbon dioxide (based on small changes of SANS intensity with CD4 and CO2 pressure [11]). The present study investigates the accessibility of pores to methane in five New Albany Shale samples of varying maturity: (1) Ro 0.50%—SDH-308 from Harrison County, Indiana; (2) Ro 0.70%—McAtee-2798 from Pike County, Indiana; (3) Ro 0.84%—Gibson-3997 from Gibson County, Indiana; (4) Ro 1.04%—Hardin-IL2 from Hardin County, Illinois, and (5) Ro 1.40%—Hardin-IL3 from Hardin County, Illinois. The main objectives of this study are to: (a) quantify the pore size distributions throughout the entire pore size range as determined by SANS and USANS; (b) assess the fraction of pores accessible to methane; (c) evaluate the pore size dependence of accessible pores in the pore size range from single nanometers to about 20 μm. These characteristics are determined for (a) samples at ambient pressure and (b) for the same samples subjected to several cycles of hydrostatic and uniaxial pressure of a magnitude and duration compatible with well treatment during hydraulic fracturing. The samples were used in as-received state to preserve the original pore fillings as close to the reservoir ones as reasonably possible.

2. Samples

The sample materials selected for this study included five Devonian New Albany Shale samples of varying maturity, ranging from marginally mature, with vitrinite reflectance (Ro) of 0.50%, to over-mature, having Ro of 1.40% (Table 1). Three lower maturity samples (Ro of 0.50%, 0.70%, and 0.84%) were collected from cores drilled in Indiana (depths ranging from ~60 m to 1218 m) and two higher maturity samples (Ro of 1.04% and 1.40%) were collected from outcrops in Hardin County in Illinois. Samples from similar New Albany Shale locations and of similar maturity range were previously a subject of several porosity-related studies [10,19,20,22]; the results of these studies were used here as a guide for sample selection for methane accessibility measurements. To extend the maturity range, the results for a post-mature sample of Devonian Marcellus Shale (Ro ≈ 2.50%, sample No 6 in Table 1) were included. SANS and USANS data for that sample were recently discussed by Radlinski at al. [3] and Blach et al. [12].
Samples for SANS and USANS measurements were prepared in the form of thin platelets (ca. 0.9 × 20 × 20 mm3) cut from well-characterized core materials oriented in the direction parallel to bedding (L-type samples). The cores were carefully sliced using a variable-speed diamond saw set at slow rotation rate (100 rpm) to avoid possible thermal alteration of the organic matter. To determine spatial uniformity of the core material, 5 to 9 adjacent slices were prepared from each core, SANS was measured for every slice, and the calibrated results of I(Q) were compared. In general, for each core the I(Q) data for individual slices were identical, with accuracy ranging from ±2.2% (for the McAtee-2798 core) to 4.9% (for the Gibson-3997 core), which is marginally above the SANS method reproducibility of about 1%.

3. Experimental Methods

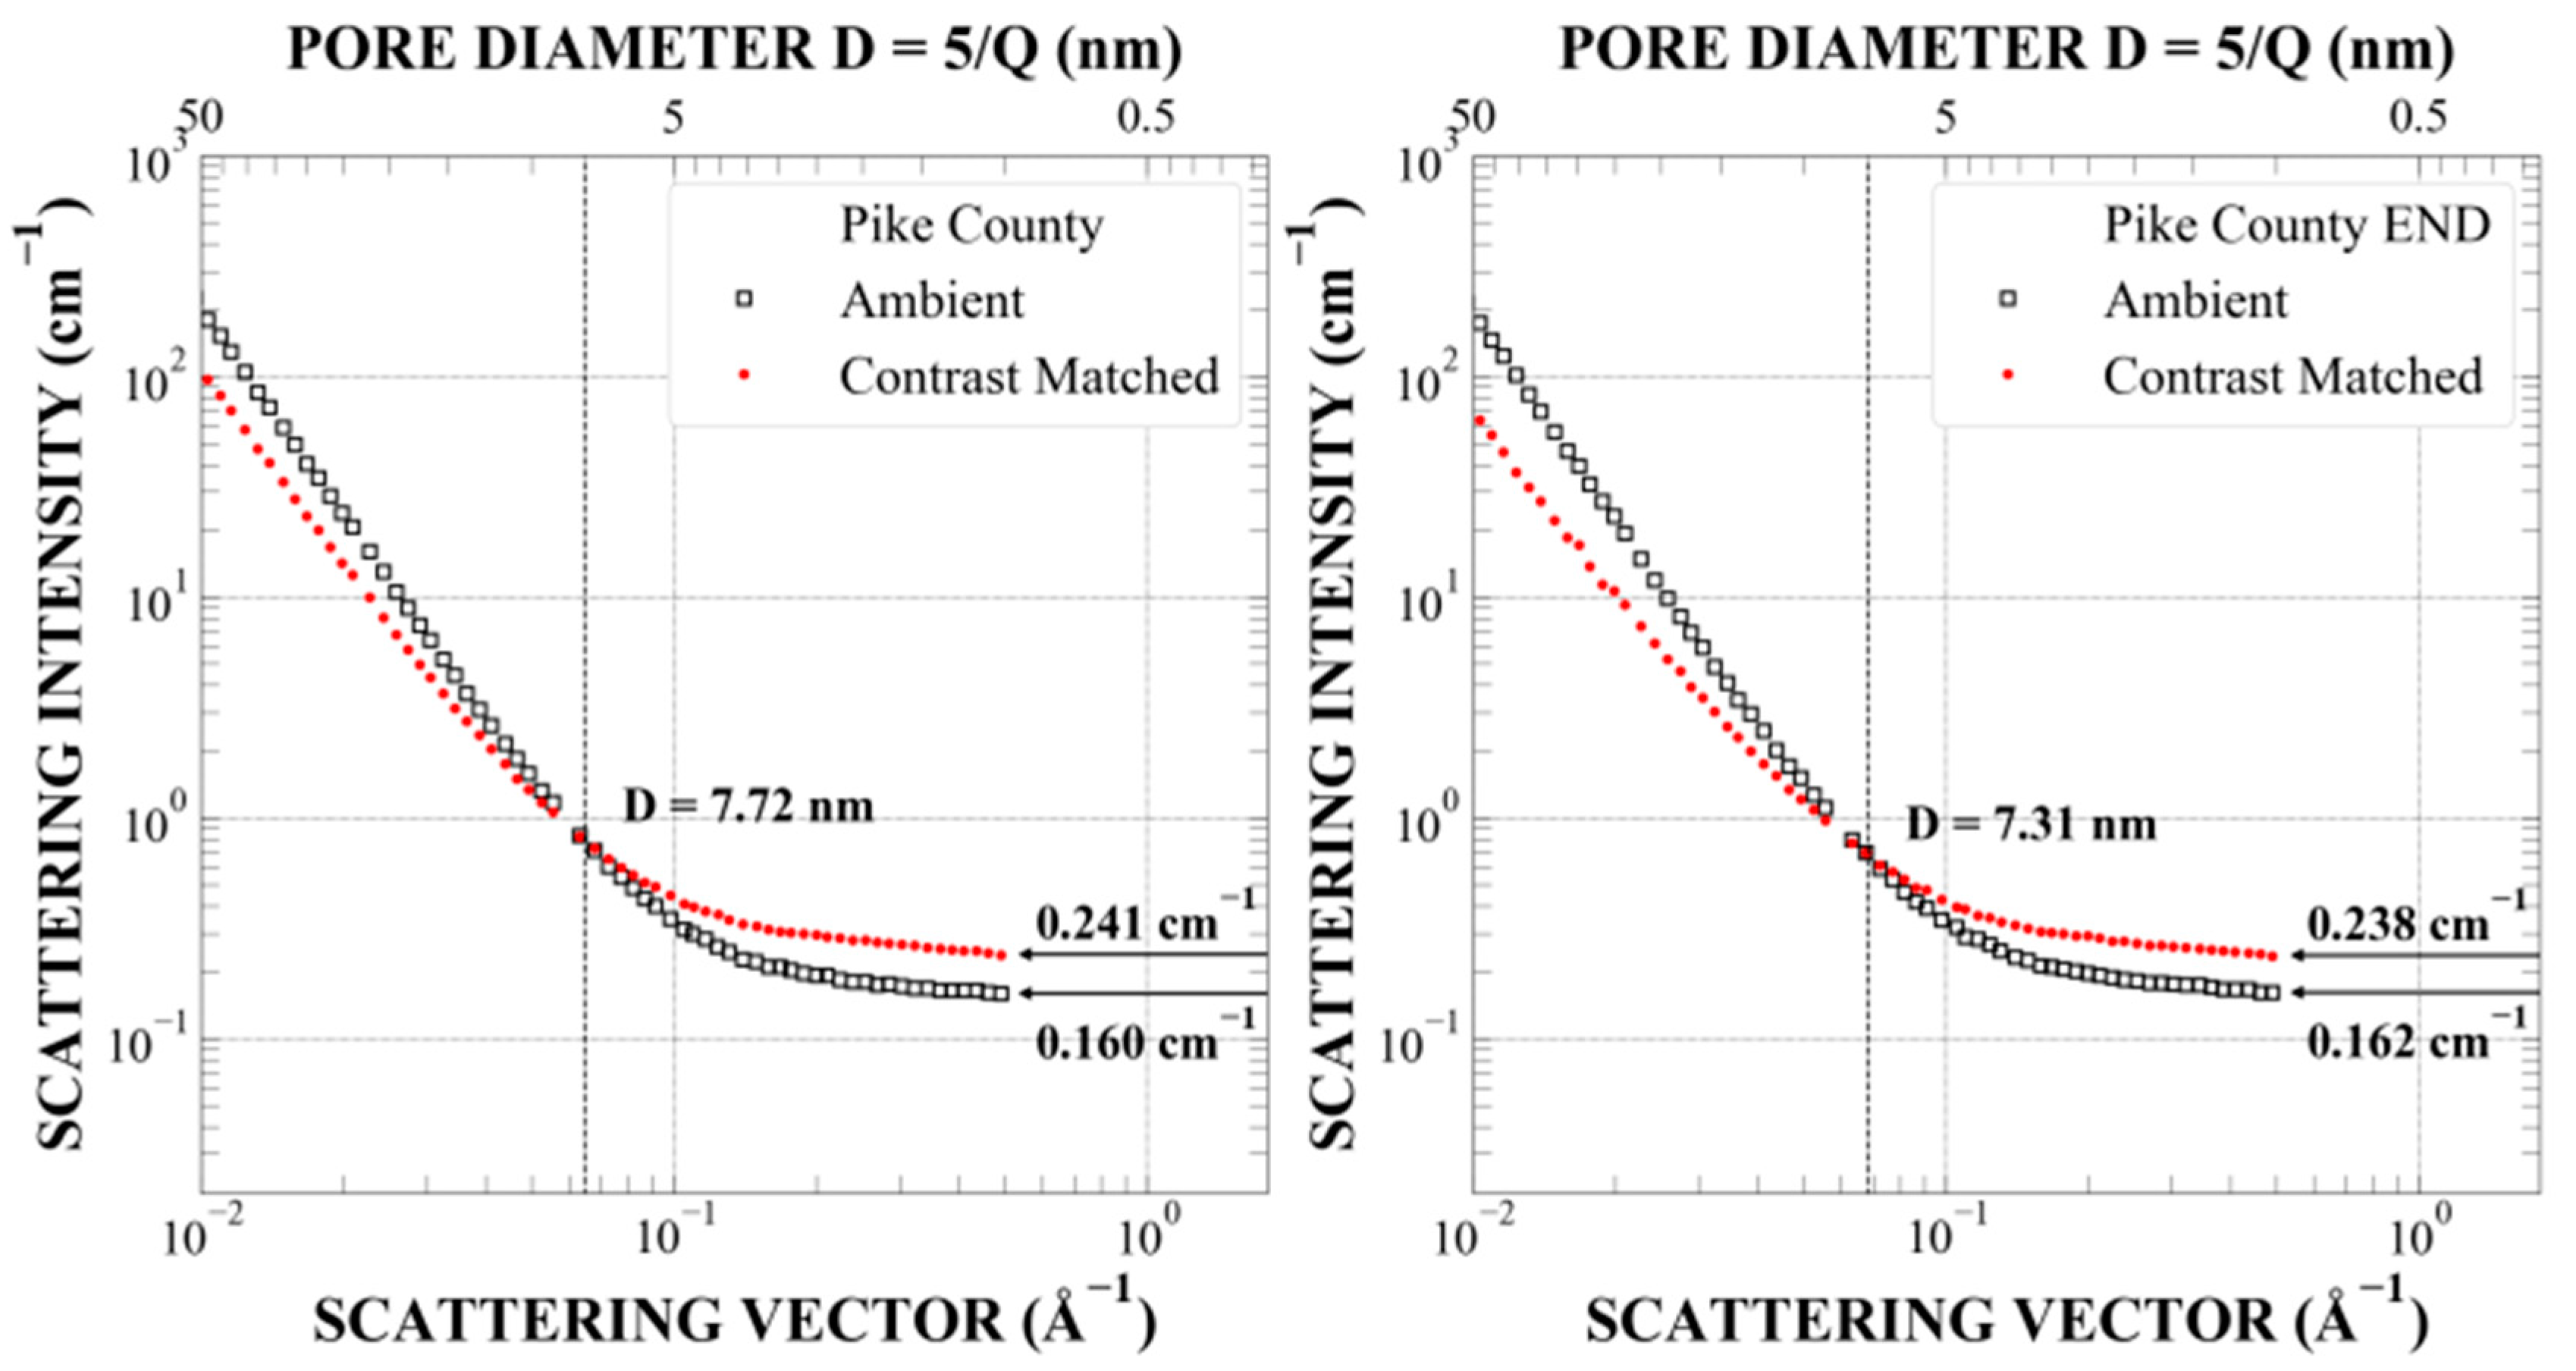
3.1. Principle of Contrast Matching Measurements of SANS and USANS

The intensity of SANS and USANS scattering, which effectively takes place on the pore-rock matrix interface, is controlled by the geometry and content of the pore space [13]. The contrast matching technique takes advantage of the possibility of modifying the scattering intensity, I(Q), by forcing liquids or pressurized gases into the pore space, thereby changing the scattering contrast between the rock matrix and the pore content, where (Δρ) = ρm − ρp is the difference between the scattering length density (SLD) of the rock matrix, ρm, and the SLD of the pore content, ρp [3,12,23,24,25,26,27,28]. The variable Q = (4π sinθ)/λ is the scattering vector, where 2θ is the scattering angle and λ is the neutron wavelength; for small scattering angles, Q is simply a re-scaled measure of the angular deviation of the neutron beam transmitted through the rock slice [4].
The physical and mathematical principles of contrast matching as well as practical examples of applications to geological materials have been published by many authors, mainly using deuterated liquids (including mixtures of water and heavy water and deuterated alkanes [29] and gases, e.g., CO2 and deuterated methane, CD4 [23,24,30,31]). A recent study pertaining to the measurement of pore accessibility in shales to methane was published by Radlinski et al. [3]. In this work, we use the same methodology.
In brief, we assume that pore shapes are spatially isotropic and may be described by a polydisperse spherical pore (PDSP) model to relate the pore space to the absolutely calibrated experimental form of the scattering intensity, I(Q). To this end, we use PRINSAS software [32,33] based on the following formula [34,35]:
I ( Q ) = ( Δ ρ ) 2 0 N ( r )   [ v ( r ) ] 2   F 0 ( Q , r ) dr  
where N(r) = Nf(r) is the number of spheres within the radius interval (r, r + dr) per unit volume, N0 is the total number of pores (per cm−3), f(r) is the pore size distribution, v(r) (= 4πr3/3) is the pore volume, and F0(Q,r) is the form factor for a sphere, i.e., F(Q,r), normalized to unity at Q = 0:
F(Q) = {[sin(Qr) Qr cos(Qr)]/(Qr)3}2
Subsequently, the pore size distribution f(r), internal specific surface area for different scales of measurements, R, SSA(R), the differential pore volume distribution ((dV/dr)(r)), and the total porosity (ϕ) are calculated. We note that the model also works reasonably well for moderately anisotropic samples [36,37], providing approximate “apparent” values of microstructural parameters. In this work, we use a sample orientation and experimental configuration that enable determination of the microstructural characteristics in the in-bedding direction and neglect possible flattening of pores in the direction perpendicular to bedding.
There is an approximate relationship between the scattering intensity, I(Q), and the radii of pores, r ± 50%, contributing most of the scattering intensity [23,32]:
r ≈ 2.5/Q
This justifies a relationship between I(Q) and the concentration of pores of the radius 2.5/Q; according to Equation (1), I(Q) and N(2.5/Q) are proportional to each other and this relationship is model-independent. It further follows from Equation (1) that the fraction of accessible pores, Fa(r), is approximated by:
Fa(r) = 1 − [N(r; {CM})/N(r; ambient)] ≈ 1 − [I(Q; {CM})/I(Q; ambient)]
where N(r) is the number of pores with apparent radii within the interval r ± dr, “ambient” means ambient conditions (in this work: vacuum and T = 23 °C), and the symbol {CM} (full contrast matching) indicates a condition where accessible pores are filled with a fluid with SLD matching the SLD of the rock matrix at the ambient temperature (T = 23 °C).
In addition to calculations based on the summation of pore volumes obtained according to the PDSP model, the total porosity, ϕ, can be directly obtained from the Porod invariant, PI, using the combined SANS and USANS intensity measured over a wide Q-range:
PI = 0 Q 2 I ( Q ) dQ = 2 π 2   ( Δ ρ ) 2   ϕ ( 1 ϕ )
The PI method has been applied here to I(Q) profiles measured in ambient and {CM} conditions, thereby providing model-independent apparent values for the accessible and inaccessible (to methane) porosity.
The scattering contrast, (Δρ)2 = (ρr − ρf)2, is determined from the difference between the scattering length density (SLD) of the rock matrix calculated from its mineralogical composition (e.g., using the NIST interactive software available at https://www.ncnr.nist.gov/resources/sldcalc.html (accessed on 10 September 2021); Table 1 and Table 2) and the physical density of the penetrating liquid or pressurized gas, ρf, for deuterated methane used in this work. SLD is proportional to the specific density at given (p,T) conditions, e.g., [3]:
ρ(CD4; p,T) = 1.00 × 10¹¹ × d(CD4; p,T)
The density of methane (CH4) versus pressure is tabulated in https://tinyurl.com/2sjwuvar (accessed on 10 September 2021) and https://tinyurl.com/u8p2xrpt (accessed on 10 September 2021); these values were converted to deuterated methane, CD4, assuming linear scaling of the gas density with molecular mass. In this work, for all New Albany Shale samples, the {CM} condition is closely approximated for the in-pore pressure of 500 bar of CD4 (Table 2). The maximal value of SLD for CD4 is limited by the pressure rating of the environmental cell used in this work, which is 4.1 × 1010 cm−2 (at p = 1 kbar and T = 24 °C; [12]). Full contrast matching with the New Albany Shale samples was reached at the pressure of 500 ± 50 bar; the value of SLD (CD4; 500 bar, 23 °C) is about 3.4 × 1010 cm−2 (e.g., [3]).

3.2. Instruments

SANS and USANS data were acquired using two instruments at the Australian Centre for Neutron Scattering, Australian Nuclear Science and Technology Organization, using a Quokka SANS instrument and Kookaburra USANS instrument, configured as shown in Table 2. Jointly, the instruments covered the pore diameter range from 1 nm to 25 μm.
Experimental data were processed and reduced to absolute units using standard procedures detailed by Radlinski et al. [3]. For SANS measurements at high gas pressures, the high Q-limit, Qmax ≈ 0.45 Å−1, was imposed by the cell acceptance angle, meaning 2rmin ≈ 1.1 nm in those conditions.
Samples were measured at 23 °C using a stainless steel environmental cell equipped with titanium windows as described by Blach et al. [12]. The cell is capable of simultaneously providing hydrostatic gas pressure, p, up to 1 kbar (100 MPa) and independently uniaxial pressure, S, up to 1 kbar. Experiments were performed at several steps of (p,S) pressure, where p was either 0 (sample in vacuum) or 500 bar of deuterated methane ({CM} condition) and S was increased stepwise from zero to a value ≤ 350 bar, depending on the sample; the maximum value of S did not exceed the estimated lithostatic pressure, which was evaluated based on the depth of burial corresponding to the maturity of the samples. In each case, enough time (ranging from 15 min to 1 h for the samples studied) was allowed for the gas pressure inside the cell to fully equilibrate before data acquisition.

3.3. Pressure Cycling Conditions

Following one hour of sample dewatering under dynamic vacuum, SANS and USANS data were acquired at 23 °C for ten different combinations of the hydrostatic pressure, p, and uniaxial stress, S (Table 3). SANS and USANS were measured for different slices of the same core, whose scattering was tested prior to pressure cycling and found to be identical within experimental uncertainty. The duration of a single measurement was about 1 h for SANS and about 6 h for USANS. Hydrostatic pressure was exerted by deuterated methane; its value (500 bar) was chosen to closely match the SLD of the rock matrix (Table 4 and last column in Table 5). The magnitude of the uniaxial stress and the duration of pressure cycles used here resembles the pressure ranges characteristic of industrial hydraulic fracturing conditions (for example, those used in the Marcellus Shale Formation [12]) and potentially could be used for stimulation of gas production from selected zones of the New Albany Shale Formation (and other shale formations). Although most of the previous gas production from the New Albany Shale Formation comes from shallow zones (less than 400 m) in the eastern part of the Illinois Basin [40], the parts deeper than 1000 m close to the basin depocenter have significant technically recoverable gas resources [41].

3.4. Supporting Measurements

Prior to SANS and USANS measurements, other analytical data were obtained on the splits of the samples, which include X-ray diffraction (XRD) measurements of total organic carbon (TOC), porosity (ϕ), and permeability (κ) and determination of the vitrinite reflectance (Ro). The main purpose of these analyses was to obtain the general characteristics of the studied shale and to provide background information for quantitative interpretation of the neutron scattering data. Below we include brief descriptions of these techniques; more details can be found in the paper by Radlinski et al. [3].
Samples for porosity and matrix permeability analyses were sent CORE LAB in Houston, USA. The bulk density of the shale samples was obtained by mercury immersion. The grain density was determined using the Boyle’s law double-cell technique with helium as the expansion gas. Subsequently, the porosity was calculated based on the difference between the grain and bulk density. The matrix permeability of the samples was determined by the pressure decay (Gas Research Institute method) on clean and dry rock fragments of 20 to 35 mesh size.
X-ray diffraction patterns of the whole rock fragments were generated using a Siemens D5000 X-ray diffractometer with a SDD detector, whereas for the clay fraction (<4 µm), a Scintag Pad-X X-ray diffractometer with a solid-state detector were used. A LECO elemental analyzer (SC832DR) was used to determine TOC contents of the samples. The vitrinite reflectance (Ro) of shale samples was measured using a Zeiss RS-III microscope, recording more than 25 readings on each sample and then averaging the values.

4. Results and Discussion

4.1. Mineralogy and Physical Properties of Shale Samples

The mineralogy and physical characteristics of the New Albany Shale samples are listed in Table 4 and Table 5. The mineralogy is dominated by quartz and clays and the bulk density varies from 2.25 to 2.55 g/cm3. The TOC content varies from 3.6% to 14.4% and the porosity ranges from 2.2% to 6%. The matrix permeability varies within the limits of 2.69 × 10⁻⁶ ≤ κ ≤ 8.1 × 10⁻⁵ mDarcy.
Values of SLD (Table 5) are calculated from the mineralogical composition of each sample and the nominal specific density of each mineral, using the NIST calculator software (https://www.ncnr.nist.gov/resources/activation/ (accessed on 10 September 2021)). The measured bulk density (Table 4) was used for PRINSAS calculations of differential pore volume per gram of rock. The incoherent scattering SANS background (Table 5) is estimated by analogy with the incoherent background for organic matter in coals of different rank (0.67% ≤ Ro ≤ 3.05%), which varies from 0.0017 to 0.0027 cm−1 per 1 wt% of TOC [42] based on the incoherent SANS cross-section measured for hydrogen nuclei bound in polymers [43]; to calculate numbers listed in Table 5, we used the value of 0.0022 cm−1 per 1 wt% of TOC (±20%), which is an average for organic matter (in coal) with Ro ≤ 1.6%.

4.2. Types of Micro- and Nanostructural Parameters Calculated from SANS–USANS Data

The pore nomenclature used in this paper follows the classification of the International Union of Pure and Applied Chemistry [44], where micropores are classified as pores <2 nm, mesopores as 2–50 nm, and macropores >50 nm in diameter. In addition, nanopores are defined here as pores with diameters within the ~1 to ~100 nm range [45].
Interpretation of the absolutely calibrated combined SANS and USANS intensity, I(Q), was done using the Porod Invariant method and conforms to the Polydisperse Spheres (PDSP) model implemented in PRINSAS software [32,33]. The following characteristics were obtained from the fits: (1) total porosity, ϕ; (2) pore size probability density distribution, f(r); (3) specific surface area versus the probe size (i.e., versus the scale of measurement, R), SSA(R); (4) distribution of differential pore volume versus pore size r, [dV/dr](r); (5) fraction of pores accessible to methane, Fa(r). These characteristics were obtained for pore diameters, D = 2r, in the range of ~2 nm to ~20 μm (for the linear scale 2R in case of the SSA values).
Because of the significant quantity of experimental data and the large number of associated plots, the complete set of plots for each shale sample (items 2 to 5) is presented in the Appendix. The results for New Albany Shale samples are shown in Appendices Appendix A.1,Appendix A.2,Appendix A.3,Appendix A.4,Appendix A.5 and for the Marcellus Shale Mar_7084 sample in Appendix A.6. In the main body of this paper, we only show illustrative examples of individual plots (for the mid-mature McAtee sample with Ro 0.70%) and focus on the discussion of global nanostructural trends related to the maturity of organic matter, in particular the accessibility of nanopores to methane.

4.3. Nano- and Microstructural Characteristics of the New Albany Shale Samples

The two-dimensional scattering patterns for the samples studied here are isotropic, since in the experimental geometry used here SANS is sensitive only to the distribution of pore shapes in the in-bedding plane [37,46]. Therefore, the 2D experimental SANS profiles can be azimuthally averaged to form one-dimensional I(Q) intensity curves. Figure 1 shows I(Q) curves for the McAtee-2798 sample measured in ambient conditions (in vacuum at 23 °C) and in contrast-matched conditions (at 23 °C and p = 500 bar of CD4) before (left panel) and after (right panel) pressure cycling (Table 2), with the large-Q background subtracted (~0.24 cm−1 in vacuum and ~0.16 cm−1 in contrast-matched conditions, before and after pressure cycling, see Section 4.5). After the background has been subtracted, the range of pore diameters suitable for further analysis is limited to 4 nm ≤ D ≤ 20 μm. Analogous curves for the remaining samples are shown in the Appendix. Sections pertaining to individual samples are numbered according to sample sequence in Table 5. It transpires that in the Q-range of 3 × 10⁻⁴ Å−1 ≤ Q ≤ 0.2 Å−1 (corresponding to the pore diameter range ~2.5 nm ≤ D ≤ ~1.5 μm), I(Q) follows the power law, I(Q) = A·Q−S + background, where -S is the power law exponent (and slope on the log-log scale), shown in Figure 2 as a function of Ro.
Slopes in the range of −4 ≤ −S ≤ −3 indicate the surface fractal geometry of the pore space, where the fractal dimension D is equal to 6 - S. In general, the surface fractal dimension D can vary for D = 2 for smooth interfaces to D = 3 for extremely rough (across many scales), volume-filling, tightly crumpled surfaces. For the New Albany Shale samples, the slopes range is from −3.3 to −3.0 (±0.1; Figure 2) and the slopes are systematically larger (less steep) for the inaccessible pore space (measured using contrast-matched samples), both before (left panel) and after pressure cycling (right panel). The corresponding fractal dimensions are 2.7 ≤ D ≤ 2.85 for all pores (sum of accessible and inaccessible pores) and 2.75 ≤ D ≤ 3.0 for the inaccessible pores. It follows that the interface is smoother for the accessible pores, possibly due to the long-term smoothing activity of dissolution processes, which eventually lead to the formation of interconnected flow paths [47].
For the five New Albany Shale samples studied here, there is no clear-cut trend for the fractal dimension with increased maturity (Figure 2). The fractal dimension does appear to increase with Ro, however, if data for the post-mature Mar_4078 sample are included, it is possible that the interface will appear to be rougher owing to the presence of pyrobitumen on the pore–rock interface in the post-mature Marcellus sample. Roughness is more accentuated for inaccessible pores; the slope values marginally smaller (within error) than −3.0 for the Mar_7084 sample (Figure 2) indicate that for post-mature shales, the internal surface may transform from a very rough interface (D ≈ 3) to an interface covered with multiscale irregular solid clusters (likely composed of pyrobitumen) separated by disconnected channels, which are better described as mass fractals.
The fractal dimensions do not seem to be related to the TOC values of the samples either (Table 5). This is consistent with previous observations that the organic matter porosity is concentrated in the nanometer size region [19,48], meaning it should not affect the geometry of the pore–matrix interface at larger scales.

4.4. Pore Accessibility to Methane

Figure 3 shows the pore size distribution f(r) (normalized to unity) and the specific surface area SSA(R) for sample McAtee-2798 (Ro 0.70%), where r is the pore size and R is the measurement scale (called probe size). Similar plots for other samples are shown in the Appendix. These results (aided by calculations of the Porod Invariant) were used to quantify the effect of pressure cycling on the apparent porosity (accessible and inaccessible to methane) and the apparent accessible and inaccessible internal surface areas.
The total porosity results obtained according to the PDSP model are presented in Table 6, where the commercial Core Lab values, based on rock accessibility to helium gas, are compared with the apparent total methane-accessible porosity results calculated from combined SANS and USANS data. Total porosities were also calculated using the Porod Invariant method, and the results were very similar (Appendix A.1 of the Appendix A). Since neutrons penetrate both the accessible and inaccessible pores, it is expected that the SANS–USANS total porosity (calculated from I(Q) measured for (p,S) = (0,0)) should be larger than the helium porosity. This is indeed the case for the three lower maturity samples (Table 6); the marginally opposite result for the late-mature and post-mature sample is attributed to the differences in the minimal pore sizes, which can be detected by both methods (0.3 nm for helium porosimetry versus ~3 nm for SANS–USANS).
The most striking result is the very small SANS–USANS-accessible porosity for all samples, ranging from its absence (within error) to 2.9%. This is, however, not unexpected for shale sequences; similarly, small methane-accessible porosity was recorded for Marcellus Shale samples [3]. Because the accessible porosity can potentially help in predicting the gas generation potential [1,3], uncovering the reasons for the variations in the accessible porosity in shales may improve gas recovery rates. The reason for differences in accessible porosity between the studied New Albany Shale samples is rather complex. For once, there is no clear trend in terms of TOC content, meaning the organic matter content alone is not a predictor of the accessible porosity. Secondly, differences in the mineralogical composition of the samples cannot provide an explanation either. For example, the largest accessible porosity occurs in the mid-mature McAtee-2798 sample with Ro 0.70% (sample 2, Table 6), which is clay-rich (>50%, Table 4) and has the lowest amount of quartz among the samples. In general, no correlation is revealed between the quartz-to-clay ratio and the accessible porosity for this sample suite. We suggest that the key to understanding differences in the accessible porosity is the evolution of pores in organic matter because of organic matter transformation and subsequent generation of hydrocarbons. Specifically, in the marginally mature sample 1 (Ro 0.50%), even though there is a lot of organic matter (TOC 14.4%), this OM contains few pores [48,49] and no accessible porosity. At the mid-mature stage (sample 2, Ro 0.70%), there was already massive oil generation by amorphous organic matter followed by the migration of oil. This generation of oil resulted in the formation of pores whose connectivity allowed oil migration from the New Albany Shale. It is well documented that the majority of the oil present in various formations of the Illinois Basin is sourced from the New Albany Shale Formation [18]. In sample 3 with Ro 0.84%, a large number of pores were filled with solid bitumen, and even more so in the late-mature sample 4 (Ro 1.04%), thereby reducing pore accessibility. This interpretation is consistent with previous studies of the New Albany samples and their porosity [19,49,50].
Another important observation of this study is that these accessible porosity values are also very small compared to the helium porosity measured by Core Lab, with the notable exception of the oil window sample McAtee-2798 (Ro = 0.70%; Figure 4, Table 6). This result is significant, since it demonstrates the importance of single-digit nanopores (SDN) as major host sites for methane molecules in shale; SDN are accessible to helium, although their contribution to SANS intensity is obscured by the large-Q background, meaning it is excluded both from fits to the PDSP model (Equation (1)) and from calculations of the Porod Invariant (Equation (5)). A detailed discussion of this issue for the Marcellus Shale is presented by Radlinski et al. [3].
Pressure cycling causes improvement of the accessible total porosity for most of the New Albany Shale samples, although in one case (oil window sample Gibson-3997 with Ro = 0.84%), it seems to destroy the porosity and closes the accessible pores. As mentioned above, at this maturation level, post-oil solid bitumen (still relatively reactive and ductile) is the dominant organic matter component [50], and application of pressure is likely to redistribute it, closing pathways between the pores.
The procedure used for extrapolating SSA(R) values calculated from PRINSAS to the probe diameter of 0.4 nm (close to the kinetic diameter of a methane molecule) is illustrated in Figure 5. The solid line is fitted to the large-Q experimental data (blue symbols) and then extrapolated to obtain the estimated SSA value for probe diameter D = 2R = 0.4 nm (close to the kinetic diameter of methane of 0.38 nm). The procedure is applied to the large-Q SANS data measured in a vacuum (sensitive to accessible plus inaccessible pores) and with contrast matching (sensitive to inaccessible pores only) Extrapolated D = 0.4 nm SSA values for accessible pores are obtained by subtraction.
Extrapolated SSA results for D = 0.4 nm for the New Albany Shale samples and the Mar_7084 sample are compiled in Figure 6. It is evident that for most of the samples the value of SSA (D = 0.4 nm) accessible to methane is of the order of 104 cm2/cm3—at least one order of magnitude smaller than the inaccessible SSA (with the exception of sample McAtee-2798). After pressure cycling, some calculated SSA values become very small or negative (such as sample Mar_7084); this is an artifact caused by neglecting the densification of methane confined in nanopores (further discussed in Section 4.5), as well as from the possible entrapment of molecular CD4 in kerogen, which is forced by the elevated pressure of methane [28].
Figure 7 shows the apparent fraction of accessible pores, Fa, for mid-mature sample 2 (McAtee-2798) before and after pressure cycling, calculated according to Equation (4) and plotted versus the pore diameter (“apparent” means that data pertain to the in-bedding pore diameter only). It is evident that for this sample, pressure cycling mostly affects pores in the size interval range of 20–600 nm. As shown in the Appendix for the remaining shale samples, the functional dependence of Fa(r) is shale-specific; it also depends on the details of the pressure cycling conditions (as demonstrated by Blach et al. [12] for the Mar_7084 sample). Pressure cycling in general increases the number of accessible nanopores in the range of 20–500 nm. The ability to provide insight into the evolution of the accessible and inaccessible nanoporosity in shales subjected to external stress constitutes a unique feature of the contrast matching SANS–USANS technique.
A brief comparison of specific surface area values obtained from SANS to those generated by low-pressure N2 and CO2 adsorption for two samples (Table 7) corroborates the existence of accessible single-digit nanopores. We note that differences in the SANS and gas adsorption results reflect different sample preparation procedures and different minimal pore sizes accessible to different methods, as discussed in [3].

4.5. Condensation of Methane in the Nanopores

As discussed in Section 3.1, contrast matching should result in decreased SANS intensity, I(Q), for every Q-value. In experimental practice, pressure inside the pore space (and gas density) is controlled using an external source of pressurized CD4. At external pressure of methane set at the contrast-matched ({CM}) value, the internal pressure remains unchanged for large accessible pores; however, the density of gas confined in small nanopores may increase above the {CM} value due to the interaction of CD4 molecules with pore walls (capillary condensation). This interaction becomes increasingly significant as the pore size decreases, which causes a gradual increase in the SLD value of confined CD4 in small nanopores. Consequently, the contrast value, (Δρ)2 = (ρm − ρp)2, increases for increased Q-values, i.e., decreasing pore diameter, corresponding to the pore diameter (D ≈ 5/Q; Equation (3)), until a crossover of the ambient and contrast-matched SANS curves takes place for pores with diameters for which ρp = 2ρm. Detailed calculations based on Equation (1) are presented by Radlinski et al. [3].
The crossover is widely observed for tight pores, including sample Mar_7084 [3] and all New Albany Shale samples studied here. As an example, Figure 8 shows details (large-Q region) of the contrast-matched and ambient SANS data acquired before and after pressure cycling for sample McAtee-2798. Analogous plots for the remaining samples are shown in the Appendix.
The Q-value at the crossover point (Q0, indicated with a vertical line in Figure 8) marks the pore size, for which the density of confined CD4 is two times larger than the external density (here 0.34 g/cm3, for p = 500 bar at 23 °C). The dominant SANS intensity at Q0 is contributed by scattering from pores with diameter D ≈ 5/Q0 (Equation (3)); for yet smaller pores the density of confined CD4 increases above 0.68 g/cm3, meaning for Q > Q0, I(Q; {CM}) becomes larger than I(Q; ambient). The very existence of this effect for all NAS samples (and the Marcellus sample) provides experimental evidence that small nanopores are penetrated by CD4 for pore diameters of at least 1 nm across a wide range of maturity, in agreement with previous observations in shale sequences [51,52]. For all except the lowest maturity samples, the crossover occurs in a relatively narrow range of pore diameters (7–14 nm), and after pressure cycling it shifts in a sample-specific way (Figure 9). This indicates that both the nanoscale geometry and distribution of methane adsorbed in nanopores are affected by pressure cycling.
If the fraction of accessible pores in the condensation region, Fa(D), were known, one could use the measured SANS intensity to quantify the amount of CD4 confined in the nanopores (assuming a particular pore shape). However, the functional form of Fa(D) can be reliably determined only for D ≥ 20 nm (Figure 7); in addition, it has been demonstrated that exposure to pressurized CD4 (at p ≥ ~210 bar) may result in a temporary or permanent penetration of the bitumen by methane [3,22]. This would violate the assumption about the stability of the pore space geometry subjected to gas pressure and render Equation (4) inaccurate.
In the preceding discussion, it has been implicitly assumed that the large-Q scattering intensity, including the large-Q background (indicated in Figure 8 with arrows), is dominated by scattering from nanopores [3]. Another possible contribution to the large-Q background, the incoherent scattering from hydrogen nuclei bound in the organic matter, was estimated using a proxy (0.002 ± 0.0005 [cm−1/(wt% of TOC)]) that was previously determined for organic matter in coals of different ranks [42]. The data presented in Table 5 for New Albany Shales show that the estimated contribution from incoherent scattering is about 0.007 to 0.032 cm−1, an order of magnitude less than the measured large-Q SANS background.

5. Conclusions

We have measured the accessible and inaccessible porosity for methane and the pore size distribution in a maturity series of five Upper Devonian New Albany Shale Formation samples, from early-mature (Ro = 0.50%) to post-mature (Ro = 1.40%), before and after the hydrostatic (in vacuum and at 500 bar) and uniaxial (0 to ca. 350 bar) pressure cycling. Measurements were performed on rock slices cut in-bedding and the results pertain to the apparent micro- and nanostructural parameters measured in the in-bedding-plane. The amplitude and duration of pressure cycles were similar to those used during hydraulic fracturing. The results were compared with similar data obtained previously for a post-mature Marcellus Shale sample (Ro = 2.50%):
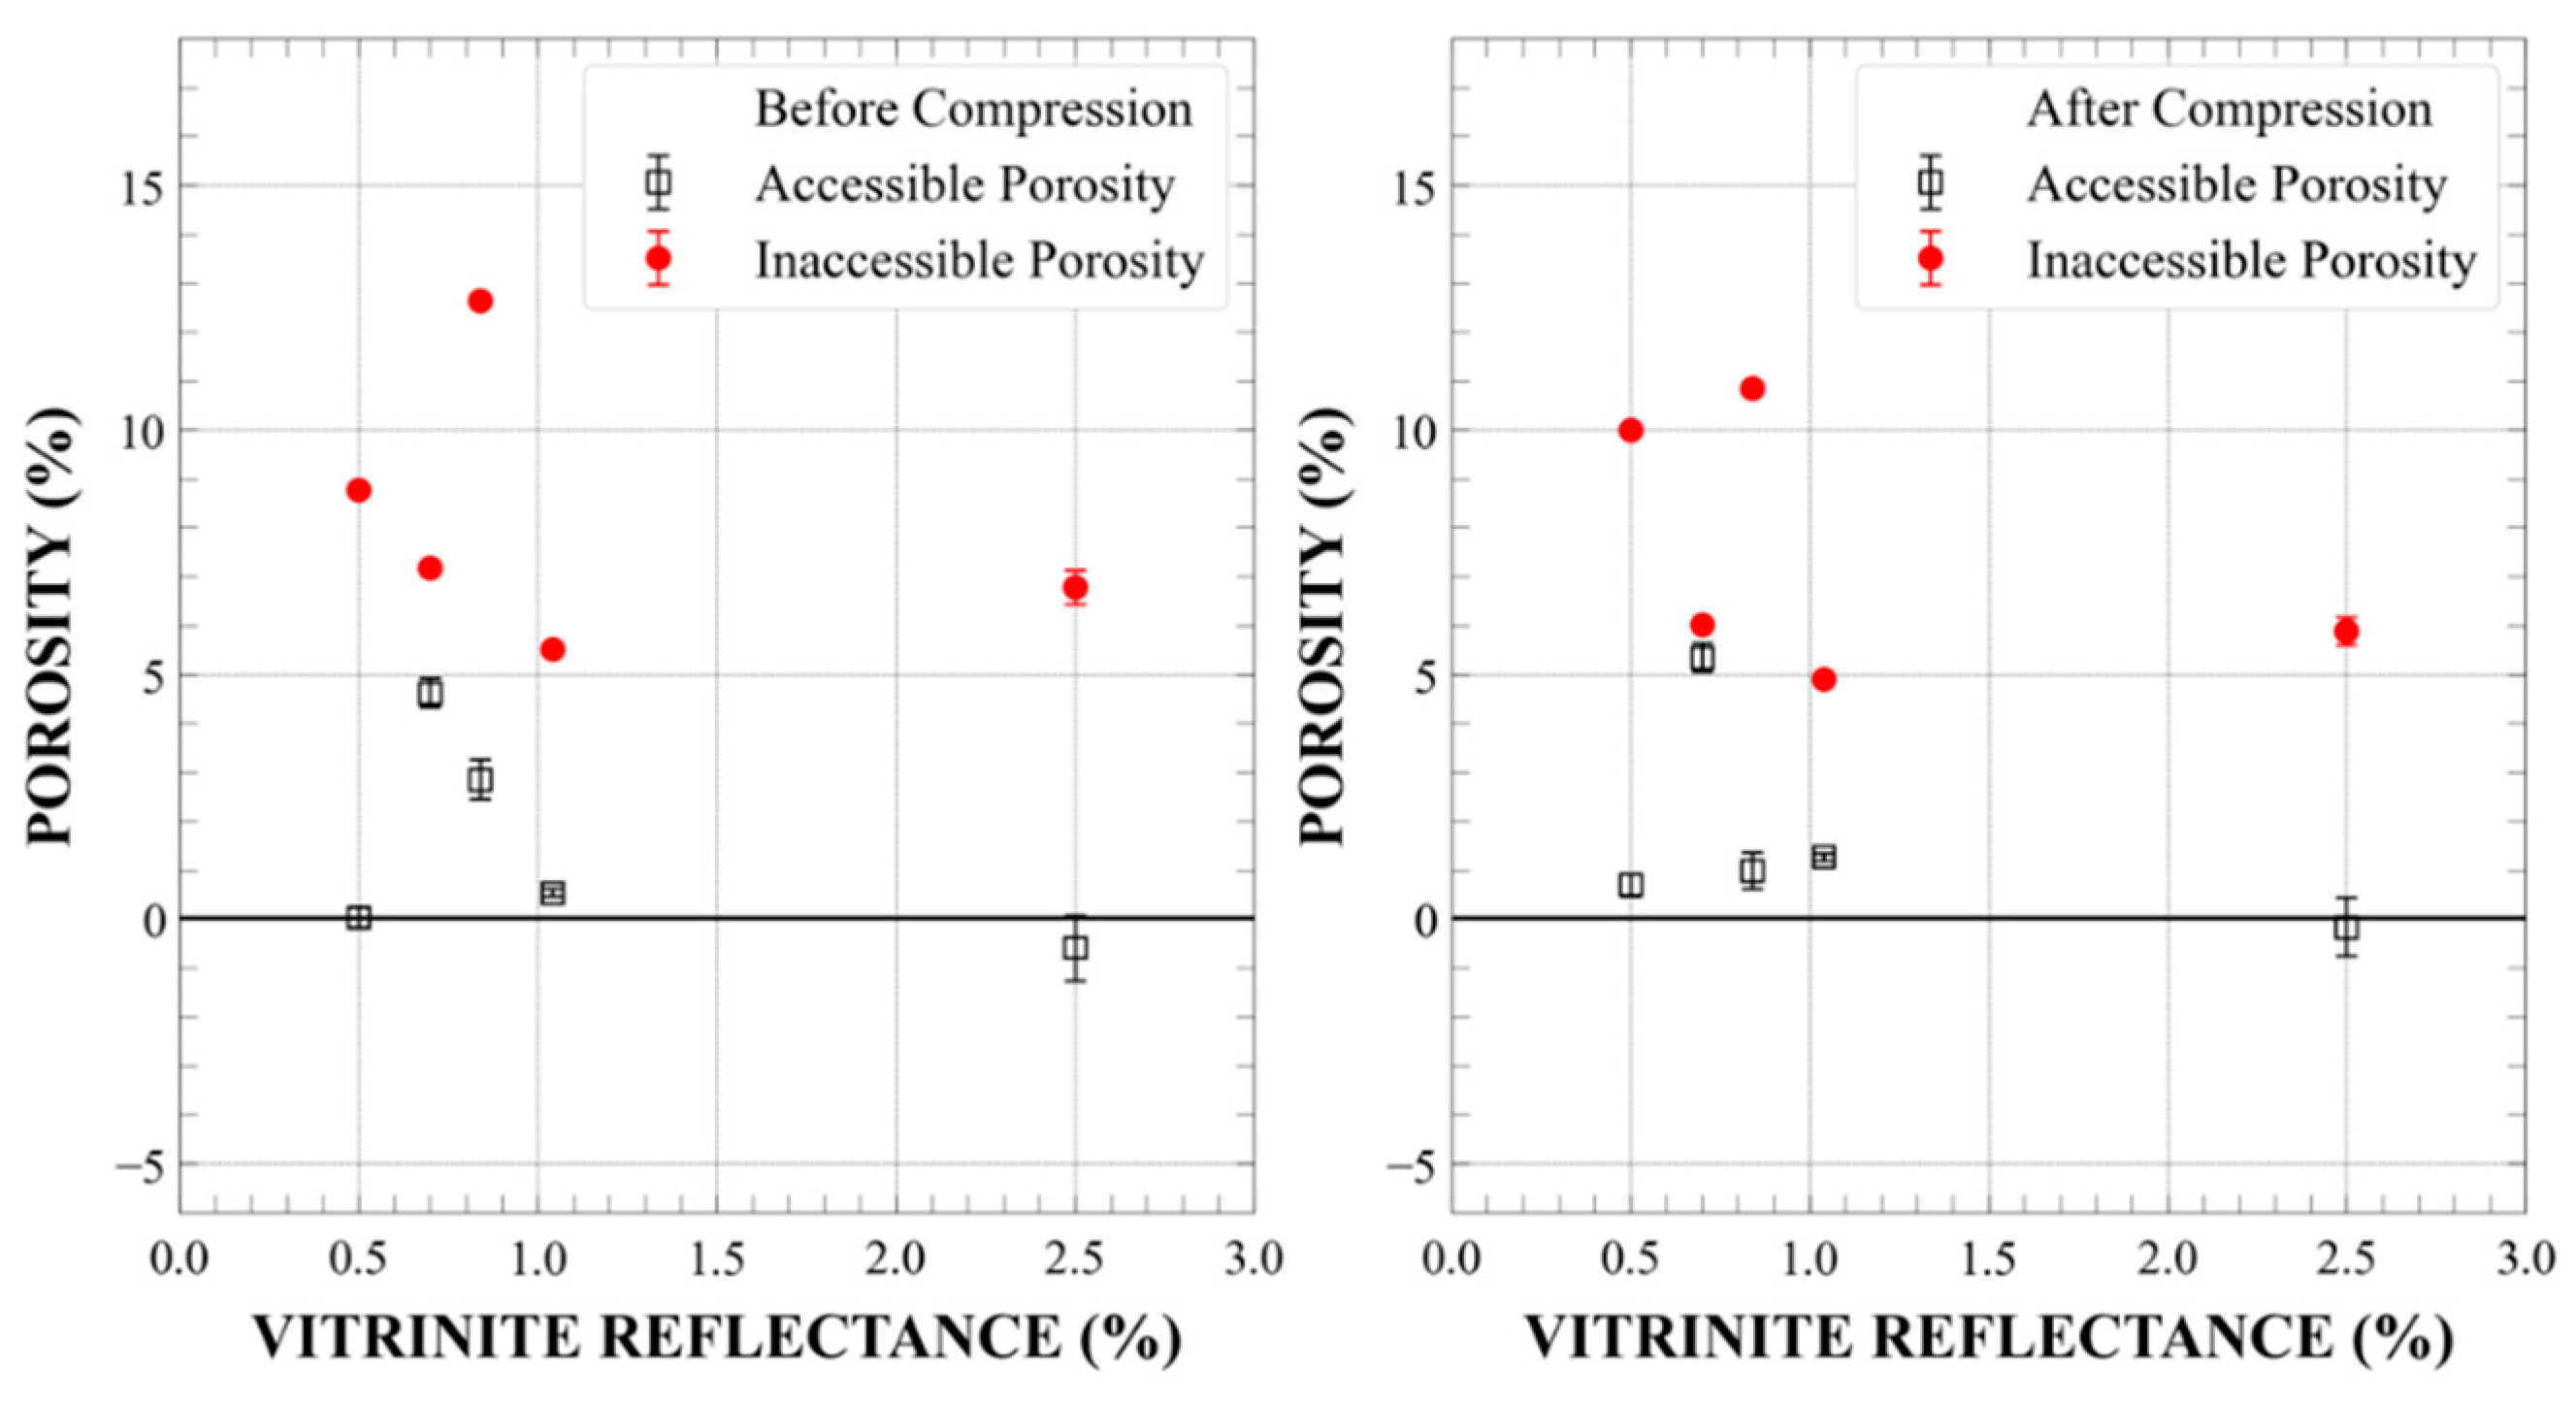
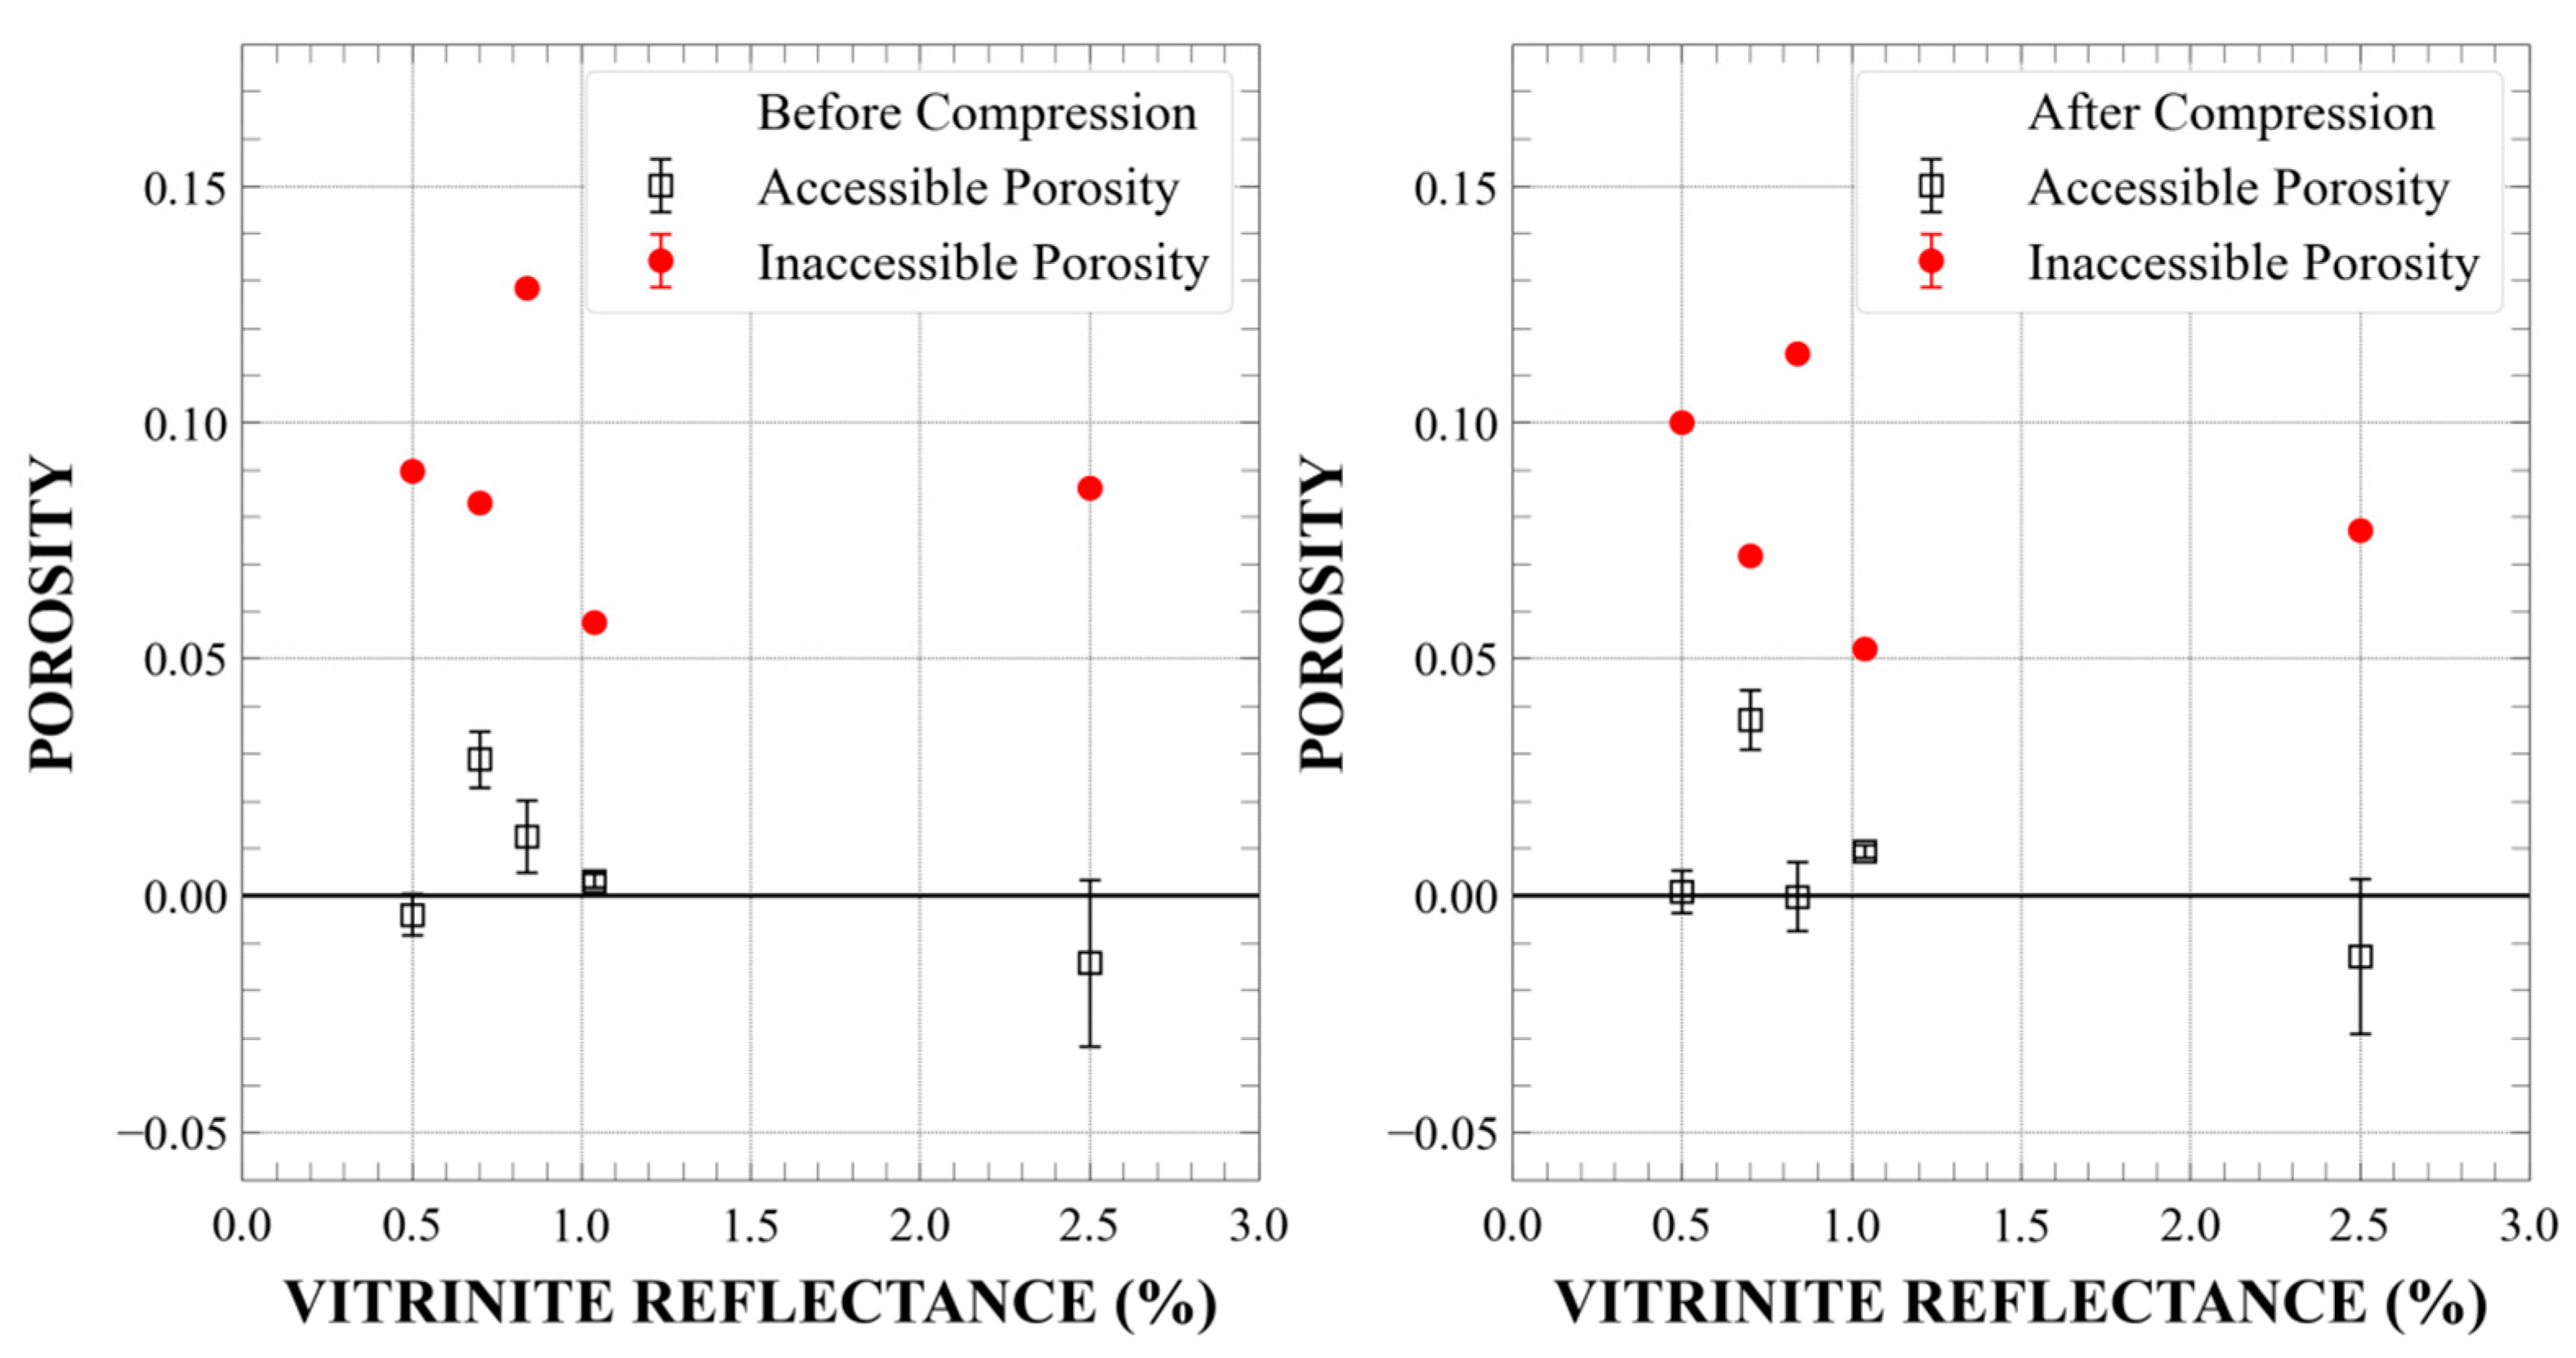
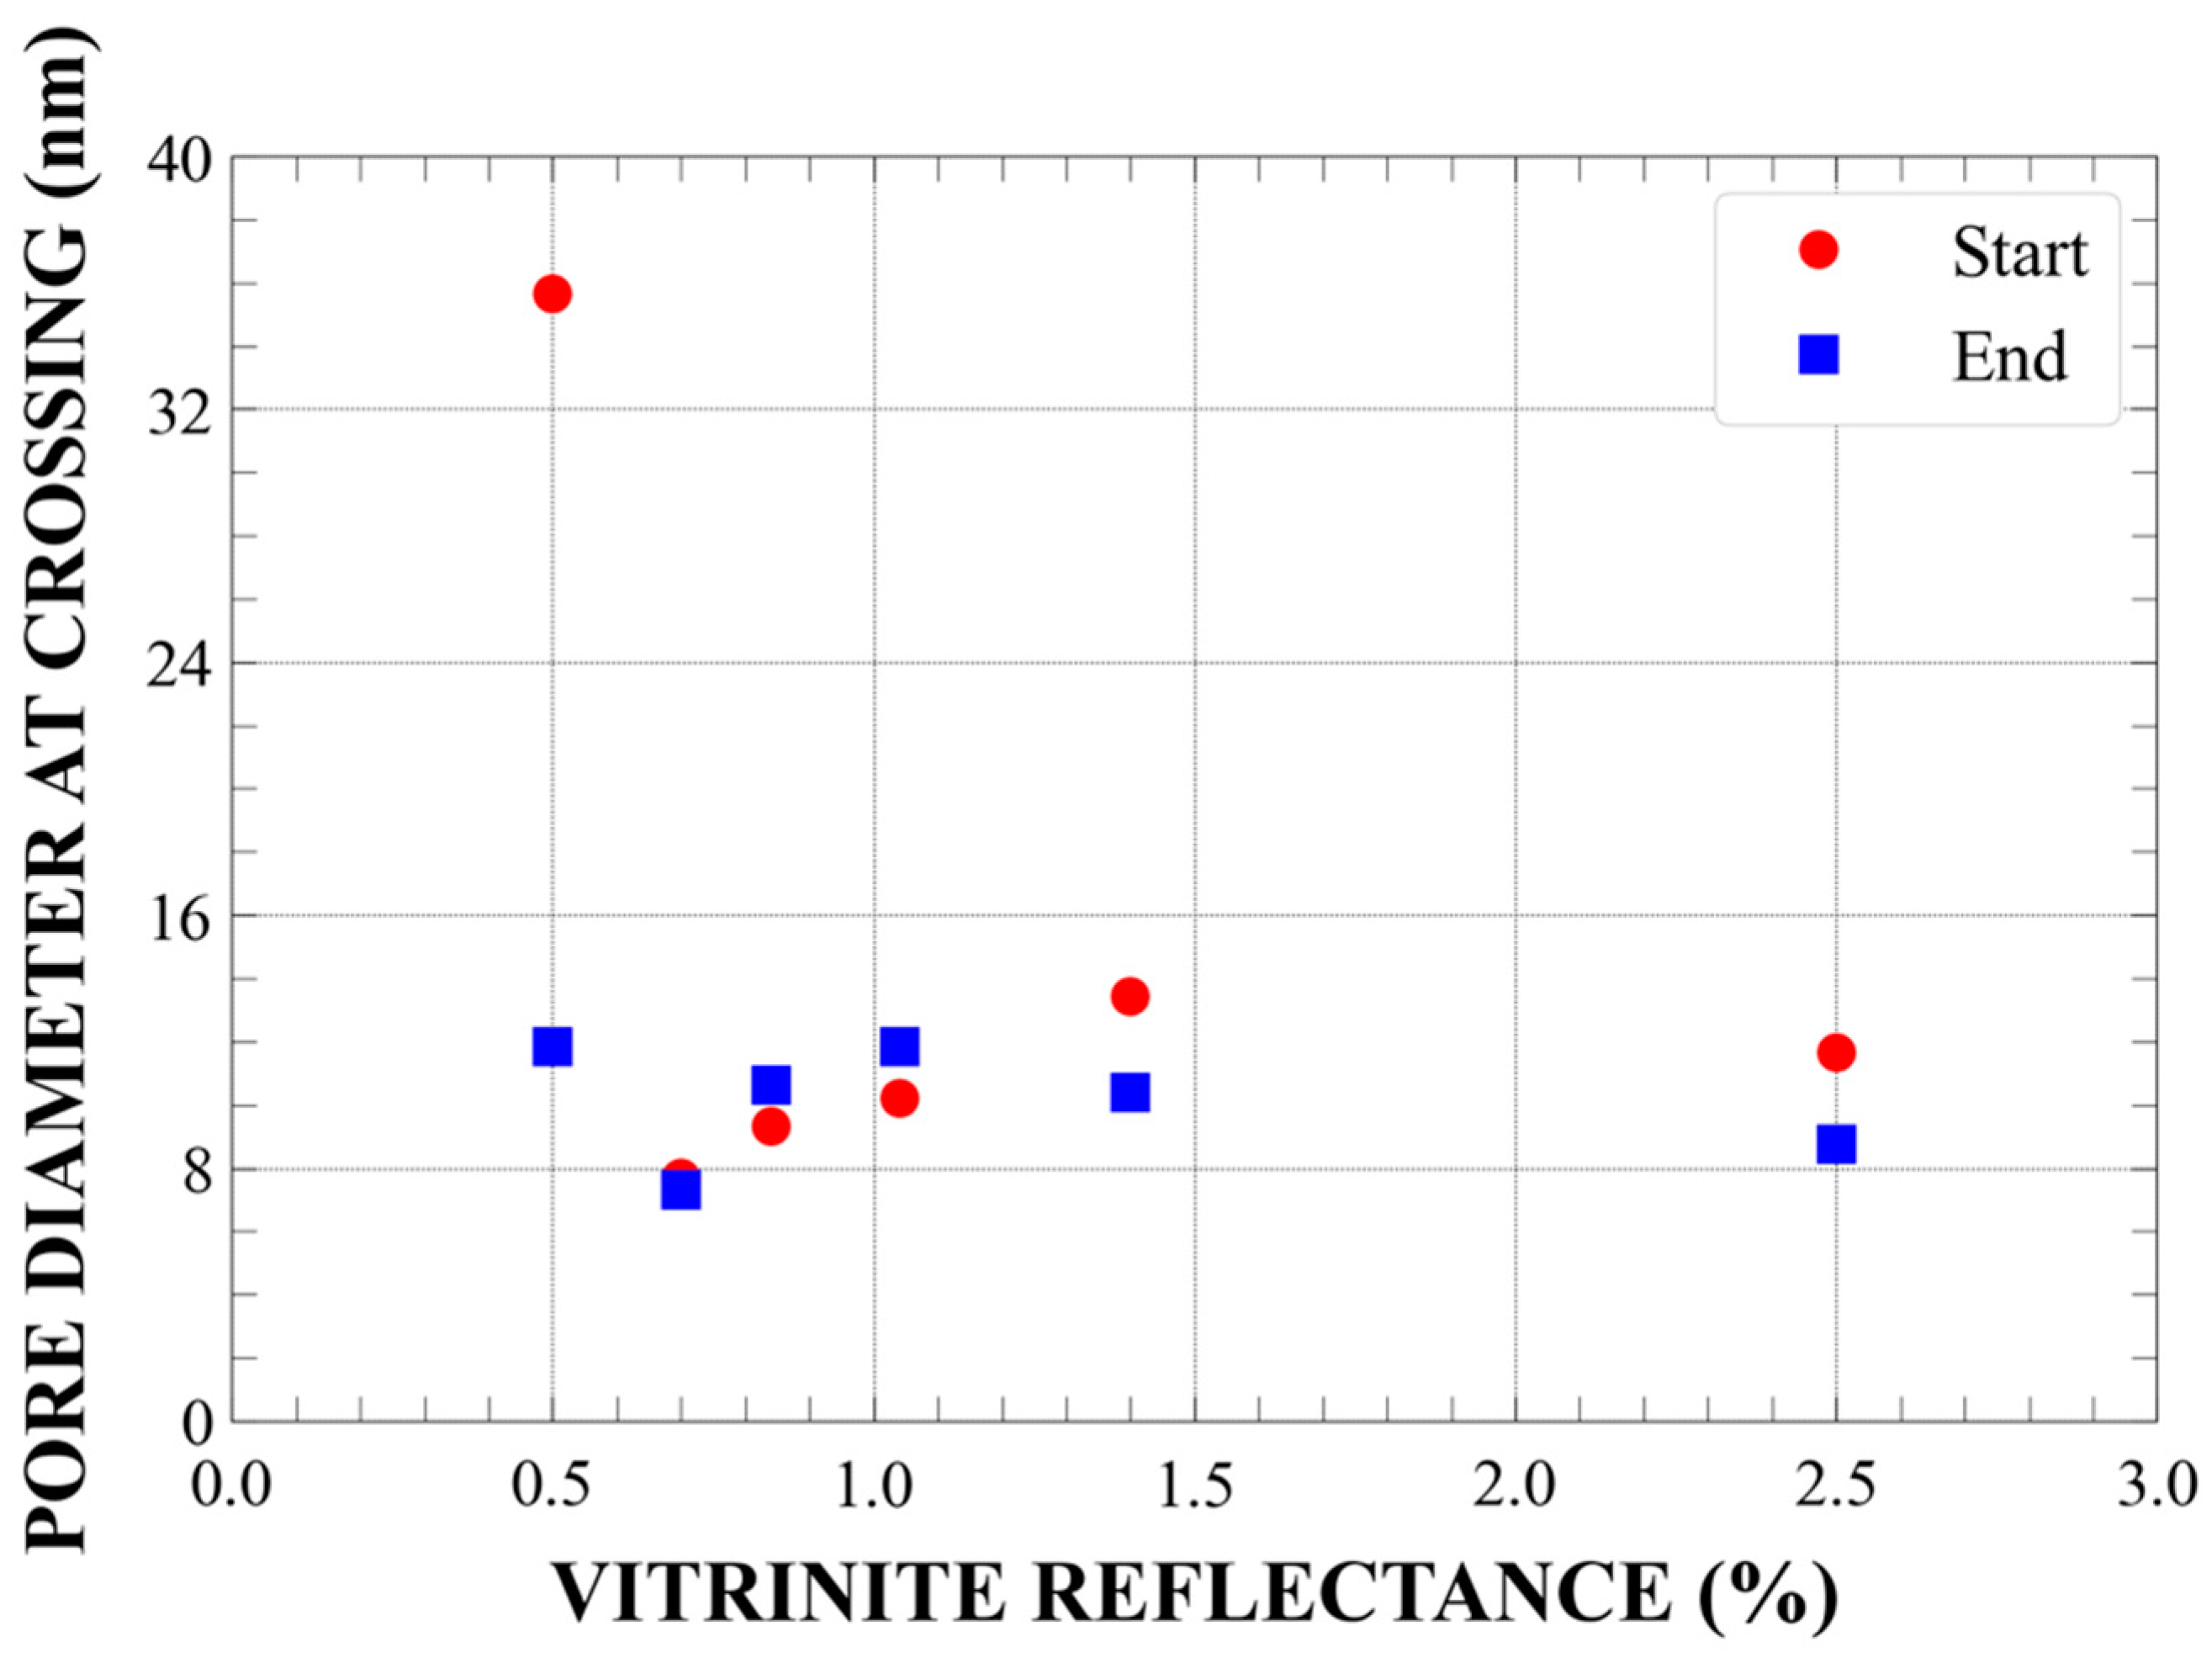
  • The accessible porosity for pores in the size range of 4 nm ≤ D ≤ 20 μm was generally small, ranging from nearly zero to 2.9 ± 0.6%, corresponding to a range from very little to 26% of the total porosity. The lowest accessible porosity values were recorded in the marginally mature (Ro = 0.50%) and late-mature sample (Ro = 1.04%), whereas the largest accessible porosity occurred in the mid-mature sample (Ro = 0.70%). Those differences can be explained by porosity changes in organic matter in response to organic matter transformation and hydrocarbon generation, further emphasizing the prominent role of the maturity-related evolution of organic matter in OM-rich shale sequences;
  • Pressure cycling modifies the distribution of accessible pores; in effect, the total accessible porosity may increase or decrease. Although more samples of variable maturity need to be tested, we suggest that the effect of pressure on the accessible porosity in OM-rich shales is controlled by the maturity of the organic matter, as observed for the samples studied here. The methodology used in this work enables predictive laboratory-scale measurements of the influence of hydrostatic and uniaxial stress (of a magnitude similar to that used for production well management) on the pore accessibility to gas at the nanoscale;
  • For all samples, methane condenses in nanopores, which are generally smaller than 20 nm, while condensed methane penetrates single-digit nanopores down to a diameter of about 1 nm (limit of measurement). Condensation of methane confined in nanopores is an increasingly recognized phenomenon in shales, which has the potential to unravel the mechanisms that inhibit the mobilization of methane during gas production.

Author Contributions

Conceptualization, A.P.R. and M.M.; formal analysis, T.B., A.P.R., P.V., Y.J. and L.d.C.; funding acquisition, M.M. and K.R.-L.; investigation, T.B., P.V., Y.J., E.P.G. and L.d.C.; methodology, T.B. and A.P.R.; project administration, M.M.; writing—original draft, A.P.R.; writing—review and editing, T.B., P.V., Y.J., L.d.C., E.P.G., K.R.-L. and M.M. All authors have read and agreed to the published version of the manuscript.

Funding

The research was funded by the U.S. Department of Energy, Office of Science, Office of Basic Energy Sciences, Chemical Sciences, Geosciences, and Biosciences Division under Award Number DE-SC0006978. This work was also supported by the Australian Research Council (ARC DP170104550, DP170104557, DP200102517, LP170100233, and LE200100209).

Institutional Review Board Statement

Not applicable.

Informed Consent Statement

Not applicable.

Data Availability Statement

Supporting data can be obtained from the first author upon request.

Acknowledgments

This material was based upon work supported by the U.S. Department of Energy, Office of Science, Office of Basic Energy Sciences, Chemical Sciences, Geosciences, and Biosciences Division under Award Number DE-SC0006978. Furthermore, this work was supported by the Australian Research Council (ARC LE200100209, DP170104550, DP170104557, DP200102517, LP170100233) and the strategic SPF01 fund of UNSW, Sydney. We also acknowledge support by the Australian Nuclear Science and Technology Organization in providing the SANS and USANS neutron research facilities used in this work under proposal numbers P8360 and P8925. We thank the editors and three anonymous reviewers for their insightful comments and suggestions.

Conflicts of Interest

The authors declare no conflict of interest.

Appendix A

Appendix A.1,Appendix A.2,Appendix A.3,Appendix A.4,Appendix A.5,Appendix A.6 contain the results of the analysis of combined SANS and USANS data acquired for five Upper Devonian New Albany Shale Formation samples and the Marcellus-7084 sample, measured in a vacuum and in contrast-matched conditions (at 500 bar of CD4) before and after pressure cycling. Appendix A.7 contains porosity-related data obtained using the Porod Invariant method and related plots, as well as combined plots containing all the scattering profiles acquired under ambient and contrast-matched conditions.

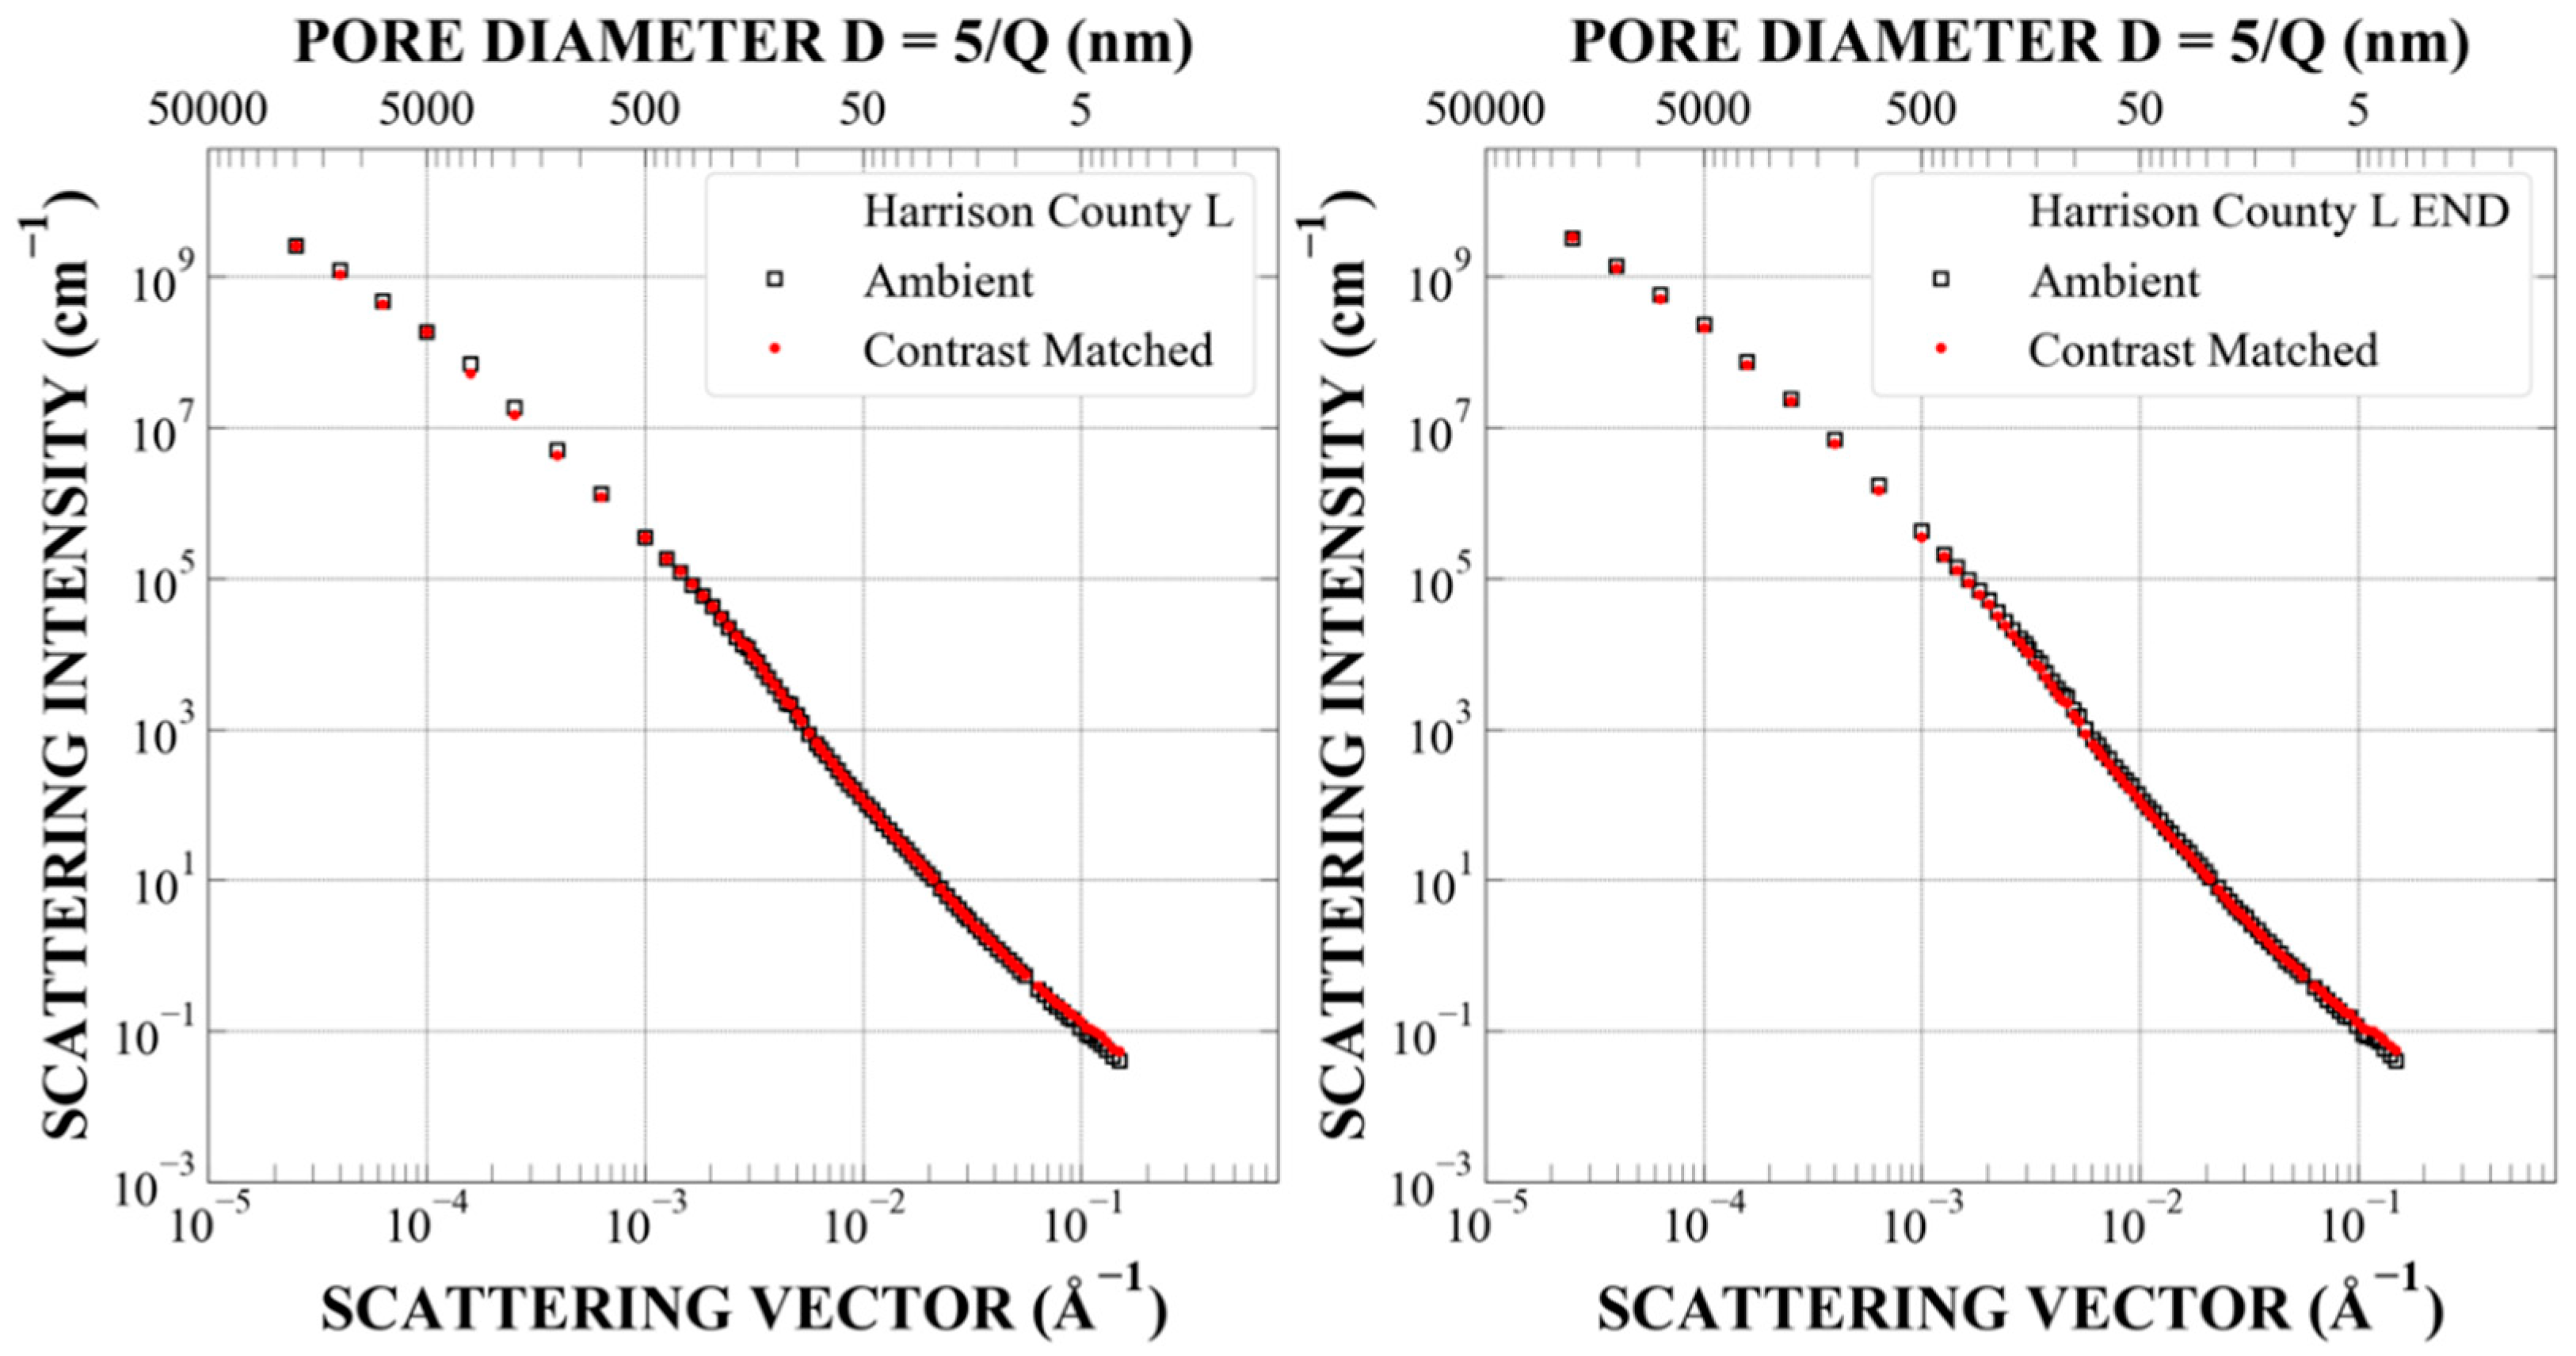
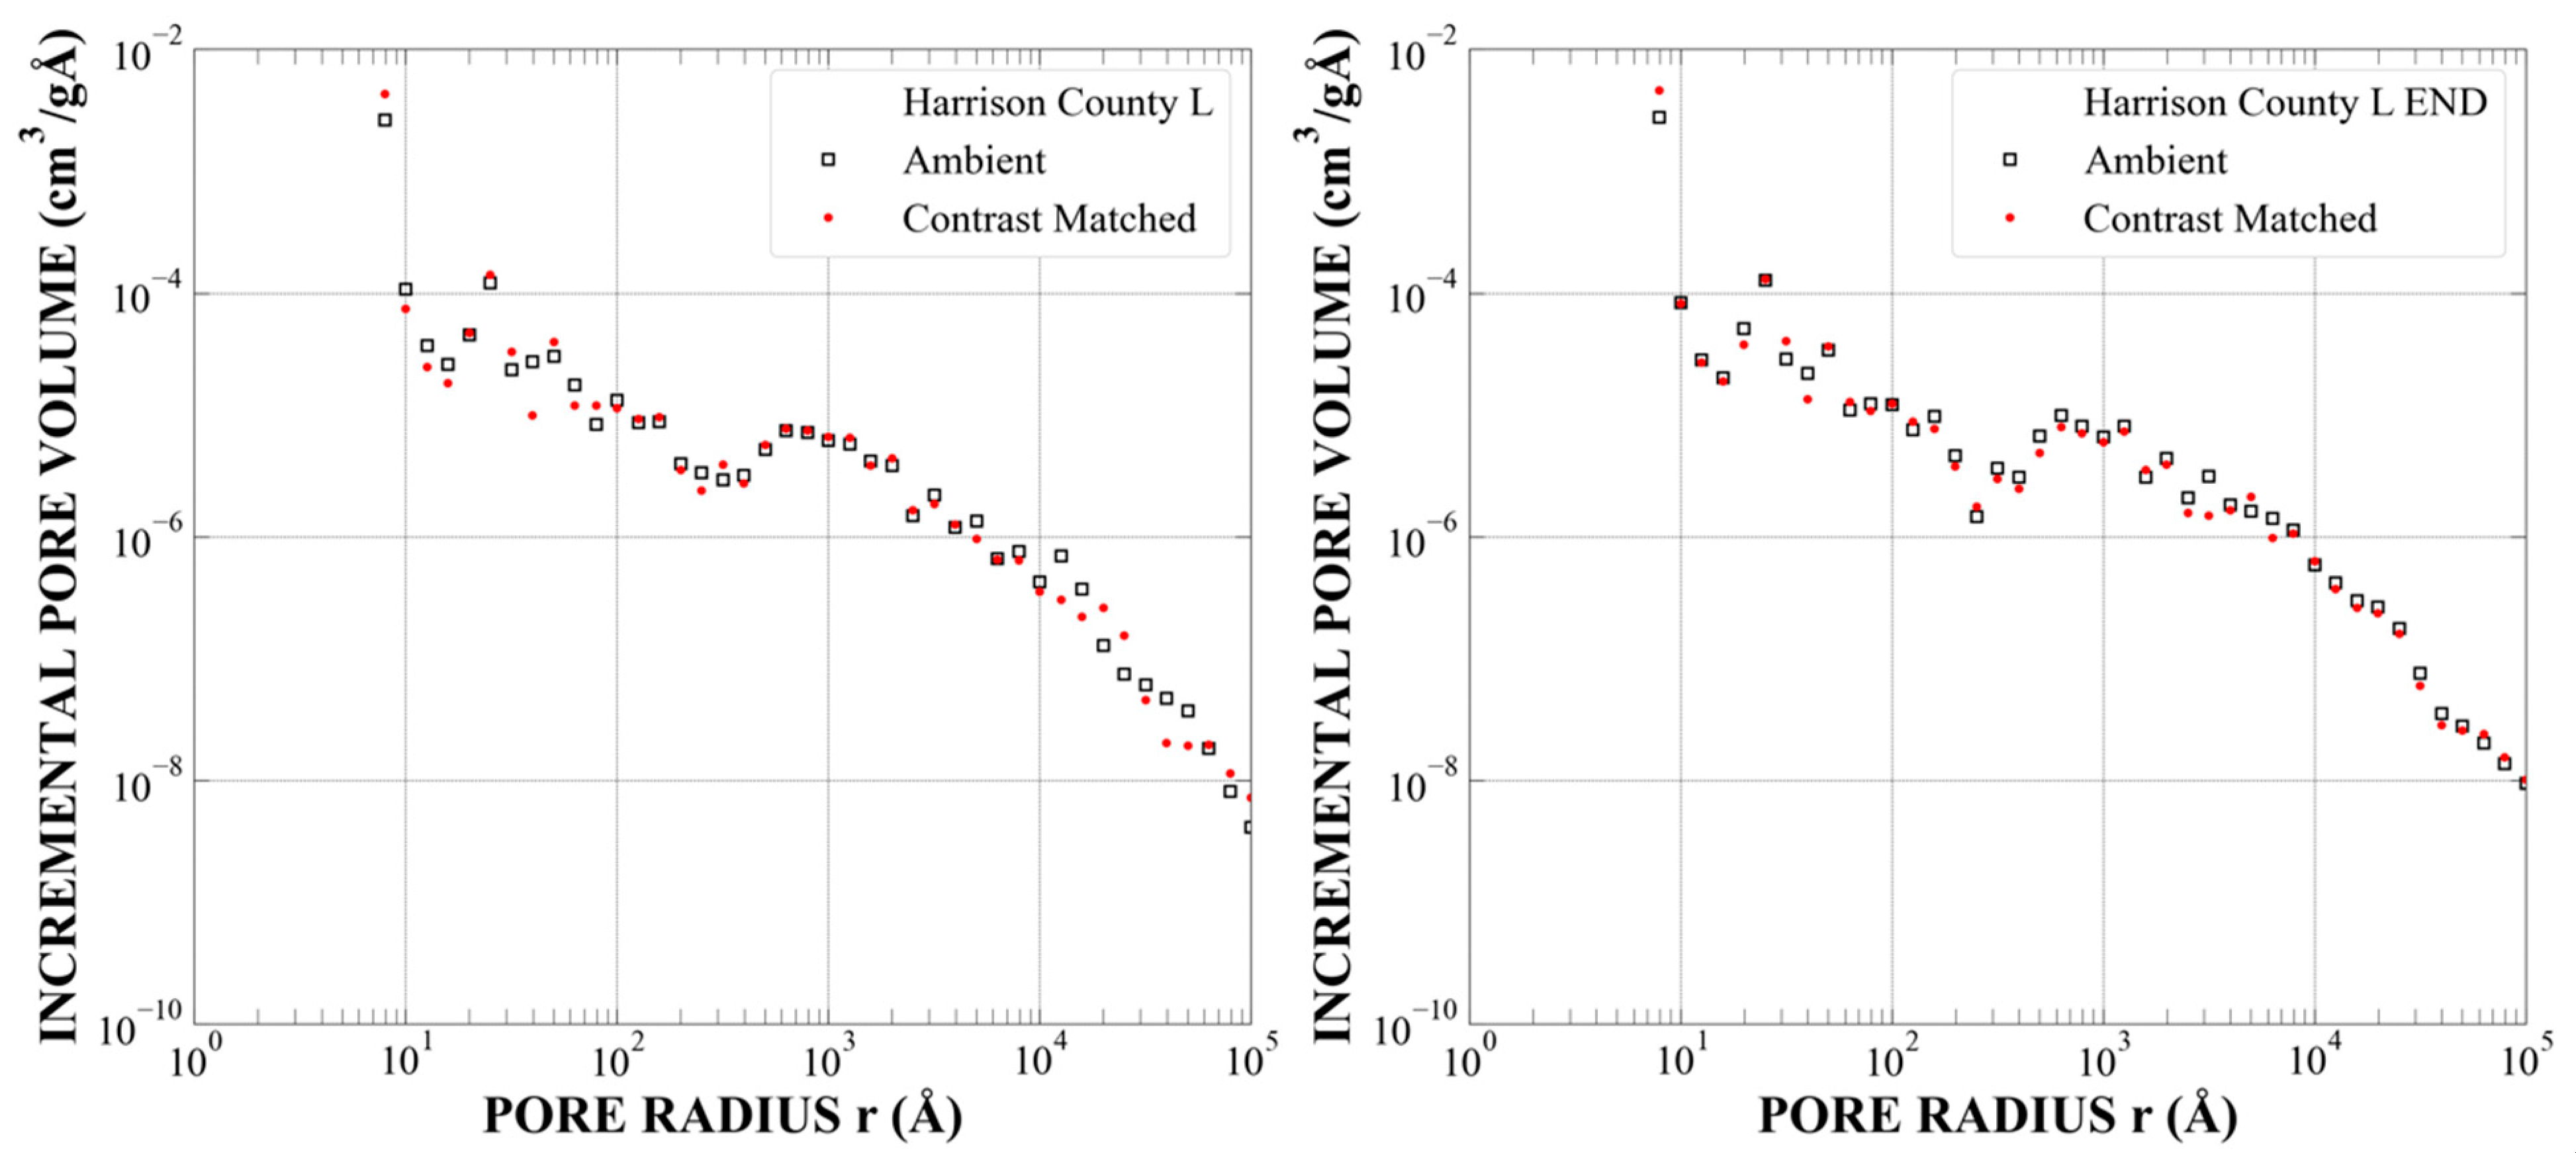
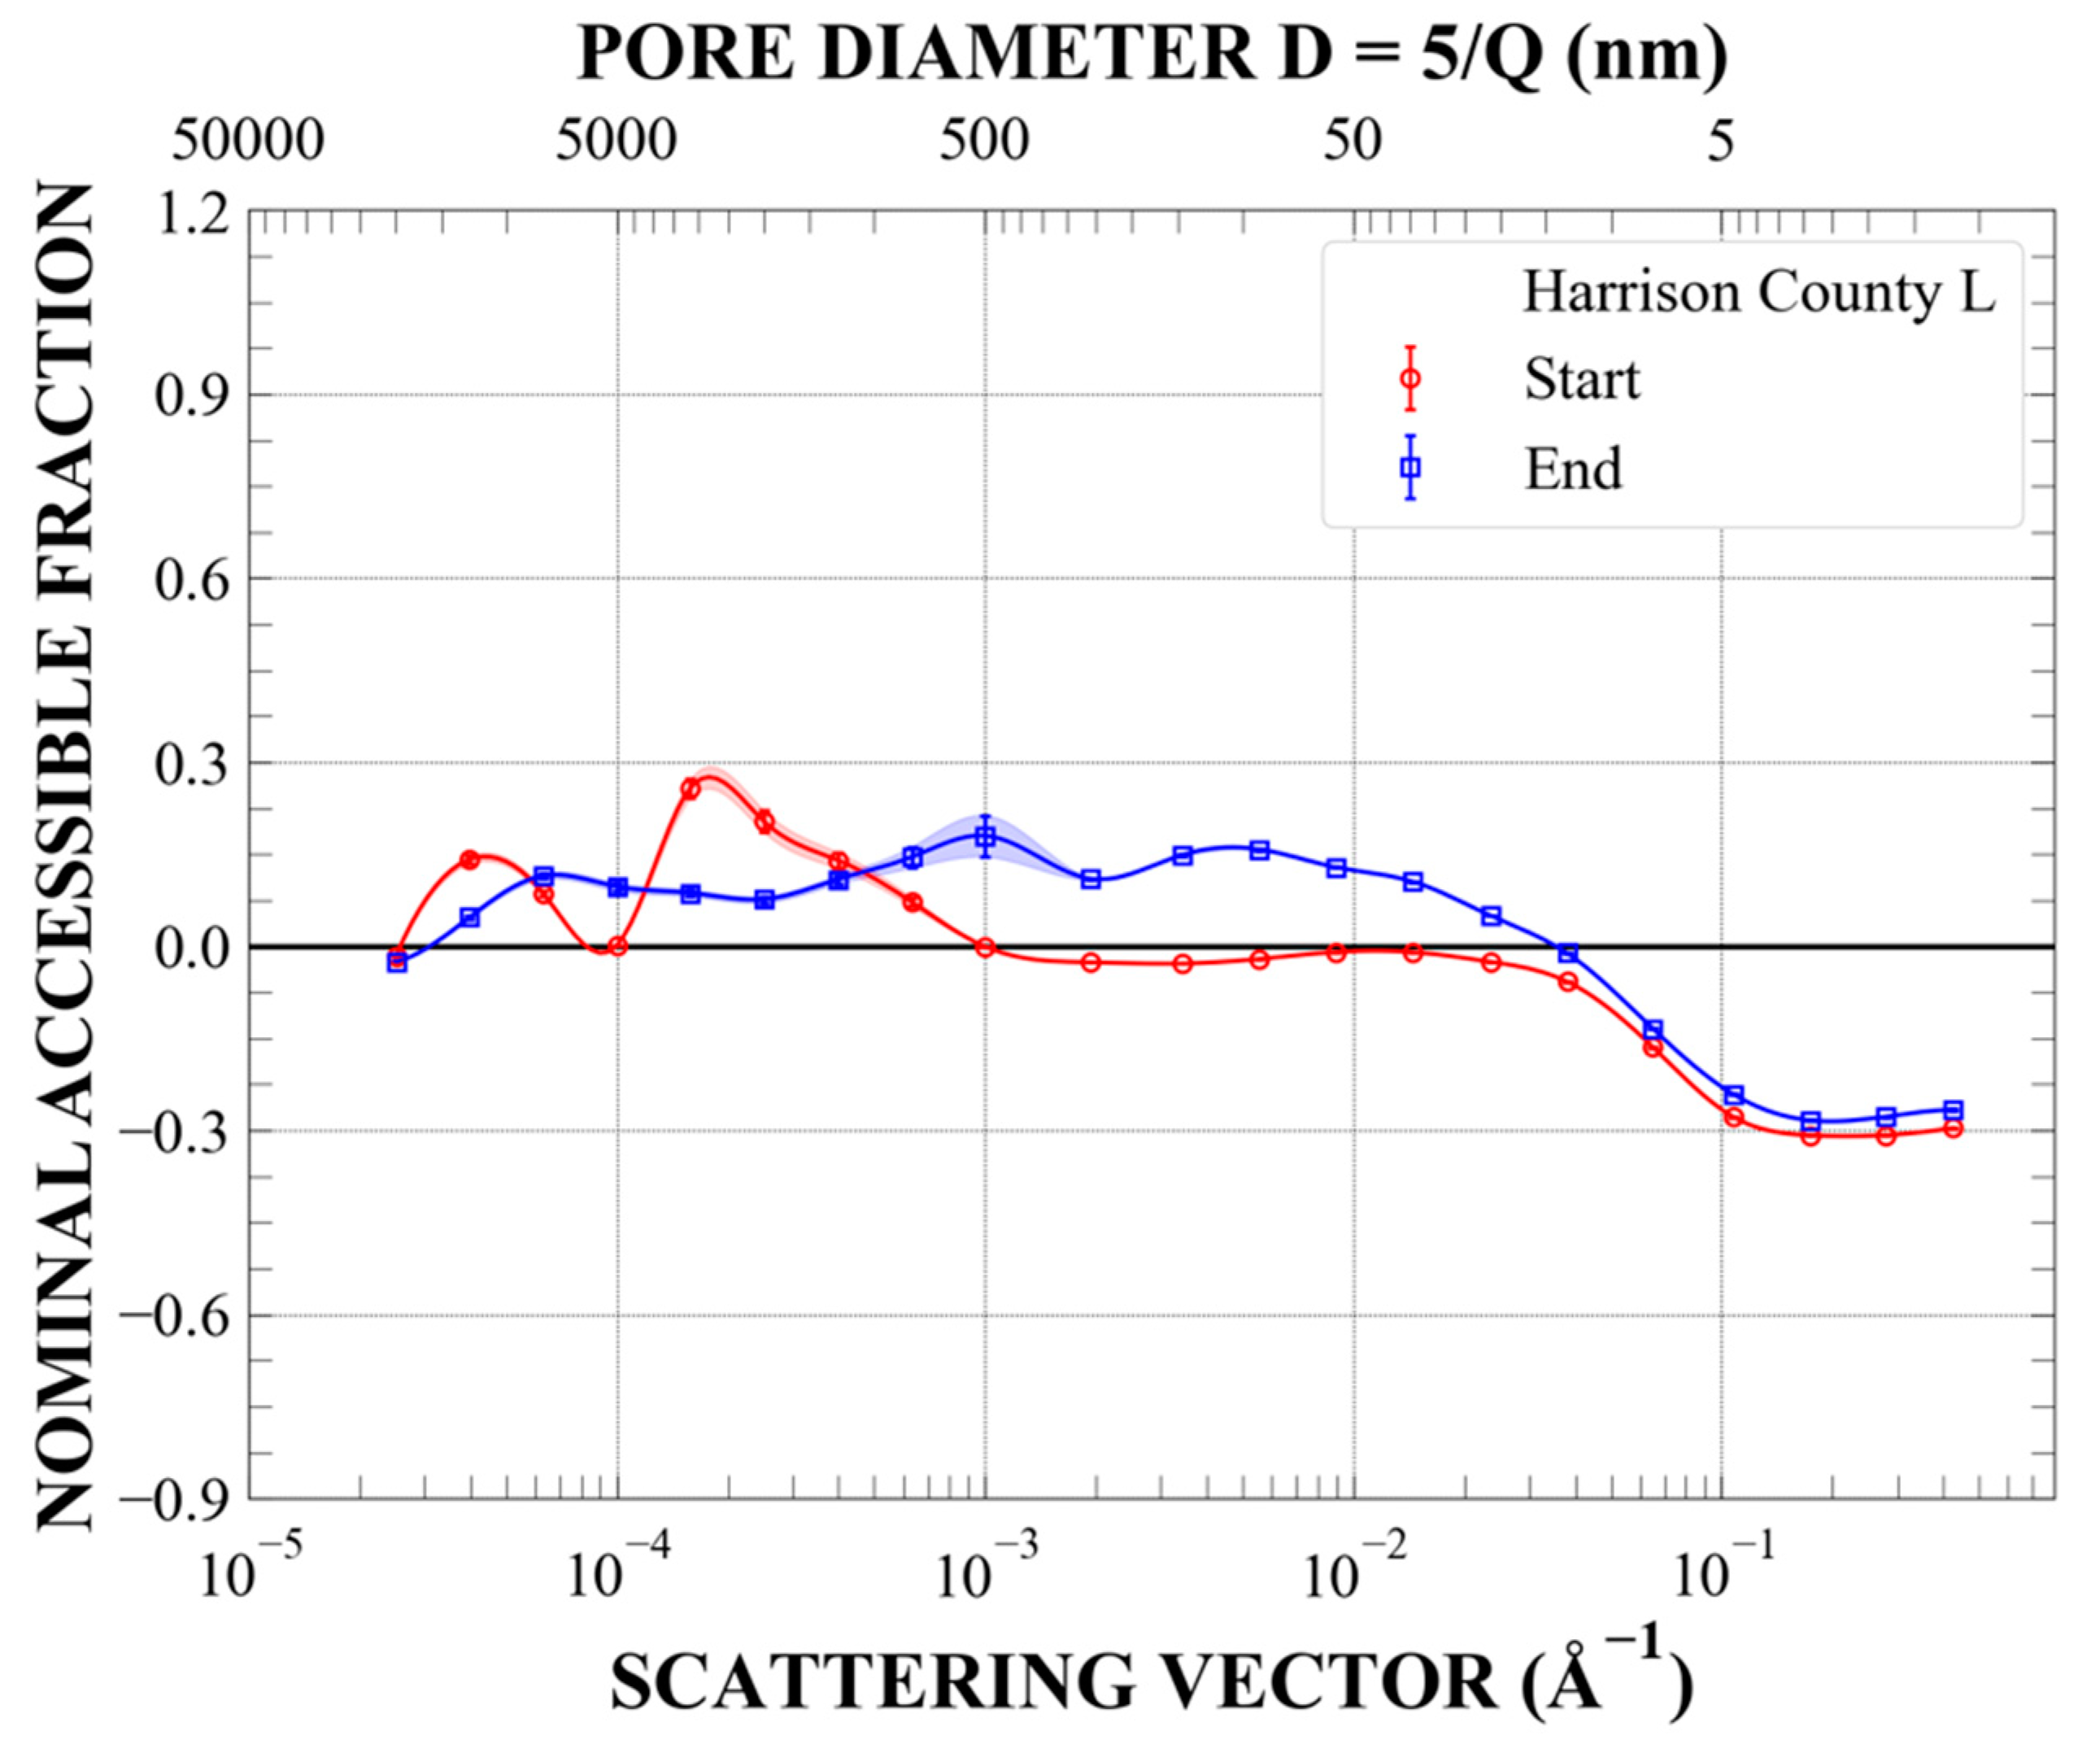
Appendix A.1. Sample SDH-308 (Harrison County), Sub-Samples L4 and L2, Depth 247 Feet, Ro = 0.50%, TOC = 14.4%, Early-Mature

Figure A1. Combined absolutely calibrated SANS and USANS intensity measured in vacuum (ambient, open black squares) and at contrast-matched conditions (hydrostatic pressure of 500 bar of CD4, full red circles): (left panel) as-obtained samples; (right panel) after pressure cycling up to S = 28 bar (2.8 MPa). The pressure cycles (p,S) were as follows: (0,0); (500,0); (500,7.5); (0,7.5); (0,18.5); (500,18.5); (500,28); (0,28); (0,0); (500,0).
Energies 14 08438 g0a1
Figure A2. Probability density of the pore radius distribution (f(r)) and the specific surface area of the rock–pore space interface versus probe size (SSA(R)), calculated using the Polydisperse Spheres model implemented in the PRINSAS software. Ambient—results for accessible plus inaccessible pores; contrast-matched—results for inaccessible pores only. (left panel)—before pressure cycling; (right panel)—after pressure cycling.
Energies 14 08438 g0a2
Figure A3. Incremental pore volume distribution (dV/dr per gram of rock), calculated using the Polydisperse Spheres model implemented in the PRINSAS software. Ambient—results for accessible plus inaccessible pores; contrast-matched—results for inaccessible pores only. (left panel)—before pressure cycling; (right panel)—after pressure cycling.
Energies 14 08438 g0a3
Figure A4. Fractions of all pores accessible to penetrating deuterated methane for various nominal pore diameters before (red circles) and after pressure cycling (blue circles), calculated using the Polydisperse Spheres model implemented in the PRINSAS software.
Energies 14 08438 g0a4
Figure A5. Details of the SANS ambient and contrast-matched data in the large-Q region before (left panel) and after pressure cycling (right panel).
Energies 14 08438 g0a5

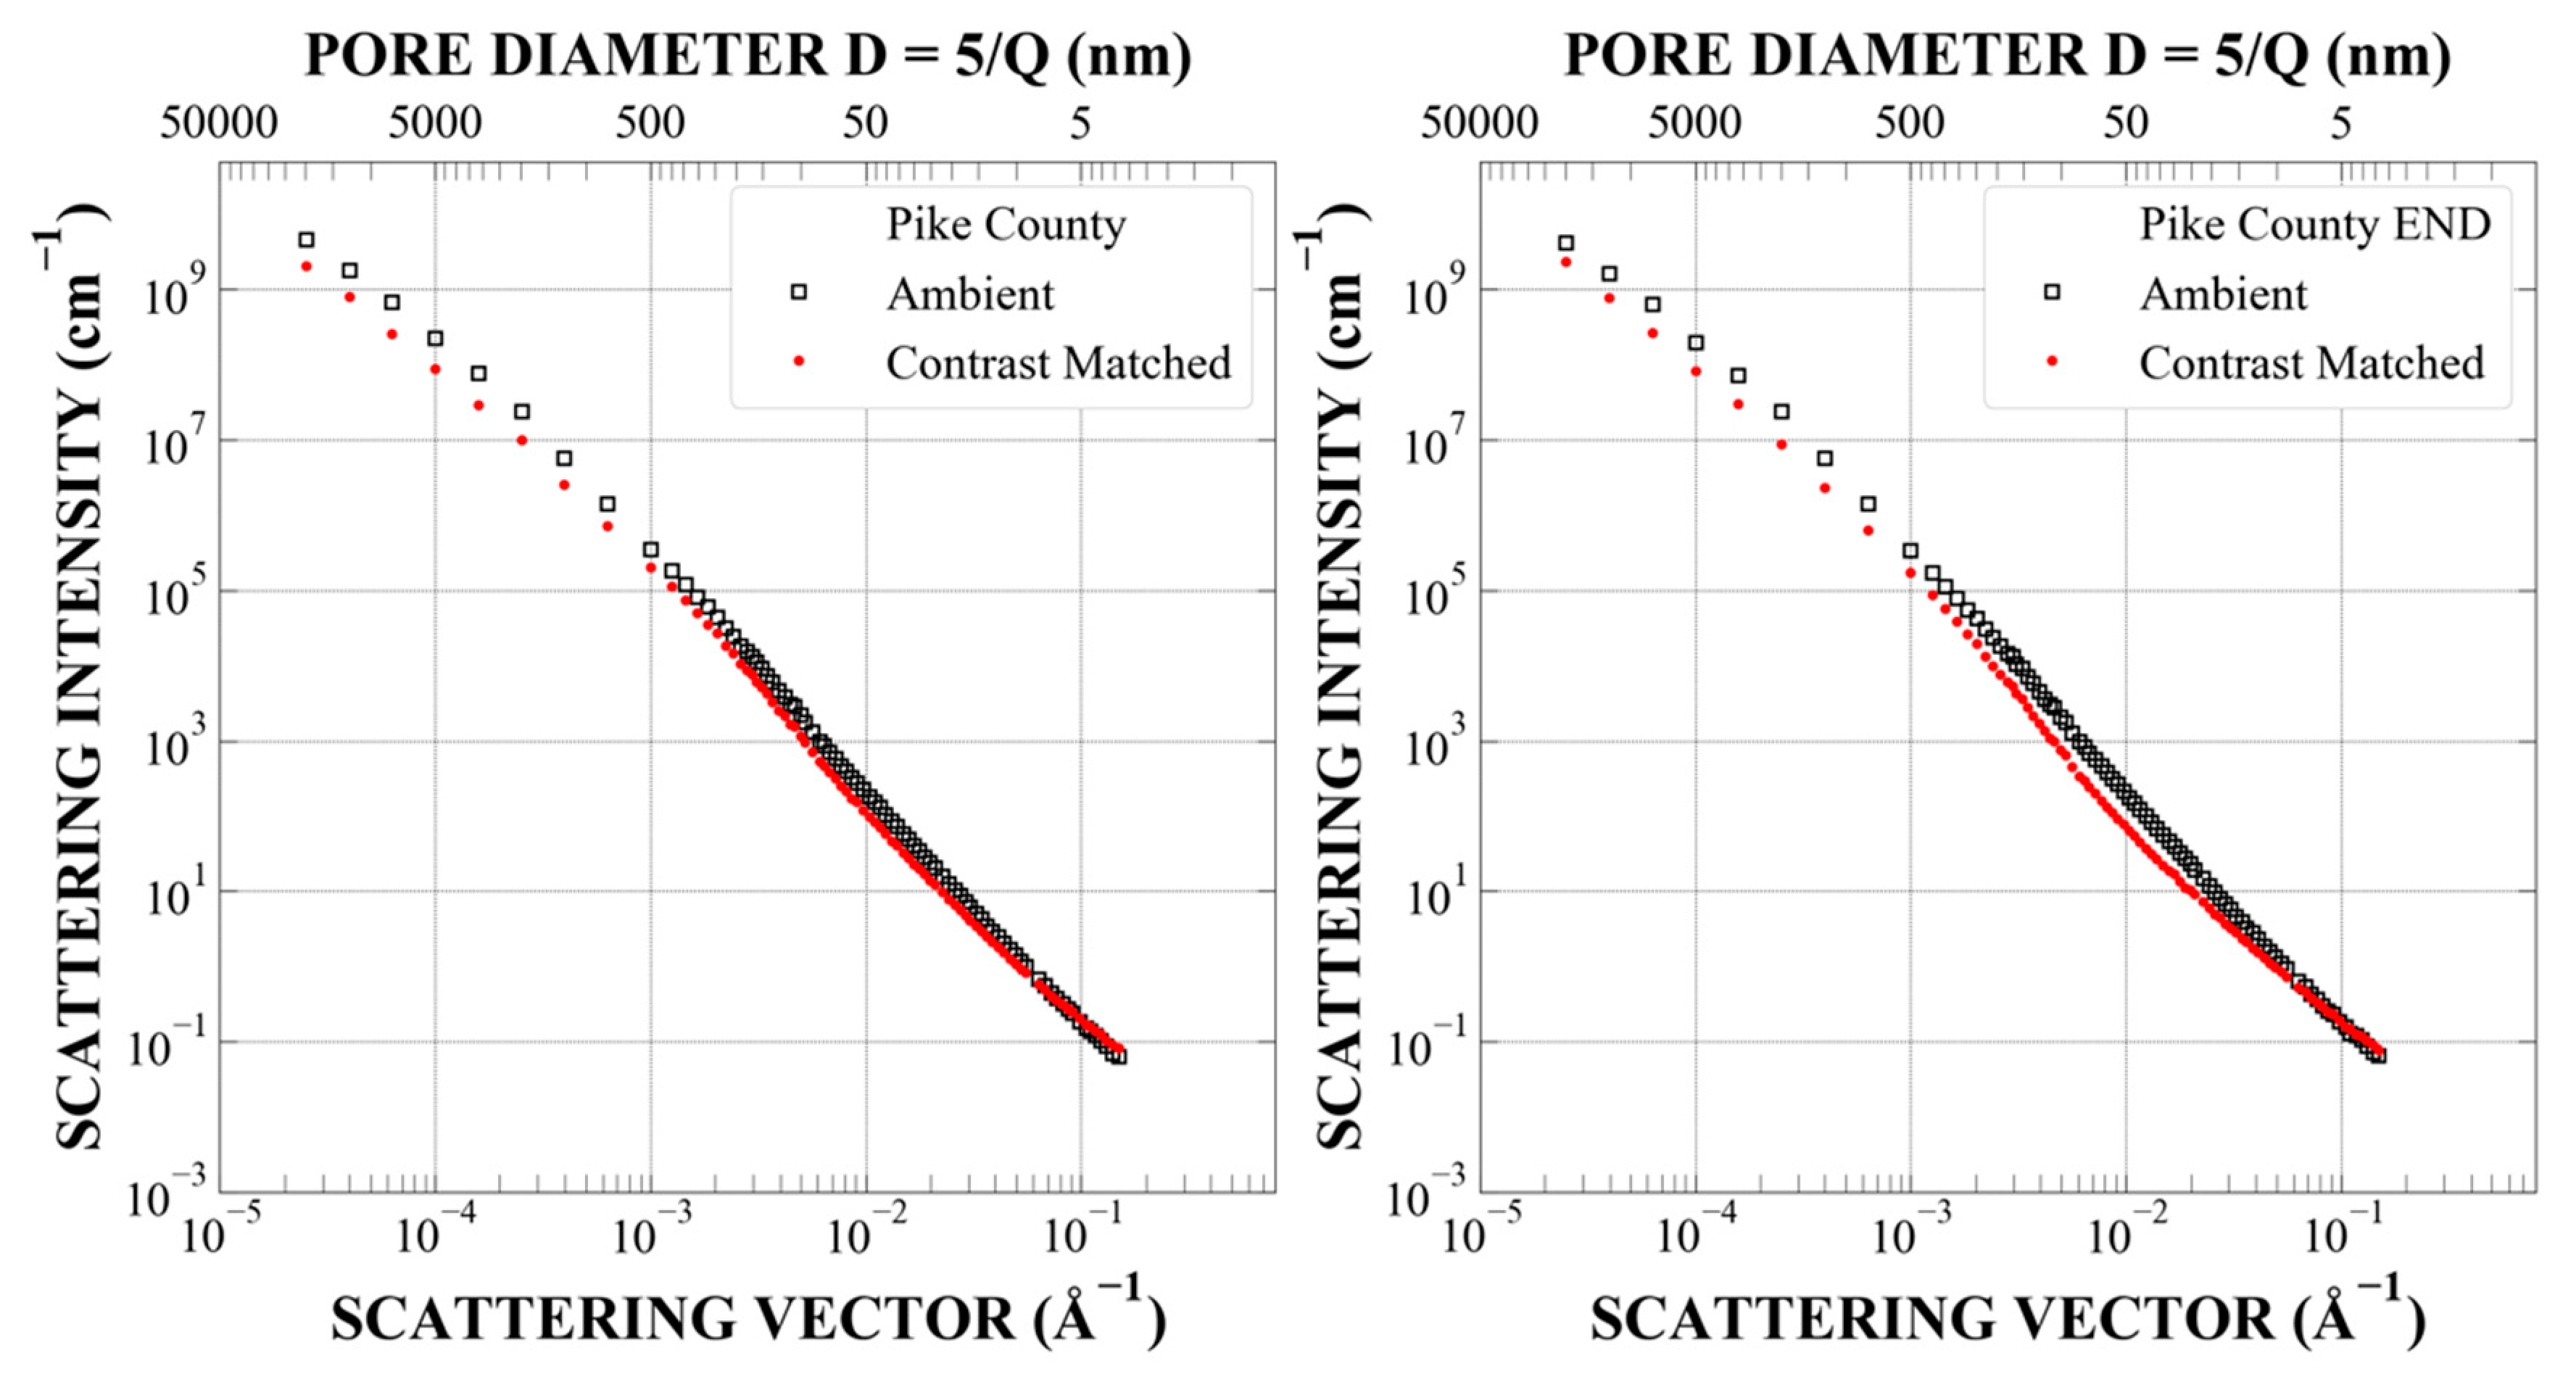
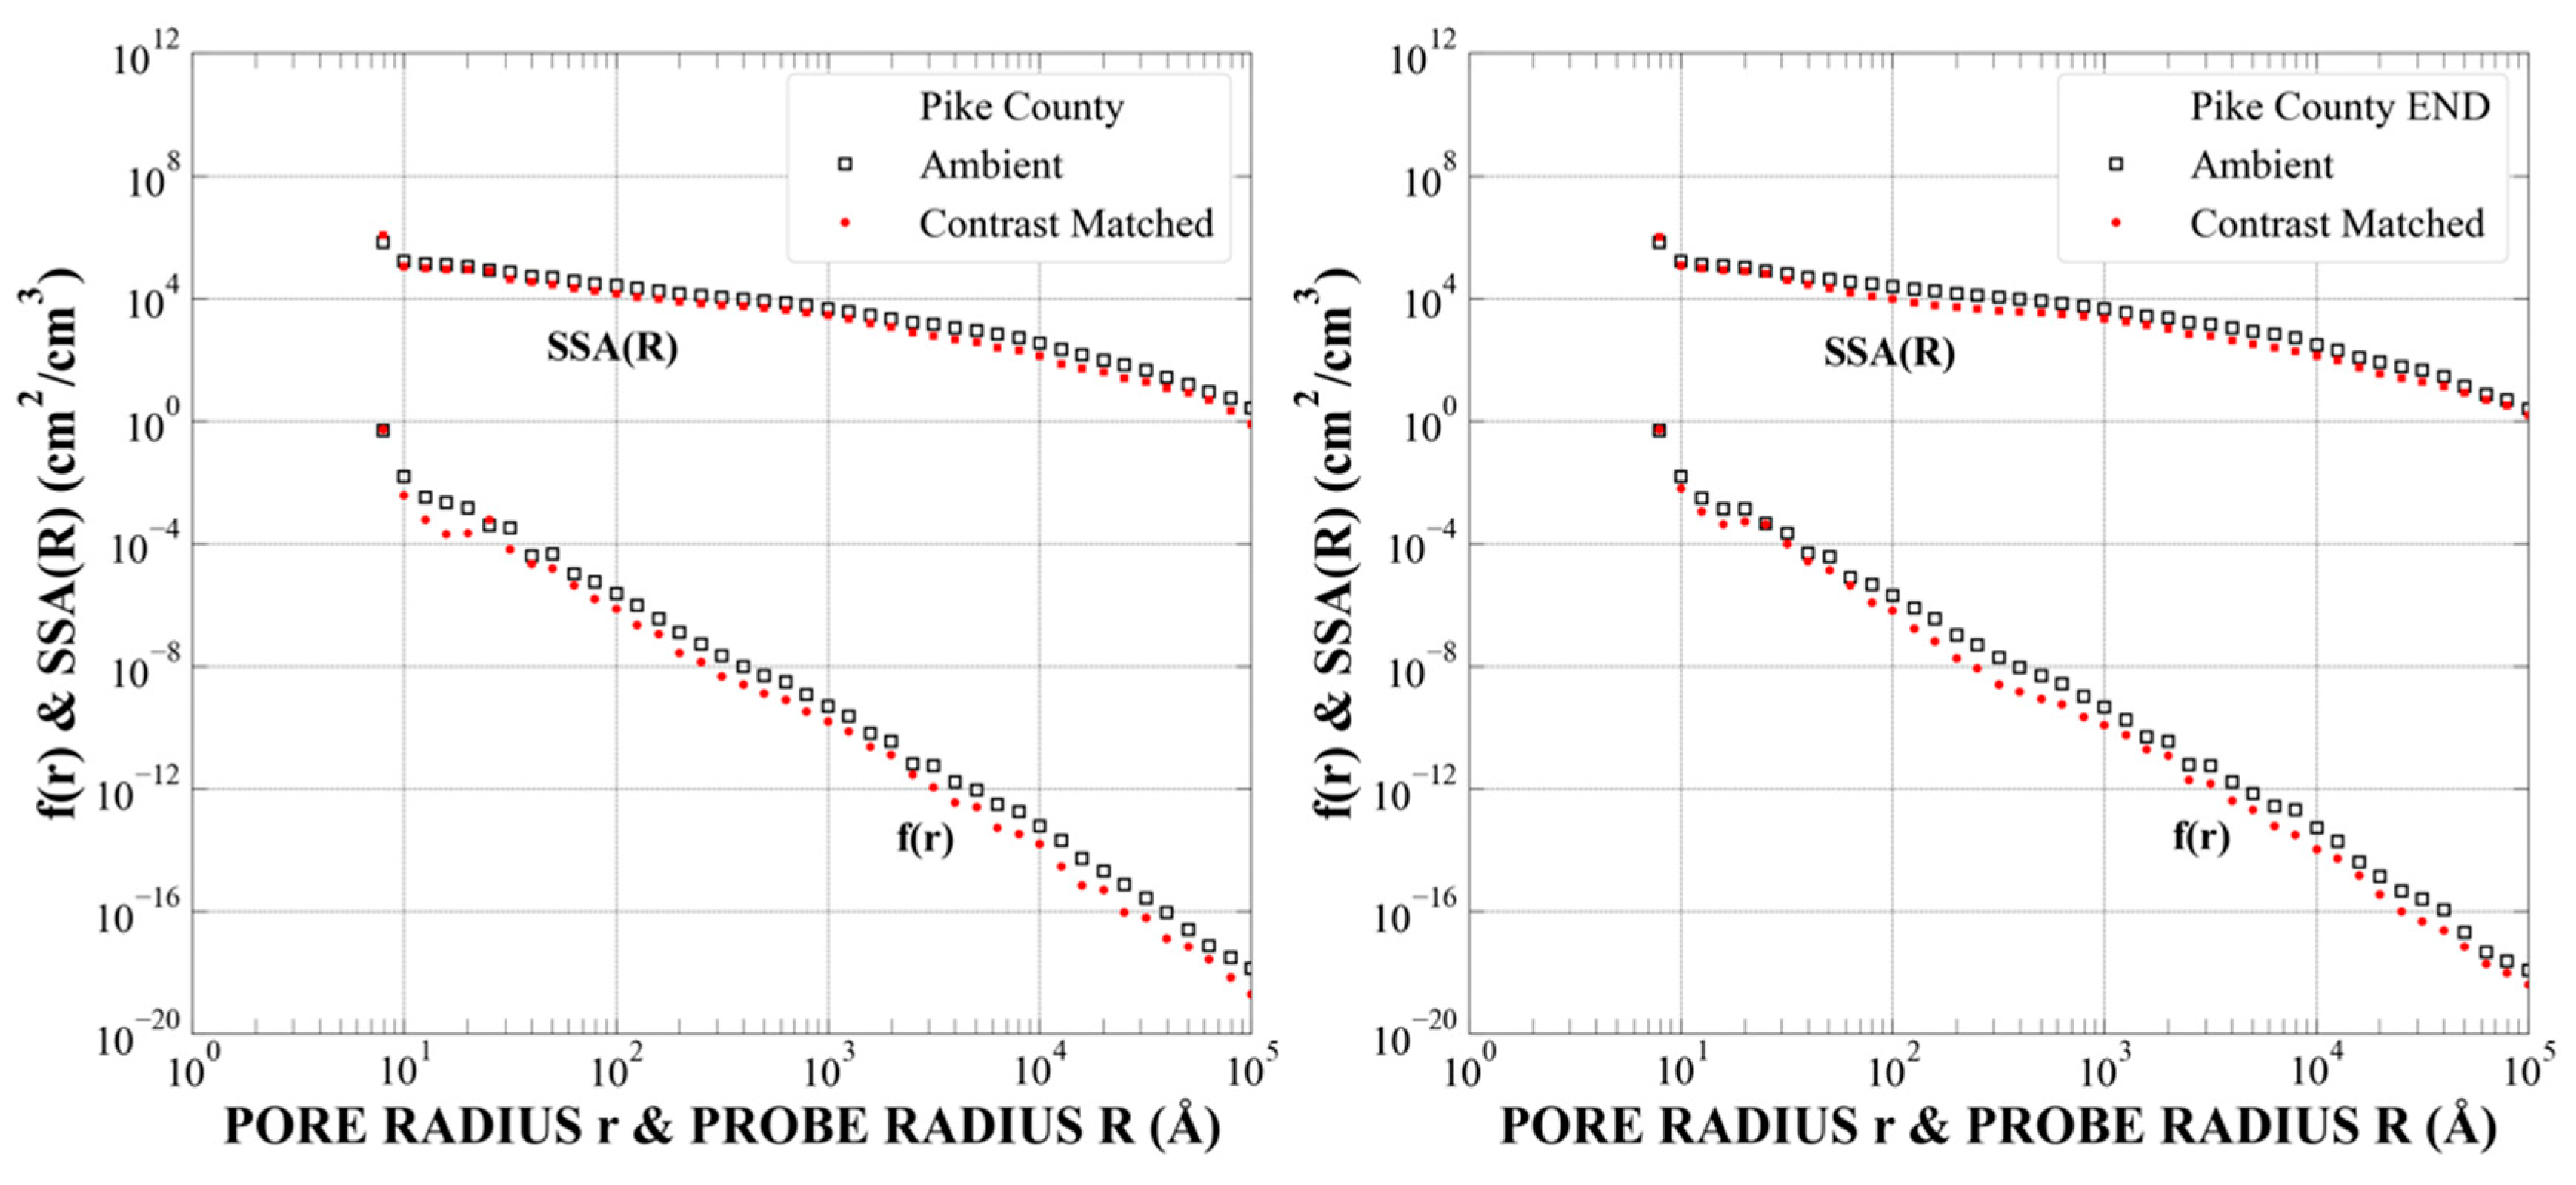
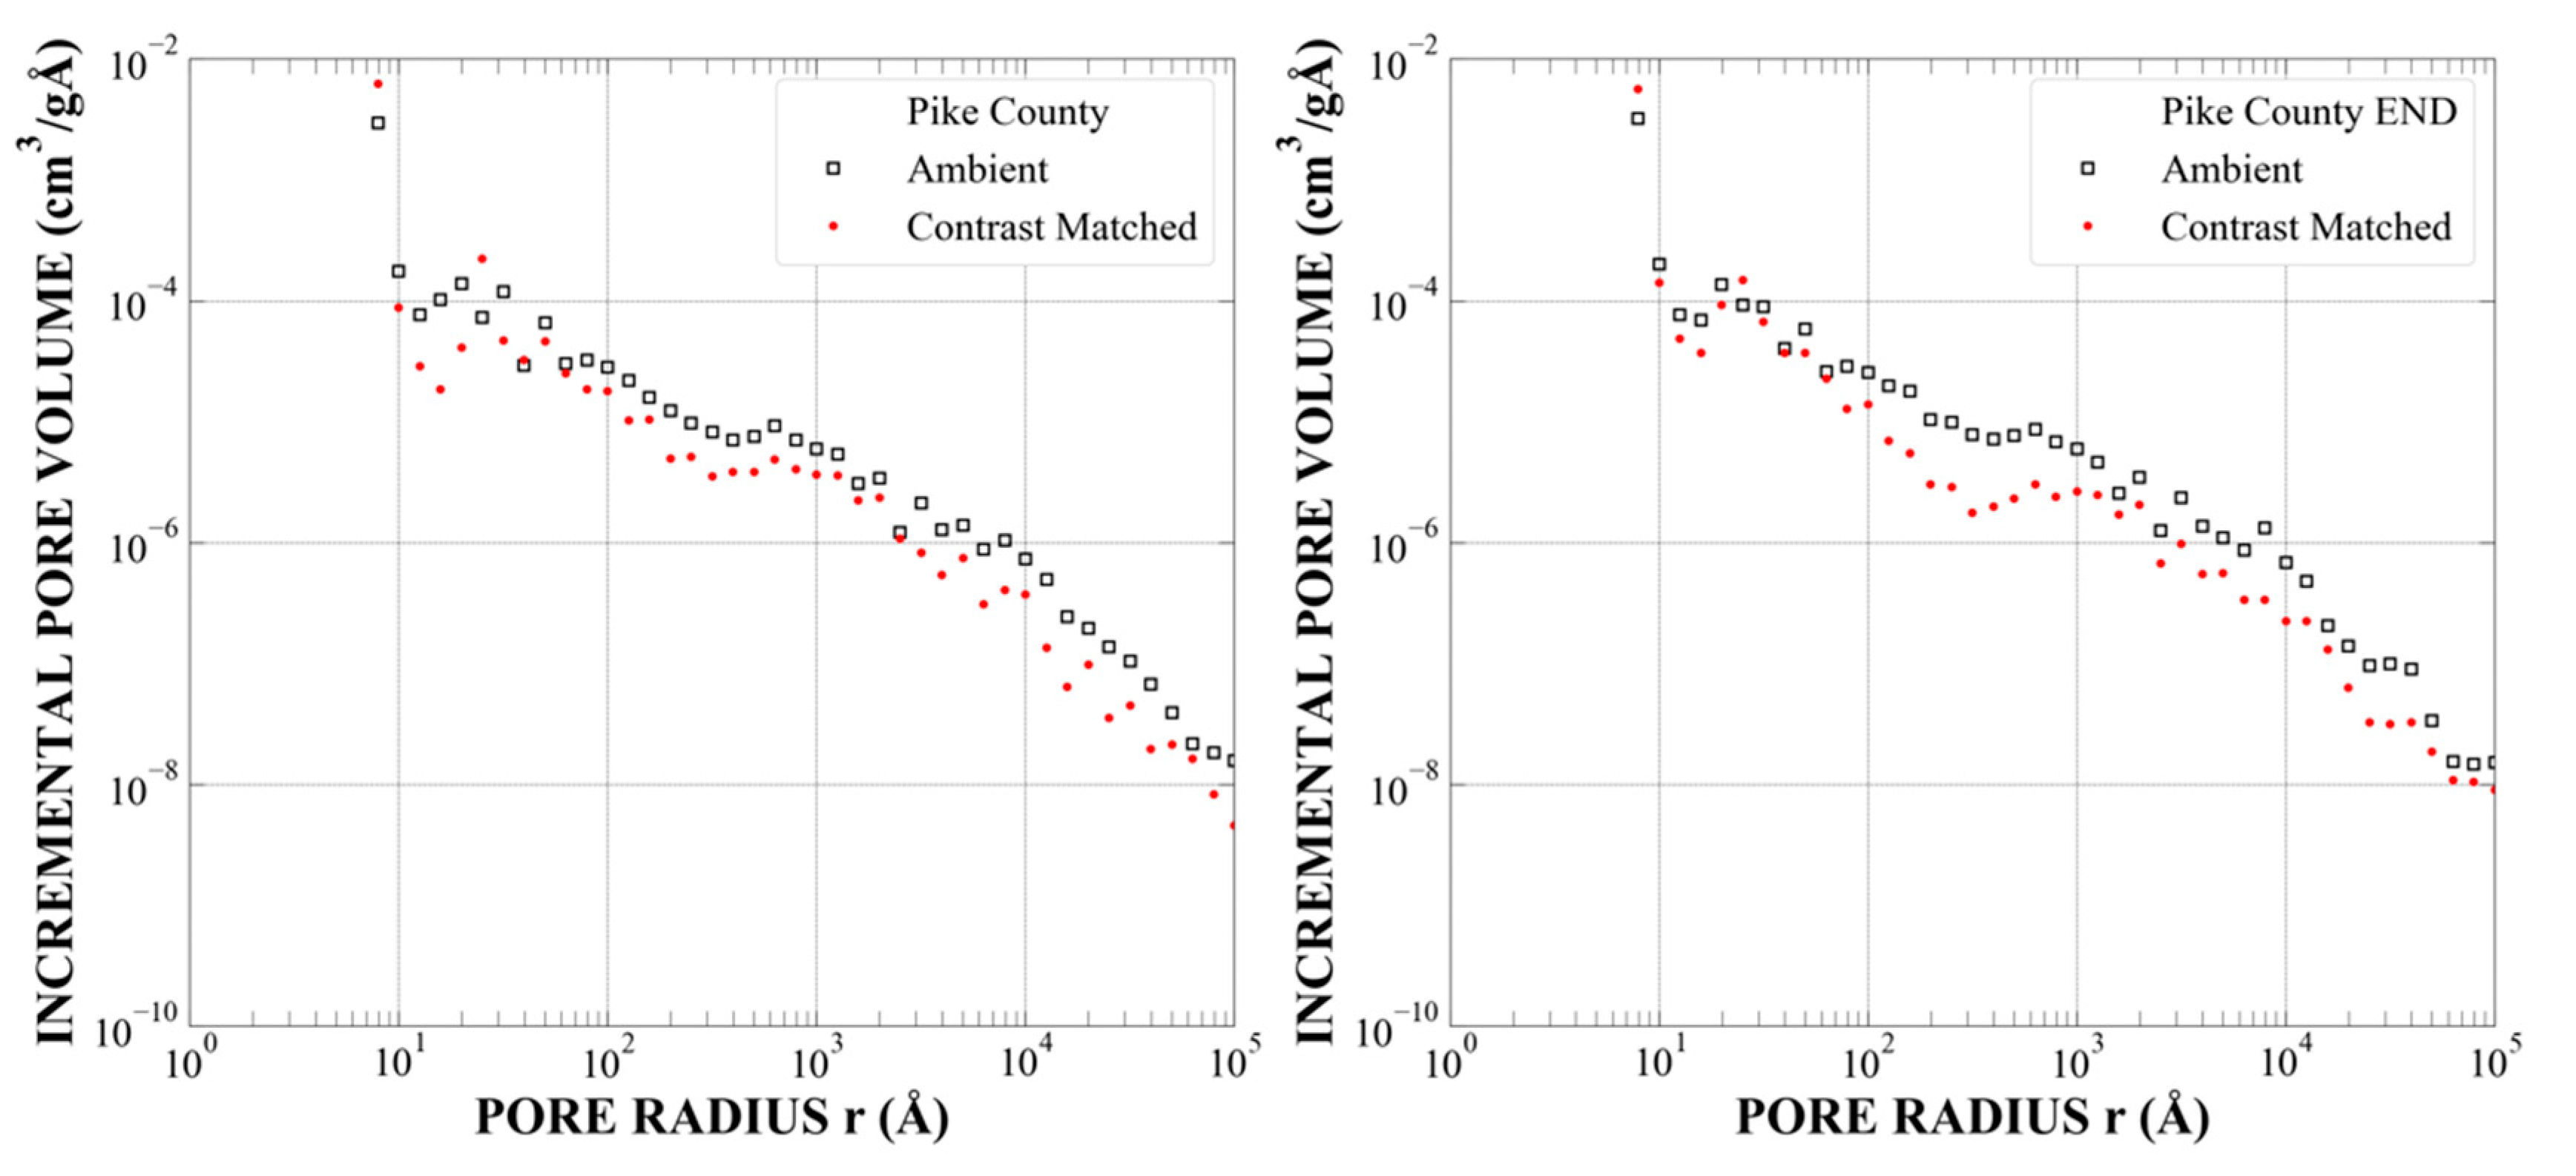
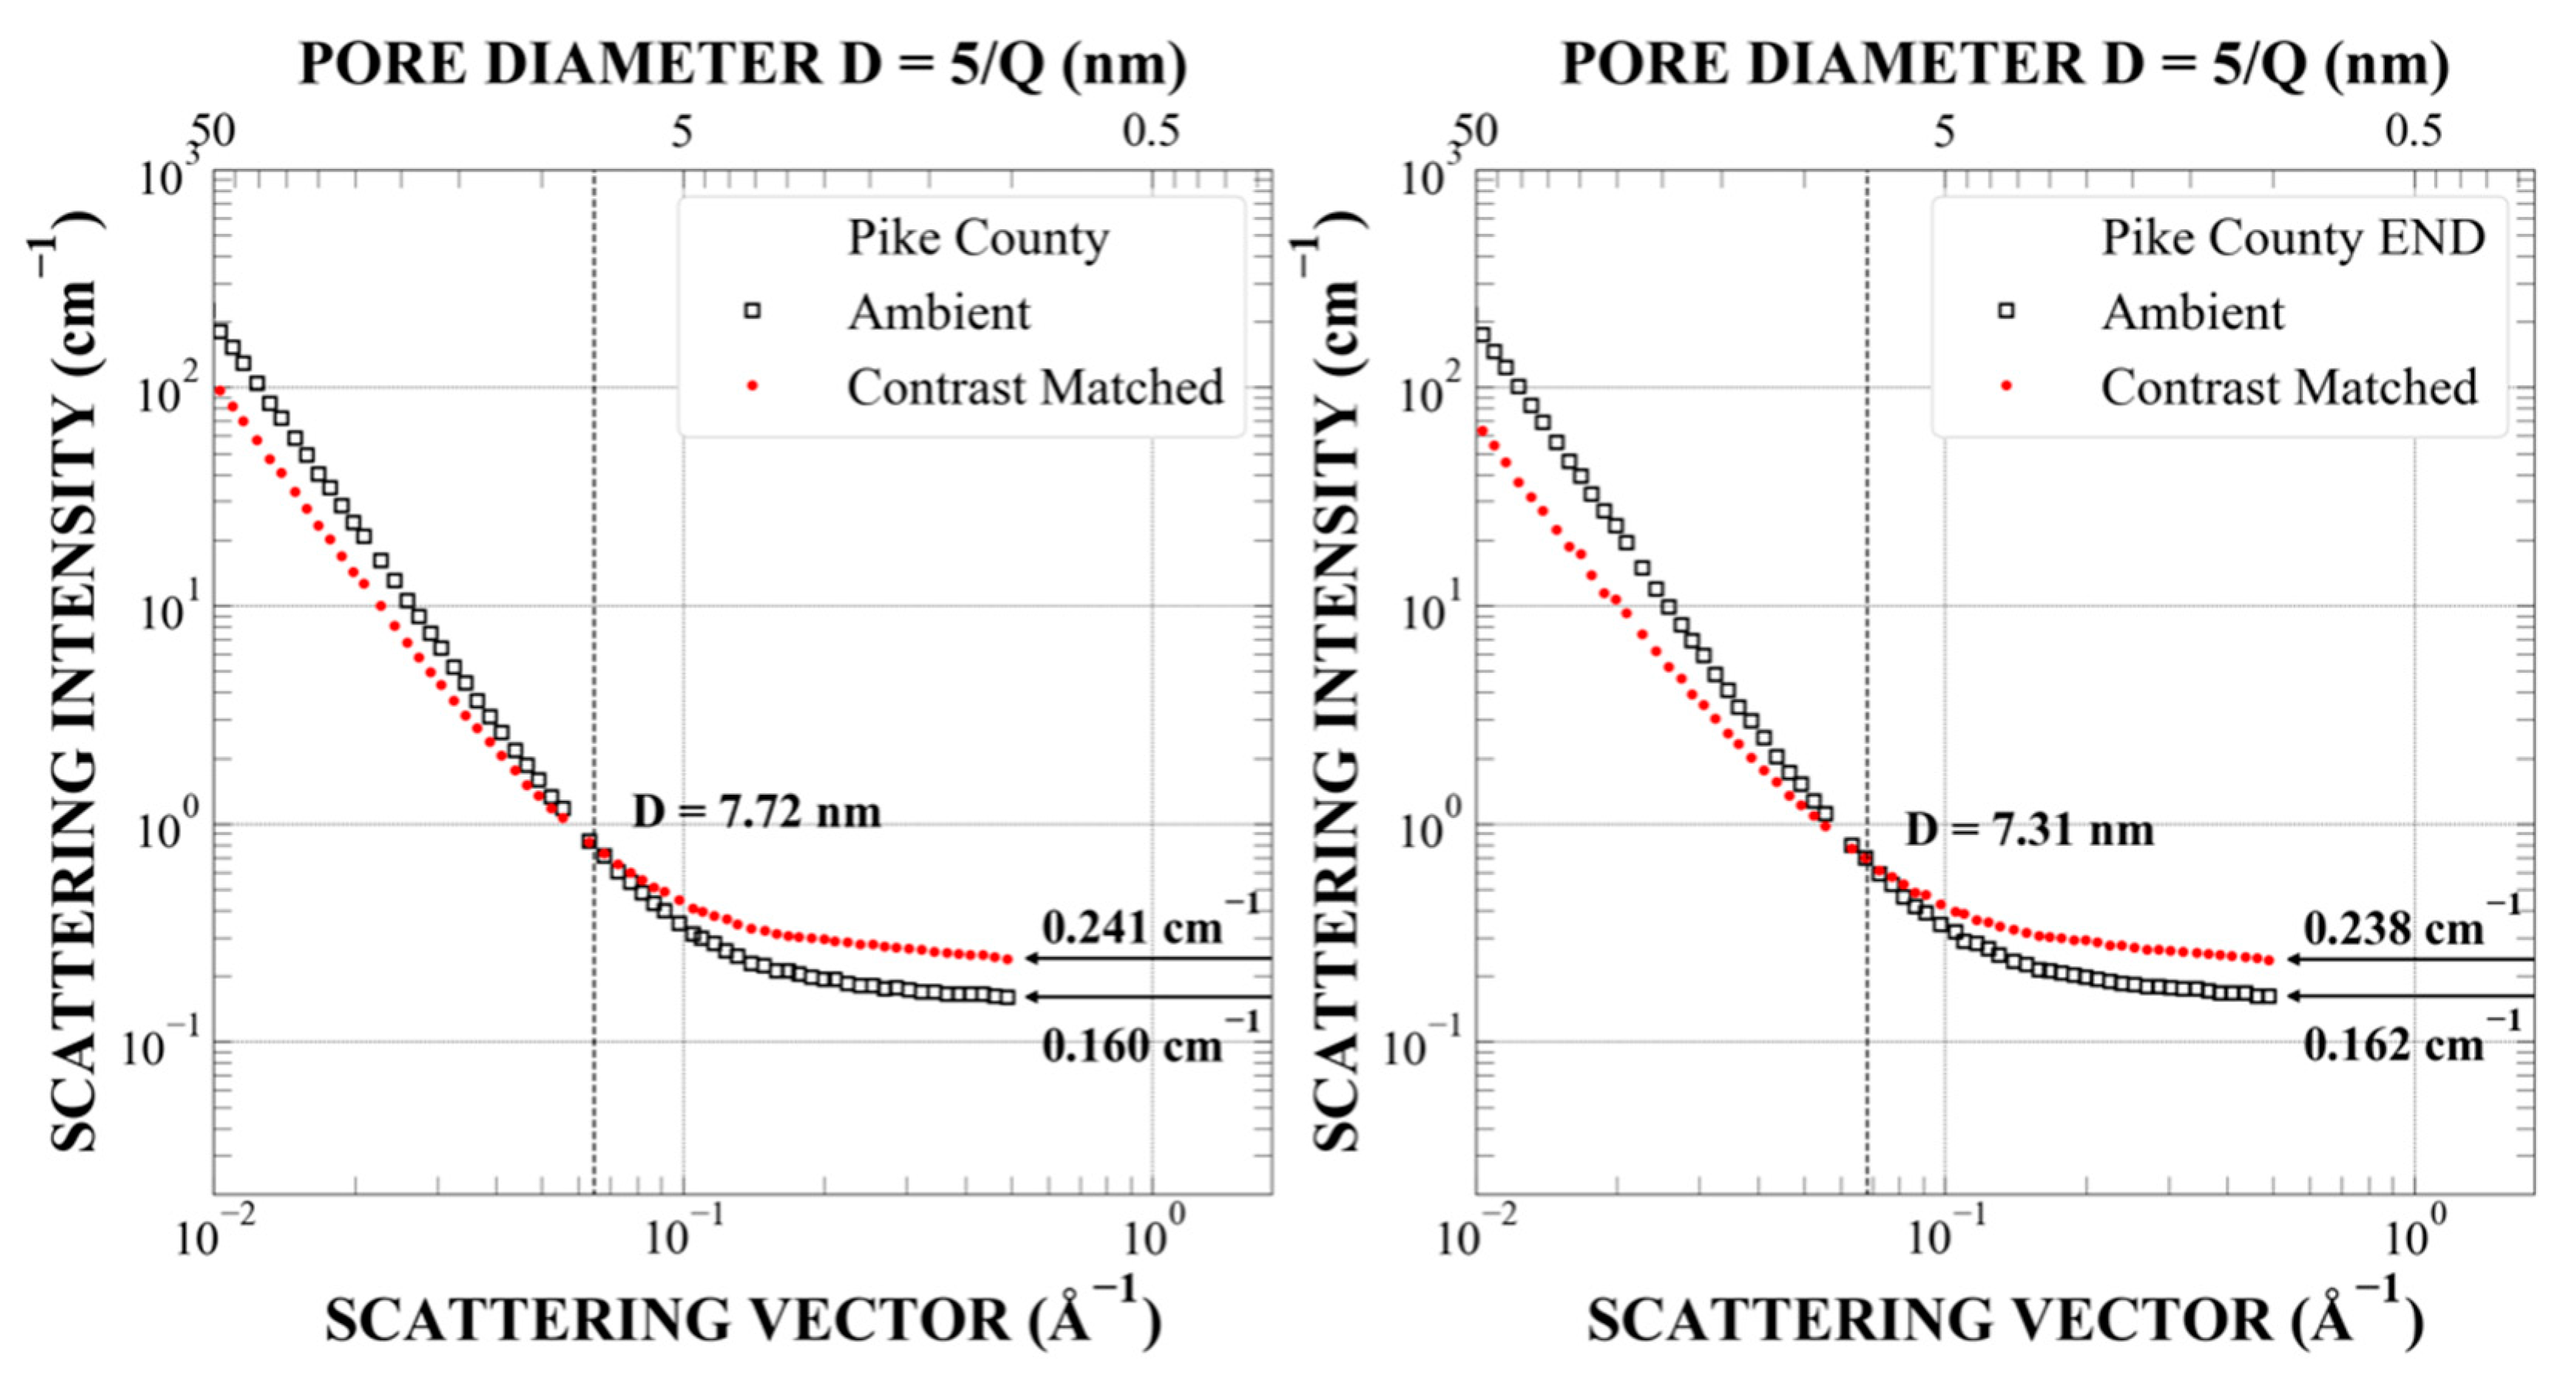
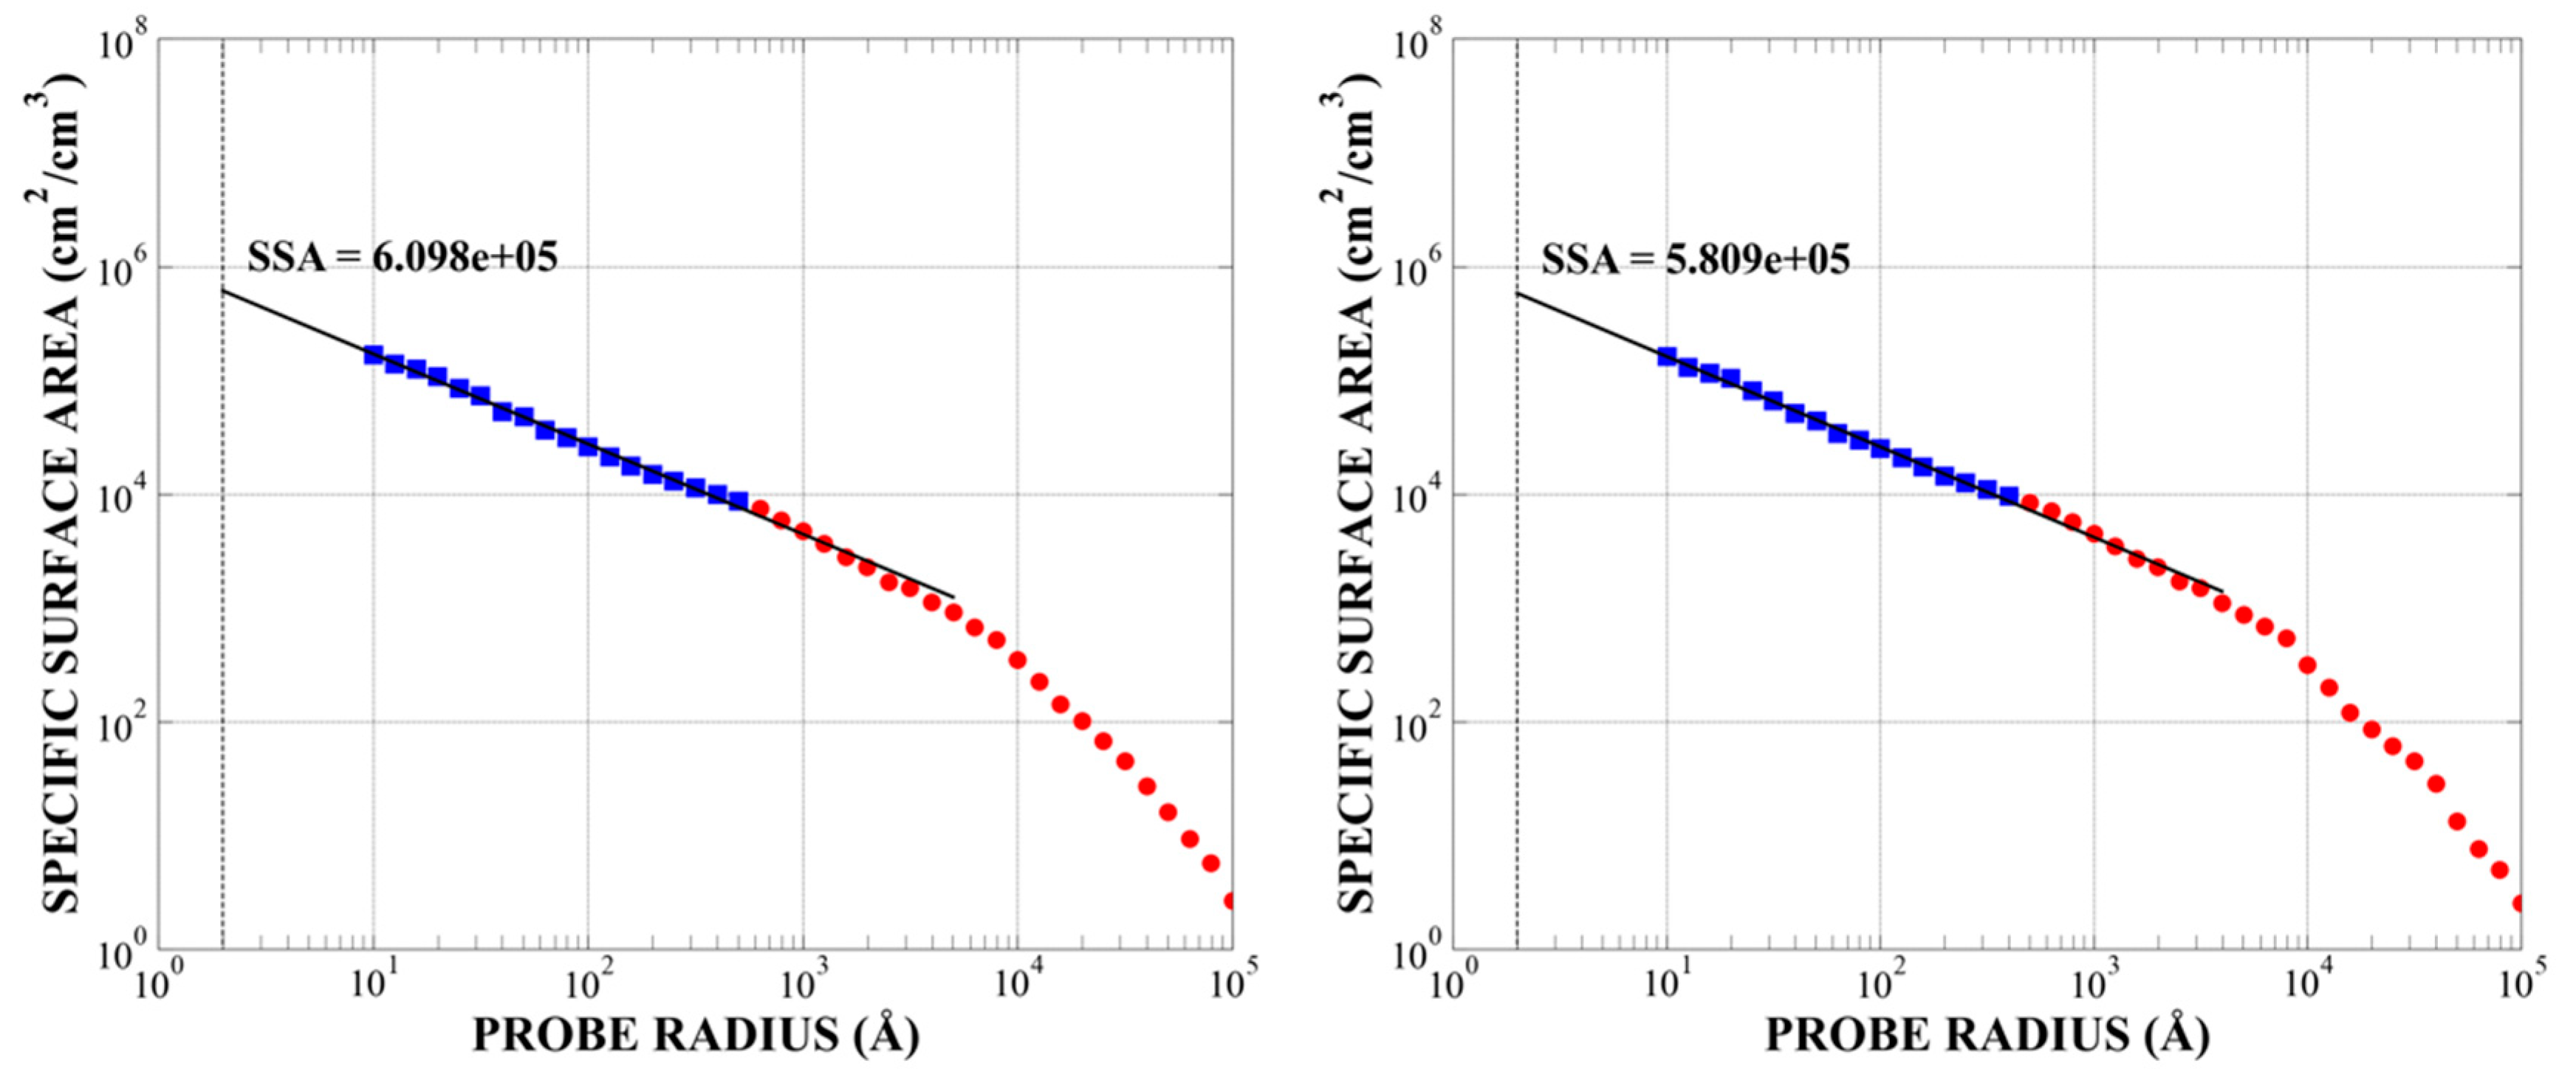
Appendix A.2. Sample McAtee-2798 (Pike County), Sub-Samples L7 and L5, Depth 2798 Feet, Ro = 0.70%, TOC = 6.6%, Mid-Mature

Figure A6. Combined absolutely calibrated SANS and USANS intensity values measured in a vacuum (ambient, open black squares) and at contrast-matched conditions (hydrostatic pressure of 500 bar of CD4, full red circles). (left panel)—as-obtained samples; (right panel)—after pressure cycling up to S = 28 bar (2.8 MPa). The pressure cycles (p,S) were as follows: (0,0); (500,0); (500,84); (0,84); (0,210); (500,210); (500,313); (0,313); (0,0); (500,0).
Energies 14 08438 g0a6
Figure A7. Probability density of the pore radius distribution (f(r)) and the specific surface area of the rock–pore space interface versus probe size (SSA(R)), calculated using the Polydisperse Spheres model implemented in the PRINSAS software. Ambient—results for accessible plus inaccessible pores; contrast-matched—results for inaccessible pores only. (left panel)—before pressure cycling; (right panel)—after pressure cycling.
Energies 14 08438 g0a7
Figure A8. Incremental pore volume distribution (dV/dr per gram of rock), calculated using the Polydisperse Spheres model implemented in the PRINSAS software. Ambient—results for accessible plus inaccessible pores; contrast-matched—results for inaccessible pores only. (left panel)—before pressure cycling; (right panel)—after pressure cycling.
Energies 14 08438 g0a8
Figure A9. Fractions of all pores accessible to penetrating deuterated methane for various nominal pore diameters before (red circles) and after pressure cycling (blue circles), calculated using the Polydisperse Spheres model implemented in the PRINSAS software.
Energies 14 08438 g0a9
Figure A10. Details of the SANS ambient and contrast-matched data in the large-Q region before (left panel) and after pressure cycling (right panel).
Energies 14 08438 g0a10

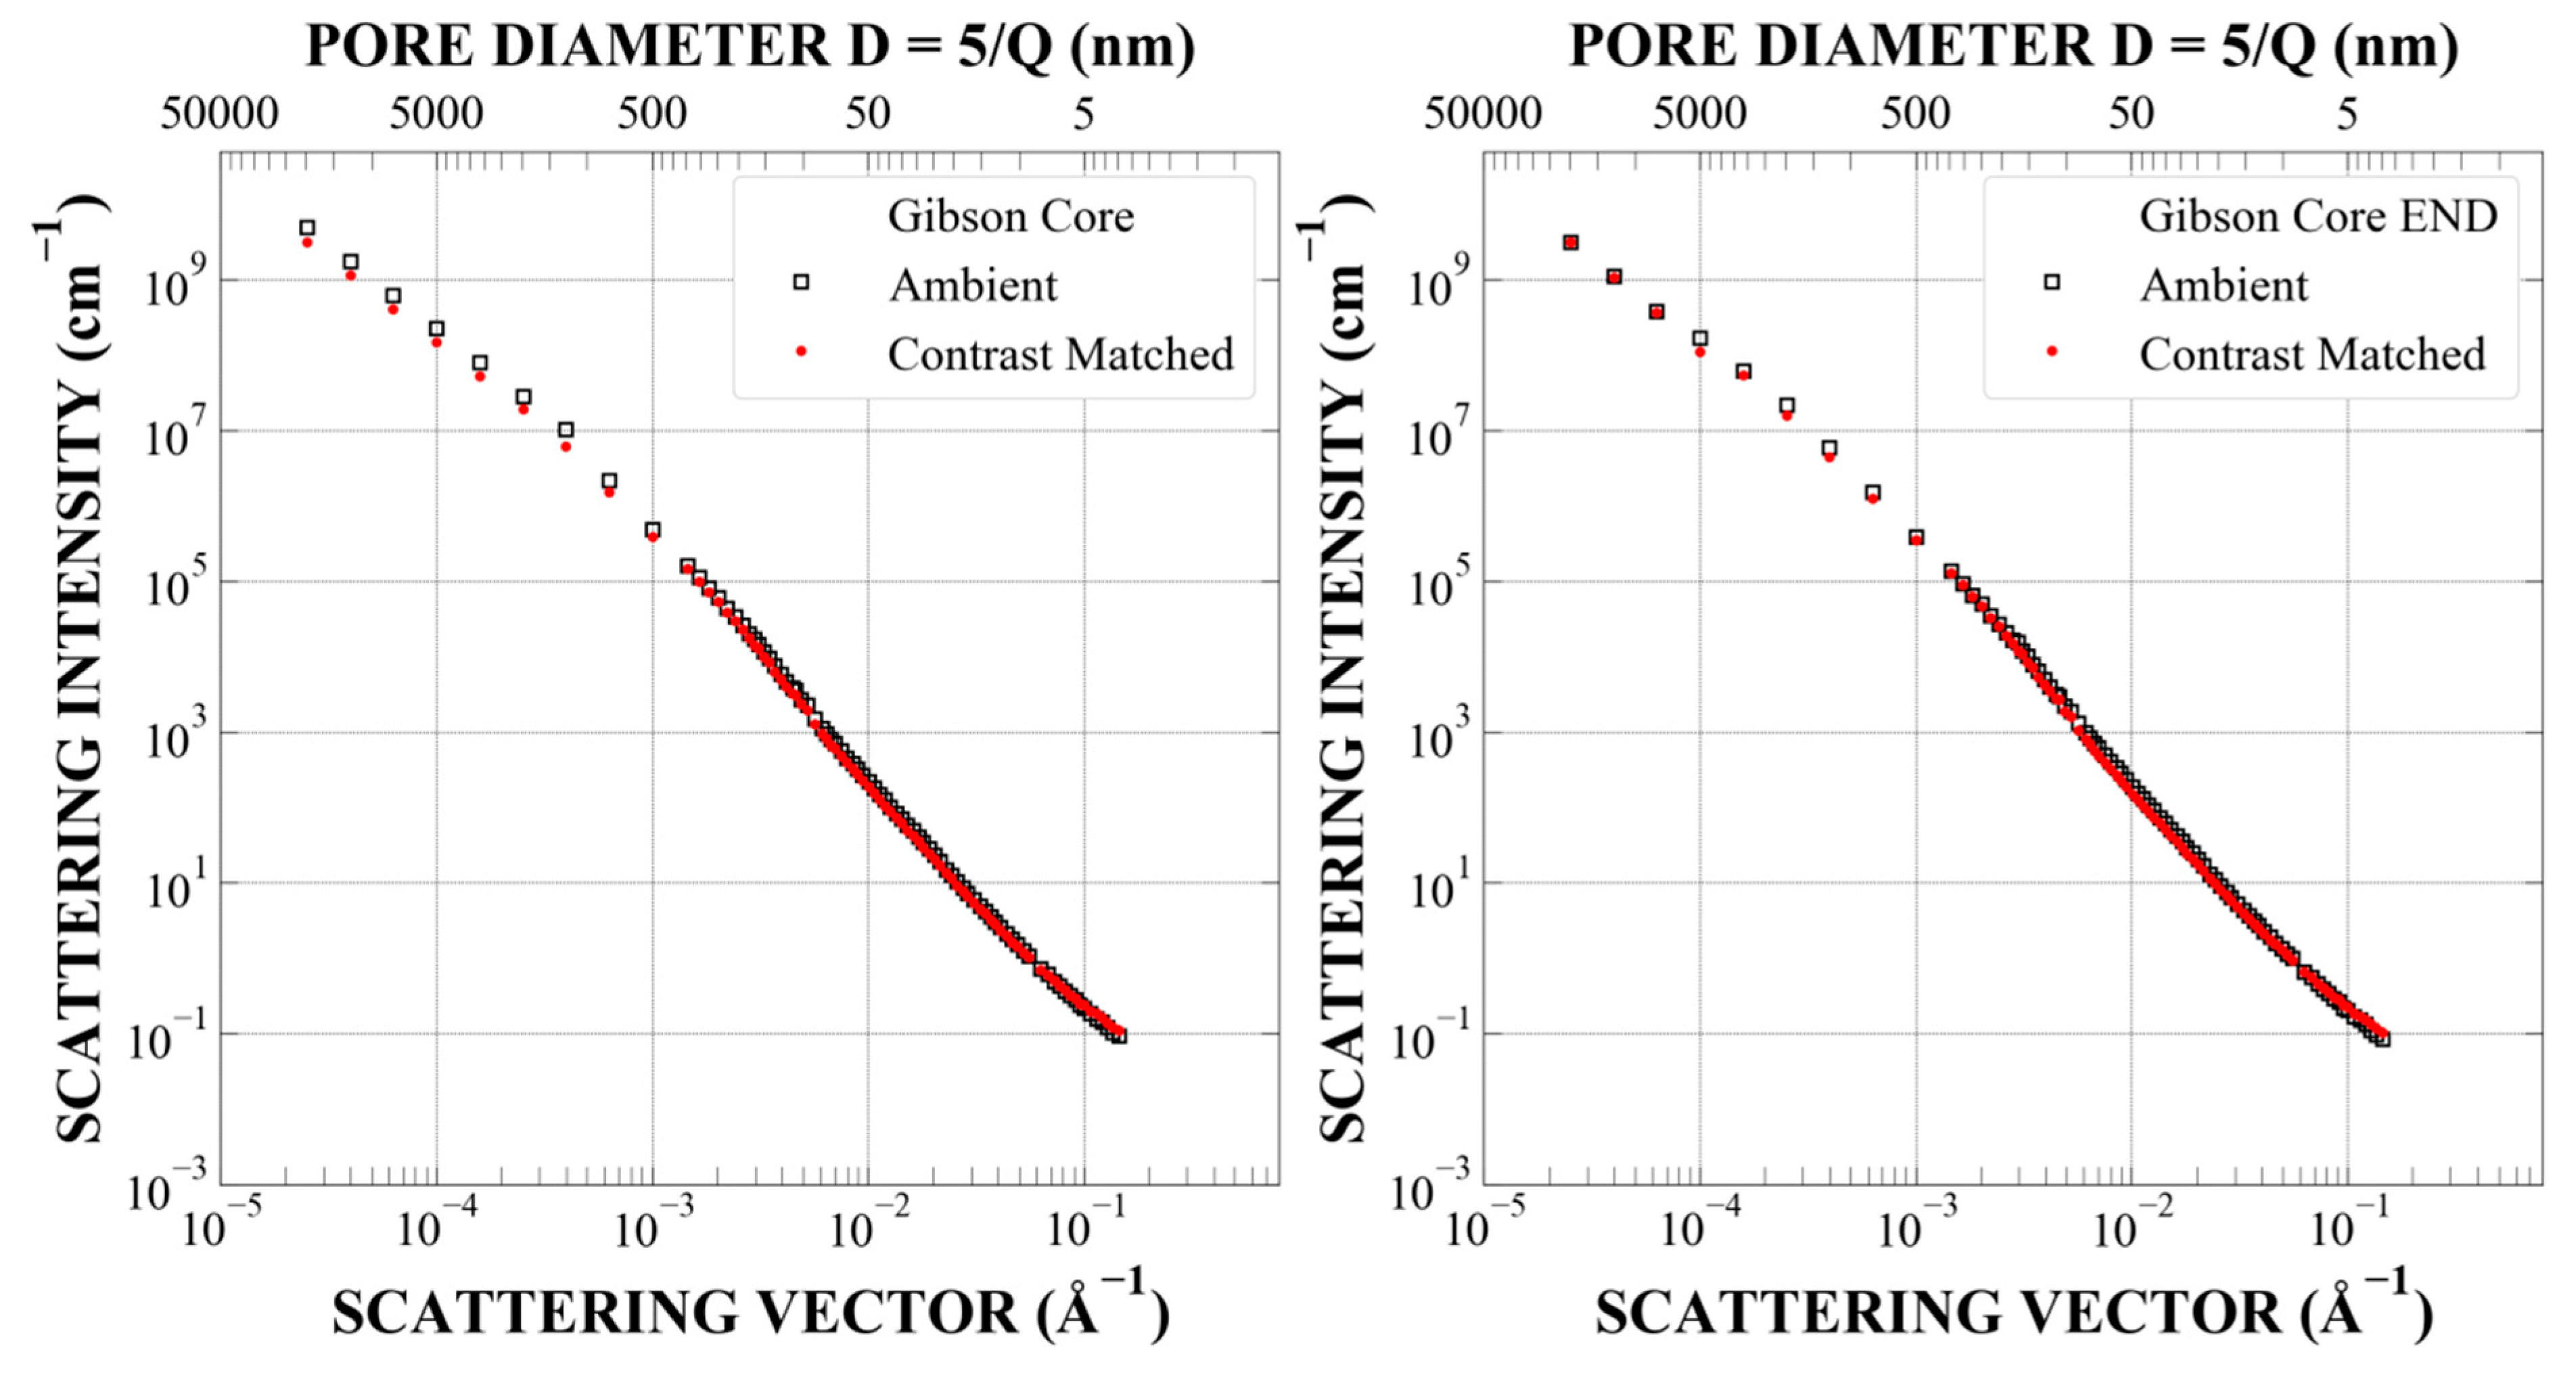
Appendix A.3. Sample Gibson-3997 (Gibson County), Sub-Samples L10 and L1, Depth 3997 Feet, Ro = 0.84%, TOC = 5.9%, Mid-Mature

Figure A11. Combined absolutely calibrated SANS and USANS intensity values measured in a vacuum (ambient, open black squares) and at contrast-matched conditions (hydrostatic pressure of 500 bar of CD4, full red circles). (left panel)—as-obtained samples; (right panel)—after pressure cycling up to S = 28 bar (2.8 MPa). The pressure cycles (p,S) were as follows: (0,0); (500,0); (500,500); (0,500); (0,850); (500,850); (0,0); (500,0).
Energies 14 08438 g0a11
Figure A12. Probability density values of the pore radius distribution (f(r)) and the specific surface area of the rock–pore space interface versus probe size (SSA(R)), calculated using the Polydisperse Spheres model implemented in the PRINSAS software. Ambient—results for accessible plus inaccessible pores; contrast-matched—results for inaccessible pores only. (left panel)—before pressure cycling; (right panel)—after pressure cycling.
Energies 14 08438 g0a12
Figure A13. Incremental pore volume distribution (dV/dr per gram of rock), calculated using the Polydisperse Spheres model implemented in the PRINSAS software. Ambient—results for accessible plus inaccessible pores; contrast-matched—results for inaccessible pores only. (left panel)—before pressure cycling; (right panel)—after pressure cycling.
Energies 14 08438 g0a13
Figure A14. Fraction of all pores accessible to penetrating deuterated methane for various nominal pore diameters before (red circles) and after pressure cycling (blue circles), calculated using the Polydisperse Spheres model implemented in PRINSAS software.
Energies 14 08438 g0a14
Figure A15. Details of the SANS ambient and contrast-matched data in the large-Q region before (left panel) and after pressure cycling (right panel).
Energies 14 08438 g0a15

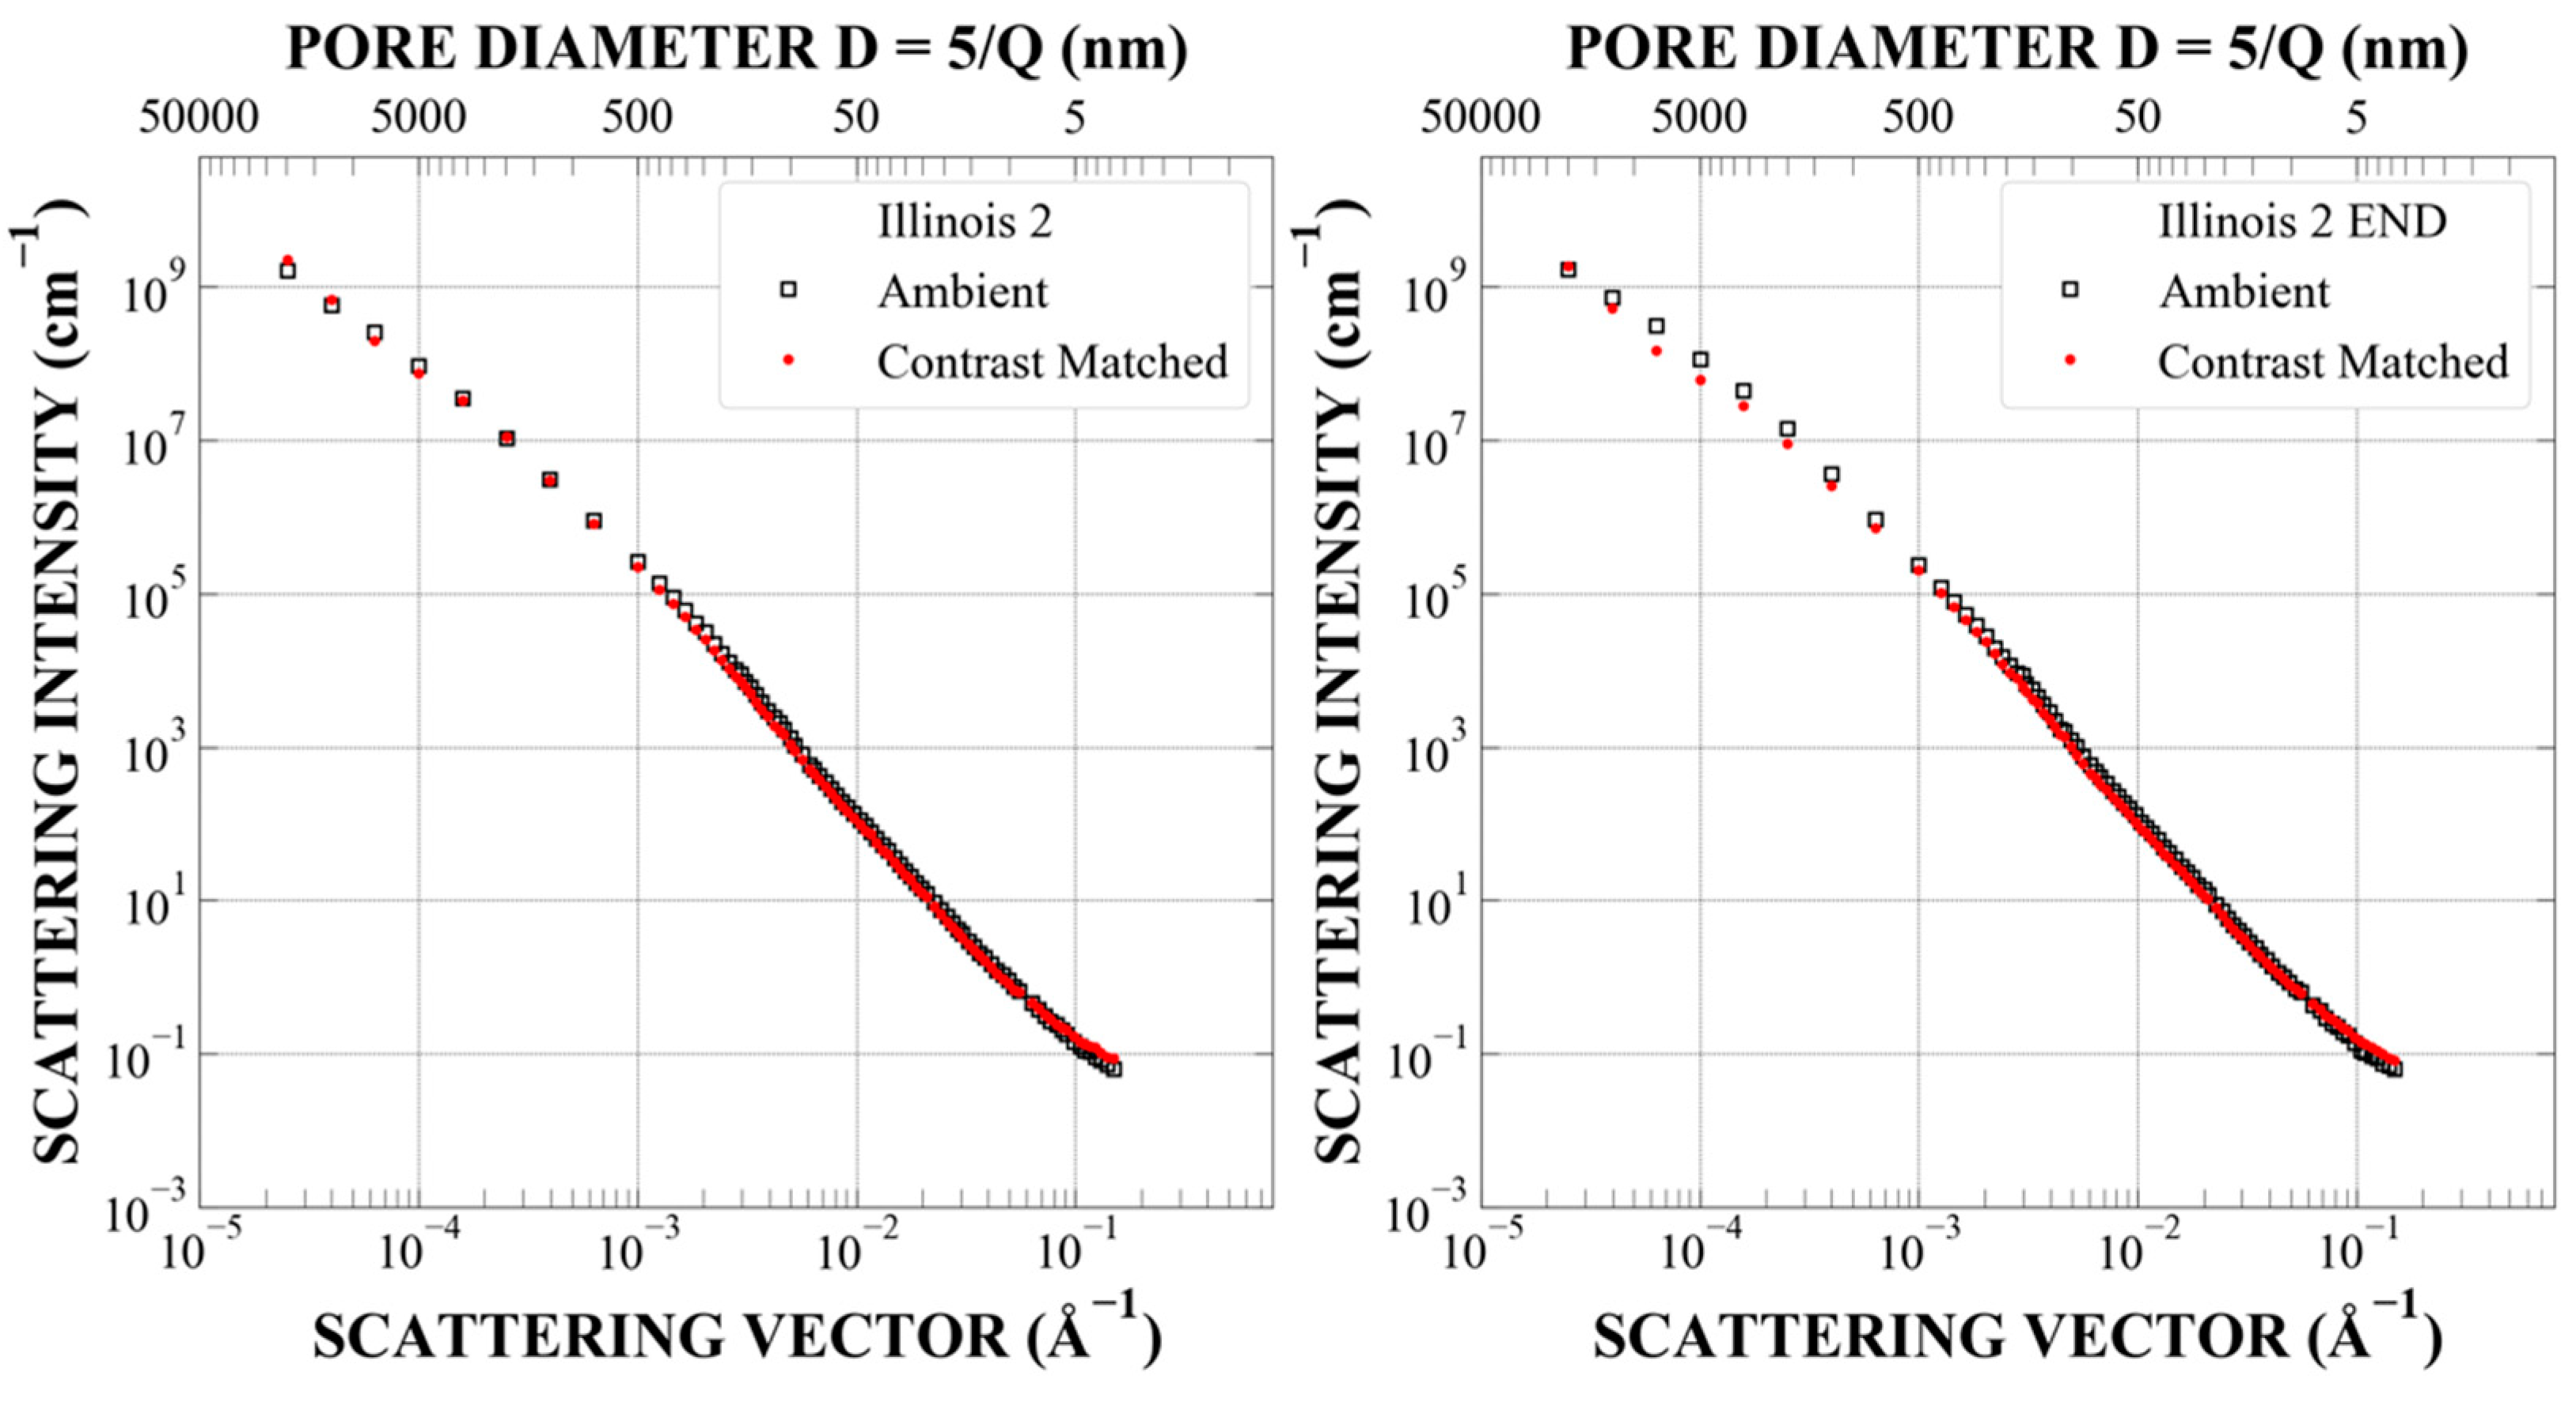
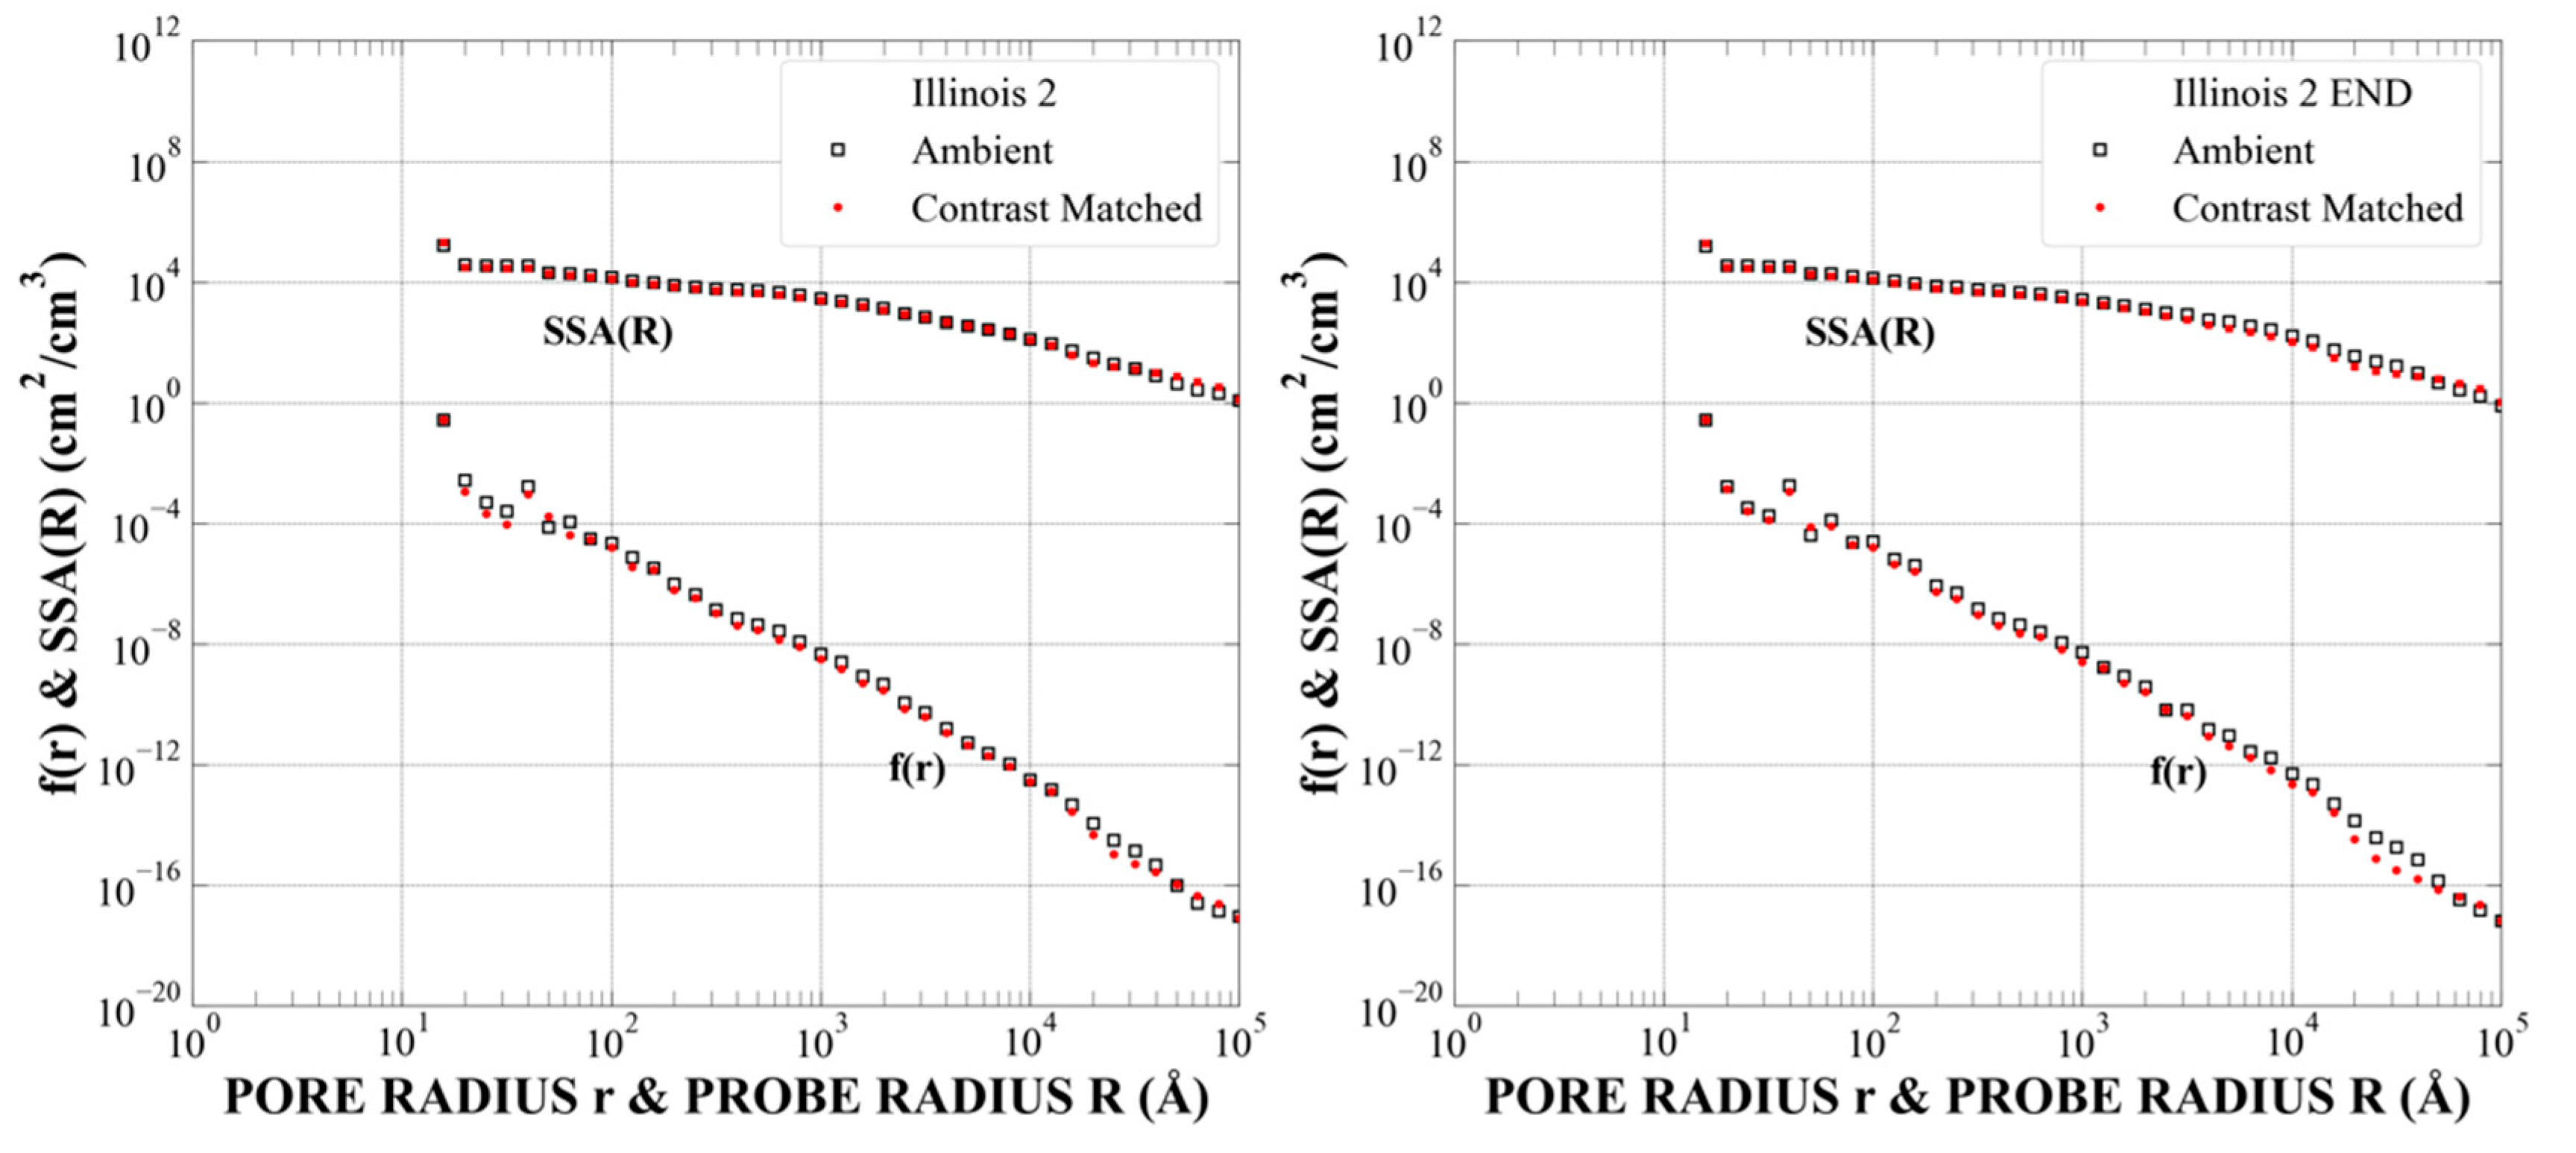
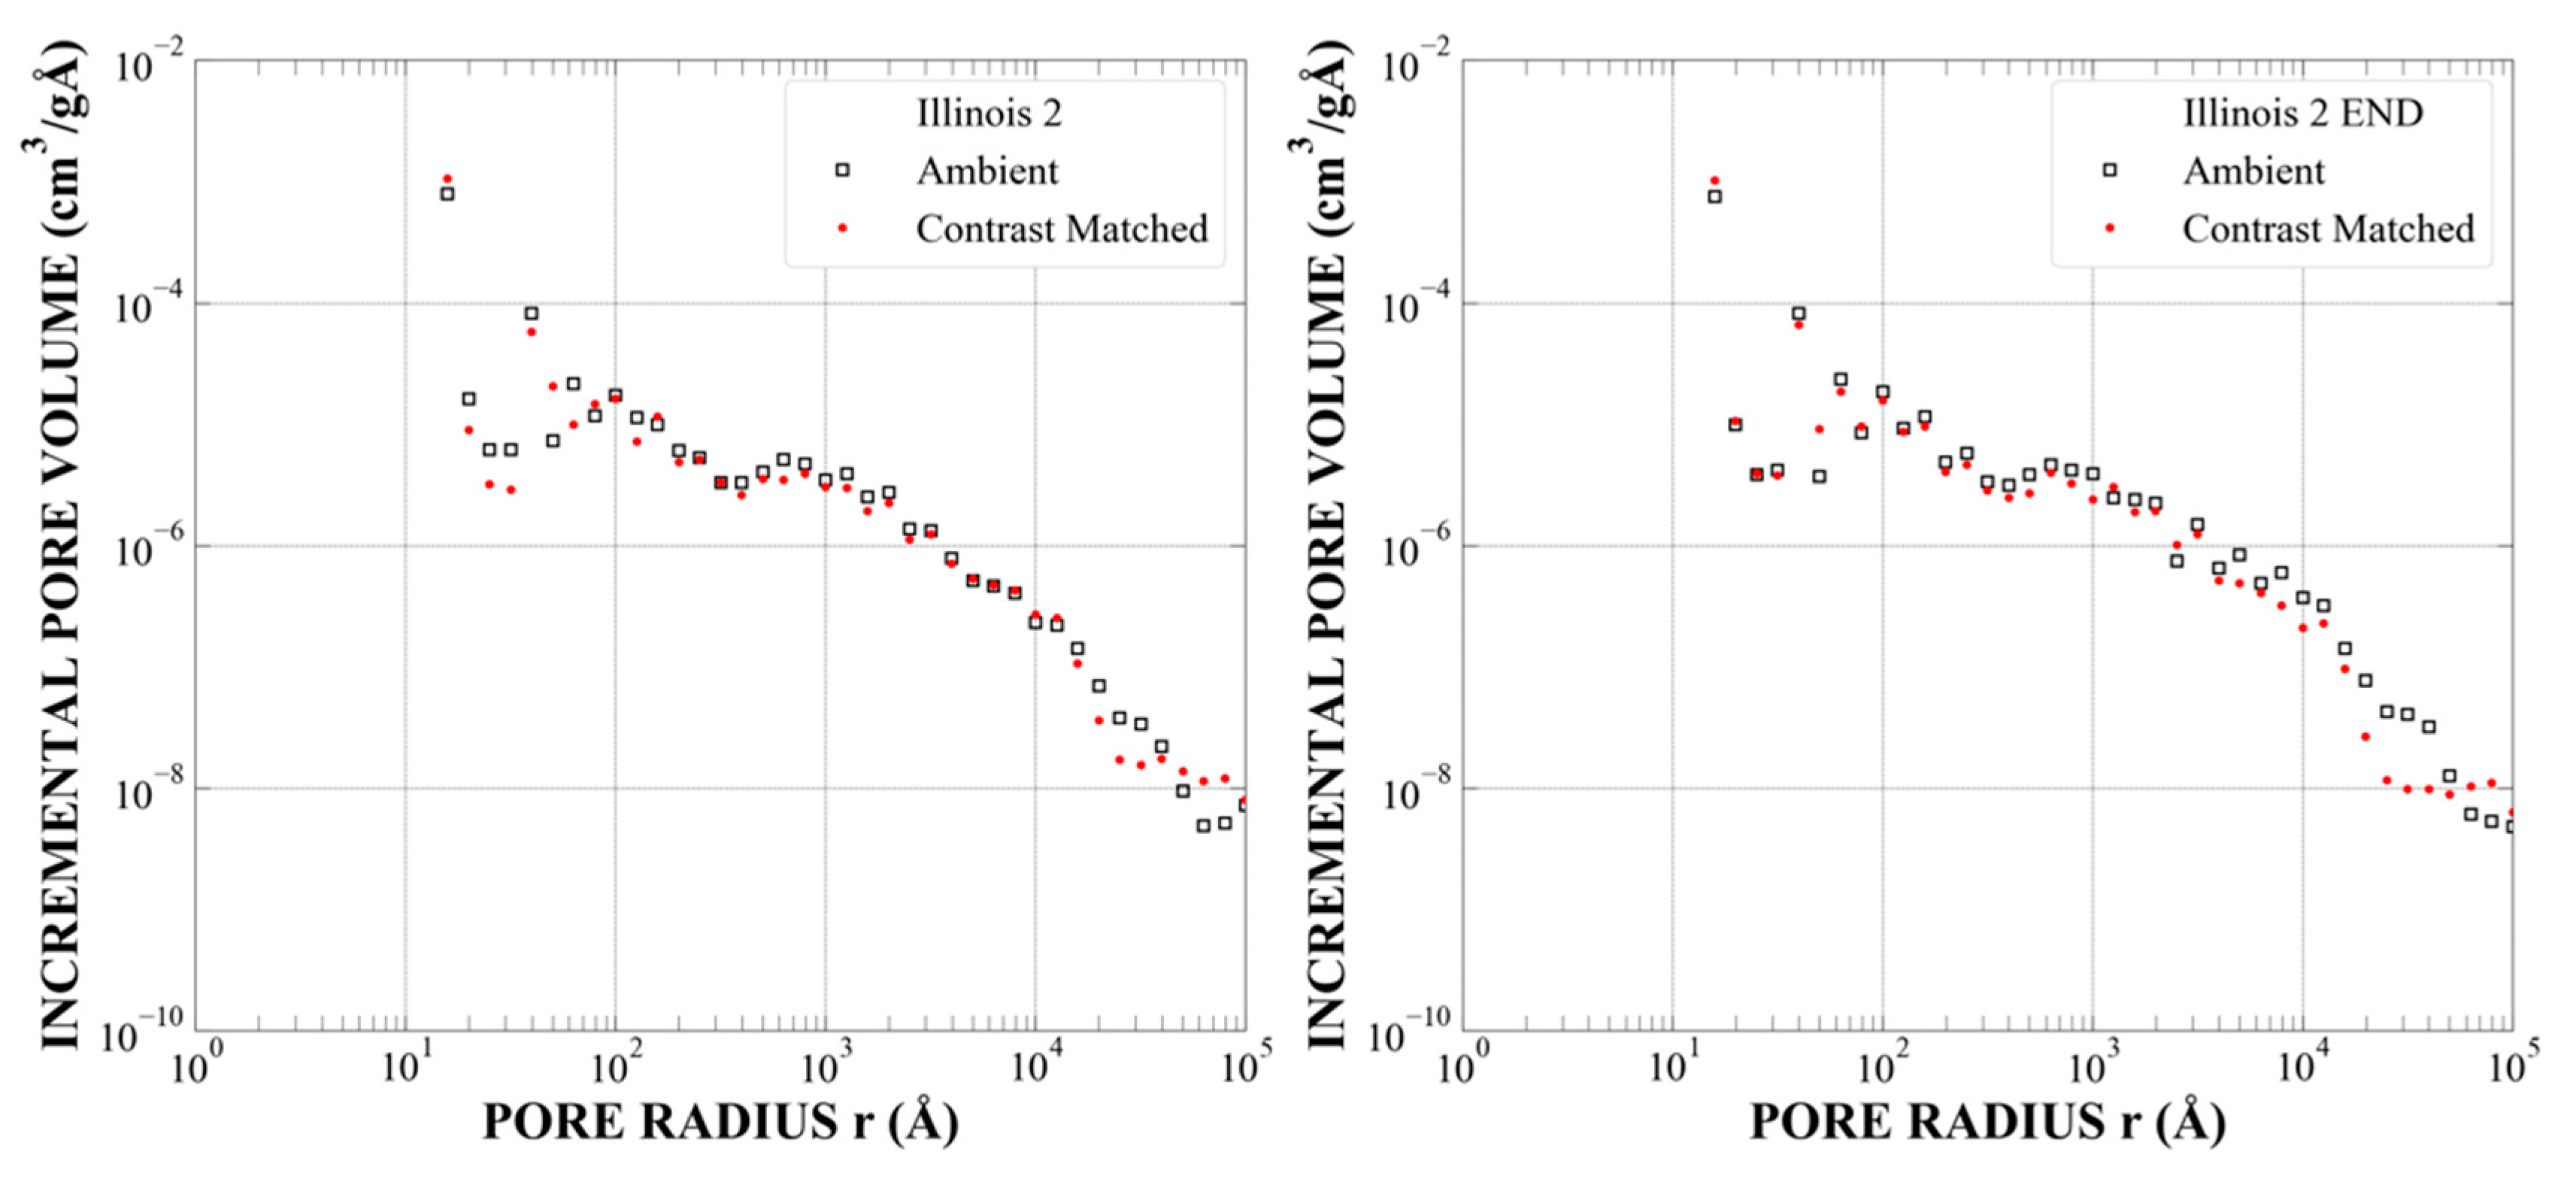
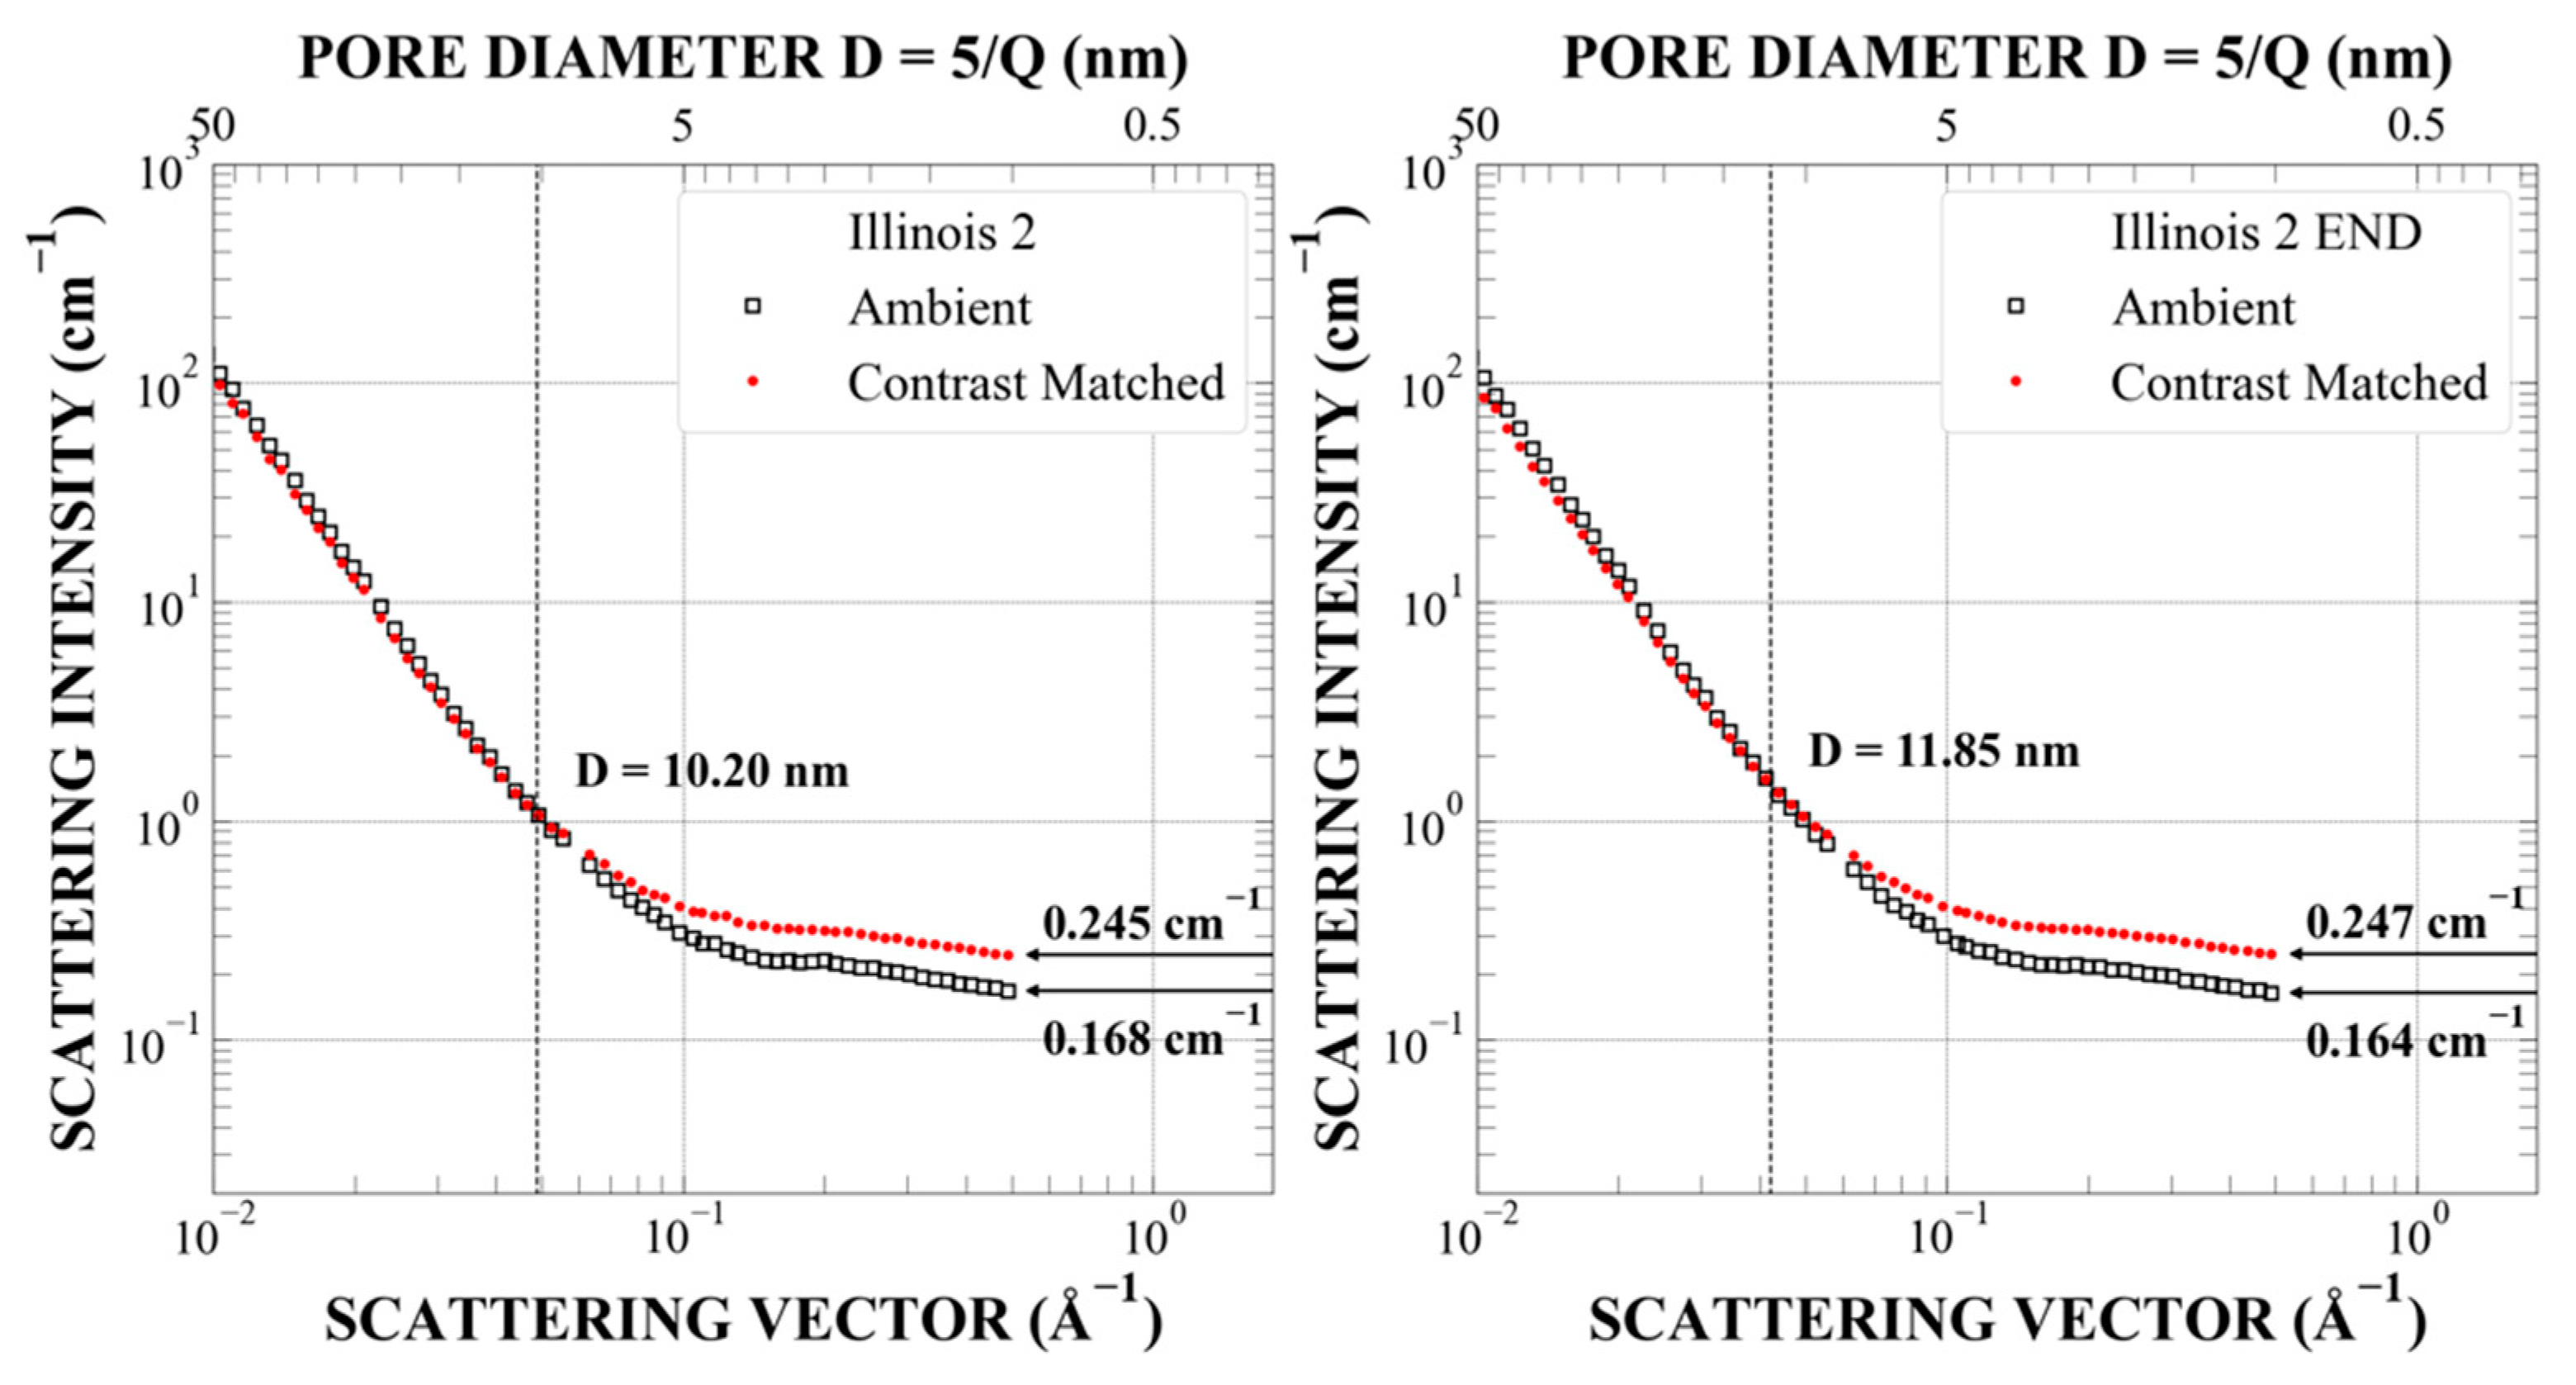
Appendix A.4. Sample Hardin-IL2 (Illinois 2), Sub-Samples L2 and L1, Outcrop, Estimated Maximal Depth ~ 4600 feet, Ro = 1.04%, TOC = 8.4%, Late-Mature

Figure A16. Combined absolutely calibrated SANS and USANS intensity values measured in a vacuum (ambient, open black squares) and at contrast-matched conditions (hydrostatic pressure of 500 bar of CD4, full red circles). (left panel)—as-obtained samples; (right panel)—after pressure cycling up to S = 28 bar (2.8 MPa). The pressure cycles (p,S) were as follows: (0,0); (500,0); (500,120); (0,120); (0,225); (500,225); (500,336); (0,336); (0,0); (500,0).
Energies 14 08438 g0a16
Figure A17. Probability density values of the pore radius distribution (f(r)) and the specific surface area of the rock–pore space interface versus probe size (SSA(R)), calculated using the Polydisperse Spheres model implemented in the PRINSAS software. Ambient—results for accessible plus inaccessible pores; contrast-matched—results for inaccessible pores only. (left panel)—before pressure cycling; (right panel)—after pressure cycling.
Energies 14 08438 g0a17
Figure A18. Incremental pore volume distribution (dV/dr per gram of rock), calculated using the Polydisperse Spheres model implemented in the PRINSAS software. Ambient—results for accessible plus inaccessible pores; contrast-matched—results for inaccessible pores only. (left panel)—before pressure cycling; (right panel)—after pressure cycling.
Energies 14 08438 g0a18
Figure A19. Fractions of all pores accessible to penetrating deuterated methane for various nominal pore diameters before (red circles) and after pressure cycling (blue circles), calculated using the Polydisperse Spheres model implemented in the PRINSAS software.
Energies 14 08438 g0a19
Figure A20. Details of the SANS ambient and contrast-matched data in the large-Q region before (left panel) and after pressure cycling (right panel).
Energies 14 08438 g0a20

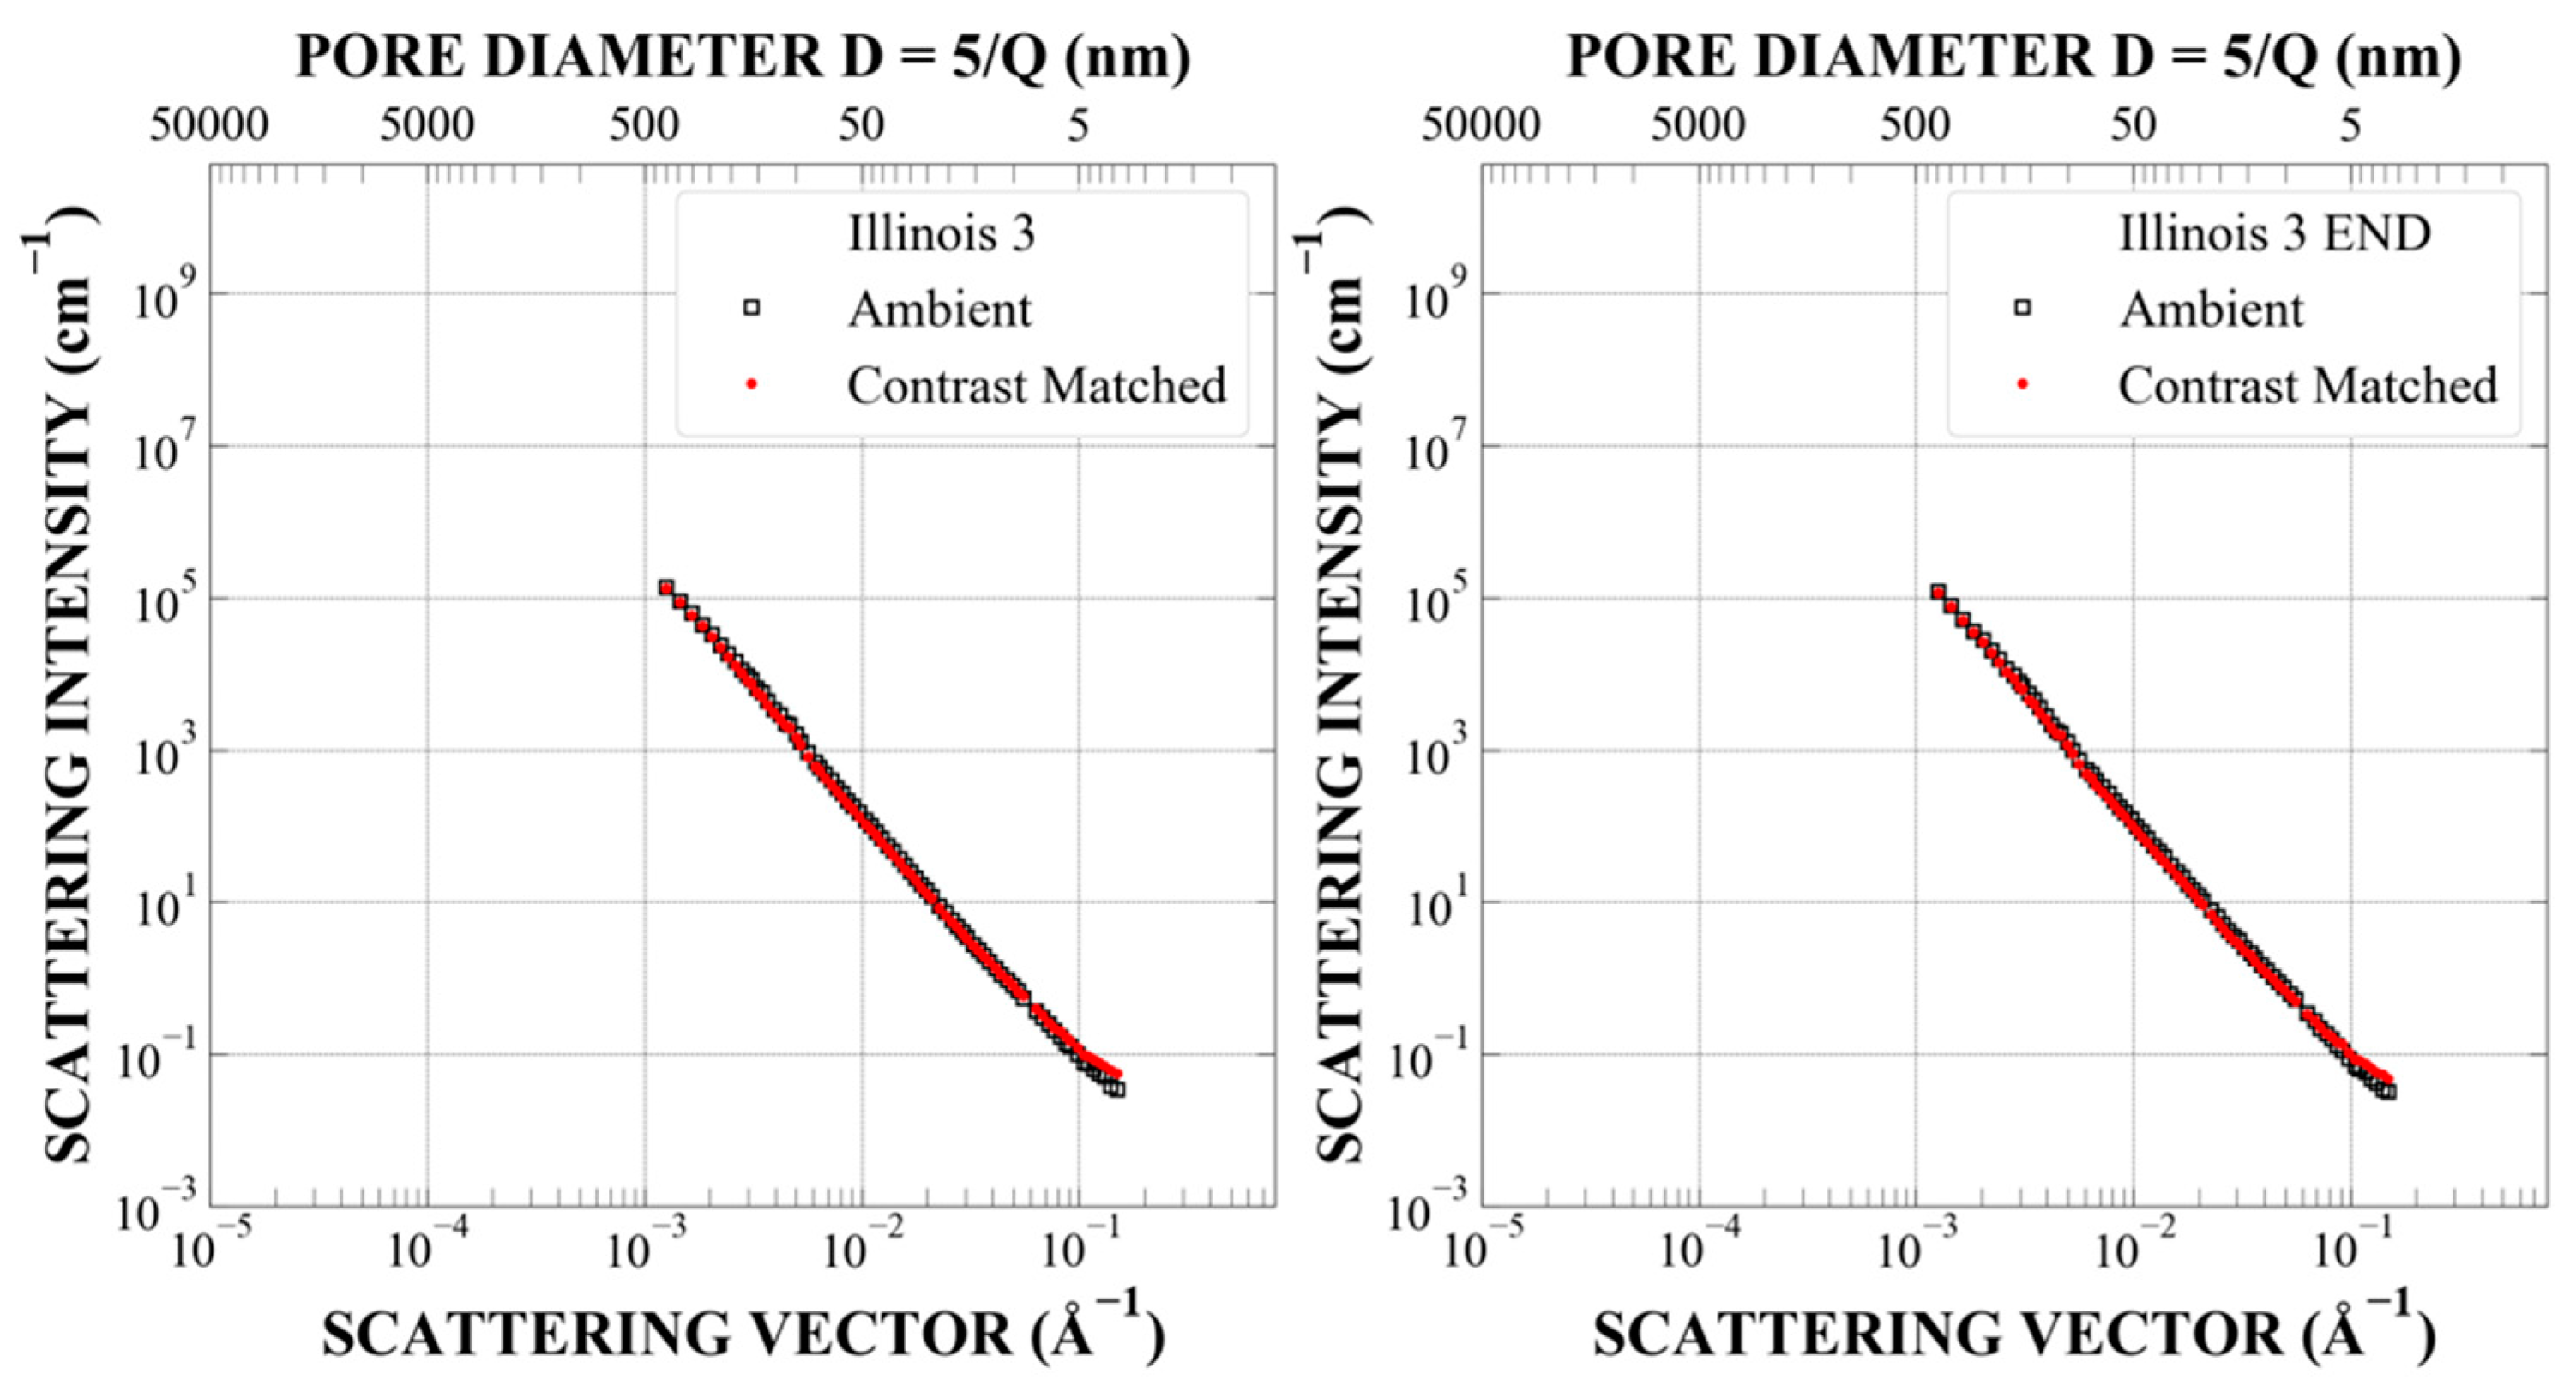
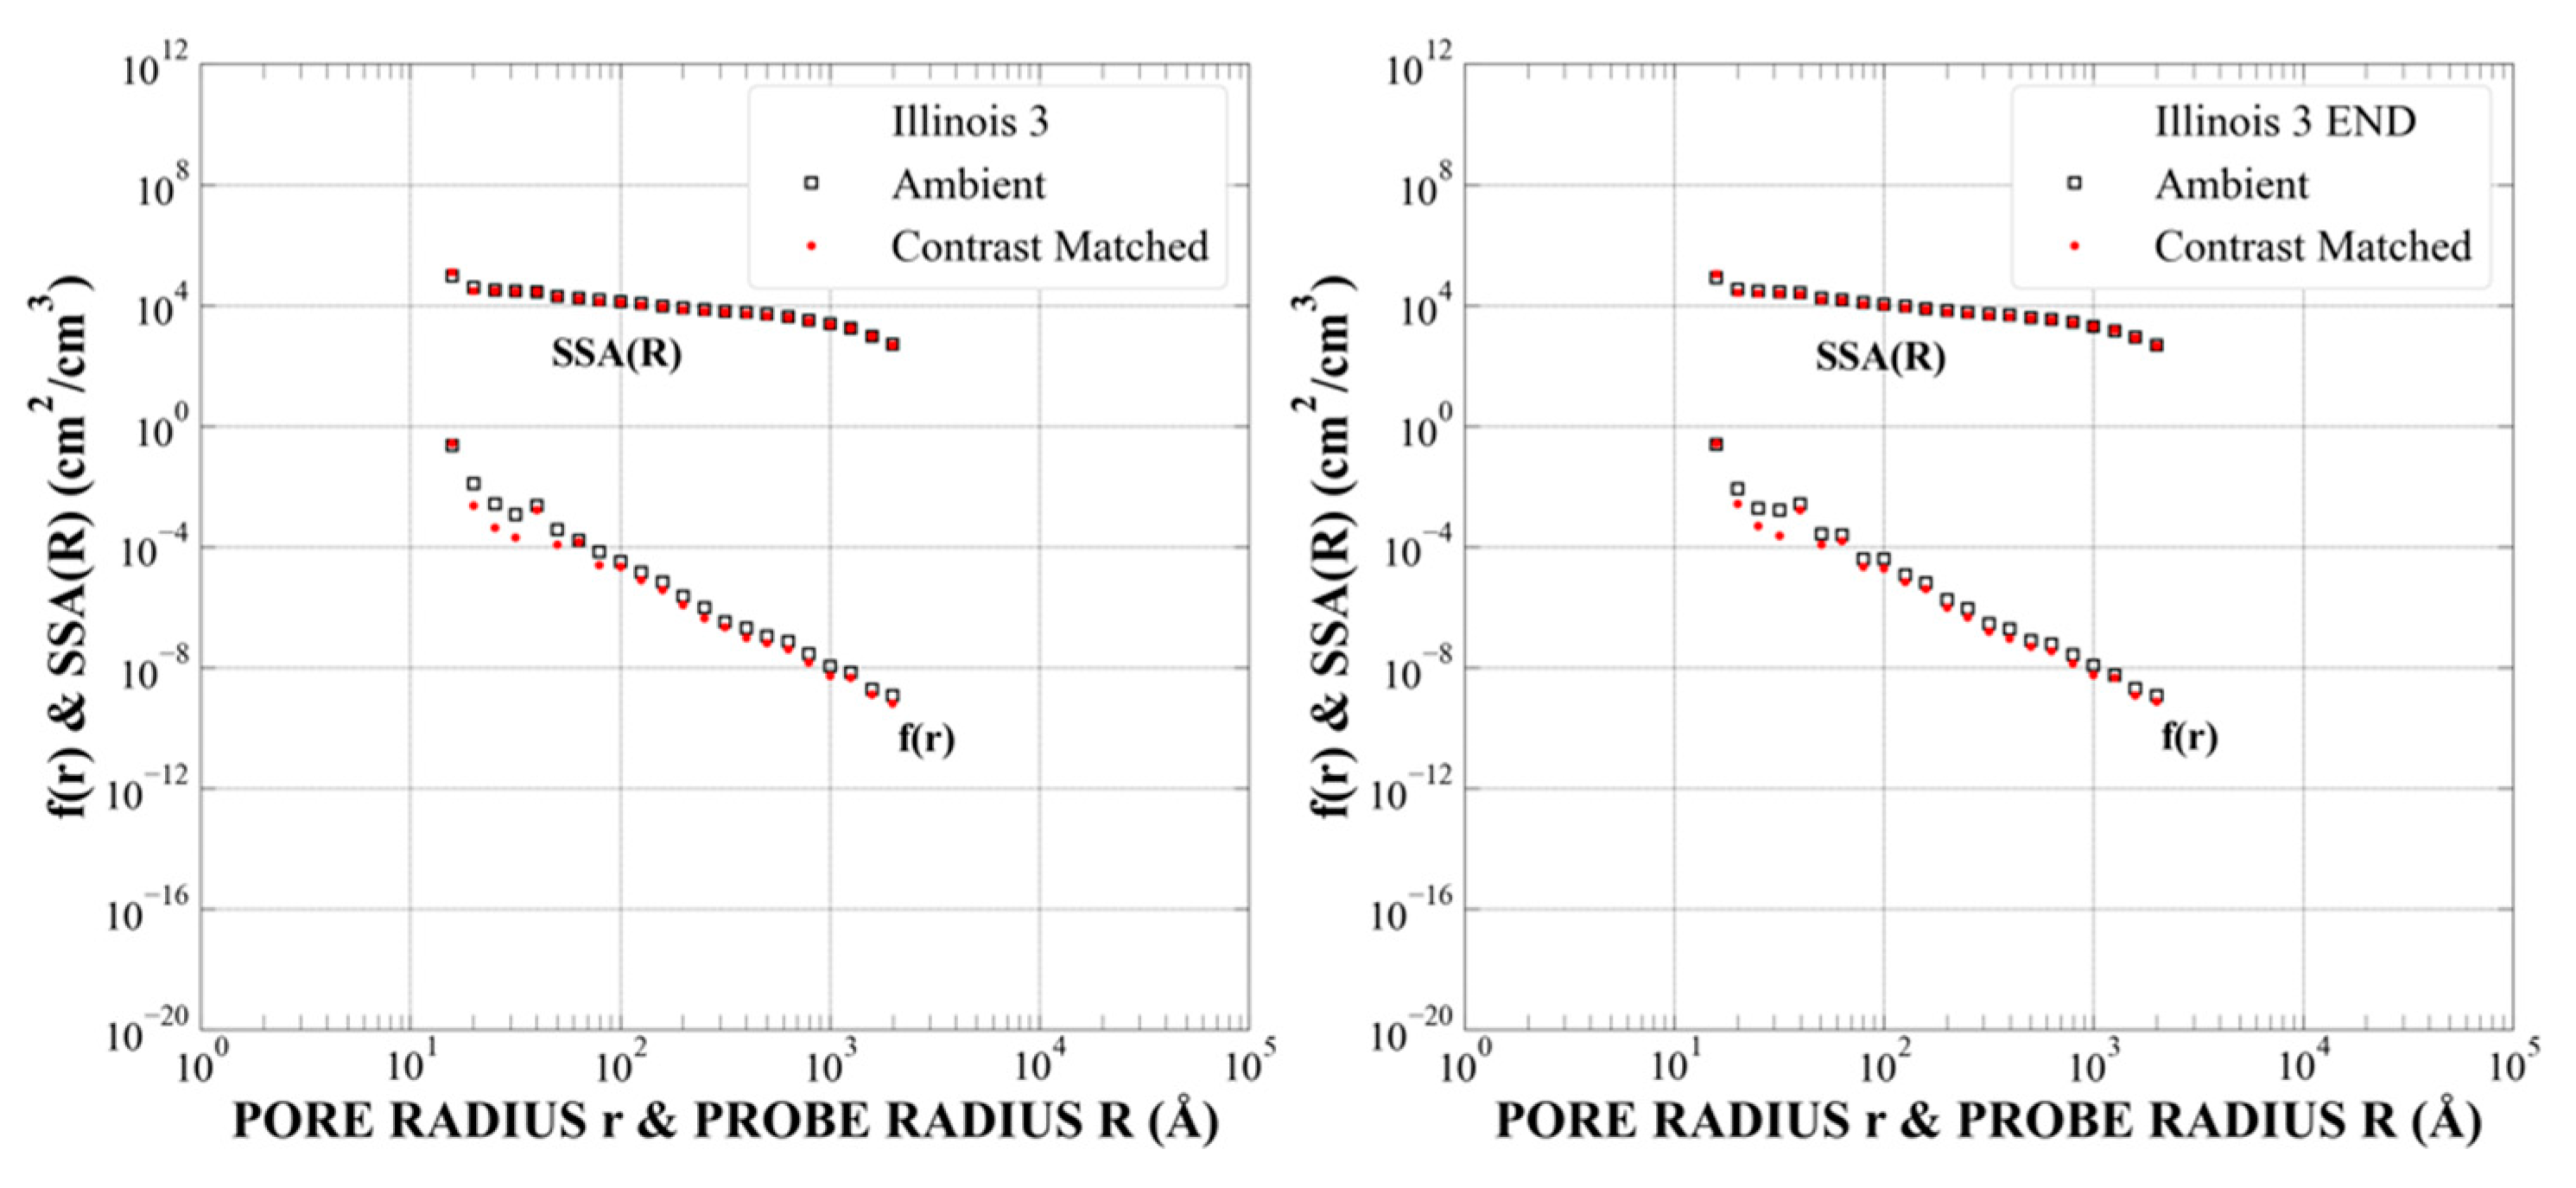
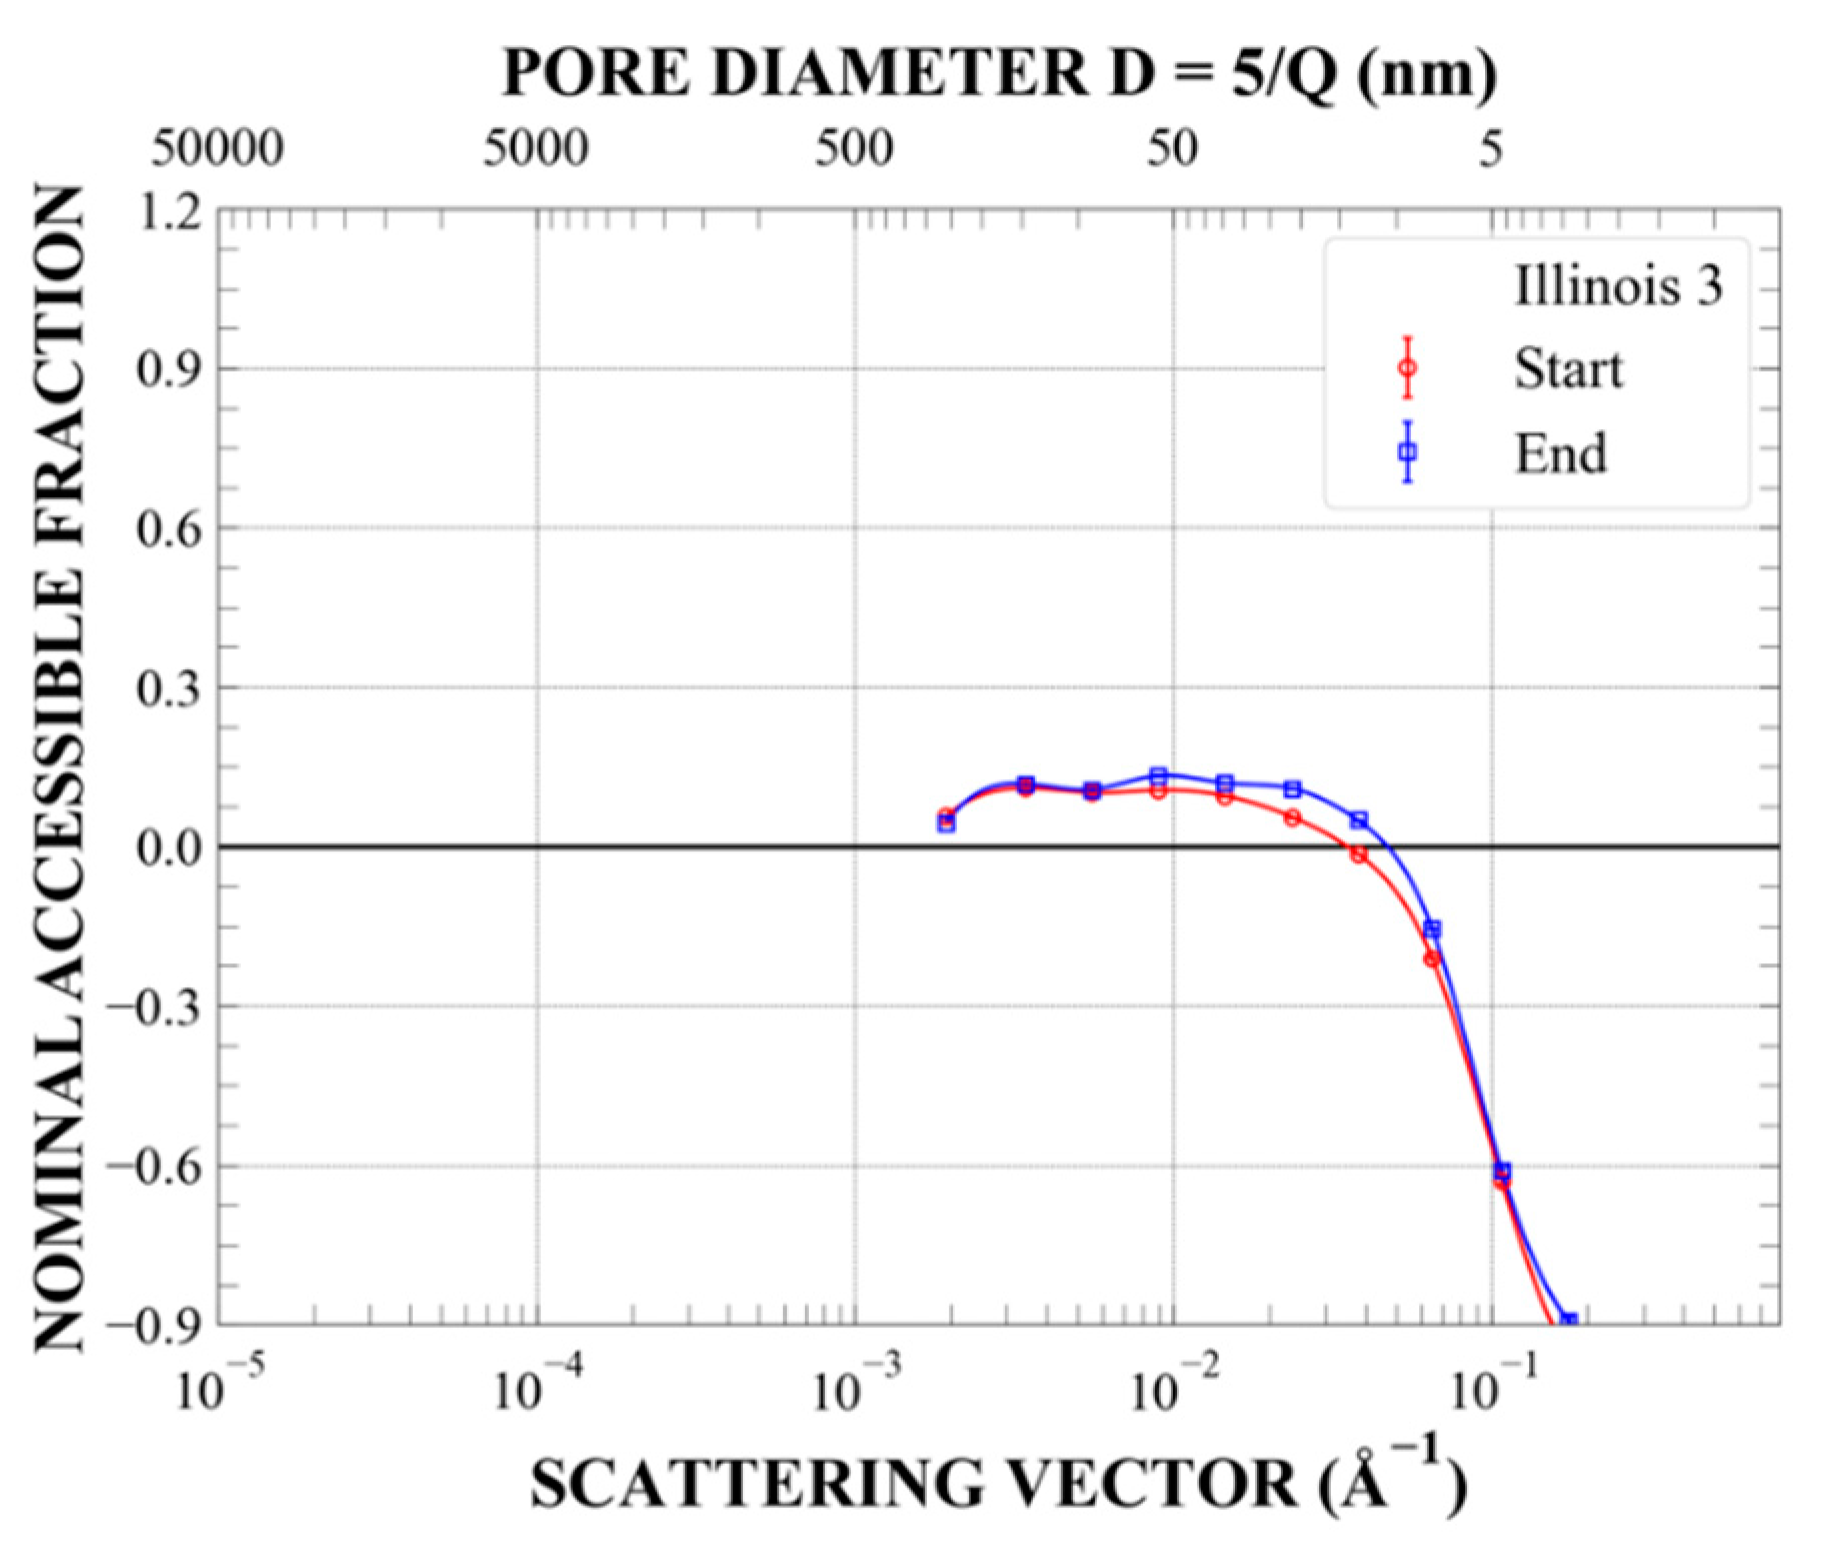
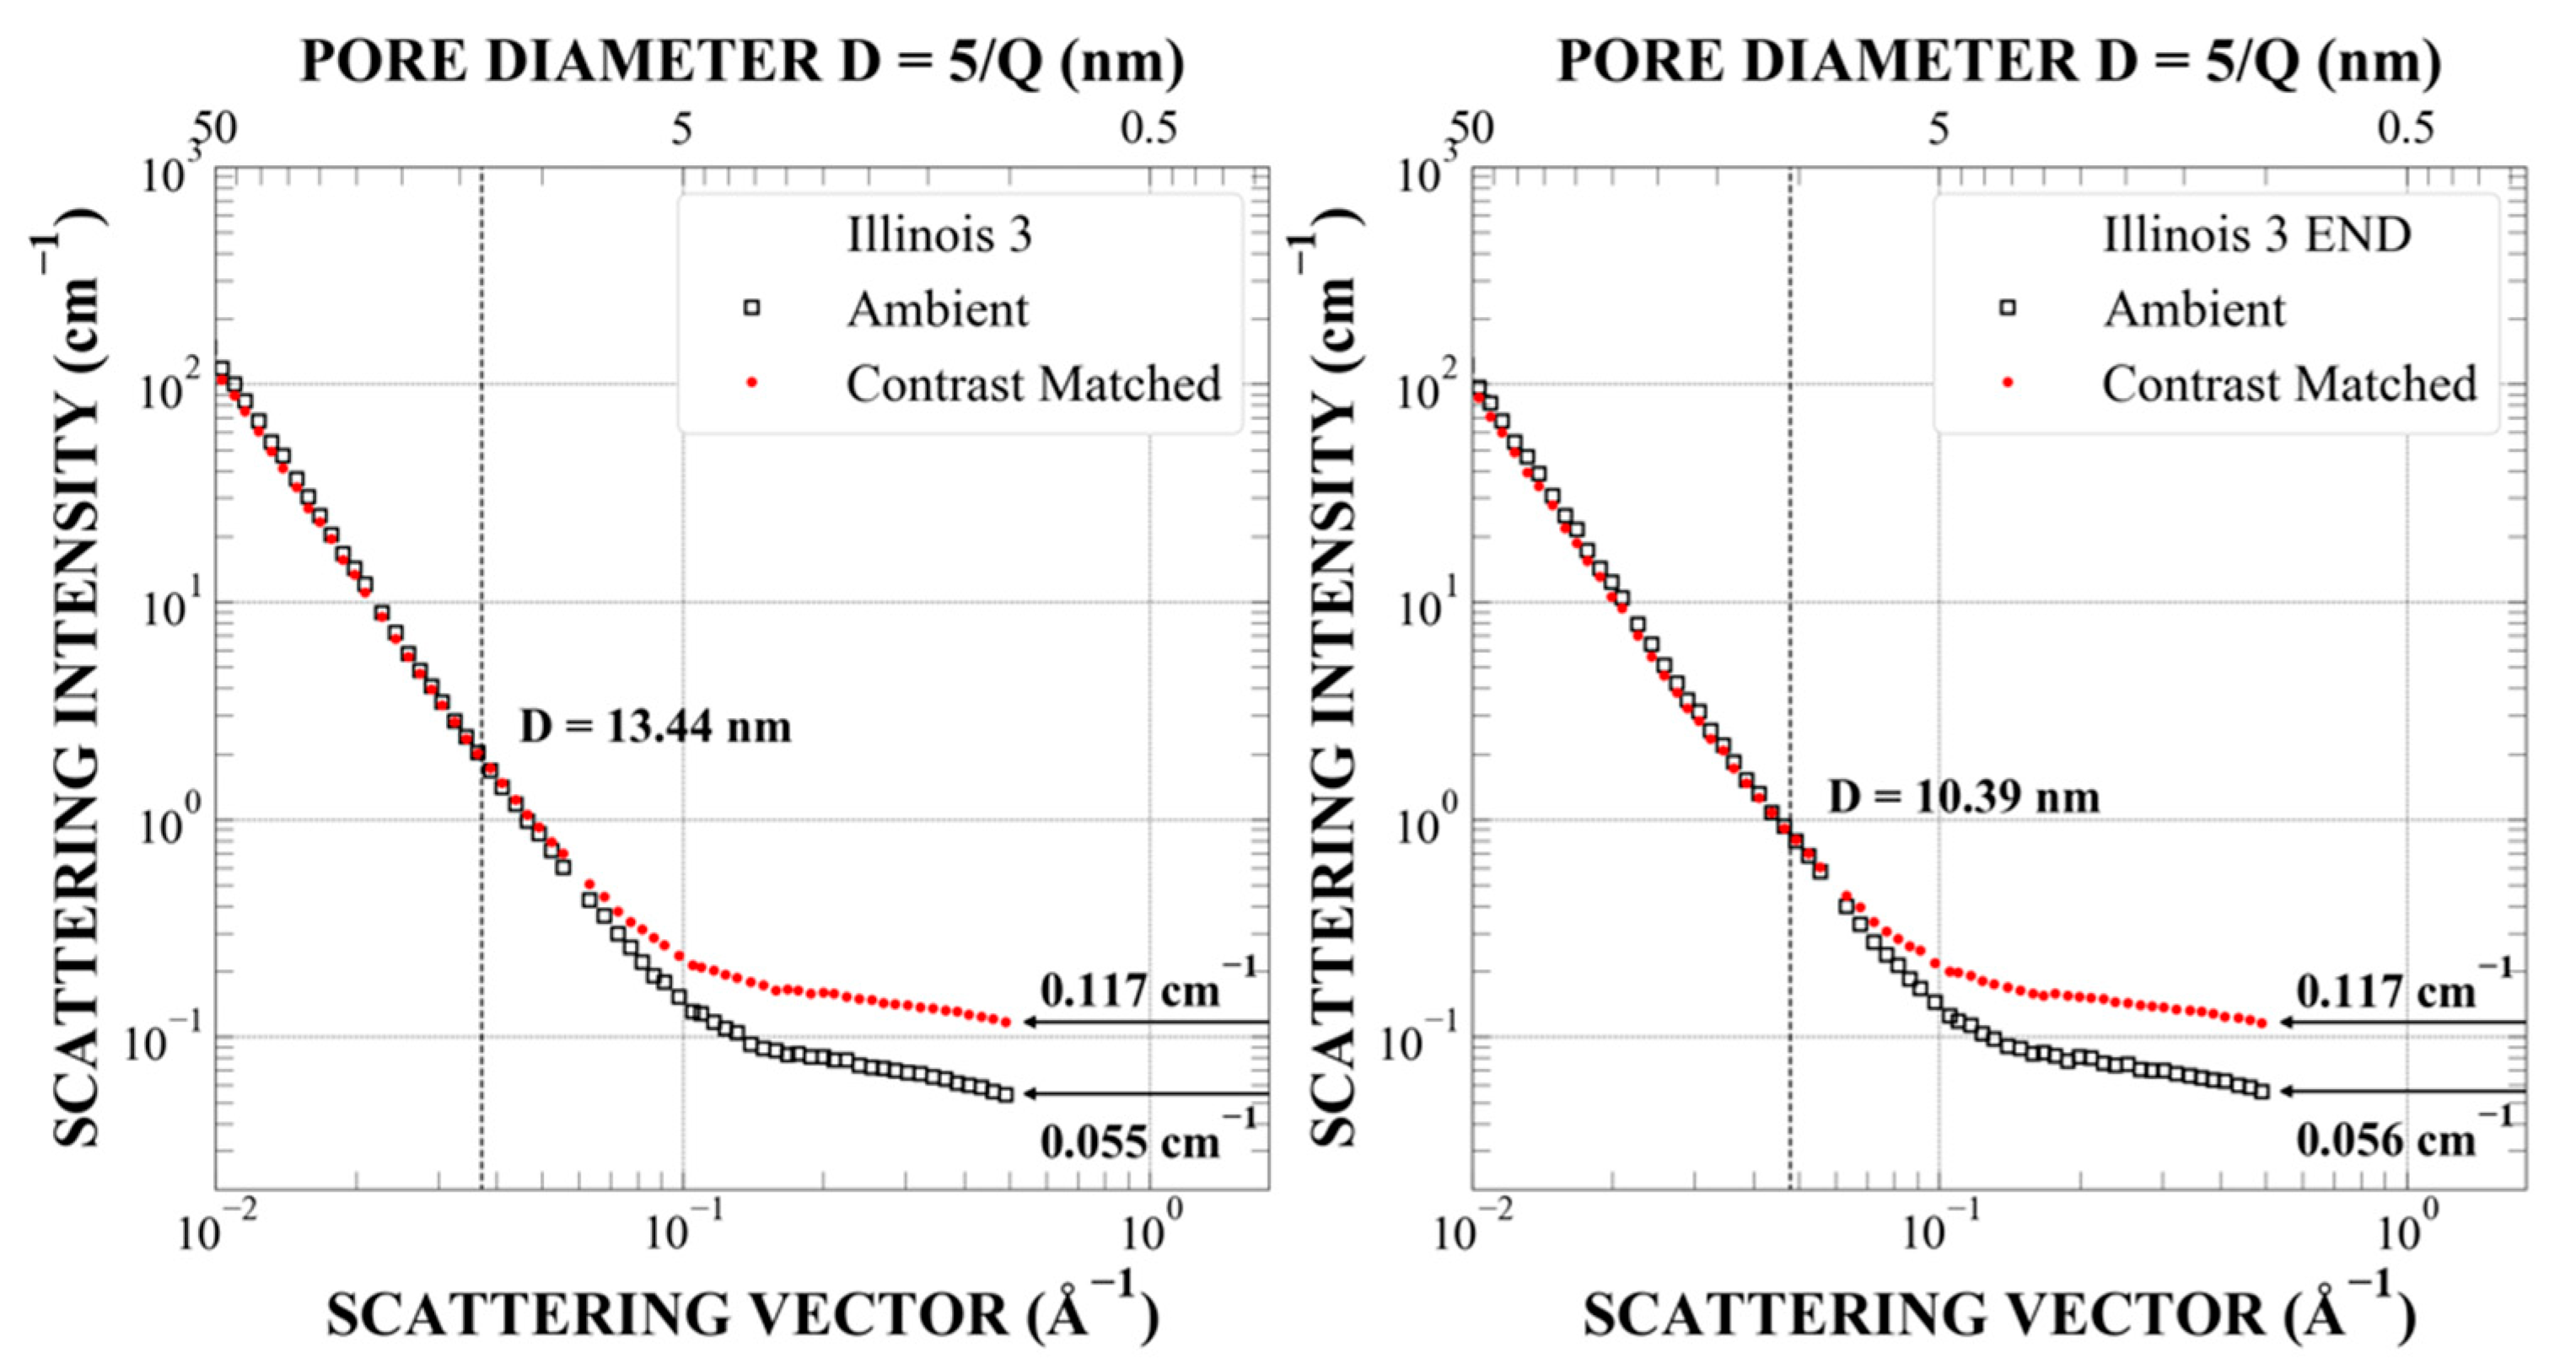
Appendix A.5. Sample Hardin-IL3 (Illinois 3), Sub-Sample L2 (SANS), Outcrop, Estimated Maximal Depth ~5400 Feet, Ro = 1.40%, TOC = 8.4%, Post-Mature

Figure A21. Combined absolutely calibrated SANS and USANS intensity values measured in a vacuum (ambient, open black squares) and at contrast-matched conditions (hydrostatic pressure of 500 bar of CD4, full red circles). (left panel)—as-obtained samples; (right panel)—after pressure cycling up to S = 28 bar (2.8 MPa). The pressure cycles (p,S) were as follows: (0,0); (500,0); (500,90); (0,90); (0,225); (500,225); (500,336); (0,336); (0,0); (500,0).
Energies 14 08438 g0a21
Figure A22. Probability density of the pore radius distribution (f(r)) and the specific surface area of the rock–pore space interface versus probe size (SSA(R)), calculated using the Polydisperse Spheres model implemented in the PRINSAS software. Ambient—results for accessible plus inaccessible pores; contrast-matched—results for inaccessible pores only. (left panel)—before pressure cycling; (right panel)—after pressure cycling.
Energies 14 08438 g0a22
Figure A23. Incremental pore volume distribution (dV/dr per gram of rock), calculated using the Polydisperse Spheres model implemented in the PRINSAS software. Ambient—results for accessible plus inaccessible pores; contrast-matched—results for inaccessible pores only. (left panel)—before pressure cycling; (right panel)—after pressure cycling.
Energies 14 08438 g0a23
Figure A24. Fractions of all pores accessible to penetrating deuterated methane for various nominal pore diameters before (red circles) and after pressure cycling (blue circles), calculated using the Polydisperse Spheres model implemented in the PRINSAS software.
Energies 14 08438 g0a24
Figure A25. Details of the SANS ambient and contrast-matched data in the large-Q region before (left panel) and after pressure cycling (right panel).
Energies 14 08438 g0a25

Appendix A.6. Sample Marcellus_7048, Sub-Samples L6 and L4, Depth 7084 Feet, Ro = 2.5%, TOC = 3.4%, Post-Mature

Figure A26. Combined absolutely calibrated SANS and USANS intensity values measured in a vacuum (ambient, open black squares) and at contrast-matched conditions (hydrostatic pressure of 500 bar of CD4, full red circles). (left panel)—as-obtained samples; (right panel)—after pressure cycling up to S = 28 bar (2.8 MPa). The pressure cycles (p,S) were as follows: (0,0); (500,0); (500,370); (0,370); (0,740); (500,740); (500,1000); (0,1000); (0,0); (500,0).
Energies 14 08438 g0a26
Figure A27. Probability density values of the pore radius distribution (f(r)) and the specific surface area of the rock–pore space interface versus probe size (SSA(R)), calculated using the Polydisperse Spheres model implemented in the PRINSAS software. Ambient—results for accessible plus inaccessible pores; contrast-matched—results for inaccessible pores only. (left panel)—before pressure cycling; (right panel)—after pressure cycling.
Energies 14 08438 g0a27
Figure A28. Incremental pore volume distribution (dV/dr per gram of rock), calculated using the Polydisperse Spheres model implemented in the PRINSAS software. Ambient—results for accessible plus inaccessible pores; contrast-matched—results for inaccessible pores only. (left panel)—before pressure cycling; (right panel)—after pressure cycling.
Energies 14 08438 g0a28
Figure A29. Fractions of all pores accessible to penetrating deuterated methane for various nominal pore diameters before (red circles) and after pressure cycling (blue circles), calculated using the Polydisperse Spheres model implemented in the PRINSAS software.
Energies 14 08438 g0a29
Figure A30. Details of the SANS ambient and contrast-matched data in the large-Q region before (left panel) and after pressure cycling (right panel).
Energies 14 08438 g0a30

Appendix A.7. Total, Accessible and Inaccessible Porosity for all Samples Calculated from Porod Invariant

Table A1. Total, accessible and inaccessible apparent porosity for New Albany Shale Formation samples, determined from I(Q) data measured in a vacuum and in {CM} conditions (p = 500 bar of CD4), calculated using the Porod Invariant method. Helium porosity values (measured by Core Lab) are listed for comparison. Annotation “end” indicates values measured after pressure cycling (Table 2). The “accessible before” and “accessible after” entries indicate values of accessible porosity before and after pressure cycling. Symbol p indicates pressure of deuterated methane CD4 (hydrostatic) and S indicates uniaxial stress exerted on the sample, both in bar (1 bar = 0.1 MPa). For sample Hardin-IL3*, only SANS was measured. Results for sample Marcellus_7084 (M_7084) were calculated using SANS/USANS data from Blach et al. (2021).
SampleRo (%)Max StressS (Bar)Core Lab
Porosity
(%)
SANS + USANS Total Porosity
at Indicated (p,S) Values
(%)
(0,0)(500,0)(0,0) End(500,0) EndAccessible
before
Accessible
after
SDH-3080.5284.18.8 ± 0.18.8 ± 0.210.7 ± 0.110.0 ± 0.20.04 ± 0.20.71 ± 0.2
McAtee-27980.73135.9711.8 ± 0.157.2 ± 0.2511.4 ± 0.216.0 ± 0.24.6 ± 0.35.4 ± 0.3
Gibson-39970.848505.1515.5 ± 0.212.7 ± 0.311.8 ± 0.210.9 ± 0.32.9 ± 0.41.0 ± 0.4
Hardin-IL21.043365.96.07 ± 0.055.53 ± 0.066.18 ± 0.044.91 ± 0.060.55 ± 0.071.27 ± 0.07
Hardin-IL3*1.43362.19n/an/an/an/an/an/a
Mar_70842.510006.886.2 ± 0.36.8 ± 0.65.7 ± 0.35.9 ± 0.5−0.6 ± 0.7−0.15 ± 0.6
Figure A31. Accessible porosity (open squares) and inaccessible porosity (full circles) values for the NAS samples and Marcellus_7084 sample, calculated using the Porod Invariant method from I(Q) values in the Q-range 3 × 10⁻⁵–0.02 Å−1 (outside of the large-Q region potentially affected by the increased density of CD4 confined in nanopores). (left)—before pressure cycling; (right)—after pressure cycling.
Energies 14 08438 g0a31
Figure A32. Combined SANS–USANS scattering profiles acquired at ambient conditions.
Energies 14 08438 g0a32
Figure A33. Combined SANS–USANS scattering profiles acquired at contrast matching pressure of CD4 (500 bar).
Energies 14 08438 g0a33

References

  1. Wang, Y.; Qin, Y.; Zhang, R.; He, L.; Anovitz, L.M.; Bleuel, M.; Mildner, D.F.R.; Liu, S.; Zhu, Y. Evaluation of nanoscale accessible pore structures for improved prediction of gas production potential in Chinese marine shales. Energy Fuels 2018, 32, 12447–12461. [Google Scholar] [CrossRef]
  2. Zhang, R.; Liu, S.; He, L.; Blach, T.P.; Wang, Y. Characterizing anisotropic pore structure and its impact on gas storage and transport in coalbed methane and shale gas reservoirs. Energy Fuels 2020, 34, 3161–3172. [Google Scholar] [CrossRef]
  3. Radlinski, A.P.; Blach, T.; Vu, P.; Ji, Y.; de Campo, L.; Gilbert, E.P.; Mastalerz, M. Pore accessibility and trapping of methane in Marcellus shale. Int. J. Coal Geol. 2021, 248, 103850. [Google Scholar] [CrossRef]
  4. Radlinski, A.P. Small Angle Neutron Scattering and the Microstructure of Rocks. In Neutron Scattering in Earth Sciences, Reviews in Mineralogy and Geochemistry; Wenk, H.-R., Ed.; The Mineralogical Society of America: Chantilly, VA, USA, 2006; Volume 63, pp. 363–397. [Google Scholar]
  5. Li, B.; Tan, X.; Wang, F.; Lian, P.; Gao, W.; Li, Y. Fracture and vug characterization and carbonate rock type automatic classification using X-ray CT images. J. Pet. Sci. Eng. 2017, 153, 88–96. [Google Scholar] [CrossRef]
  6. Schmitt Rahner, M.; Halisch, M.; Peres Fernandes, C.; Weller, A.; Santiago dos Santos, V.S. Fractal dimensions of pore spaces in unconventional reservoir rocks using X-ray nano- and micro-computed tomography. J. Nat. Gas Sci. Eng. 2018, 55, 298–311. [Google Scholar] [CrossRef]
  7. Tembely, M.; AlSumaiti, A.M.; Alameri, W.S. Machine and deep learning for estimating the permeability of complex carbonate rock from X-ray micro-computed tomography. Energy Rep. 2021, 7, 1460–1472. [Google Scholar] [CrossRef]
  8. Martínez-Martínez, J.; Fusi, N.; Galiana-Merino, J.J.; Benavente, D.; Crosta, G.B. Ultrasonic and X-ray computed tomography characterization of progressive fracture damage in low-porous carbonate rocks. Eng. Geol. 2016, 200, 47–57. [Google Scholar] [CrossRef] [Green Version]
  9. Martyushev, D.A.; Yurikov, A. Evaluation of opening of fractures in the Logovskoye carbonate reservoir, Perm Krai, Russia. Pet. Res. 2021, 6, 137–143. [Google Scholar] [CrossRef]
  10. Bahadur, J.; Radlinski, A.; Melnichenko, Y.B.; Mastalerz, M.; Schimmelmann, A. Small-angle and ultrasmall-angle neutron scattering (SANS/USANS) study of the New Albany Shale: A treatise on microporosity. Energy Fuels 2015, 29, 567–576. [Google Scholar] [CrossRef] [Green Version]
  11. Mastalerz, M.; He, L.; Melnichenko, Y.; Rupp, J. Porosity of coal and shale: Insights from gas adsorption and SANS/USANS techniques. Energy Fuels 2012, 26, 5109–5120. [Google Scholar] [CrossRef]
  12. Blach, T.; Radlinski, A.P.; Vu, P.; Ji, Y.; de Campo, L.; Gilbert, E.P.; Regenauer-Lieb, K.; Mastalerz, M. Deformation of pores in response to uniaxial stress in Marcellus shale: Implications for gas recovery. Int. J. Coal Geol. 2021, 248, 103867. [Google Scholar] [CrossRef]
  13. Melnichenko, Y.B. Small-Angle Scattering from Confined and Interfacial Fluids. In Applications to Energy Storage and Environmental Science; Springer International Publishing: Cham, Switzerland, 2016; p. 314. [Google Scholar]
  14. Hasenmueller, N.R.; Comer, J.B. (Eds.) Gas Potential of the New Albany Shale (Devonian and Mississippian) in the Illinois Basin, Final Report: Gas Research Institute 92-0391/IBS2; Illinois: Chicago, IL, USA, 1994; p. 83. [Google Scholar]
  15. Lis, G.P.; Mastalerz, M.; Schimmelmann, A.; Lewan, M.; Stankiewicz, B.A. FTIR absorption indices for thermal maturity in comparison with vitrinite reflectance Ro in type-II kerogens from Devonian black shales. Org. Geochem. 2005, 36, 1533–1552. [Google Scholar] [CrossRef]
  16. Strąpoć, D.; Mastalerz, M.; Schimmelmann, A.; Drobniak, A.; Hasenmueller, N.R. Geochemical constraints on the origin and volume of gas of the New Albany Shale (Devonian–Mississippian) in the eastern part of the Illinois Basin. AAPG Bull. 2010, 94, 1713–1740. [Google Scholar] [CrossRef]
  17. Cluff, R.M.; Dickerson, D.R. Natural gas potential of the New Albany Shale Group (Devonian-Mississippian) in southeastern Illinois. In Society of Petroleum Engineers Technical Paper 8924, Proceedings of the 1980 Society of Petroleum Engineers/Department of Energy, Tulsa, OK, USA, 18–19 May 1980; Society of Petroleum Engineers: Richardson, TX, USA, 1982; pp. 21–25. [Google Scholar]
  18. Lewan, M.D.; Henry, M.E.; Higley, D.K.; Pittman, J.K. Material-balance assessment of the New Albany-Chesterian petroleum system of the Illinois Basin. Am. Assoc. Pet. Geol. Bull. 2002, 86, 745–777. [Google Scholar]
  19. Mastalerz, M.; Schimmelmann, A.; Drobniak, A.; Chen, Y. Porosity of Devonian/Mississippian New Albany Shale across a maturation gradient—Insights from organic petrology, gas adsorption, and mercury intrusion. AAPG Bull. 2013, 97, 1621–1643. [Google Scholar] [CrossRef]
  20. Mastalerz, M.; Drobniak, A.; Hower, J.C. Controls on reservoir properties in organic-matter-rich shales: Insights from MICP analysis. J. Pet. Sci. Eng. 2021, 196, 107775. [Google Scholar] [CrossRef]
  21. Hamilton-Smith, T.; Hasenmueller, N.R.; Boberg, W.S.; Smidchens, Z.; Frankie, W.T. Gas Production. In Gas Potential of the New Albany Shale (Devonian and Mississippian) in the Illinois Basin; GRI-00/0068; Illinois Basin Studies; Hasenmueller, N.R., Comer, J.B., Eds.; Gas Research Institute: Chicago, IL, USA, 1994; Volume 2, pp. 23–40. [Google Scholar]
  22. Wei, L.; Mastalerz, M.; Schimmelmann, A.; Chen, L. Influence of Soxhlet-extractable bitumen and oil on porosity in thermally maturing organic-rich shales. Int. J. Coal Geol. 2014, 132, 38–50. [Google Scholar] [CrossRef] [Green Version]
  23. Melnichenko, Y.B.; He, L.; Sakurovs, R.; Kholodenko, A.L.; Blach, T.; Mastalerz, M.; Radlinski, A.P.; Cheng, G.; Mildner, D.F.R. Accessibility of pores in coal to methane and carbon dioxide. Fuel 2012, 91, 200–208. [Google Scholar] [CrossRef]
  24. Ruppert, L.; Sakurovs, R.; Melnichenko, Y.B.; Blach, T.P.; He, L.; Mildner, D.F.R. A USANS/SANS study of the accessibility of pores in the Barnett shale to methane and water. Energy Fuels 2013, 27, 772–779. [Google Scholar] [CrossRef]
  25. Bahadur, J.; Medina, C.R.; He, L.; Melnichenko, J.B.; Rupp, J.A.; Blach, T.P.; Mildner, D.F.R. Determination of closed porosity in rocks by small-angle neutron scattering. J. Appl. Crystallogr. 2016, 49, 2021–2030. [Google Scholar] [CrossRef]
  26. Blach, T.; Radlinski, A.P.; Edwards, D.S.; Boreham, C.; Rehm, C.; de Campo, L.; Gilbert, E.P. Fingerprint of hydrocarbon generation in the southern Georgina Basin, Australia, revealed by small angle neutron scattering. Int. J. Coal Geol. 2018, 186, 135–144. [Google Scholar] [CrossRef]
  27. Bahadur, J.; Ruppert, L.F.; Pipich, V.; Sakurovs, R.; Melnichenko, Y.B. Porosity of the Marcellus shale: A contrast matching small-angle neutron scattering study. Int. J. Coal Geol. 2018, 188, 156–164. [Google Scholar] [CrossRef]
  28. Neil, C.W.; Mehana, M.; Hjelm, R.P.; Hawley, M.E.; Watkins, E.B.; Mao, Y.; Viswanathan, H.; Kang, Q.; Xu, H. Reduced methane recovery at high pressure due to methane trapping in shale nanopores. Commun. Earth Environ. 2020, 1, 49. [Google Scholar] [CrossRef]
  29. Sakurovs, R.; Koval, L.; Grigore, M.; Sokolova, A.; de Campo, L.; Rehm, C. Nanostructure of cokes. Int. J. Coal Geol. 2018, 188, 112–120. [Google Scholar] [CrossRef]
  30. Radlinski, A.P.; Busbridge, T.L.; MacA Gray, A.; Blach, T.P.; Cheng, G.; Melnichenko, Y.B.; Cookson, D.J.; Mastalerz, M.; Esterle, J. Dynamic micromapping of CO2 sorption in coal. Langmuir 2009, 25, 2385–2389. [Google Scholar] [CrossRef] [PubMed]
  31. Radlinski, A.P.; Congo, T.L.; MacA Gray, A.; Blach, T.P.; Cookson, D.J. Small angle X-ray scattering mapping and kinetics study of sub-critical CO2 sorption by two Australian coals. Int. J. Coal Geol. 2009, 77, 80–89. [Google Scholar] [CrossRef]
  32. Radlinski, A.P.; Boreham, C.J.; Lindner, P.; Randl, O.G.; Hinde, A.L.; Hope, J.M. Small angle neutron scattering signature of oil generation in artificially and naturally matured hydrocarbon source rocks. Org. Geochem. 2000, 31, 1–14. [Google Scholar] [CrossRef]
  33. Hinde, A.L. PRINSAS—A Windows-based computer program for the processing and interpretation of small-angle scattering data tailored to the analysis of sedimentary rocks. J. Appl. Crystallogr. 2004, 37, 1020–1024. [Google Scholar] [CrossRef] [Green Version]
  34. Espinat, D. Application des techniques de diffusion de la lumière, des rayons X et des neutrons à l’étude des systèmes colloïdaux. Rev. De L’institut Français Du Pétrole 1990, 45, 131. [Google Scholar]
  35. Liu, S.; Zhang, R. Anisotropic pore structure in shale and gas injection-induced nanopore alternation: A small angle neutron scattering study. Int. J. Coal Geol. 1990, 219, 103384. [Google Scholar] [CrossRef]
  36. Radlinski, A.P.; Mastalerz, M.; Hinde, A.L.; Hainbuchner, M.; Rauch, H.; Baron, M.; Lin, J.S.; Fan, L.; Thiyagarajan, P. Application of SAXS and SANS in evaluation of porosity, pore size distribution and surface area of coal. Int. J. Coal Geol. 2004, 59, 245–271. [Google Scholar] [CrossRef]
  37. Gu, X.; Mildner, D.F.R. Determination of porosity in anisotropic fractal systems by neutron scattering. J. Appl. Crystallogr. 2018, 51, 175–184. [Google Scholar] [CrossRef] [Green Version]
  38. Wood, K.; Mata, J.P.; Garvey, C.J.; Wu, C.-M.; Hamilton, W.A.; Abbeywick, P.; Bartlett, D.; Bartsch, F.; Baxter, P.; Booth, N.; et al. QUOKKA, the pinhole small-angle neutron scattering instrument at the OPAL research reactor, Australia: Design, performance, operation and scientific highlights. J. Appl. Crystallogr. 2018, 51, 294–314. [Google Scholar] [CrossRef]
  39. Rehm, C.; de Campo, L.; Brûle, A.; Darmann, F.; Bartsch, F.; Berry, A. Design and performance of the variable-wavelength Bonse-Hart ultra-small-angle neutron scattering diffractometer KOOKABURRA at ANSTO. J. Appl. Crystallogr. 2018, 51, 1–8. [Google Scholar] [CrossRef] [Green Version]
  40. Drobniak, A.; Mastalerz, M.; Crockett, J.E.; Nuttall, B.C.; Russell, K.P. New Albany Shale: Indiana Geological Survey Digital Information 07. 2016. Available online: https://igws.indiana.edu/IGSMap/?map=NAS (accessed on 5 November 2021).
  41. Swezey, C.S.; Hatch, J.R.; Brennan, S.E.; East, J.A.; Rowan, E.L.; Repetski, J.E.; Charpentier, R.R.; Cook, T.A.; Klett, T.R.; Pollastro, R.M.; et al. Assessment of undiscovered oil and gas resources of the Illinois Basin, 2007. In United States Geological Survey Fact Sheet FS-2007-3058; United States Geological Survey: Reston, VA, USA, 2007; p. 2. [Google Scholar]
  42. Radlinski, A.P.; Radlinska, E.Z. The microstructure of pore space in coals of different rank: A small angle scattering and SEM study. In Coalbed Methane: Scientific, Environmental and Economic Evaluation; Mastalerz, M., Glikson, M., Golding, S.D., Eds.; Kluwer Academic Publishers: Dodrecht, The Netherlands, 1999; pp. 329–365. [Google Scholar]
  43. Dubner, W.S.; Schultz, J.M.; Wignall, G.D. Estimation of incoherent backgrounds in SANS studies of polymers. J. Appl. Crystallogr. 1990, 23, 469–475. [Google Scholar] [CrossRef]
  44. Rouquerol, F.; Rouquerol, J.; Sing, K.S.W.; Llewellyn, P.; Maurin, G. Adsorption by Powders and Porous Solids: Principles, Methodology and Applications, 2nd ed.; Academic Press: Oxford, UK, 2014; p. 630. [Google Scholar]
  45. Faucher, S.; Aluru, N.; Bazant, M.Z.; Blankschtein, D.; Brozena, A.H.; Cumings, J.; Pedro de Sousa, J.; Elimelech, M.; Epsztein, R.; Fourkas, J.T.; et al. Critical knowledge gaps in mass transport through single digit nanopores: A review and perspective. J. Phys. Chem. C 2019, 123, 21309–21326. [Google Scholar] [CrossRef]
  46. Blach, T.; Radlinski, A.P.; Edwards, D.S.; Boreham, C.J.; Gilbert, E.P. Pore anisotropy in unconventional hydrocarbon source rocks: A small-angle neutron scattering (SANS) study on the Arthur Creek Formation, Georgina Basin, Australia. Int. J. Coal Geol. 2020, 225, 103495. [Google Scholar] [CrossRef]
  47. Radlinski, A.P.; Blach, T.P.; Lipar, M.; Magni, S.; Schweins, R.; Lemmel, H.; Szymczak, P. The effect of carbonate cementation on the pore space structure. In Proceedings of the Interpore 11th Annual Meeting, Valencia, Spain, 6–10 May 2019. [Google Scholar]
  48. Liu, B.; Teng, J.; Mastalerz, M.; Schieber, J.; Schimmelmann, A.; Bish, D. Compositional control on shale pore structure characteristics across a maturation gradient: Insights from the Devonian New Albany Shale and Marcellus Shale in the eastern United States. Energy Fuels 2021, 35, 7913–7929. [Google Scholar] [CrossRef]
  49. Liu, B.; Schieber, J.; Mastalerz, M. Combined SEM and reflected light petrography of organic matter in the New Albany Shale: A perspective on organic porosity development with thermal maturation. Int. J. Coal Geol. 2017, 184, 57–72. [Google Scholar] [CrossRef]
  50. Liu, B.; Schieber, J.; Mastalerz, M. Petrographic and micro-FTIR study of organic matter in the Upper Devonian New Albany Shale during thermal maturation: Implications for kerogen transformation. In Mudstone Diagenesis: Research Perspectives for Shale Hydrocarbon Reservoirs, Seals, and Source Rocks; Camp, W., Milliken, K., Taylor, K., Fishman, N., Hackley, P., Macquaker, J., Eds.; American Association of Petroleum Geologists Memoir: Tulsa, OK, USA, 2019; Volume 121, pp. 165–188. [Google Scholar] [CrossRef]
  51. Eberle, A.P.R.; King, H.E.; Ravikovitch, P.I.; Walters, C.C.; Rother, G.; Wesolowski, D.J. Direct measure of the dense methane phase in gas shale organic porosity by neutron scattering. Eneegy Fuels 2016, 30, 9022–9027. [Google Scholar] [CrossRef]
  52. Jubb, A.M.; Ruppert, L.F.; Youngs, T.G.A.; Headen, T.F. Exploring methane behavior in Marcellus Shale micropores via contrast matching neutron scattering. Energy Fuels 2020, 34, 10926–10932. [Google Scholar] [CrossRef]
Figure 1. I(Q) for the McAtee-2798 sample (R0.70%) measured before (left) and after (right) pressure cycling, in vacuum (open squares) and in the {CM} conditions (p = 500 bar of CD4). The large-Q background has been subtracted.
Energies 14 08438 g001
Figure 2. Power-law exponent (slope on the double-log scale) of scattering intensity I(Q) for the NAS samples and Marcellus_7084 sample, fitted in the Q-range of 3 × 10⁻⁴–0.2 Å−1: (left) before pressure cycling; (right) after pressure cycling. I(Q) was measured in a vacuum (open squares) and under {CM} conditions (full circles; 500 bar of CD4).
Energies 14 08438 g002
Figure 3. Pore size distribution f(r) and specific surface area SSA(R) calculated for the McAtee-2798 sample: (left) before pressure cycling; (right) after pressure cycling.
Energies 14 08438 g003
Figure 4. Accessible porosity (open squares) and inaccessible porosity (full circles) values for the NAS samples and Marcellus_7084 sample, calculated using the PDSP model from the I(Q) values in the Q-range of 3 × 10⁻⁵–0.02 Å−1 (outside of the large-Q region potentially affected by the increased density of CD4 confined in nanopores): (left) before pressure cycling; (right) after pressure cycling.
Energies 14 08438 g004
Figure 5. Total (accessible + inaccessible) specific surface area versus probe radius calculated for the McAtee-2798 sample using the PDSP model: (left) before pressure cycling; (right) after pressure cycling.
Energies 14 08438 g005
Figure 6. Accessible and inaccessible specific surface area values for the NAS samples and Marcellus_7084 sample, calculated for the probe diameter of 0.4 nm by extrapolation from the SSA(R) results computed using the PDSP model: (left) before pressure cycling; (right) after pressure cycling. Only upper parts of error bars are shown for error bars extending beyond the plot frame on the logarithmic scale.
Energies 14 08438 g006
Figure 7. Accessible pore fraction, Fa(D), for sample McAtee-2798 before and after pressure cycling, calculated using Equation (4). Color-shaded areas illustrate the extent of experimental uncertainty. Start—before pressure cycling; end—after pressure cycling.
Energies 14 08438 g007
Figure 8. Large-Q detail of the I(Q) plot for sample McAtee-2798 in the region of crossover between the ambient and contrast-matched curves: (left) before pressure cycling; (right) after pressure cycling.
Energies 14 08438 g008
Figure 9. Pore diameter corresponding to the crossover point of the SANS intensity measured at ambient conditions and in {CM} conditions for the NAS samples and the Marcellus_7084 sample. Start—before pressure cycling; end—after pressure cycling.
Energies 14 08438 g009
Table 1. Naming convention for samples. Note: * marks outcrop samples and the values of the maximum depth of burial, roughly estimated from the plot of Ro versus depth; Ro—vitrinite reflectance; OM—organic matter.
Sample No.Abbreviated Sample NameSample Depth (Feet/m)Sample OriginRo (%)OM Maturity
1SDH-308247/75.29Harrison County, Indiana0.50early-mature
2McAtee-27982798/852.83Pike County, Indiana0.70mid-mature
3Gibson-39973997/1218.3Gibson County, Indiana0.84mid-mature
4Hardin-IL2* 4600/1402.1Hardin County, Illinois1.04late mature
5Hardin-IL3* 5400/1645.9Hardin County, Illinois1.40post-mature
6Mar_70847084/2159.2Pennsylvania2.50post-mature
Table 2. Configurations and pore size range of SANS and USANS instruments used in this work. Entry “SDD” means the sample–detector distance.
InstrumentReferenceInstrument ConfigurationNeutron WavelengthQ-Range
−1)
Pore Diameter Range
pinhole:
40 m SANS Quokka[38]SDD = 1.4 m
SDD = 8 m
SDD = 20 m
MgF2 lens
5.0 Å
5.0 Å
5.0 Å
8.1 Å
total:
6 × 10⁻⁴–0.5
1 nm–830 nm
USANS Kookaburra[39]Bonse-Hart2.37 Å2 × 10⁻⁵–2 × 10−3250 nm–25 μm
Total 2 × 10⁻⁵–0.51 nm–25 μm
Table 3. Pressure cycling conditions (p—pressure of CD4 (bar); S—uniaxial mechanical pressure) exerted on the big face of the slice (in the direction perpendicular to bedding, shown in bar). Data for the Marcellus Shale Formation sample Mar_7084 were taken from [12].
Sample Name(p,S) Values (bar)
(p,S) Cycle No.12345678910
SDH-3080,0500,0500,7.50,7.50,18.5500,18.5500,280,280,0500,0
McAtee-27980,0500,0500,840,840,210500,210500,3130,3130,0500,0
Gibson-39970,0500,0500,5000,5000,850500,850nilnil0,0500,0
Hardin-IL20,0500,0500,1200,1200,225500,225500,3360,3360,0500,0
Hardin-IL30,0500,0500,900,900,225500,225500,3360,3360,0500,0
Mar_70840,0500,0500,3700,3700,740500,740500,10000,10000,0500,0
Table 4. Mineral composition (in weight%), reflectance of vitrinite (Ro), and TOC (total organic carbon, weight%) content values for New Albany Shale samples. Symbols: Qrtz—quartz; K-fel—K-feldspar; Plag—plagioclase; Dol—dolomite; Ank—ankerite; P/M—pyrite and marcasite; Il/Sm—illite/smectite; Il/M—illite and mica; Kao—kaolinite; Chl—chlorite; TOC—total organic carbon.
Sample No.Ro (%)QrtzK-felPlagDolAnkP/MIl/SmIl/MKaoChlTOC
10.5032.803.93.81.25.719.317.90.50.514.4
20.7027.104.810.26.727.624.20.71.16.6
30.8436.124.72.70.52.226180.61.35.9
41.0439.510.53.24.92.86.61410.1008.4
51.4032.425.516.26.83.92.55.93.2003.6
Table 5. Petrographic and physical parameters, estimated SANS background caused by incoherent scattering on hydrogen bound in the organic matter, and scattering length density values calculated for the NAS samples using mineralogy data from Table 4.
Sample
No.
Bulk Density
g/cm3
Matrix Permeability
(mD)
Core Lab Porosity
(%)
TOC
(wt%)
Estimated Incoherent SANS Background
(cm−1)
SLD
×1010 (cm−2)
12.252.346 × 10−54.114.40.032 ± 20%3.637
22.438.082 × 10−55.976.60.0153.608
32.454.501 × 10−55.155.90.0133.699
42.327.289 × 10−55.98.40.0193.848
52.562.697 × 10−62.193.60.0083.993
62.5516.23 × 10−56.883.40.0073.4 ± 0.2
Table 6. Total ((p,S) = (0,0)), accessible, and inaccessible ((p,S) = (500,0)) apparent porosity values for New Albany Shale samples, determined from I(Q) data measured in a vacuum and in {CM} conditions (p = 500 bar of CD4), calculated from fits to the PDSP model coded in PRINSAS. Helium porosity values (measured by Core Lab) are listed for comparison. Annotation “end” indicates values measured after pressure cycling (Table 2). The “accessible before” and “accessible after” entries indicate values of accessible porosity before and after pressure cycling. Symbol p indicates pressure of deuterated methane CD4 (hydrostatic) and S indicates uniaxial stress exerted on the sample, both in bar (1 bar = 0.1 MPa). For sample Hardin-IL3* only SANS was measured. Results for sample Marcellus_7084 (M_7084) were taken from Blach et al. [12].
Sample
No.
Ro (%)Max Stress
S (Bar)
Core Lab
Porosity
(%)
SANS + USANS Total Porosity
at Indicated (p,S) Values
(%)
(0,0)(500,0)(0,0) End(500,0) EndAccessible
Before
Accessible
After
10.50284.18.6 ± 0.29.0 ± 0.410.1 ± 0.2510.0 ± 0.4−0.40 ± 0.440.09 ± 0.45
20.703135.9711.2 ± 0.38.3 ± 0.510.9 ± 0.357.2 ± 0.52.9 ± 0.63.7± 0.6
30.848505.1514.1 ± 0.412.8 ± 0.611.4 ± 0.411.4 ± 0.61.3 ± 0.8−0.02 ± 0.7
41.043365.96.1 ± 0.15.8 ± 0.16.14 ± 0.085.2 ± 0.10.32 ± 0.140.9 ± 0.1
51.403362.19n/an/an/an/an/an/a
62.5010006.887.2 ± 0.88.6 ± 1.66.4 ± 0.87.7 ± 1.4−1.4 ± 1.8−1.3 ± 1.6
Table 7. Specific surface area in the nanopore region measured for the least and most mature sample using different techniques. SANS data extrapolated to pore diameter of 0.4 nm, micropore surface area (obtained from CO2 sorption, ASAP 2020), and BJH adsorption surface area (2–50 nm, measured using low-temperature N2, using ASAP 2020). All units are m2/g.
SampleSANS (Accessible + Inaccessible)
Extrapolated to R = 0.4 nm
CO2
Micropores
N2 BJH
(2–50 nm)
SDH-30813.327.83.22
Mar_70849819.34.43
Publisher’s Note: MDPI stays neutral with regard to jurisdictional claims in published maps and institutional affiliations.

