Article

Effects of Inhibitory Compounds Present in Lignocellulosic Biomass Hydrolysates on the Growth of Bacillus subtilis

by
Lucas van der Maas
1,†,
Jasper L. S. P. Driessen
2,† and
Solange I. Mussatto
1,*
1
Department of Biotechnology and Biomedicine, Technical University of Denmark, Søltofts Plads, Building 223, 2800 Kongens Lyngby, Denmark
2
Novo Nordisk Foundation Center for Biosustainability, Technical University of Denmark, Kemitorvet, Building 220, 2800 Kongens Lyngby, Denmark
*
Author to whom correspondence should be addressed.
The authors contributed equally to this work.
Energies 2021, 14(24), 8419; https://doi.org/10.3390/en14248419
Submission received: 24 October 2021 / Revised: 23 November 2021 / Accepted: 30 November 2021 / Published: 14 December 2021
(This article belongs to the Special Issue Bioenergy and Biobased Technologies to Support a Green Transition)

Abstract

:
This study evaluated the individual and combined effects of inhibitory compounds formed during pretreatment of lignocellulosic biomass on the growth of Bacillus subtilis. Ten inhibitory compounds commonly present in lignocellulosic hydrolysates were evaluated, which included sugar degradation products (furfural and 5-hydroxymethylfurfural), acetic acid, and seven phenolic compounds derived from lignin (benzoic acid, vanillin, vanillic acid, ferulic acid, p-coumaric acid, 4-hydroxybenzoic acid, and syringaldehyde). For the individual inhibitors, syringaldehyde showed the most toxic effect, completely inhibiting the strain growth at 0.1 g/L. In the sequence, assays using mixtures of the inhibitory compounds at a concentration of 12.5% of their IC50 value were performed to evaluate the combined effect of the inhibitors on the strain growth. These experiments were planned according to a Plackett–Burman experimental design. Statistical analysis of the results revealed that in a mixture, benzoic acid and furfural were the most potent inhibitors affecting the growth of B. subtilis. These results contribute to a better understanding of the individual and combined effects of inhibitory compounds present in biomass hydrolysates on the microbial performance of B. subtilis. Such knowledge is important to advance the development of sustainable biomanufacturing processes using this strain cultivated in complex media produced from lignocellulosic biomass, supporting the development of efficient bio-based processes using B. subtilis.

1. Introduction

Due to its low cost, large availability (181.5 billion tons/year) [1], and sugar-rich composition, lignocellulosic biomass has attracted great interest to be used as a feedstock for the production of a wide range of bio-based products. One of the main advantages of using these materials in bioprocesses is that they do not compete with the food supply or existing arable land, as lignocellulosic materials include residues and side streams from agriculture, forestry, energy crops, biorefineries, and pulp mills [2,3]. In the last decade, lignocellulosic biomass has gained increased attention as a feedstock for many industrial processes, among which includes the production of enzymes. Although the global market for enzymes in industrial applications is expected to grow from USD 6.4 billion in 2021 to USD 8.7 billion by 2026 [4], high production costs and high levels of competition have put pressure on the enzyme industry to seek new sustainable alternatives for their processes. Using lignocellulose as a feedstock can improve the sustainability of the production chain and reduce substrate costs, which, next to capital investment (50%), make up a third of the total costs [5].
Lignocellulose mainly consists of cellulose, hemicellulose, and lignin fractions. In spite of the potential of lignocellulosic biomass as a source of sugars for bioprocesses, some key problems related to their utilization still must be overcome to accelerate the transition towards a society less dependent on fossil fuels. One of these main problems is due to the fact that sugars present in lignocellulosic biomass are not freely available for biochemical conversion by microorganisms. Therefore, a pretreatment step is commonly required to break the physical and chemical bonds between the main constituents of the biomass, releasing sugars that can be used for fermentation [6]. However, pretreatment is not a selective reaction, and besides solubilizing hemicellulose sugars, it also promotes the formation and release of several other compounds from the lignocellulose structure, which have negative effects on fermentation, affecting the microbial metabolism and reducing the efficiency of the strain to convert sugars into products.
The severity and mechanism of inhibition depend on the chemistry of the specific compound, the environment during microbial fermentation, and the tolerance of the microorganism to each toxic compound [7]. The by-products generated from cellulose and hemicellulose fractions range from weak acids, for example from the acetyl groups present in hemicellulose, to furans formed during the degradation of sugars. Part of the lignin also breaks down during pretreatment, generating other inhibitory (phenolic) compounds [8]. The presence of inhibitory compounds together with sugars is one of the major challenges hindering the efficient utilization of lignocellulosic biomass hydrolysates in bioprocesses. Elucidating the individual and combined effects of these compounds on microbial performance to grow is essential to find solutions to this problem, and to obtain an efficient and cost-competitive product formation from complex media produced from plant-based materials [9].
In this study, Bacillus subtilis was the microbial strain considered to evaluate the effect of inhibitory compounds, as it is a major workhorse in the production of industrial enzymes. This status is due to several reasons: it has high growth rates, is generally regarded as safe (GRAS) by the FDA, and is able to secrete high levels of protein [10]. Moreover, B. subtilis has a number of validated and putative transporters, which enable it to take up several types of monomeric sugars, making it a prime candidate for enzyme production based on biomass. Furthermore, the physiology and biochemistry of B. subtilis have been extensively studied due to its relevance to industry.
The aim of this study was to elucidate the individual and combined effects of the inhibitory compounds present in lignocellulosic biomass hydrolysates on the growth performance of B. subtilis. The ten most common inhibitory compounds present in lignocellulosic hydrolysates were tested at different concentration levels, and the strain growth was monitored. The half-maximal inhibitory concentration (IC50) was determined for each inhibitor. Then, assays using a mixture of the inhibitors were performed according to a Plackett–Burman experimental design. In the end, the results allowed us to conclude which individual inhibitory compounds and mixtures are the most toxic to B. subtilis.

2. Materials and Methods

2.1. Microorganism and Inoculum Preparation

Bacillus subtilis BS168 was the microorganism used in the experiments. The strain was grown in M9 minimal media (Sigma-Aldrich, Burlington, MA, USA) supplemented with glucose (10 g/L) and tryptophan (0.05 g/L), at 250 rpm and 37 °C. Cryopreserved cells were grown overnight on LB agar plates at 37 °C, after which a single colony was used to inoculate a 12 mL culture tube containing 5 mL of LB, and the culture was kept for 8 h. Then, 10 µL of this culture was grown for 15 h in a 250 mL shake flask containing 20 mL of M9 medium (supplemented with 1 mL of 10 g/L yeast extract solution) to serve as inoculum for the growth experiments.

2.2. Culture Media and Conditions

The following inhibitory compounds were tested in the experiments: furfural, 5-hydroxymethylfurfural (5-HMF), acetic acid, vanillin, vanillic acid, benzoic acid, ferulic acid, p-coumaric acid, 4-hydroxybenzoic acid, and syringaldehyde (Sigma-Aldrich). Stock solutions of all inhibitors were prepared in 98% (v/v) ethanol at concentrations close to their respective solubility. Subsequently, dilutions were made in M9 minimal medium to obtain the inhibitors at appropriate concentrations for use in the experiments.
To determine the effect of inhibitors on microbial growth rate, cells were grown in microtiter plates incubated in a Growth Profiler 960 (EnzyScreen, Heemstede, The Netherlands) at 250 rpm, 37 °C. Microtiter plate wells (280 µL) were inoculated with 20 µL of diluted preculture, so that the starting optical density (OD600) was approximately 0.05. The OD600 was measured every 20 min. All tests were performed in triplicate.

2.3. Determination of Growth Rate and Lag Phase

Growth rates were determined following the method described by Hemmerich et al. [11], which is based on an iterative procedure: first, the growth curve is transformed by a natural logarithm, followed by weighted linear regression to obtain the logarithmic growth phase. Then, three stopping criteria are applied. If the stopping criteria are not met, a new iteration is started. The three stopping criteria are defined as follows: firstly, the set R2 value has to be met. The second criterion dictates that the increase in biomass in the last data point needs to be higher than the increase in the previous point to exclude data from the transition to the stationary phase. The final stopping criterion dictates that there must be an overall positive increase in biomass to rule out any measurement artifacts. If all these stopping criteria are met, the µ is calculated according to Equation (1).
μ = 1 c X × d c X d t Δ l n ( c x ) Δ t
The lag phase of bacterial growth can be mathematically defined as the time up to the maximum of the second derivate of the growth curve [12]. This is the time point at which the growth rate increase is maximal. Determination of the lag phase was performed manually in Excel (Microsoft, Richmond, VA, USA) by taking the moving average of 7 points in the growth.
The half-maximal inhibitory concentration (IC50) was defined as the concentration of the inhibitor at which the growth rate µ was half that of the control [13].

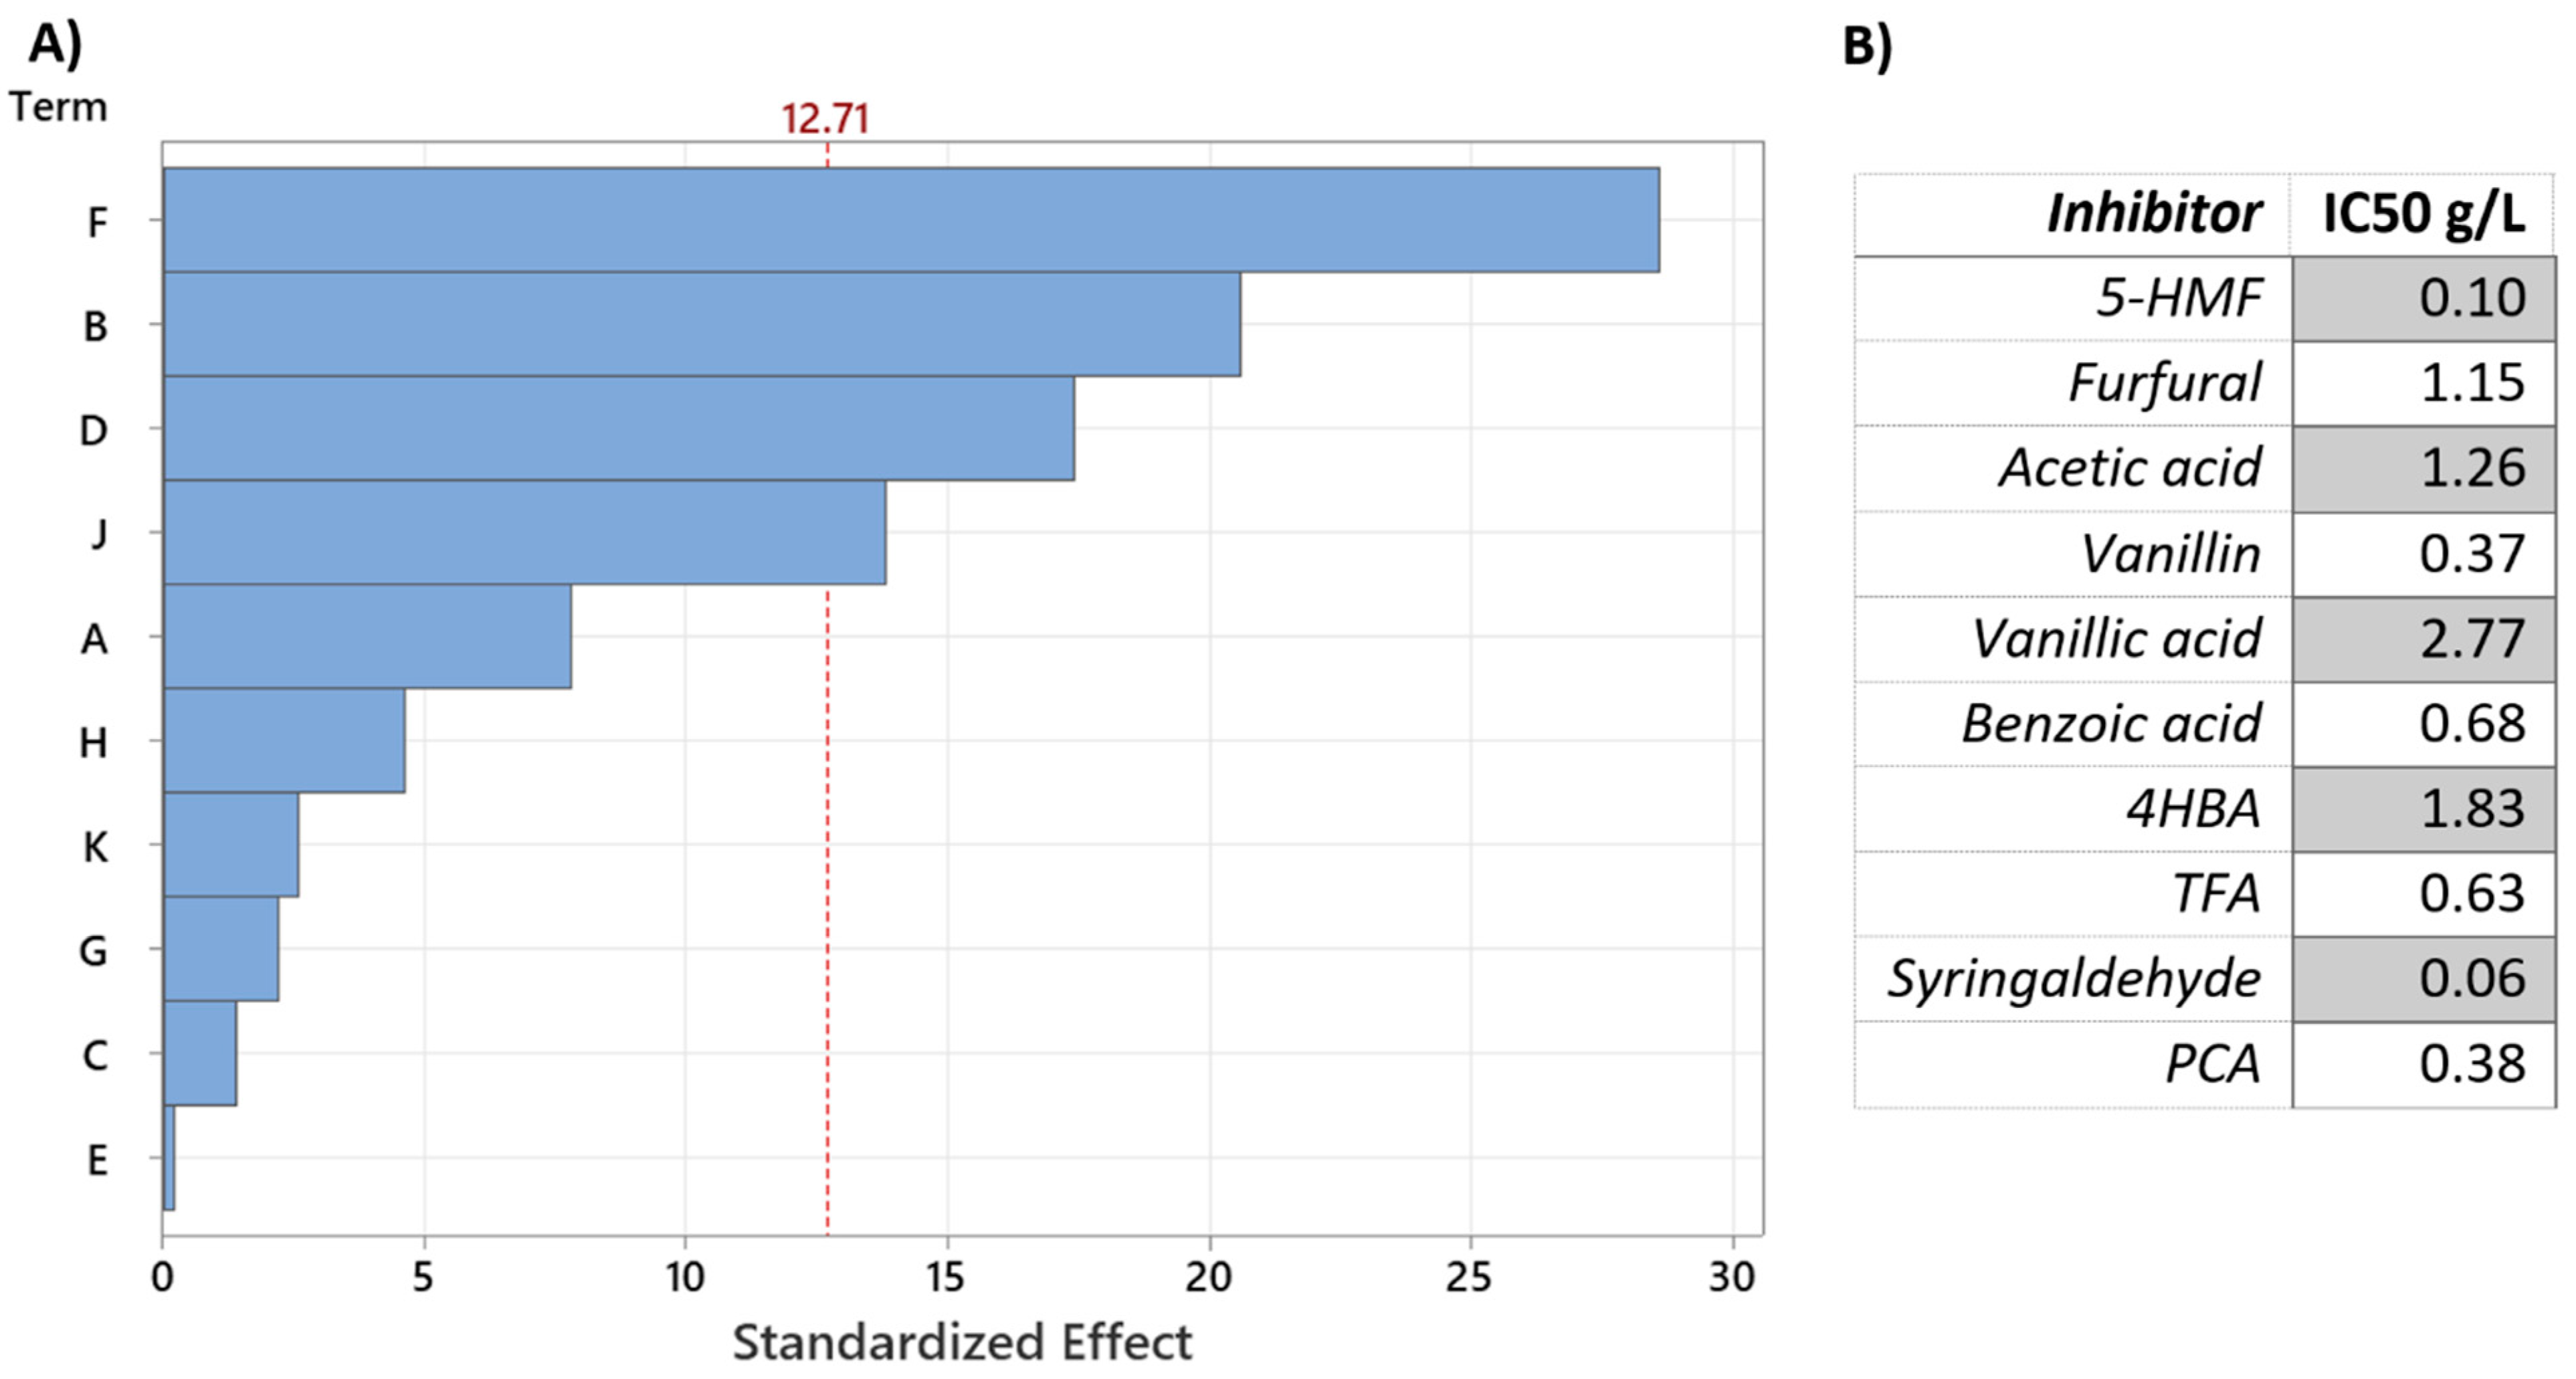
2.4. Plackett–Burman Experimental Design

The Plackett–Burman experimental design was chosen to evaluate the effect of mixtures of inhibitors, since it allows the screening of numerous parameters in a relatively small number of experiments [14]. In these experiments, 12 different combinations of 10 different inhibitors were tested in triplicate. The concentration at which the growth rate was 50% of the control without inhibition (IC50) was calculated to each inhibitor by linear regression of the linear part of the inhibition curves. As combining multiple inhibitors at their corresponding IC50 values resulted in no growth, lower concentrations were also tested. One-eighth of the IC50 values yielded an optimal response for the determination of the main effects of inhibitors on growth rate. The design and statistical analysis of the Plackett–Burman experimental design were performed using the software Minitab (Minitab Inc., State College, PA, USA). Additional data about the Plackett–Burman design are shown in the Supplementary Materials.

3. Results and Discussion

3.1. Individual Effects of Inhibitory Compounds

Experimental growth curves and lag phases of B. subtilis grown in varying concentrations of the 10 different inhibitory compounds are shown in Figure 1 and Figure 2. To obtain an appropriate range of growth for all inhibitory compounds, multiple independent experiments were performed with varying concentrations. The results obtained for each category of inhibitor compound (furan derivatives, weak acids, and phenolic compounds) are presented and discussed below.

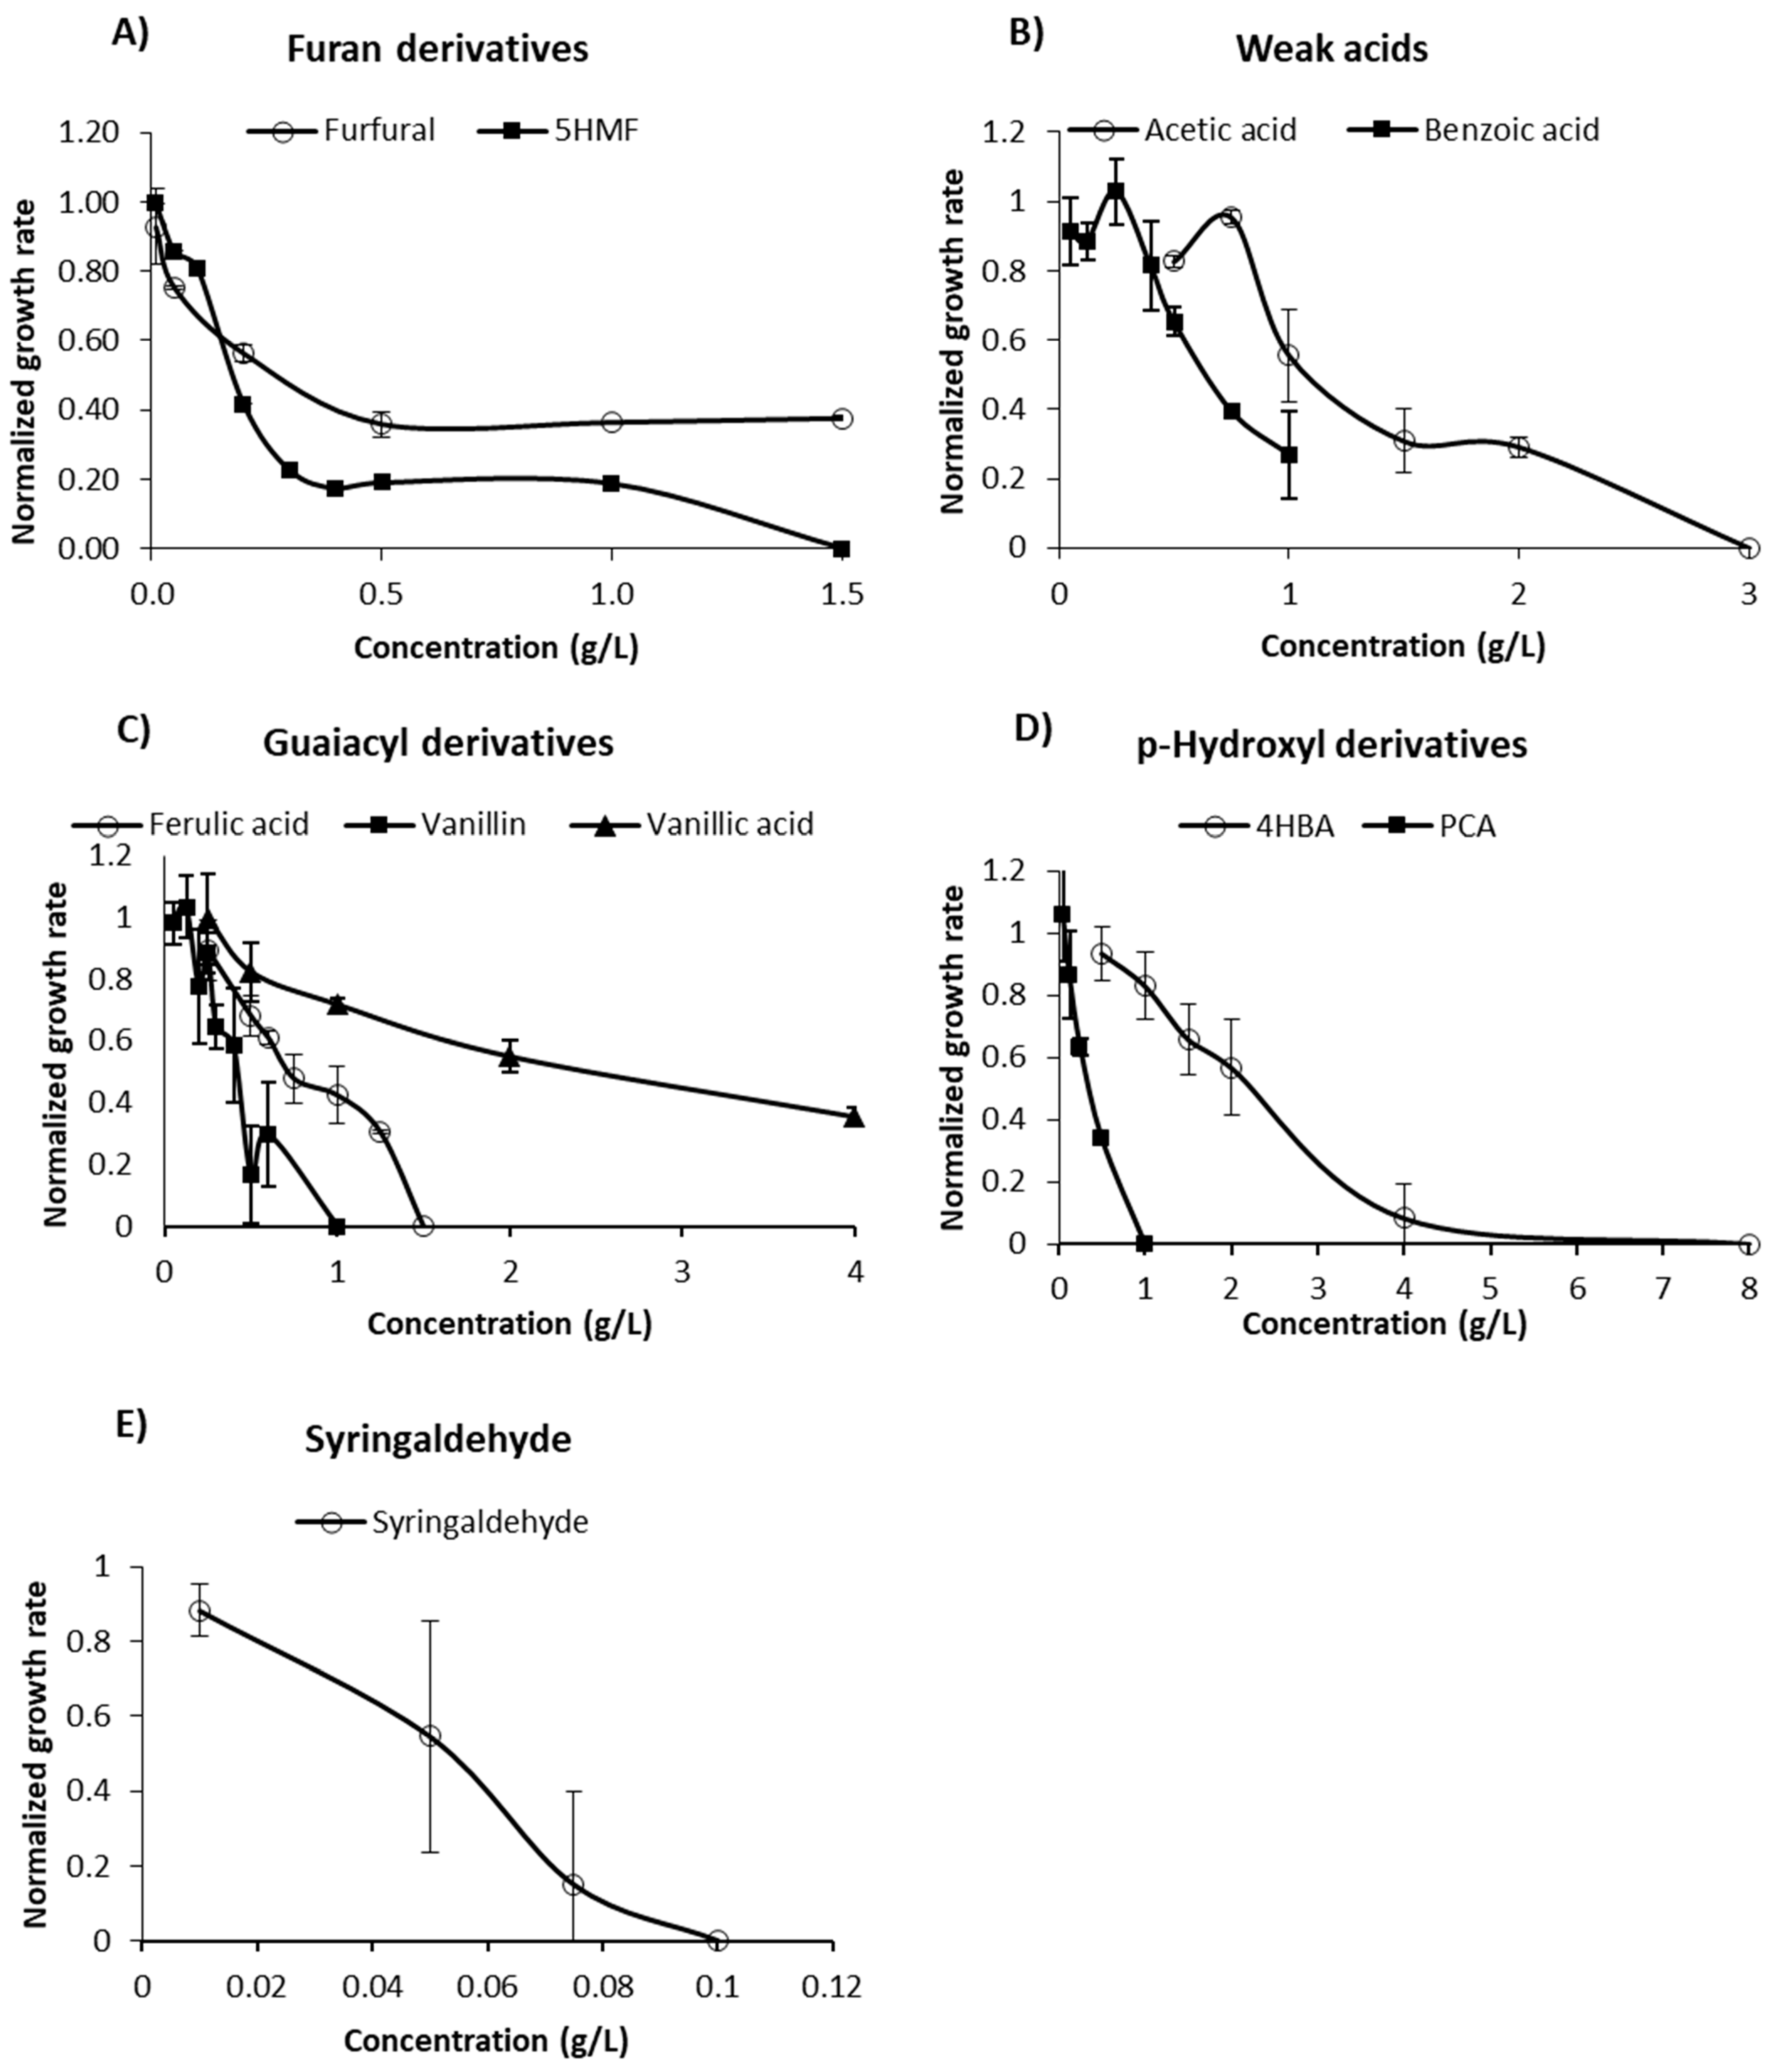
3.1.1. Furan Derivatives

The degradation of pentoses and hexoses during pretreatment results in the formation of furfural and 5-HMF, respectively [8]. Both furan derivatives are toxic to the cell as they inhibit the glycolytic and fermentative enzymes essential to central metabolic pathways and the cross-linking of proteins, and cause DNA damage [15,16]. In addition, furan derivatives deteriorate membrane integrity because of their high hydrophobicity, causing membrane leakage/disruption and ultimately leading to lower ATP production and a drop in the growth rate [17].
Furfural inhibited the growth of B. subtilis at concentrations as low as 0.05 g/L (Figure 1A). The growth rate was about half the value of the control at a concentration of 0.2 g/L and was further reduced to roughly 35% at concentrations of 0.5 g/L and higher (Figure 2A). Higher concentrations resulted in a longer lag phase, while growth rates remained constant. B. subtilis appears to be more sensitive to furfural compared to certain yeast species, as it is shown that furfural concentrations below 0.5 g/L had a positive effect on the cell growth of Pichia stipitis, for example, [18]. Zheng et al. [19] discovered a B. subtilis strain (DS3) capable of growing on and utilizing furfural as sole carbon source. There is a possibility that other B. subtilis strains, including the one used in this study, could also utilize furfural as their sole carbon source, but this has not yet been proven and was also not investigated in this study.
5-HMF is commonly present in lower concentrations than furfural in hemicellulose hydrolysates; due to the low amount of hexoses usually present in hemicelluloses, the conditions usually applied for pretreatment (which do not degrade large amount of hexoses), and the high reactivity of 5-HMF [8]. In the present study, 5-HMF showed an overall similar response to that of furfural: at higher concentrations, the microbial growth rate was reduced to a low, constant level, while the lag phase was prolonged (Figure 1B and Figure 2A).
Zhang et al. [20] investigated the effect of furfural and 5-HMF on the growth rate of a Bacillus coagulans species and found stronger growth inhibition of furfural compared to 5-HMF at concentrations below 3 g/L. However, at higher concentrations, the inhibition by 5-HMF was more severe than furfural. Although inhibition occurred at lower concentrations in the current work, the trend of inhibition found by Zhang and co-authors matches with the results obtained in this study: B. subtilis is more resistant to higher concentrations of furfural than 5-HMF (Figure 2A), but inhibition by furfural occurs even at low concentrations. In contrast, Pereira et al. [21] found that the growth of B. subtilis NCCB 70064 was inhibited less by 5-HMF compared to furfural. Moreover, the authors observed growth even at 2 g/L of 5-HMF, while in our study, no growth was observed at 5-HMF concentrations over 1 g/L (Figure 2A).

3.1.2. Weak Acids

During pretreatment of lignocellulosic biomass, weak acids such as acetic acid, formic acid, levulinic acid, and benzoic acid can be formed or released from the material structure. Undissociated weak acids are generally liposoluble and able to diffuse across the plasma membrane into the cytosol. Due to the neutral intracellular pH, weak acids dissociate, lowering the pH of the cell [8]. Multiple explanations have been proposed to explain the inhibitory effect of weak acids entering the cell. Active transport and ATPase can remove the dissociated acids and protons, respectively, but both are at the expense of ATP. As the proton-pumping capacity of the cell falls short at higher acid concentrations, the depletion of the ATP content, lower proton motive force, and acidification of the intracellular environment will lead to low cell viability [22]. In addition, it has been suggested that enzymes are not only inhibited by internal acidification, but also by the accumulation of the anionic form of the acid [23]. The inhibitory effects of weak acids are highly dependent on the ratio of dissociated to undissociated forms, which is dictated by the pH of the environment and pKa of the compound.
The two weak acids investigated in this study included acetic acid and benzoic acid. Acetic acid is released from the hemicellulose structure, while benzoic acid is a lignin degradation product [9]. For an acetic acid concentration of 0.75 g/L, no significant inhibition was observed in terms of lag phase or maximal growth rate (Figure 1C and Figure 2B). However, when observing the growth curve (Figure 1C), an inhibitory effect is clear at this concentration. It seems that B. subtilis has a biphasic growth pattern when acetic acid is present in the medium. B. subtilis cultures are able to consume acetate and produce acetoin when extracellular acetate levels rise to toxic levels. Acetoin is a non-toxic pH-neutral overflow metabolite that can be used as a carbon source in later growth stages [24], which could explain the biphasic growth pattern observed in the present study. At a concentration of 2 g/L, growth only occurs after 48 h at 29% of the rate of the control.
The inhibitory effect of acetic acid is highly dependent on the pH of the medium. The productivity of P. stipitis, for example, dropped by 50% when the strain was grown in 0.8 g/L or 13.8 g/L of acetic acid at pH 5.1 or 6.5, respectively [25]. On the other hand, an increase in productivity at concentrations up to 1 g/L was observed for Candida guilliermondii, while other authors observed the same effect up to 10 g/L for Saccharomyces cerevisiae [26,27]. This allows us to conclude that the inhibiting effect of acetic acid is dependent on the species of microorganism and experimental conditions used for cultivation.
Unlike the acetic acid, the inhibitory effect of benzoic acid was clearly visible from 0.5 g/L onwards, while the lag phase was fairly constant (Figure 1D). The constant lag phase might indicate that the cell does not have a specific coping mechanism for benzoic acid. The cell does need to expend energy to reduce the intracellular concentration of the acid, as well as maintain a suitable intracellular pH; this energy cannot be used for growth, thus reducing the growth rate [28]. According to the literature, the minimal inhibitory concentration of benzoic acid for several yeast species varies between 0.17 and 1.25 g/L [29]. Benzoic acid was also found to be a potent inhibitor of the growth of Rhodosporidium toruloides, increasing the lag phase of this yeast by 60% compared to the control when present in concentrations higher than 1 mM [9].

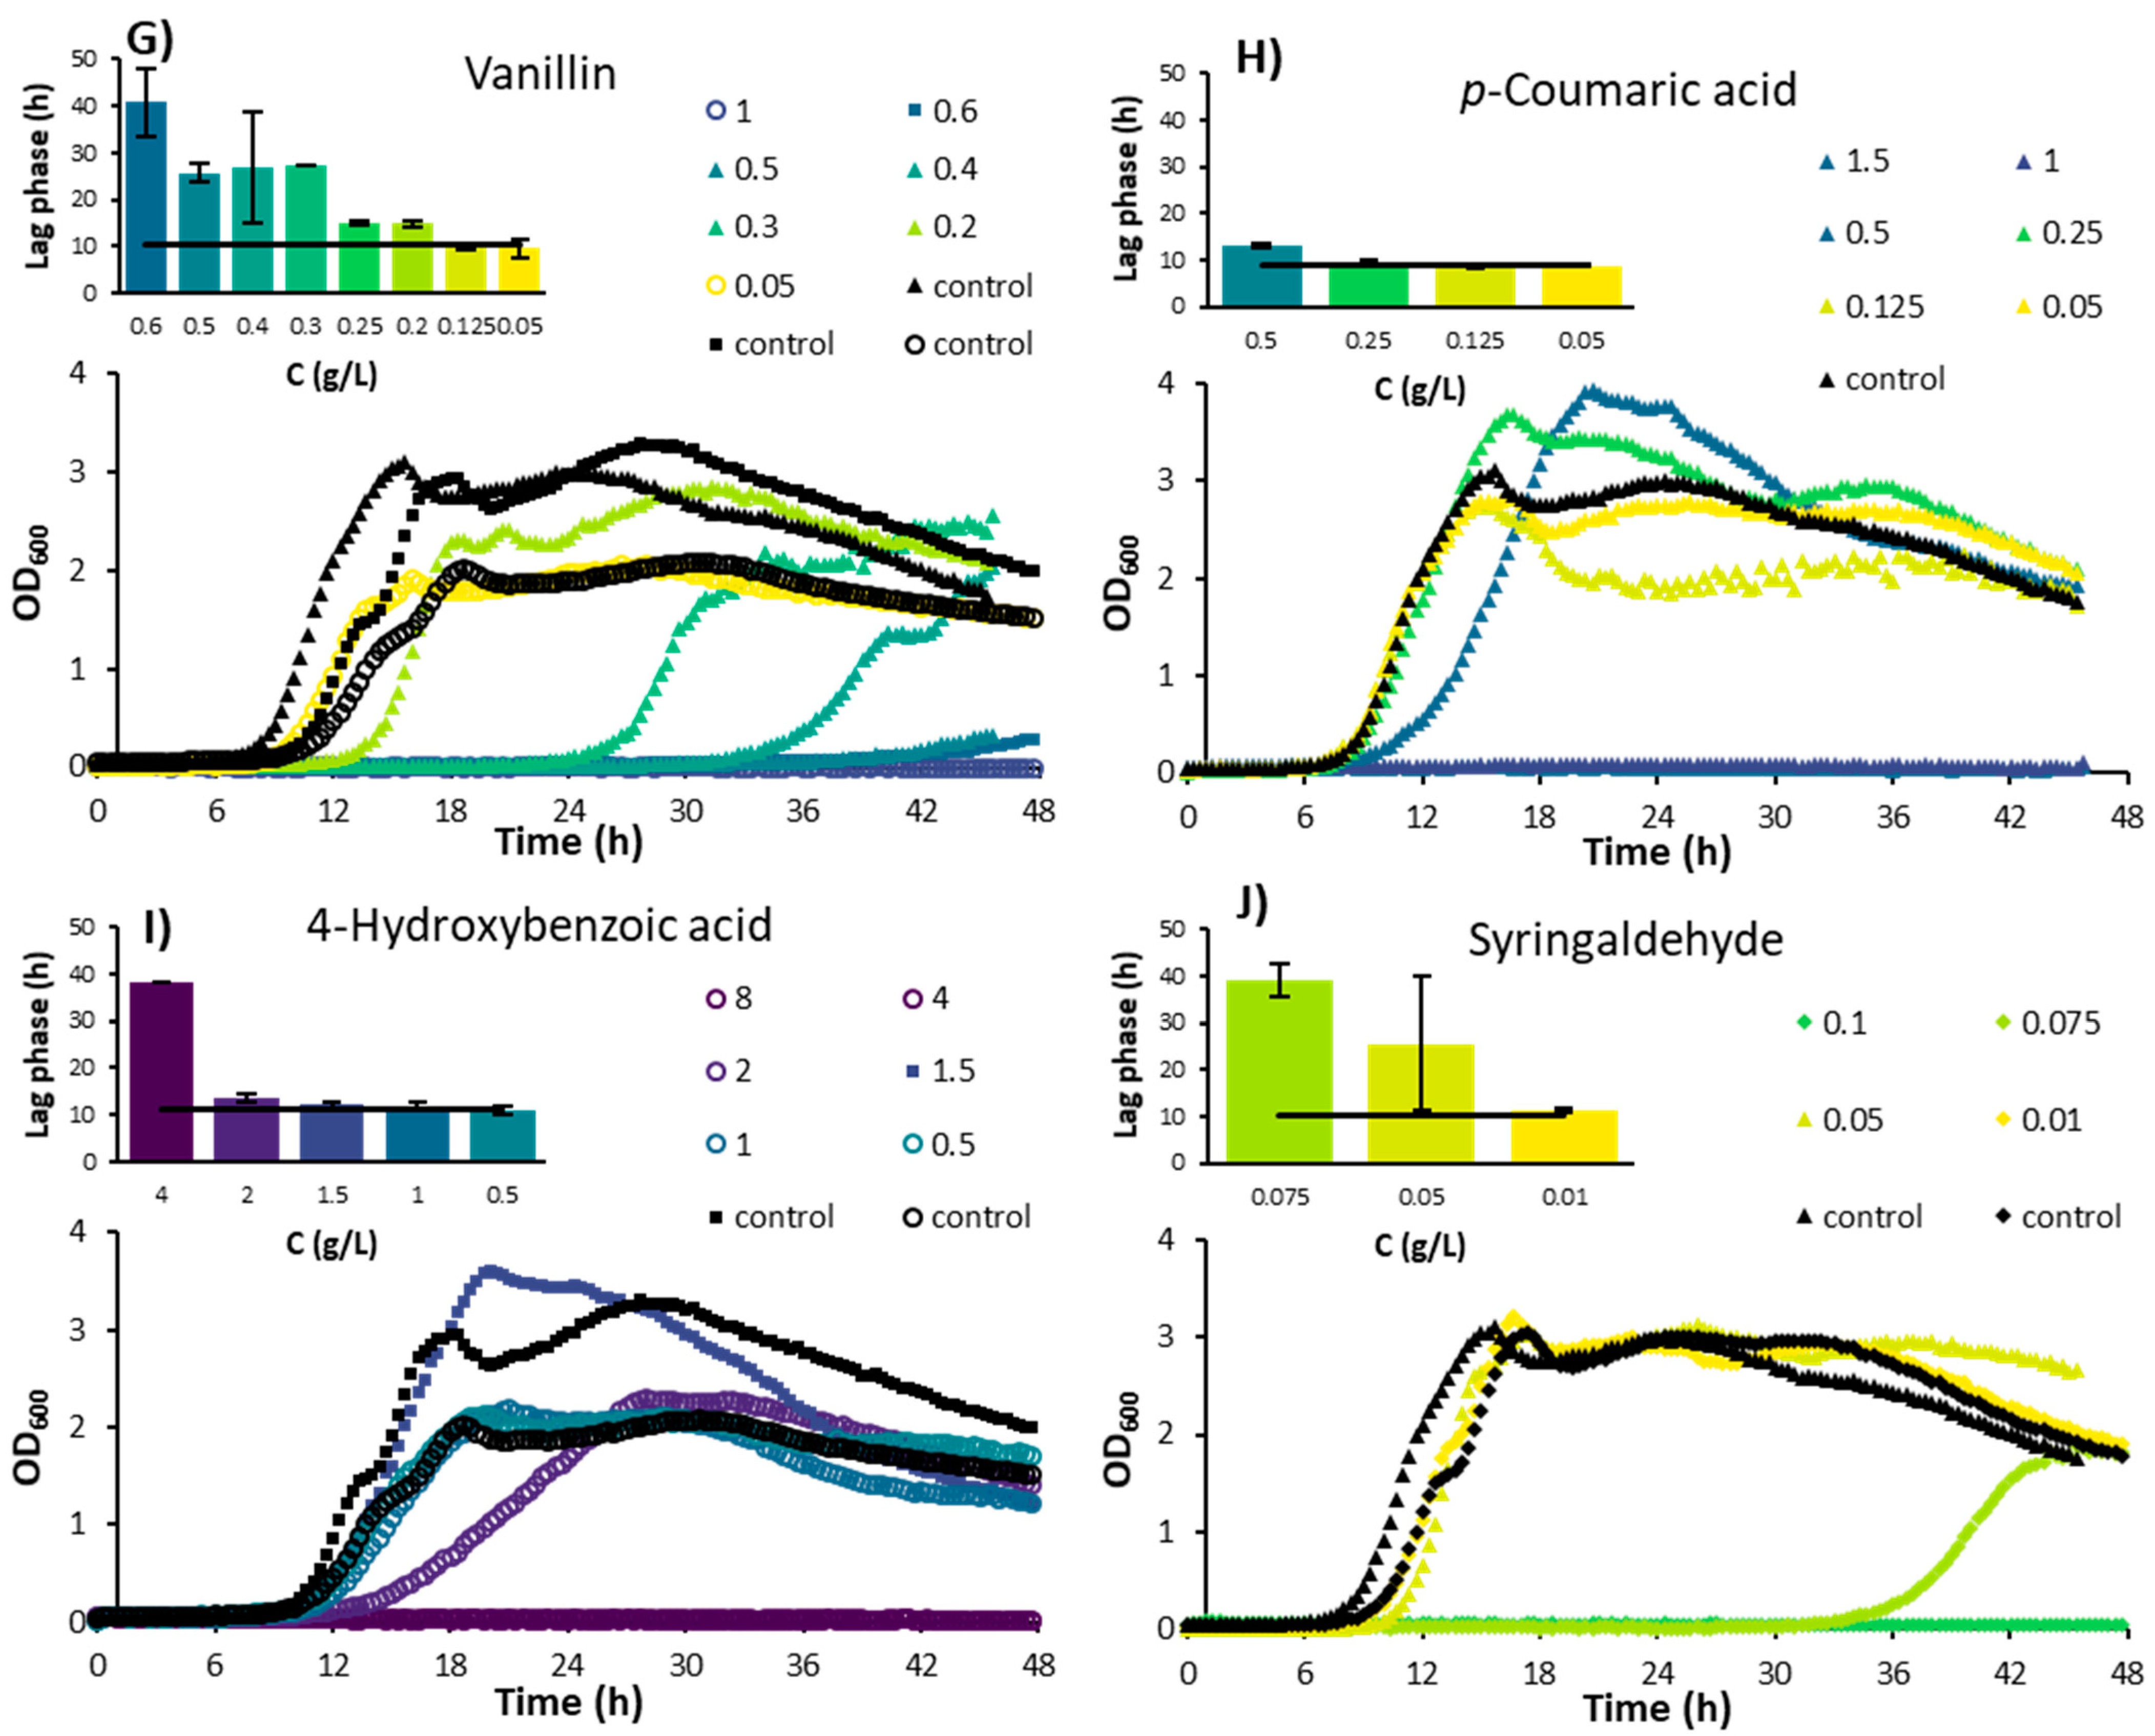
3.1.3. Phenolic Compounds

Phenolic compounds include acids (e.g., ferulic acid, p-coumaric acid, vanillic acid, 4-hydroxybenzoic acid), alcohols (e.g., guaiacol, catechol, vanillyl alcohol), and aldehydes (e.g., vanillin, syringaldehyde), some of which are considered the most potent inhibitors of microbial growth [30]. Molecular weight, polarity, and side groups dictate the specific inhibitory effect of each phenolic compound. Phenolic compounds generally cause a loss of integrity of cell membranes, leading to a loss of barrier capacity of the membrane. Consequently, a change in the intracellular environment occurs, reducing ATP levels, impairing proton motive force, and reducing protein function and nutrient transport [8]. In addition, phenolic compounds can cause enzyme denaturation, damage the cytoskeleton, as well as cause DNA damage by enhancing the formation of reactive oxygen species, and induce programmed cell death [31].
Ferulic acid, vanillic acid, and vanillin are derivatives of the guaiacyl building block of lignin [32]. For the range of 0.25–1.5 g/L of ferulic acid, the growth of B. subtilis was increasingly inhibited with a concomitant prolonged lag phase (Figure 1E and Figure 2C). The gradual increase in the lag phase might indicate that the organism has a way to adapt and survive under conditions with increasing levels of ferulic acid. For vanillic acid, a concentration of 2 g/L caused a reduction in growth to 55% compared to the control, with a 50% increase in the lag phase (Figure 1F and Figure 2C). At 4 g/L of vanillic acid, the growth rate was still at 35% of the control, while the lag phase was increased up to 36 h. This lag phase was longer than that with the chemically similar ferulic acid at the highest concentration, indicating that for vanillic acid, a coping mechanism might also be present. It was found that ferulic acid is a stronger inhibitor to the growth of Clostridium beijerincki than vanillic acid [33].
The results match with the effect of vanillic acid reported on the growth of other bacteria. For Escherichia coli and Bacillus cereus, for example, vanillic acid started to show a negative effect on the strain growth from 0.84 g/L and 0.42 g/L, respectively [34]. Although vanillin is chemically closely related to vanillic acid, it appears to be considerably more toxic. B. subtilis could not grow at vanillin concentrations higher than 0.6 g/L (Figure 1G and Figure 2C), while growth was still observed at 4 g/L of vanillic acid (Figure 1F and Figure 2C).
p-Coumaric acid and 4-hydroxybenzoic acid are derivatives from the p-hydroxyl building block of lignin [32]. While p-coumaric acid significantly inhibited the growth rate of B. subtilis in concentrations higher than 0.25 g/L, the lag phase did not increase as much as with other inhibitory acids such as ferulic, vanillic, or acetic acids (Figure 1H and Figure 2D). However, no growth was visible at concentrations of 1 g/L or higher. Herald and Davidson [35] studied the effect of p-coumaric acid on the growth of E. coli and B. cereus for different pH levels. Near-complete (99.5%) inhibition of B. cereus was found at a concentration of 0.5 g/L at all pH levels tested (6, 6.5, and 7). In contrast, a reduction of only 9% in the growth rate of E. coli was observed at 0.5 g/L and pH 7, whereas growth was completely inhibited at pH 5 at the same concentration. Similar to the toxicity of weak acids discussed previously, the inhibiting effect of p-coumaric acid for E. coli appeared to be heavily dependent on pH. When compared to other inhibitors such as ferulic, acetic, and vanillic acids, B. subtilis was inhibited at lower concentrations of p-coumaric acid without a strong increase in the lag phase. This might indicate that B. subtilis does not have a mechanism to adapt to the toxic effects of p-coumaric acid, while it does for ferulic, acetic, and vanillic acids.
4-Hydroxybenzoic acid is a phenolic derivative of benzoic acid. The inhibitory effect of 4-hydroxybenzoic acid on the growth rate of B. subtilis gradually increased with the increase in the concentration of 4-hydroxybenzoic acid to 2 g/L, while the lag phase was constant (Figure 1I and Figure 2D). However, at 4 g/L, the growth rate was significantly reduced, and the lag phase was increased to approximately 3.5 times the control lag phase. Unlike the present study, Cho et al. [36] found that the growth of B. subtilis was reduced to 50% of the control at a concentration of 0.956 g/L of 4-hydroxybenzoic acid. However, in their study, a paper disk assay was used, which was mentioned as showing inconsistent results compared to liquid cultures due to the solubility and polarity of 4-hydroxybenzoic acid.
Syringyl propanoids are abundant lignin building blocks in angiosperm plants, which includes all grain-type plants [31]. During pretreatment, syringyl propanoid building blocks of lignin can degrade to syringaldehyde, among other compounds. Syringaldehyde is known to play an important role in membrane disruption. In the present study, syringaldehyde was the most toxic compound to B. subtilis as no growth was observed at 0.1 g/L or higher concentrations (Figure 1J and Figure 2E). Syringaldehyde has also been reported to fully inhibit butanol production and significantly reduce the growth of Clostridium species at a concentration of 1 g/L [37].

3.2. Combined Effect of Inhibitory Compounds

For the optimization of the pretreatment conditions, or effectively engineering tolerant microbial strains, knowledge of the contribution of individual and combined inhibitors to the overall toxic level of lignocellulosic hydrolysates and the underlying toxicity mechanisms are important information still lacking in the literature. Some studies have focused on the interactions of inhibitors by factorial designs or binary combinations [17,27,38]. However, testing interactions of a multitude of inhibitors present in lignocellulosic biomass hydrolysates via factorial designs is not a feasible task when considering the vast number of experimental runs to be performed (2k, where k = number of inhibitors). Therefore, the main effect of each compound in a mixture of 10 inhibitors was tested in the present study using a Plackett–Burman experimental design. Although the Plackett–Burman design does not provide one-on-one interactions, this analysis does provide an indication of the main inhibitory effect when a large number of process parameters (presence of inhibitors) are used. Residual plots were used to verify whether the model is adequate and meets three general assumptions of the analysis: residuals are randomly distributed, residuals are independent of one another, and residuals are normally distributed (graphs not shown).
The relative magnitude of the main effects of each compound when present in a mixture are presented in the Pareto Chart plotted in Figure 3A. As can be seen, when present in a mixture, benzoic acid, furfural, vanillin, and syringaldehyde were the main inhibitory compounds affecting the growth rate of B. subtilis (results significant at p < 0.05).
It is worth noting that while all inhibitors were diluted equally in terms of inhibitory effect (12.5% of the IC50 value, shown in Figure 3B), results clearly show that the impact of each inhibitor is completely different when present in a mixture. A similar result was observed when evaluating the effect of inhibitory compounds on the growth of Rhodosporidium toruloides [9]. According to the authors, benzoic acid was the most potent individual inhibitor affecting the growth of the yeast, while in a mixture, furfural presented the highest toxicity. Zaldivar et al. [17] also found that binary combinations of inhibitors with furfural usually resulted in a stronger inhibition than that caused by the individual inhibitory compounds.
Since biomass hydrolysates often contain multiple inhibitors, understanding the combined effect of these compounds on microbial performance is of paramount importance to design an efficient strategy to maximize the yield of a bioprocess from lignocellulosic hydrolysates. In this sense, the experimental design performed in this study gives useful indications of the main effects of the tested compounds on the growth rate of B. subtilis when multiple inhibitors are present.

4. Conclusions

Using a systematic approach, this study provides a solid base on the individual and combined effects of 10 inhibitors on the growth of Bacillus subtilis. When considering individual effects, syringaldehyde was the most toxic compound affecting microbial performance, whereas benzoic acid and furfural had the biggest main effects from a mixture of inhibitors. By combining the information provided in this study with the compositional analysis of a lignocellulosic hydrolysate, better predictions related to the potential toxicity of the hydrolysate and poor microbial performance can be made. This will allow scientists to prioritize strategies to overcome toxicity, not only for detoxification purposes but also for adaptive laboratory evolution experiments, to increase the tolerance of the strain to specific toxic compounds present in the hydrolysate to be used, accelerating the development of efficient fermentation processes using complex media produced from lignocellulosic biomass.

Supplementary Materials

The following are available online at https://www.mdpi.com/article/10.3390/en14248419/s1, Figure S1: Residual plots from Plackett Burman design; Table S1: Codded coefficients of Plackett Burman; Table S2: Analysis of variance from Plackett Burman.

Author Contributions

Conceptualization, S.I.M.; methodology, L.v.d.M. and J.L.S.P.D.; validation, S.I.M.; formal analysis, L.v.d.M. and J.L.S.P.D.; resources, S.I.M.; writing—original draft preparation, L.v.d.M. and J.L.S.P.D.; writing—review and editing, S.I.M.; supervision, S.I.M.; project administration, S.I.M.; funding acquisition, S.I.M. All authors have read and agreed to the published version of the manuscript.

Funding

This research was funded by the Novo Nordisk Foundation (NNF), Denmark, grant number NNF20SA0066233. PhD fellowships were covered by the NNF grant NNF17SA0031362.

Institutional Review Board Statement

Not applicable.

Informed Consent Statement

Not applicable.

Data Availability Statement

Not applicable.

Acknowledgments

The authors would like to thank Francesco Reggianini for his support with some of the experimental work and data analysis.

Conflicts of Interest

The authors declare no conflict of interest.

References

  1. Dahmen, N.; Lewandowski, I.; Zibek, S.; Weidtmann, A. Integrated lignocellulosic value chains in a growing bioeconomy: Status quo and perspectives. GCB Bioenergy 2018, 11, 107–117. [Google Scholar] [CrossRef] [Green Version]
  2. Mussatto, S.I.; Yamakawa, C.K.; van der Maas, L.; Dragone, G. New trends in bioprocesses for lignocellulosic biomass and CO2 utilization. Renew. Sustain. Energy Rev. 2021, 152, 111620. [Google Scholar] [CrossRef]
  3. Dragone, G.; Kerssemakers, A.A.J.; Driessen, J.L.S.P.; Yamakawa, C.K.; Brumano, L.P.; Mussatto, S.I. Innovation and strategic orientations for the development of advanced biorefineries. Bioresour. Technol. 2020, 302, 122847. [Google Scholar] [CrossRef]
  4. BCC Research. Global Markets for Enzymes in Industrial Applications. Available online: https://www.bccresearch.com/market-research/biotechnology/global-markets-for-enzymes-in-industrial-applications.html (accessed on 23 October 2021).
  5. Ravindran, R.; Hassan, S.S.; Williams, G.A.; Jaiswal, A.K. A review on bioconversion of agro-industrial wastes to industrially important enzymes. Bioengineering 2018, 5, 93. [Google Scholar] [CrossRef] [PubMed] [Green Version]
  6. Mussatto, S.I.; Dragone, G. Biomass pretreatment, biorefineries, and potential products for a bioeconomy development. In Biomass Fractionation Technologies for a Lignocellulosic Feedstock Based Biorefinery; Mussatto, S.I., Ed.; Elsevier: Amsterdam, The Netherlands, 2016; pp. 1–22. [Google Scholar] [CrossRef]
  7. Sivagurunathan, P.; Kumar, G.; Mudhoo, A.; Rene, E.R.; Saratale, G.D.; Kobayashi, T.; Xu, K.; Kim, S.-H.; Kim, D.-H. Fermentative hydrogen production using lignocellulose biomass: An overview of pre-treatment methods, inhibitor effects and detoxification experiences. Renew. Sustain. Energy Rev. 2017, 77, 28–42. [Google Scholar] [CrossRef]
  8. Mussatto, S.I.; Roberto, I.C. Alternatives for detoxification of diluted-acid lignocellulosic hydrolyzates for use in fermentative processes: A review. Bioresour. Technol. 2004, 93, 1–10. [Google Scholar] [CrossRef] [PubMed]
  9. Liu, Z.; Fels, M.; Dragone, G.; Mussatto, S.I. Effects of inhibitory compounds derived from lignocellulosic biomass on the growth of the wild-type and evolved oleaginous yeast Rhodosporidium toruloides. Ind. Crops Prod. 2021, 170, 113799. [Google Scholar] [CrossRef]
  10. Schallmey, M.; Singh, A.; Ward, O.P. Developments in the use of Bacillus species for industrial production. Can. J. Microbiol. 2004, 50, 1–17. [Google Scholar] [CrossRef] [PubMed]
  11. Hemmerich, J.; Wiechert, W.; Oldiges, M. Automated growth rate determination in high-throughput microbioreactor systems. BMC Res. Notes 2017, 10, 617. [Google Scholar] [CrossRef] [Green Version]
  12. Buchanan, R.L.; Cygnarowicz, M.L. A mathematical approach toward defining and calculating the duration of the lag phase. Food Microbiol. 1990, 7, 237–240. [Google Scholar] [CrossRef]
  13. Klyachko, K.A.; Schuldiner, S.; Neyfakh, A.A. Mutations affecting substrate specificity of the Bacillus subtilis multidrug transporter Bmr. J. Bacteriol. 1997, 179, 2189–2193. [Google Scholar] [CrossRef] [Green Version]
  14. Beres, D.L.; Hawkins, D.M. Plackett-Burman technique for sensitivity analysis of many-parametered models. Ecol. Model. 2001, 141, 171–183. [Google Scholar] [CrossRef]
  15. Hadi, S.M.; Shahabuddin; Rehman, A. Specificity of the interaction of furfural with DNA. Mutat. Res. Lett. 1989, 225, 101–106. [Google Scholar] [CrossRef]
  16. Modig, T.; Lidén, G.; Taherzadeh, M.J. Inhibition effects of furfural on alcohol dehydrogenase, aldehyde dehydrogenase and pyruvate dehydrogenase. Biochem. J. 2002, 363, 769–776. [Google Scholar] [CrossRef] [PubMed]
  17. Zaldivar, J.; Martinez, A.; Ingram, L.O. Effect of selected aldehydes on the growth and fermentation of ethanologenic Escherichia coli. Biotechnol. Bioeng. 1999, 65, 24–33. [Google Scholar] [CrossRef]
  18. Roberto, I.C.; Lacis, L.S.; Barbosa, M.F.S.; Mancilha, I.M. Utilization of sugar cane bagasse hemicellulosic hydrolysate by Pichia stipitis for the production of ethanol. Process Biochem. 1991, 26, 15–21. [Google Scholar] [CrossRef]
  19. Zheng, D.; Bao, J.; Lu, J.; Lv, Q. Biodegradation of furfural by Bacillus subtilis strain DS3. J. Environ. Biol. 2015, 36, 727–732. [Google Scholar]
  20. Zhang, Y.; Chen, X.; Luo, J.; Qi, B.; Wan, Y. An efficient process for lactic acid production from wheat straw by a newly isolated Bacillus coagulans strain IPE22. Bioresour. Technol. 2014, 158, 396–399. [Google Scholar] [CrossRef]
  21. Pereira, J.P.C.; Verheijen, P.J.T.; Straathof, A.J.J. Growth inhibition of S. cerevisiae, B. subtilis, and E. coli by lignocellulosic and fermentation products. Appl. Microbiol. Biotechnol. 2016, 100, 9069–9080. [Google Scholar] [CrossRef] [Green Version]
  22. Imai, T.; Ohno, T. The relationship between viability and intracellular pH in the yeast Saccharomyces cerevisiae. Appl. Environ. Microbiol. 1995, 61, 3604–3608. [Google Scholar] [CrossRef] [PubMed] [Green Version]
  23. Pampulha, M.E.; Loureiro-Dias, M.C. Activity of glycolytic enzymes of Saccharomyces cerevisiae in the presence of acetic acid. Appl. Microbiol. Biotechnol. 1990, 34, 375–380. [Google Scholar] [CrossRef]
  24. Speck, E.L.; Freese, E. Control of metabolite secretion in Bacillus subtilis. J. Gen. Microbiol. 1973, 78, 261–275. [Google Scholar] [CrossRef] [Green Version]
  25. Van Zyl, C.; Prior, B.A.; du Preez, J.C. Acetic acid inhibition of d-xylose fermentation by Pichia stipitis. Enzyme Microb. Technol. 1991, 13, 82–86. [Google Scholar] [CrossRef]
  26. Felipe, M.G.A.; Vieira, D.C.; Vitolo, M.; Silva, S.S.; Roberto, I.C.; Manchilha, I.M. Effect of acetic acid on xylose fermentation to xylitol by Candida guilliermondii. J. Basic Microbiol. 1995, 35, 171–177. [Google Scholar] [CrossRef]
  27. Palmqvist, E.; Grage, H.; Meinander, N.Q.; Hahn-Hägerdal, B. Main and interaction effects of acetic acid, furfural, and p- hydroxybenzoic acid on growth and ethanol productivity of yeasts. Biotechnol. Bioeng. 1999, 63, 46–55. [Google Scholar] [CrossRef]
  28. Warth, A.D. Effect of Benzoic Acid on Growth Yield of Yeasts Differing in Their Resistance to Preservatives. Appl. Environ. Microbiol. 1988, 54, 2091–2095. [Google Scholar] [CrossRef] [PubMed] [Green Version]
  29. Chipley, J.R. Sodium benzoate and benzoic acid. In Food Science and Technology; Marcel Dekker: New York, NY, USA, 2005; Volume 145, p. 11. [Google Scholar]
  30. Ibraheem, O.; Ndimba, B.K. Molecular adaptation mechanisms employed by ethanologenic bacteria in response to lignocellulose-derived inhibitory compounds. Int. J. Biol. Sci. 2013, 9, 598–612. [Google Scholar] [CrossRef] [Green Version]
  31. Van der Pol, E.C.; Bakker, R.R.; Baets, P.; Eggink, G. By-products resulting from lignocellulose pretreatment and their inhibitory effect on fermentations for (bio)chemicals and fuels. Appl. Microbiol. Biotechnol. 2014, 98, 9579–9593. [Google Scholar] [CrossRef] [PubMed]
  32. Gu, H.; Zhu, Y.; Peng, Y.; Liang, X.; Liu, X.; Shao, L.; Xu, Y.; Xu, Z.; Liu, R.; Li, J. Physiological mechanism of improved tolerance of Saccharomyces cerevisiae to lignin-derived phenolic acids in lignocellulosic ethanol fermentation by short-term adaptation. Biotechnol. Biofuels 2019, 12, 268. [Google Scholar] [CrossRef] [PubMed] [Green Version]
  33. Cho, D.H.; Lee, Y.J.; Um, Y.; Sang, B.-I.; Kim, Y.H. Detoxification of model phenolic compounds in lignocellulosic hydrolysates with peroxidase for butanol production from Clostridium beijerinckii. Appl Microbiol. Biotechnol. 2009, 83, 1035–1043. [Google Scholar] [CrossRef]
  34. Merkl, R.; Hrádková, I.; Filip, V.; Šmidrkal, J. Antimicrobial and antioxidant properties of phenolic acids alkyl esters. Czech J. Food Sci. 2010, 28, 275–279. [Google Scholar] [CrossRef] [Green Version]
  35. Herald, P.J.; Davidson, P.M. Antibacterial activity of selected hydroxycinnamic acids. J. Food Sci. 1983, 48, 1378–1379. [Google Scholar] [CrossRef]
  36. Cho, J.-Y.; Moon, J.-H.; Seong, K.-Y.; Park, K.-H. Antimicrobial activity of 4-hydroxybenzoic acid and trans 4-hydroxycinnamic acid isolated and identified from rice hull. Biosci. Biotechnol. Biochem. 1998, 62, 2273–2276. [Google Scholar] [CrossRef] [PubMed] [Green Version]
  37. Baral, N.R.; Shah, A. Microbial inhibitors: Formation and effects on acetone-butanol-ethanol fermentation of lignocellulosic biomass. Appl. Microbiol. Biotechnol. 2014, 98, 9151–9172. [Google Scholar] [CrossRef] [PubMed]
  38. Franden, M.A.; Pilath, H.M.; Mohagheghi, A.; Pienkos, P.T.; Zhang, M. Inhibition of growth of Zymomonas mobilis by model compounds found in lignocellulosic hydrolysates. Biotechnol. Biofuels 2013, 6, 99. [Google Scholar] [CrossRef] [Green Version]
Figure 1. Experimental growth curves of Bacillus subtilis in M9 minimal media containing different concentrations of inhibitory compounds. (A) Furfural; (B) 5-Hydroxymethylfurfural (5-HMF); (C) Acetic acid; (D) Benzoic acid; (E) Ferulic acid; (F) Vanillic acid; (G) Vanillin; (H) p-Coumaric acid; (I) 4-Hydroxybenzoic acid; (J) Syringaldehyde. Average standard deviation of the data points was 17%. The lag phases shown in the bar graphs are average values of multiple experiments. The black line corresponds to the average lag phase of the controls without inhibitors present.
Energies 14 08419 g001aEnergies 14 08419 g001b
Figure 2. Average growth rates of Bacillus subtilis cultivated in M9 minimal media containing different concentrations of inhibitory compounds. (A) Furan derivatives; (B) Weak acids; (C) Guaiacyl derivatives; (D) p-Hydroxyl derivatives; (E) Syringaldehyde. Data from 4 independent experiments were normalized to the corresponding control, and average values are shown.
Energies 14 08419 g002
Figure 3. (A): Pareto chart of standardized effects to estimate the effect of inhibitors on the reduction in the growth rate of B. subtilis. Bars exceeding the dashed red reference line have a significant main effect for p < 0.05. A: 5-HMF; B: Furfural; C: Acetic acid; D: Vanillin; E: Vanillic acid; F: Benzoic acid; G: 4-Hydroxybenzoic acid (4HBA); H: Ferulic acid (TFA); J: Syringaldehyde; K: p-Coumaric acid (PCA). (B): IC50 values determined to each inhibitory compound.
Energies 14 08419 g003
Publisher’s Note: MDPI stays neutral with regard to jurisdictional claims in published maps and institutional affiliations.

