Article

Intelligent Multi-Vehicle DC/DC Charging Station Powered by a Trolley Bus Catenary Grid

1
Chair of Electric Mobility and Energy Storage Systems, University of Wuppertal, Rainer Gruenter Straße 21, 42119 Wuppertal, Germany
2
Institute of Electrical Machines and Drives, University of Wuppertal, Rainer Gruenter Straße 21, 42119 Wuppertal, Germany
*
Authors to whom correspondence should be addressed.
These authors contributed equally to this work.
Energies 2021, 14(24), 8399; https://doi.org/10.3390/en14248399
Submission received: 30 October 2021 / Revised: 21 November 2021 / Accepted: 30 November 2021 / Published: 13 December 2021
(This article belongs to the Special Issue Smart Energy Management for Electric and Hybrid Electric Vehicles)

Abstract

:
This article deals with the major challenge of electric vehicle charging infrastructure in urban areas—installing as many fast charging stations as necessary and using them as efficiently as possible, while considering grid level power limitations. A smart fast charging station with four vehicle access points and an intelligent load management algorithm based on the combined charging system interface is presented. The shortcomings of present implementations of the combined charging system communication protocol are identified and discussed. Practical experiments and simulations of different charging scenarios validate the concept and show that the concept can increase the utilization time and the supplied energy by a factor of 2.4 compared to typical charging station installations.

Graphical Abstract

1. Introduction

The complexity of the development of intelligent fast charging infrastructure for electric vehicles (EV) is high. It involves specialized power electronics, bidirectional digital communication, and specialized control algorithms. The following sections will first provide a general introduction to the overall topic and then narrow it down to the specific application.

1.1. General Introduction

The sales volume of electric vehicles has increased in recent years. By the end of 2020, over 10 million EVs had already been registered worldwide [1]. Compared to 7.3 million registered EVs by the end of 2019 [2], this was a remarkable development, accelerated by national and international policies and targets as well as a rethinking in society regarding climate protection measures. Nevertheless, to achieve global climate protection goals (e.g., Paris Agreement [3]), the number of EVs to replace gasoline-fueled vehicles must increase significantly.
The European Union (EU) aims to reach climate neutrality by 2050 [4] and thus a share of 100% of zero-emission vehicles (ZEV) in the whole vehicle stock in the EU by 2050 [5]. The transport sector has a significant influence on greenhouse gas emissions: in [6], the authors emphasize that the transport sector (including aviation and shipping) has a share of one third (32%) of total CO2 emissions in the EU, whereas 72% of these emissions were caused by road transport in 2017. In addition, ground transport accounts for 15% of today’s worldwide energy-related CO2 emissions [7]. Hence, the ambitious goal of the EU and other countries and regions regarding EVs can help to reduce the global warming caused by humans.
However, the increasing sales volume of EVs leads to challenges. One such challenge is the installation of a sufficient number of charging stations to handle the increasing demand. The common charging systems can be divided into slow chargers (3–7 kW, AC), normal chargers (11–22 kW, AC), fast chargers (50–100 kW, DC), and ultra-fast chargers (>100 kW, DC) [8]. Depending on the charging power, battery capacity, and state of charge (SoC), average charging times vary between less than 20 min (ultra-fast) and up to 7–16 h (slow) [8]. A more detailed technical introduction to the several charging modes is presented in Section Two.
The majority of EV owners charge their vehicles at home or work [1]. Nevertheless, the expansion of public charging systems plays an important role, particularly for people who live in apartments without the possibility of charging their EVs at home. Furthermore, public charging systems, especially fast and ultra-fast chargers on highways, are necessary for long-distance traveling [8]. Hence, an increasing number of charging stations in public areas could be an incentive to purchase EVs.
In 2020, 1.3 million public charging stations had been installed worldwide, of which 30% were fast chargers (above 22 kW) [1]. The majority of these chargers (500,000) were installed in China. According to the report [9], the total number of charging stations in publicly accessible areas in the United States increased in the third quarter of 2020 to 88,093. The EU has already installed 250,000 public charging stations (e.g., 63,000 in the Netherlands) [1]. With regard to the target of 1 million public charging and refueling stations for ZEV and low-emission vehicles by 2025 as stated in the European Green Deal [10], there is a considerable gap between the set goals and the current progress. Thus, companies, research institutions, municipalities, and policymakers in the field of EVs need to develop, among others, charging technologies, charging strategies, and a legal framework (incentives, etc.) to close this gap, as this is one of the greatest barriers to the purchase of EVs [11].

1.2. The Potential of Multi-Vehicle Charging

The charging infrastructure is a key factor in the successful change to a climate-friendly transport sector as mentioned above. Today, the majority of DC charging stations provide only one or two dedicated charge points per set of power electronics. In this scenario that EVs remain parked at the charger after finishing the charging process, the charging station is blocked for use by other EVs. This produces a conflict for fast chargers in urban settings, as the average length of time parked is generally great when compared to the time needed to charge the EV, which is generally less than 1 h, depending on the available power of the fast charger and the EV. The authors in [12] anticipate an average public charging station utilization per day of 4.7 h, at 100,000 vehicles per million population, in metropolitan areas for normal and fast chargers in the UK. The utilization is expected to increase as the normalized number of EVs rises. The average utilization time is still low, and the demand for public chargers likely focused around specific times of day, e.g., rush hour. This means that DC-fast chargers with the ability to supply more than one or two charge points have the benefit of providing additional low power charge points during peak demand times and fast charging capability in off-peak hours. This increases the overall utilization of the charger. In addition, the charging power under real conditions depends on the battery management system and ambient temperature. Furthermore, manufacturers apply different charging profiles for the constant-current/constant-voltage (CCCV) charging method [13]. Therefore, it must be acknowledged that the maximum available charging power of a fast charging station is not required over the entire duration of the charging process. Thus, the development of a charging station with multiple charge points and multiple dynamically interconnected power electronics modules presented in this paper (see Section 3) can increase the utilization factor of the power electronics significantly.

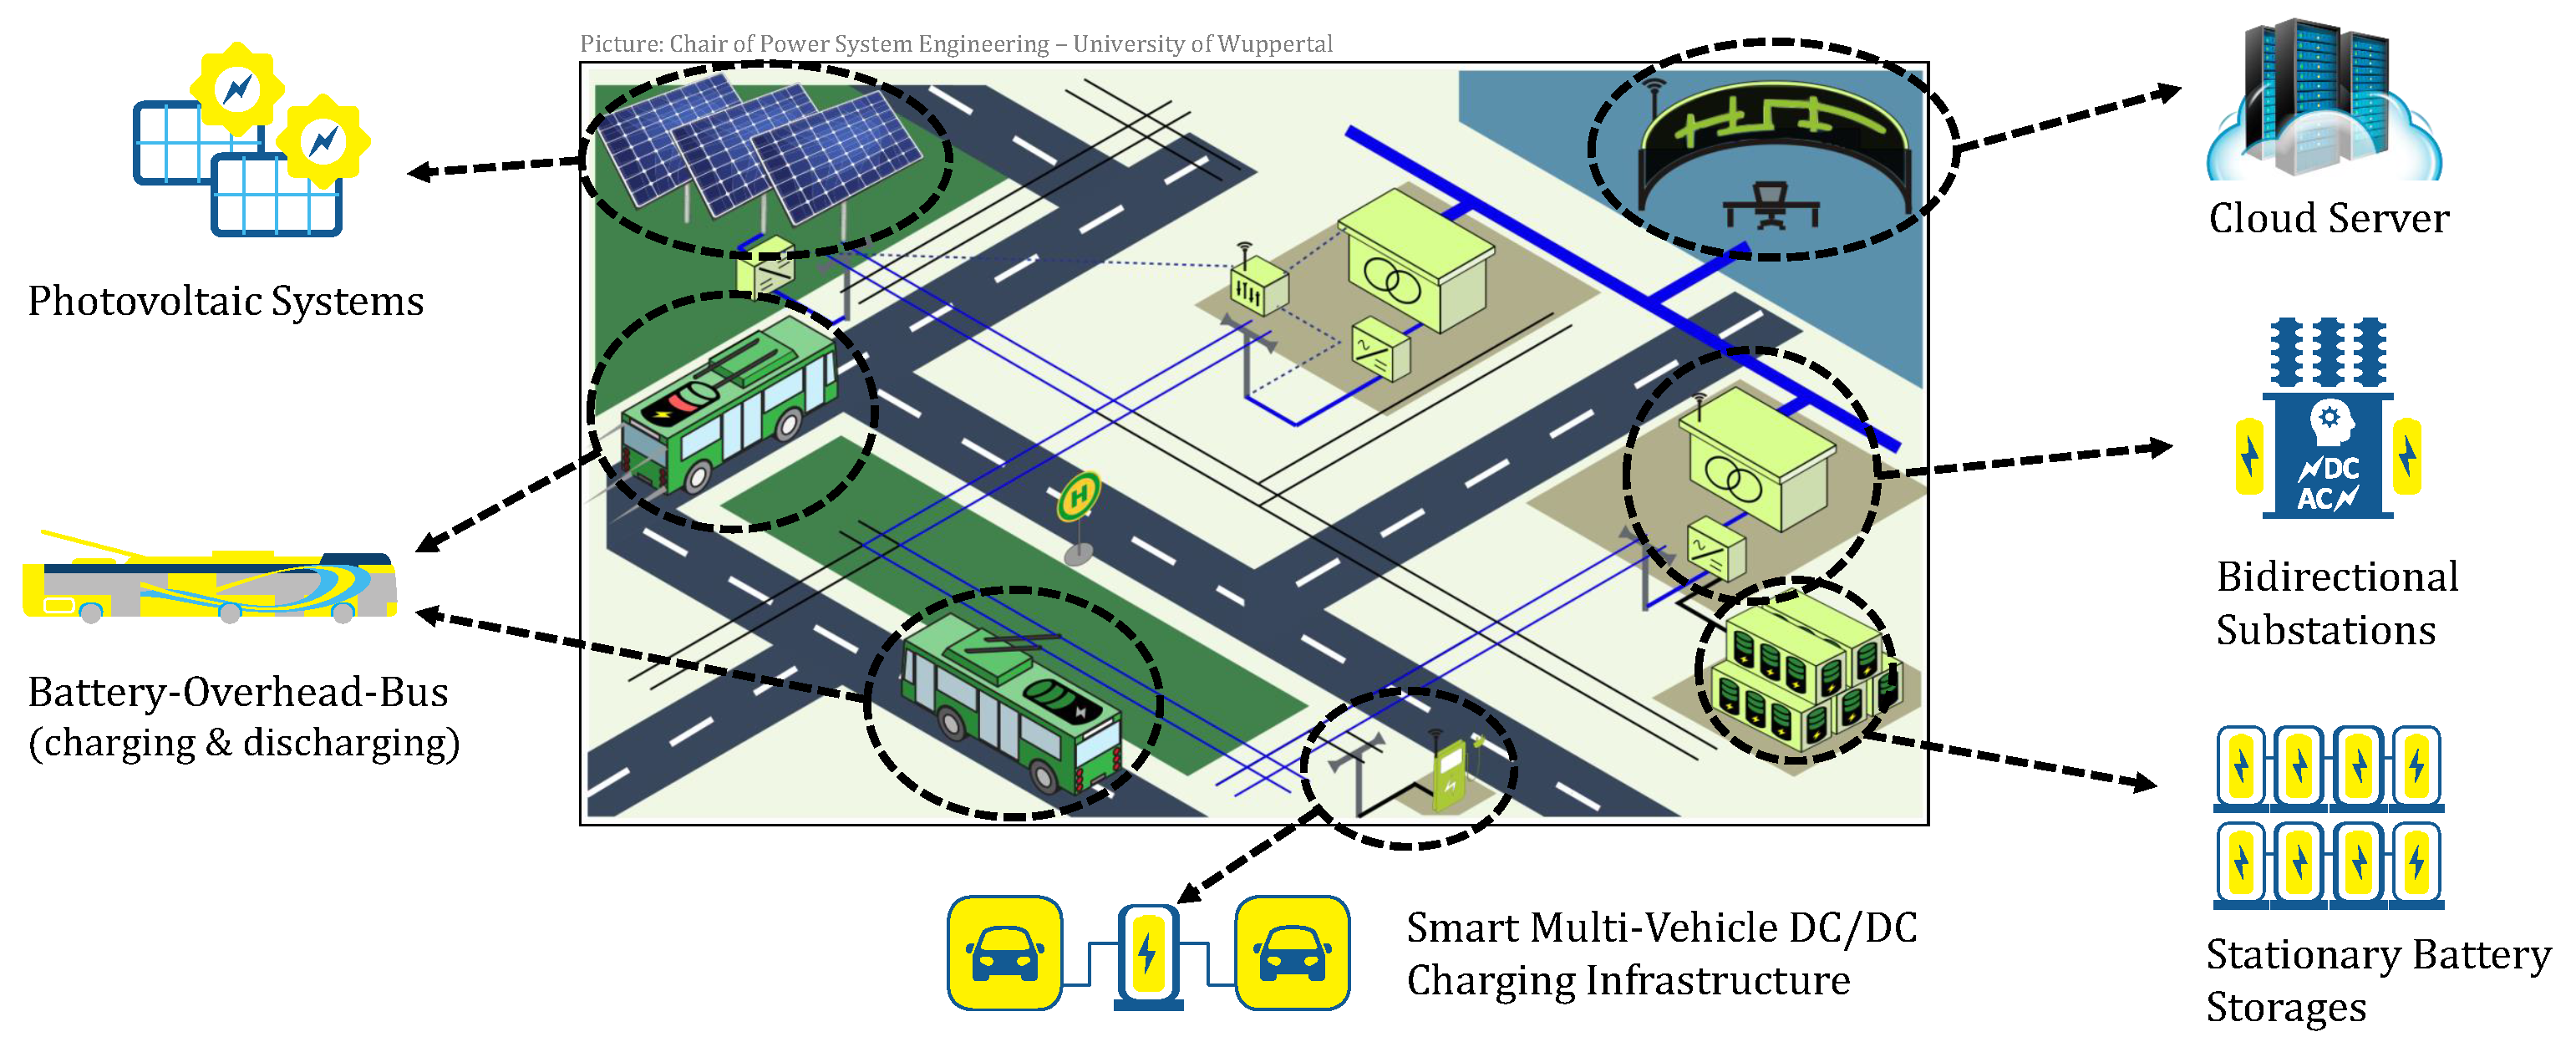
1.3. Research Environment—The Catenary Grid of Solingen

About 300 trolleybus systems are currently in use around the world in 43 different countries. In the German city of Solingen, where the battery-overhead-bus (BOB) project takes place, a large overhead grid, spanning about 100 km of power-line, had supplied a significant share of the local public transportation for nearly 70 years. On routes without or with only partially available overhead lines, diesel-powered buses, and their respective supplementary diesel units had always proven necessary until, in 2018, BOBs were introduced on one test line to overcome this limitation, allowing a fully electrified bus fleet in the near future. A smart trolleybus system (STS) is created to improve environmental sustainability and economic efficiency. The STS, presented in Figure 1, is supplemented by renewable energy and local energy storage and combined with bidirectional substations, sophisticated control algorithms, and overhead-line-driven public fast charging stations presented in this paper. This project is funded with EUR 15 million by the German Federal Ministry of Transport and Digital Infrastructure and is called BOB Solingen.

2. State of the Art

The state of the art of fast charging electric vehicle charging stations is examined below. The first section focuses on hardware, and the following discusses the relevant standards involved, and the current control algorithm.

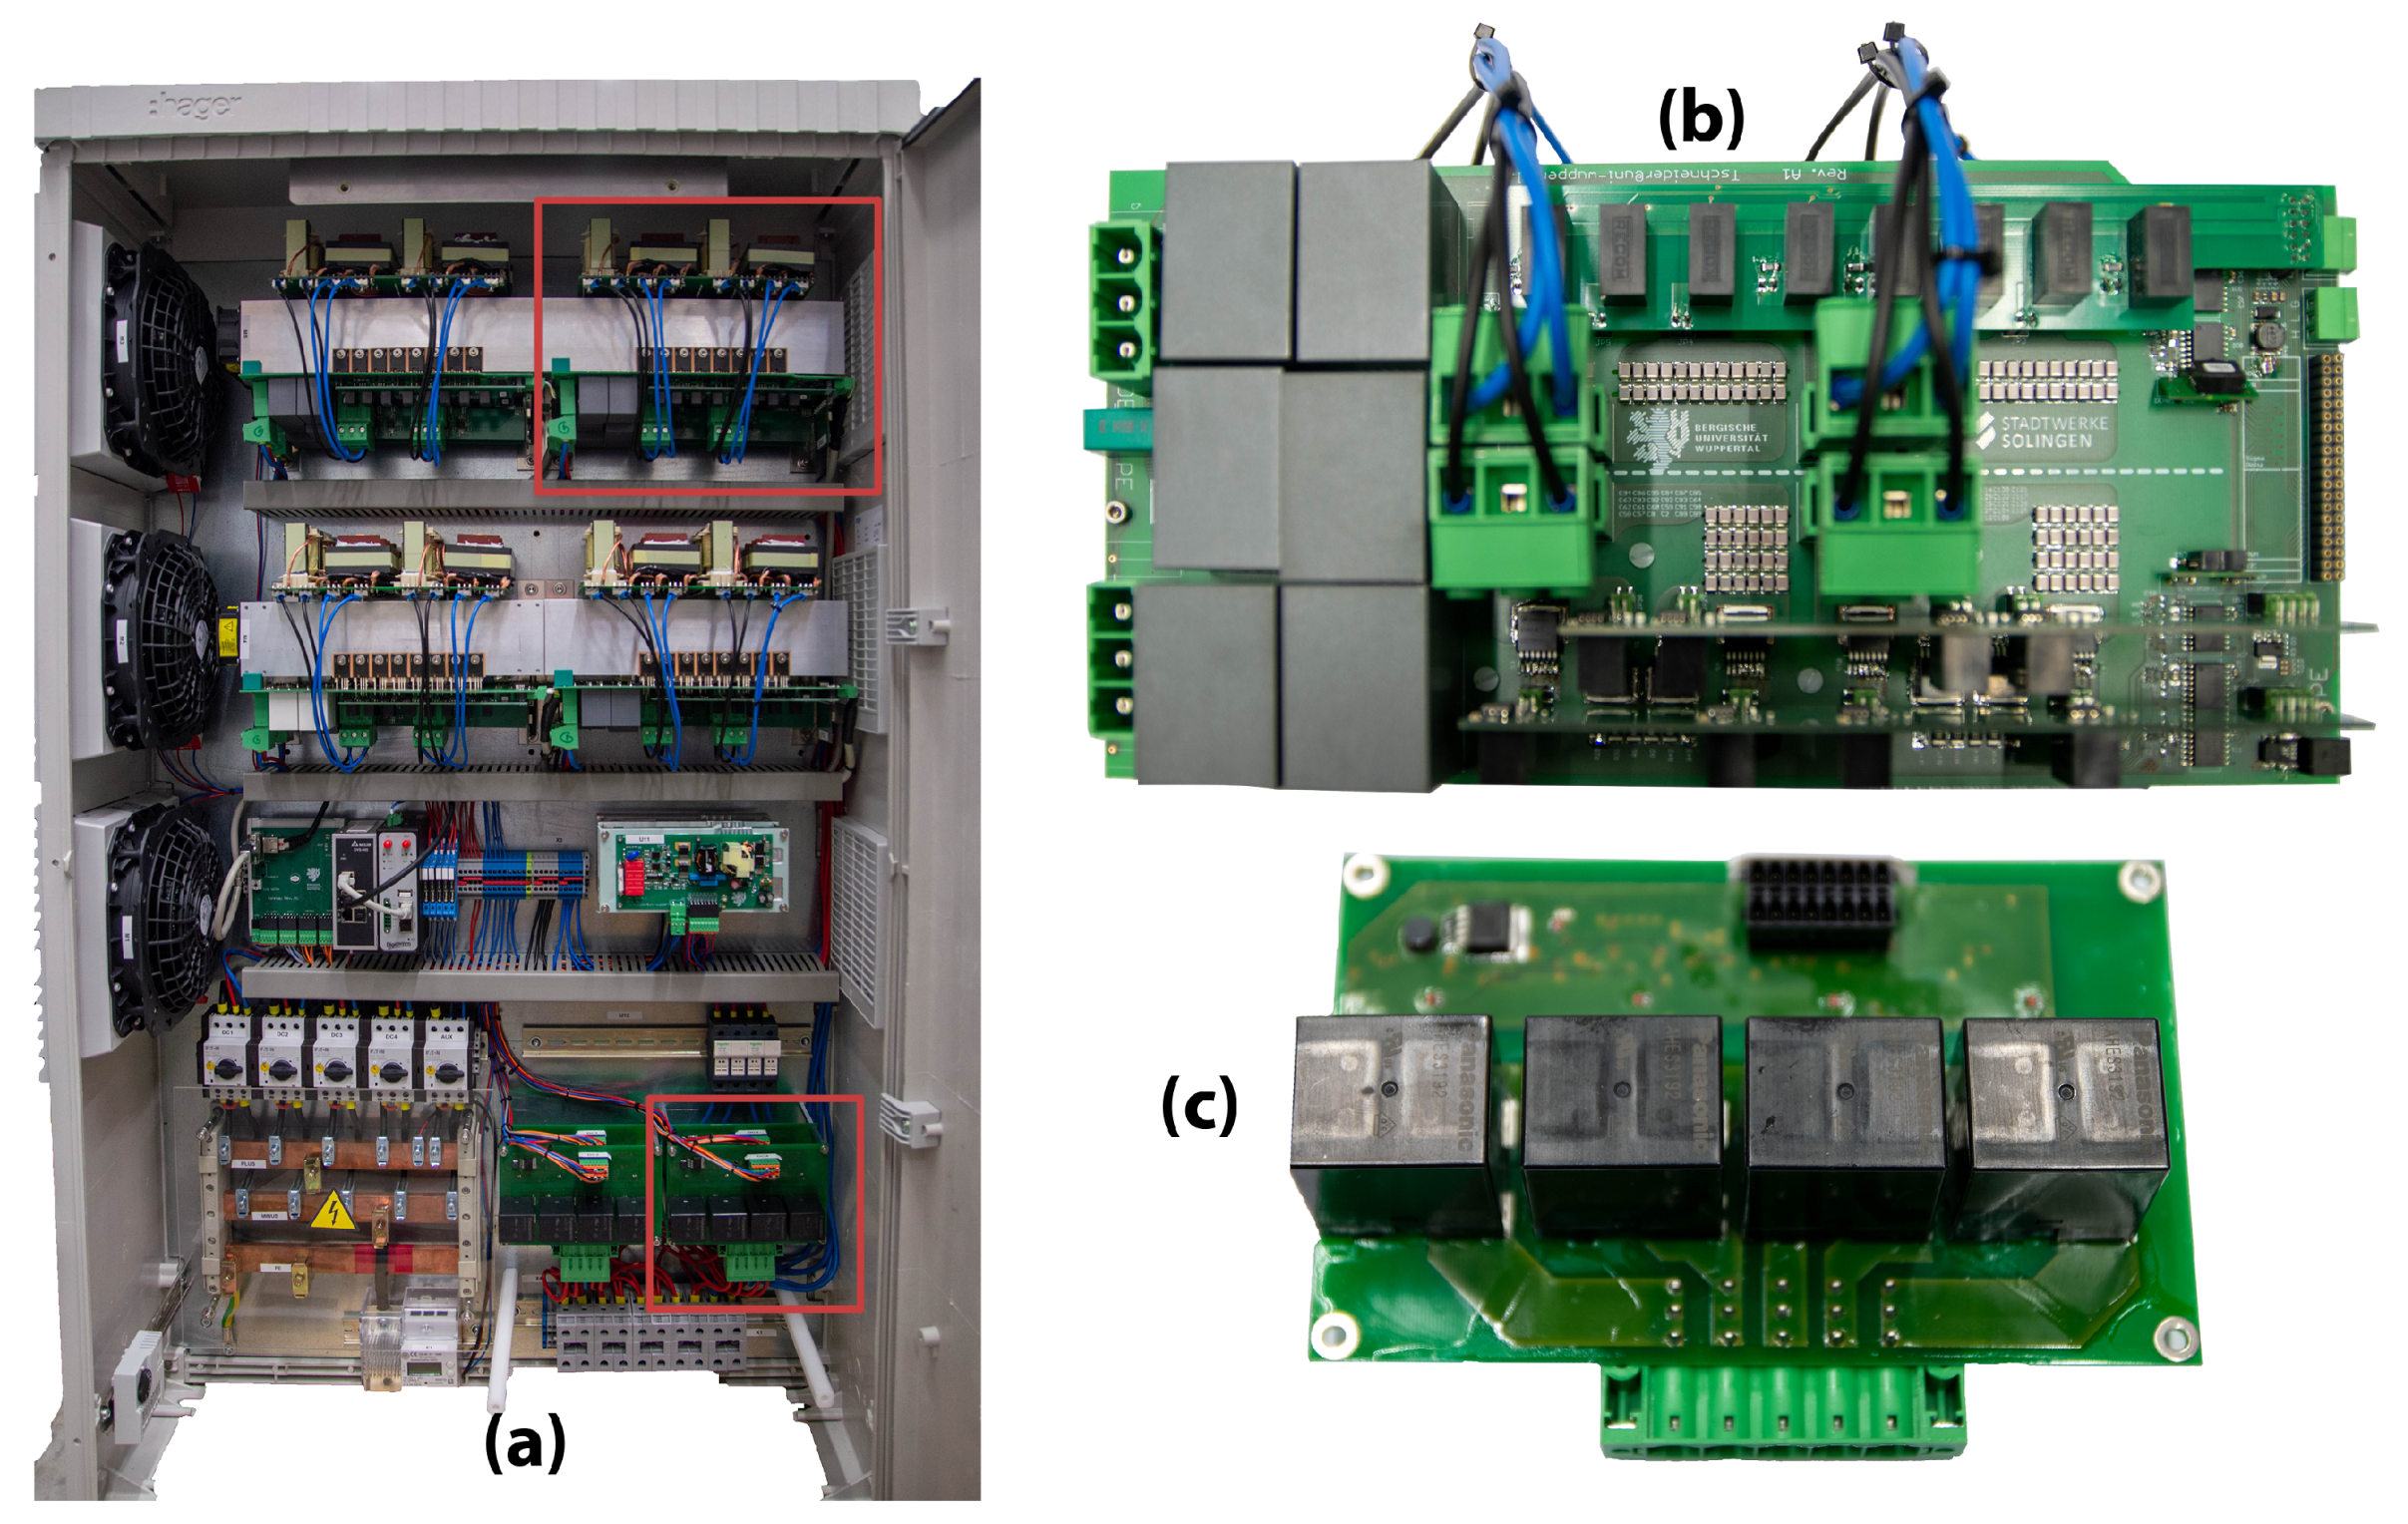
2.1. Hardware Fundamentals

The international standard IEC61851-1 defines four modes of EV charging, which are shown in Table 1. In general, in mode one, the charging current is defined by the terminal interface and cannot be controlled as there is no communication between the EV and the power outlet. Mode two and three use a pulse width modulation (PWM) signal for communication to transmit the maximum current limit of the electric vehicle supply equipment (EVSE). The charging power for mode two, however, is low, with a maximum of 22 kW. Only modes three and four can be classified as fast charging. Mode four necessitates a digital bidirectional communication protocol, either via a controller area network (CAN bus) or power line communication (PLC).
Modes one and two are commonly used for home charging in residential areas with long parking durations due to the low power transmission. Since AC fast charging is possible with mode three utilizing its maximum power of 43.5 kW, this mode is suitable for charging stations in urban areas providing charge points for medium duration parking. With AC-charging, although the actual charger is located inside the EV, each charge point needs a dedicated supply equipment charge controller (SECC) for communication. AC-charging has the disadvantage that the AC/DC converter has to be located inside the vehicle, which adds to weight and lowers the range. The power electronics for DC-charging are typically located in a remote enclosure separate from the charging pole. To generate the necessary output power, charging station manufacturers already tend to split power electronics into several separate modules in parallel [14]. For example, Tesla’s supercharger utilizes 12 modules [15]. ABB uses two modules each in their Terra 184 and Terra HP chargers [16,17]. Most charging stations are designed to provide two charge points to serve multiple clients at the same time. All modules work in parallel if only one EV is connected, but the modules will be evenly separated when a second EV connects to the pole. Both EVs will hence be served with a maximum of half the total power. This scheme can be developed further to serve even more charge points, supplied by the same total output power.
Several different converter module topologies have been investigated and can possibly be used to build the isolated DC/DC stage of the EVSE. One of these topologies is the conventional dual active bridge (DAB), shown in Figure 2a, which was one of the most prevalent bidirectional converters historically. The DAB converter has the disadvantage of a limited ability to reduce the switching losses by zero-voltage-switching (ZVS) or zero-current-switching (ZCS) of its full bridges under light load, known as soft switching. Additionally, it has a high sensitivity towards variations in the leakage inductance of its transformer [18,19]. This and the advancements in the semiconductor industry, such as stable silicon carbide and gallium arsenide power MOSFETs, is why resonant bidirectional converters, which enable higher switching frequencies, have been gaining interest in research and industry. Their major advantage is that they are, in principle, capable of soft switching over a broad load range and do so at reduced circulating energy. Several promising bidirectional resonant converter topologies have been proposed; all of them are similar to the conventional DAB converter in makeup but use frequency control instead of phase shift control. One of these is the bidirectional full-bridge converter that uses two inductors (LL) and a capacitor (C), known as an LLC configuration, shown in Figure 2b, proposed by T. Jiang et.al. [18]. It generally has the advantage of soft switching capabilities in the vehicle to grid (V2G) and grid to vehicle (G2V) operation and high efficiency. However, the voltage gain of the bidirectional LLC is lower than the voltage gain of unidirectional LLC resonant converters. This means that it potentially cannot be used as a single stage converter in a DC grid with varying grid voltage. A topology with a higher voltage gain is the full-bridge converter shown in Figure 2c that uses three inductors (LLL) and two capacitors (C), known as the CLLC or CLLLC resonant converter [20]. The CLLC can be designed symmetrically, with the same transformed component values for both halves of the resonant tank, or asymmetrically. Both the symmetrical and the asymmetrical CLLC have the upside of soft switching in both directions of power flow. The design of the resonant tank, however, is significantly more complex for the asymmetrical CLLC, as the asymmetry of its resonant tank produces differing transfer characteristics for the V2G and G2V operation. The topology developed and used in this paper is the symmetrical CLLC resonant converter, originally introduced by J. Jung et. al. [21]. The symmetrical CLLC has a zero voltage switching inverter stage and a zero current switching rectifier stage. Both the symmetrical and the asymmetrical CLLC necessitate active rectification to reduce the losses produced by the MOSFET body diodes. Silicon carbide MOSFETs are used for the rectifier stage. Because silicon carbide MOSFET body diodes have a significant forward voltage drop of >6 V, a passive rectification results in a significant power loss. The active rectification, on the other hand, usually requires multiple Rogowski coils to measure the resonant tank currents to synchronize the rectifier. The symmetrical CLLC, however, enables a simplified sensorless active rectification [22], which reduces hardware space and cost.

2.2. Communication Standards

The most prevalent DC-charging standards in Europe are CHAdeMO, which is an abbreviation of “CHArge de MOve,” equivalent to “charge for moving” and the combined charging system (CCS), with CCS being mandatory for DC-chargers in Germany. The CCS communication standard is defined in the ISO-15118 and demands a digital communication through powerline, fed into the control pilot lines of the CCS/Type-2 plug. The standard, in its newest versions, covers bidirectional, DC and AC charging, plug and charge, the negotiation of charge schedules between the EVSE and the EV, and the exchange of all necessary information needed for the implementation of a load management system, e.g., information such as the energy needed to fully charge the EV and the total battery capacity. However, a simplified transitional version of the ISO-15118, called the German technical specification DIN SPEC 70121, based on an early unpublished version of the ISO-15118 standard, was published in 2012. The first version of the ISO-15118 was only published in late 2014. The DIN SPEC 70121 does not support scheduling, bidirectional, or AC charging and is stripped of most of the data intended for load management systems. Its original purpose was an accelerated development time, leading to the introduction of a broad fast charging infrastructure. This now has the side effect of significant interoperability problems, which, in turn, cause increased software development time for charging station and electric vehicle manufacturers. That and the fact that many EVs currently only support the transitional standard are why the limited DIN SPEC 70121 has become somewhat of a de facto CCS fast charging communication standard in Germany. Therefore, load management systems for CCS-chargers, for interoperability reasons, must still be able to handle the limitations of the DIN SPEC 70121 protocol. Table 2 depicts some of these functional differences between the DIN SPEC 70121, version one of the ISO-15118 protocol, and version two, called ISO-15118-20.
There are two possible approaches to regulate the charging power of the EV in accordance with the DIN SPEC 70121. Both must rely on the CurrentDemandRes message and must be able to influence the present current request by the EV, as the EVSE is essentially working as a slave device. It is only able to set limits for the charge current request by the EV, but the requested current within these limits must be supplied by the EVSE, as it is currently requested. The EV will otherwise abort the charging session. The CurrentDemandRes message is sent by the SECC to the electric vehicle charge controller (EVCC) as an answer to the EVCC’s CurrentDemandReq message during the active charge process. This message pair is exchanged every 150–200 ms. The CurrentDemandRes message has data fields as defined in Figure 3. The EVSEMaximumPowerLimit control parameter can be used to set an indirect upper limit for the EV’s current request. However, tests with commercial EVs revealed that the maximum power limit set by the EVSE is ignored by some, such as the Hyundai Kona (2019). The other possible control parameter is the EVSEMaximumCurrentLimit field to limit the charge current request directly. The tested EVs followed the maximum current limit, even when it changed dynamically during the charging process. The only exception was a VW e-Up (2019), which disregarded current limits lower than 5 A. This is the reason why the VW e-Up was not used during the validation of the load management. It can be said that the standard conformity among the EVs needs improvement in this regard to increase the reliability of the load management systems for CCS-DC-chargers.

2.3. Smart Charging Algorithms

According to P. Kong et. al. [23] there are two major schemes when it comes to unidirectional smart charging of EVs, namely optimal finance and optimal operation. Optimal finance schemes, in general, aim to maximize the charging station operator’s profit. For example, in [24], the arrival time, energy demand, and departure time of each vehicle connected to the charging station was gathered, and a charging schedule was calculated depending on the wholesale markets energy prices, with the goal to achieve the lowest purchasing prices while also satisfying the customer’s need for a fully charged vehicle. The energy flow in the distribution grid was examined in [25]; the energy demand was regulated to reduce power losses.
Optimal operation, however, concentrates on flattening the grid load profile [26,27] or serving as many customers as possible despite grid level power limitations. For example, in [28], the sharing of given limited power to several EVs is performed by calculating an adequacy level for each connected EV according to the charging power that the EV expects, the capacity of its battery, and the total amount of power to be shared. Another criterion in optimal operation schemes is the fairness of the charging process for all participants. So, in [29], a charging priority level was calculated using fuzzy logic, considering the departure time, the battery SoC, and the electricity tariff. However, most schemes in the literature have only been simulated, and no investigation on real hardware has been performed. The load management proposed in this paper is an optimal operation scheme to maximize the hardware utilization rate, as well as charging fairness, by considering the EV owner’s request for specified energy to be delivered during the time parked.

3. Object of Investigation and Methodology

As mentioned in the introduction, one of the major challenges of future EV charging infrastructure will be the competition between parking and charging time of an EV. A fully charged vehicle that blocks the access point for other cars and reduces the overall utilization time of a classic charging station will produce a tangible financial loss for charging station operators, especially in urban settings with parking space shortages. This, however, may lead to an overcompensation effect by a large-scale development of charging stations and high-powered grid connections, of which only a few would be used simultaneously. To avoid this kind of oversizing and deal with the volatile energy supply of Solingen’s catenary grid, the following concept of a DC/DC multi-vehicle-charging-station and the corresponding load management has been developed, constructed, and tested within the framework of the project already described.

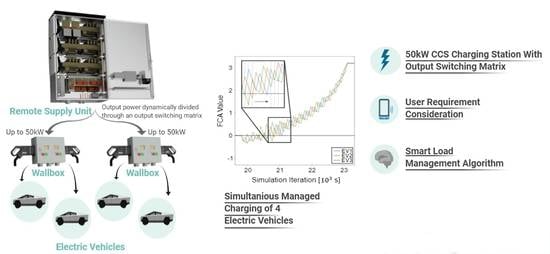
3.1. The DC/DC Multi-Vehicle-Charging Concept

This setup allows the charging station to deal with a volatile grid and simultaneous charging requests. To ensure efficient usage of the charging point by up to four connected EVs, the charging strategy described by the following algorithm is applied.
The investigated charger is depicted in Figure 4a. The remote supply feeds four charge points with a maximum total output power of 50 kW. The remote supply comprises four bidirectional 12.5 kW DC/DC-resonant converter modules (see Figure 4b). Each of these converters is connected to its own array of output relays, called switching matrix, shown in Figure 4c. The switching matrix connects each converter output to one of four charge points. Thus, it is possible to divide the maximum output power into steps of 12.5 kW and distribute them arbitrarily to the four points. The DC/DC-converter modules are bidirectional CLLC resonant converter prototypes and provide a maximum charging current of 30 A, each over a voltage range of 250–435 V. The charging voltage is galvanically isolated by the converter module. The switching matrix is a safety-critical system, as erroneous closing of the relays, as well as welded contacts, could short-circuit and potentially damage multiple EV batteries. The possibility of short circuits as the result of a switching matrix fault can be prevented with output diodes, as they prohibit the current reversal. However, simple output diodes are no solution for bidirectional chargers, since the reversal of the current is needed in the V2G operation. Multiple strategies have been implemented to prevent erroneous contact closing and to monitor the state of health of the relay contacts. The relay drive signals are interlocked through software and analog circuitry, but contact welding can still occur. This may be the result of inrush currents, as the relay normally turns on, or by arcing, as the relay turns off while conducting current. The state machine shown in Figure 5 is used to prevent both. The relay to be turned on is blocked from doing so, unless the difference between the module’s output voltage and the charge point voltage, to which the module is supposed to be connected, is less than 10 V (Figure 5f). The module will otherwise pre-charge to the desired voltage (Figure 5a). The relay is enabled at the end of the pre-charge if the voltage difference is reduced to <10 V (Figure 5b). Enabled relays are blocked from turning off if they currently conduct (Figure 5g). The relay turn off is possible if its associated converter module has confirmed to be disabled or in fault state (Figure 5c). The module output voltage is then monitored until it falls below 90% of the charge point voltage. The relay contacts are welded if the voltage is not decreasing or decreases too slowly (Figure 5d). In this case, the switching matrix will consequently be blocked and the associated module and charge point will be disabled. The remaining modules, switching matrices, and charge points remain functional, only with reduced maximum total output power.
Exemplary switching events between two charge points are depicted in Figure 6. Four modules supply two charge points, starting with an equal distribution of two modules per charge point, delivering 25 A each. The load management determined to move one converter from charge point one to charge point two. This happens at Figure 6 point (a). Charge point one, shown in black, is now notified to decrease its requested current from 50 A to 25 A, through the EVSEMaximumCurrent data field of the CurrentDemandRes message. The EV now decreases its requested current in a linear ramp. It should be noted that the rate of change of the requested current is not the same for all EVs; it varies significantly between different EV models. The converter module and the corresponding relay are disabled at Figure 6 point (b), since the requested current is lower than the present current limit for the charge point. The current dip between Figure 6 points (b) and (c) happens as follows: the now-disabled module disables its output, while the remaining module continues to supply only half the requested current by the EV. The module’s current output adapts to the reduced number of parallel modules when the switching module confirms that it is disabled. This causes a large communication delay but ensures that no overcurrent is supplied to the charge point. The welding detection finishes at Figure 6d, at which point the module starts to precharge to the target voltage, which is reached at point Figure 6e. The relay is subsequently enabled, and the target current for all connected modules is set to equal the requested current by the EV, divided by the number of connected modules. This is the reason why the output current dips between points (e) and (f) of Figure 6, until the newly connected converter module finishes its soft start. The EV is notified of the increased maximum charge point current and may then increase its current request in a linear ramp. The switched converter is not supplying energy between points (b) to (e) of Figure 6, which can last up to 12 s, depending on the voltage difference between the present EV battery voltages and the rate of discharge of the module output capacitors during the welding detection. Each module is allowed to switch at most once every 30 s to limit the number of switching events during a charging session, and to reduce the wear on the relay contacts.
A charging session is started by a user charging request, which contains certain information, e.g., battery capacity, remaining charging/parking time, or the target SoC, and triggers a pre-allocation procedure to calculate the expected CS utilization. This includes the catenary grid load (provided by another sub-system) and a power analysis of the other already connected vehicles as well. In case of a successful validation, the user receives positive feedback and can continue to start the charging process. Otherwise, they are encouraged to readjust charging parameters (e.g., lower target SoC or a prolonged parking time). Thus, the pre-allocation procedure can be executedt in two different ways, either to achieve simultaneous charging of all connected vehicles or maximum utilization of the charging station. A minimal example to visualize both procedures is displayed in Figure 7.
This example shows a common situation where two individual EVs reach the charging station at the same time and initialize two different charge requests. All parameters like battery capacity (100 kWh), start (0.2) and target (0.7) SoC, and the maximum charging power (50 kW) are identical for both cars except the parking/charging time, which is 1.0 h for EV1 and 2.0 h for EV2. Hence, the mean charging request value for both vehicles is different (EV1 = 50 kW and EV2 = 25 kW). Combining both results in an overload with 75 kW for the first and an underutilization with 25 kW in the second half of the charging session. The overall mean charging power needs to be reduced to 50 kW by one of the following procedures due to power restrictions.
Starting with the first case (Figure 7a), which is characterized by a complete utilization of the charging station, the pre-allocation procedure would sort the different charging requests consecutively by its last starting point to reach the target SoC. The presented constellation allows a complete recharge of both vehicles by postponing the second one for an hour to use the full power of 50 kW in the other half of the parking/charging time. This leads to a theoretical overall utilization of exactly 50 kW or 100% and a positive validation during pre-allocation, which might be desirable. However, a simple example reveals a problem. The EV might not yet have been charged if the owner wants to depart earlier than initially requested and the EV priority was low during pre-allocation. The consecutive charging strategy additionally assumes that all EVs are able to receive the 50 kW during the entirety of the bulk charging. However, this assumption is incorrect and results in significant management errors, because the undersupplying of the EV as the result of a limited charging capability of the EV cannot be compensated through increased power allowance. A simultaneous charging (weighted by the individual charging requirement) is necessary, which reduces the target SoC of at least one vehicle during the pre-allocation of the charging sessions (reduced to 0.55 in this case), to avoid this kind of restriction. This strategy is displayed in the second case (Figure 7b) and illustrates the differences to consecutive charging. The target charge power is not reached by focusing on only one vehicle, but rather with the partial supply of both vehicles. The result is a parallel SoC increase for both vehicles with different gradients, which can be sensitively adjusted by a deviating parameterization in the pre-allocation procedure. The mean utilization during the 2 h charging period is just 37.5 kW in comparison to the 50 kW mean power of the consecutive charging case, but the simultaneous charging provides higher flexibility, e.g., to compensate energy supply fluctuations by the catenary grid or to reopen the charging station earlier for further vehicles.
After passing the pre-allocation procedure successfully, the charging process starts. Henceforth, the assignment algorithm of the load management system controls the charge power limit of each vehicle. A value called feeding compensation account (FCA) is used by the algorithm to ensure a fair weighted power assignment and represents the amount of energy necessary to compensate for the over- or underfeeding of a specific vehicle during the next charging period. While an FCA value near zero corresponds to a strict following of the pre-allocated charge curve, a negative FCA indicates an underfeeding, and conversely, a positive FCA points to an overfeeding. The value itself is calculated as the difference between the assigned charge power and the remaining energy volume divided by the remaining charge time and is finally added to the summation of previous FCA values. The algorithm starts with a case analysis and divides the charging EVs into three groups, negative (underfed), zero (newly started), and positive (overfed) FCA to assign the correct charge power to each vehicle. In case at least one vehicle is in the negative group, all available 12.5 kW phases are shared among this group to compensate for the current underfeeding. If the negative group is empty, the assignment considers just the vehicles in the zero group. The positive group receives charge power only if no other group has members. Frequently, there is more than one EV in a group, which requires a tolerable sharing of the up to four available phases. Therefore, the algorithm iterates through the specific group, calculates the individual FCA share for each vehicle, and allocates the converter modules based on a parameterized assignment matrix. The matrix contains a set of different distribution parameters depending on the absolute number of installed charge points. Hence, the current amount of available charge modules and the number of connected EV are represented in lines and columns and the combination of both gives the specific assignment directive. The following example illustrates the procedure. EV1 with the maximum FCA (highest charge demand) has a share of 0.52 (two other connected EVs and three available modules) and requests a CPA for the next period. The third column and line of the assignment matrix supplies two values 0.65 and 0.35 which are the distribution barriers for this constellation. Due to 0.52 < 0.35 = f a l s e (one module), 0.52 > 0.35 = t r u e (two modules), and 0.52 > 0.70 f a l s e (three modules), EV1 recives two charge modules for the next period, and the remaining one is going to be assigned to one of the other two EVs. This procedure ensures compliance with the charging conditions and provides a fair distribution of the available charging power. Figure 8 presents the whole assignment algorithm.

3.2. Scenario Description

This section describes the cases used to validate the concept, some of which were evaluated through simulation and others implemented in practice.

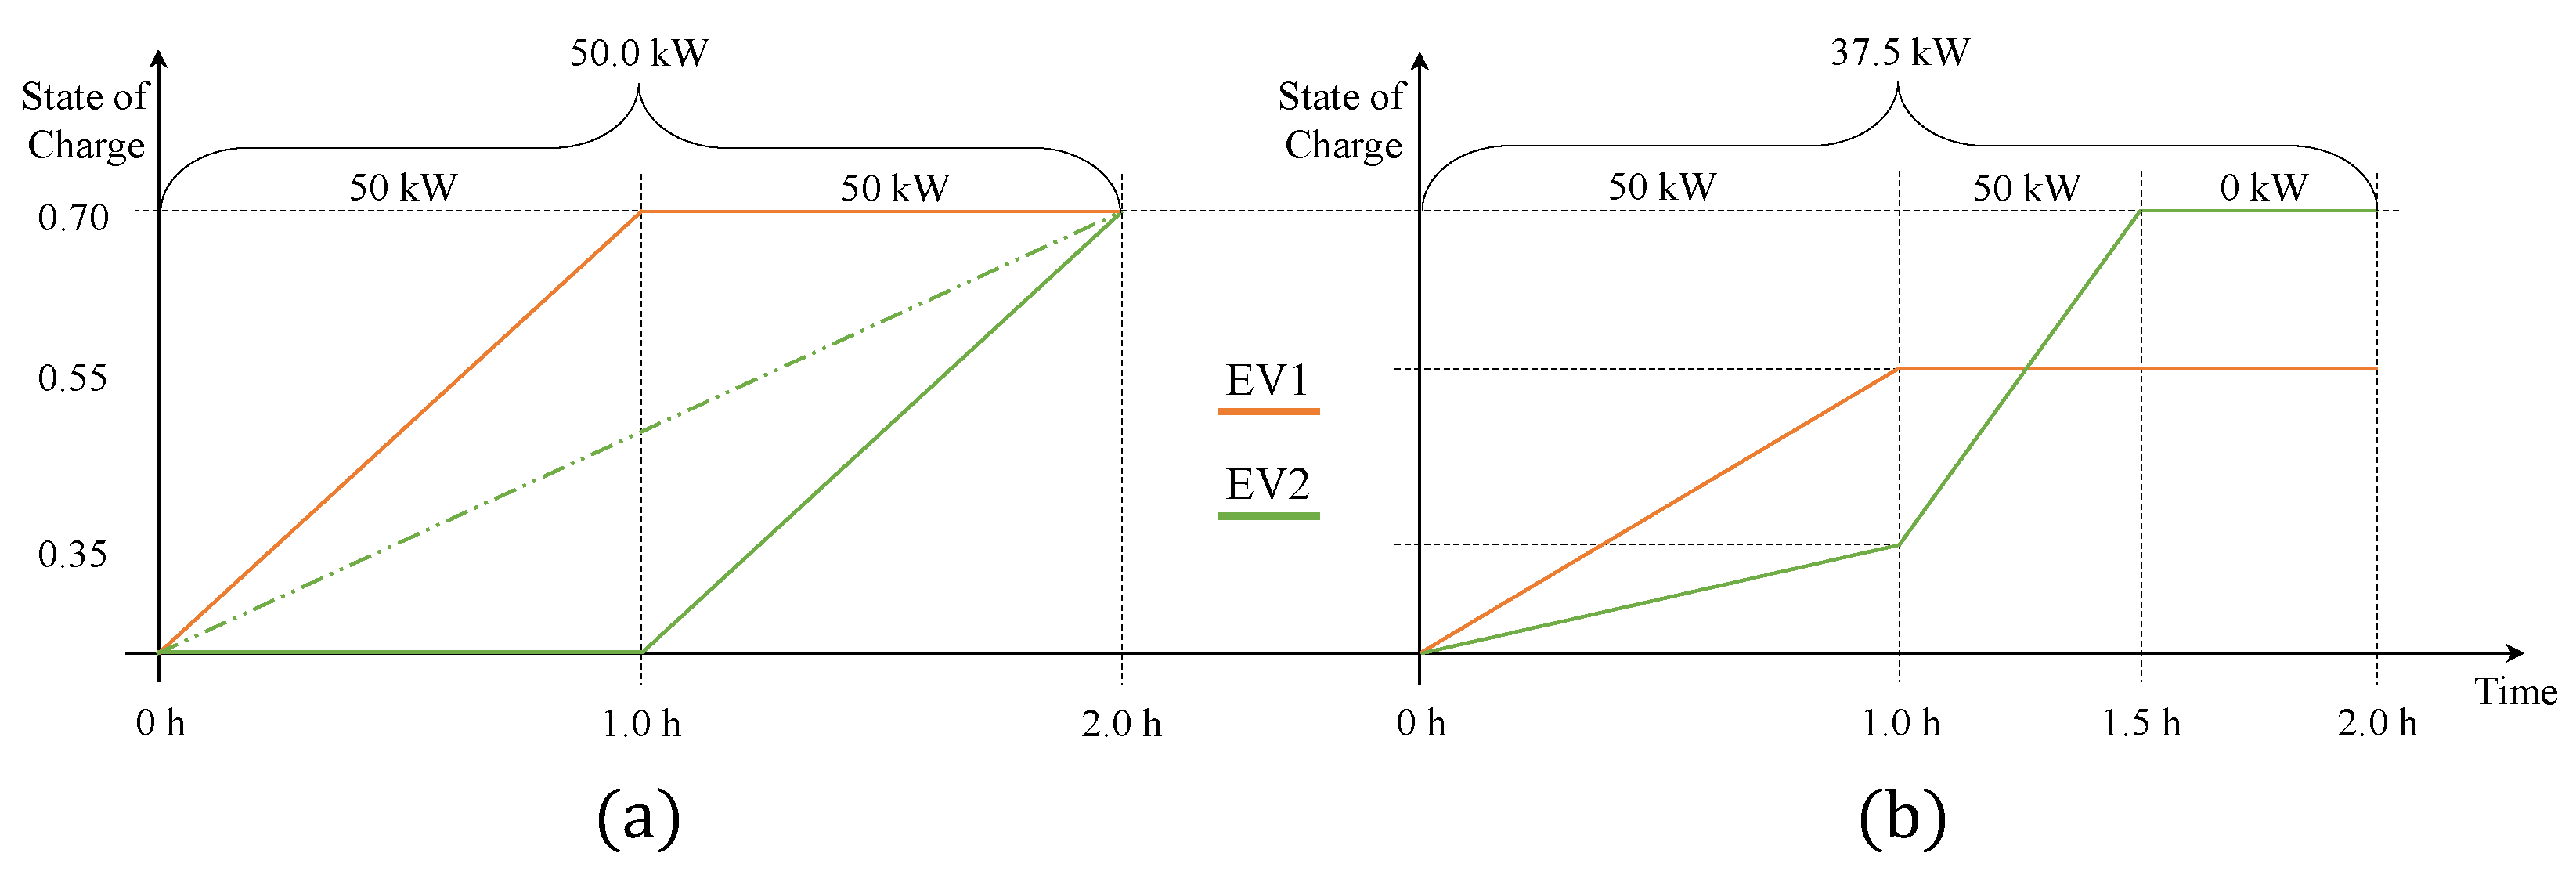
3.2.1. Classic Use Case—Simulation and Measurement

Due to certain restrictions concerning experiments and equipment, e.g., the available amount of rechargeable EVs, it is not possible to prove all imaginable scenarios by real measurements. That is where simulations are used to analyze different variations of charge requests with one, two, or more vehicles. The first scenario is a use case, where two vehicles with a different average power need are charging at the same time. The sum of their average power needs, however, is less than 50 kW. The EVSE should therefore be able to charge both EVs to the requested SoC during their parking time. The user information, corresponding to the measurement, was supplied as follows: requested parking time equal to 30 min for both EV1 and EV2, target SoC equal to 75% for EV1 and 62% for EV2. EV1 has listed a battery capacity of 39 kWh, and EV2 has a battery capacity of 32 kWh. This case is both simulated and tested on commercial EVs.

3.2.2. Double Split by Preferences—Simulation

Another scenario is called the double split and represents a situation where two vehicles connect to the charging station at the same time but with different parking/charging durations. The simulated scenario includes EV1 with a requested energy amount of 50 kWh and a parking time of just one hour. EV2 requests the same amount of energy but extends its parking time up to two hours. A possible real life example could be a charging station next to a supermarket or a pedestrian area.

3.2.3. Trio Simultaneously—Simulation

Besides the double scenarios, it is theoretically possible to charge three vehicles at the same time, but due to a lag of further EVs, this kind of analysis is carried out just by a simulation. Therefore, the input data are three vehicles with a charging time of one hour, battery capacity of 30 kWh, and a target SoC difference of +50%, which leads to a total amount of energy of 15 kWh per car.

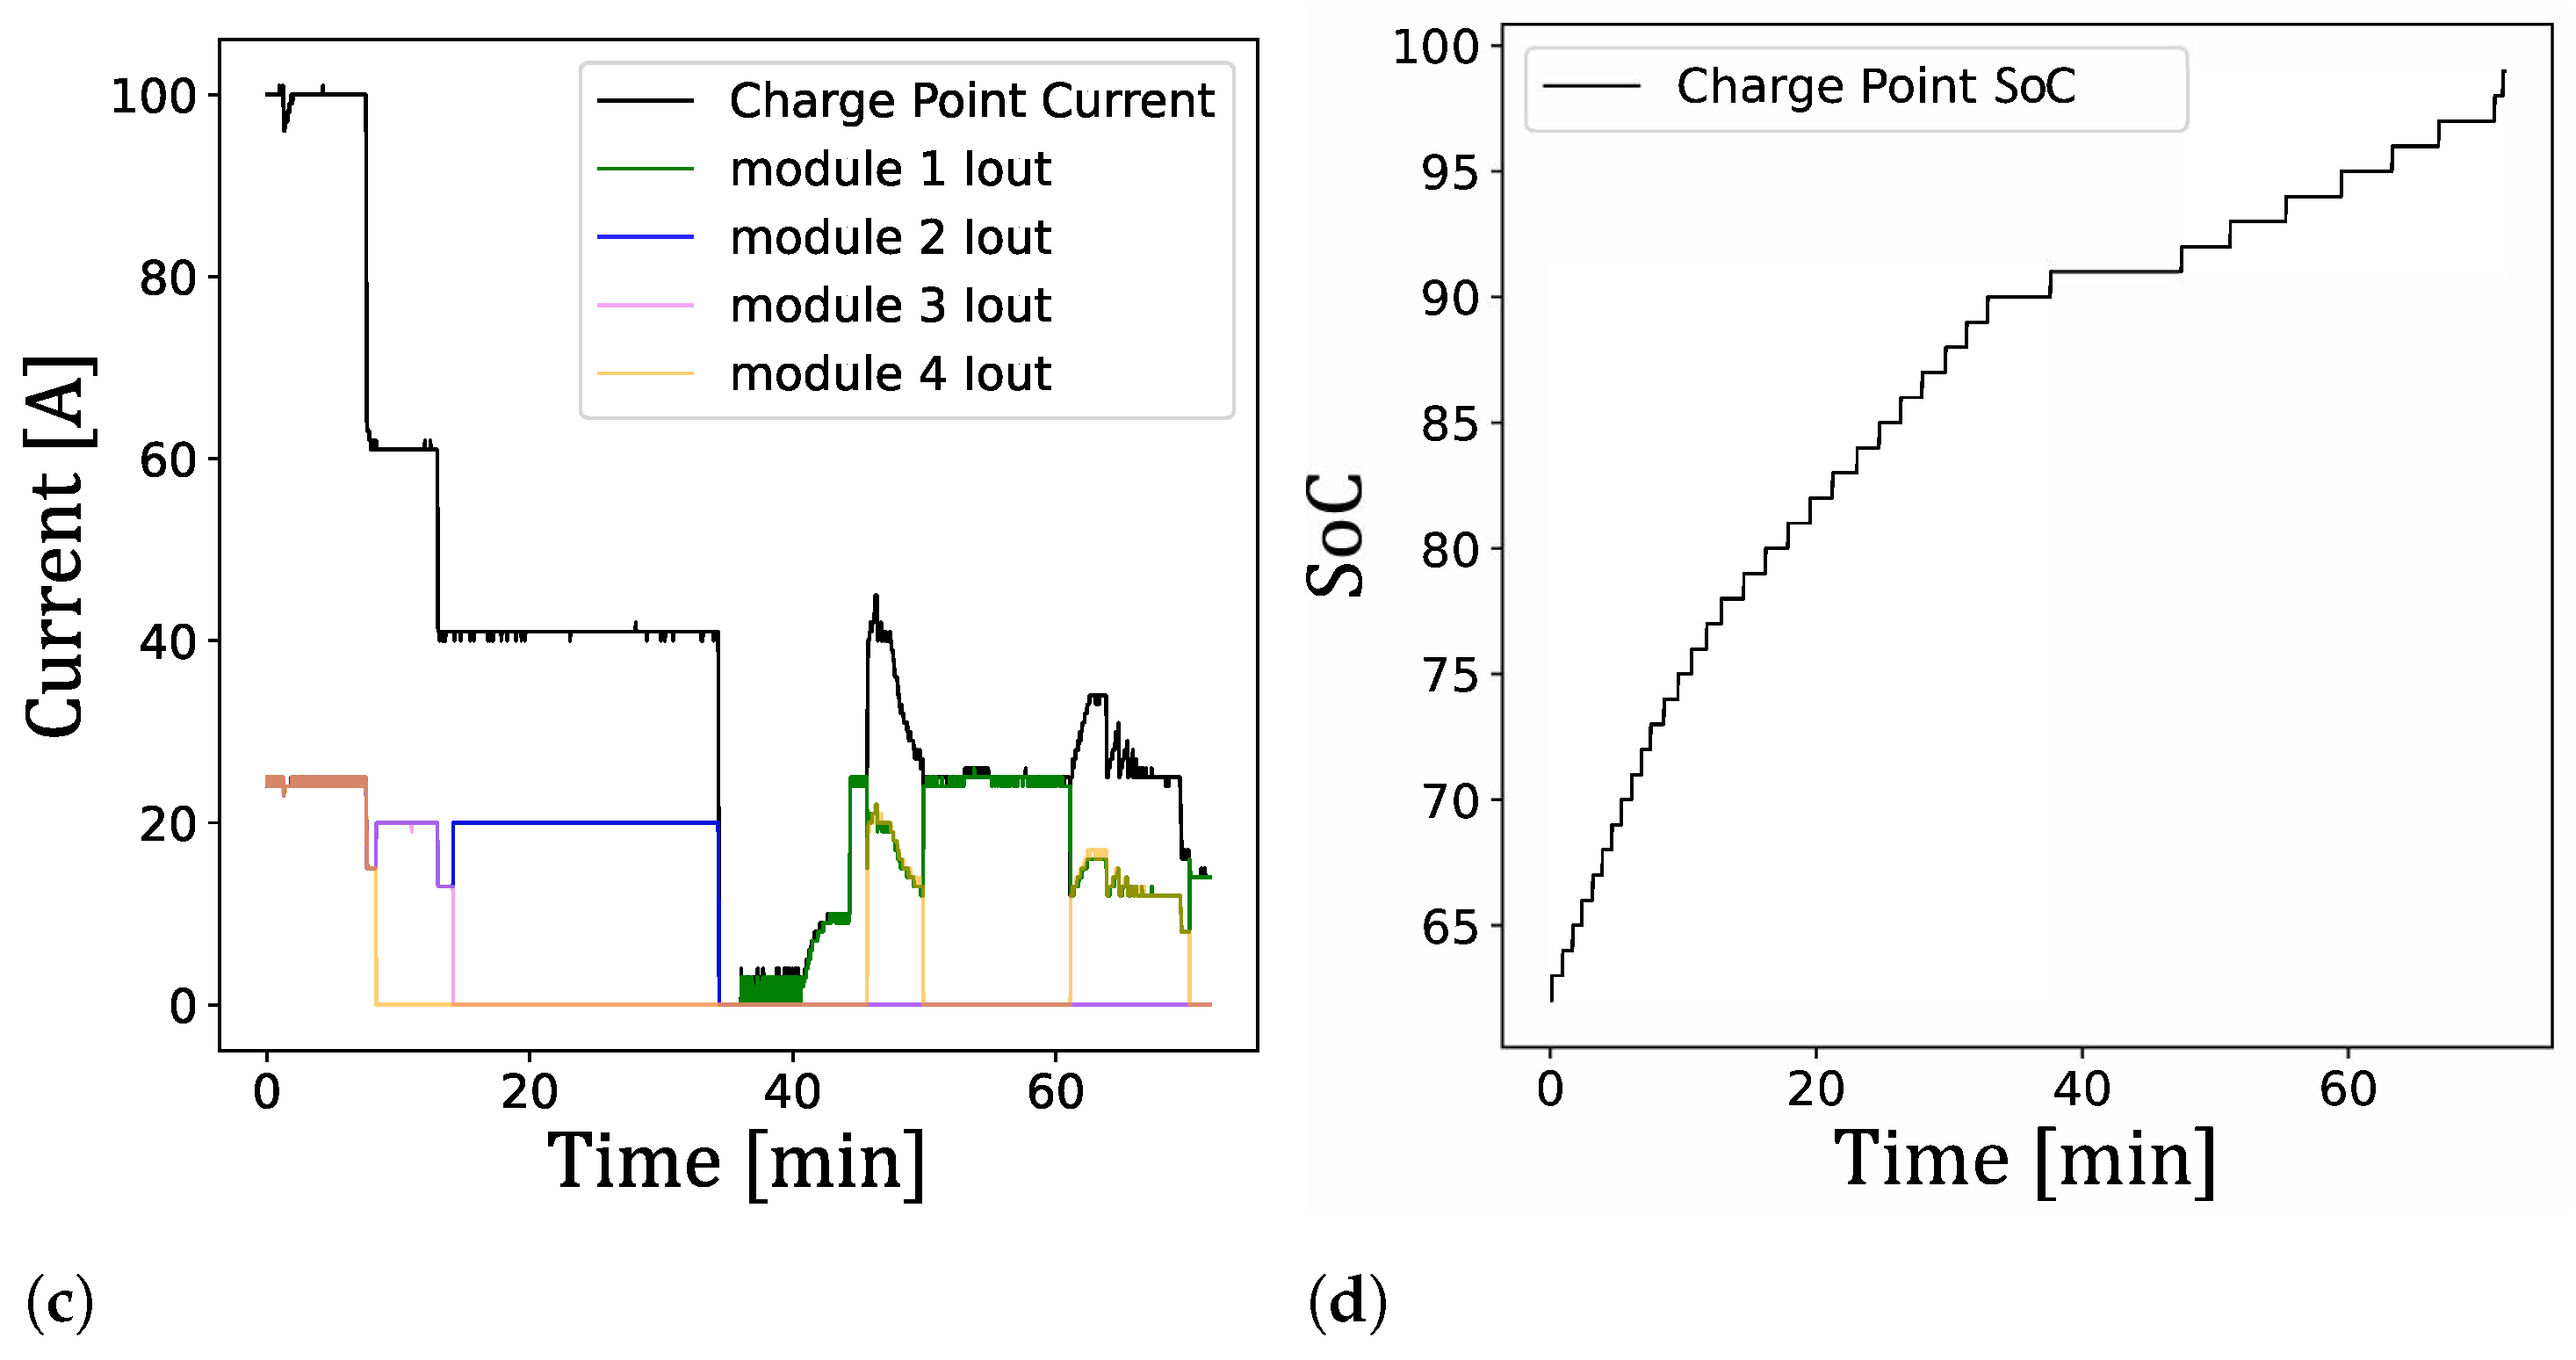
3.2.4. One against Three—Simulation

An enhancement of the previous scenario might be another common situation, where three EVs with equal charging requirements are already charging, and a fourth vehicle with a significantly higher power request and therefore higher priority arrives at the charging station. In this case, three EVs have the following identical parameters: start SoC of 0.2, target SoC of 0.7, battery capacity of 20 kWh, and a parking/charging time of one hour. EV4 arrives late and requests an energy volume of 22.5 kWh within 30 min of charging and thus demands a higher priority regarding the future charge power assignment.

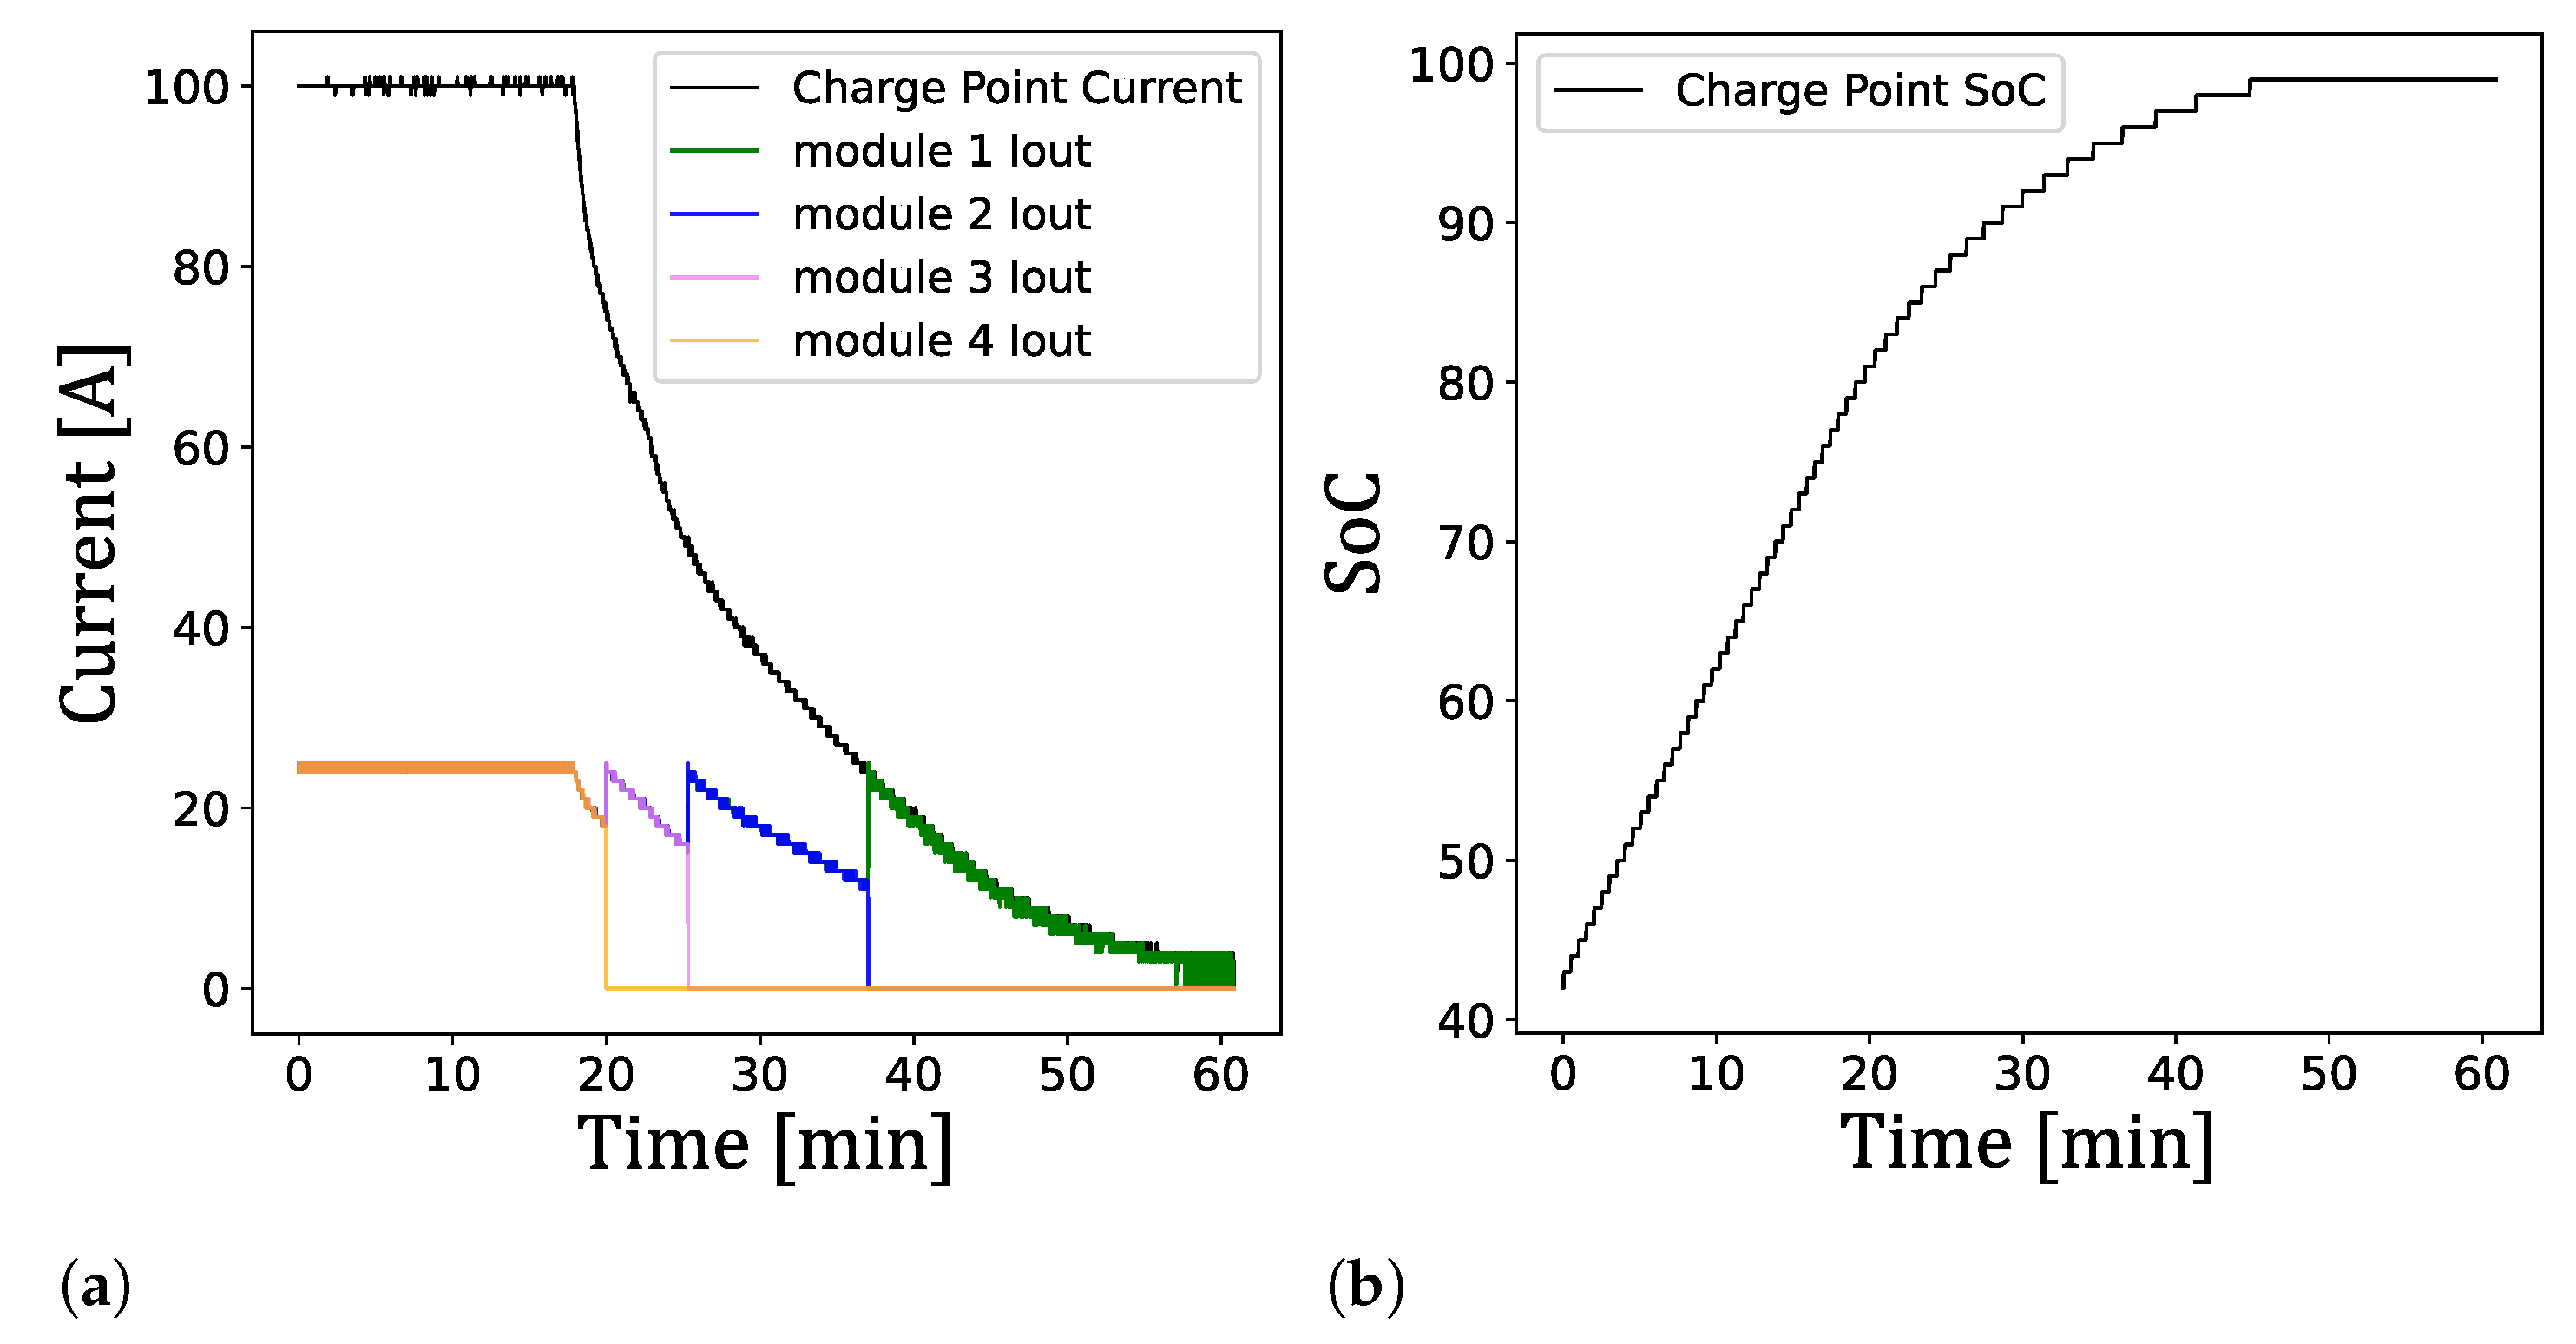
3.2.5. Full Charging with Module Shedding—Measurement

Concerning the well-known characteristic of electro-chemical energy storage such as batteries, marked by the decreasing ability to deal with high charging currents above an SoC of around 0.8, and due to negative side effects such as temperature rise or a reduced battery life cycle. Therefore, the individual response of different vehicles to a continuous shedding of charging modules is going to be measured during an experiment where modules are switched off one by one along a decreasing charging current. In a real-life use case, this procedure might be useful for opening the charging station for other possible charge requests.

3.2.6. Overall Daily Performance Potential—Simulation

The final scenario distances itself from specific use cases and focuses on the daily performance potential, which is mainly linked to the business interests of common charging infrastructure operators. For these, the efficiency of a charging station in terms of the transferred energy volume or the utilization hours are important to calculate economical key factors such as the return on investment (ROI) to validate the profitability of a charging station.

4. Results and Discussion

The charging profile of the EV can be complex and is generally unknown to the EVSE. The load management, therefore, must assume a default charging profile to adjust its projected average power demand for the EV. One simplification would be to assume that the electric vehicle accepts all the allowed power/current if it lies within the EV’s maximum power and current limits. This assumption would be incorrect if the EV is not charged to about 80% SoC, called bulk charging, but is charged fully. All EVs will either gradually or abruptly reduce the charging current at bulk SoC, eventually even down to about 1 A. The EV communicates a generic bulk SoC value to the EVSE but may start to reduce the requested current before reaching it. The actual start of the charging current reduction, by the EV, depends on the battery type, battery management system, and the battery’s temperature. So, the same vehicle could have a significantly different charging behavior depending on the battery’s state of health [30]. This produces uncertainty for the planning of the load management. The inconsistent reduction in the requested current can lead to scenarios where one vehicle with a negative FCA will eventually be assigned all converter modules, while only being able to accept a fraction of the available power that is being assigned to the charge point. This necessitates that converter modules are taken from and no longer given to charge points if Equation (1) is fulfilled, with n being the number of parallel modules connected to the charge point. The shedding of modules has the additional advantage of a higher overall module loading, because resonant converters, like most converters, have a decreased efficiency during the light load operation [22].
I R e q u e s t e d < I m o d u l e m a x · ( n 1 )

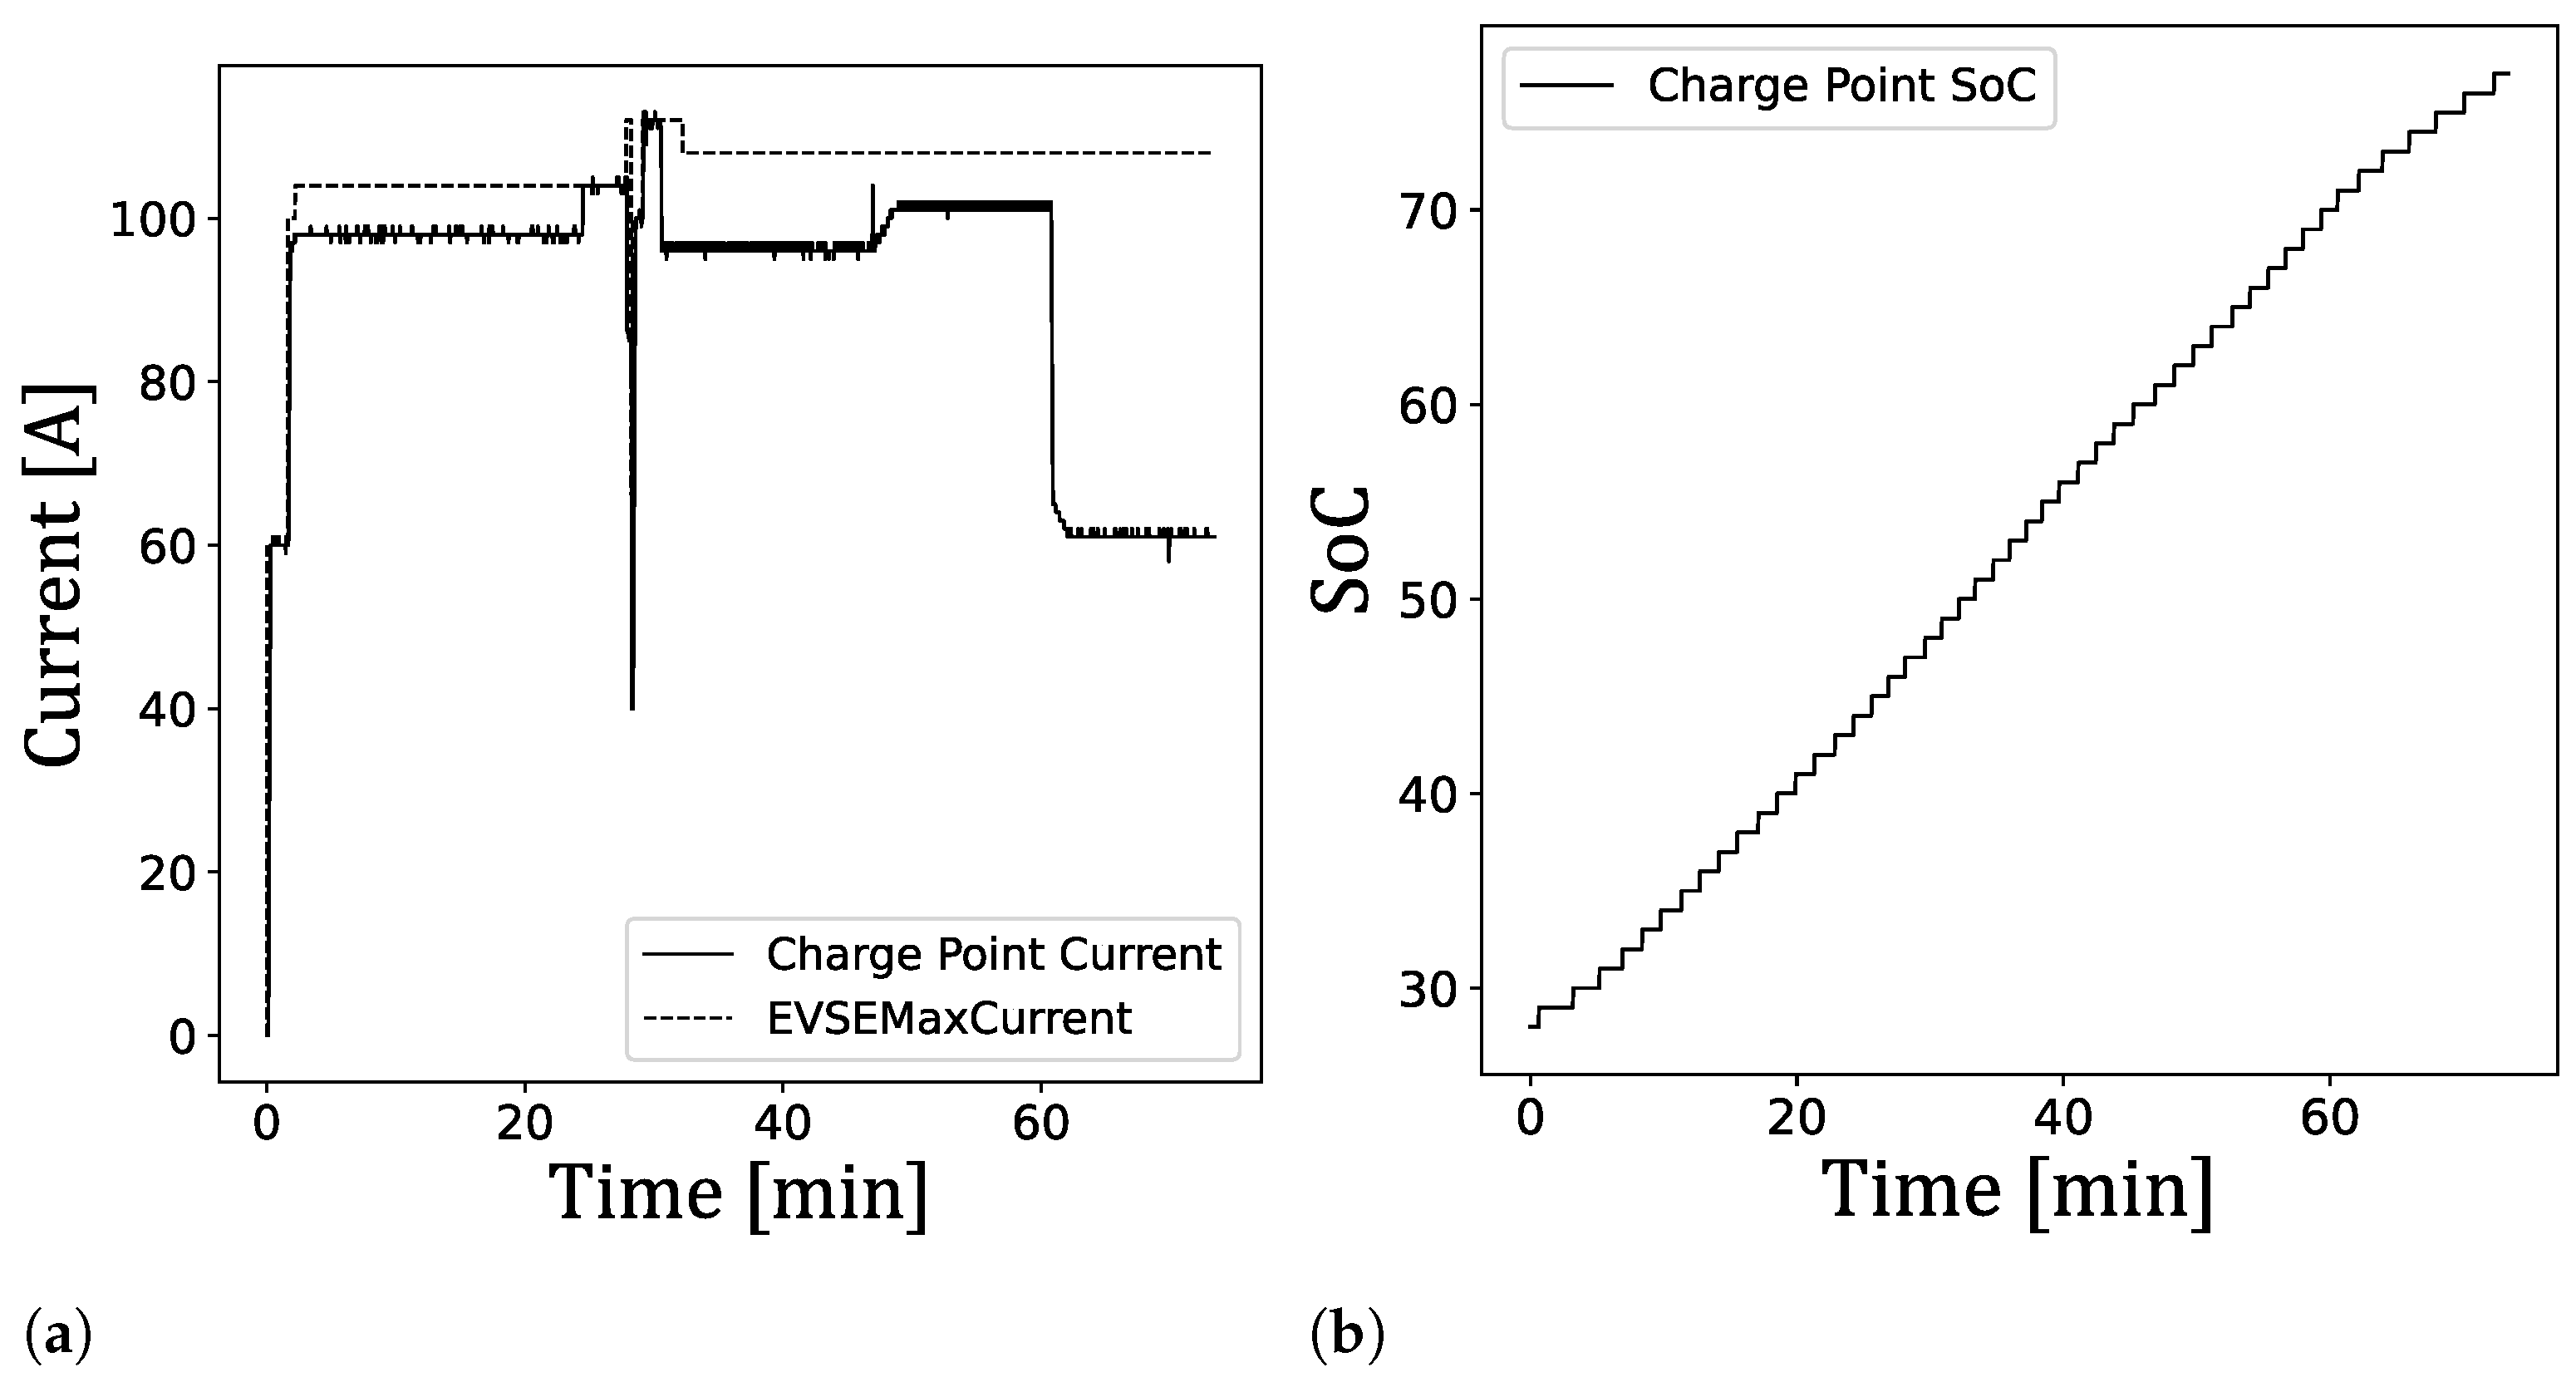
4.1. Classic Use Case—Simulation and Measurement

Starting with the simulation part of the first scenario, Figure 9 presents the results in three separate data plots. While the X-axis always shows the number of iterations (seconds for a one-day simulation), the Y-axis represents the FCA value (Figure 9a), the assigned charge power (Figure 9b), or the state of charge (Figure 9c). In the current case, the positive FCA value for both vehicles represents a moderate utilization of the charging station, which leads to achieving the target SoC; hence, the assigned charge power alternates back and forth between the two EVs. In general, besides minor deviations, this behavior should also be apparent during the following measurements.
A measurement with two connected EVs is depicted in Figure 10. It can be seen that the EVs started their charging process practically at the same time. They do, however, have different energy demands. The charging power at the two charge points alternates, as predicted by the simulation, even though the FCA is positive for both EVs. At the beginning of the charge process EV2 has the higher average power demand and is consequently given three of four modules. EV1 is supplied by the remaining module, as observed at the end of the first evaluation. EV2 now develops a positive FCA, while EV1’s balance is negative. This causes the switchover of one module from EV2 to EV1 at the end of the second evaluation. EV1 is then developing a positive FCA, as it receives more energy than it needs, and EV2 is reducing its still positive FCA because it is being undersupplied. The next evaluation results in one module being switched back to charge point two. This time, however, both FCAs are at a positive balance, and the switching of the modules according to Section 3.1 avoids potential unfairness during the charging process. A possible static distribution of three or four modules at charge point one and one or no module at charge point two would have caused charge point one to fulfill its charge request significantly early. EV2 would afterward be charged with all four modules for the remaining time. This only works out to be as fast or faster than the proposed method if the EVs can accept the power allowance. This has been shown to not necessarily be the case. It is, therefore, likely that a static distribution of the converters results in a slower charging request fulfillment than the proposed method and does not consider concepts of fairness.

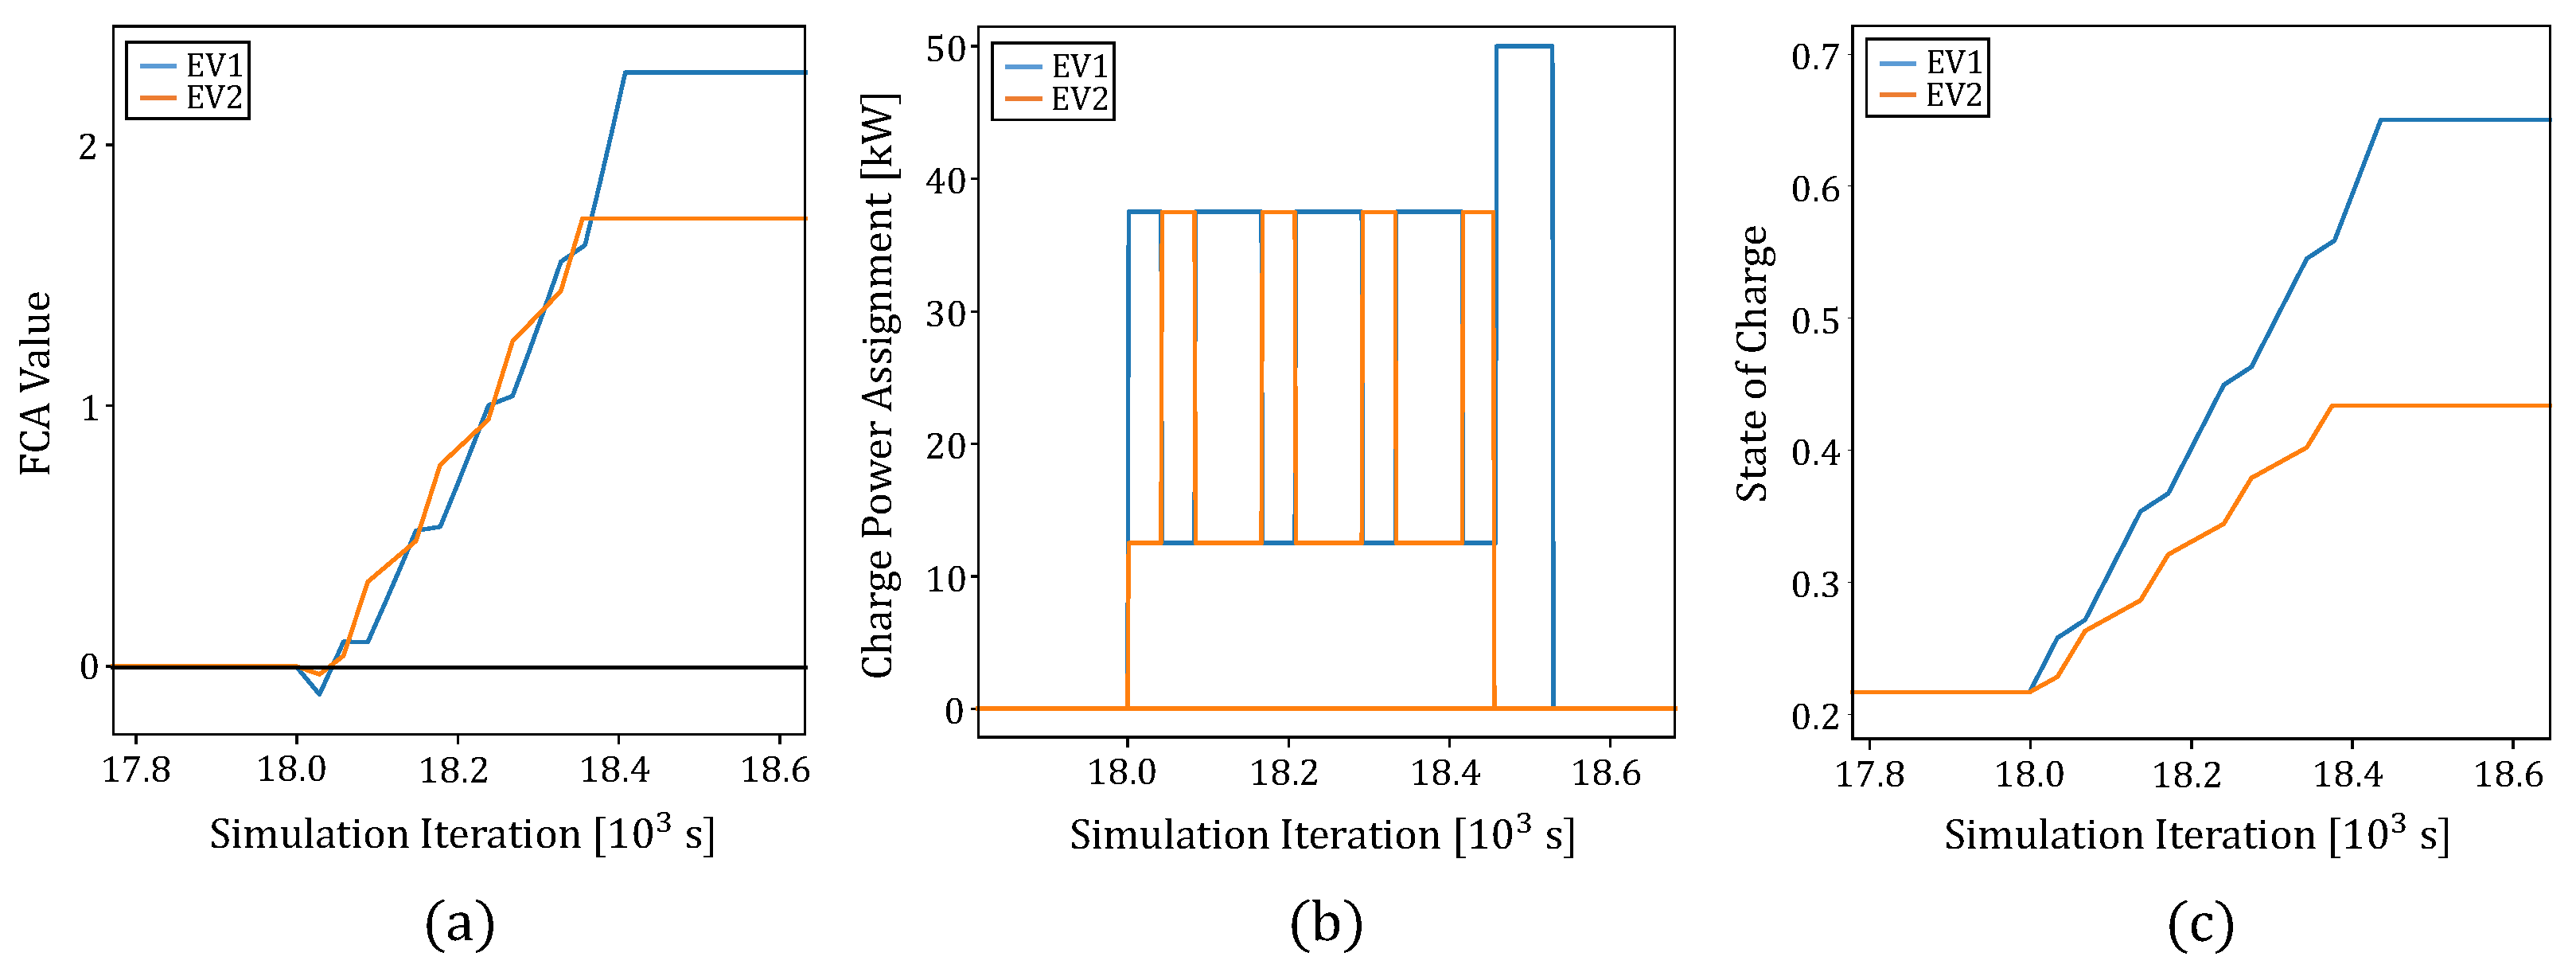
4.2. Double Split by Preferences—Simulation

The second scenario differs from the classic use case due to the negative FCA value of EV1 (displayed in Figure 11a, which results in incomplete charging during the available time. That means the total available power of the charging station is not sufficient to meet the requirements of both vehicles. The EV with the greater energy demand is prioritized but will not receive the total available power to guarantee the charging EV2, although at throttled charging rate. Figure 11c shows the simulation result, which is similar to the already known qualitative charging strategy representation of the third chapter. The exposed jags were evoked by the several charge power changes and depend on the period length, and the shorter it is, the more accurately does the result follow the idealized curve. Another point of interest is the beginning of the second half, where EV1 disconnects from the charging station, and the whole power of 50 kW is available for EV2, which reaches its target SoC within the remaining parking/charging time. This is why the FCA value of EV2 is initially negative and finishes the charging being positive. Figure 11b presents the assigned charge power values and reveals an initial oscillation between the later constellation of (EV1 = 3 modules, EV2 = 1 module) and an equal distribution of (EV1 = 2 modules, EV2 = 2 modules).

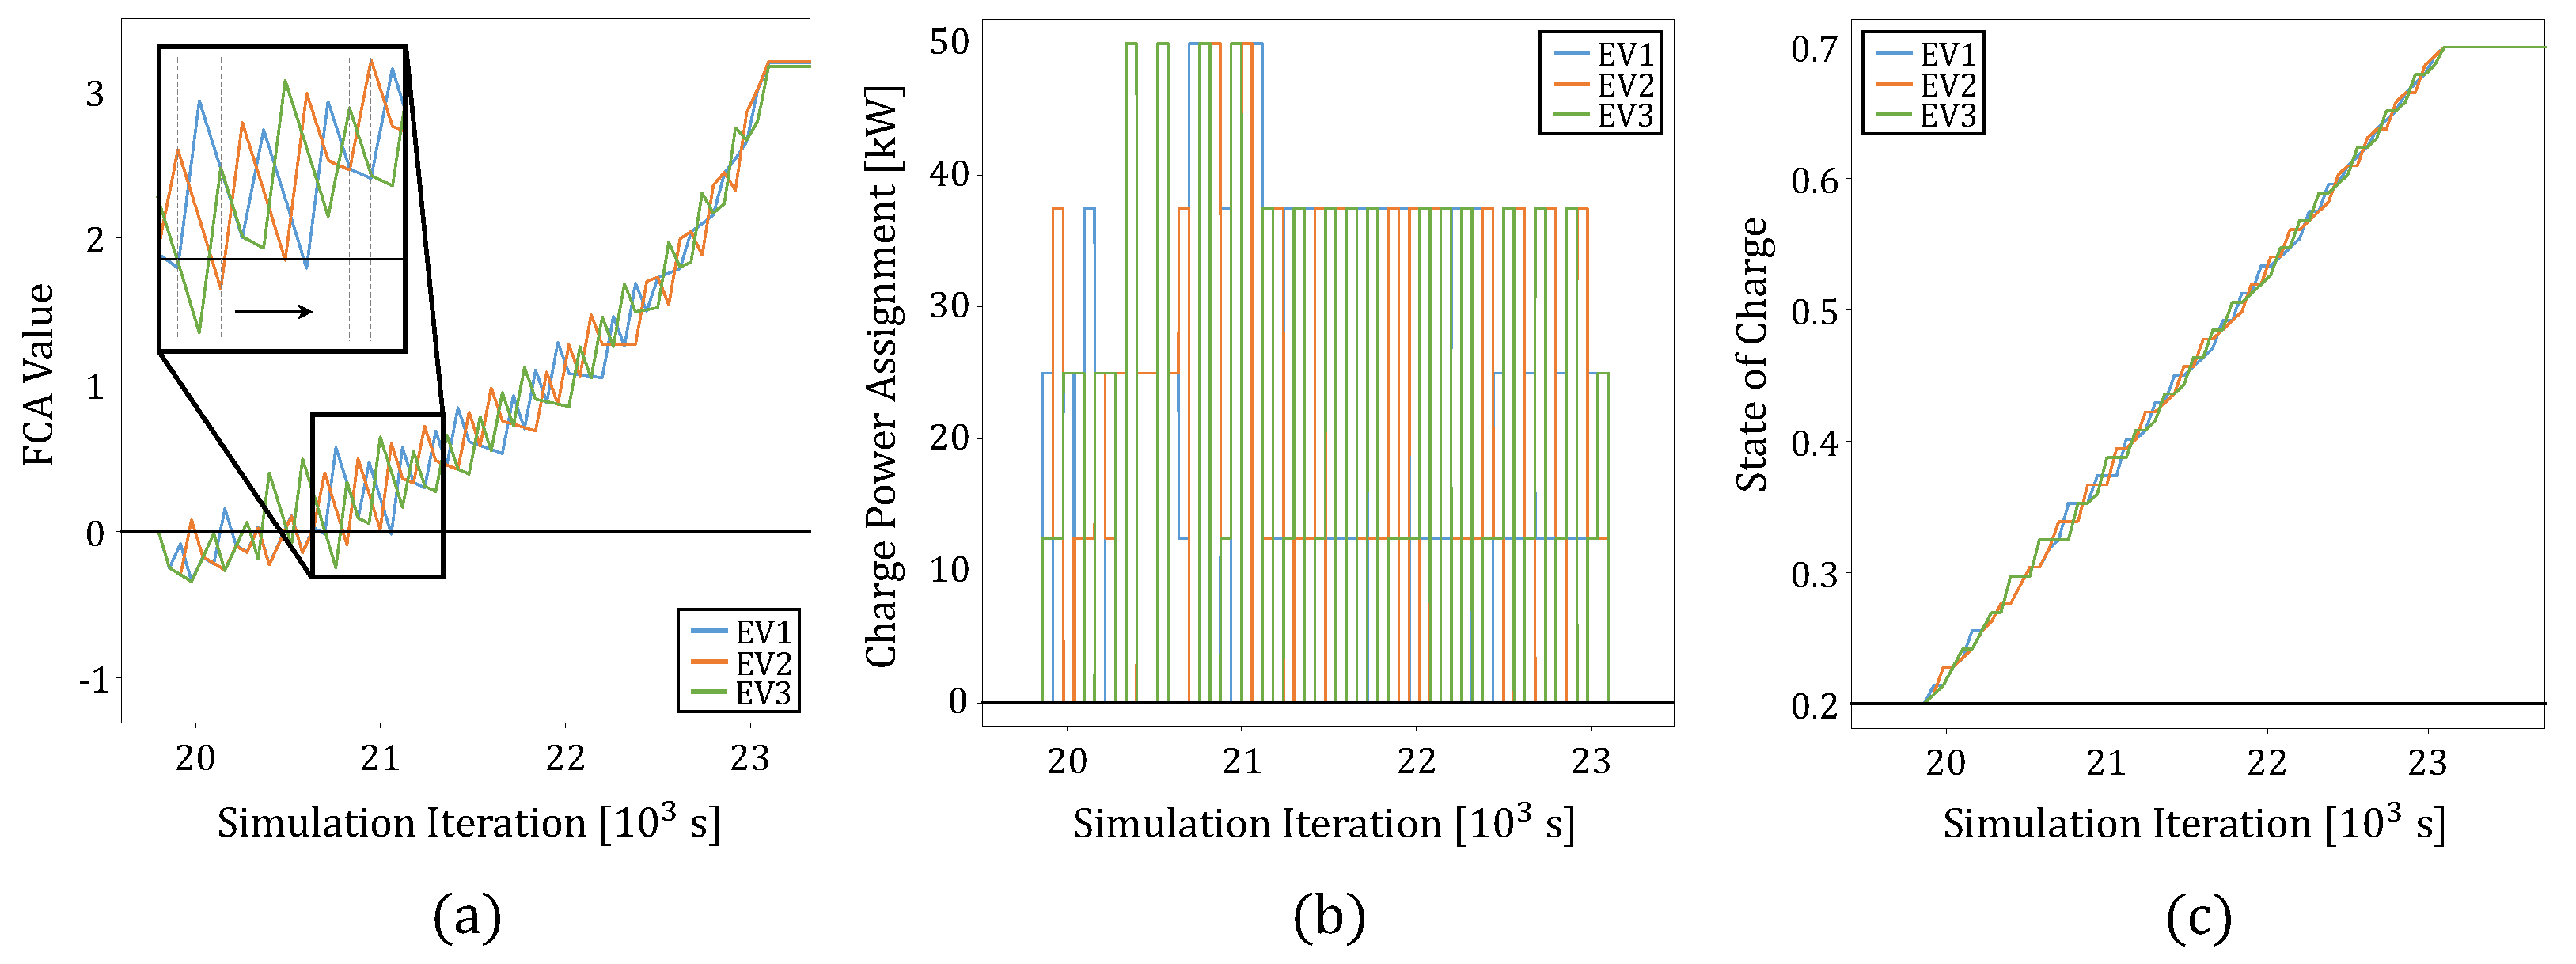
4.3. Simultaneous Trio—Simulation

The potential of the developed load management algorithm becomes clear in the next scenario. For the three EVs with a charge request of 15 kWh, each during a simultaneous parking/charging time of one hour, it is not possible to complete their charging successful in the case of a classic static charge power assignment such as EV1 = two modules, EV2 = one module, and EV3 = one module. Thus, the mean charge request of 15 kW is larger than a single power module with 12.5 kW, which directly leads to an underfeeding of EV2 and EV3. In comparison, an FCA-driven charging process provides an equal SoC increase for all three vehicles (see Figure 12c). The fact that the average requested charging power of 15 kW is slightly higher than the maximum module power results in the presented FCA curve of Figure 12a, where all EVs start with negative values and then work their way back out of this deficit. Consequently, sometimes, one EV receives all modules if it is the only one with a negative FCA value (see assignment algorithm in Section 3.1). This accelerates the baseline crossing process and brings the vehicles back on a course of efficient distribution. The zoom box illustrates this behavior, which is also discernible in the left half of Figure 12b.

4.4. One against Three—Simulation

This scenario expands the former use case by an additional vehicle with a significantly higher charge request than the other already connected EVs. The mean power demand of the three vehicles combined is 30 kW, which is not a challenge for the charging station, wherefore a positive value is already achieved after a short time and continues to rise until the EV4 connects to the charging station. Based on the positive buffer, the three EVs can pause for some charging periods and provide the whole power of 50 kW to the last vehicle, which is perceptible in Figure 13b. The flat shape of the SoC curve during this period is another indication, as well as the relapsing FCA value of the first three vehicles and, in turn, the increasing value of EV4. This works until the buffer of EV1, EV2 and EV3 is depleted, which is highlighted in Figure 13a. The simultaneous power request of 52.5 kW exceeds the capacity of the charging station, and whatever the assignment for the next period is, at least one vehicle will always be underfed and further reduce its FCA value. Due to this kind of theoretical overload (physically, the charging station just provides its rated power of 50 kW), none of the four vehicles will reach their target SoC. The remaining parking/charging time of the first three vehicles is ten minutes after EV4 disconnects from the charging station. Their FCA deficit is now too large to be compensated during the last charging periods, wherefore the value continues to fall even if the vehicles narrowly missed their target SoC. A sensitive pre-allocation is important to avoid such a mismatch.

4.5. Full Charging with Module Shedding—Measurement

Two exemplary charging sessions are shown in Figure 14. The individual module currents are shown as colored lines. The Figure 14a,b show a typical gradual decrease of a MINI SE’s requested charging current, starting from 70% SoC. The four connected converter modules are, in accordance with Equation (1), gradually disabled and disconnected from the charge point. This process works if the current demand strictly decreases. The EV charging process will then, however, be throttled if the EV increases its current demand again, after the initial decrease. Figure 14c,d depict this case. The requested charging current decreases in sudden jumps, until the EV, most likely to calibrate its BMS, reduces the target current down to 2 A for over one minute and at an SoC of 93%. It then increases its requested current again to values greater than 40 A. Shedding of modules, with charge profiles similar to the one being shown, leads to an unwanted prolonging of the charging session. This problem of a faulty load management evaluation due to unknown charging profiles can also be present during the bulk charging of the EV battery. A measurement, where the EV requests less current than its allowance and its maximum battery current during the bulk charge, is depicted in Figure 15. The EV has a maximum battery current of 200 A, and the SoC is below 70%. However, only less than 100 A are requested for most of the bulk charge.

4.6. Overall Daily Performance Potential—Simulation

The final scenario, which represents the overall daily performance, could include all the previous use cases in one, as all represent real needs of EV users. This, in turn, is important for the operator of a charging station to calculate the amortization time or to make a site selection. Figure 16 shows the assigned charge power throughout a whole day of simulation and clarifies the potential of the load management algorithm to increase the daily utilization of a charging station. Comparing the displayed simulation result with the number of chargeable vehicles by a classic one connector charging station (same charge request density), the energy volume and the utilization hours are nearly 2.4 times higher. This clearly demonstrates the benefit of multi-vehicle charging stations in combination with intelligent load management and their ability to operate the charging infrastructure in a customer-friendly and economically profitable manner in the future.

5. Conclusions and Future Work

A load management concept for CCS fast charging stations in urban areas, based on the idea to maximize the charge point availability despite power limitations present on the grid level, has been proposed. The concept has been tested and validated through tests with a prototype hardware implementation for use in a DC catenary grid and commercial electric vehicles. The measurement results fit the predictions made by simulations and show that the active switchover of the converter modules between multiple charge points mitigates some of the uncertainty that arises from the fact that EVSEs, which are interoperable with the DIN Spec 70121, have no information about the state of health of the EV battery and therefore cannot approximate the charging profiles.
According to the different behaviors of individual EVs regarding fluctuating charging power, some adjustments to the simulation software as well as the charging station will be necessary. First, the load management must be modified from a power-led to a current-led system, since the vehicles do not necessarily accept the available output power of the charging station, even under supposedly ideal conditions. Based on this, an EV-response-model must be developed, which allows the manual specification of certain vehicle-side behaviors to test the adapted control algorithm. If the underlying standards do not provide any clear specifications with regard to active load management, the corresponding systems have no choice but to deal with the response behavior of the vehicles in the best possible manner available.

Author Contributions

Conceptualization, M.W. and T.S.; methodology, M.W. and T.S.; software, M.W. and T.S.; validation, M.W. and T.S.; formal analysis, M.W. and T.S.; investigation, M.W. and T.S.; resources, M.W., T.S., D.M. and H.F.; writing—original draft preparation, M.W., T.S., D.M., U.S. and H.F.; writing—review and editing, M.W., T.S., D.M., U.S., H.F., R.W., S.S. and B.S.; visualization, M.W. and T.S.; supervision, M.W. and T.S.; project administration, M.W. and T.S.; funding acquisition, R.W., H.F., S.S. and B.S. All authors have read and agreed to the published version of the manuscript.

Funding

This research was funded by Federal Ministry of Transport and Digital Infrastructure, grant number 03MKS002B.

Data Availability Statement

Data available in a publicly accessible repositoryThe data presented in this study are openly available in https://git.uni-wuppertal.de/tschneider.

Acknowledgments

The presented article was developed during the research project “BOB Solingen”, which is funded by the Federal Ministry of Transport and Digital Infrastructure. The urban transportation operator (Stadtwerke Solingen GmbH) assisted with all the measurements. University colleagues from all involved academic chairs were essential for a constant exchange of knowledge and new thoughts.

Conflicts of Interest

The authors declare no conflict of interest.

References

  1. International Energy Agency. Global EV Outlook 2021—Accelerating Ambitions Despite the Pandemic; International Energy Agency: Paris, France, 2021. [Google Scholar]
  2. International Energy Agency. Global EV Outlook 2020—Entering the Decade of Electric Drive; International Energy Agency: Paris, France, 2020. [Google Scholar]
  3. United Nations. Paris Agreement; COP 21; The United Nations: Paris, France, 2015. [Google Scholar]
  4. Enzmann, J.; Ringel, M. Reducing Road Transport Emissions in Europe: Investigating A Demand Side Driven Approach. Sustainability 2020, 12, 7594. [Google Scholar] [CrossRef]
  5. Euopean Commission. Fit for 55 Package; Euopean Commission: Brussels, Belgium, 2021. [Google Scholar]
  6. European Environment Agency. Monitoring CO2 Emissions from Passenger Cars and Vans in 2018; European Environment Agency: Copenhagen, Denmark, 2020.
  7. International Energy Agency. World Energy Outlook 2021; International Energy Agency: Paris, France, 2021. [Google Scholar]
  8. European Court of Auditors. Infrastructure for Charging Electric Infrastructure for Charging Electric Vehicles: More Charging Stations But Uneven Deployment More Charging Stations but Uneven Deployment; European Union: Luxembourg, 2021. [Google Scholar]
  9. Brown, A.; Lommele, S.; Schayowitz, A.; Klotz, E. Electric Vehicle Charging Infrastructure Trends from the Alternative Fueling Station Locator: Third Quarter 2020; National Renewable Energy Lab. (NREL): Golden, CO, USA, 2021.
  10. Euopean Commission. The European Green Deal; Euopean Commission: Brussels, Belgium, 2019. [Google Scholar]
  11. Wolbertus, R.; van den Hoed, R.; Kroesen, M.; Chorus, C. Charging infrastructure roll-out strategies for large scale introduction of electric vehicles in urban areas: An agent-based simulation study. Transp. Res. Part A Policy Pract. 2021, 148, 262–285. [Google Scholar] [CrossRef]
  12. Nicholas, M.; Lutsey, N. Quantifying the Electric Vehicle Charging Infrastructure Gap in the United Kingdom; International Coucil on Clean Transportation: London, UK, 2020. [Google Scholar]
  13. Brenna, M.; Foiadelli, F.; Leone, C.; Longo, M. Electric Vehicles Charging Technology Review and Optimal Size Estimation. J. Electr. Eng. Technol. 2020, 15, 2539–2552. [Google Scholar] [CrossRef]
  14. Tu, H. Extreme Fast Charging of Electric Vehicles: A Technology Overview. IEEE Trans. Transp. Electrific. 2019, 5, 861–878. [Google Scholar] [CrossRef]
  15. Rare Look Inside Tesla Supercharger. Available online: https://insideevs.com/news/322486/rare-look-inside-tesla-supercharger/ (accessed on 19 October 2021).
  16. INFOGRAPHIC|Terra 184 Charger. Available online: https://search.abb.com/library/Download.aspx?DocumentID=9AKK107680A8808&LanguageCode=en&DocumentPartId=&Action=Launch (accessed on 19 October 2021).
  17. Product Leaflet Electric Vehicle Infrastructure Terra High Power—GEN III. Available online: https://search.abb.com/library/Download.aspx?DocumentID=9AKK107991A9632&LanguageCode=en&DocumentPartId=&Action=Launch (accessed on 19 October 2021).
  18. Jiang, T.; Chen, X.; Zhang, J.; Wang, Y. Bidirectional llc resonantconverter for energy storage applications. In Proceedings of the Twenty-EighthAnnual IEEE Applied Power Electronics Conference and Exposition(APEC), Long Beach, CA, USA, 17–21 March 2013; pp. 1145–1151. [Google Scholar]
  19. Zhao, B.; Song, Q.; Liu, W.; Sun, Y. Overview of dual-active-bridge isolated bidirectional dcdc converter for high-frequency-linkpower-conversion system. IEEE Trans. Power Electron. 2014, 29, 4091–4106. [Google Scholar] [CrossRef]
  20. Zahid, Z.U.; Dalala, Z.M.; Chen, R.; Chen, B.; Lai, J. Design of Bidirectional DC–DC Resonant Converter for Vehicle-to-Grid (V2G) Applications. IEEE Trans. Transp. Electrific. 2015, 1, 232–244. [Google Scholar] [CrossRef]
  21. Jung, J.; Kim, H.; Kim, J.; Ryu, M.; Baek, J. High efficiency bidirectional llc resonant converter for 380V dc power distribution system using digital control scheme. In Proceedings of the Twenty-Seventh Annual IEEE Applied Power Electronics Conference and Exposition (APEC), Orlando, FL, USA, 5–9 February 2012; pp. 532–538. [Google Scholar]
  22. Schneider, T.; Kratz, S.; Wegener, R.; Soter, S. Symmetrical Bidirectional CLLC-Converter with Simplified Synchronous Rectification for EV-Charging in Isolated DC Power Grids. In Proceedings of the IEEE 28th International Symposium on Industrial Electronics (ISIE), Vancouver, BC, Canada, 12–14 June 2019. [Google Scholar]
  23. Kong, P.; Karagiannidis, G.K. Charging Schemes for Plug-In Hybrid Electric Vehicles in Smart Grid: A Survey. IEEE Access 2016, 4, 6846–6875. [Google Scholar] [CrossRef]
  24. Li, Y.; Ni, Z.; Zhao, T.; Zhong, T.; Liu, Y.; Wu, L.; Zhao, Y. Supply Function Game Based Energy Management Between Electric Vehicle Charging Stations and Electricity Distribution System Considering Quality of Service. IEEE Trans. Ind. Appl. 2020, 56, 5932–5943. [Google Scholar] [CrossRef]
  25. Clement-Nyns, K. The Impact of Charging Plug-In Hybrid Electric Vehicles on a Residential Distribution Grid. IEEE Trans. Power Syst. 2010, 25, 371–380. [Google Scholar] [CrossRef] [Green Version]
  26. Shao, S. Demand Response as a Load Shaping Tool in an Intelligent Grid With Electric Vehicles. IEEE Trans. Smart Grid 2011, 2, 624–631. [Google Scholar] [CrossRef]
  27. Deshmukh, R.R.; Ballal, M.S. An energy management scheme for grid connected EVs charging stations. In Proceedings of the 2018 International Conference on Power, Instrumentation, Control and Computing (PICC), Thrissur, India, 18–20 January 2018; pp. 1–6. [Google Scholar]
  28. Zhang, J.; Yuan, R.; Yan, D.; Li, T.; Jiang, Z.; Ma, C.; Chen, T.; Luo, G. A Non-Cooperative Game Based Charging Power Dispatch in Electric Vehicle Charging Station and Charging Effect Analysis. In Proceedings of the 2018 2nd IEEE Conference on Energy Internet and Energy System Integration (EI2), Beijing, China, 20–22 October 2018. [Google Scholar]
  29. Yao, L.; Damiran, Z.; Lim, W.H. A fuzzy logic based charging scheme for electric vechicle parking station. In Proceedings of the 2016 IEEE 16th International Conference on Environment and Electrical Engineering (EEEIC), Florence, Italy, 7–10 June 2016; pp. 1–6. [Google Scholar]
  30. Motoaki, Y.; Yi, W.; Salisbury, S. Empirical analysis of electric vehicle fast charging under cold temperatures. Energy Policy 2018, 122, 162–168. [Google Scholar] [CrossRef]
Figure 1. Schematic Concept of the STS in the City of Solingen.
Energies 14 08399 g001
Figure 2. Comparison of converter topologies. (a) Conventional Dual Active Bridge, (b) Bidirectional LLC Resonant Converter, (c) Bidirectional CLLC Resonant Converter.
Energies 14 08399 g002
Figure 3. Schema Diagram of the CurrentDemandRes.
Energies 14 08399 g003
Figure 4. (a) Remote Supply, (b) Converter Module, (c) Switching Matrix Module.
Energies 14 08399 g004
Figure 5. The Switching Matrix State Machine. (a) Relay Turn on Request, (b) Relay Turn on, (c) Relay Turn off Request, (d) Module Output Voltage not Decreasing, (e) Relay Turn off, (f) Relay Disabled and (g) Relay Enabled.
Energies 14 08399 g005
Figure 6. Switching of one Converter Module. (a) Relay Turn off Request, (b) Relay Turn off, (c) Current Limit Adjustment, (d) Relay Turn on Request, (e) Relay Turn on and (f) Current Limit Adjustment.
Energies 14 08399 g006
Figure 7. Load Management Strategies. (a) Consecutive Charging, (b) Simultaneous Charging.
Energies 14 08399 g007
Figure 8. Load Management Algorithm.
Energies 14 08399 g008
Figure 9. Classic Use Case. (a) Feeding Compensation Account, (b) Charge Power and (c) State of Charge.
Energies 14 08399 g009
Figure 10. Measured Charging Process of Two Electric Vehicles Simultaneously. (a) Feeding Compensation Account, (b) Charge Power and (c) State of Charge.
Energies 14 08399 g010
Figure 11. Double Split by Preferences. (a) Feeding Compensation Account, (b) Charge Power, (c) State of Charge.
Energies 14 08399 g011
Figure 12. Simultaneous Trio. (a) Feeding Compensation Account, (b) Charge Power and (c) State of Charge.
Energies 14 08399 g012
Figure 13. One against Three. (a) Feeding Compensation Account, (b) Charge Power and (c) State of Charge.
Energies 14 08399 g013
Figure 14. Two Different Endings of Charging Sessions. MINI SE(2020) in (a,b) and Hyundai KONA (2019) in (c,d).
Energies 14 08399 g014aEnergies 14 08399 g014b
Figure 15. Measured Bulk Charging Process of a Hyundai KONA (2019). (a) Charge Current and Maximum Current Limit and (b) State of Charge.
Energies 14 08399 g015
Figure 16. Overall Performance by Preferences.
Energies 14 08399 g016
Table 1. IEC61851-1 Charging Modes.
Mode1234
EV power supplyACACACDC
communicationnonePWMPWMPWM and digital
charging current
controllability
EV onlyEV onlystation and EVstation and EV
max. current 16 A 32 A 63 Aup to 400 A
max. power 3.7 kW (1p)
11 kW (3p)
7.4 kW (1p)
22 kW (3p)
14.5 kW (1p)
43.5 kW (3p)
up to 400 kW
Table 2. Functional Differences between CCS-Communication Protocols.
ProtocolDIN SPEC 70121ISO 15118 ver.1ISO 15118 ver.2
DC-Charging
AC-Charging
Load Management
Plug & Charge
Secured Communication
Bidirectional Charging
Inductive Charging
Publisher’s Note: MDPI stays neutral with regard to jurisdictional claims in published maps and institutional affiliations.

