Article

Comparative Multicriteria Analysis Methods for Ranking Sites for Solar Farm Deployment: A Case Study in Greece

by
Dimitra G. Vagiona
Department of Spatial Planning and Development, Aristotle University of Thessaloniki, 54124 Thessaloniki, Greece
Energies 2021, 14(24), 8371; https://doi.org/10.3390/en14248371
Submission received: 12 November 2021 / Revised: 8 December 2021 / Accepted: 10 December 2021 / Published: 12 December 2021
(This article belongs to the Special Issue Energy Decision Making: Problems, Methods, and Tools)

Abstract

:
This study investigated the prioritization and ranking problem of the appropriate locations at which to deploy solar photovoltaic (PV) farms. Although different Multicriteria Decision Making (MCDM) methods can be found in the literature to address this problem, a comparative analysis of those methods is missing. The aim of this study is to compare four different MCDM approaches to evaluate and rank suitable areas for the deployment of solar PV farms, with the island of Rhodes (Greece) being used as an example. Feasible areas for the location of such facilities were identified with the use of Geographical Information Systems (GIS), by applying certain exclusion criteria found either in the national legislative framework or in the international literature. Data were obtained from Greek open geospatial data. The feasible sites were evaluated and ranked using four different MCDM methods: the Analytical Hierarchy Process (AHP), the Technique for Order Preference by Similarity to Ideal Solution (TOPSIS), the VIKOR (VIseKriterijumska Optimizacija I Kompromisno Resenje), and the PROMETHEE II (Preference Ranking Organization METHod for Enrichment of Evaluations) method. The best alternative rated according to three TOPSIS, VIKOR and PROMETHEE is site (S2). The second-best alternative in the above three methods is site (S1), while the worst is site (S3). The best alternative rated according to AHP (S4) is in sixth position according to TOPSIS and in fifth position VIKOR and PROMETHEE. The comparison demonstrated that different MCDM techniques may generate different ranks. The simultaneous use of several MCDM methods in energy siting problems is considered advantageous as it can help decision makers to select the most sustainable sites, avoiding the disadvantages and availing the advantages of each method.

1. Introduction

The share of renewable energy in the European Union has been almost doubled between 2004 and 2019 [1]. Although wind and hydropower are the main sources of renewables for gross electricity generation, solar photovoltaic (PV) has seen a significant growth and is expected to lead electricity production from renewables in the future [1]. According to International Energy Agency (IEA) [2], “net additions in Europe are expected to increase steadily from 21 GW in 2021 to an average of 25 GW per year between 2023 and 2025 and this trend is largely supported by an increase in policy efforts to meet the European Union’s 2030 renewable energy target of 32% under the Renewable Energy Directive”. Greece ranks 3rd and 5th worldwide with regard to PV contribution to electricity needs and installed PV capacity per capita respectively and PV covers 7% of the country’s electricity demand in 2019 [3]. The solar photovoltaic installed capacity had increased from 202 MW in 2010 to 3247 MW in 2020, while the electricity generation had increased from 158 GWh in 2010 to 4429 GWh in 2020 [4]. A long-term energy planning is currently underway in Greece, having as a preliminary target for cumulative PV capacity till 2030 the amount of 6.9 GW [3].
It is evident that solar energy is important in achieving the energy transition, and its role in power supply has become more important during the last few decades. It is a technology that could provide significant support to current energy technologies, allowing reductions in the consumption of fossil fuels. An appropriate implementation of this technology will not only allow the creation of new jobs but will also contribute to the economic and industrial development of the areas where they are sited. On the other hand, this technology can lead to some environmental problems such as biodiversity damage, migration of birds, and deforestation. To avoid negative impacts, it is extremely important to select very carefully which sites are the most suitable for deploying this technology and to ensure balanced and sustainable development.
Geographic Information Systems can be used to find suitable locations to implement solar energy facilities, and they can visually depict useful information (e.g., protected areas, roads, settlements, electricity grid) through thematic layers that provide maps. The use of GIS to solve the siting of solar energy facilities began to develop almost 15 years ago [5] and has become more widespread since then (e.g., [6,7]).
In addition, the literature includes several multicriteria analysis methods that can be applied to solar energy siting problems. Analytical Hierarchy Process (AHP) is highly recommended as an evaluation method both for the assessment criteria and the alternatives, while Technique for Order Preference by Similarity to Ideal Solution (TOPSIS) is also a method that stands out for solving energy problems [8]. There are many case studies combining GIS with multicriteria decision making methods (MCDM), multi-objective optimization methods with several objectives, or probabilistic methods in spatial planning such as urban planning, urban infrastructure, and, during the last decade, the combination of GIS–MCDM has been spreading to applications related to energy [9].
The main aim of the study is to perform and compare four classic multi-criteria decision-making methods (AHP, TOPSIS, VIKOR and PROMETHEE) in solar farm siting applications and compare their results in the evaluation and ranking suitable areas for the deployment of solar PV farms in the Rhodes island, Greece. The criteria for selecting these methods are to include: (i) both frequently and scarcely used MCDM methods and (ii) methods based on pairwise comparison, scoring, and outranking. Although there have been recently performed many studies evaluating the most appropriate sites for solar facilities deployment in various countries, by combining GIS with different multicriteria analysis methods, the application, assessment, and comparison of four different multicriteria decision methods make the application in the present study novel. There is a clear preference of researchers to apply AHP in evaluating different alternatives and TOPSIS is also a method used for solving energy problems [8]. However, the application of other MCDM methods such as VIKOR and PROMETHEE is rather scarce. Similarly, in the solar PV farm site selection problems, researchers have frequently used the AHP approach in their methodology (e.g., of recent applications [10,11,12,13,14,15]) as well as TOPSIS method (e.g., [16,17,18,19]. Solangi et al. [20] employed F-VIKOR method, while, to the author’s knowledge, the PROMETHEE method has not been applied in any case-study in the literature of solar PV farm siting problem. Thus, the author performed both frequently-used and scarcely-used classic multi-criteria decision-making methods and compared their results. To the best of the author’s knowledge, this is the first study that compares four different MCDM approaches to evaluate and rank suitable areas for the deployment of a solar PV farm. The comparative analysis highlights the strengths and the weaknesses of each method and demonstrates the benefit of their simultaneous use. In addition, the simultaneous use of these methods is considered advantageous as it can help decision makers to select the most sustainable sites, avoiding the weaknesses and availing the strengths of each method.
We carried out a comparison among four MCDM methods, assessed their application, and investigated their impact on the site selection problem for the deployment of a solar photovoltaic (PV) farm in the Rhodes island (Greece). Section 2 presents a brief overview of MCDM methods for evaluation of site alternatives. Section 3 presents the research methodology as well as the multicriteria analysis techniques implemented in this work. In Section 4, the suitable areas in each Regional Unit are evaluated by four methods of multicriteria decision making (AHP, TOPSIS, VICKOR, PROMETHEE II). Finally, Section 5 concludes with useful remarks.

2. Overview of the Application of MCDM Methods to Site Selection for Solar Farm Deployment

As already outlined in the introduction section, MCDM methods are a valuable tool in solving energy spatial planning problems. Table A1 in Appendix A summarizes indicatively several case studies regarding the use of MCDM methods for the evaluation of site alternatives for solar PV farm deployment.
More specifically, researchers have used the AHP approach frequently in their methodology for selecting the best locations for solar PV deployment, and the most recent applications are presented in the Appendix A (Table A1). Uyan [21] determined a land suitability index map for the appropriate siting of solar farms in Karapinar region, Konya, Turkey by integrating AHP and GIS. Watson and Hudson [22] assessed the suitability of solar and wind farm deployments in a large area of southern England using GIS and a multicriteria decision-making framework incorporating AHP and expert stakeholders’ involvement. Georgiou and Skarlatos [10] in their study at the Limassol district in Cyprus, employed the AHP to estimate the criteria weights in order to evaluate land suitability for the ideal photovoltaic solar power plant site. Ali et al. [6] used GIS and AHP to assess various physiographic, environmental and economic siting criteria to produce suitability maps and identify the most appropriate areas to site utility-scale wind and solar farms in Songkhla, in southern Thailand. In the Regional Unit of Rethymno, Greece, Giamalaki and Tsoutsos [12] used GIS and the AHP method to develop a dynamic methodology for locating sustainable siting areas for PV and CSP farms. Colak et al. [13] used GIS and AHP to determine the best places for solar PV power plant installation in Malatya Province, Turkey, and assessed their feasibility and efficiency for the entire country. Ruiz et al. [23] integrated an Analytic Hierarchy Process (AHP) based Multi Criteria Decision Analysis (MCDA) algorithm into a Geographical Information System (GIS) program to create a tool for the evaluation of site-suitability for solar power facilities in West Kalimantan Province, Indonesia. Saraswat et al. [11] used GIS and AHP to find suitable locations for solar PV and wind power technologies in India. Prieto-Amparán et al. [14] aimed at evaluating site-suitability in the Desert of Chihuahua in Mexico, for the development of solar farm by using AHP methodology integrated with GIS. In Kahramanmaraş, Turkey, Günen [24] used a GIS with layers of satellite-derived data for energy resources as well as locally acquired data, and AHP to choose acceptable and unsuitable areas. Albraheem et al. [15] assessed appropriate sites for the deployment of solar energy project, by developing a GIS-AHP-based methodology and performing a geospatial analysis of solar energy in the Riyadh region in Saudi Arabia.
It should be noted that in all studies, AHP has been used for site suitability analysis of solar energy projects.
Kengpol et al. [25] used the Fuzzy Analytic Hierarchy Process (FAHP) and Technique for Order of Preference by Similarity to Ideal Solution (TOPSIS) methods to examine solar power plant sites in Thailand. Using GIS and MCDM, such as the TOPSIS approach (to analyze the alternatives) and the AHP method, Sánchez-Lozano Lozano et al. [26] established the optimal location to deploy a solar thermoelectric power plant on the coast of the Region of Murcia, southeast Spain. Sánchez-Lozano et al. [17] used the TOPSIS approach to evaluate various alternatives in order to determine the best location for photovoltaic solar power facilities on the Murcia coast in Spain. In a case study in Iran, Alhuyi Nazari et al. [18] selected ideal sites for photovoltaic installation. The key choices for utility-scale PV plant installation were four alternative places, and the optimum option was chosen using the TOPSIS approach. Ali Sadad et al. [19] proposed an integrated methodology that combined fuzzy AHP and fuzzy TOPSIS approaches to examine the evolution of solar energy generation in Iran. Al-Shammari [27] investigated prospective locations in Saudi Arabia for a PV system facility using AHP and TOPSIS methods integrated with the GIS software tool.
Solangi et al. [20] employed the fuzzy VlseKriterijuska Optimizacija I Komoromisno Resenje (F-VIKOR) method to prioritize 14 cities of Pakistan for solar photovoltaic (PV) power project installation.
Other approaches include those that are less commonly used for solar technology site selection, such as FLOWA module, DEMATEL, D-BCA and MACBETH. Charabi and Gastli [28] developed a GIS-based spatial multicriteria evaluation approach (FLOWA module) to determine the suitability of land in Oman for the construction of huge solar farms. Chen et al. [29] investigated the interdependent interrelationship and influential weights among criteria for solar farm siting using a hybrid MCDM model that included a decision-making trial and evaluation laboratory (DEMATEL) and a DEMATEL-based analytic network process (DANP) based on GIS. Amjad and Ali Shah [30] used Geographic Information Systems (GIS) for data collecting and mapping, as well as an unique Density-Based Clustering Approach (D-BCA) to find and group places with significant solar potential within Pakistan’s geographic limits. Hinestroza-Olascuaga [31] used an MCDM technique based on the Measuring Attractiveness by a Categorical Based Evaluation Technique (MACBETH) to analyze the appropriateness of probable locations in South America for implementing off-grid solar PV plants.

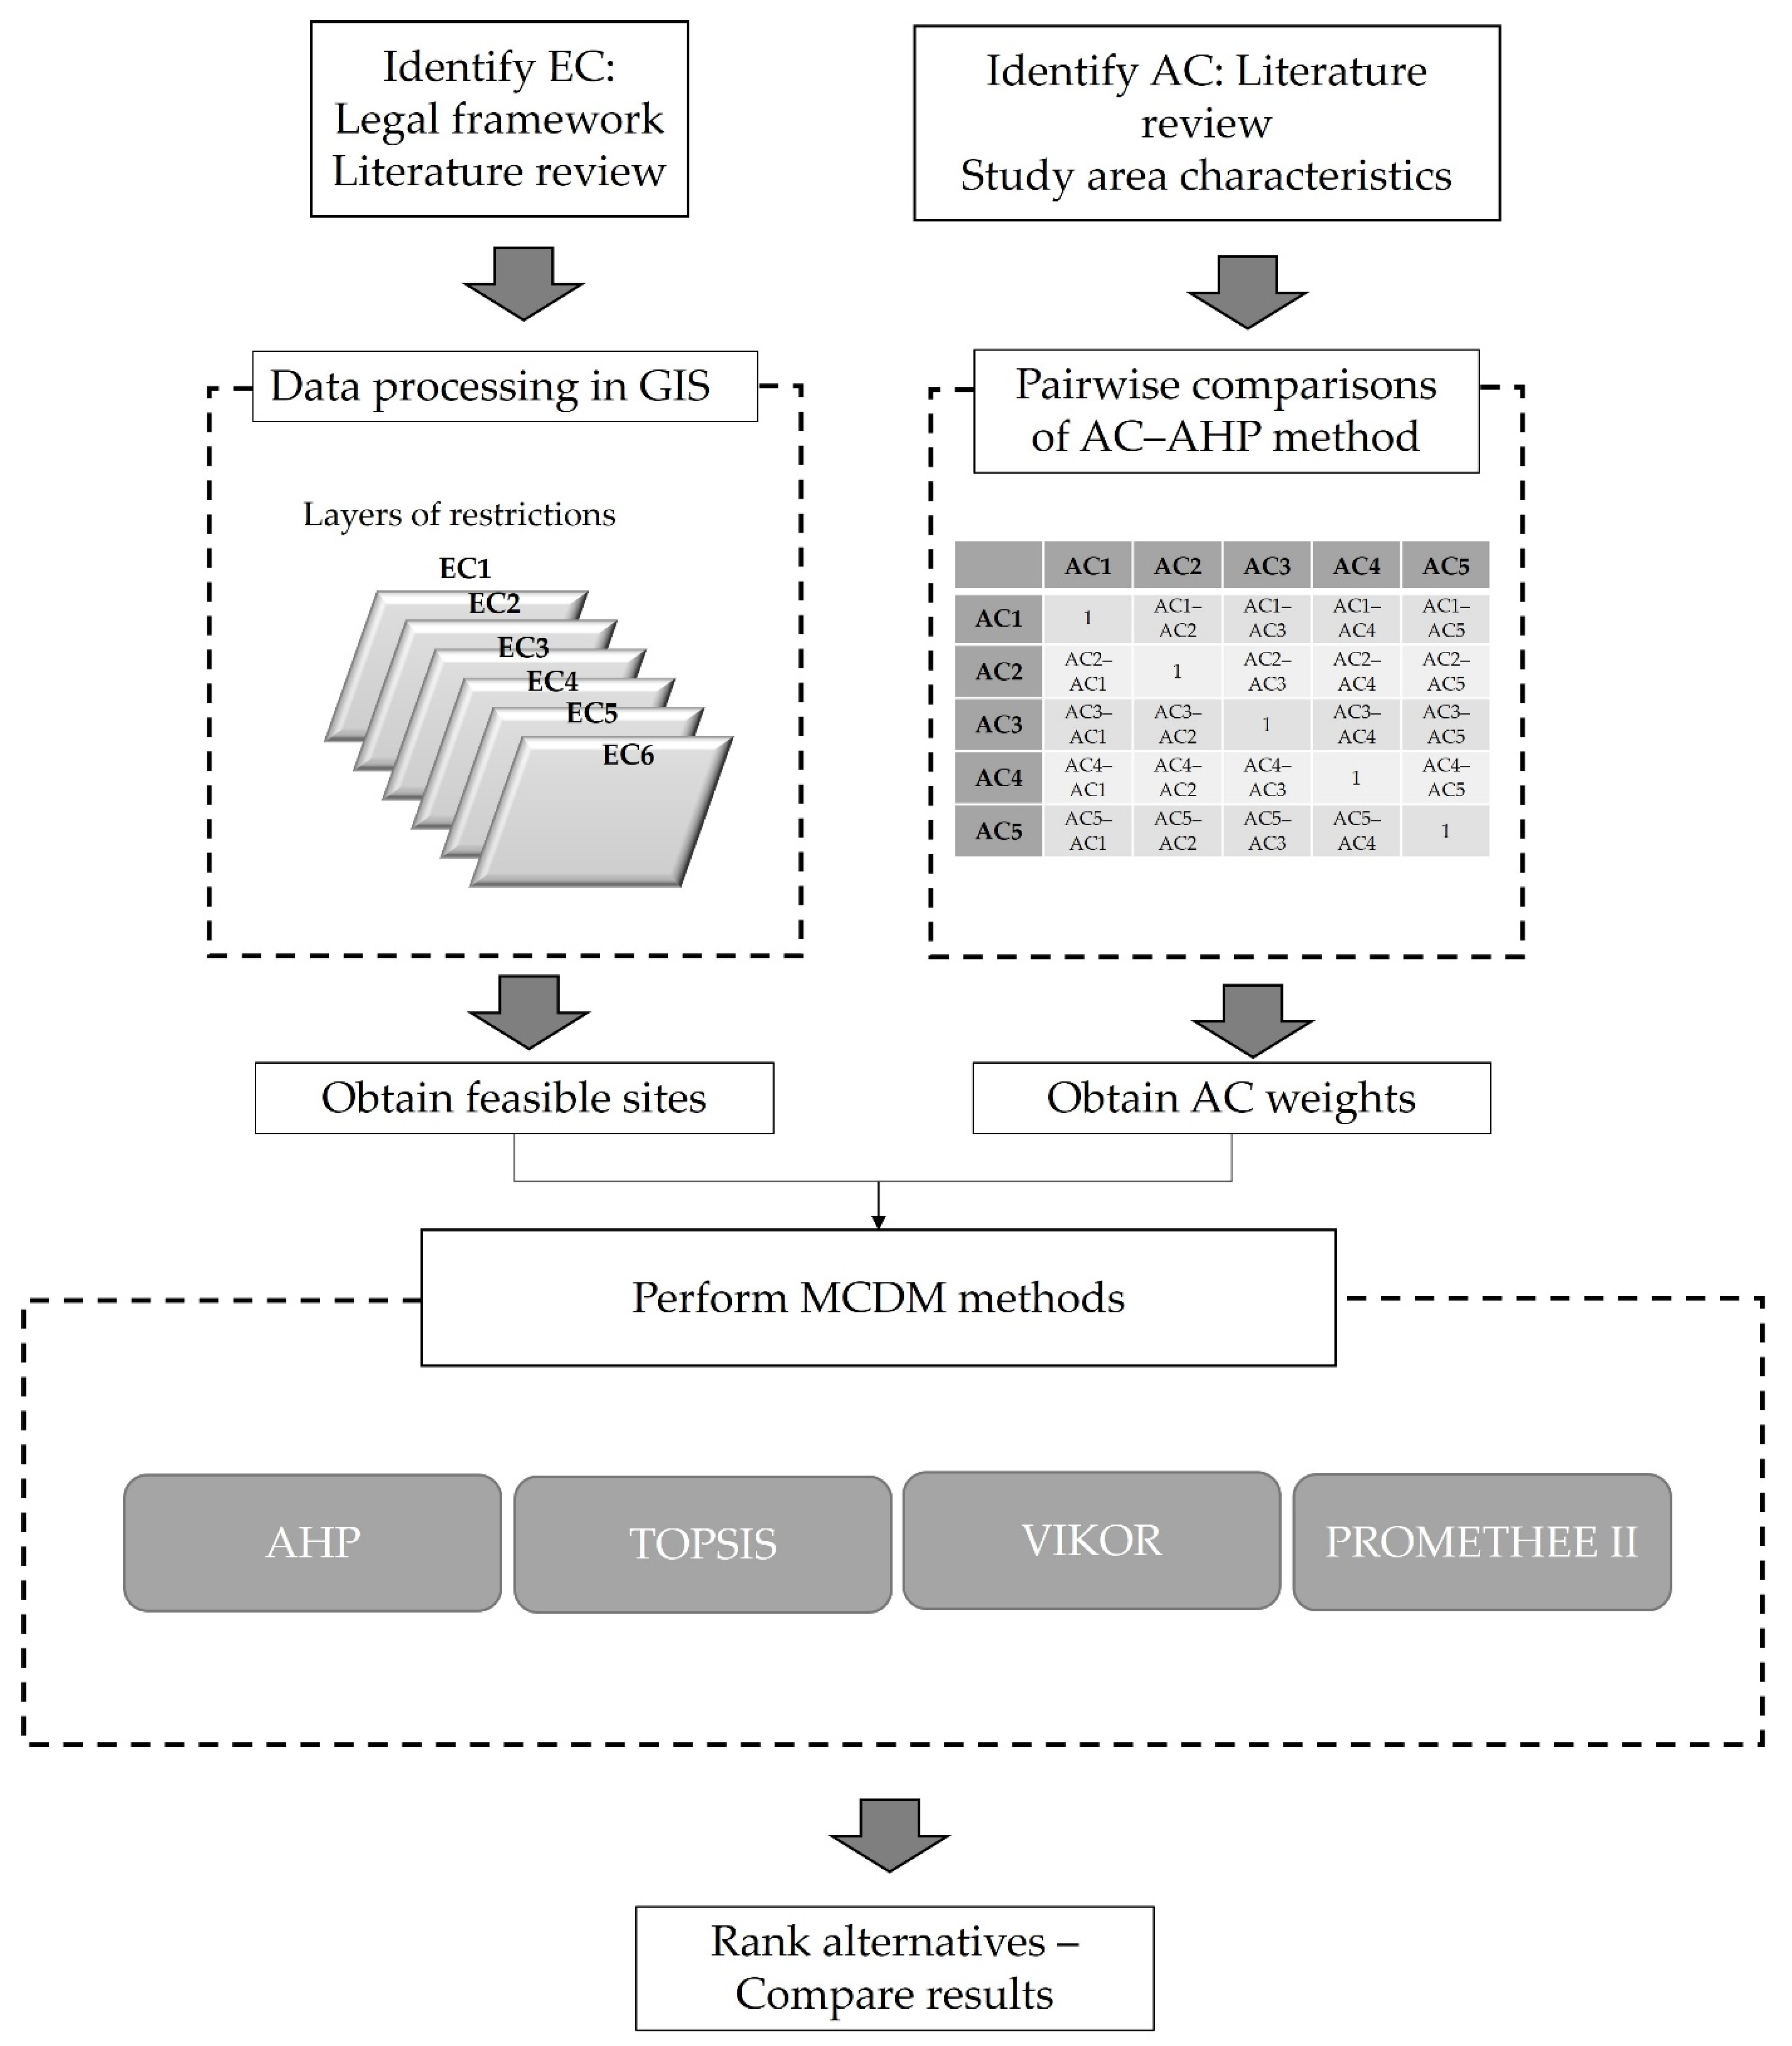
3. Materials and Methods
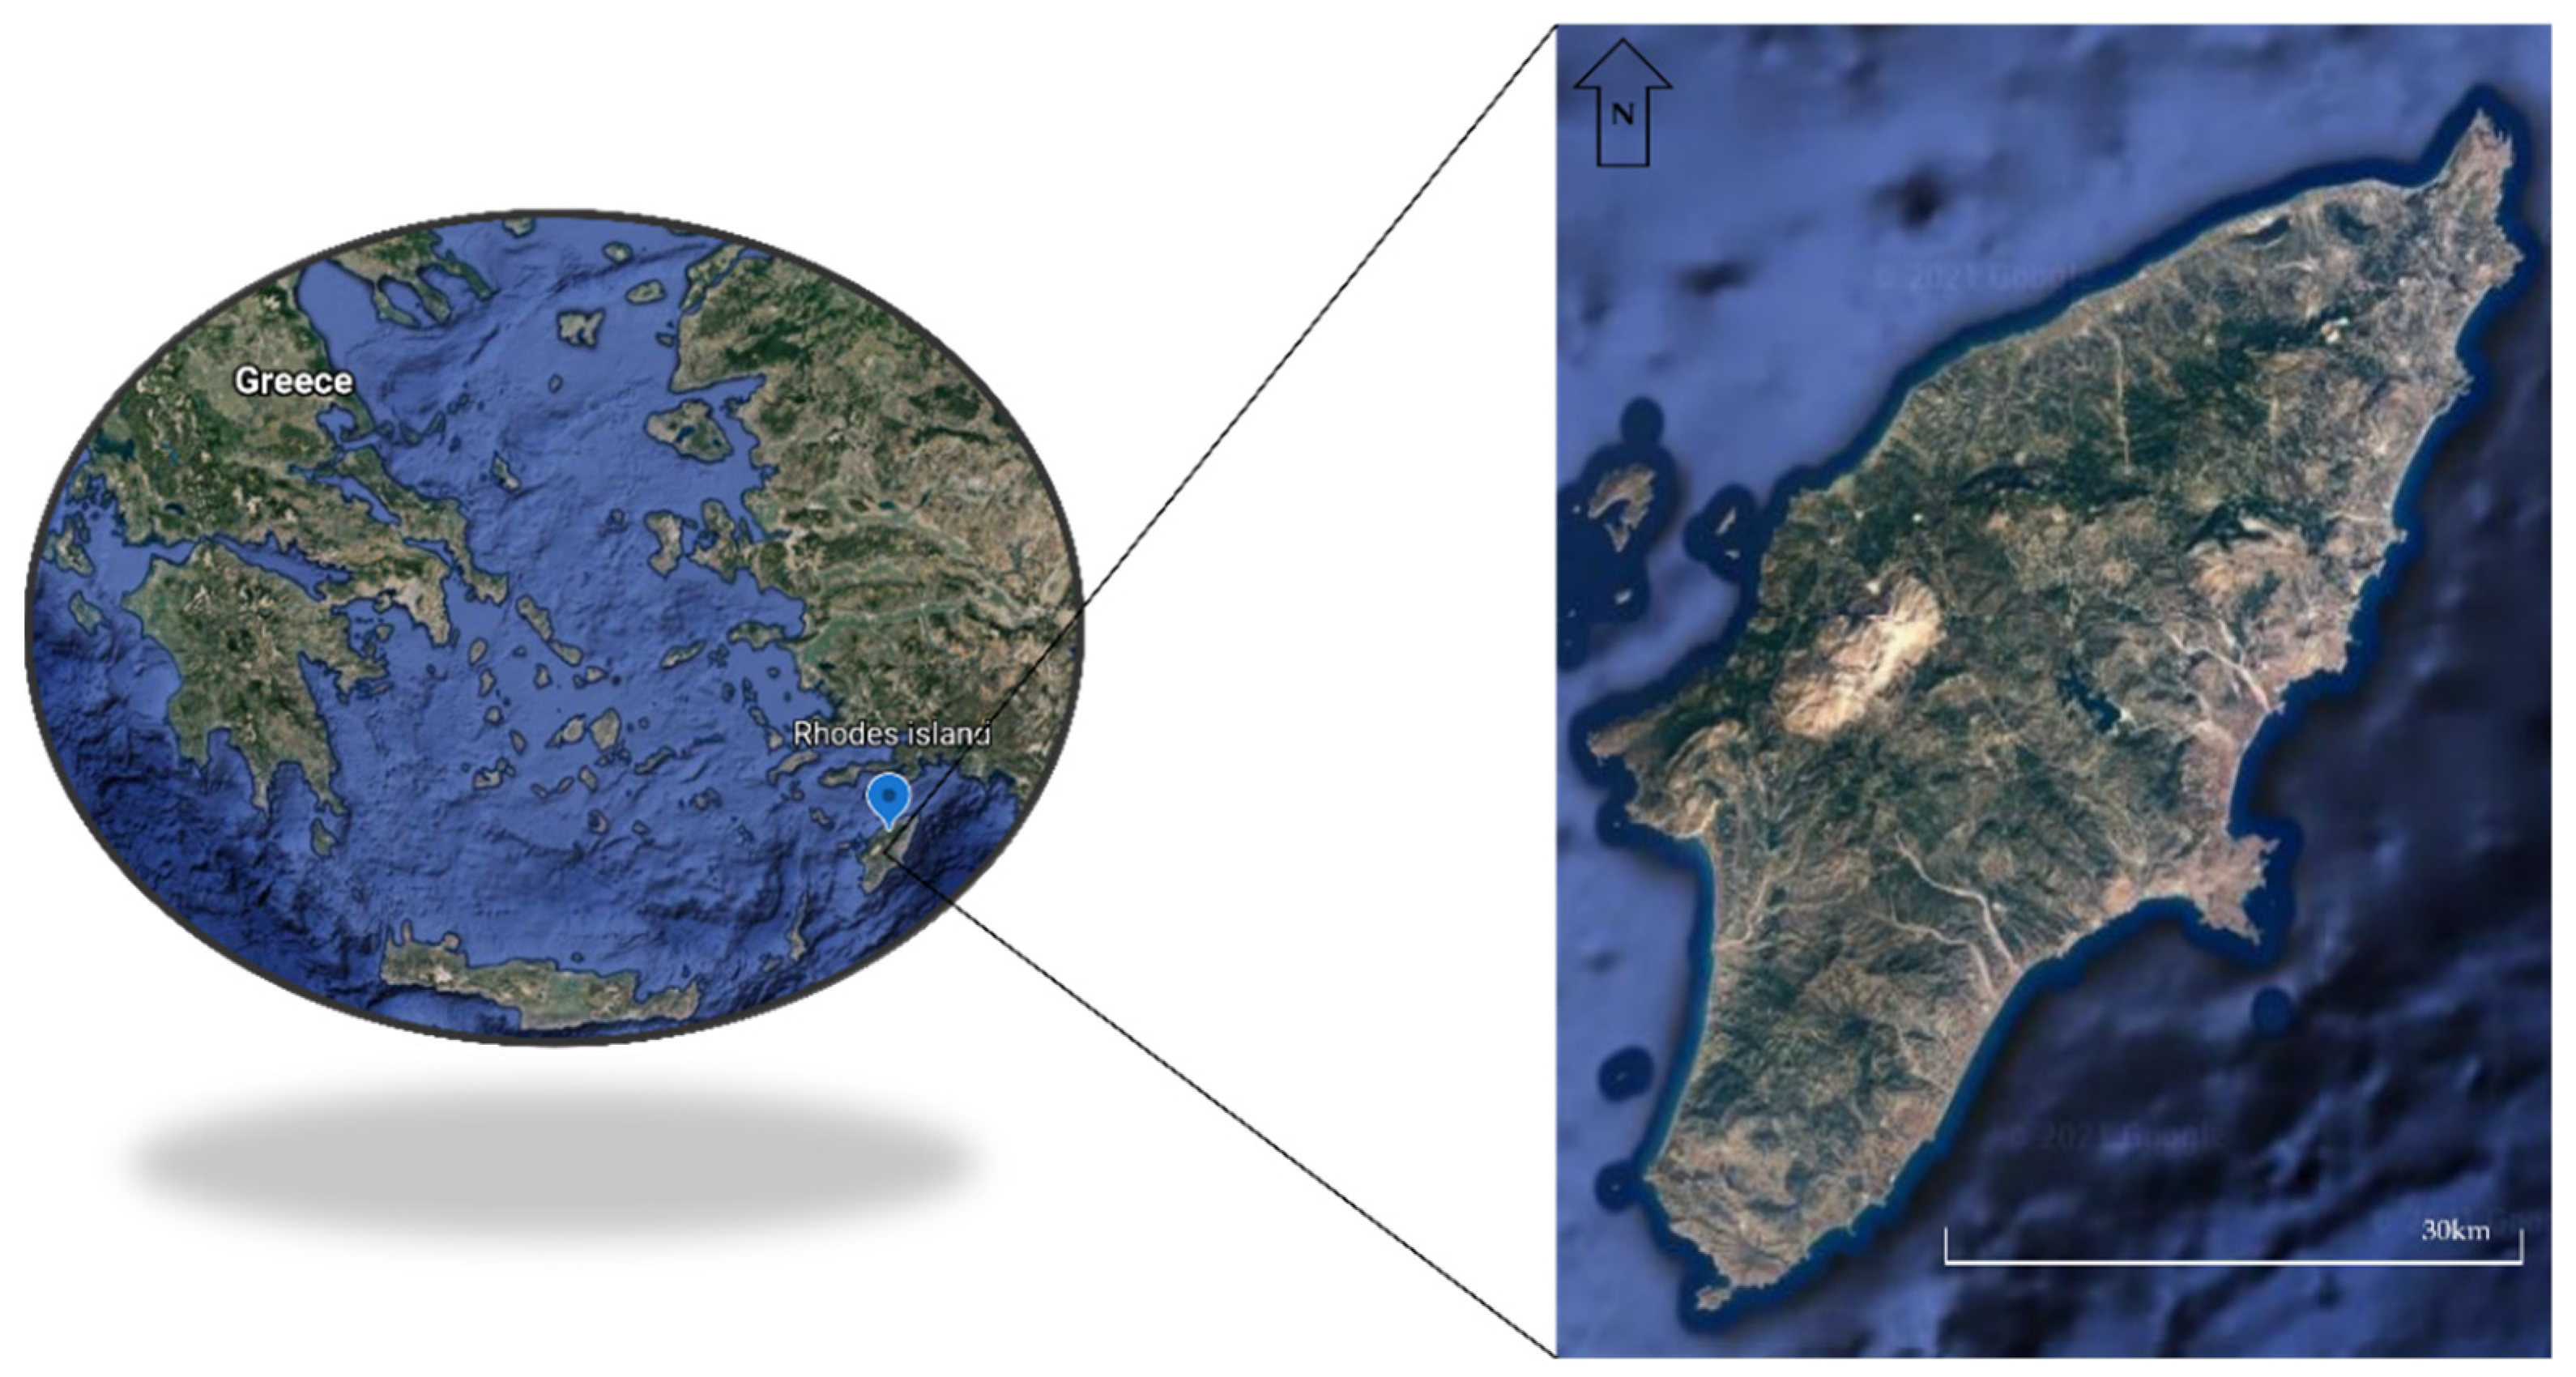
Τhe implementation of photovoltaic (PV) solar farms in the island of Rhodes (Greece) is a viable option since the contribution of solar thermoelectric energy is critical to addressing the energy objectives established for 2030. The first stage is to assess which sites are suited for that purpose and which are not. To achieve this, GIS are used since they are able: (i) to analyze and visualize geospatial information and (ii) to create a database that will serve as a starting point for any decision support system. The second stage includes the identification of the optimal locations to site a PV solar farm, considering various environmental, economic, social, and technical aspects. It is critical not only to find appropriate sites, but also to find the most suitable ones. MCDM methodologies contribute to solving the above problem since they can indicate the most suitable area for the installation of a PV solar farm. In this case, the suitable areas were evaluated and ranked using four different multicriteria decision methods: AHP, TOPSIS, VIKOR, and PROMETHEE II. All computations were performed in Excell spreadsheets. All of the above is reflected in Figure 1.

3.1. Study Area

The island of Rhodes is the largest island of the Dodecanese group islands, southwest of mainland Greece and north-east of Crete (Figure 2). Administratively, it forms a separate municipality within the Rhodes regional unit, which is part of the South Aegean administrative region. The island of Rhodes extends to an area of approximately 1400 km2, is shaped like a spearhead with a coastline of approximately 220 km. Its permanent population according to the last national official population census in 2011 corresponds to 115,490 people. The island has a typical Mediterranean climate, with hot and dry summers and pleasant winters with little precipitation. Its economy relies to a great extent on the tourism sector. The island has several protected areas, many outstanding beaches and plentiful renewable energy sources (high values of global horizontal irradiance and wind velocity).

3.2. Identification of Criteria and Data Sources

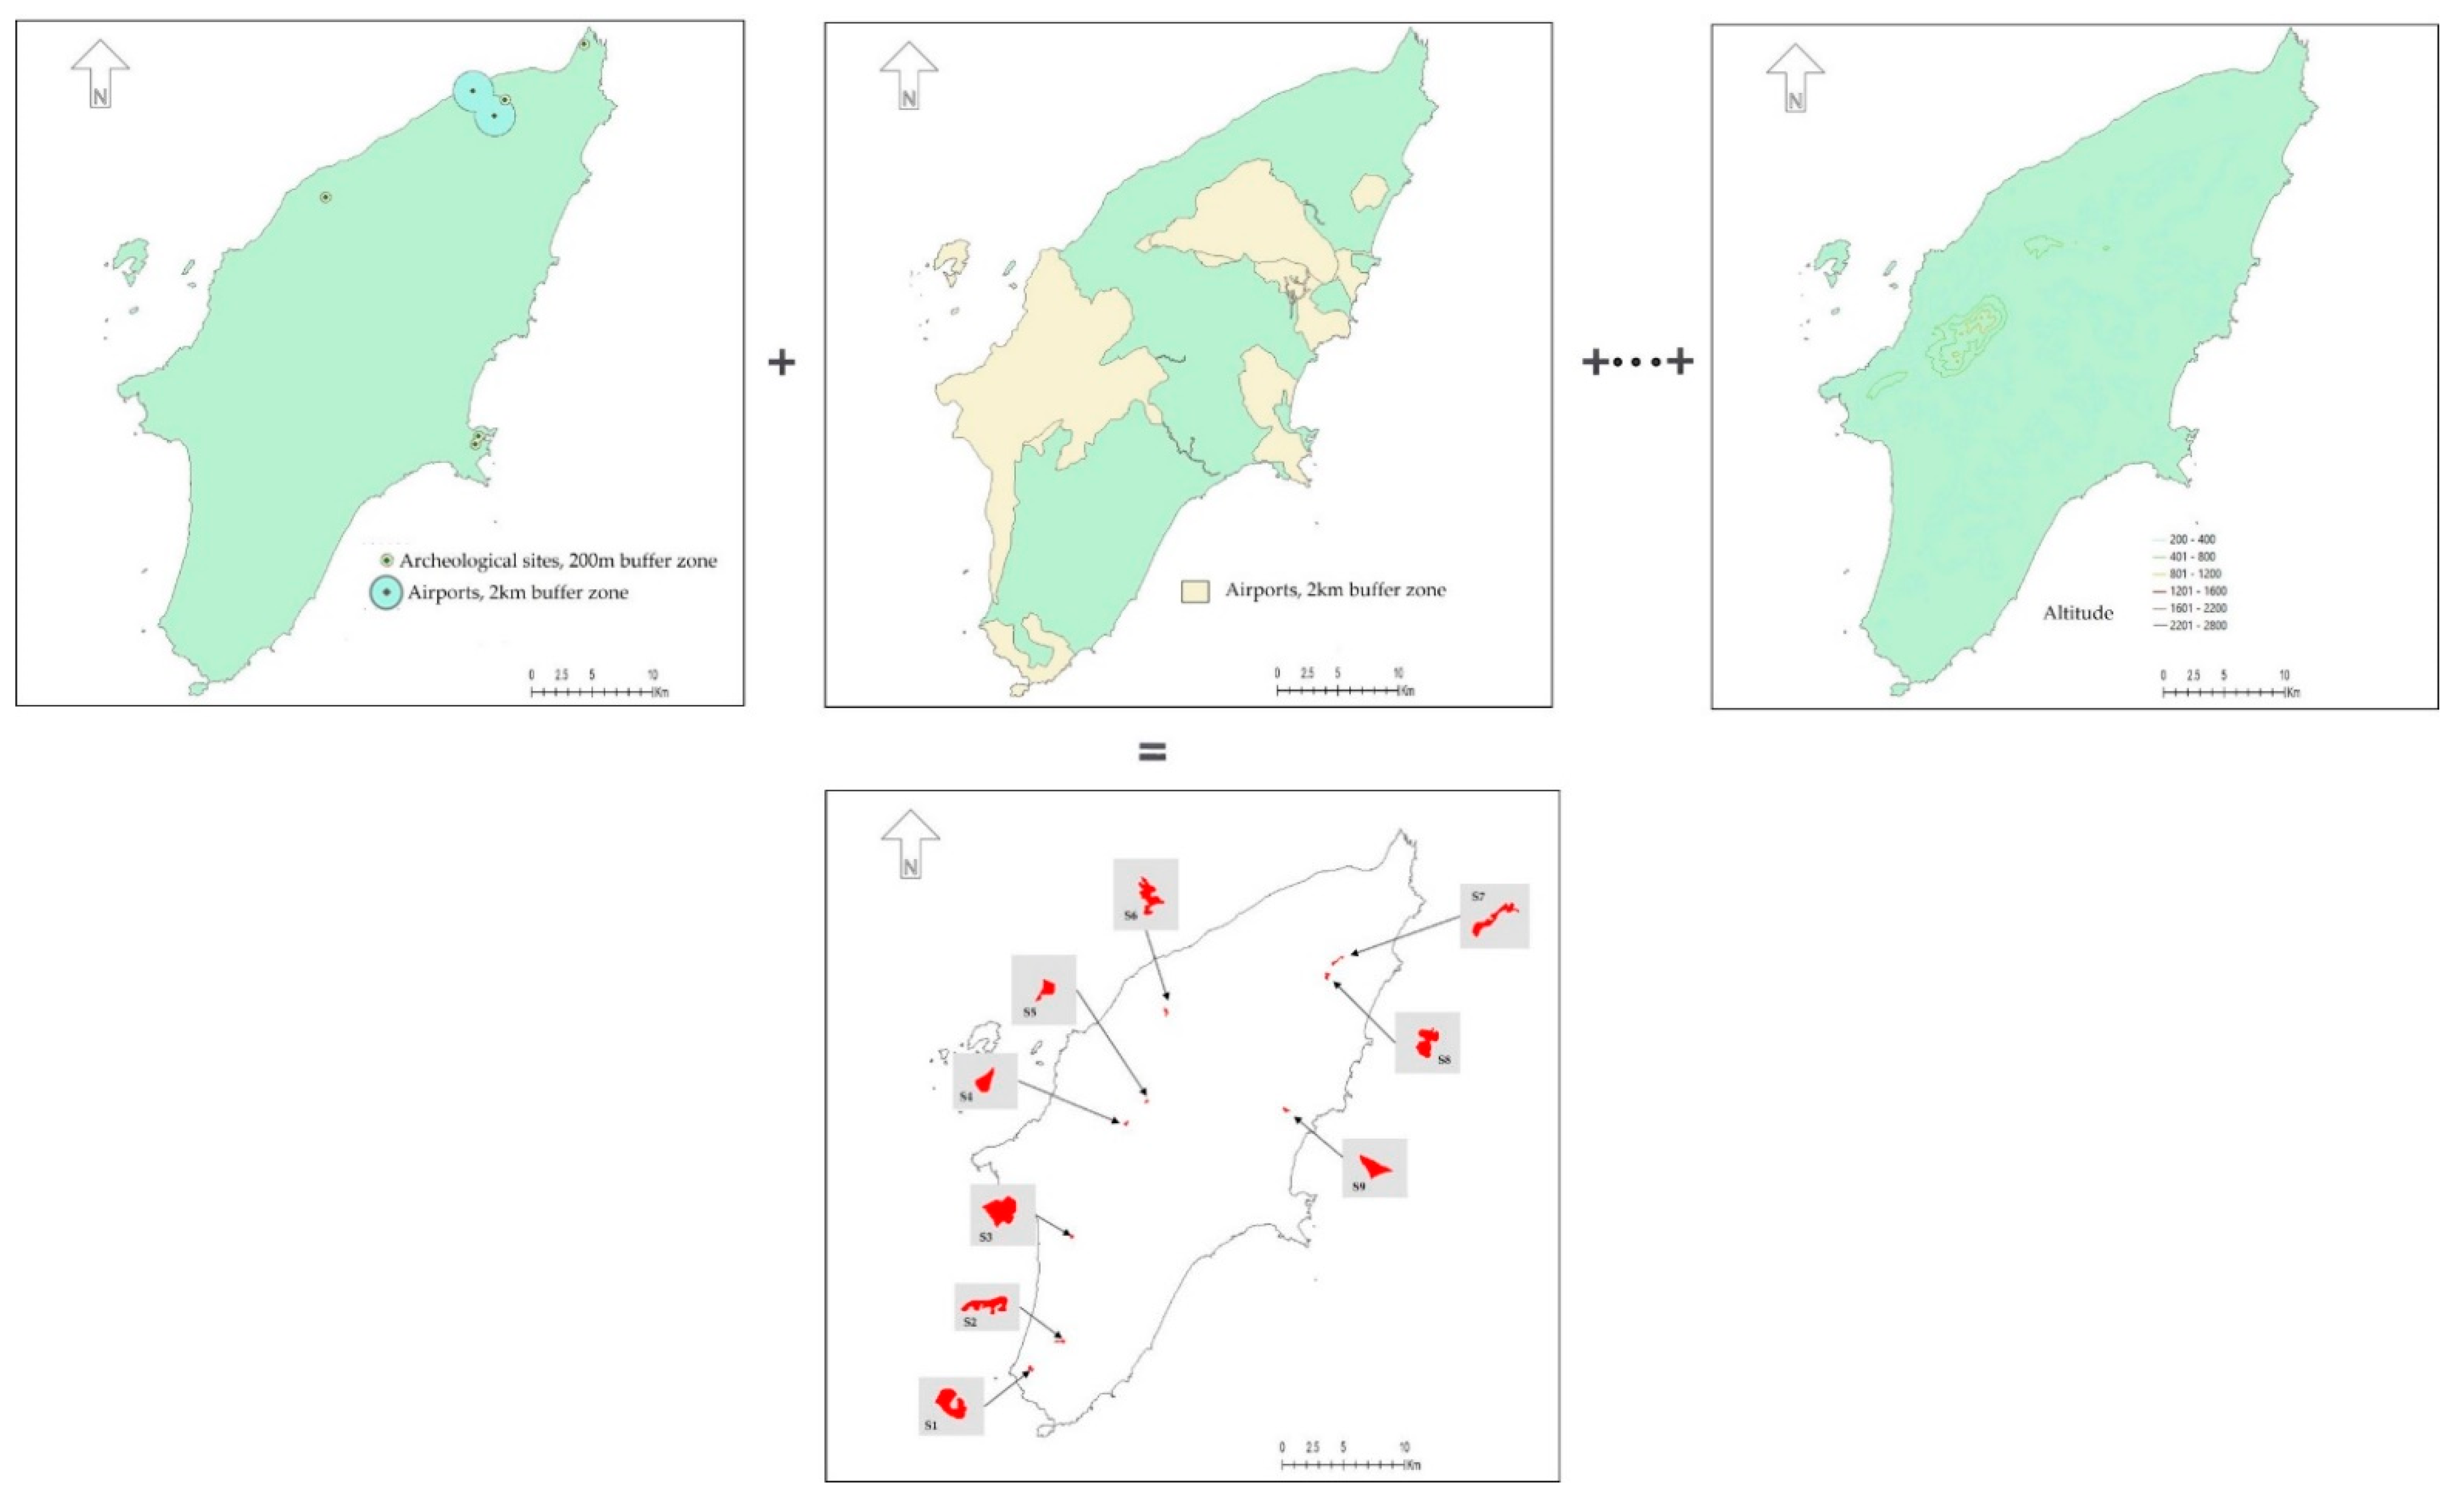
3.2.1. Layers of Restrictions. Obtaining Feasible Sites

In this location problem, the suitable sites were obtained using GIS and by discarding those areas that answer to certain exclusion criteria found either in the Specific Framework for Spatial Planning and Sustainable Development for Renewable Energy Sources (SFSPSD-RES) [33] or in the international literature (Table 1).
Land availability and land uses are a basic part of the site selection process, and the main impact on natural areas and biodiversity is due to land occupied by the power plant itself. The sites of agricultural land of particularly high productivity are excluded from the analysis [33]. Since the current study intends to maintain natural resources and decrease environmental damage, it excluded all Natura 2000 protected areas as well as a buffer zone of 250 m around them [10]. The upper altitude limit for the candidate installation sites was set at 1500 m [34,35] to minimize installation costs and transportation difficulties. The minimum distance from the archeological sites was set at 200 m to avoid visual disturbances and reflections [33]; to avoid reflections, as well as for safety reasons, a minimum distance of 2 km from the airports was set [10]. It is worth noting that in the present work, the criterion of the installation site area limitations was considered. The area required for a solar production facility (farm required area) may influence the relative cost per kW of energy, and the minimum area required for utility-scale farms for continuous solar energy applications is 0.4 km2 (100 acres), as indicated by [6,36]. For the exclusion of either small or very large areas, sites < of 0.40 km2 (100 acres) and > of 2.02 km2 (500 acres) were excluded from the analysis. The installation site area limitations were implemented considering that to produce 1 MW and serve 200 households, an area of 35 acres is required; therefore, the areas with the selected value range will cover much larger energy needs. In addition, the upper limit was selected to minimize the possible adverse impacts of the project on the environment and the communities around it.

3.2.2. Assessment Criteria

The criteria that influence the decision and opt for one site rather than another are defined not only through the study of the literature but also concern data availability for the study area. These criteria include: Distance from Residential Areas (AC1), Distance from Road Network (AC2), Distance from the Existing High-Voltage Electricity Grid (AC3), Solar Radiation (AC4), Installation Site Area Limitations (AC5).

Distance from Residential Areas (AC1)

Considering that the site’s closeness to residential areas significantly reduces construction and power supply costs [11,24,37] and enables for more efficient utilization of existing infrastructure [38], the proximity of the site to the population centers is considered an advantage in this study.

Distance from Road Network (AC2)

Adequate and fully maintained roads are needed to access solar power facilities during both construction and operational phases. Sites close to the existing road network can minimize the cost as well as the environmental impacts associated with constructing new roads. Access to the transportation network reduces operating expenses because proximity to roadways reduces power plant transportation costs [35,39]. The existing road network should be adequate for both the delivery of materials required for the deployment of solar PV plants during the construction phase and the project’s replacement and maintenance during the operational phase. Thus, site accessibility is recognized as an important criterion in the process of PV farm siting in many studies (e.g., [12,40,41]).

Distance from the Existing High-Voltage Electricity Grid (AC3)

An important economic criterion is the proximity of a site to the existing high-voltage electricity grid [42]. The closer a project is to existing power lines, the less expensive it will be to be connected to the grid, and distribution will be accomplished with little loss and reduced transmission costs [28,43]. Solar PV utilities with capacities less than 15 MW require a nearby power line of 35 kV, but solar PV utilities with capacities greater than 15 MW require special high-voltage transmission lines greater than 35 kV.

Solar Radiation (AC4)

The solar potential of the site is considered an important factor in many studies thus far (e.g., [44,45,46]). The size of a solar PV system’s electrical output is determined by the intensity of its radiation. When evaluating solar PV power plant sites, selecting areas with high solar potential contributes significantly to the desired efficiency and economic feasibility of the project.

Installation Site Area Limitation (AC5)

Finally, the size of the candidate installation site was selected as the last evaluation criterion. Larger sites ensure flexibility in terms of the exact installation point depending on the conditions and in terms of the size of the project and the number of systems to be installed.
All necessary data describing the above restrictions were obtained from the sources listed below:
(i)
administrative units, airports, archaeological areas, altitude [47]
(ii)
solar radiation [48]
(iii)
existing high-voltage electricity grid [49]
(iv)
land cover [50]

3.3. Multicriteria Decision Making

MCDM have been successfully used in many different planning processes. Although different MCDM exist, all of them follow several certain steps: problem definition, identification of alternatives, criteria selection, preparation of the decision matrix, and assigning weights to the criteria.

3.3.1. Analytical Hierarchy Process (AHP)

The Analytic Hierarchy Process (AHP) was developed by Prof. Thomas L. Saaty in 1977 [51]. The AHP technique has been widely employed in solving complicated decision-making problems, as well as in various domains for the development and analysis of user preferences across a wide variety of application areas.
The AHP process includes the decomposition of a problem into a hierarchy with a goal at the top of the hierarchy, criterions at the second level of the hierarchy and alternatives (solutions) at the bottom of the hierarchy (third level). In AHP, each component was compared as a binary value at each level of the hierarchy using the pairwise comparison technique, and the relative values were appraised in accordance with the level of significance among themselves to each other, based on a nine-point binary comparison scale that is known as Saaty’s fundamental scale (1–9), where 1 corresponds to ‘equally important’, 3 to ‘slightly more important’, 5 to ‘much more important’, 7 to ‘far more important’ and 9 to ‘extremely more important’. If the relation of importance is reverse, the index rating should also be reversed, i.e., 1/3, 1/5, 1/7, 1/9. The intermediate values of 2, 4, 6 and 8 can also be used in pairwise comparison.
The method includes the following three steps:
Step 1: Create an nxn matrix, where n is the number of comparison elements. The table expresses, through a set of wi/wj reasons, the preference of the decision maker regarding the relative importance of one comparison element over another.
Step 2: Normalize the nxn table by dividing each value by the corresponding sum of the vertical column to which it belongs.
Step 3: Calculate the priority vectors or weights (w) of each comparison item as an average of the normalized values of the corresponding horizontal row.
The preceding stages are carried out at each level of the hierarchy. At the second level, the priority vector (relative weight) displays the hierarchical ranking of criteria and illustrates the degree of contribution of each criterion to the overall goal, while at the third level, the priority vector of decision alternatives on each criterion displays the hierarchical ranking of alternatives for each criterion. For example, if wi, i = 1,…, n is the relative weight (%) of the ith criterion with respect to the goal and wai, a = 1,…, m, i = 1,…, n is the relative weight (%) of the ath alternative with respect to the ith criterion, then the total priority (%) of the ath alternative (TPa) defining the final score of this alternative and, therefore, its final ranking among the rest alternatives, is obtained as follows:
T P a = i n w i w a i ,   a = 1 , , m
Pairwise comparisons involve subjective judgments. In order to assess the validity of the decision, it is necessary to check the consistency of the comparison matrix and the calculation of the consistency index (CI) and the consistency ratio (CR), which assess the inconsistency of the judgments.
The consistency index (CI) is determined by Equation (2):
C I = λ max n n 1
where the value λmax corresponds to the sum of the products of the column of each criterion of the initial matrix (nxn) with the corresponding priority vector and the value n in the number of evaluation criteria. The consistency ratio (CR) is calculated as the ratio of the consistency index (CI) to the random consistency index (RI) (Equation (3)):
C R = C I R I
where RI where is a random consistency index, and its value depends on the size of the matrix (n × n) (Table 2) [52]. The results are correct, reliable, and significant when the consistency ratio (CR) is less than 0.1 (CR ≤ 0.1).

3.3.2. Technique for Order Preference by Similarity to Ideal Solution (TOPSIS)

The TOPSIS method (Technique for Order Preference by Similarity to Ideal Solution) was developed by Hwang Ching-Lai and Yoon in 1981 [53]. The TOPSIS method is based on the concept that in a multicriteria analysis problem, the selected alternative must be as close as possible to the ideally best solution and as far away as possible from the ideally worst solution. Therefore, it considers the distances from both the optimal ideal and negative ideal solution, calculating the relative distance from them. In this way, both the optimal and the negative ideal solutions are identified in the set of evaluation criteria. TOPSIS is a practical and useful method for ranking available alternatives by measuring Euclidean distances and is used several studies in solar energy planning.
The method includes the following steps:
Step 1: Create an initial assessment matrix that includes the numerical values of the alternatives in relation to each assessment criterion.
Step 2: From the original assessment matrix, a new normalized decision matrix is created in order to retrieve all the values of the alternatives in terms of the individual assessment criteria on a common basis and to be able to make the necessary comparisons between them. The normalized rating r i j is calculated as follows (Equation (4)):
r i j = x i j i = 1 m x i j 2
where xij denotes a rating of alternative i to the assessment criterion j.
Step 3: The normalized decision matrix is multiplied by the relative weight of the criterion corresponding to the column, which is calculated using another method of calculating the weight of criteria (for example, AHP). If wj is the weight of criterion j, Equation (5) is performed.
v i j = w j r i j
Step 4: Two hypothetical variables A + και A are defined, which collect the maximum and minimum possible weighted performances of each evaluation criterion, respectively. The distinction between benefit and non-benefit (cost) functions determines the value that the optimal ideal and the negative ideal solution receives.
Step 5: The Euclidean calculation of the distance of each alternative from the optimal ideal ( S i + ) and the negative ideal choice ( S i ) respectively is performed using Equations (6) and (7), respectively. The variable v i j represents the value of ith alternative corresponding to the jth assessment criterion, while V j + and V j , are the optimal ideal and the negative ideal values of the jth criterion, respectively.
S i + = j = 1 n ( v i j V j + ) 2
S i = j = 1 n ( v i j V j ) 2  
where i = 1, 2, 3,…, m.
Step 6: The closeness coefficient of each alternative to the optimal ideal and the negative ideal solution is calculated as follows (Equation (8)):
C i = S i S i + + S i
where i = 1, 2, 3,…, m.
Step 7: The alternatives are ranked in descending order, and those that receive the highest values of the relative proximity measure are ranked in the first places of the ranking.

3.3.3. VIKOR (VIseKriterijumska Optimizacija I Kompromisno Resenje)

The VIKOR method focuses on prioritizing a set of alternatives with conflicting criteria. The solution is determined based on its proximity to an optimal ideal solution. Unlike the TOPSIS method, which considers both the optimal and the negative ideal solution, the VIKOR method focuses only on the positive ideal solution.
The decision table consists of n criteria and m alternatives, with X = f i j   ( A i ) m x n . The method includes the following steps:
Step 1: Determine the best f j * and worst f j performance for each criterion.
For beneficial criteria, Equation (9) is used, while for non-beneficial criteria, Equation (10) is used.
f j * = m a x i f i j ,   f j = m i n i f i j
f j * = m i n i f i j ,   f j = m a x i f i j
Step 2: Determine the utility S i and regret R i measure; i = 1, 2,…, m, according to Equations (11) and (12), where w j is the weight of the jth criterion.
S i = j = 1 n w j ( f j * f i j ) / ( f j * f j )
R i = m a x j [ w j ( f j * f i j ) / ( f j * f j ) ]
Step 3: Calculate the VIKOR index Q i ; i = 1, 2,…, m, from Equation (13).
Q i = v ( S i S * ) / ( S S * ) + ( 1 v ) ( R i R * ) / ( R R * )
where S * = m i n i S i , S = m a x i S i ,   R * = m i n i R i , R = m a x i R i , v can take values from 0 to 1 and expresses the weight of the decision-maker’s strategy. Usually, this variable takes the value 0.5.
Step 4: Rank the alternatives, sorting by the S, R, and Q values, from the minimum to the maximum value and obtain the final ranking. Some researchers use only the list of Q values to rank the alternatives [54].

3.3.4. PROMETHEE II (Preference Ranking Organization METHod for Enrichment of Evaluations)

The PROMETHEE method was developed by Brans in 1982 [55] and further extended by Vincke and Brans in 1985 [56]. Although when compared to other multicriteria analysis methods, it is a very straightforward outranking approach in terms of conception and application [57], its non-appearance and application in the literature of solar PV farm siting problem can be understood by the unfamiliarity of the researchers with the results that this method is capable of providing. In this study, PROMETHEE II (complete ranking) was applied.
Step 1: Create an initial assessment matrix, which includes the numerical values of the alternatives in relation to each assessment criterion.
Step 2: Identify the preference function for each criterion Pj(a,b) for each criterion j. There are six main types of preference forms that are often used [56], which are usual criterion, quasi criterion, linear preference criterion, level criterion, linear preference and indifference area criterion, and Gaussian criterion. The preference function is used to assess how much preference alternative a has over alternative b, and it converts the difference in evaluations of the two alternatives into a preference degree. The value “1” denotes a strong preference for alternative a over alternative b, whereas “0” denotes an indifferent choice between the two alternatives. In many cases, the preference function of the usual criterion is used as it does not add additional parameters, such as the preference and indifference thresholds, required in other types of preference functions.
Step 3: Determine the multicriteria preference index (Equation (14)). The index Π ( a , b ) shows that the degree of a is preferred to b over all the criteria.
Π ( a , b ) = j = 1 k w j P j ( a , b )
where wj is the weights associated with each criterion j, and P j ( a , b ) represents the function of the difference between the evaluations of alternative a regarding alternative b. When Π ( a , b ) is almost equal to 0, a weak preference of a over b is implied, while when Π(a,b) is almost equal to 1, a strong preference of a over b is implied.
Step 4: Calculate direction preference based on the index values of leaving flow and entering flow. For each alternative, the leaving flow value can be calculated using Equation (15), while entering flow value is calculated using Equation (16):
Φ + ( a ) = 1 n 1 b A Π ( a , b )
Φ ( a ) = 1 n 1 b A Π ( b , a )
The alternative with a higher value of Φ + ( a ) and a lower value of Φ ( a )   is the best alternative.
Step 4: Compute net flow value. Net flow is calculated using Equation (17) and defines the alternatives’ complete ranking:
Φ ( a ) = Φ + ( a ) Φ ( a )
Step 5: Sort the alternatives based on net flow (ranking).

4. Results and Discussion

In the following sub-sections the results of the present study are presented and discussed. After identifying the exclusion criteria that determine the appropriate locations of solar PV facilities, the feasible sites that were candidates for further evaluation were presented. Next, the weights of the assessment criteria that influence the location of solar PV facilities were obtained, using the AHP method. The nine feasible sites were ranked using the four different MCDM methods, and the results of each method were presented. Finally, the comparative analysis of all the four MCDM methods was presented and discussed.

4.1. Obtaining Feasible Sites

All the restrictions were defined by thematic layers (Figure 3).

4.2. Assessment Criteria Weighting

To obtain the weights of the criteria that influence the proposed problem, the Analytic Hierarchy Process (AHP) was employed. A matrix of pairwise comparisons was created for the assessment criteria. There is no strict protocol when performing pairwise comparisons or assigning weighting factors between the assessed criteria. It is a subjective process that in most cases depends either on the decision of the researchers or on the expertise of relevant stakeholders and policymakers. In the present study, the pairwise comparisons were performed considering: (i) the author’s expertise and experience in renewable energy site selection processes (e.g., [58,59,60,61,62,63]), (ii) the understanding of the author of the local conditions and constraints of the study area and (iii) the recent literature review.
The total solar radiation incident on a horizontal surface (Global Horizontal Irradiance (GHI)) is generally considered as the assessment criterion with the greatest weighting factor in many studies (e.g., [38,46,64]). However, there are other studies in which a larger weighting is given to other assessment criteria, such as the proximity to the existing power grid [9]. The distance from urban areas criterion received the lowest weight value in several studies [9,38,39].
The pairwise weight matrix for the calculation of the overall weights of the assessment criteria and the priority weights are presented in Table 3. Although the solar radiation (AC4) is considered to be the most important criterion since it determines the energy output of the solar PV park, it was noted (Table 4) that in this study all the feasible sites have exactly the same value on this criterion. Therefore, this criterion does not meet Roy’s postulate of non redundancy in a coherent family of criteria [65] and was rejected.
The reasoning followed by the author for the pairwise comparisons includes the following points: the distance from the existing high-voltage electricity grid (AC3) and the distance from Road Network (AC2) follow are the most important criteria as they determine several costs of the project such as installation and operation costs; the distance from residential areas (AC1) and the installation site area limitations (AC5) are considered last as the potential environmental impacts are very few and the social opposition of this RES technology appears low.

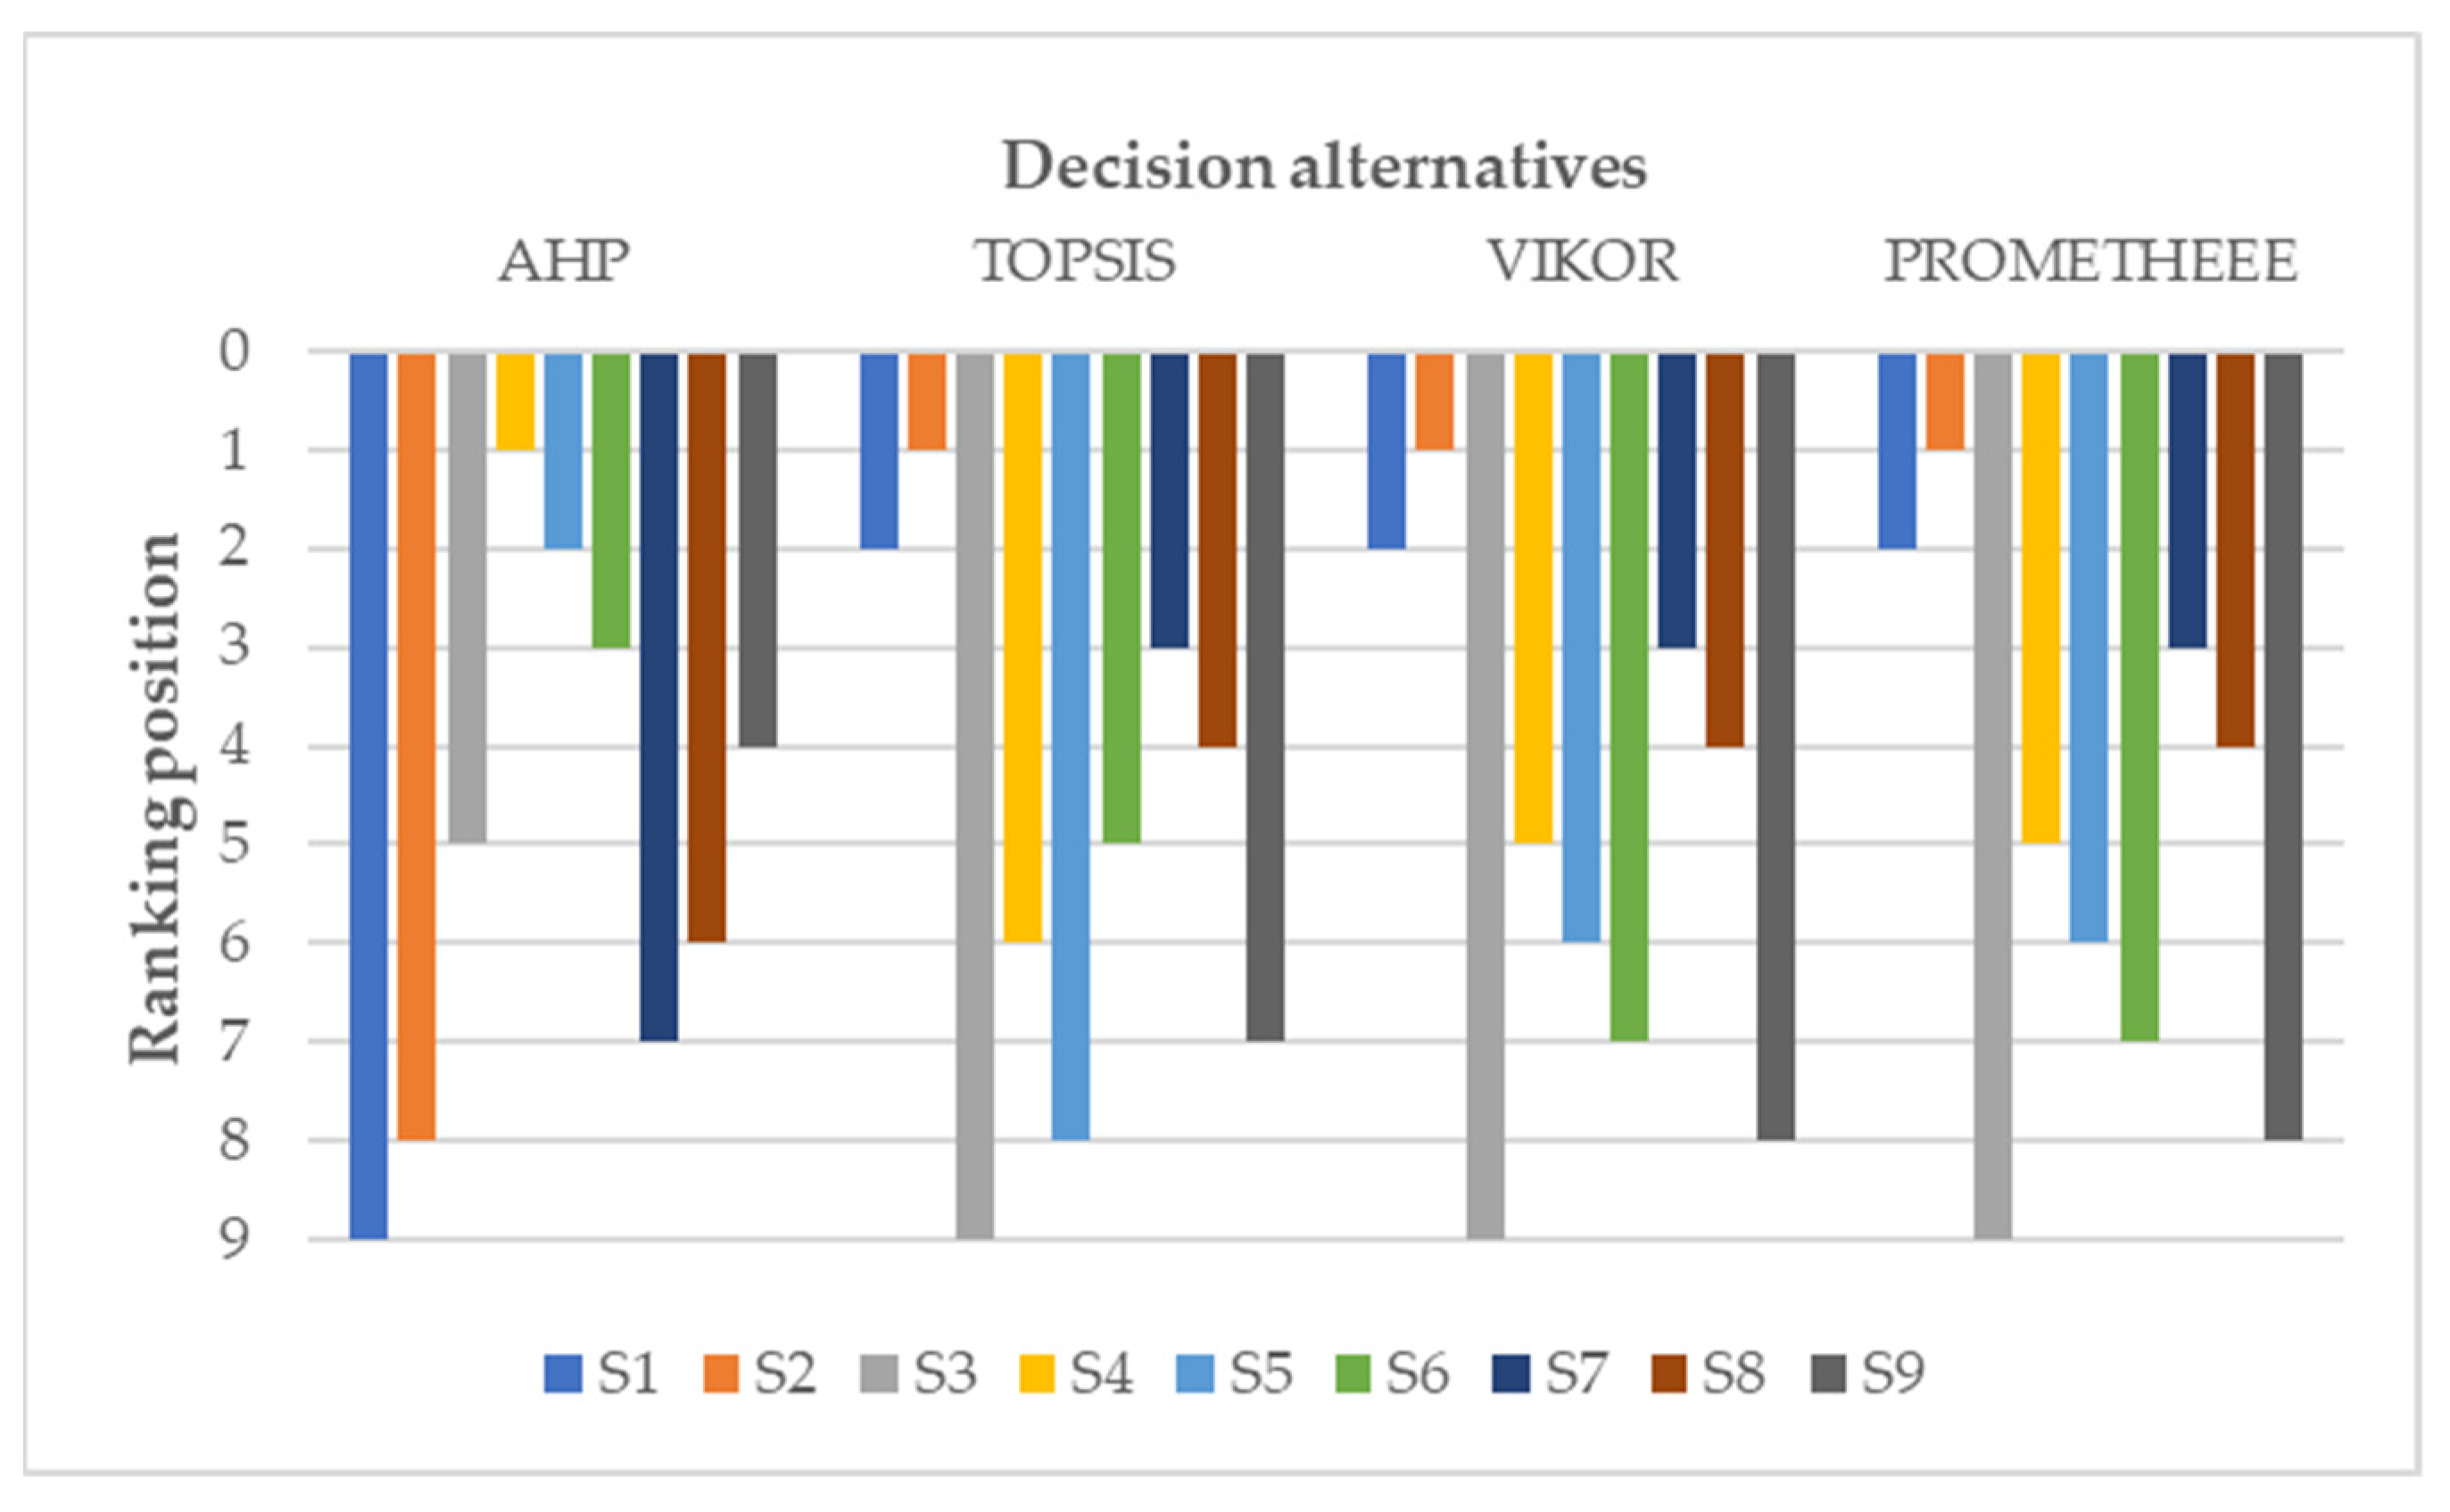
4.3. Ranking the Feasible Sites

Table 4 presents the performance of each alternative (feasible site) in relation to each assessment criterion (AC1–AC5) obtained by GIS, while Table 5 shows the ranging scores for AC1, AC2, AC3, AC5 based on their suitability.
Table 4. Assessment matrix of feasible sites.
S1S2S3S4S5S6S7S8S9
AC1 (km)2~52~51~22~52~51~22~52~51~2
AC2 (km)1~31~3<1<1<1<11~3<1<1
AC3 (km)>10>10<3<3<3<36~103~6<3
AC4 (kWh/m2)1801–19001801–19001801–19001801–19001801–19001801–19001801–19001801–19001801–1900
AC5 (acres)208280120184104252293285194
It should be noted that for the implementation of the TOPSIS and the VIKOR method, the linguistic terms of suitability for AC1, AC2 and AC3 were converted to numerical values, using a four-point scale (1: suitable to 4: extremely suitable), while AC4 was treated as a quantitative criterion. For the PROMETHEE II method, all the four criteria were treated as qualitative ones based on the values of Table 5.

4.3.1. AHP Results

To determine the preferred order for solar PV siting, the nine feasible sites (Figure 3) were reviewed and graded using AHP. For the aforementioned evaluation, the feasible sites presented the decision alternatives (S1~S9), while the priority weights of the assessment criteria AC1, AC2, AC3 and AC5 were also considered. Following the process outlined in Section 3.2.1, the relevant weights of the decision alternatives (S1~S9) with regard to each assessment criterion were quantified by comparing these alternatives pairwise with respect to AC1, AC2, AC3, AC5 (Appendix B). The CR values (Equation (3)) in all cases were below 0.1, which verified the consistency of the pairwise comparisons. The relevant weights of the feasible sites with respect to the assessment criteria are shown in Table 6.
It is noted that S3, S6, S9 represent the less preferable areas in terms of AC1, since in these sites, the distance from residential areas corresponds to the lowest values (1–2 km). As for the assessment criteria AC2 and AC3, the feasible sites S3, S4, S5, S6, S8, and S9 and S3, S4, S5, S6 and S9 were considered the most preferable ones, indicating the highest proximity to the road network and the existing high-voltage electricity grid, respectively.
Combing the relevant weights of the feasible sites with respect to each AC with the priority weights of AC, the feasible areas S1~S9 were evaluated and ranked. The corresponding results are presented in Table 7.

4.3.2. TOPSIS Results

Using Formulas (6) and (7) for the solar PV farm site alternatives, the distance values to the optimal ideal and the negative ideal solutions (Si+ and Si) as well as the Ci values that exhibit the closeness coefficient of each alternative to the optimal ideal and the negative ideal solution for solar PV alternatives are presented in Table 8.
The best alternative must have the closest value to 1; therefore, in this case, it corresponds to alternative site S2. A ranking is obtained between sites as S1, S7, S8, S6, S4, S9, S5, S3.

4.3.3. VIKOR Results

According to the VIKOR approach, the site with the lowest Qi value is favored as a highly favorable location for the installation of a solar PV plant project. The obtained S, R, and Q values are given in Table 9.
The final feasible site ranking was performed according to the lowest value of Q. The results recommended S2 as the best-suited site followed by S1, S7, S8, S4, S5, S6, S9, and S3, respectively. The ordered ranking of different sites is highly significant since it represents the best and worst sites for solar PV plant deployment.

4.3.4. PROMETHEE Results

In this solar PV siting example, the usual preference function was used for all the AC, as they are treated as qualitative criteria [66,67]. This is the simplest of all preference functions, as it has no thresholds and returns a binary result. If the function of the difference between the evaluations of an alternative a regarding an alternative b is ≤0, then the preference function obtains the value zero (0), while if the function of the difference between the evaluations of an alternative a regarding an alternative b is >0, the preference function obtains the value one (1), even if the difference is very small.
Table 10 shows the global preference degrees for each pair of alternatives. Finally, positive, negative, and net flow ratings were computed in order to get a comprehensive ranking of alternatives (Table 11).
The three best solutions, according to the given criteria and their weights, are alternative S2, followed by S1 and then S7, while S6, S9, and S3 obtained the lowest net flow scores, respectively.

4.3.5. Comparative Results of All Methods

Multicriteria decision-making methodologies find a wide application in the problem of solar farm siting. Several methodologies have been employed according to the structure of decision problem and the preferences of decision maker. In this study, four different MCDM methods were applied to highlight the advantages and disadvantages of each method and to demonstrate the benefit of their simultaneous use.
The AHP method does not include complicated and sophisticated mathematic calculations. AHP is considered one of the most suitable MCDM methods for solving energy sector problems [68,69] and is especially applied for the selection of the best place for energy production [70]. AHP allows, through the use of Saaty scales, the standardization of attributes represented by different measurement units. Owing to its simplicity of application and flexibility, AHP can be adapted to the specific requirements of each field of application. AHP technique is well equipped for dealing with criteria of various types, such as quantitative measurable data and qualitative subjective assessments. Another essential advantage of the pairwise comparison in AHP is that the decision-maker deals with the prioritization of only two options under comparison, irrespective of the other options. However, the AHP presents three theoretical weaknesses: the rank reversal problem, the priorities derivation method and the comparison scale [71].
The most important advantage of the TOPSIS method is that the optimal (best) alternative is not only closer to the ideal solution but is also more distant from the ideal negative solution. The computation process is not complex, and the results are obtained easily and can be programmed even into a simple Excel spreadsheet. The method is suitable when the values of alternatives for each criterion do not vary very strongly [69].
VIKOR is considered an updated version of TOPSIS [72] and is described as a method for determining the compromise ranking-list of a set of alternatives considering only the measure of closeness to the ideal solution.
The PROMETHEE method is based on a pairwise comparison of alternatives that are evaluated according to various criteria. These criteria can be either cost or benefit criteria. A preference function is used for each criterion to obtain a preference degree ranging from 0 to 1. This method includes a time-consuming computation process with complicated calculations, but works effectively with qualitative and quantitative information. Due to the difficulties in the computation process, this method is considered to be suitable only for experts.
The use of each method depends on the type of data availability. AHP is preferable when qualitative data are used to describe alternatives as well as when the decision maker is expert in the field under investigation. TOPSIS and VIKOR methods are appropriate when the values of alternatives for each criterion do not vary very strongly, while the PROMETHEE method should be used by experts in order to ensure reliable results.
In this study, the final rankings exhibited both differences and similarities among the MCDM methods (Figure 4). One outstanding result of this study is that the VIKOR and ROMETHEE methods presented the same ranking results. In addition, although the VIKOR method is considered an updated version of the TOPSIS method [72], these two MCDM methods showed the same ranking in five out of nine alternatives (55.55%) (S1, S2, S3, S7, S8). This outcome can be explained by the fact that in the TOPSIS method, the solution is determined based on its proximity both to the optimal ideal solution and the negative ideal solution, while in the VIKOR method the solution is determined only based on its proximity to the optimal ideal solution.
The best alternative rated according to three out of four MCDM methods (TOPSIS, VIKOR and PROMETHEE), is (S2). The second-best alternative in these three methods is (S1), while the worst is (S3). The best alternative rated according to AHP (S4) is in sixth position according to TOPSIS and in fifth position VIKOR and PROMETHEE.
The correlations between the four different MCDM methods were additionally examined, using Kendall’s tau [73]. The correlation values are presented in Table 12 and confirm: (i) the perfect agreement between rankings of VIKOR and PROMETHEE, (ii) a high similarity in rankings between TOPSIS and VIKOR and TOPSIS and PROMETHEE and a low disagreement between rankings of AHP and VIKOR and AHP and PROMETHEE, as well as a moderate disagreement between AHP and TOPSIS.

5. Conclusions

The fundamental aim of this study was to assist in the site selection of solar PV farms to be established in the island of Rhodes, Greece. Geographic Information Systems (GIS) and four multicriteria decision-making methods (AHP, TOPSIS, VIKOR and PROMETHEE) were used to evaluate and hierarchically rank the feasible sites for solar farm siting in Rhodes island, Greece. This is the first suitability research for deployment of solar PV farms in the study area.
Although, the application of MCDM methods for solving complex problems in the renewable energy selection field (e.g., ranking feasible sites, energy technologies, energy projects) according to various aspects and criteria provided a reliable solution approach, every multicriteria method has its advantages and disadvantages and may lead to different results. The comparison of different MCDM in energy planning can be hardly found in the existing literature. To avoid disadvantages and to avail the advantages of the methods, the simultaneous use of several methods would be advantageous.
The paper provides energy policy makers and relevant authorities with a list of feasible sites, with their sizes ranging between 0.42 and 1.19 km2 located in the island of Rhodes (Greece). AHP method recommended S4 (Attavyros) as the most sustainable site, while S2 and S1 (Southern Rhodes) were also favorable sites according to three out of four methods (TOPSIS, VIKOR and PROMETHEE). The top four feasible sites for deploying solar farm in the Rhodes island (Greece) in these three MCDM methods are S2, S1, S7, S8.
The results of this study are in line with two very important results that have been already stated in previous studies [74]: (1) different MCDM techniques may generate different ranks, and (2) there is no the best MCDM technique for all decision problems.
From the author’s point of view, the most suitable options to solve this kind of problems are VIKOR and TOPSIS. AHP method can give reliable results when the number of both criteria and alternatives are quite limited but becomes more complicated as criteria and alternatives increases, as it includes pairwise comparisons. Therefore, the use of pairwise comparison methods is considered appropriate in this study, as the number of alternatives and criteria are quite limited, and this makes the number of comparisons easy to carry out.
The present study offers a potential solution to the complexity of the decision-making process in the renewable energy sector and provides a scientifically validated resource to deploy solar PV farms that are more environmentally friendly, cost effective, and sustainable for decision makers, planners, and investors.
One limitation of the use of MCDM methods in energy siting planning is that they may guide decision-makers to a solution that works best under their jurisdiction. In the current study, the results were built upon author’s expertise and opinion in the assessment criteria weighting. The use of MCDM techniques could be improved by including relevant social criteria or/and by garnering information about social perception of renewable energy sources issues at the individual community level.
Another limitation of this study is the definition of the preference function in the PROMETHEE. The use of different types (e.g., quasi criterion, linear preference criterion, level criterion, linear preference and indifference area criterion, and Gaussian criterion) preference function for one or more AC may lead to different final ranking of the feasible sites.
Regarding future work related to this study, different methods to evaluate AC (e.g., entropy) could be performed. Economic studies could also be considered to enhance the alternatives’ assessment from an economic point of view. In addition, the involvement and participation of local residents could be encouraged, at least in providing weights for the assessment criteria, contributing to the social acceptability of RES projects.

Funding

This research received no external funding.

Institutional Review Board Statement

Not applicable.

Informed Consent Statement

Not applicable.

Data Availability Statement

Not applicable.

Acknowledgments

The author would like to thank George Tzekakis for providing some digital geospatial data of the study area.

Conflicts of Interest

The author declares no conflict of interest.

Appendix A

Table A1 presents relevant information (defined goal, study area, nature and number of assessment criteria and final output or number of alternatives) from selected case studies on solar farm siting.
Table A1. Use of MCDM methods in evaluation of solar farm siting.
MCDMReferencesYear of PublicationAim/ScopeLocationNature and Number of Assessment CriteriaNumber of Alternatives
(Outputfinal Results)
AHP[21]2013suitable site selection for solar farmsKarapinar region, Konya/TurkeyEnvironmental (2), Economic (3)land suitability index map
[22]2015regional assessment of the suitability for wind farm and solar farm developmentsSouth Central England, UKTechnical (2), Visual (2), Ecological (1), Economic (2)wind and solar suitability maps
[10]2016land suitability for the optimal placement of photovoltaic solar power plantsLimassol district, CyprusTechnical (3), Financial (1), Financial/Technical (2), Social (1)suitability index map
[6]2019ideal sites to locate utility-scale wind and solar farmsSongkhla, ThailandPhysiographic (4), Environmental (5), Economical (3)wind and solar suitability maps
[12]2019high priority sustainable siting areas for PV and CSP farmsRegional Unit of Rethymno, GreeceEnvironmental (3), Financia/Technical (6), Social (1) *priority maps for PV and CSP farm siting
[13]2020optimal solar photovoltaic power plant sitesMalatya Province, TurkeyEnvironmental (3), Financial/Technical (6), Social (1) *34 suitable areas for the establishment of solar (PV) power plants
[23]2020site-suitability assessment of solar power plantsWest Kalimantan Province, IndonesiaClimatology (3), topography (3), proximity to location (3)highly suitable areas for the deployment of solar power plants under three approaches
[11]2021suitable sites for the installation of solar and wind farmsIndiaTechnical (4), Socio-Environmental (5), Economic (4)wind and solar farm suitability maps
[14]2021site-suitability for solar farm deploymentDesert of Chihuahua, MexicoEnvironmental (1), Financial/Technical (9) *solar suitability maps
[24]2021optimal sites for solar PV farmsKahramanmaraş, TurkeyGeograply (3), Climate (4), Location (7)solar suitability maps
[15]2021site suitability of solar PVRiyadh region, Saudi ArabiaClimatology (2), Orography (2), Location (3)solar suitability maps
TOPSIS[25]2013avoid flood on solar power plant site selectionThailandClimate (4), Geographical (5), Transportation (4), Environment (3), Cost (3)3 sites
[26]2015optimal sites to implant solar thermoelectric power plantsMurcia region, SpainEnvironmental (1), Origraphy (3), Location (4), Climatology (2)33 alternatives
[17]2016best locations to build solar photovoltaic farmsMurcia region, SpainEnvironmental (1), Origraphy (3), Location (4), Climatology (2)13 municipalities (numerous alternatives)
[18]2018select the most appropriate option for PV power plantinstallationIranSocial and cultural (1), Technological (6), Economic (1), Ecological (1), Political factors (2)4 alternatives
[19]2021development of photovoltaic energy productionIranSocial barriers (3), Technical barriers (5), Economical barriers (9), Political barriers (3), Institutional barriers (3)6 solution alternatives
[27]2021optimal decision-making process in photovoltaic (PV) system location selectionSaudi ArabiaClimate (4), Location (4), Orography (2), Environmental (1)17 cities
VIKOR[20]2019optimal site for solar PV power project developmentPakistanEconomic (4), Environmental (3), Social (3), Location (4), Climate (3), Orography (3)14 cities
* categorization is based on author’s perception.

Appendix B

The Appendix B provides the pairwise comparison matrices of feasible sites (S1~S9) with respect to assessment criteria AC1, AC2, AC3, AC5.
Table A2. Pairwise comparison matrix of feasible sites (S1~S9) with respect to AC1.
S1S2S3S4S5S6S7S8S9
S1114113113
S2114123113
S31/41/411/31/311/31/31
S4113113113
S511/23113113
S61/31/311/31/311/31/31
S7113113113
S8113113113
S91/31/311/31/311/31/31
Table A3. Pairwise comparison matrix of feasible sites (S1~S9) with respect to AC2.
S1S2S3S4S5S6S7S8S9
S1111/21/31/31/311/31/3
S2111/31/21/31/311/21/2
S3231111311
S4321111311
S5331111311
S6331111311
S7111/31/31/31/311/31/3
S8321111311
S9321111311
Table A4. Pairwise comparison matrix of feasible sites (S1~S9) with respect to AC3.
S1S2S3S4S5S6S7S8S9
S1111/61/71/71/71/31/51/7
S2111/71/71/71/71/31/51/6
S3671111531
S4771111531
S5771111531
S6771111531
S7331/51/51/51/511/31/5
S8551/31/31/31/3311/3
S9761111531
Table A5. Pairwise comparison matrix of feasible sites (S1~S9) with respect to AC5.
S1S2S3S4S5S6S7S8S9
S111/551511/61/51
S2519595115
S31/51/911/511/51/91/91/5
S411/551511/61/51
S51/51/911/511/51/91/91/5
S611/551511/51/51
S7619695115
S8519595115
S911/551511/51/51

References

  1. EUROSTAT. Available online: https://ec.europa.eu/eurostat/statistics-explained/index.php?title=Electrical_capacity_for_wind_and_solar_photovoltaic_power_-_statistics#Electricity_production_capacity_from_solar_energy_:_photovoltaic_was_the_most_important_technology (accessed on 19 October 2021).
  2. International Energy Agency (IEA). Available online: https://www.iea.org/reports/renewables-2020 (accessed on 19 October 2021).
  3. Hellenic Association of Photovoltaic Companies (HELAPCO). Available online: https://helapco.gr/pdf/Greek_PV_Market_Opportunities_Aug2019.pdf (accessed on 19 October 2021).
  4. International Renewable Energy Agency (IRENA). Available online: https://www.irena.org/solar (accessed on 19 October 2021).
  5. Bravo, J.D.; Casals, X.G.; Pascua, I.P. GIS approach to the definition of capacity and generation ceilings of renewable energy technologies. Energy Policy 2007, 35, 4879–4892. [Google Scholar] [CrossRef]
  6. Ali, S.; Taweekun, J.; Techato, K.; Waewsak, J.; Gyawali, S. GIS based site suitability assessment for wind and solar farms in Songkhla, Thailand. Renew. Energy 2019, 132, 1360–1372. [Google Scholar] [CrossRef]
  7. Munkhbat, U.; Choi, Y. GIS-based site suitability analysis for solar power systems in Mongolia. Appl. Sci. 2021, 11, 3748. [Google Scholar] [CrossRef]
  8. Rigo, P.D.; Rediske, G.; Rosa, C.B.; Gastaldo, N.G.; Michels, L.; Neuenfeldt Júnior, A.L.; Siluk, J.C.M. Renewable energy problems: Exploring the methods to support the decision-making process. Sustainability 2020, 12, 10195. [Google Scholar] [CrossRef]
  9. Sánchez-Lozano, J.M.; Teruel-Solano, J.; Soto-Elvira, P.L.; Socorro García-Cascales, M. Geographical information systems and multi-Criteria decision making methods for the evaluation of solar farms locations: Case study in south-eastern Spain. Renew. Sustain. Energy Rev. 2013, 24, 544–556. [Google Scholar] [CrossRef]
  10. Georgiou, A.; Skarlatos, D. Optimal site selection for sitting a solar park using multi-criteria decision analysis and geographical information systems. Geosci. Instrum. Method Data Syst. 2016, 5, 321–332. [Google Scholar] [CrossRef] [Green Version]
  11. Saraswat, S.; Digalwar, A.K.; Yadav, S.; Kumar, G. MCDM and GIS based modelling technique for assessment of solar and wind farm locations in India. Renew. Energy 2021, 169, 865–884. [Google Scholar] [CrossRef]
  12. Giamalaki, M.; Tsoutsos, T. Sustainable siting of solar power installations in Mediterranean using a GIS/AHP approach. Renew. Energy 2019, 141, 64–75. [Google Scholar] [CrossRef]
  13. Colak, H.E.; Memisoglu, T.; Gercek, Y. Optimal site selection for solar photovoltaic (PV) power plants using GIS and AHP: A case study of Malatya Province, Turkey. Renew. Energy 2020, 149, 565–576. [Google Scholar] [CrossRef]
  14. Prieto-Amparán, J.A.; Pinedo-Alvarez, A.; Morales-Nieto, C.R.; Valles-Aragón, M.C.; Álvarez-Holguín, A.; Villarreal-Guerrero, F. A regional GIS-assisted multi-criteria evaluation of site-suitability for the development of solar farms. Land 2021, 10, 217. [Google Scholar] [CrossRef]
  15. Albraheem, L.; Alabdulkarim, L. Geospatial analysis of solar energy in riyadh using a GIS-AHP-based technique. ISPRS Int. J. Geo-Inf. 2021, 10, 291. [Google Scholar] [CrossRef]
  16. Doukas, H.; Karakosta, C.; Psarras, J. Computing with words to assess the sustainability of renewable energy options. Expert Syst. Appl. 2010, 37, 5491–5497. [Google Scholar] [CrossRef]
  17. Sánchez-Lozano, J.M.; García-Cascales, M.S.; Lamata, M.T. Comparative TOPSIS-ELECTRE TRI methods for optimal sites for photovoltaic solar farms. Case study in Spain. J. Clean. Prod. 2016, 127, 387–398. [Google Scholar] [CrossRef]
  18. Alhuyi Nazari, M.; Aslani, A.; Ghasempour, R. Analysis of Solar Farm Site Selection Based on TOPSIS Approach. Int. J. Soc. Ecol. Sustain. Dev. 2018, 9, 12–25. [Google Scholar] [CrossRef]
  19. Ali Sadat, S.; Vakilalroaya Fini, M.; Hashemi-Dezaki, H.; Nazififard, M. Barrier analysis of solar PV energy development in the context of Iran using fuzzy AHP-TOPSIS method. Sustain. Energy Technol. Assess. 2021, 47, 101549. [Google Scholar] [CrossRef]
  20. Solangi, Y.A.; Shah, S.A.A.; Zameer, H.; Ikram, M.; Saracoglu, B.O. Assessing the solar PV power project site selection in Pakistan: Based on AHP-fuzzy VIKOR approach. Environ. Sci. Pollut. Res. 2019, 26, 30286–30302. [Google Scholar] [CrossRef]
  21. Uyan, M. GIS-based solar farms site selection using analytic hierarchy process (AHP) in Karapinar region, Konya/Turkey. Renew. Sustain. Energy Rev. 2013, 28, 11–17. [Google Scholar] [CrossRef]
  22. Watson, J.; Malcolm, D.H. Regional Scale wind farm and solar farm suitability assessment using GIS-assisted multi-criteria evaluation. Landsc. Urban Plan. 2015, 138, 20–31. [Google Scholar] [CrossRef]
  23. Ruiz, H.; Sunarso, A.; Ibrahim-Bathis, K.; Murti, S.; Budiarto, I. GIS-AHP multi criteria decision analysis for the optimal location of solar energy plants at Indonesia. Energy Rep. 2020, 6, 3249–3263. [Google Scholar] [CrossRef]
  24. Günen, M.A. A comprehensive framework based on GIS-AHP for the installation of solar PV farms in Kahramanmaraş, Turkey. Renew. Energy 2021, 178, 212–225. [Google Scholar] [CrossRef]
  25. Kengpol, A.; Rontlaong, P.; Tuominen, M. A decision support system for selection of solar power plant locations by applying fuzzy AHP and TOPSIS: An empirical study. J. Softw. Eng. Appl. 2013, 6, 470–481. [Google Scholar] [CrossRef] [Green Version]
  26. Sánchez-Lozano, J.M.; García-Cascales, M.S.; Lamata, M.T. Evaluation of suitable locations for the installation of solar thermoelectric power plant. Comput. Ind. Eng. 2015, 87, 343–355. [Google Scholar] [CrossRef]
  27. Al-Shammari, S.; Ko, W.; Al Ammar, E.A.; Alotaibi, M.A.; Choi, H.-J. Optimal decision-making in photovoltaic system selection in Saudi Arabia. Energies 2021, 14, 357. [Google Scholar] [CrossRef]
  28. Charabi, Y.; Gastli, A. PV site suitability analysis using GIS-based spatial fuzzy multi-criteria evaluation. Renew. Energy 2011, 36, 2554–2561. [Google Scholar] [CrossRef]
  29. Chen, C.R.; Huang, C.C.; Tsuei, H.J. A Hybrid MCDM Model for Improving GIS-Based Solar Farms Site Selection. Int. J. Photoenergy 2014, 2014, 925370. [Google Scholar] [CrossRef] [Green Version]
  30. Amjad, F.; Ali Shah, L. Identification and assessment of sites for solar farms development using GIS and density based clustering technique- A case of Pakistan. Renew. Energy 2020, 155, 761–769. [Google Scholar] [CrossRef]
  31. Hinestroza-Olascuaga, L.M.; Carvalho, P.M.S.; Cardoso de Jesus, C.M.S. Using a Multi-Criteria Model to Assess the Suitability of Potential Sites to Implement Off-Grid Solar PV Projects in South America. Sustainability 2021, 13, 7546. [Google Scholar] [CrossRef]
  32. Google Earth. Available online: https://earth.google.com/ (accessed on 20 October 2021).
  33. Ministry of Environment, Energy and Climate Change (MEECC). Specific Framework for Spatial Planning and Sustainable Development for Renewable Energy Sources; JMD 49828/2008, OGHE B′ 2464/3-12-08; MEECC: Athens, Greece, 2008.
  34. Kereush, D.; Perovych, I. Determining criteria for optimal site selection for solar power plants. Geomat. Landmanag. Landsc. 2017, 4, 39–54. [Google Scholar] [CrossRef]
  35. Yousefi, H.; Hafeznia, H.; Yousefi-Sahzabi, A. Spatial site selection for solar power plants using a GIS-based boolean-fuzzy logic model: A case study of Markazi province, Iran. Energies 2018, 11, 1648. [Google Scholar] [CrossRef] [Green Version]
  36. Anwarzai, M.A.; Nagasaka, K. Utility-scale implementable potential of wind and solar energies for Afghanistan using GIS multi-criteria decision analysis. Renew. Sustain. Energy Rev. 2017, 71, 150–160. [Google Scholar] [CrossRef]
  37. Sánchez-Lozano, J.M.; Antunes, C.H.; García-Cascales, M.S.; Dias, L.C. GIS-based photovoltaic solar farms site selection using ELECTRE-TRI: Evaluating the case for Torre Pacheco, Murcia, Southeast of Spain. Renew. Energy 2014, 66, 478–494. [Google Scholar] [CrossRef]
  38. Al Garni, H.Z.; Awasthi, A. Solar PV power plant site selection using a GIS-AHP based approach with application in Saudi Arabia. Appl. Energy 2017, 206, 1225–1240. [Google Scholar] [CrossRef]
  39. Zoghi, M.; Ehsani, A.H.; Sadat, M.; Javad Amiri, M.; Karimi, S. Optimization solar site selection by fuzzy logic model and weighted linear combination method in arid and semi-arid region: A case study Isfahan-IRAN. Renew. Sustain. Energy Rev. 2015, 68, 986–996. [Google Scholar] [CrossRef]
  40. Fang, H.; Li, J.; Song, W. Sustainable site selection for photovoltaic power plant: An integrated approach based on prospect theory. Energy Convers. Manag. 2018, 174, 755–768. [Google Scholar] [CrossRef]
  41. Merrouni, A.A.; Elalaoui, E.F.; Mezrhab, A. Large scale PV sites selection by combining GIS and analytical hierarchy process, case study: Eastern Morocco. Renew. Energy 2018, 119, 863–873. [Google Scholar] [CrossRef]
  42. Effat, H.A. Selection of potential sites for solar energy farms in Ismailia governorate, Egypt using SRTM and multicriteria analysis. Int. J. Adv. Remote Sens. GIS 2013, 2, 205–220. [Google Scholar]
  43. Castillo, C.P.; Batista e Silva, F.; Lavalle, C. An assessment of the regional potential for solar power generation in EU-28. Energy Policy 2016, 88, 86–99. [Google Scholar] [CrossRef]
  44. Majumdar, D.; Pasqualetti, M.J. Analysis of land availability for utility-scale power plants and assessment of solar photovoltaic development in the state of Arizona, USA. Renew. Energy 2019, 134, 1213–1231. [Google Scholar] [CrossRef]
  45. Aly, A.; Jensen, S.S.; Pedersen, A.B. Solar power potential of Tanzania: Identifying CSP and PV hot spots through a GIS multicriteria decision making analysis. Renew. Energy 2017, 113, 159–175. [Google Scholar] [CrossRef]
  46. Doorga, J.R.S.; Rughooputh, S.D.D.V.; Boojhawon, R. Multi-criteria GIS-based modelling technique for identifying potential solar farm sites: A case study in Mauritius. Renew. Energy 2019, 133, 1201–1219. [Google Scholar] [CrossRef]
  47. Open Geospatial Data and Services for Greece. Available online: http://geodata.gov.gr/ (accessed on 2 September 2021).
  48. Nikitidou, E.; Kazantzidis, A.; Tzoumanikas, P.; Salamalikis, V.; Bais, A.F. Retrieval of surface solar irradiance, based on satellite-derived cloud in-formation, in Greece. Renew. Energy 2015, 90, 776–783. [Google Scholar] [CrossRef]
  49. Independent Power Transmission Generation. Available online: https://www.admie.gr/en/grid/description/lines-map (accessed on 2 September 2021).
  50. Corine Land Cover 2018. Available online: http://mapsportal.ypen.gr/layers/geonode:gr_clc2018 (accessed on 2 September 2021).
  51. Saaty, R.W. The analytic hierarchy process—What it is and how it is used. Math. Modell. 1987, 9, 161–176. [Google Scholar] [CrossRef] [Green Version]
  52. Saaty, T.L. The analytic hierarchy and analytic network processes for the measurement of intangible criteria and for decision-making. In Multiple Criteria Decision Analysis: State of the Art Surveys; José, F., Salvatore, G., Matthias, E., Eds.; Springer: New York, NY, USA, 2005; pp. 345–405. [Google Scholar]
  53. Hwang, C.L.; Yoon, K. Methods for multiple attribute decision making. In Multiple Attribute Decision Making: Lecture Notes in Economics and Mathematical Systems, 1st ed.; Springer: Berlin/Heidelberg, Germany, 1981; Volume 186, pp. 58–191. [Google Scholar] [CrossRef]
  54. Shekhovtsov, A.; Kozlov, V.; Nosov, V.; Sałabun, W. Efficiency of methods for determining the relevance of criteria in sustainable transport problems: A comparative case study. Sustainability 2020, 12, 7915. [Google Scholar] [CrossRef]
  55. Brans, J.P. L’ingénièrie de la decision. Elaboration d’instruments d’aide à la décision. La méthode PROMETHEE. In l’Aide à la Décision: Nature, Instruments et Perspectives d’Avenir; Nadeau, R., Landry, M., Eds.; Presses de l’Université Laval: Ville de Québec, QC, Canada, 1982; pp. 183–213. [Google Scholar]
  56. Vincke, J.P.; Brans, P. A preference ranking organization method. The PROMETHEE method for MCDM. Manag. Sci. 1985, 31, 641–656. [Google Scholar] [CrossRef] [Green Version]
  57. Brans, J.P.; Vincke, P.; Mareschal, B. How to select and how to rank projects: The PROMETHEE method. Eur. J. Oper. Res. 1986, 24, 228–238. [Google Scholar] [CrossRef]
  58. Vagiona, D.; Karanikolas, N. A multicriteria approach to evaluate offshore wind farms siting in Greece. Glob. Nest. J. 2012, 14, 235–243. [Google Scholar] [CrossRef]
  59. Vasileiou, Μ.; Loukogeorgaki, Ε.; Vagiona, D. GIS-based multi-criteria decision analysis for site selection of hybrid offshore wind and wave energy systems in Greece. Renew. Sust. Energy Rev. 2017, 73, 745–757. [Google Scholar] [CrossRef]
  60. Vagiona, D.G.; Kamilakis, M. Sustainable site selection for offshore wind farms in the South Aegean—Greece. Sustainability 2018, 10, 749. [Google Scholar] [CrossRef] [Green Version]
  61. Bili, A.; Vagiona, D. Use of multicriteria analysis and GIS for selecting sites for onshore wind farms: The case of Andros island (Greece). Eur. J. Environ. Sci. 2018, 8, 5–13. [Google Scholar] [CrossRef]
  62. Bily, A.; Vagiona, D. Site selection of hybrid solar/wind renewable energy systems: A case study from Andros, Greece. In Proceedings of the 16th International Conference on Environmental Science and Technology (CEST 2019), Rhodes Island, Greece, 4–7 September 2019. [Google Scholar]
  63. Spyridonidou, S.; Sismani, G.; Loukogeorgaki, E.; Vagiona, D.G.; Ulanovsky, H.; Madar, D. Sustainable Spatial Energy Planning of Large-Scale Wind and PV Farms in Israel: A Collaborative and Participatory Planning Approach. Energies 2021, 14, 551. [Google Scholar] [CrossRef]
  64. Doljak, D.; Stanojević, G. Evaluation of natural conditions for site selection of ground-mounted photovoltaic power plants in Serbia. Energy 2017, 127, 291–300. [Google Scholar] [CrossRef] [Green Version]
  65. Roy, B. Decision-Aiding Today: What Should We Expect? In Multicriteria Decision Making: Advances in MCDM Models, Algorithms, Theory, and Applications; Gal, T., Stewart, T.J., Hanne, T., Eds.; International Series in Operations Research & Management Science; Springer: Boston, MA, USA, 1999; pp. 1–35. ISBN 978-1-4613-7283-7. [Google Scholar]
  66. Deshmukh, S.C. Preference ranking organization method of enrichment evaluation (Promethee). Int. J. Eng. Sci. Invent. 2013, 2, 28–34. [Google Scholar]
  67. Ziemba, P. Multi-criteria stochastic selection of electric vehicles for the sustainable development of local government and state administration units in Poland. Energies 2020, 13, 6299. [Google Scholar] [CrossRef]
  68. Kaya, I.; Çolak, M.; Terzi, F. Use of MCDM techniques for energy policy and decision-making problems: A review. Int. J. Energy Res. 2018, 42, 2344–2372. [Google Scholar] [CrossRef]
  69. Siksnelyte-Butkiene, I.; Zavadskas, E.K.; Streimikiene, D. Multi-Criteria Decision-Making (MCDM) for the Assessment of Renewable Energy Technologies in a Household: A Review. Energies 2020, 13, 1164. [Google Scholar] [CrossRef] [Green Version]
  70. Siksnelyte, I.; Zavadskas, E.K.; Streimikiene, D.; Sharma, D. An overview of multi-criteria decision-making methods in dealing with sustainable energy development issues. Energies 2018, 11, 2754. [Google Scholar] [CrossRef] [Green Version]
  71. Ishizaka, A.; Lusti, M. How to derive priorities in AHP: A comparative study. Cent. Eur. J. Oper. Res. 2006, 14, 387–400. [Google Scholar] [CrossRef] [Green Version]
  72. Kumar, A.; Sah, B.; Singh, A.R.; Deng, Y.; He, X.; Kumar, P.; Bansal, R.C. A review of multi criteria decision making (MCDM) towards sustainable renewable energy development. Renew. Sustain. Energy Rev. 2017, 69, 596–609. [Google Scholar] [CrossRef]
  73. Ziemba, P. Multi-criteria group assessment of E-commerce websites based on the new PROSA GDSS method–The case of Poland. IEEE Access 2021, 9, 126595–126609. [Google Scholar] [CrossRef]
  74. Mousavi-Nasab, S.H.; Sotoudeh-Anvari, A. An extension of best-worst method with D numbers: Application in evaluation of renewable energy resources. Sustain. Energy Technol. Assess. 2020, 40, 100771. [Google Scholar] [CrossRef]
Figure 1. Methodological framework.
Energies 14 08371 g001
Figure 2. The study area [32].
Energies 14 08371 g002
Figure 3. Indicative thematic maps of restriction criteria and feasible sites.
Energies 14 08371 g003
Figure 4. Ranking of decision alternatives.
Energies 14 08371 g004
Table 1. Legal restrictions.
N.Denomination of the Restrictions
EC1Land cover
EC2Distance from protected areas
EC3Altitude
EC4Distance from airports
EC5Distance from archaeological areas
EC6Installation site area limitations
Table 2. Random index (RI) values.
n12345678910
RI0.000.000.580.901.121.241.321.411.451.49
Table 3. Pairwise comparisons of assessment criteria.
AC1AC2AC3AC5Priority Weight
AC111/51/510.083
AC251150.417
AC351150.417
AC511/51/510.083
Table 5. Ranging scores for assessment criteria.
CriterionMeasurementClassValue
AC1 (km)<1suitable1
1~2moderate suitable2
2~5high suitable3
>5extremely suitable4
AC2 (km)<1extremely suitable4
1~3high suitable3
3~5moderate suitable2
>5suitable1
AC3 (km)<3extremely suitable4
3~6high suitable3
6~10moderate suitable2
>10suitable1
AC5 (acres)100~180suitable1
180~260moderate suitable2
260~320high suitable3
320~500extremely suitable4
Table 6. Relevant weights of feasible sites with respect to AC.
AC1AC2AC3AC5
S10.1460.0510.0220.061
S20.1600.0560.0220.236
S30.0440.1390.1670.018
S40.1410.1390.1690.061
S50.1320.1450.1690.018
S60.0470.1450.1690.062
S70.1410.0480.0400.247
S80.1410.1390.0750.236
S90.0470.1390.1670.062
Table 7. Overall prioritization of solar PV siting.
Feasible SitePreference Percentage (%)Ranking
S14.75%9
S26.54%8
S313.27%5
S414.51%1
S514.35%2
S614.00%3
S76.92%7
S812.04%6
S913.63%4
Table 8. Si+, Si, and Ci values.
Feasible SiteSi+SiCi
S10.0110.1350.927
S20.0020.1360.988
S30.1360.0020.014
S40.1340.0140.096
S50.1360.0100.070
S60.1340.0180.121
S70.0430.0970.694
S80.0930.0490.346
S90.1350.0110.077
Table 9. S, R, and Q values.
Feasible SiteSiRiQi
S10.0370.0370.055
S20.0060.0060.000
S30.9930.4171.000
S40.8810.4170.944
S50.9170.4170.961
S60.9350.4170.971
S70.1390.1390.229
S80.6980.4170.851
S90.9600.4170.983
Table 10. Global preference degree of feasible sites.
S1S2S3S4S5S6S7S8S9
S1 0.0001.0000.8330.9170.9170.4170.8330.917
S20.083 1.0000.9170.9171.0000.4170.8331.000
S30.0000.000 0.0000.0000.0000.0000.0000.000
S40.0000.0000.167 0.0830.0830.0000.0000.083
S50.0000.0000.0830.000 0.0830.0000.0000.083
S60.0000.0000.0830.0000.083 0.0000.0000.000
S70.0830.0001.0000.9170.9171.000 0.8331.000
S80.0830.0000.1670.5000.5000.5830.000 0.583
S90.0000.0000.0830.0000.0830.0000.0000.000
Table 11. Positive, negative, and net flow scores.
Φ+ΦΦ(α)
S10.7290.0310.698
S20.7710.0000.771
S30.0000.448−0.448
S40.0520.396−0.344
S50.0310.438−0.406
S60.0210.458−0.438
S70.7190.1040.615
S80.3020.313−0.010
S90.0210.458−0.438
Table 12. Kendall’s tau correlations between MCDM methods.
TOPSISVIKORPROMETHEEE
AHP−0.56−0.39−0.39
TOPSIS 0.830.83
VIKOR 1.00
Publisher’s Note: MDPI stays neutral with regard to jurisdictional claims in published maps and institutional affiliations.

