1. Introduction
Tight gas reservoirs have played a dominating role in the recent unconventional hydrocarbon boom. With the advancement in the development of multi-fractured horizontal wells, such resources could be effectively developed. However, hydrocarbon production from tight reservoirs is challenging primarily due to the low-permeability ranges. While considering fractured tight gas reservoirs, analyzing the effects of stress-sensitivity, heterogeneity, and the fluid flow between the matrix to fracture are essential. Furthermore, induced formation damage further restricts fluid flow over time. Hence, well productivity is a critical parameter that influences the lifecycle of a well and optimization techniques for production.
The inflow performance relationship or IPR is one of the fundamental relations that exists to evaluate well performance [
1,
2]. Over the decades, there have been significant advancements in IPR modeling for horizontal wells [
3,
4,
5,
6,
7,
8]. Some investigations have also incorporated the effect of non-Darcy flow [
9,
10] due to the presence of natural fractures and identified ways to address additional discrepancies concerning the type of flow within the reservoir and methodologies to accurately capture the flow regimes. Recent advancements in productivity modeling and well performance evaluation have also assisted in better understanding and analyzing the expected flow behavior within the reservoir [
11,
12,
13,
14,
15,
16].
This comprehensive investigation analyzes the multi-segment horizontal well approach to developing the local skin factors for each horizontal well segment. The approach was to obtain the equivalent skin factor of the segmented horizontal well in a tight gas reservoir by equating the total production from the entire horizontal well to the sum of the flow from individual segmented damaged zones along the well length. The flow rate into a volume segment of a porous media does not match the flow rate of that element during the unsteady-flow condition. In other words, the fluid content of the porous medium is dynamic and changes with time. The combination of continuity, Darcy’s, and compressibility equations along with the initial and boundary conditions results in Equation (1)
This general partial differential equation describes the radial flow in all directions in a porous media [
17]. Equation (1) implies laminar flow; hence, there is a need to treat Equation (1) differently to develop a practical equation that describes the flow behavior of fluids in a gas reservoir. Due to the significant effect of pressure on gas viscosity and density, two equations are added to Equation (1), resulting in the derivation of Equation (2), which is the radial diffusivity equation for compressible fluids, that is, gas reservoir fluids.
Equation (2) is linearized by the introduction of the real gas potential
m(
p), which is defined in Equation (3) along with the boundary condition. As the well is shut-in, a pressure disturbance is created in the reservoir, and a pressure wave travels throughout the reservoir. The pressure behavior of the well during unsteady-state (transient) flow is not affected by the reservoir boundaries; that is, the reservoir behaves as if it has infinite size, and this occurs within a relatively short time [
18]. As soon as the pressure disturbance reaches all the drainage boundaries, the pseudo-steady state flow begins; hence, different boundary conditions are imposed on the diffusivity equation in Equation (2). Furthermore,
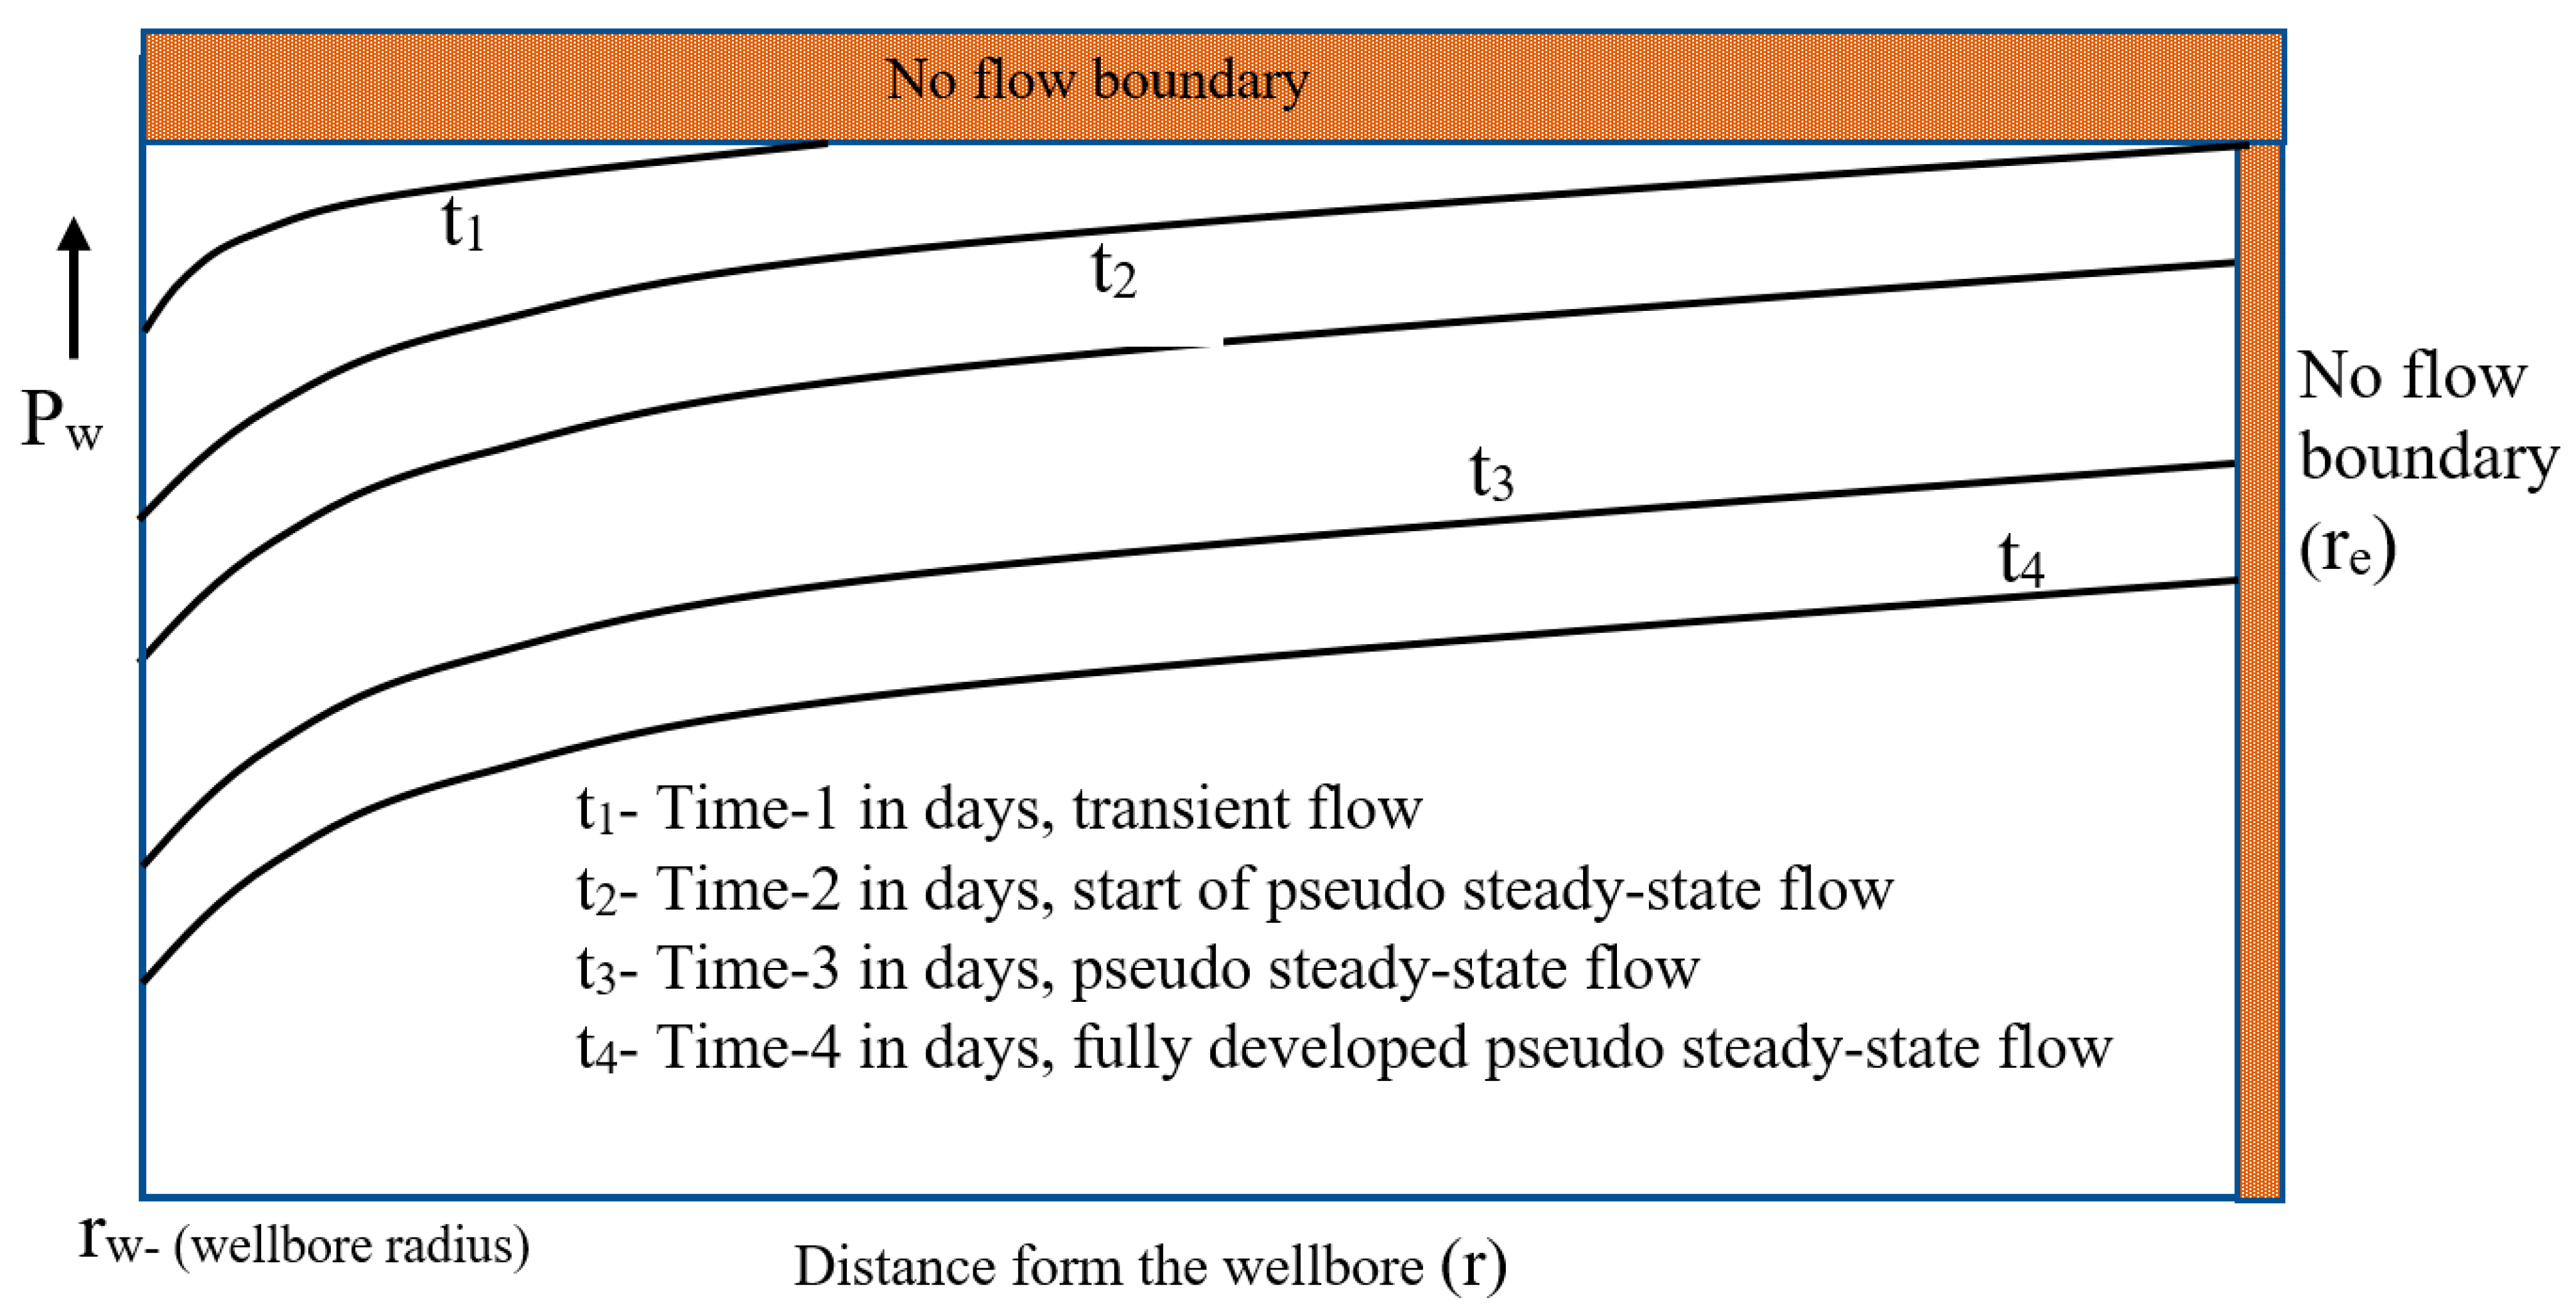
Figure 1 illustrates the pressure profile of a well versus drainage radius, producing at a constant rate. Different pressure profiles are shown for different flow periods (t) and a transition from transient flow to pseudo-steady-state flow will occur with time depending on the pressure support. In the present case, the well is undergoing pseudo-steady state flow with constant change in pressure with time throughout the drainage area. This behavior fits the practical performance of horizontal wells with a pressure-depletion scheme, such that the reservoir boundary pressure is not maintained but decreases with time (t
2 < t
3 < t
4) and
.
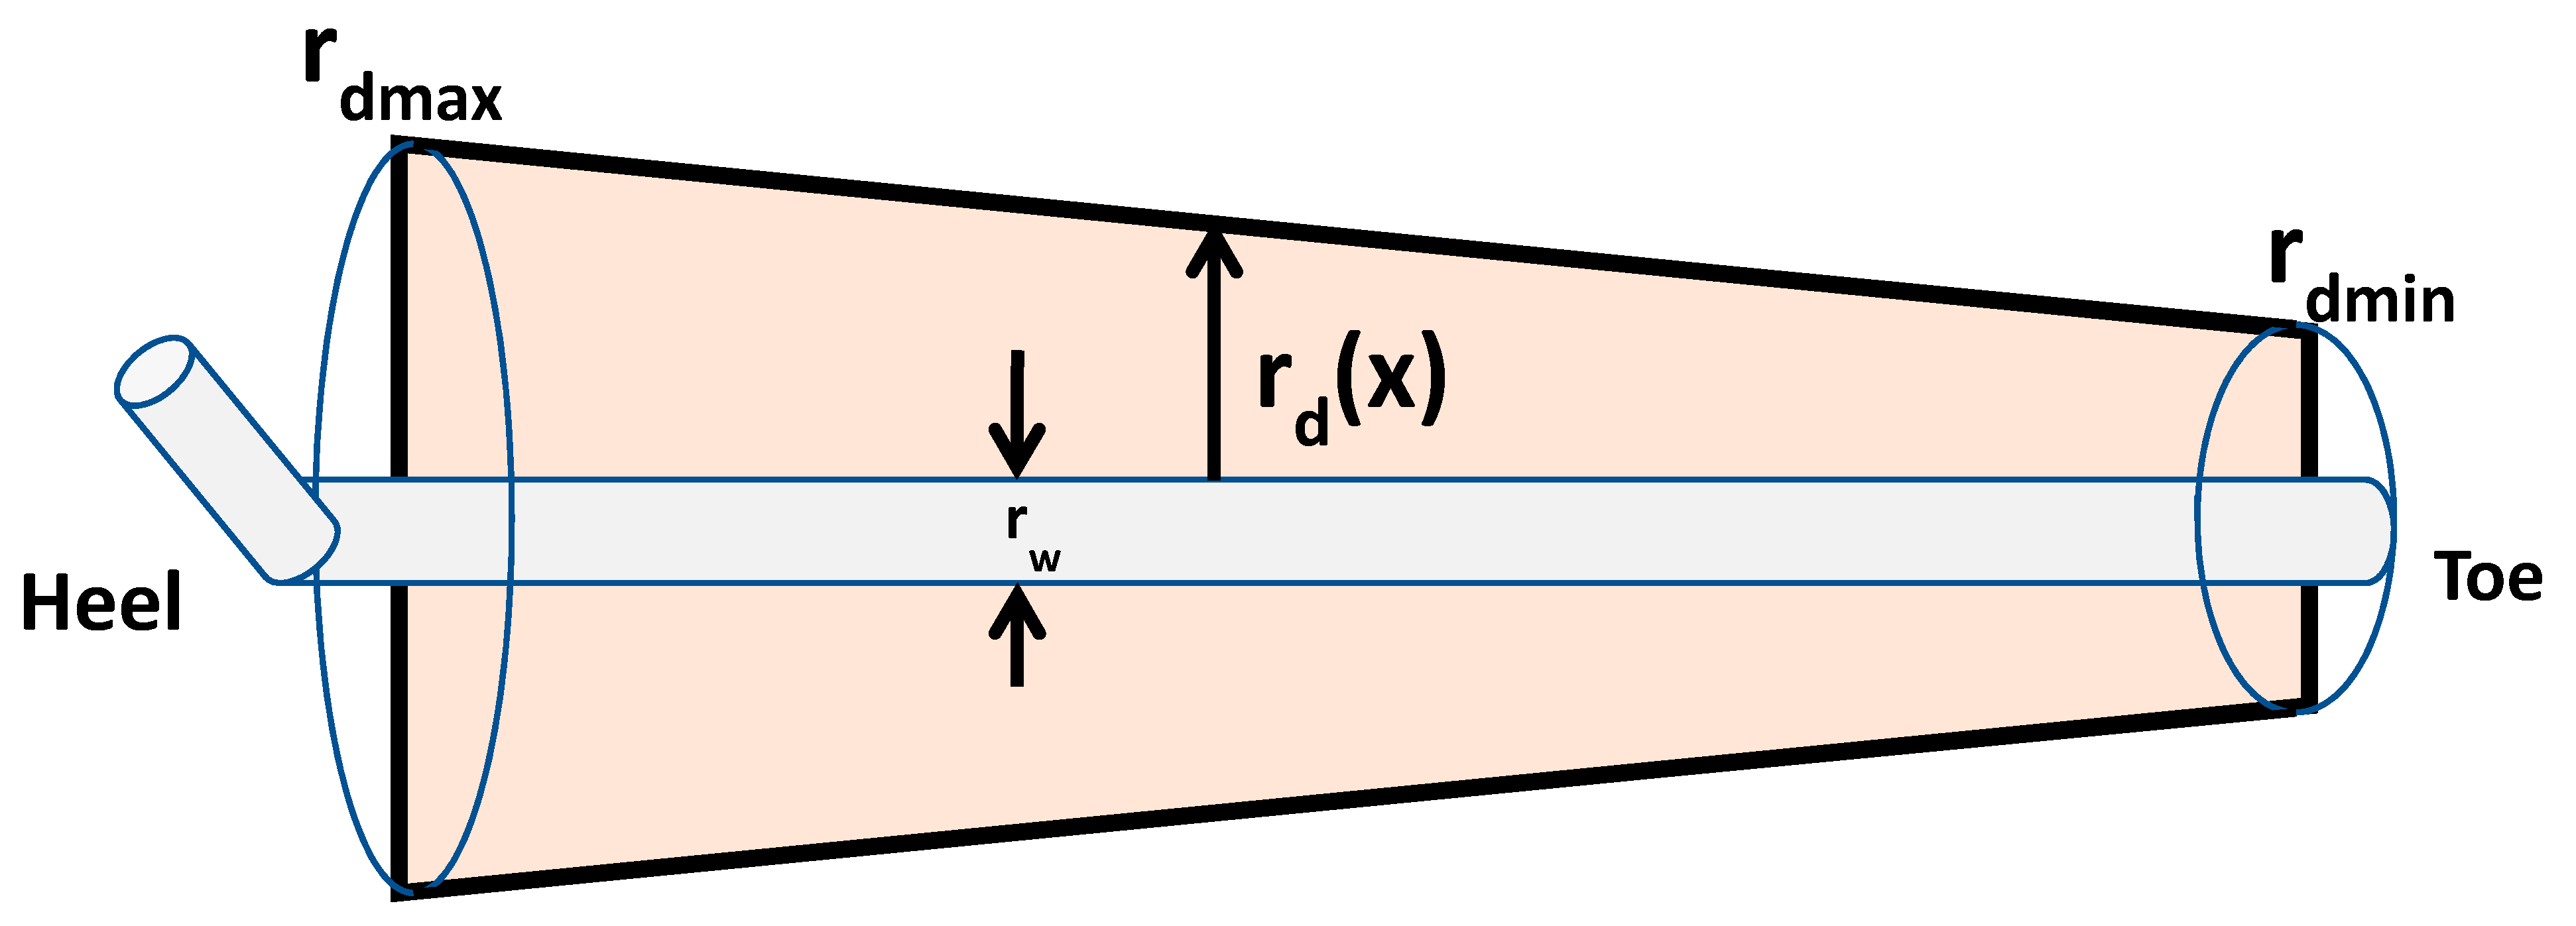
Formation damage along the horizontal length in gas reservoirs increases the required drawdown pressure, resulting in a reduced flow rate. Therefore, damaged wells will require a higher-pressure drawdown to produce at a particular flow rate than an equivalent undamaged well with a uniform permeability. It is expected that the damaged region in a horizontal well would be greater near the heel of the well because of the longer duration of exposure to drilling fluid and filtrate invasion than near the toe. Additionally, due to permeability variations along the well path, there will be a difference in flow rate among the segments. Due to these well attributes, most conventional models fail to take this non-uniform damage into account. In horizontal wells, non-uniform damage distribution greatly impacts the pressure transient characteristics and the well’s productivity. Since the damage distribution around a horizontal well is typically contributed by the duration of the exposure of drilling fluid, the damaged formations around a horizontal well are expected to take a conical shape [
19].
This comprehensive investigation analyzes the multi-segment horizontal well approach to developing the local skin factors for each horizontal well segment. This approach has been used in literature to develop equivalent skin factors in horizontal wells subjected to non-uniform damage. This obtains the equivalent skin factor of the segmented horizontal well in a tight gas reservoir by equating the total production from the entire horizontal well to the sum of the flow from individual segmented damaged zones along the well length. Hence, the primary objective of this paper is to apply the model for non-uniform damage and productivity of horizontal wells in gas reservoirs to predict the performance of these wells when subjected to turbulence at the near-wellbore region.
1.1. Damage to Horizontal Wells Drilled in Tight Gas Reservoirs
Tight gas reservoirs exhibit very low permeability values, less than 0.1 mD. In addition, formation damage in tight gas reservoirs arising from the invasion of fluids during drilling and completion is an inevitable phenomenon. This damage is usually referred to as mechanical skin damage, resulting in gas flow at very low rates, making production uneconomical in many cases.
Low-permeability reservoirs such as the tight gas reservoirs have reduced invasion zone thickness than a high permeability formation. However, the percentage loss in a low-permeability reservoir is larger than a high permeability reservoir. This occurs due to the blockage of the small pore throats in low-permeability reservoirs by drill solids and completion fluids, resulting in a large reduction in permeability around the wellbore. This reduced permeability around the wellbore minimizes fluid loss and therefore minimizes the radius of the fluid-invaded zone.
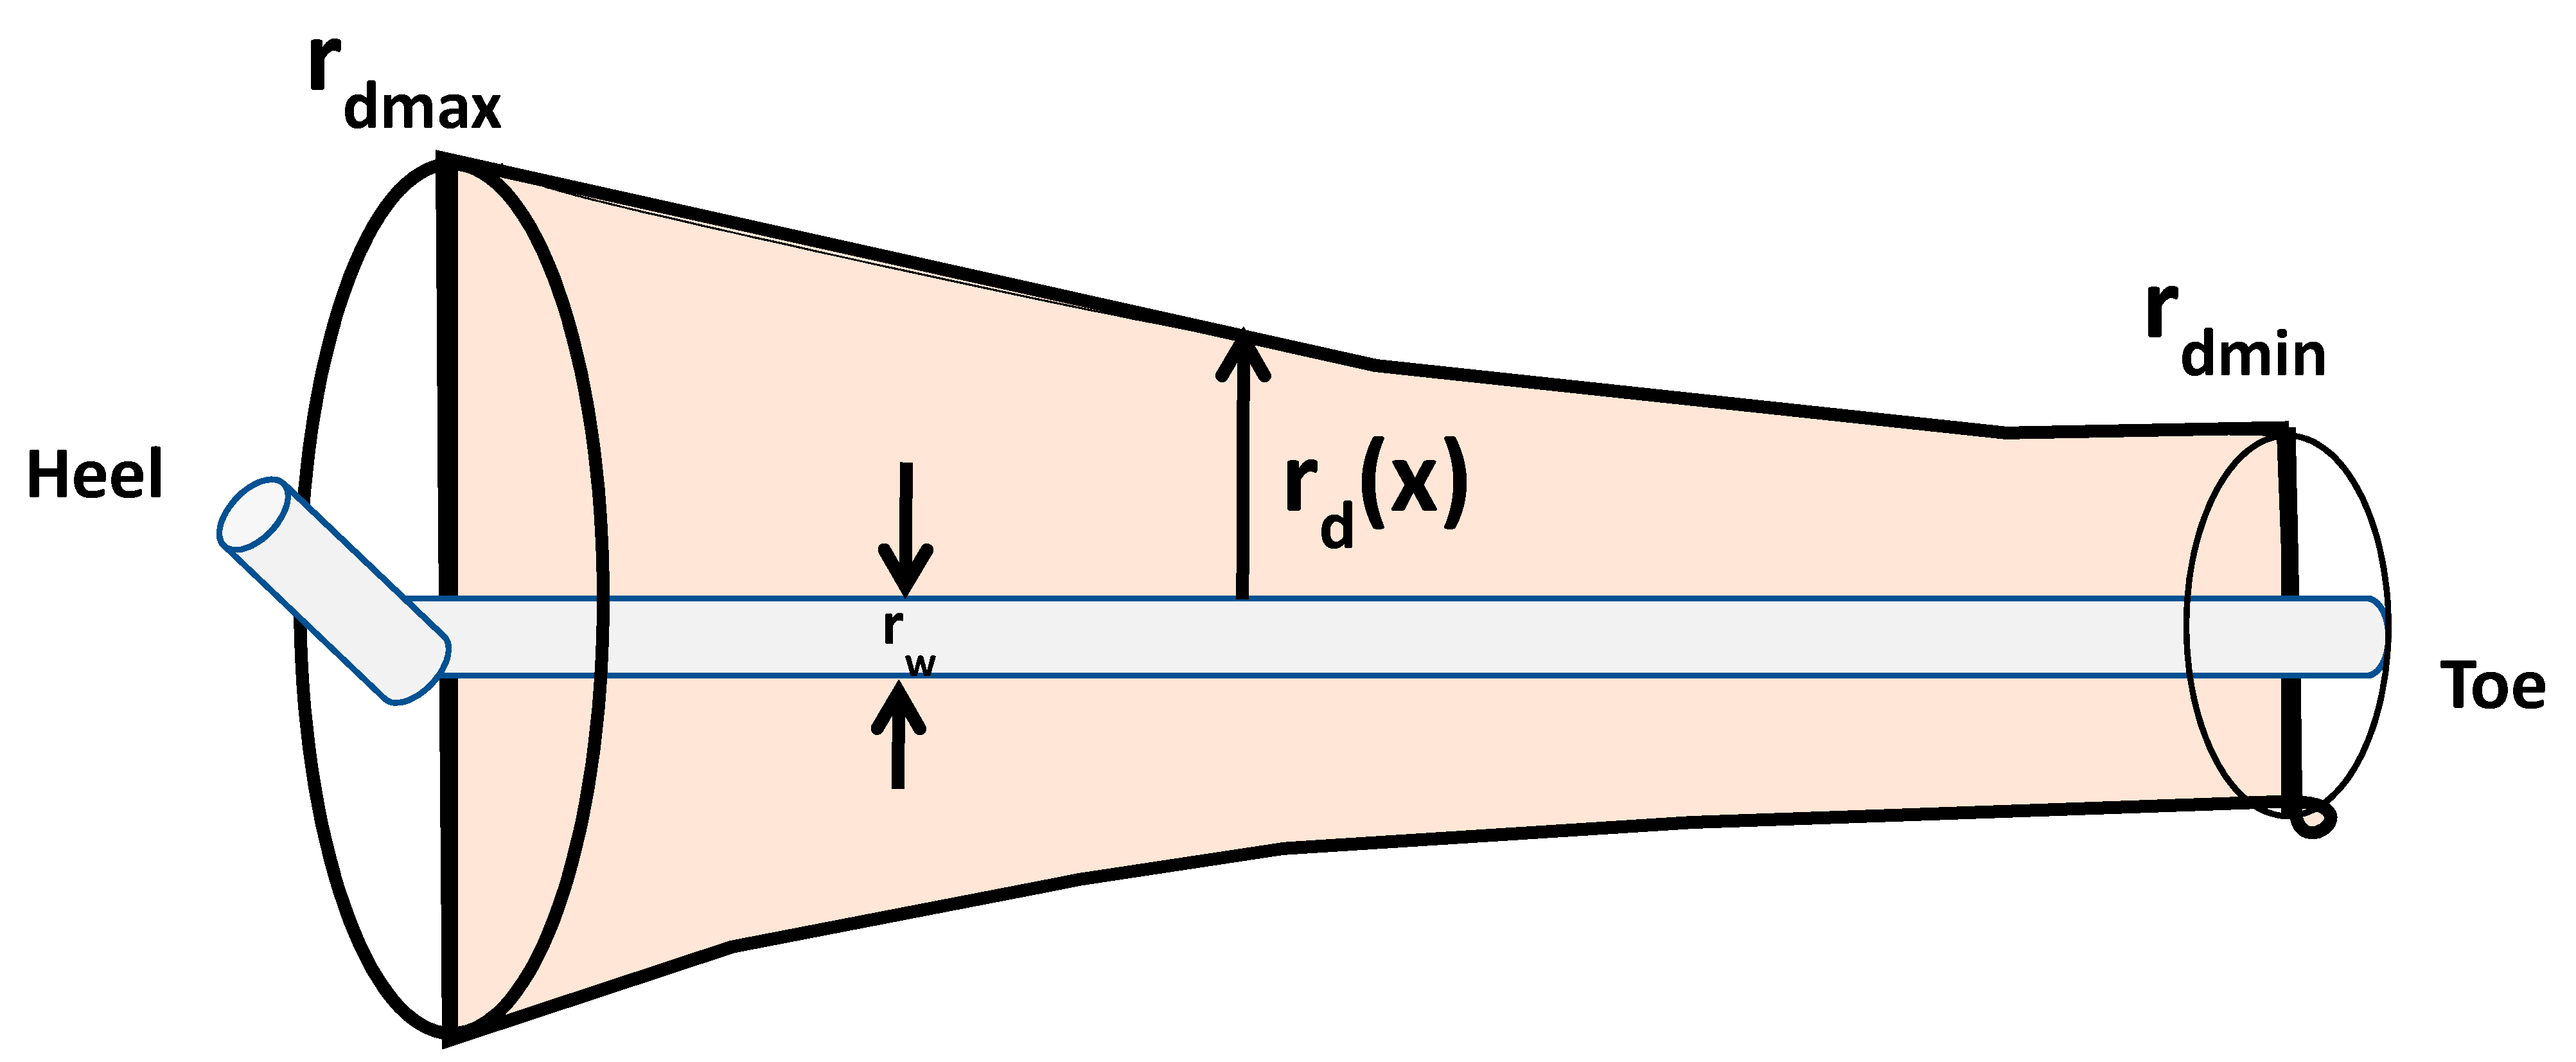
The damage in horizontal wells will be larger than that in vertical wells drilled in tight gas reservoirs because horizontal drilling takes a longer time than vertical well drilling, resulting in the conical-shaped damaged zone shown. For this investigation, two patterns of non-uniform damage are examined, the cone-shaped and horn-shaped patterns, as shown in
Figure 2 and
Figure 3.
This damaged zone severely reduces horizontal well productivity especially in tight gas reservoirs. In this scenario, skin damage varies along the length of the horizontal well. The skin versus horizontal length plots can be used to estimate the expected average damage from a horizontal well. During the horizontal well test interpretation, an average or equivalent skin value can be calculated, which would obviously represent the entire well.
1.2. Near-Wellbore Turbulence in Horizontal Wells in Tight Gas Reservoirs
As the gas finds a flow path through the ultra-low-permeability reservoir, because of the relatively low pressures around the wellbore, the flow velocity is expected to increase as the wellbore is approached. This increased velocity will be the cause of the development of a turbulent flow around the wellbore. Hence, the proposed model includes the coefficient of turbulence in the productivity equation to account for turbulence, though the reservoir has low permeability. Additional pressure loss due to the turbulence, similar to that caused by the skin effect (but of different magnitudes) must be taken into consideration. The literature uses the non-Darcy flow term, which is interpreted as rate-dependent skin to describe the additional pressure drop due to the turbulent (non-Darcy) flow [
17].
Therefore, total or apparent skin,
in a tight gas reservoir will be due to equivalent or average formation damage,
seq and the non-Darcy rate-dependent skin, expressed as
DQg, that is:
where
D is the turbulent flow factor and
Qg is the gas volumetric flow rate.
1.3. Horizontal Well Application in Tight Gas Reservoirs
Generally, tight gas reservoirs are historically considered to have poor commercial value owing to their low production rates. These difficulties have caused the replacement of vertical wells by horizontal wells, such that large volumes can be drained. Furthermore, the vertical wells, if any, are hydraulically fractured and/or acidized and closely spaced to efficiently drain the reservoir [
1]. Therefore, horizontal wells have proved to be suitable for the development of tight gas reservoirs due to high production rates achievable through suitable drawdown.
It is generally observed that in tight gas reservoirs, wellbore turbulence limits the deliverability of horizontal wells. The possible alternative to reduce near-wellbore turbulence is to reduce the gas velocity around the wellbore. For vertical wells, Qg/h is higher around the wellbore compared to Qg/L around the horizontal wellbore because L is sufficiently greater than h, where h and L are the reservoir thickness and lateral length of the horizontal well, respectively.
Experience shows that it is difficult to create long fractures through a tight reservoir, especially if there is a weak cap or base rock overlaying and/or underlying the reservoir, where there is the possibility of fracture extension into unproductive zones. In these cases, horizontal wells provide a better alternative to obtain long fracture extension since the horizontal well itself represents a long fracture with a height equal to the wellbore diameter [
20].
The concept of dimensionless time
tD, defined to represent various flow regimes and estimate the time to reach pseudo-steady state, vertical gas wells drilled with a circular drainage area with 160-acre spacing will have infinite acting time (i.e., time to reach pseudo-steady state in hours) as:
Equation (5) shows that the transient time (infinite acting time) depends on the porosity, permeability, and compressibility of the reservoir. Vertical gas wells in tight gas reservoirs with permeability less than 0.1 mD take longer to reach the pseudo-steady state. Therefore, it is very difficult to drain the reservoir economically with vertical wells in such a long transient time in tight gas reservoirs. Horizontal wells provide the best option to accelerate reservoir drainage and drain the reservoir effectively.
2. Materials and Methods
2.1. Horizontal Well Productivity Model
This paper adopts the pseudo-steady state gas flow equation as the primary equation, which models the practical performance of horizontal wells in reservoirs with a pressure-depletion scheme. The reservoir boundary pressure is not maintained but decreases with time. This paper modifies the equation to be suitable for non-uniform skin and turbulent flow. The equation is given in two forms:
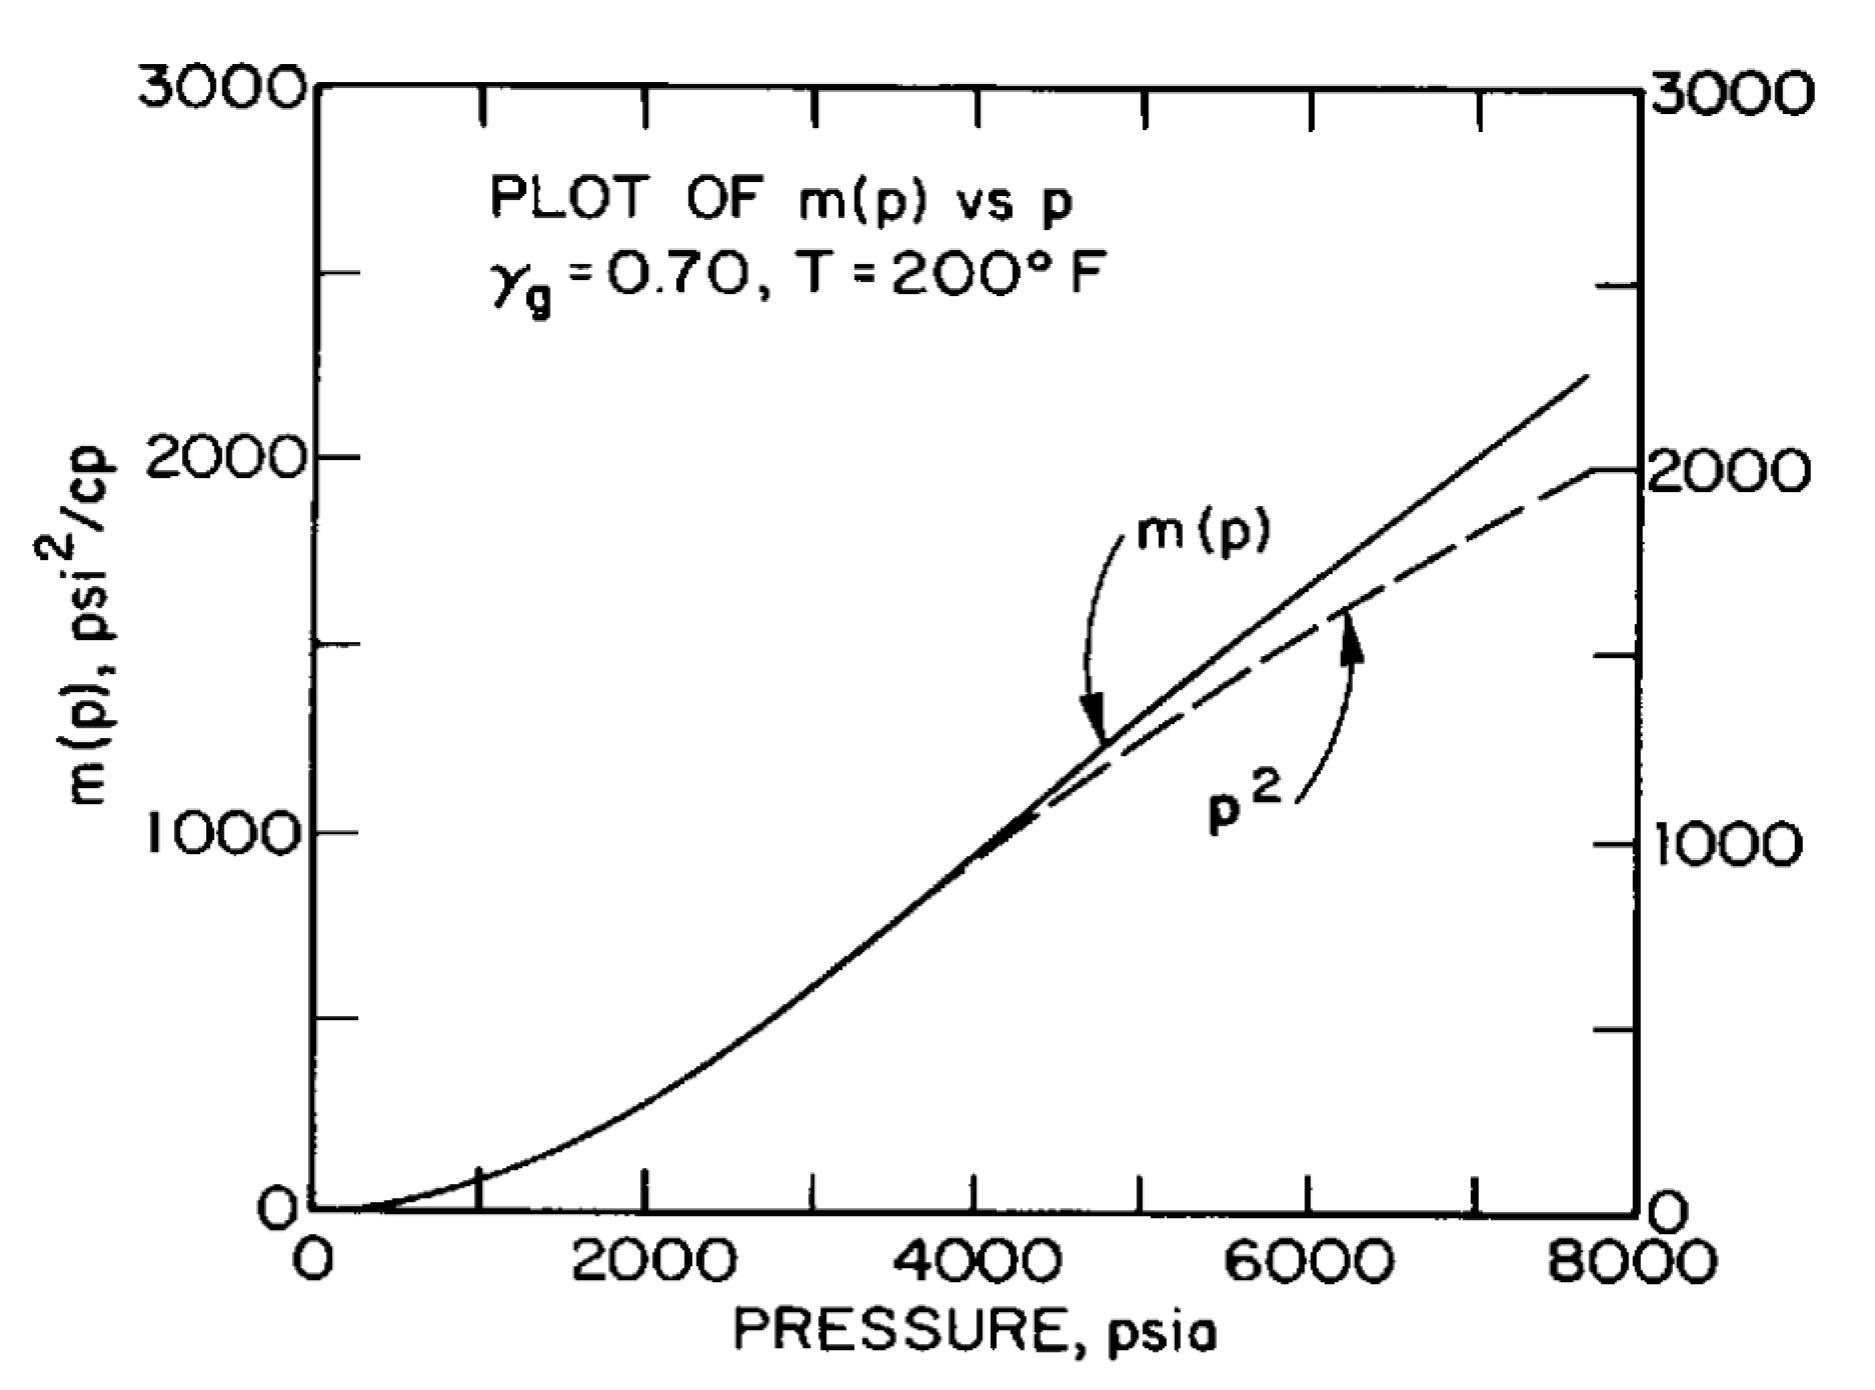
From
Figure 4 it can be seen that the gas flow rate is proportional to the pressure square terms in the pressure-squared solution. The pseudo-pressure solution method can be used for reservoir pressures up to 3800 psia, as P
2 and m(P) curves have identical values up to 3800 psia.
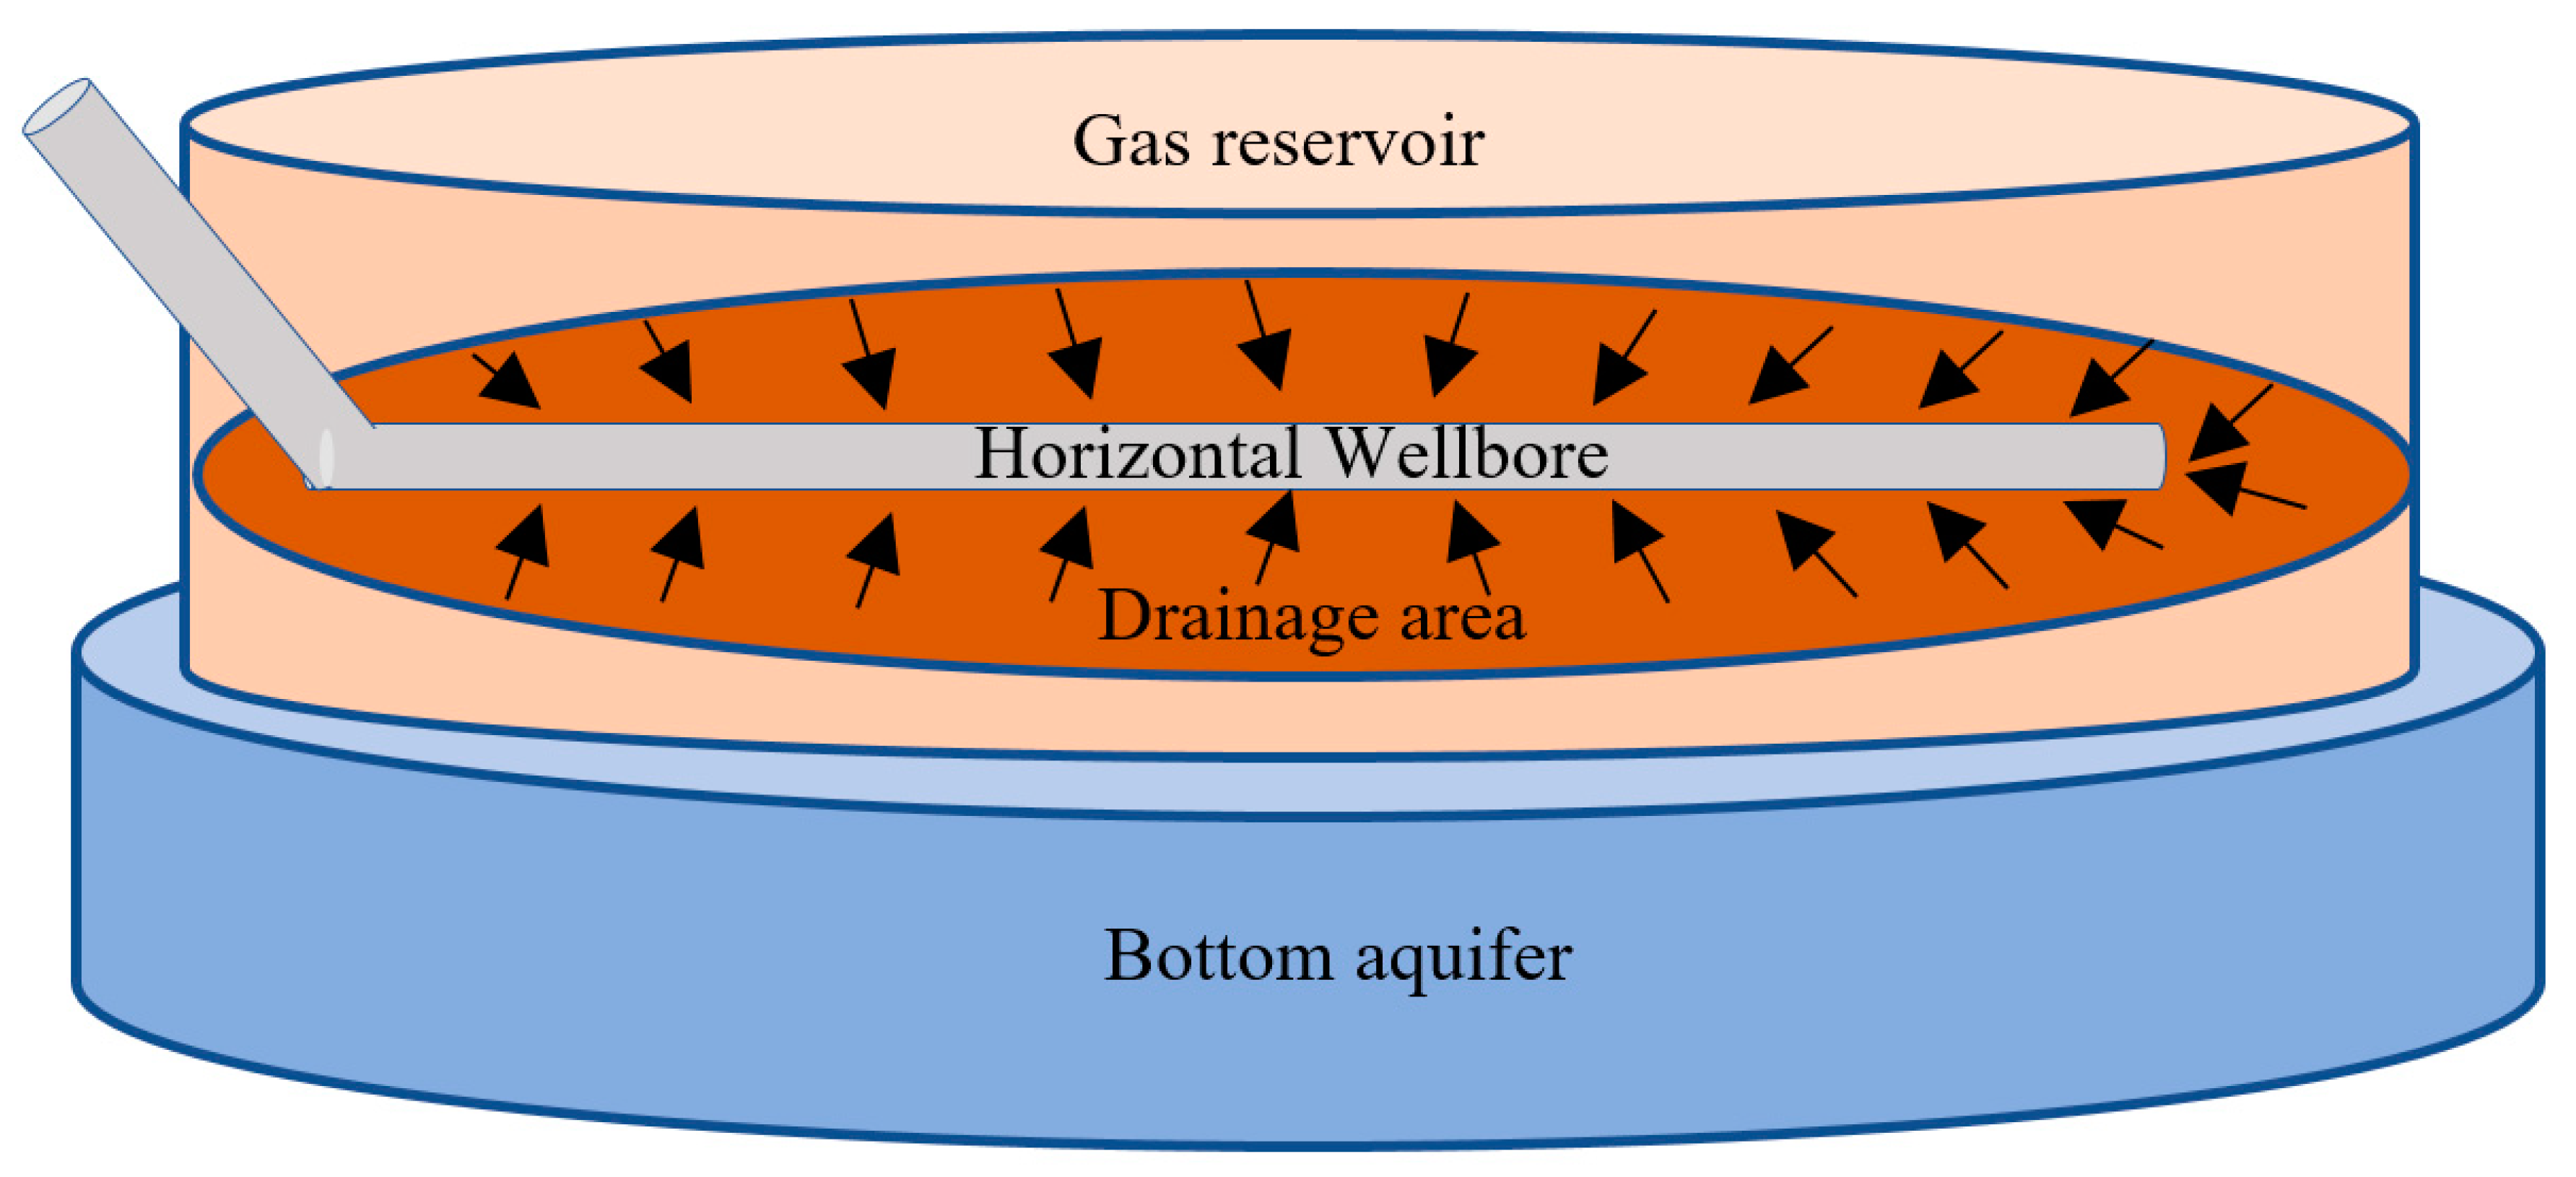
Thus, the pseudo-pressure solution method is adopted as the base of our modified model, and the system described in this manuscript is a tight gas reservoir underlain by a bottom-water aquifer providing the drive, as shown in
Figure 5.
The concept of effective wellbore radius,
given by Joshi [
20], is introduced into the gas flow equation as follows:
with
and
where the drainage area,
A, is assumed to be elliptical for the purpose of this paper. That is,
where
is half of the major axis and and
is half of the minor axis.
Now, the apparent or total skin defined in Equation (4) needs to be substituted into Equations (6) and (7). Therefore,
2.2. Concept of Equivalent Skin from Non-Uniform Damage in the Horizontal Well Productivity Model
Furui et al. [
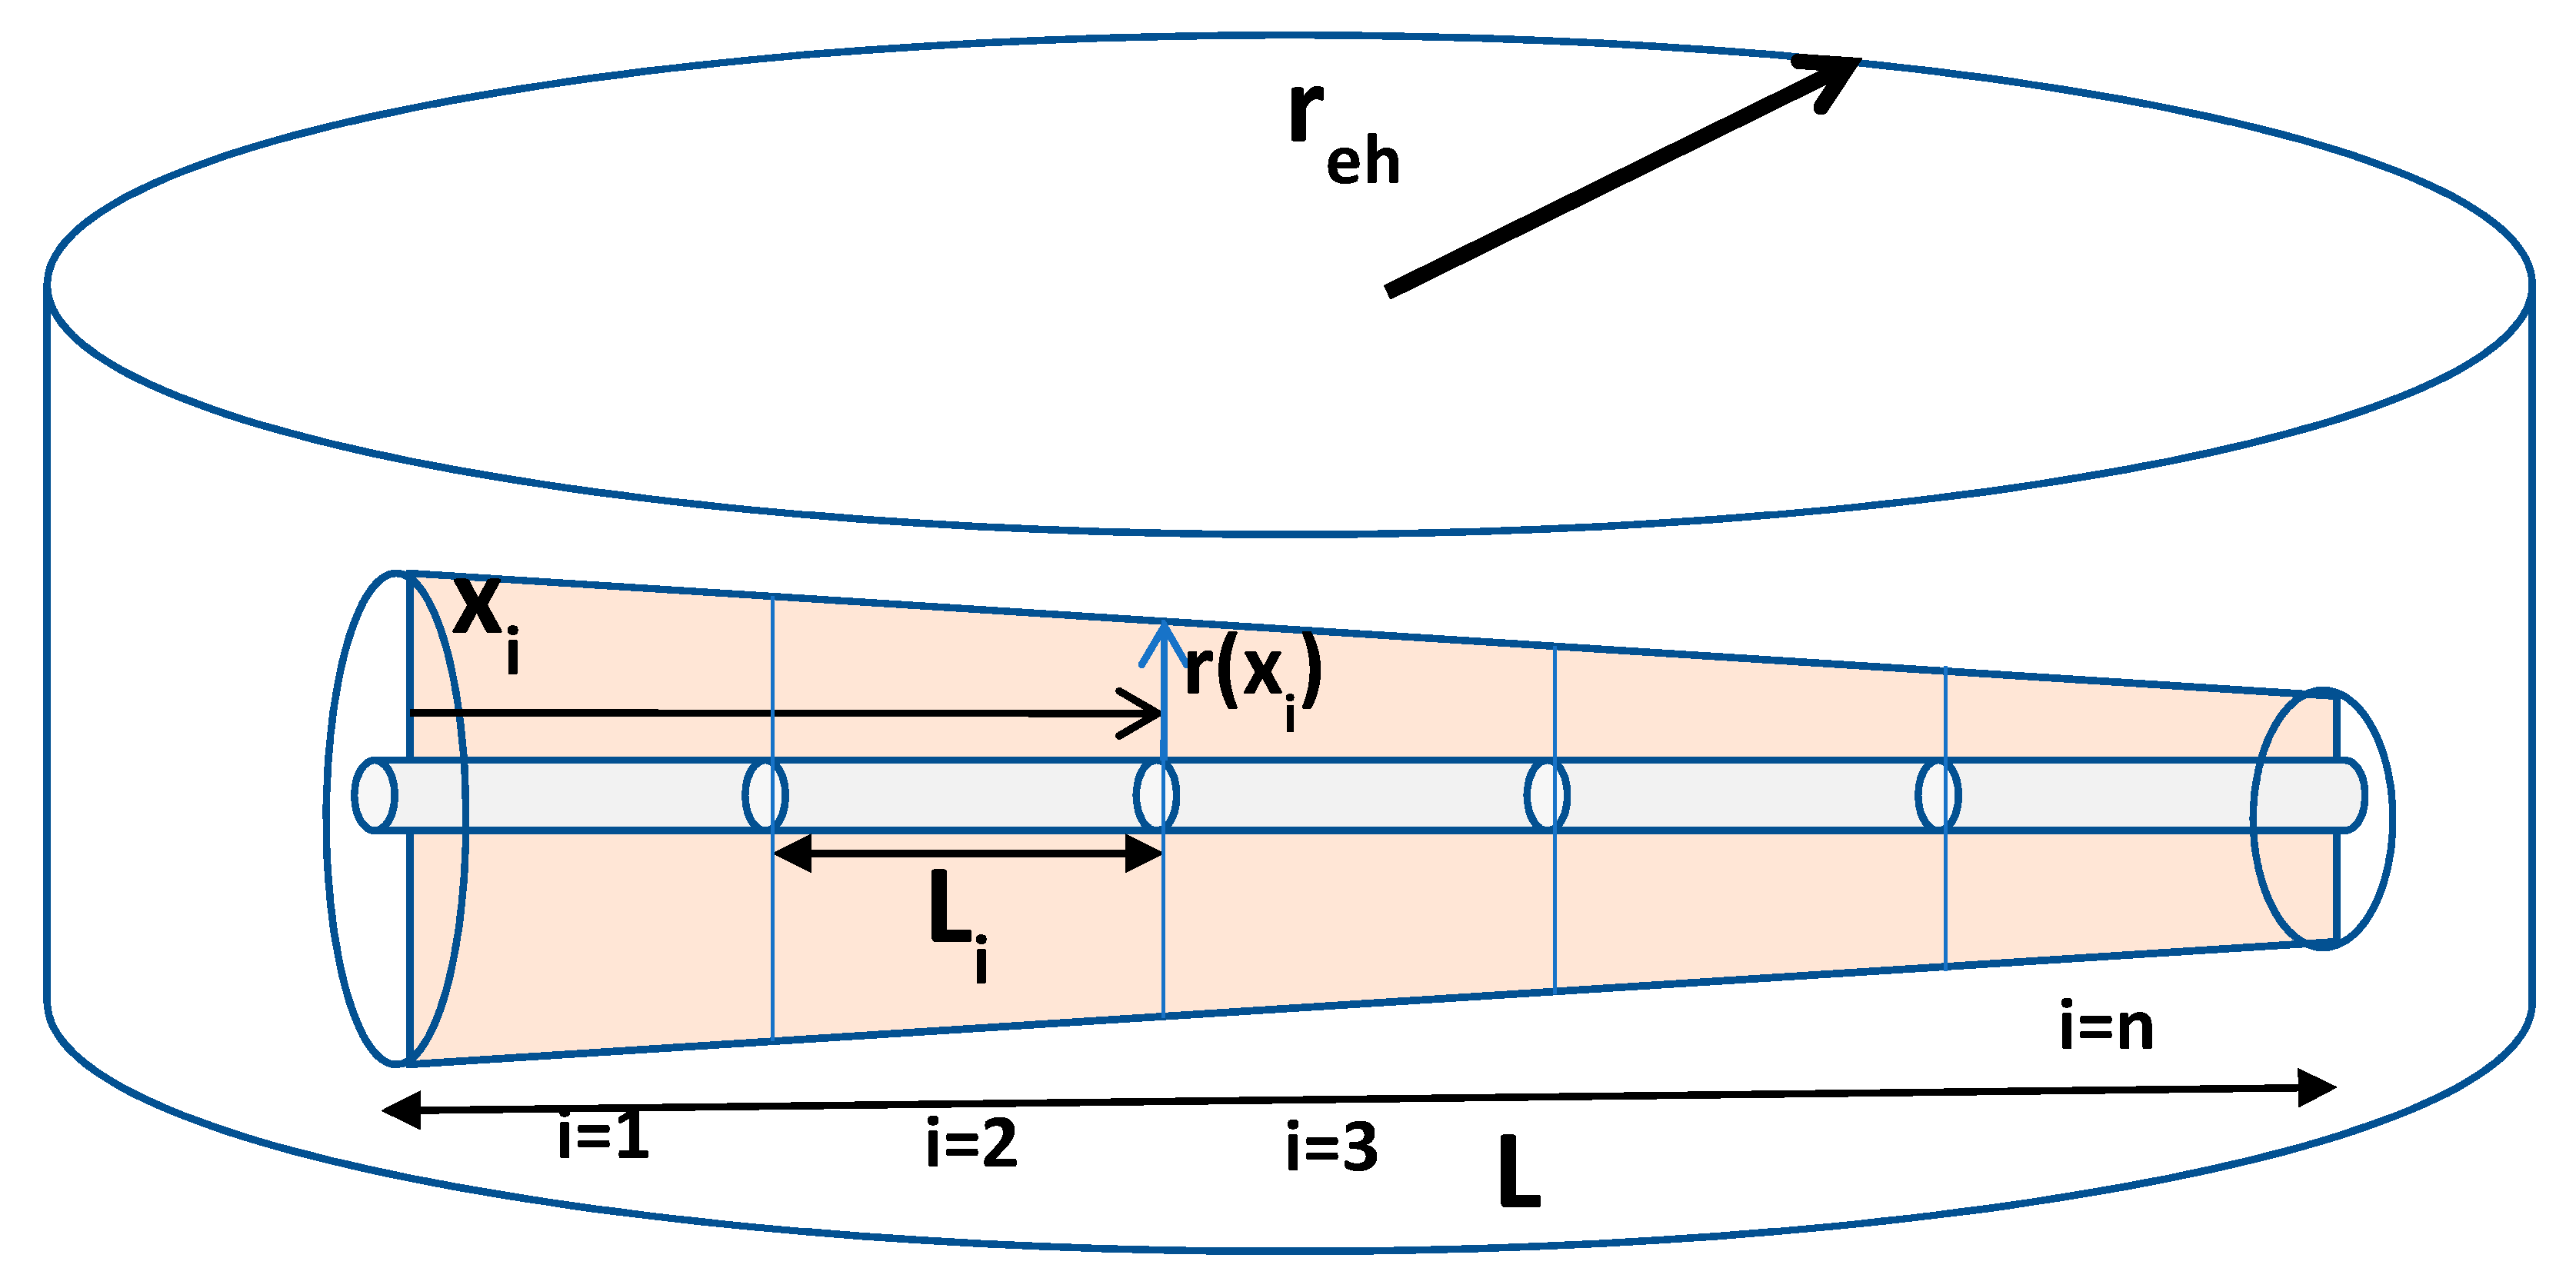
21] conducted an analysis on heterogeneous skin calculation along the wellbore length, which this paper refers to as non-uniform damage along the wellbore length. The method of analysis in the reference is adapted in this paper. The distribution of the gas flow rate per unit length of the tight gas horizontal well is not uniform when the distribution of the formation damage is not uniform but is a function of the position x along the horizontal well. As stated earlier, two patterns of non-uniform damage are examined, the cone-shaped and horn-shaped patterns. According to the multi-segmented horizontal well model, this paper divides the horizontal well in the tight gas reservoir (with bottom aquifer) model into equal segments (i.e., from 1 to n) and analyzes the cumulative lateral length from the heel up to the tip of each segment as individual lateral lengths with local skin factors for each segment.
Figure 6 shows the multi-segment horizontal well model.
From Equations (11) and (12), assuming homogeneous and isotropic reservoirs, the total flow rate due to the equivalent skin factor is:
and will be equal to the sum of the flow rate from each damaged segment with individual local skin factors, that is:
The rate-dependent skin due to turbulence from each segment of flow is sufficiently low in low-permeability reservoirs such as tight gas reservoirs; therefore, the rate-dependent skin terms are neglected.
Note that the effective wellbore radius due to the length of each segment is:
where
The equivalent skin factor from formation damage to be used to calculate the horizontal well flow rate in gas reservoirs depends on the local skin factors for each damaged segment, drainage radius of the horizontal well, and the effective wellbore radius of the horizontal well.
The local skin factor,
s(
xi) is defined as:
The permeability of the damaged zone, is a function of x along the lateral length, i.e., . Also, the radius of damage, is a function of x, i.e., .
For the cone-shaped damage,
rd(
x) is a linear function (
Figure 2):
Hence, the local skin factor for each segment will be:
For the horn-shaped damage,
rd(
x) is an exponential function (
Figure 3).
2.3. Concept of Turbulence in the Horizontal Well Productivity Model
As discussed above, the development of Equations (11) and (12) resulted from using the Darcy Law as the basis and included modifications to suit the behavior of horizontal wells in gas reservoirs. Turbulence, which is peculiar to gases, adds the non-Darcy characteristic to the fluid flow. Hence, the need to add the turbulence or inertial flow factor, D, to the productivity model arises.
From literature, the turbulent flow factor,
D, is defined as [
20]:
where
F is the non-Darcy flow coefficient and is given by:
The turbulence parameter,
is given as:
Equation (23) shows that the near-wellbore turbulence in a vertical well is inversely proportional to the perforated interval, , whereas in a horizontal well, by increasing the length, the near-wellbore velocity or turbulence is decreased, and productivity is enhanced.
Equations (11) and (12) result in quadratic relationships in terms of
, not explicit expressions for calculating the gas flow rate [
20].
The deliverability or multi-rate test is one of the tests that can be used to confirm the effect of high velocity or turbulence in a horizontal well by measuring the flow rate at different surface pressures after the well has been shut-in for some time (i.e., for formation pressure/bottomhole flowing pressure to equalize at the average reservoir pressure). At each surface pressure, a stabilized gas flow rate,
Qg is recorded. The bottomhole flowing pressure is calculated from surface pressure and gas flow rate. The backpressure or deliverability equation in Equation (26) is used to correlate the data from the deliverability test. That is:
The exponent,
n, is a dimensionless constant and accounts for the additional pressure drop caused by turbulence in the horizontal well, whereas reservoir rock properties, fluid properties, and the reservoir flow geometry define the performance coefficient,
C [
1].
From , the deliverability plot of versus on a log-log scale can be obtained from which the slope 1/n can be calculated. This also applies to the pseudo-pressure method.
The values of n range from 1.0 (fully laminar flow) to 0.5 (fully turbulent flow).
The values of C and n are used to determine the gas flow rate at any bottomhole flow pressure.
The linear-inertial-turbulent (LIT) quadratic approach [
18], is also used to separate the laminar and inertial-turbulent terms in Equations (11) and (12). The quadratic equations can be written in the following forms:
Pressure-Squared form:
where
The values of a
1 (laminar flow coefficient) and b
1 (inertial-turbulent flow coefficient) make Equation (28) solvable for
at different values of
.
Pseudo-Pressure form:
where,
The values of
a2 (laminar flow coefficient) and
b2 (inertial-turbulent flow coefficient) make Equation (28) solvable for
at different values of
.
3. Results
A 5000 feet horizontal well is proposed to be drilled in a tight sand reservoir underlain with a bottom aquifer. The details of the reservoir, flow, and pressure parameters are given in
Table 1,
Table 2 and
Table 3.
The development of this tight gas reservoir required decisions and predictions on the dependence of equivalent skin factor and flow rate on five major influencing parameters. This section investigates the influence of the horizontal well length, damaged zone permeability, drainage area, reservoir thickness, and wellbore diameter on the calculated equivalent skin (of a non-uniform skin distribution) and the flow rate (with turbulence and no turbulence).
Figure 7,
Figure 8,
Figure 9,
Figure 10,
Figure 11,
Figure 12,
Figure 13,
Figure 14 and
Figure 15 illustrate the key findings from this investigation.
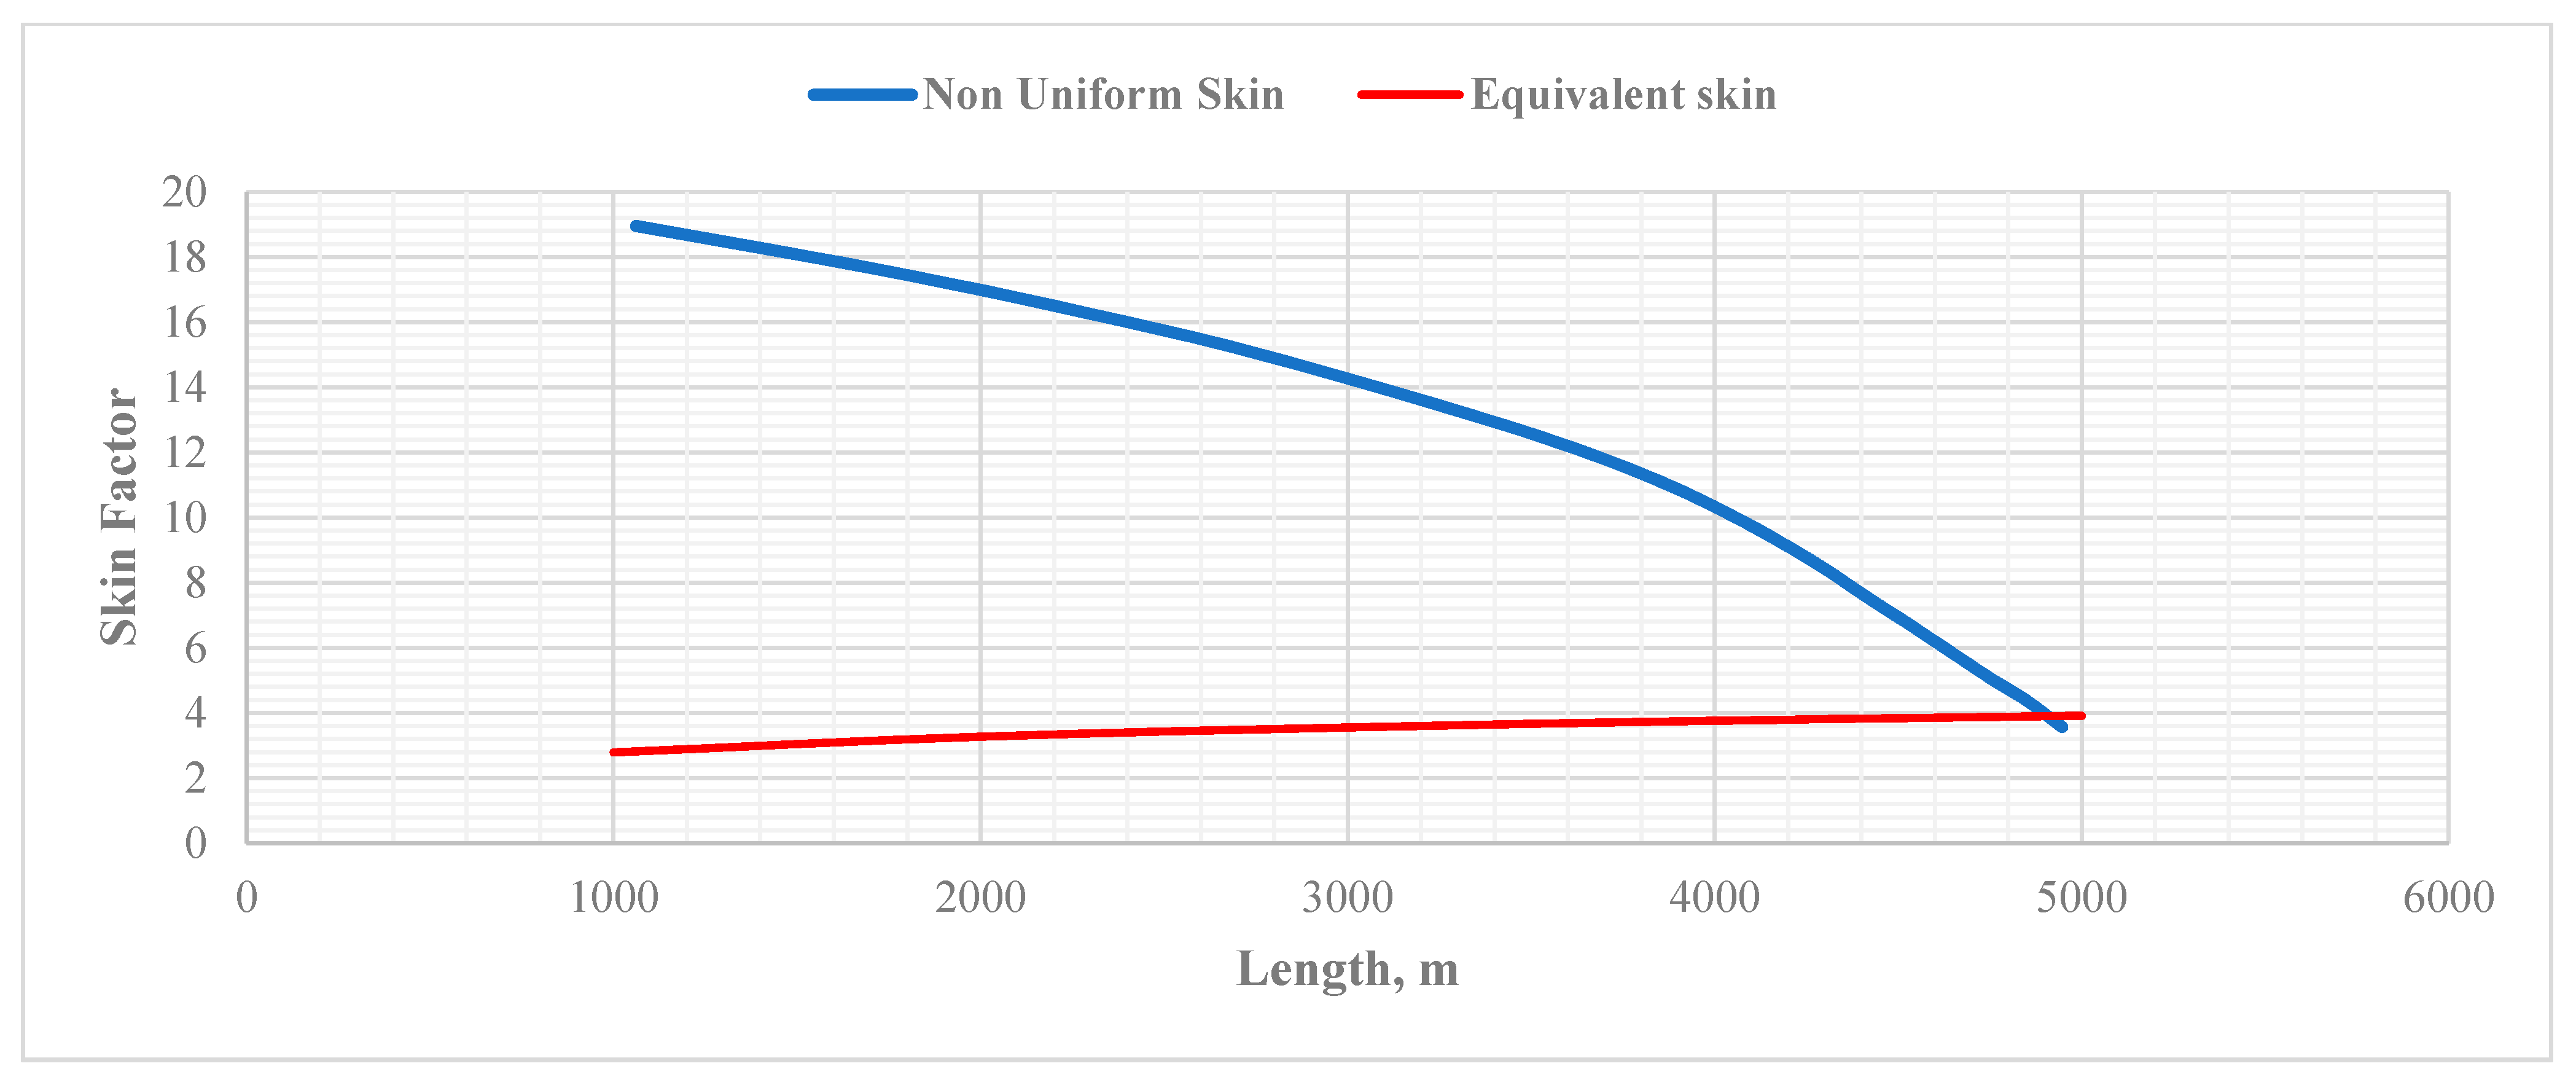
Figure 7 shows the plot of the local skin factor and equivalent skin versus horizontal well length. As illustrated, the skin factor with respect to non-uniform skin decreases along the horizontal well length. The non-uniform skin behavior matches better with horn-shaped damage rather than cone-shaped damage. Furthermore, there is a slight increase in equivalent skin with respect to an increase in horizontal length. However, the incremental rate of equivalent damage is very minimum, which justifies drilling a longer horizontal well. This is consistent with the findings reported in literature [
22,
23,
24] and can be associated with lesser exposure to damaging drilling fluids towards the toe segment.
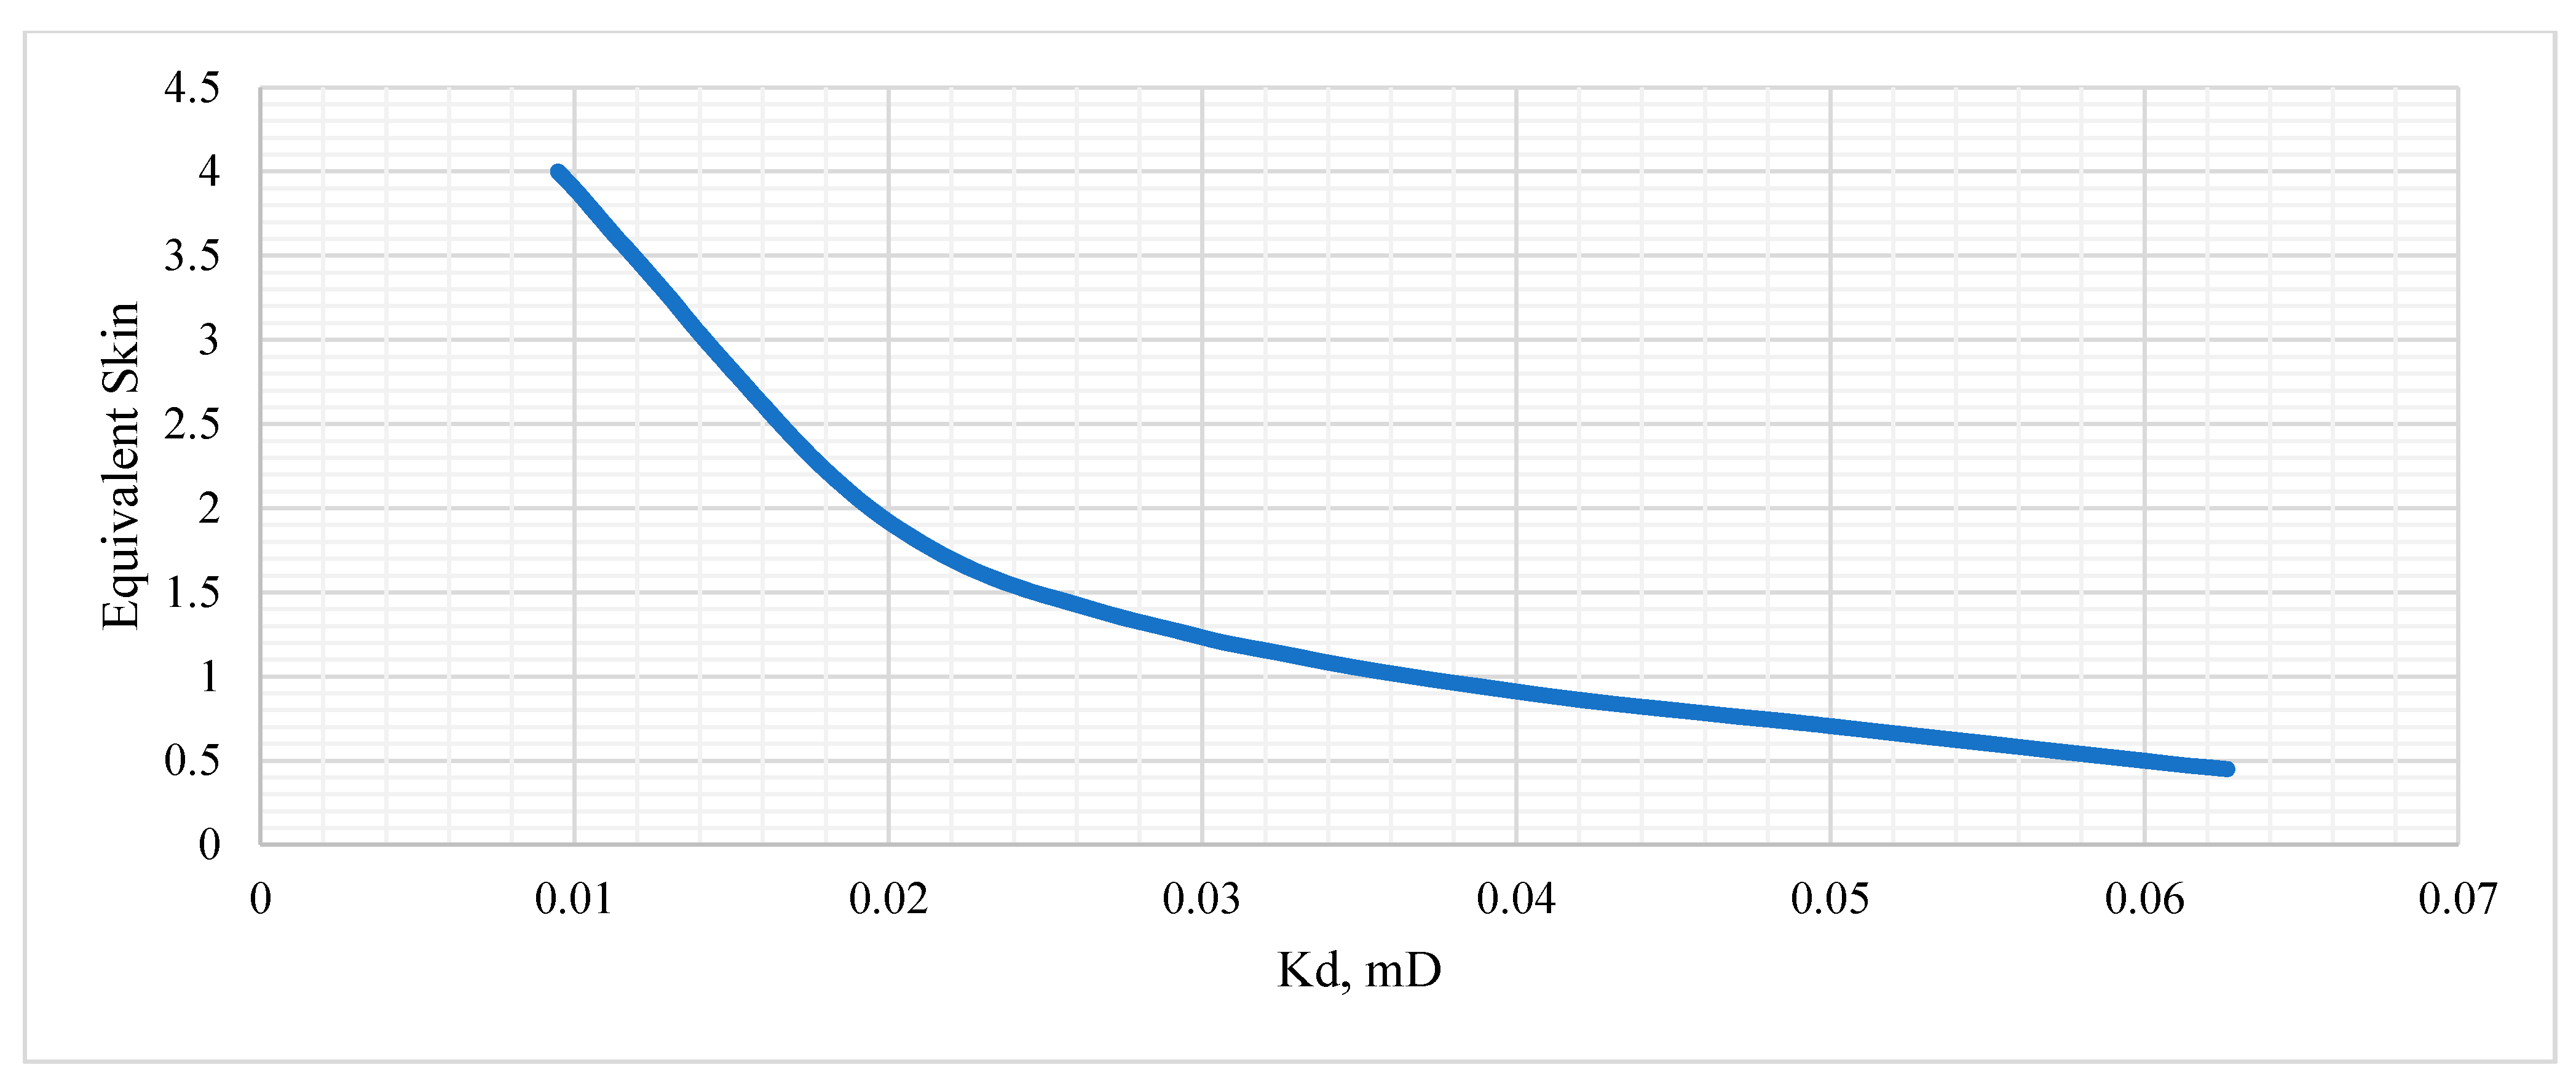
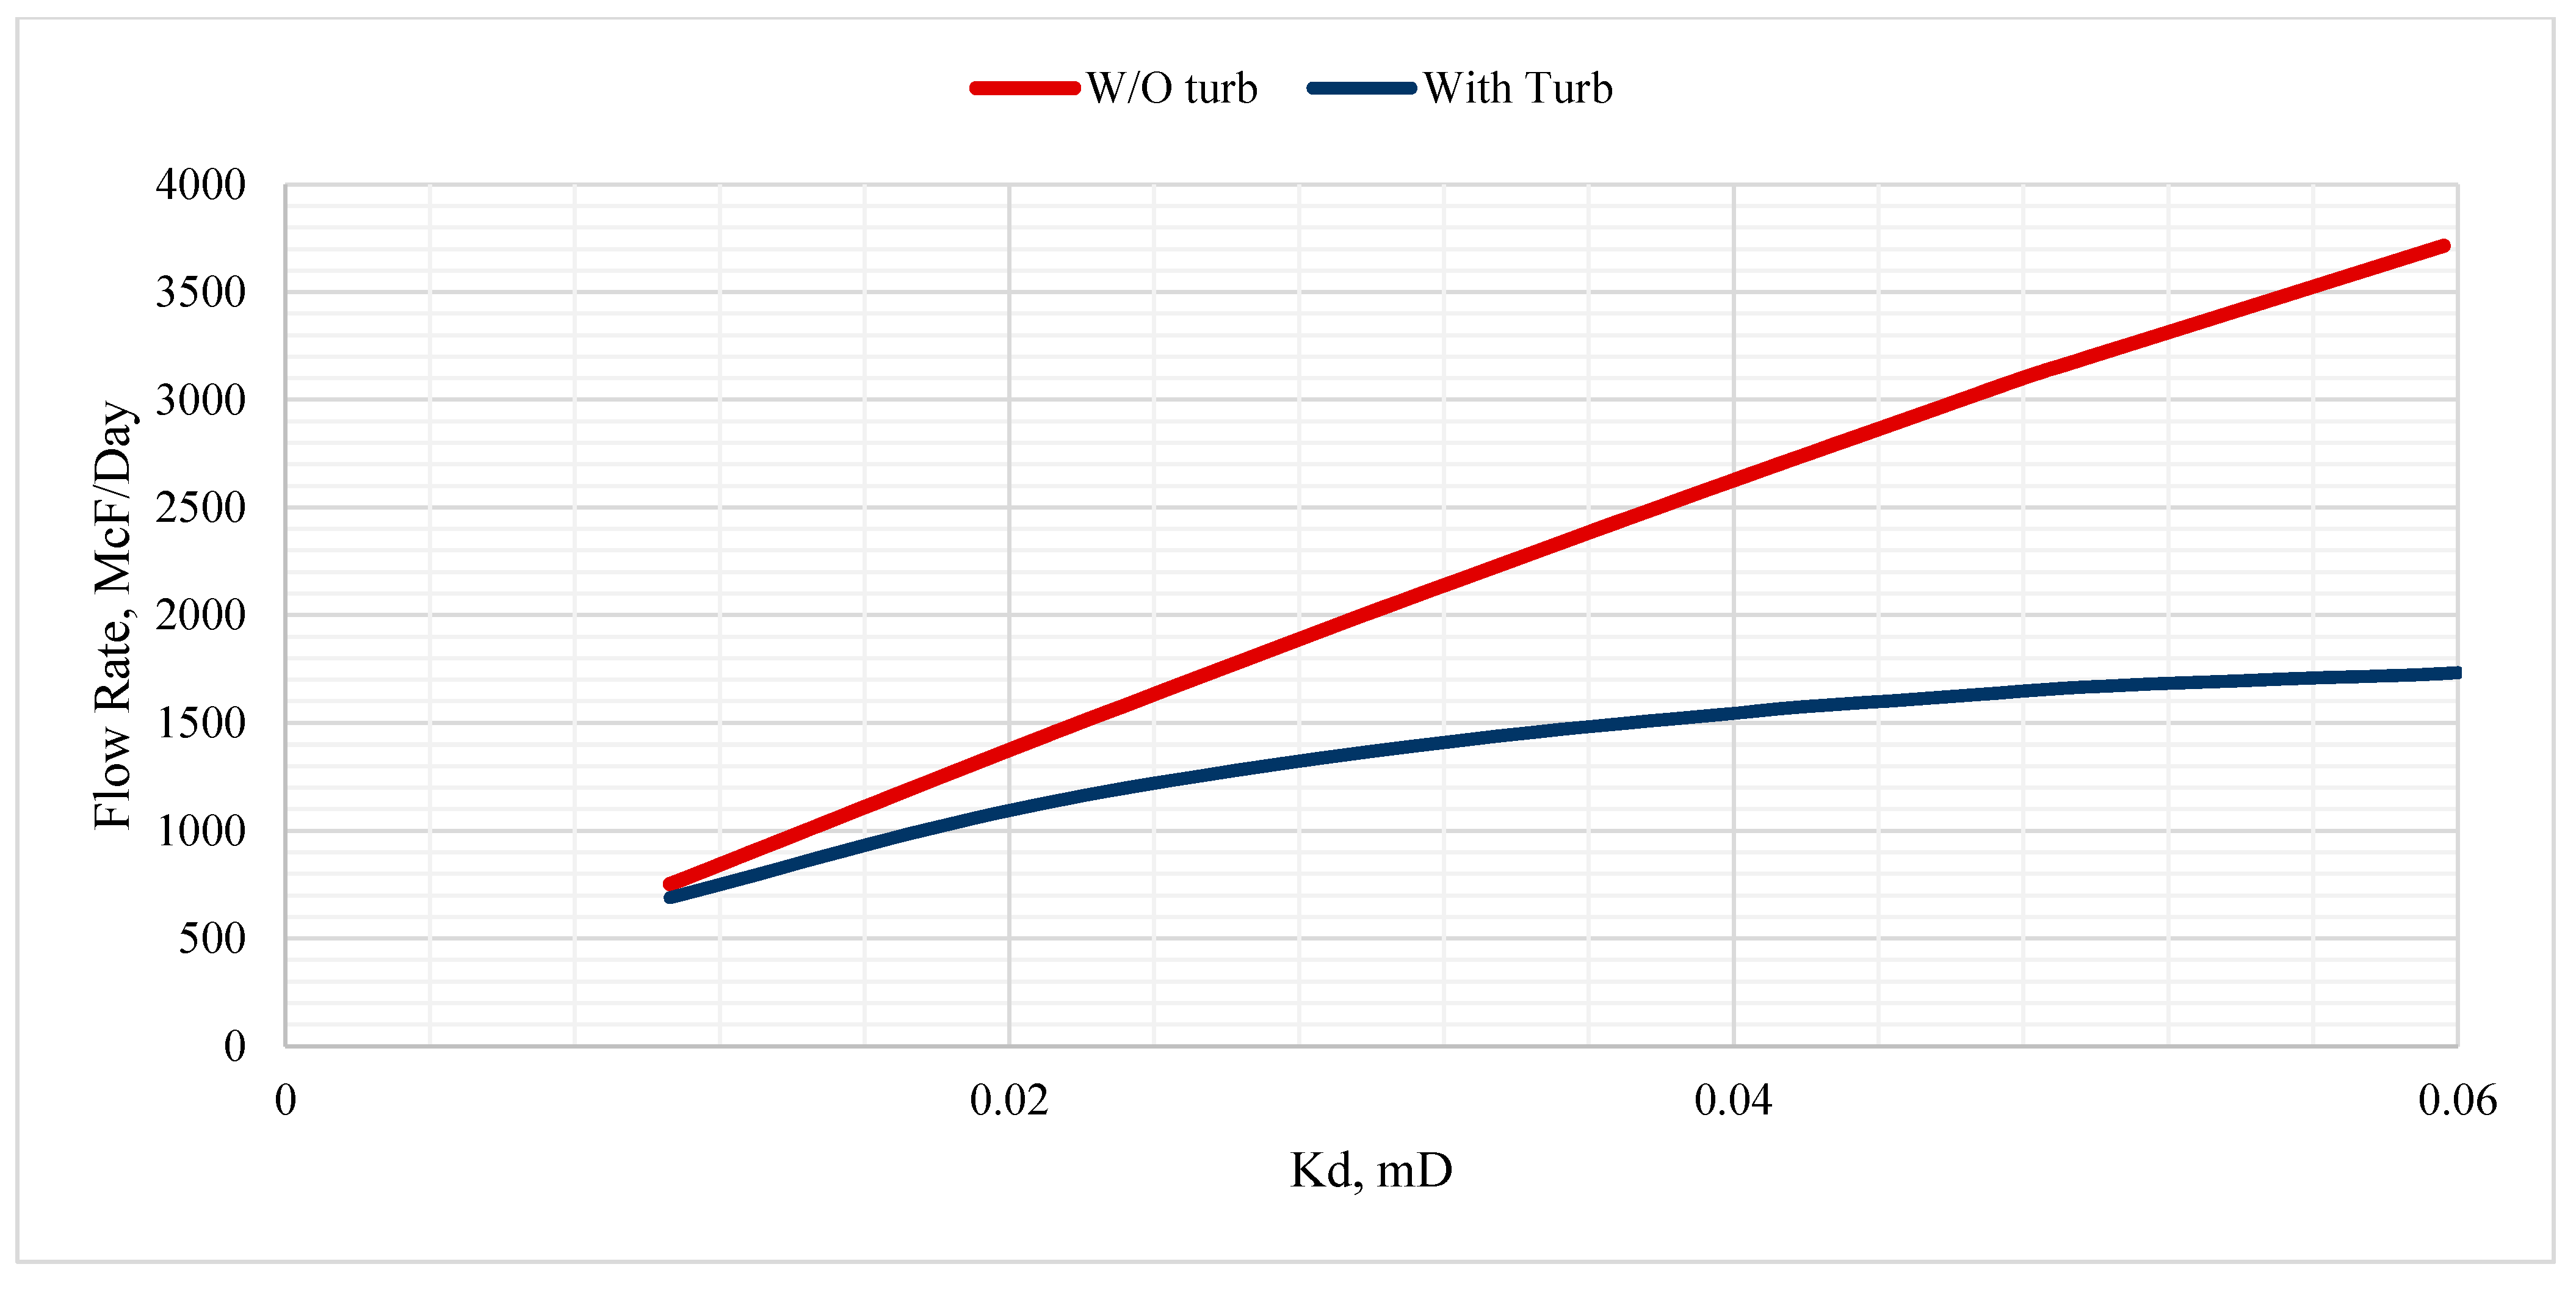
Important findings from the model in terms of well productivity can be found in
Figure 8 and
Figure 9.
Figure 8 shows the plot of the equivalent skin factor versus damaged zone permeability. It can be seen that the damaged zone permeability increases with reduced equivalent skin. A reduction of equivalent skin from 4 to 0.5 can enhance permeability by nearly six-fold.
Figure 9 shows the plot of the gas flow rate versus damaged zone permeability. Under the cases analyzed within the given scenarios, a nearly linear increase in flow rate is noticed when the effect of turbulence is not considered. In contrast, the flow rate is significantly lowered when the effect of turbulence is considered within the non-Darcy flow equation. This clearly shows the importance of considering the turbulence while calculating the expected flow rate in a realistic scenario.
Figure 9 and
Figure 10 can also help in predicting the improved well productivity if wellbore clean up and skin removal is attempted. A mare reduction of equivalent skin from 4 to 0.5 would result in permeability enhancement from 0.01 to 0.06 mD, which would result in gas productivity enhancement from 700 McF/day to nearly 3700 McF/day in the case of a non-turbulent situation and if turbulence is factored, the well’s productivity can be raised from 700 McF/day to nearly 1700 McF/day. These findings are consistent with the findings reported by Bin et al. [
22] and Yuan et al. [
23].
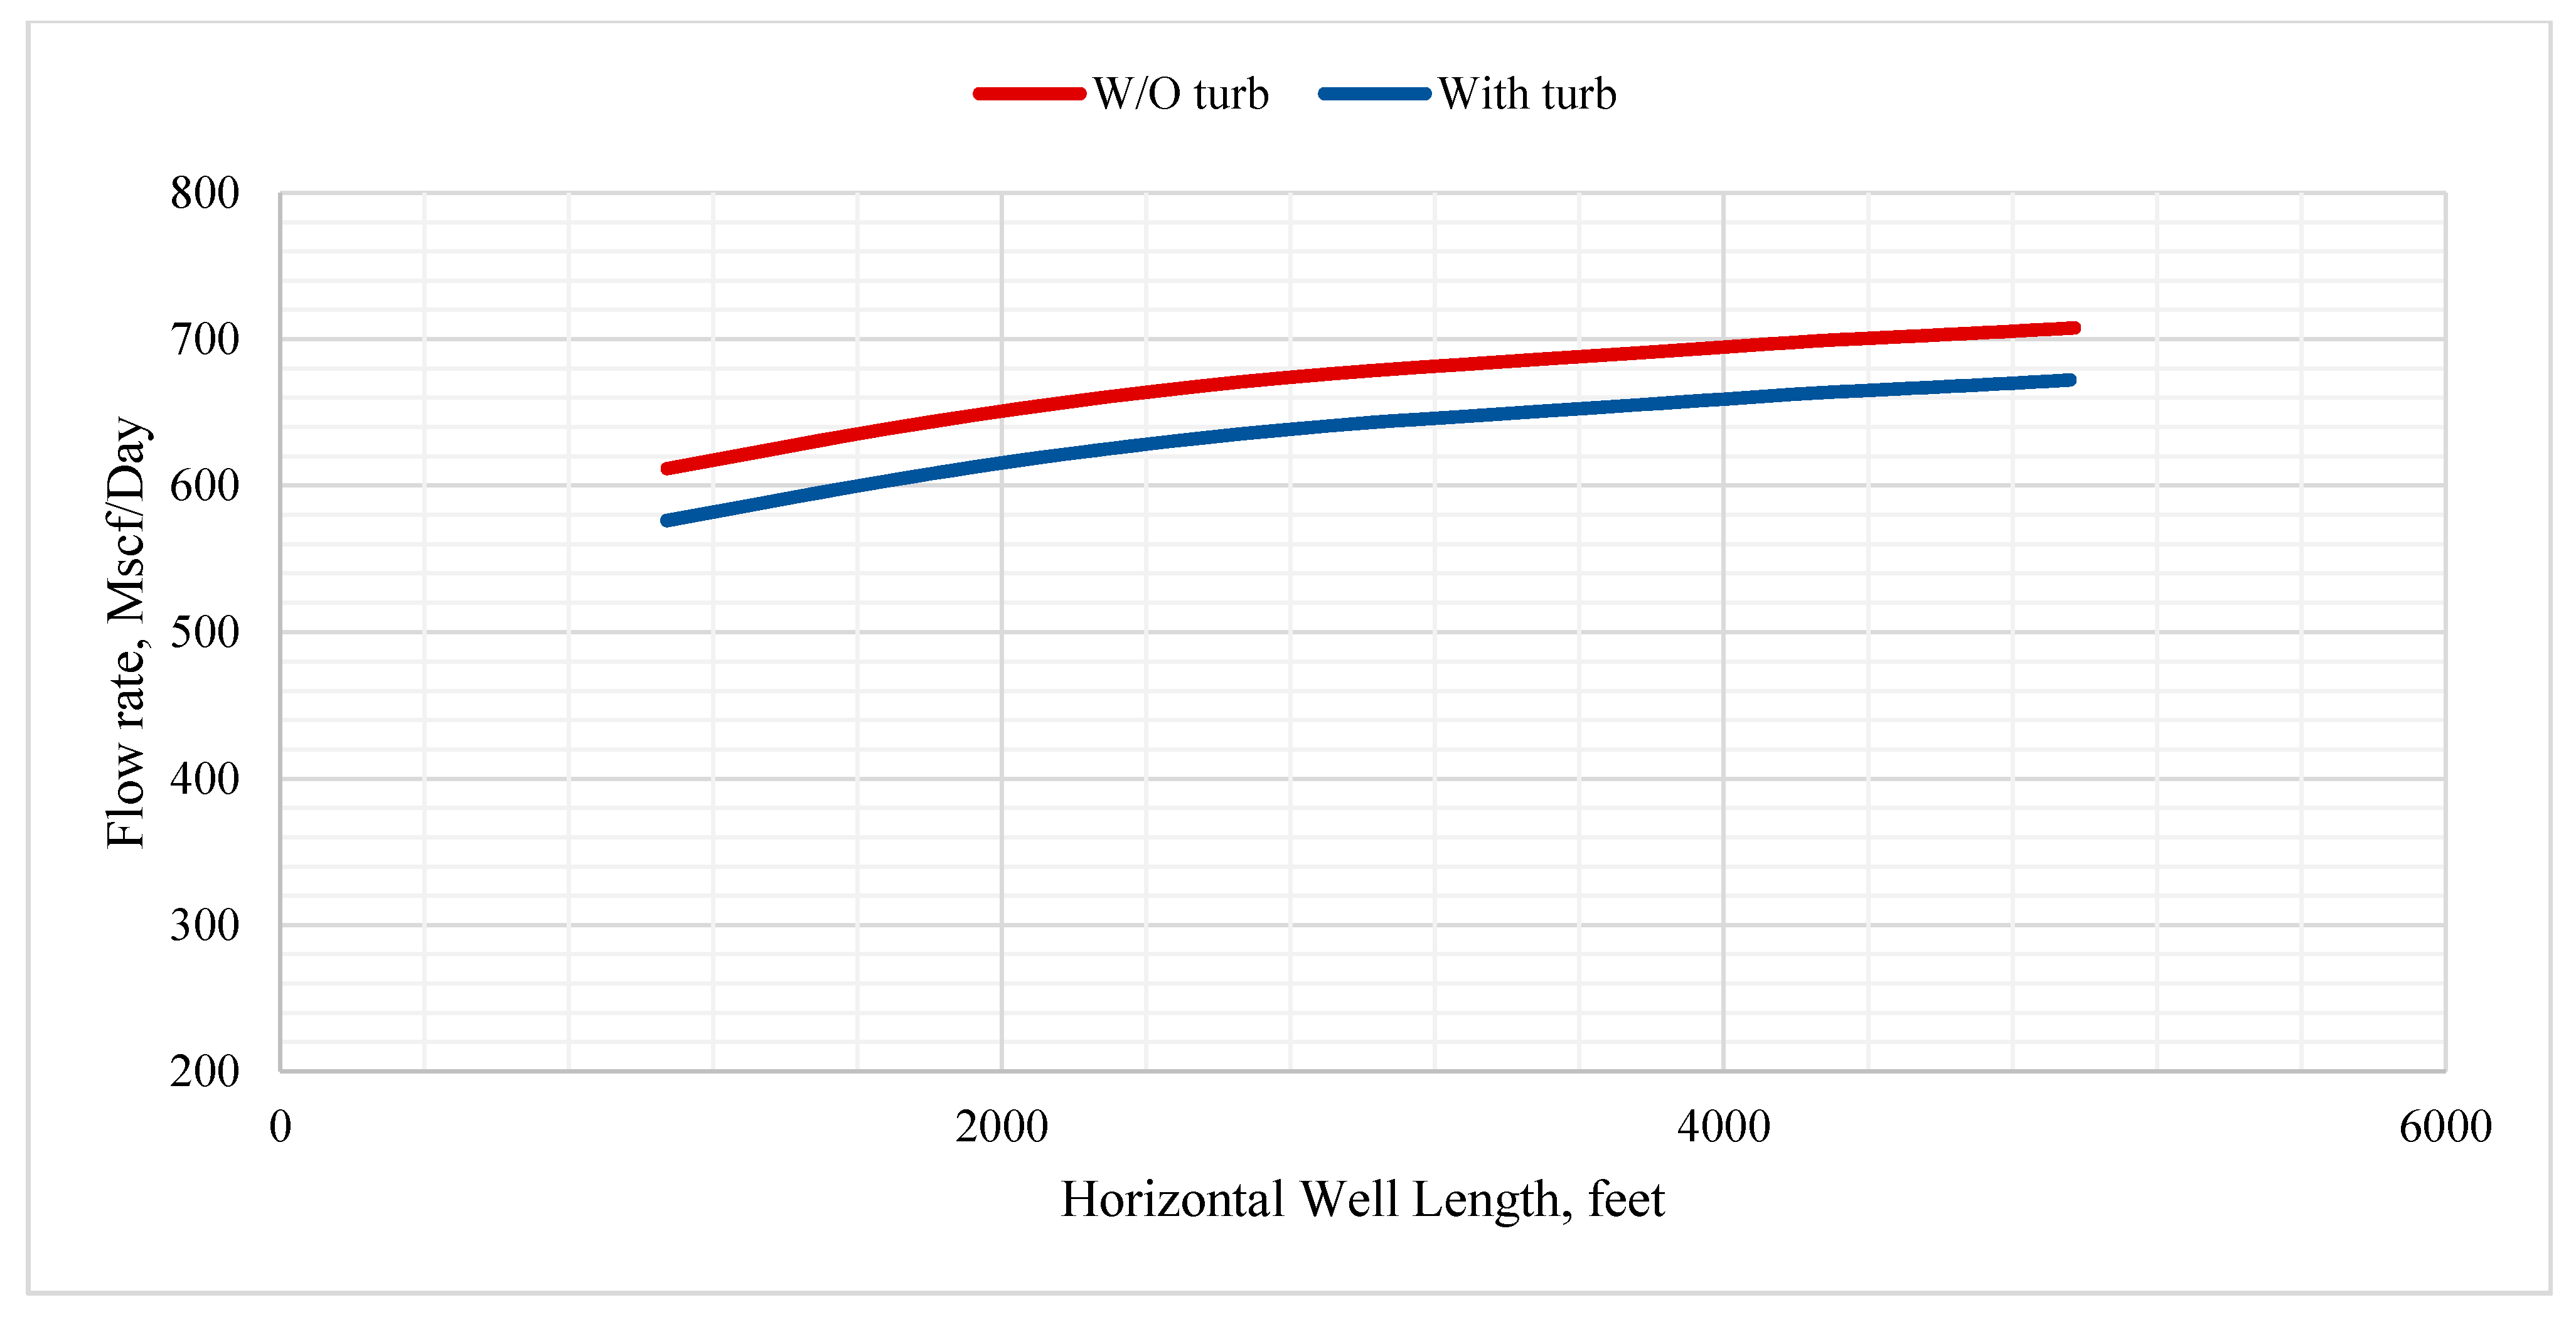
Figure 10 shows the plot of the gas flow rate versus horizontal well length. Under the cases examined within these scenarios, an associated increase in flow rate is observed in the presence and absence of turbulence with respect to changes in horizontal well length. As anticipated, the flow rate without any turbulence is slightly higher than the flow rate with turbulence present. However, significant observation and serious decision-making criteria could be derived from this plot. The model outcome shows that by increasing the length of the horizontal well in a tight gas field from 1000 to 5000 ft, only 70–80 Mscf/Day additional gas production could be achieved, which may not permit the economics of drilling, completion, and maintenance of the well.
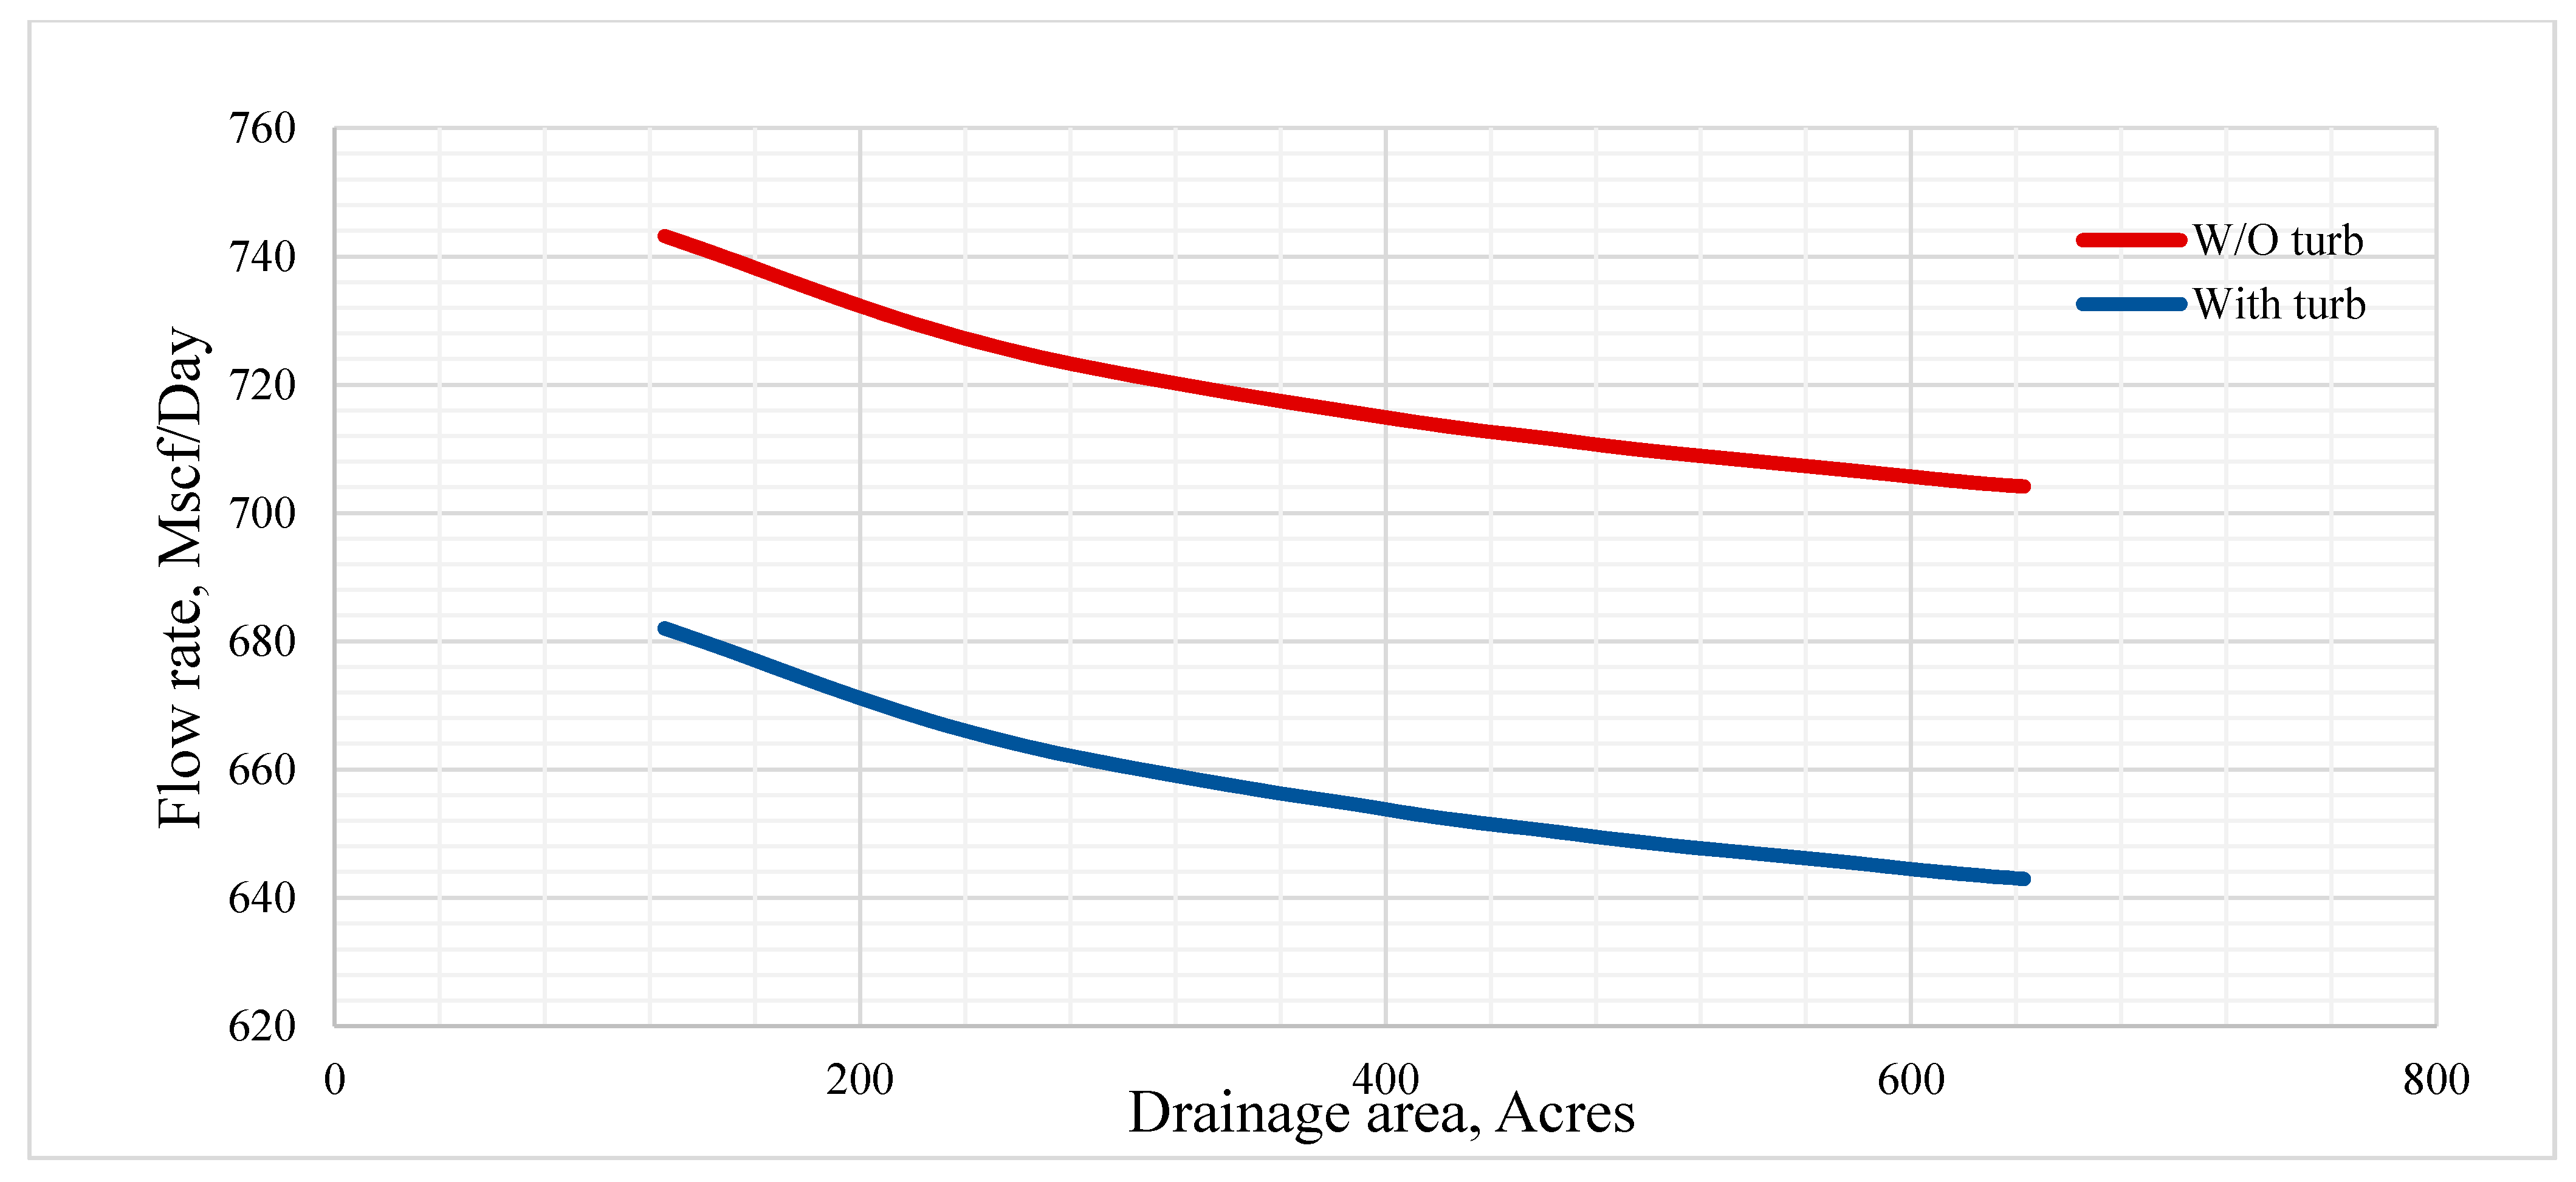
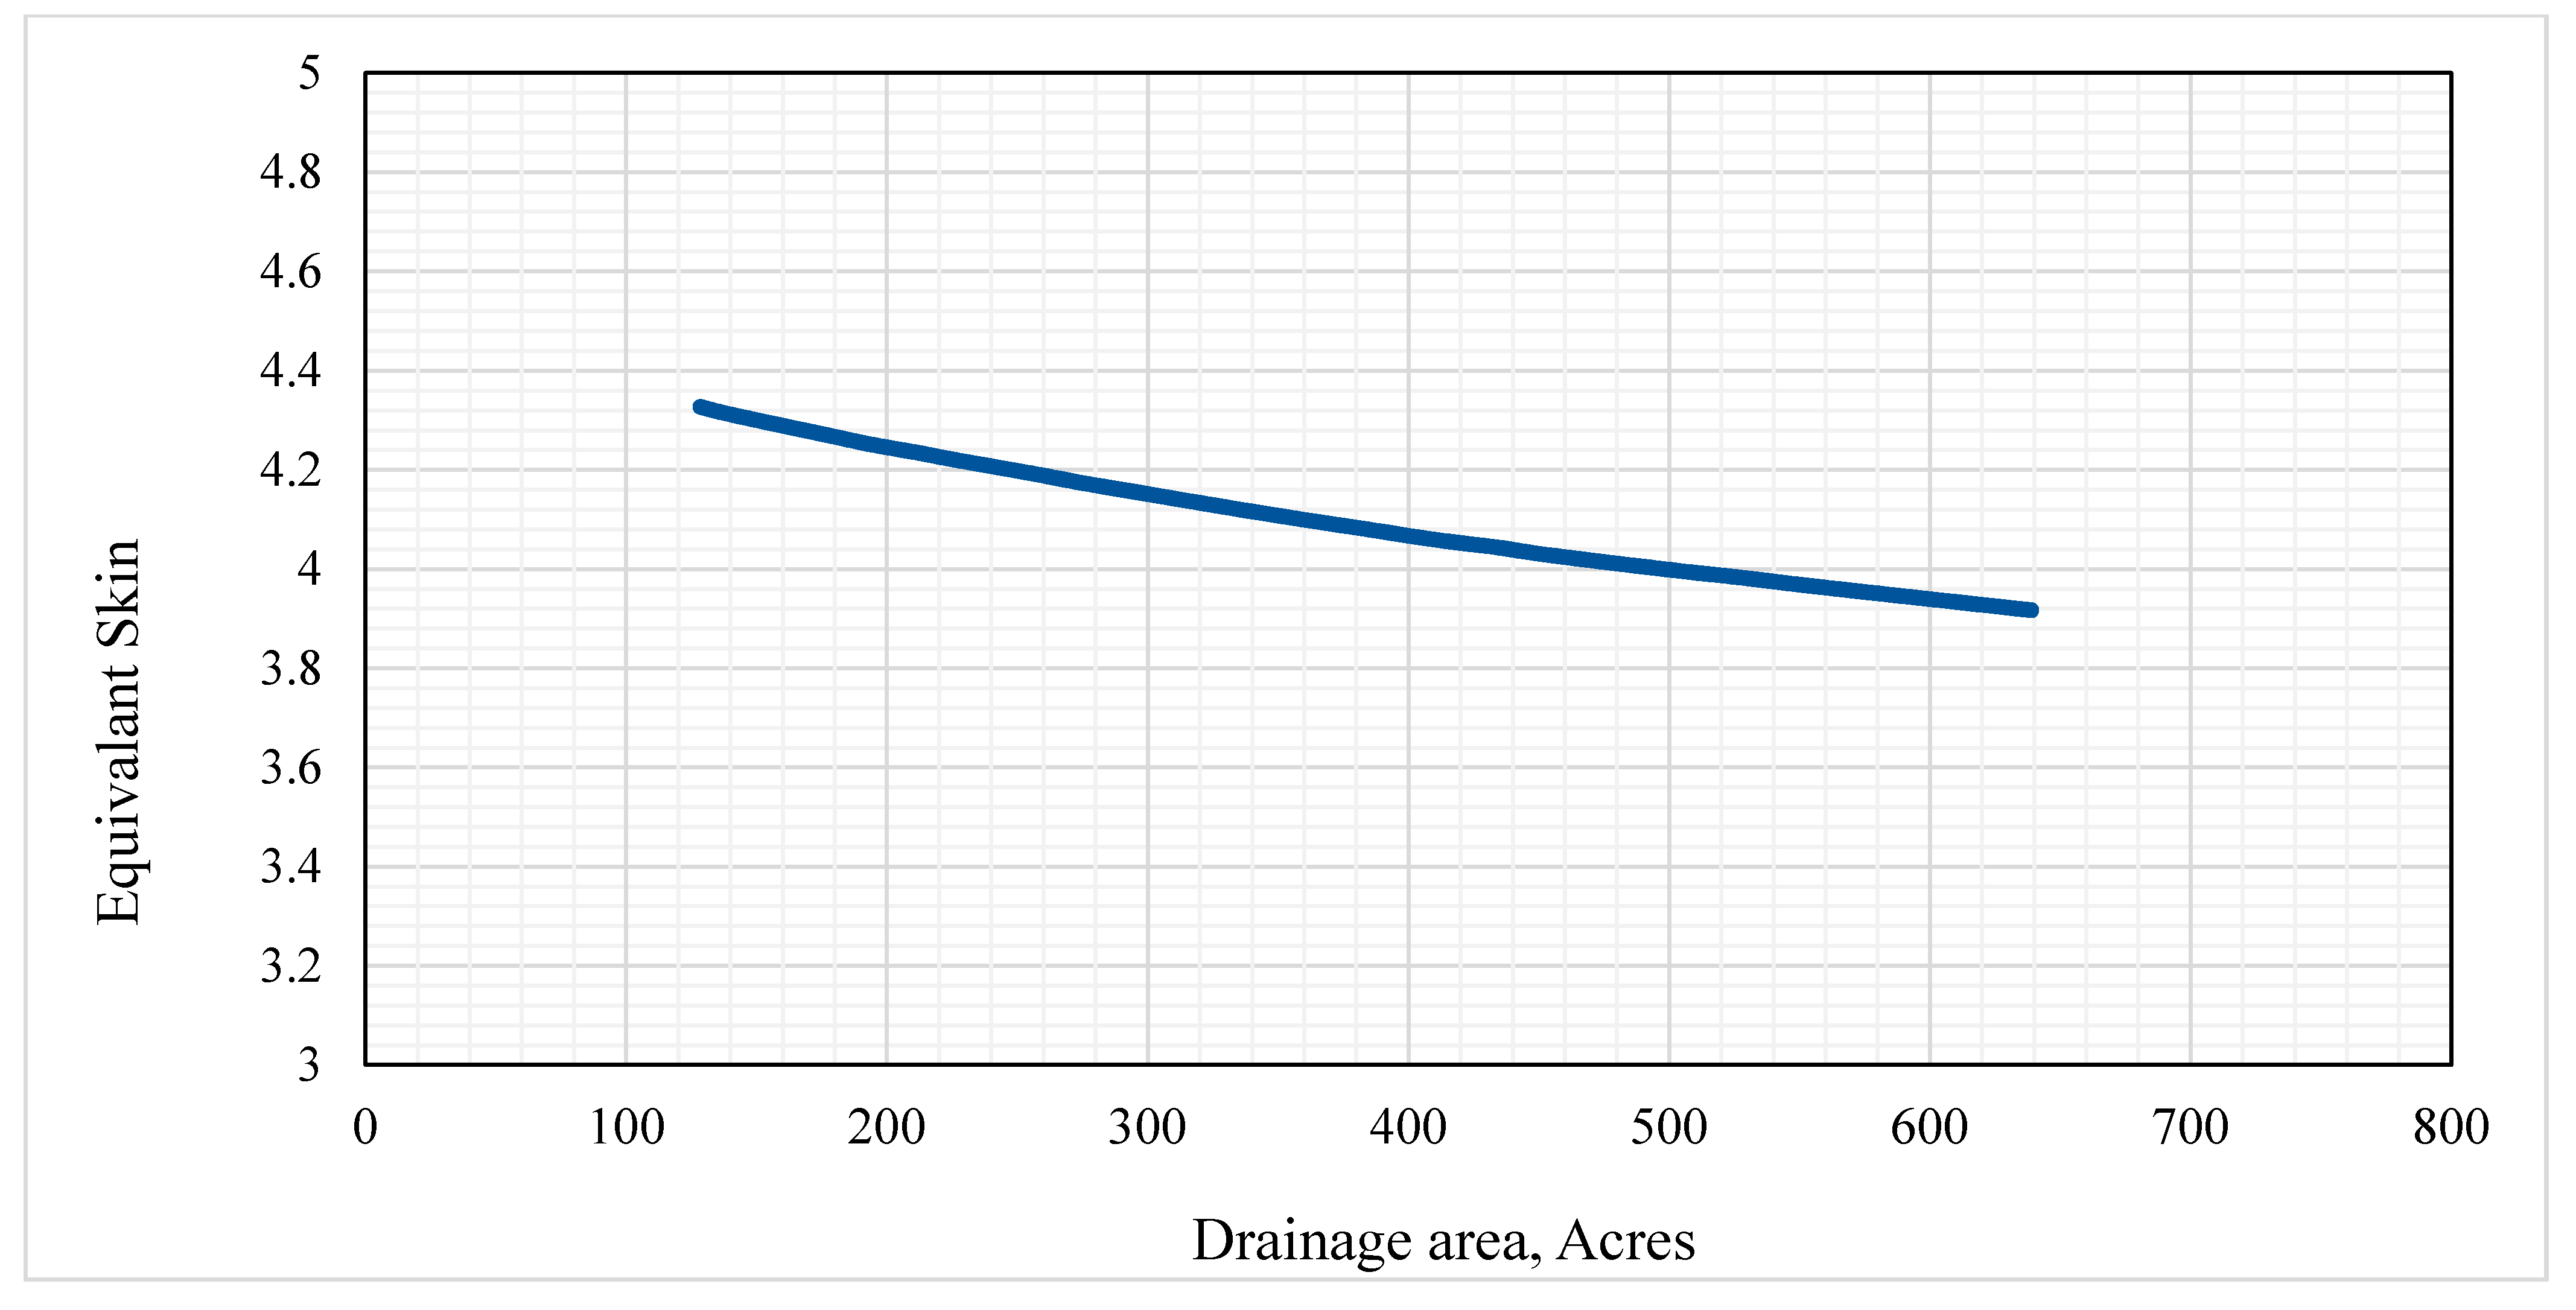
Figure 11 shows the effect of the drainage area of the well on the equivalent skin. A comparative decrease in equivalent skin is noted as the drainage area increases. On the contrary,
Figure 12, which represents the model outcome of the drainage area on gas flow rate, shows that flow rate reduces if a larger drainage area is permitted. Though the trend is very similar, well production is significantly less when turbulence is considered in productivity calculation (influence of non-Darcy flow). These plots show that factoring in the turbulence effect would help in realistic production forecasting as well as optimizing well placement to meet the project economics.
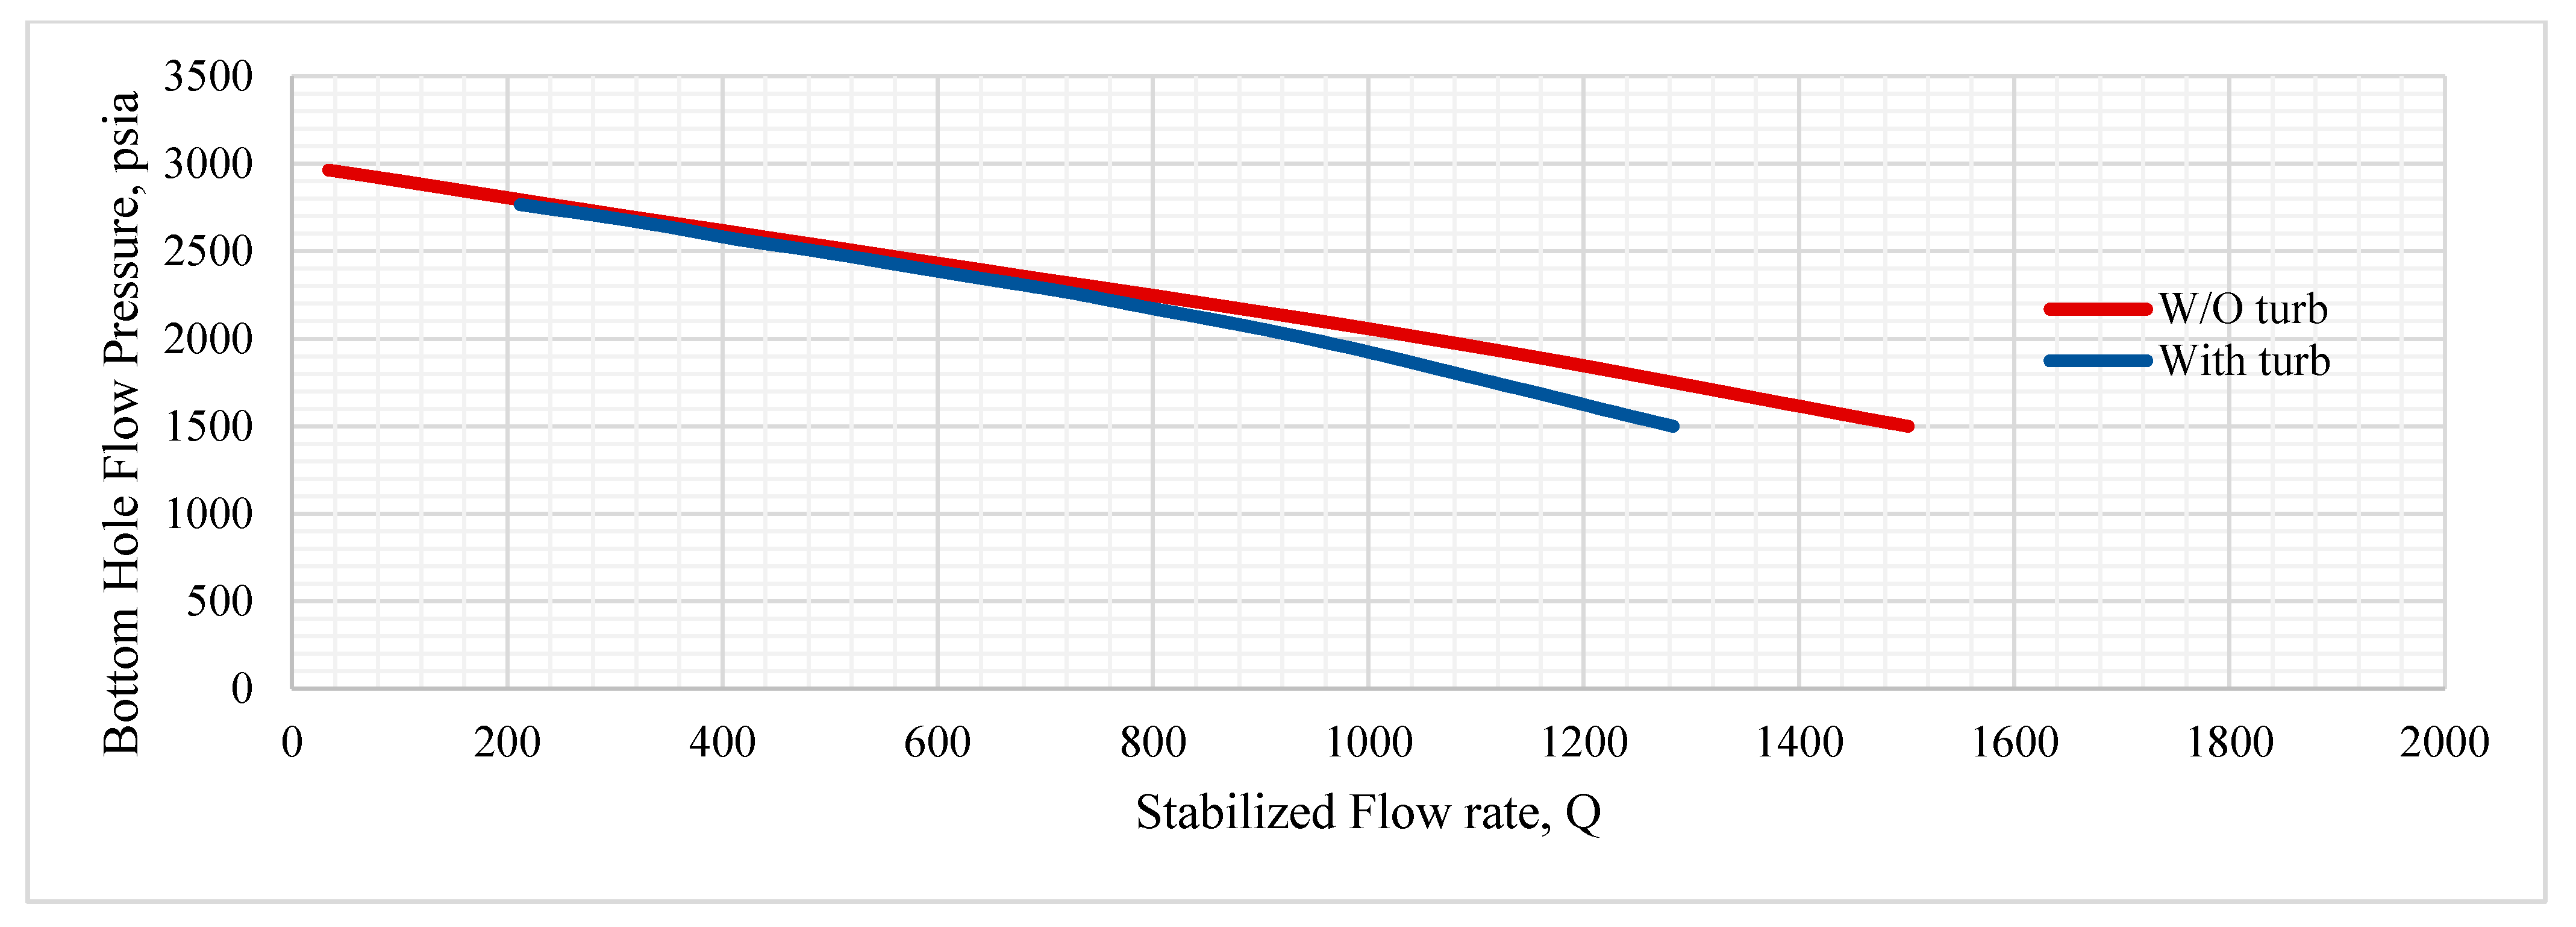
The above observation is supported by the inflow performance curves presented in
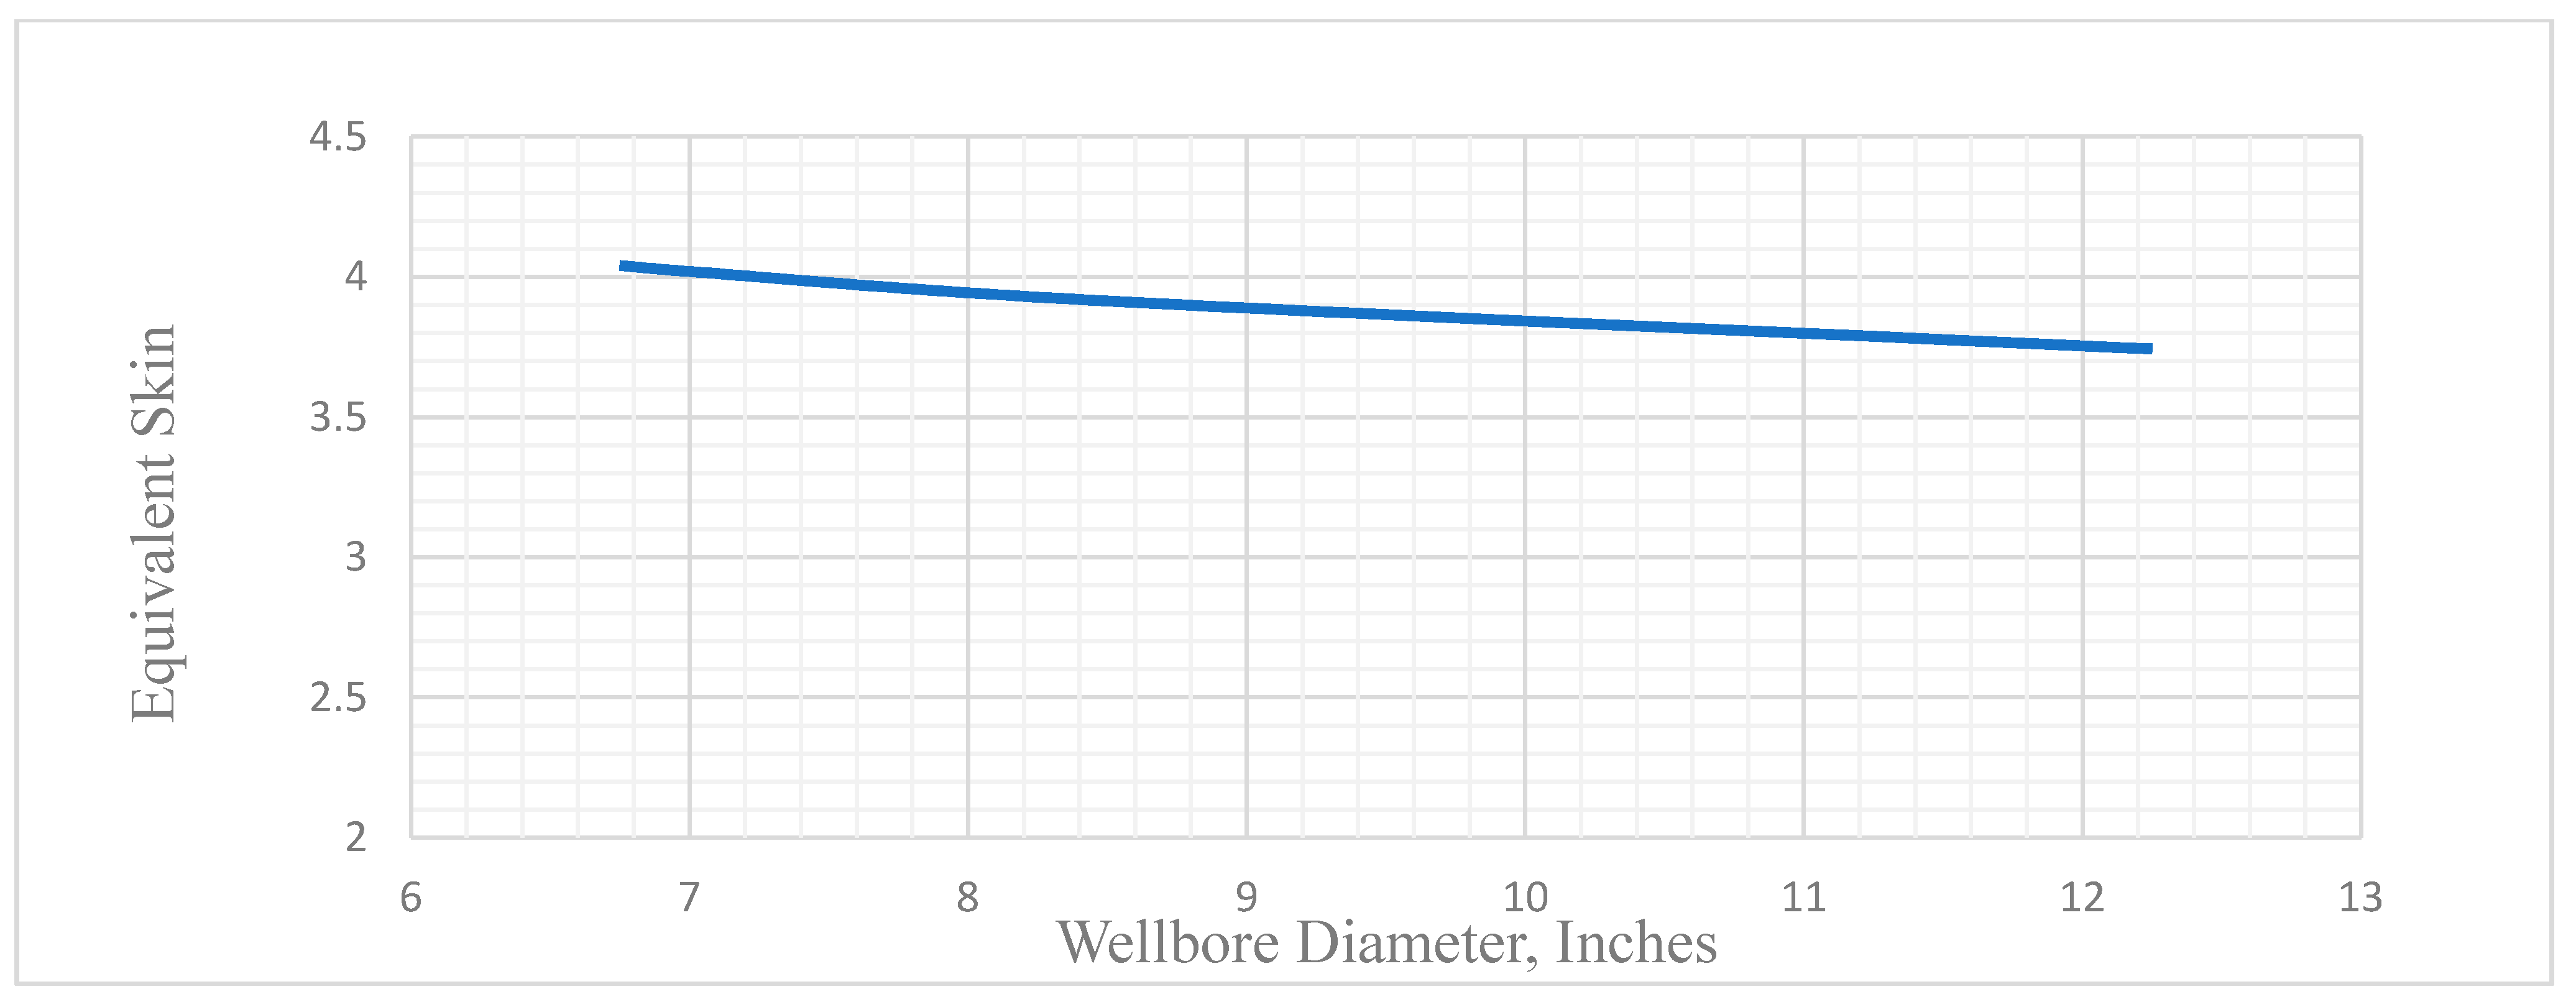
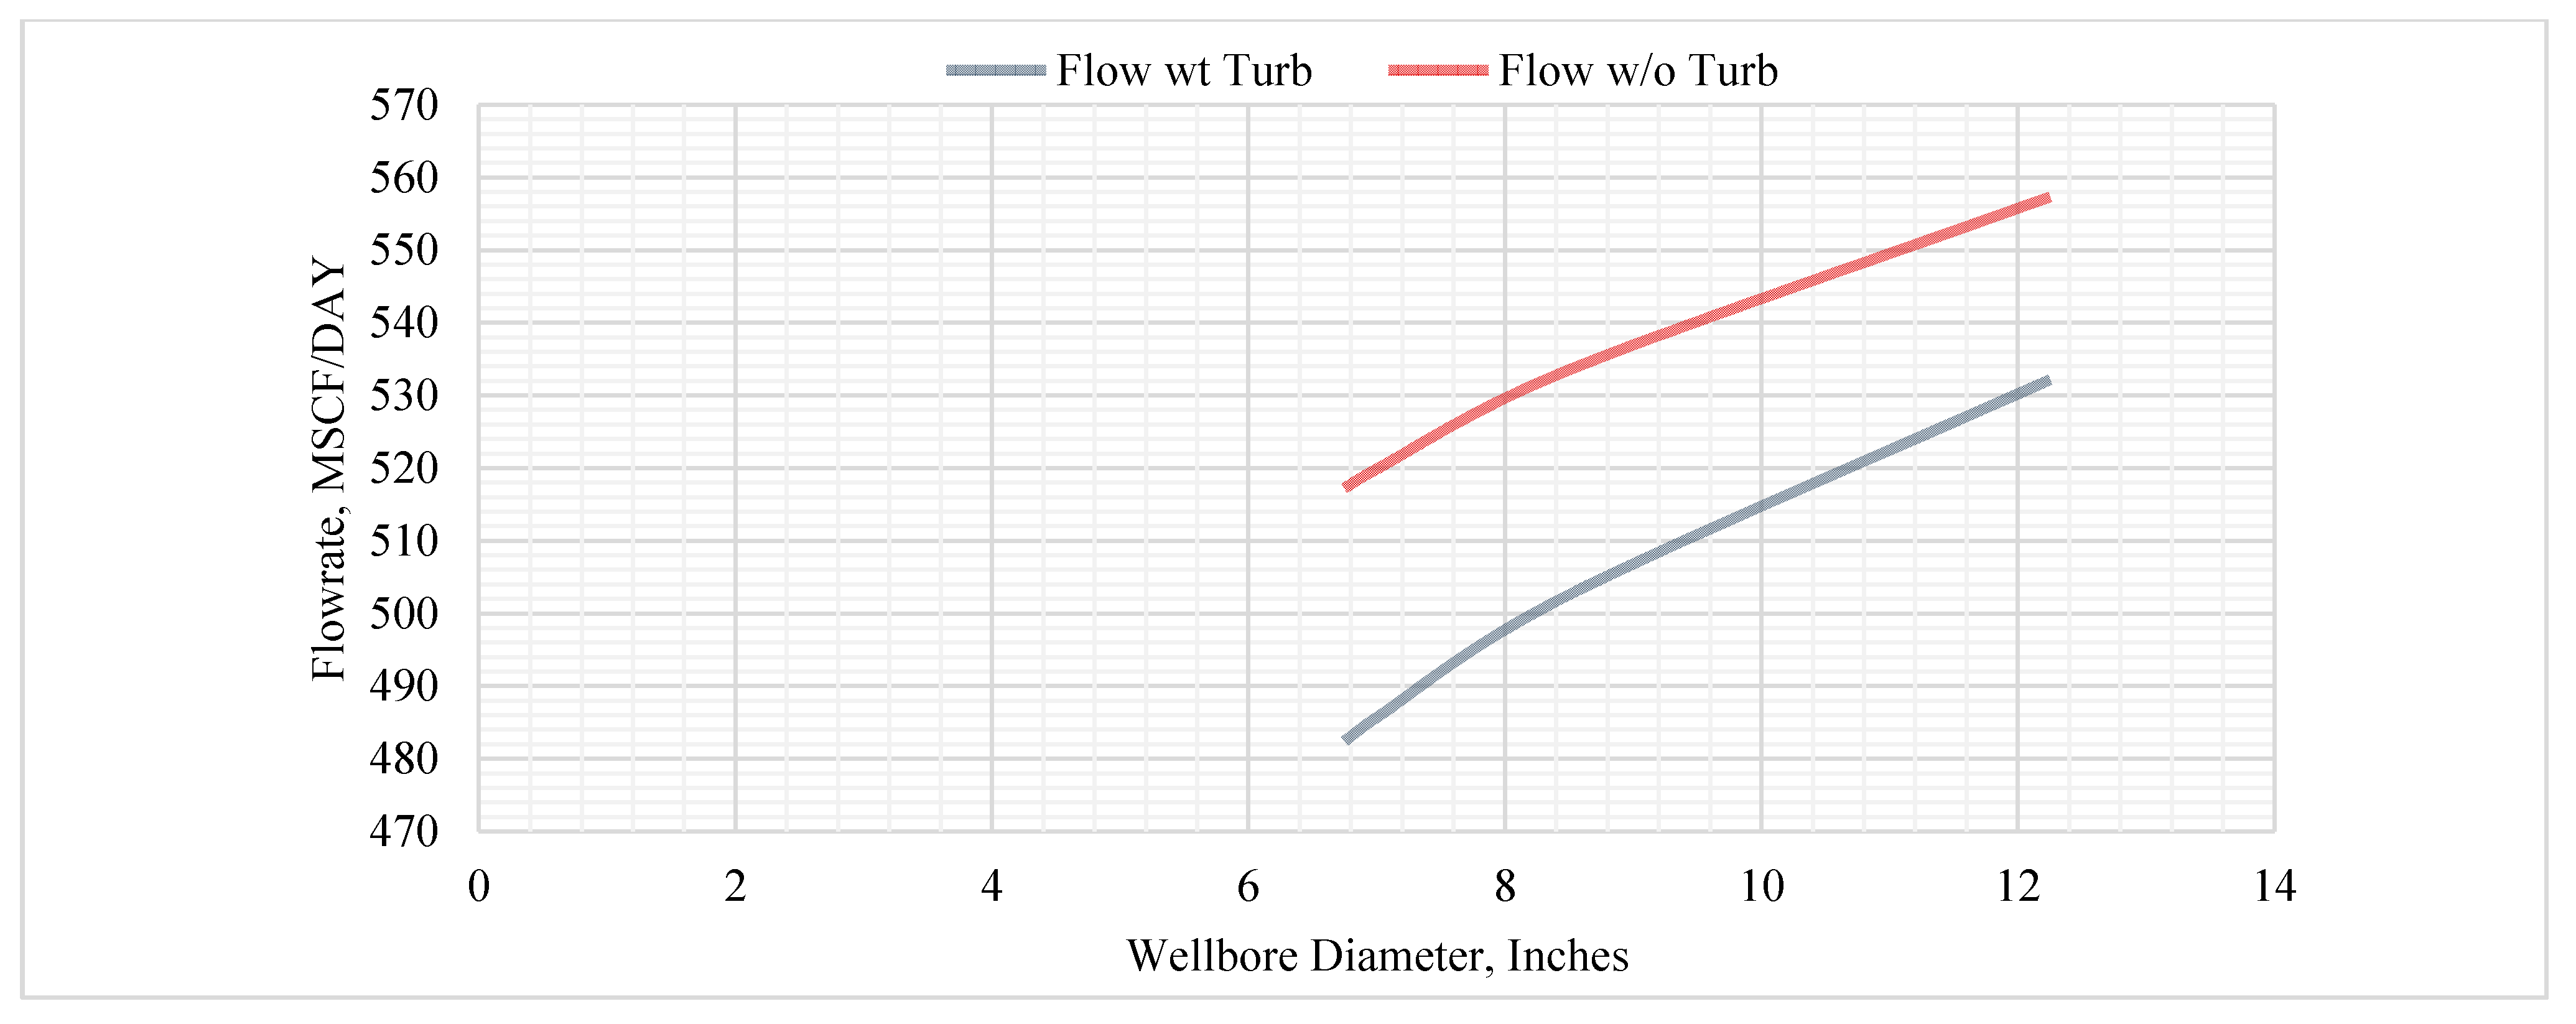
Figure 13, considering flow with and without turbulence. Under the cases examined within the given scenario, it could be seen that at high bottom-hole pressure, the impact of turbulence is minimum; however, at low bottom hole pressure, there could be a significant difference in well productivity, thus providing a more realistic forecasting tool. Finally, we used the model to investigate the impact of wellbore diameter on equivalent skin (
Figure 14) and well flow rate (
Figure 15). It is evident from
Figure 14 and
Figure 15 that by doubling the wellbore diameter, the equivalent skin could be reduced marginally (about 7%), and the production rate can be improved by about 7% if no turbulence effect is considered and about 9% if the turbulence effect is considered. This nominal increase may not permit the economics of drilling a larger diameter hole.
The above results show that the improved analytical model considering non-uniform flow and the effect of turbulence in a tight gas field can save from over-estimation of well productivity. The model outcome is in accordance with Adesina et al. [
24], who has shown that when frictional pressure losses are considered, the actual production would be significantly less compared to the prediction made from Joshi’s model. The present model can also be a helpful tool in optimization of horizontal length, wellbore diameter, and well distance, and cost benefits of post-drilling wellbore cleanup operations.
4. Conclusions
This work presents a modified horizontal gas well productivity equation by modifying the mechanical skin factor to account for non-uniform mechanical damage along with the evaluation of the turbulence effect in the near-wellbore region for tight gas reservoirs. The productivity model is applied to a case study involving the development of a tight gas field with horizontal wells. The influence of the horizontal well length, damaged zone permeability, drainage area, reservoir thickness, and wellbore diameter on the calculated equivalent skin (of a non-uniform skin distribution) and the flow rate (with turbulence and no turbulence) are investigated. The key conclusions are as follows:
A model equation is developed for tight gas reservoirs that modifies the horizontal gas well productivity equation proposed by Joshi.
The model incorporated the mechanical skin factor to account for non-uniform skin damage as well as near-wellbore turbulence effect in horizontal gas wells.
The multi-segment horizontal well approach was used to develop the local skin factors for each segment and estimated the equivalent skin factors subjected to non-uniform damage drilled in oil reservoirs.
The equivalent skin factor of the segmented horizontal well was estimated by equating the total production from the entire horizontal well to the sum of the flow from individual segmented damaged zones along the well length. Conical and horn-shaped damage profiles were used to develop the equivalent skin in the horizontal well productivity equation.
Application of the above equation on a proposed horizontal gas well in a tight reservoir was made on the influence of the horizontal well length, damaged zone permeability, drainage area, reservoir thickness, and wellbore diameter on the calculated equivalent skin factor and the flow rate showed that equivalent skin factor increases with an increase in horizontal well length and decreases with an increase in the drainage area.
The results obtained from this investigation show a significant potential to assist in making practical decisions on the favorable parameters for the success of the field development in terms of equivalent skin factor, flow rate, and inflow performance relationships (IPR); however, it is important to validate the model based on real field data.
Future work and recommendations:
Validation of the above model needs segmented well test data. The local operator was contacted and suggested to perform segmented well tests in tight gas reservoirs.
Suggestions are made to test the well for flow rate and pressure, segmenting the horizontal section based on saturation and porosity logs.
Suggestions are also made to place high-sensitive optical fiber-based DTS (differential thermal sensors) during well completion to measure temperature difference within segments, which would indicate gas flow rate at different segments.
The above data once generated will be used for validating the model, in particular in investigating the non-uniform damage effect and turbulence effect.


