Next Article in Journal
Real-Time Fault Detection to Ensure the Safe Operation of the Single-Phase Five-Level VIENNA Rectifier
Next Article in Special Issue
Short-Term Electricity Prices Forecasting Using Functional Time Series Analysis
Previous Article in Journal
Increasing the Biogas Potential of Rapeseed Straw Using Pulsed Electric Field Pre-Treatment
Previous Article in Special Issue
Demonstration of Blockchain Based Peer to Peer Energy Trading System with Real-Life Used PHEV and HEMS Charge Control
 
 
Order Article Reprints
Article

Bidding Agents for PV and Electric Vehicle-Owning Users in the Electricity P2P Trading Market

1
School of Engineering, The University of Tokyo, Tokyo 113-8656, Japan
2
The Kansai Electric Power Co., Inc., Osaka 530-8270, Japan
3
Nihon Unisys, Ltd., Tokyo 135-8560, Japan
*
Author to whom correspondence should be addressed.
Energies 2021, 14(24), 8309; https://doi.org/10.3390/en14248309
Received: 20 October 2021 / Revised: 26 November 2021 / Accepted: 30 November 2021 / Published: 9 December 2021
(This article belongs to the Special Issue Forecasting and Risk Management Techniques for Electricity Markets)

Abstract

:
As the world strives to decarbonize, the effective use of renewable energy has become an important issue, and P2P power trading is expected to unlock the value of renewable energy and encourage its adoption by enabling power trading based on user needs and user assets. In this study, we constructed a bidding agent that optimizes bids based on electricity demand and generation forecasts, user preferences for renewable energy (renewable energy-oriented or economically oriented), and owned assets in a P2P electricity trading market, and automatically performs electricity trading. The agent algorithm was used to evaluate the differences in trading content between different asset holdings and preferences by performing power sharing in a real scale environment. The demonstration experiments show that: EV-owning and economy-oriented users can trade more favorably in the market with a lower average execution price than non-EV-owning users; forecasting enables economy-enhancing moves to store nighttime electricity in batteries in advance in anticipation of future power generation and market prices; EV-owning and renewable energy-oriented users can trade more favorably in the market with other users. EV-owning and renewable energy-oriented users can achieve higher RE ratios at a cost of about +1 yen/kWh compared to other users. By actually issuing charging and discharging commands to the EV and controlling the charging and discharging, the agent can control the actual use of electricity according to the user’s preferences.

1. Introduction

1.1. Background

The current electricity network is undergoing a major transformation with the introduction of renewable energy. The European Union (EU) has set a goal to increase the share of renewable energy to at least 32% by 2030 and to reduce greenhouse gas emissions by 40% compared to 1990 levels [1,2]. However, in order to increase the proportion of power sources that are decentralized and whose output is affected by weather conditions, such as renewable energy, a mechanism is needed to ensure that supply and demand are coordinated to make effective use of renewable energy. In this context, there is a growing need for supply and demand adjustment and energy storage through distributed power networks in order to cope with decentralized power sources.
In particular, peer-to-peer (P2P) energy trading is expected to be a promising model for the future power system, which consists of energy buyers, sellers, and their matching mechanisms, and is expected to enable users to match each other’s needs. P2P transactions are expected to enable matching according to the needs of users, and have been the subject of extensive research in recent years [3]. The significance of P2P trading is that it allows consumers, who are passive in the existing system, to trade while taking into account prices and their own preferences. As a result, when power generation is low and the price of electricity is high, consumers are expected to move their use of electricity to other times of the day or discharge electricity from storage batteries, and when the price is low, they are expected to store electricity or run heat pumps. Through these actions, the uncertainty of renewable energy generation is expected to be absorbed by the demand side by shifting their own demand as much as possible through prices and by using storage facilities. This will contribute to improving the balance of supply and demand, not at the micro level of frequency adjustment, but at the macro level of shifting demand and storing electricity.

1.2. Related Work

The forms of P2P transactions can be broadly classified into three categories: full P2P markets, community-based markets, and hybrid P2P markets [4]. In the full P2P market, peers negotiate directly with each other in order to buy and sell electric energy. An example of this is the study of bilateral method matching [5,6]. A relaxed consensus + innovation (RCI) approach in P2P market structure based on the multi-bilateral economic dispatch (MBED) method [6] has been proposed. It was shown that the MBED approach can effectively produce optimal market outcomes in terms of maximizing social welfare while respecting consumer preferences. In these studies of full P2P markets, the challenge is to reduce communication as peers interact with each other. Community-based markets are more structured, with a community manager to manage trading activities within the community and an intermediary between the community and the rest of the world. Mengelkamp et al. showed that both buyers and sellers of energy can benefit from P2P trading by harnessing excess renewable energy in the Brooklyn Microgrid experiment and reaching mutually satisfactory prices and quantities [7]. Another example showed that P2P markets can balance the local energy supply and demand and reduce energy transmission losses [8]. Hybrid P2P markets are proposed as a hybrid of full P2P markets and community-based markets, where transactions between peers are hierarchically defined in a model. An example is a study that aims to minimize the overall energy cost and the loss of P2P energy sharing in a distribution network consisting of multiple MGs [9].
P2P energy trading has been studied not only from the perspective of efficiency, but also from the perspective of fulfilling user preferences. While the increase in willingness to pay (WTP) for renewable energy has been reported in various countries [10,11,12,13], not everyone necessarily has the same WTP, and there is a need to realize transactions that meet the needs of individual users, and there are expectations for P2P transactions to meet these needs.
One study of the user preference perspective is [14], in which the authors proposed a P2P market based on multi-class energy management that respects user preferences and assumes that individual users work to maximize overall utility, rather than to maximize their own profit or utility. There are also studies that consider preferences for renewable energy within a community [15,16], but they have practical issues in that they are not optimized based on predictions of electricity demand and generation. To make effective use of the fluctuating output of renewable energies, an approach of sequential optimization while predicting the output of power generation and the power demand of consumers is necessary, and thus research on optimization based on prediction is needed.
In addition, in order to satisfy the needs of users, individual users themselves may utilize storage batteries, electric vehicles, and other energy storage equipment, as well as electric water heaters and other equipment that can shift demand. By conducting P2P energy transactions while optimizing the operation of such equipment according to the economic perspective and personal preferences of individual users, the system as a whole is expected to absorb the uncertainty of renewable energy and make more effective use of renewable energy. Kobashi et al. conducted a techno-economic analysis of an urban-scale energy system with rooftop solar PV, batteries, and electric vehicles, and showed that rooftop solar PV could be popularized at a significantly lower cost by actively introducing electric vehicles and using electric vehicles as energy storage devices [17]. In addition to improving the economics, these facilities could also be used to increase the percentage of renewable energy. The system itself, which assumes consumers who own storage batteries and electric vehicles automatically trade electricity, has already been proposed as previously introduced, and research on bidding strategies for aggregators who bundle peers [18,19,20,21] can be cited. However, all of them aim at maximizing profits for the entire community, and not for individuals to maximize their own profits or satisfy their own preferences. Therefore, bidding for satisfaction of individual preferences is not taken into account. This study differs from existing studies in this respect, as it gives bidding strategies for individuals to trade while taking their own preferences into account as they aim to maximize their own profits through market principles. In addition, although the studies in [19,20] take user preferences into account, the user preferences there are like the “departure SoC” for EV usage. These studies do not optimize bids with the goal of satisfying individual consumers’ preferences for renewable energy usage. In contexts other than P2P electricity trading, although there are studies [22] that reveal the economic benefits of owning EVs by optimizing EV battery operation, they do not consider the needs of users other than economic benefits.

1.3. Contribution

In this research, we adopt an electricity P2P trading market where consumers and generators trade with each other and develop an agent system that automatically trades electricity on behalf of users in the market. The system not only makes bids based on the user’s assets, such as electric vehicles and solar power generators, and the user’s demand for electricity, but also makes bids based on the user’s preferences for renewable energy, enabling the trading of electricity according to the circumstances of the individual user. There are two major novelties in our research.
Individuals optimize their bidding by using energy storage facilities in order to maximize profits and satisfy their own preferences for renewable energy.
By developing a bidding strategy that considers the individual’s preference for renewable energy, we have achieved both economic efficiency and satisfaction of the individual’s preference for renewable energy.
The agent system is used to conduct a demonstration experiment of P2P electricity trading. This agent system not only bids on the electricity market, but also plays a role in optimizing the use of electricity by users by controlling the charging and discharging of electric vehicles based on the results of bid execution. This research is also unique in that the P2P power market and its surrounding systems work together with physical objects such as electric vehicles. There are only a few studies on this topic. Through demonstration experiments, this study shows that this agent system and the P2P electricity market mechanism enable the effective use of electricity through the use of assets such as electric vehicles, while taking into account users’ costs and preferences regarding renewable energy.

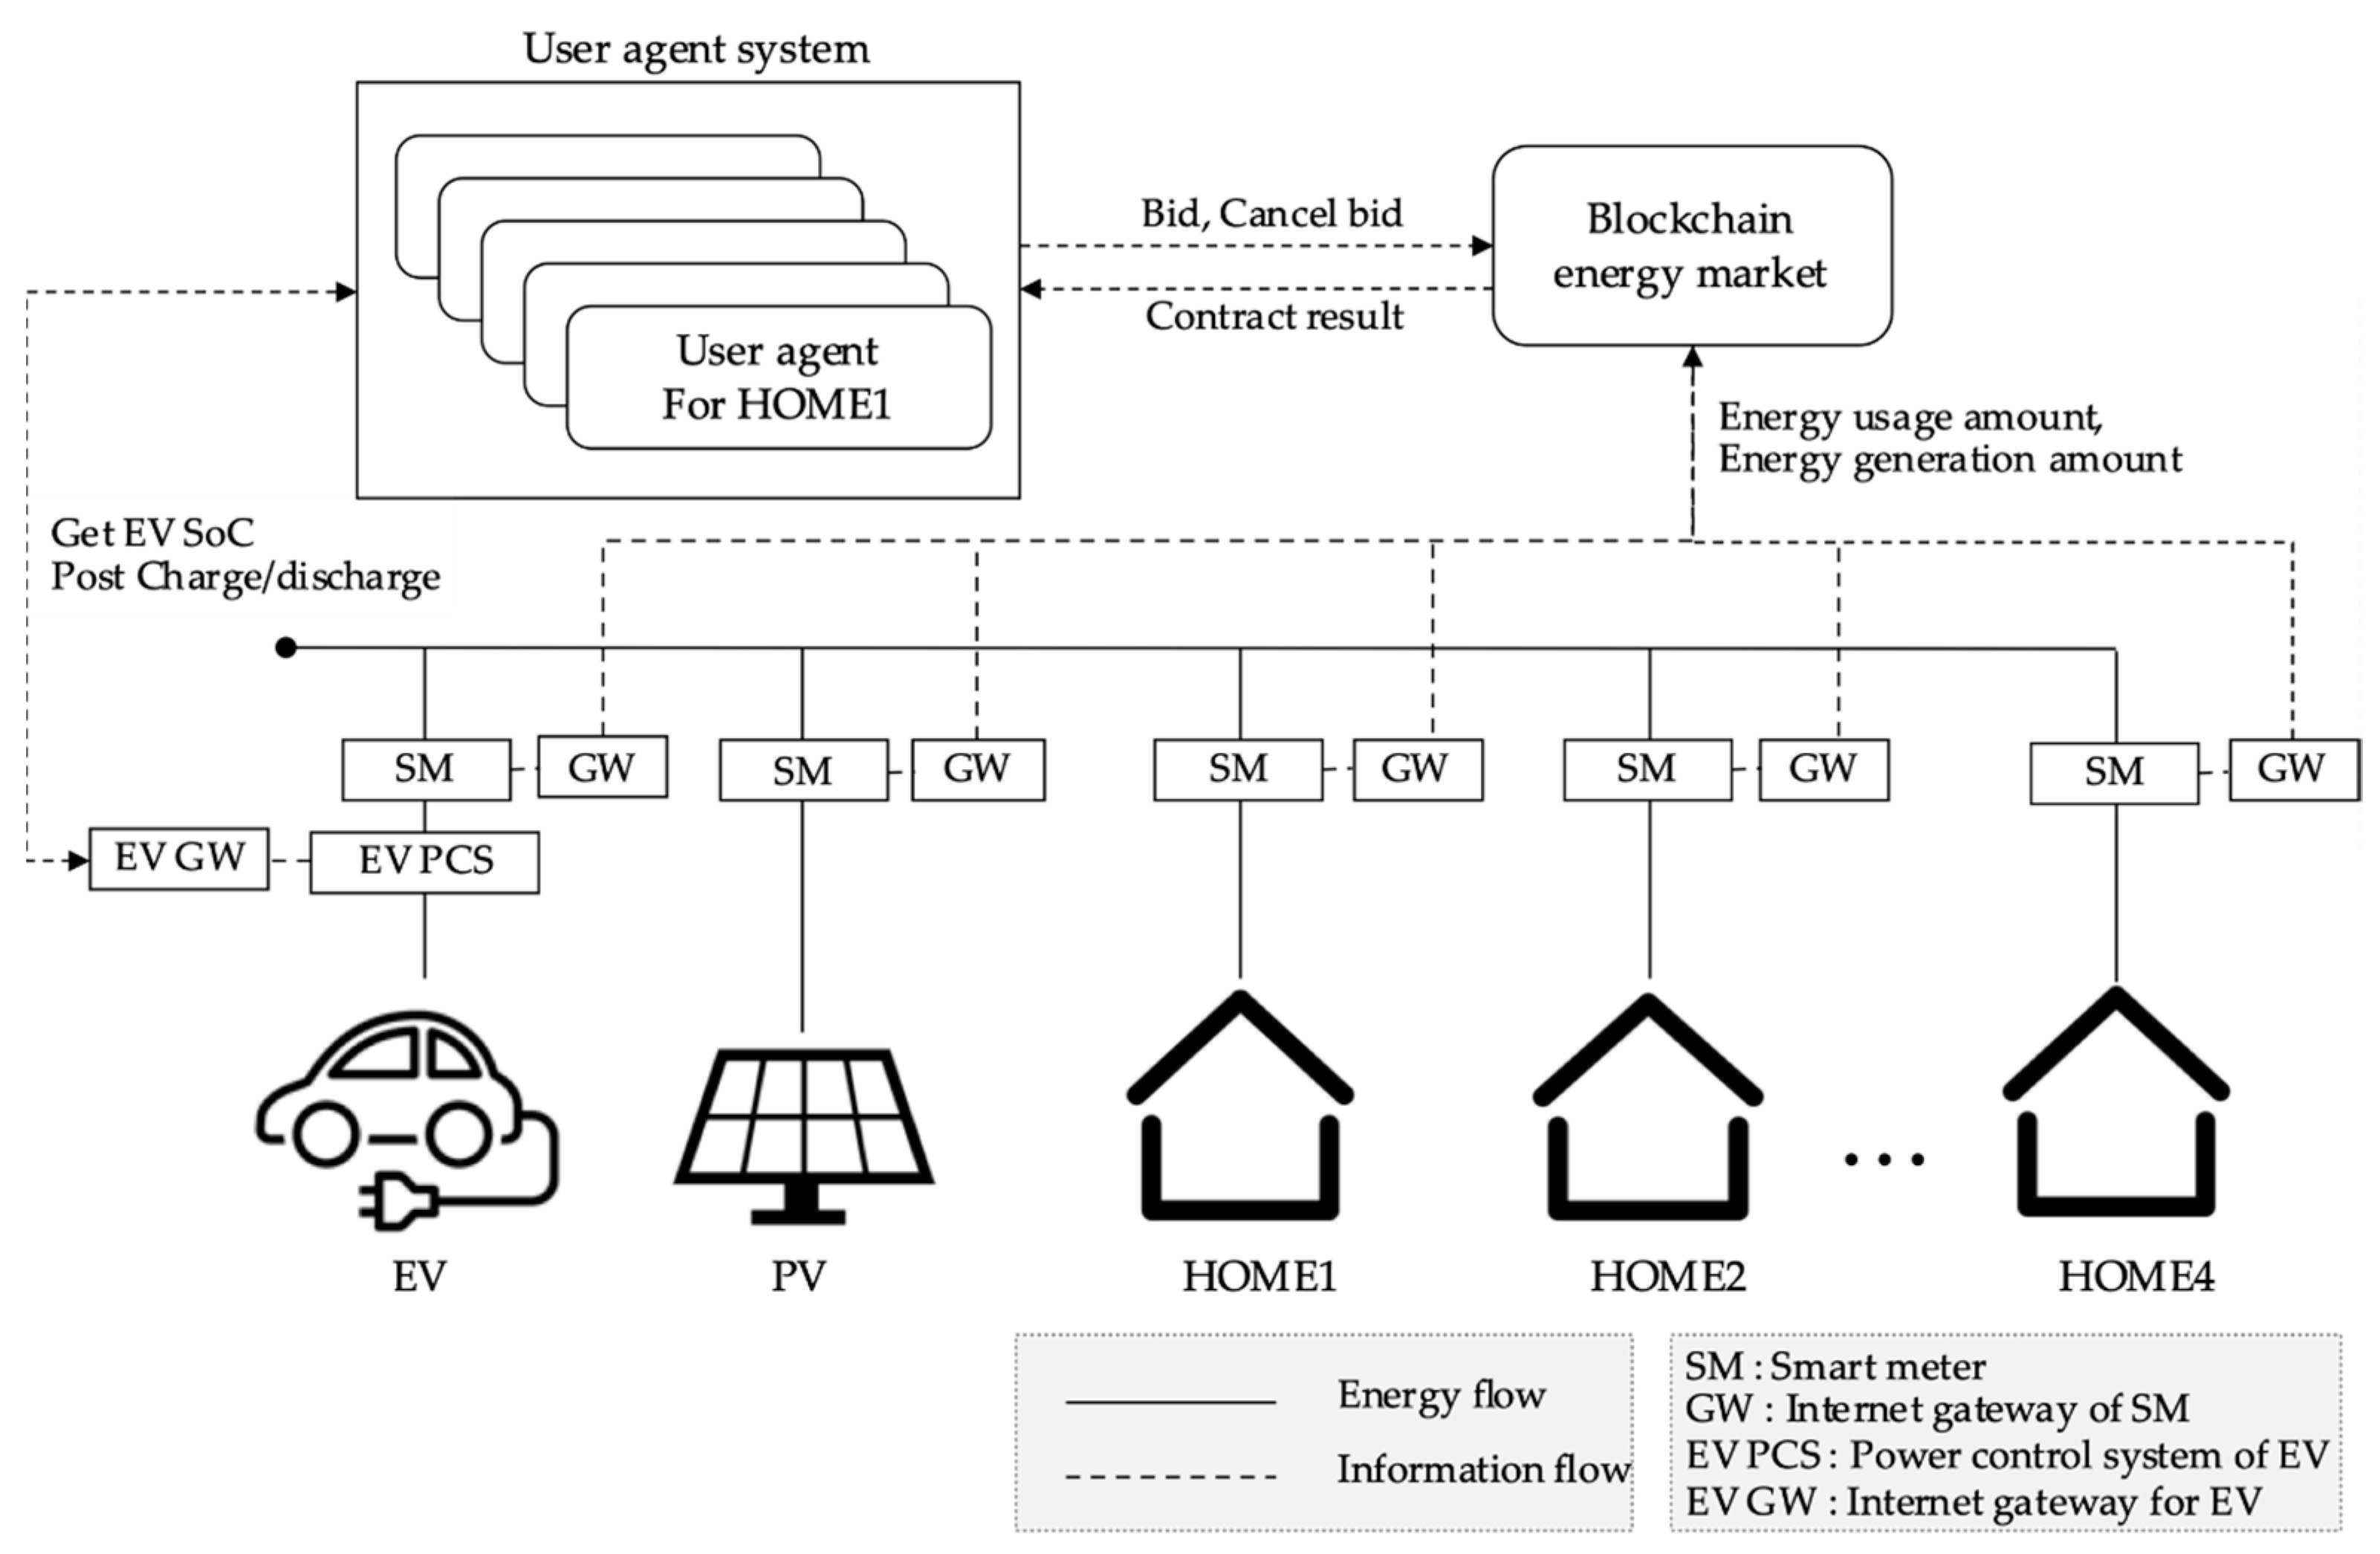
2. Overall Picture of the Demonstration Experiment

Figure 1 shows the overall picture of the demonstration experiment. User agents bid into the blockchain market on behalf of consumers and generators. Each user agent represents a household and conducts electricity transactions according to its preferences and the availability of EVs. In this experiment, user agents interact with each other through a retail power provider. User agents can also purchase electricity from the retail power provider. The blockchain market is implemented using Ethereum smart contracts to process the bids of user agents. The actual demand and power generation are also sent from the smart meter to the blockchain through an Internet gateway (GW) and recorded. Since it takes time to recall past demand data and past generation data from the blockchain, the information recorded in the blockchain is also synchronized in the RDBMS, and data are referenced from the RDBMS. In this experiment, there is only one EV, and the EV is treated as belonging to HOME1; the user agent in HOME1 plans the electricity usage, including charging and discharging the EV. The user agent of HOME1 plans the electricity usage including the charging and discharging of the EV. The other HOME2~4 do not own any EVs. As for the power generation side, there is only one PV, and there is a user agent that bids in the market on behalf of the PV. Therefore, there is one user agent for PV and four for HOME1~4, for a total of five user agents. The agent in HOME1 can issue charging and discharging commands to EVs via REST/HTTPS through the Internet gateway (EV GW) and can also obtain state of charge (SOC) from EVs. In addition, the measurement data from the smart meter are received by the Internet gateway (GW) via Wi-SUN and sent from the GW to the blockchain server via REST/HTTPS.

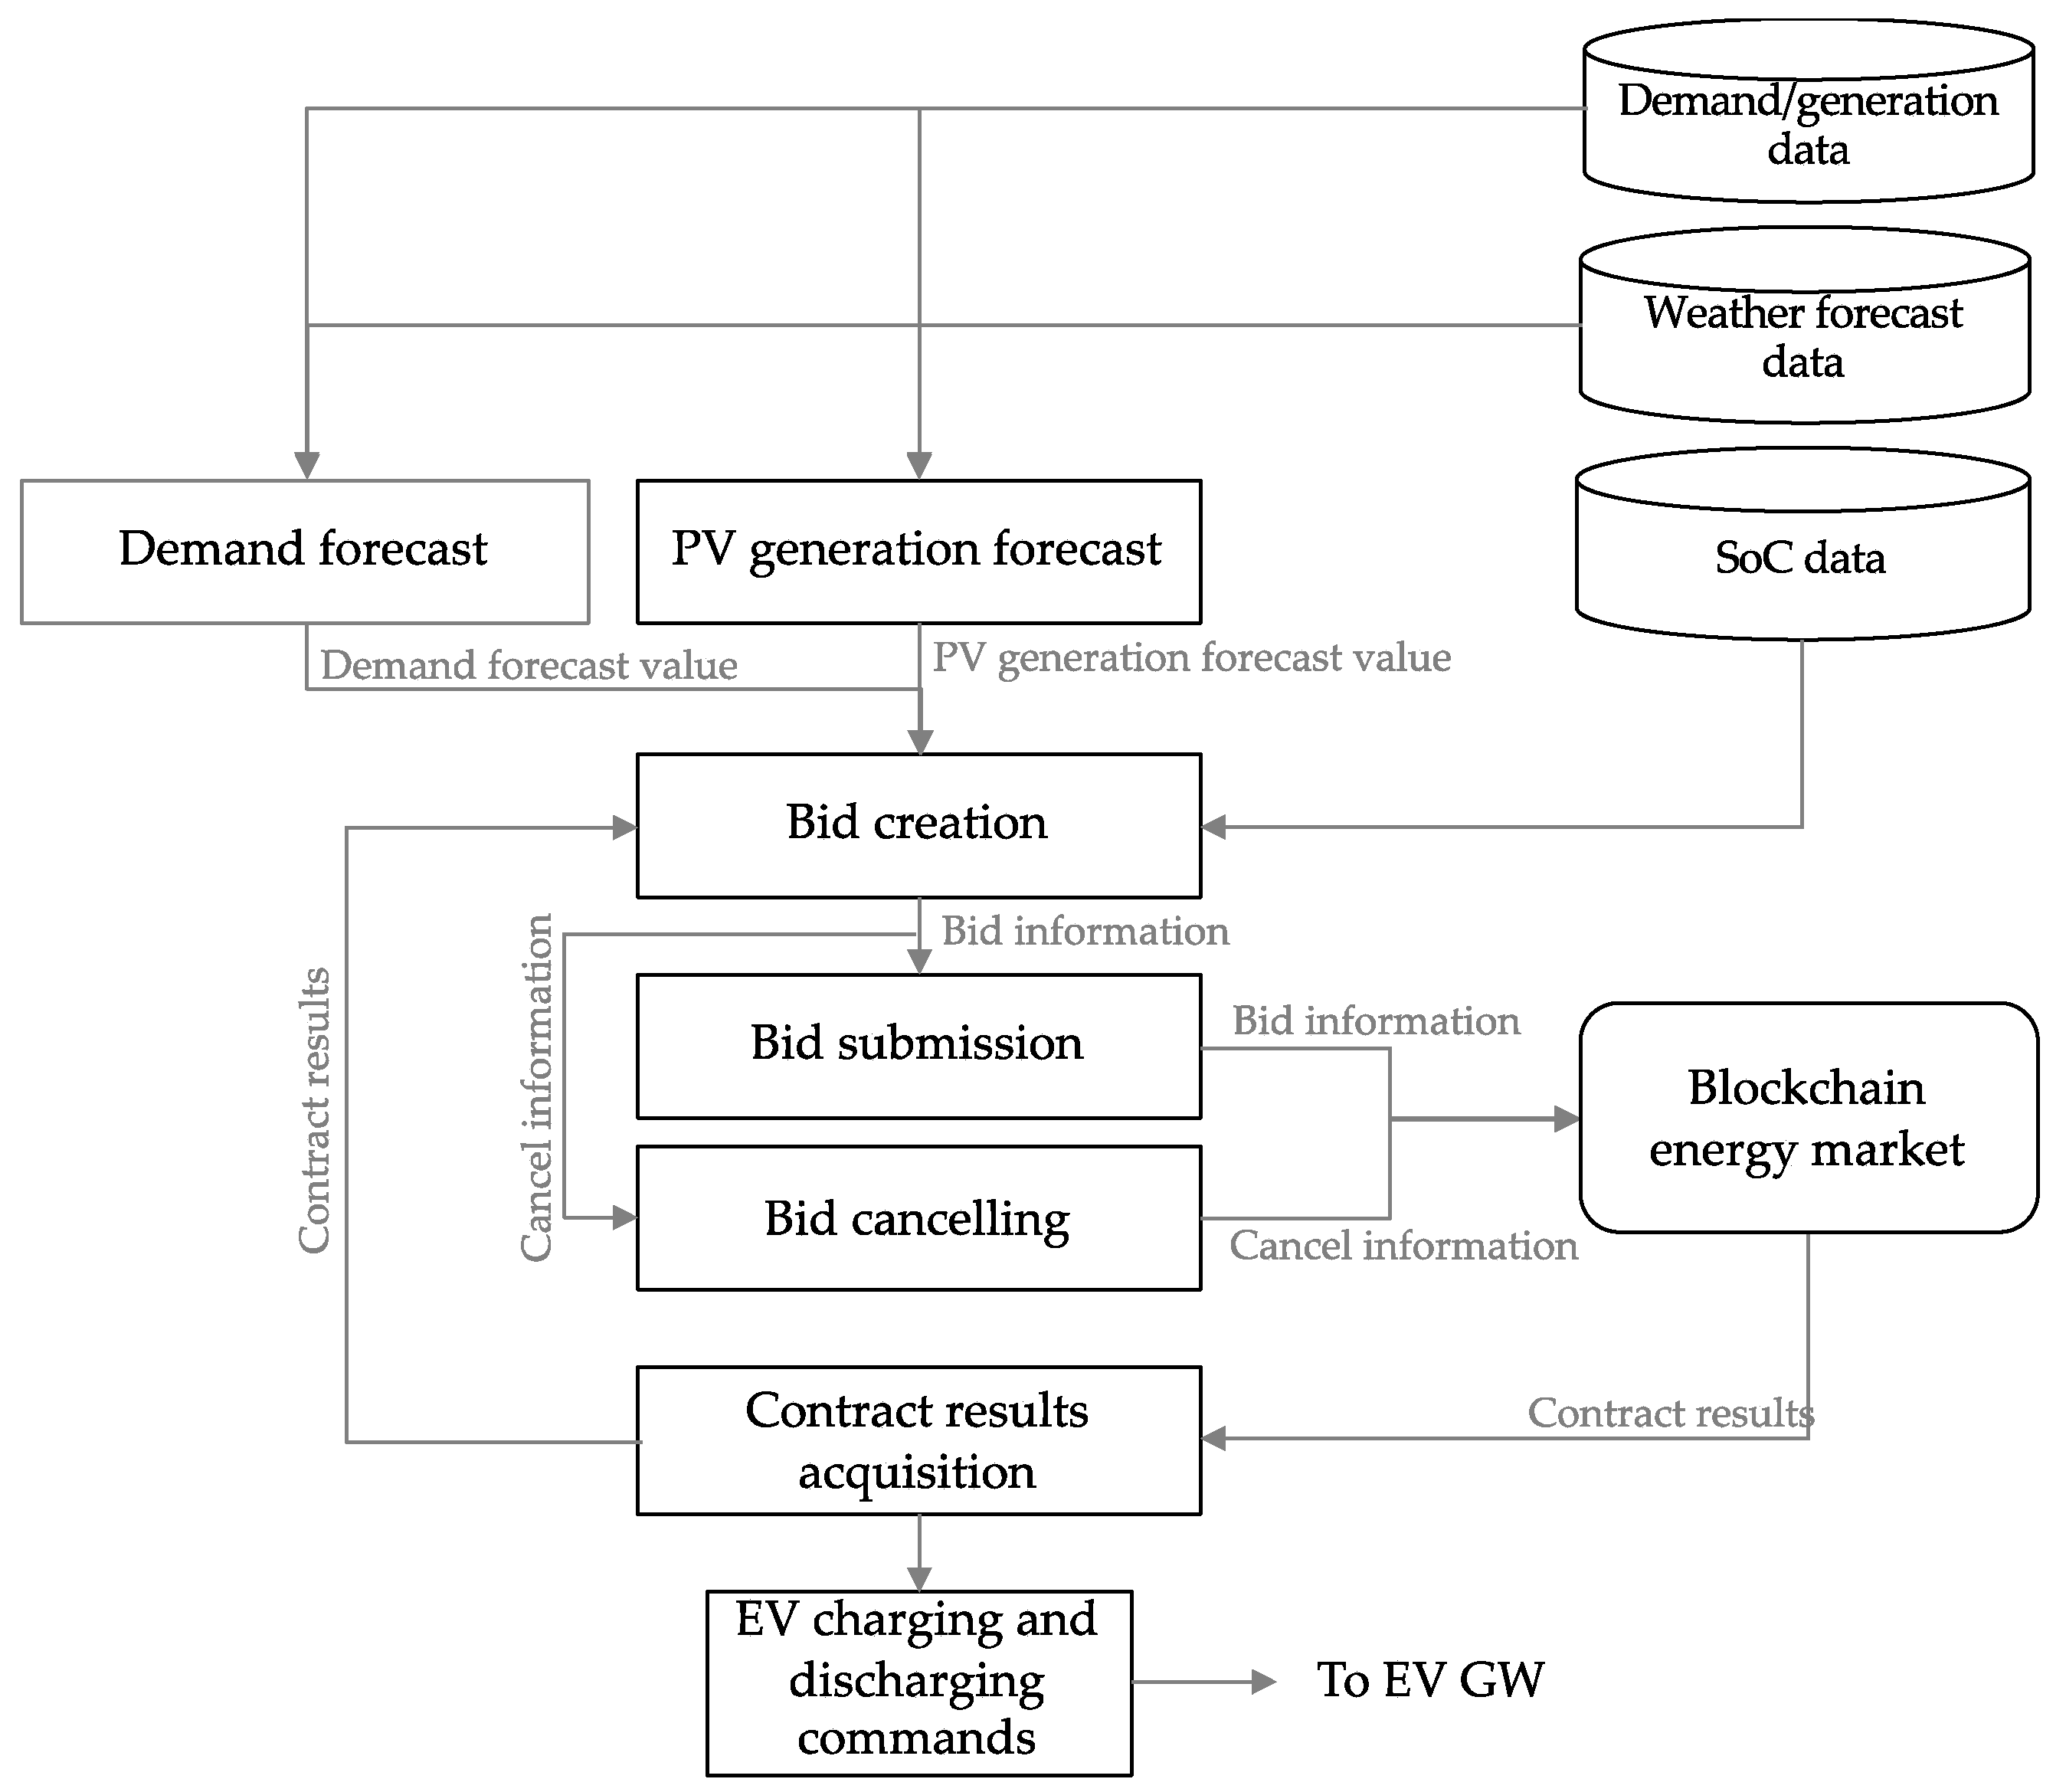
3. Functions of User Agents

The user agent determines the amount and price of bids according to the user’s equipment and demand, aiming to maximize the profit of each consumer or prosumer. The user agent makes decisions about when and how much to sell (or buy) and at what price, based on demand and power generation forecasts, and executes bids to the blockchain market. In the case of P2P transactions at the individual level, it is unrealistic for electricity consumers to constantly monitor the market just like day traders in the stock market, calculate the amount of electricity they need, and place bids. Therefore, we need such an agent module that automatically procures the amount of electricity consumers need from the market.
Bidding agents are required to take into account the various needs of consumers and power generators and automatically execute transactions in accordance with their preferences. The purpose of the bidding agent is to realize various needs, such as the financial need to purchase cheap electricity anyway, and the environmental value need to use renewable energy as much as possible. In the development of bidding agents, the assets they own are also an important factor. By optimizing the charging and discharging of EVs, consumers who own EVs can be expected to enjoy cost advantages, such as procuring more electricity from the market when electricity prices are low, storing it in batteries, and discharging it from batteries when electricity prices in the market are rising. In addition, optimizing the charging and discharging of EVs is an important factor not only in terms of cost, but also in terms of satisfying the RE preferences of individual users, as it can be expected to increase the RE ratio at a low cost by charging EVs when surplus inexpensive RE is generated. When EVs and storage batteries are not owned, the amount of electricity demanded is a constraint on electricity transactions, but when EVs and storage batteries are owned, it is possible to reduce costs and increase the RE ratio by recharging and discharging at appropriate times.
The processing flow of the user agent is shown in Figure 2. In the electricity demand forecasting function, electricity demand forecasting is performed based on consumer demand data and weather data. In the case of PV power generation, the PV power generation forecast is based on past power generation data and weather data. Here, the solar radiation forecasting API of the Meteorological Engineering Center [23] is used to create a machine learning model using random forest [24] that learns the relationship between actual PV power generation values and forecasted solar radiation values to make forecasts. The bid creation function creates bids specifying the time frame, amount of electricity, and price based on the trading mode (green mode or economy mode) set by the user, the forecast results, and the SOC of the EV, and the bid execution function puts the created bids into the energy market. The details of the bid creation method will be described in the following sections. The execution result acquisition function acquires a record of the executed bids in the energy market, and the results are submitted again to the bid creation function to recalculate a new bid. The energy market trades electricity in 30-min increments, bids can be submitted from 24 h before the actual electricity fusion to one hour before the fusion, and user agents change their bids for the same market every 30 min. At that time, the bid cancellation function is a function that sends a command to the market to cancel the old bids from the past. The entire process from forecasting to bidding is repeated for each agent at 30-min intervals until one hour before the market closes. The EV charging/discharging command function actually issues charging/discharging commands to EVs through the EV PCS API based on the calculated EV charging/discharging plan once the target market has been closed. The EV charging/discharging plan is calculated in the optimization calculation in the bid creation.

4. User Agent Bidding Modes and Bid Optimization

The bid creation function optimizes the bidding to the market and the charging and discharging of EVs based on the forecasted amount of demand, the forecasted amount of power generation, the SOC value, the expected market contract price, and the retail price of electricity. Two types of bid creation modes have been established: the economy mode and the green mode. In the economy mode, optimization is performed with the objective function of minimizing costs, including electricity sales revenue. It aims to maximize profits (minimize costs) by adjusting the timing and amount of procurement from the market and the grid, and by controlling the charging and discharging of its own EVs. The green mode is optimized by minimizing the cost, including the revenue from electricity sales, as the objective function while placing the constraint of meeting the target RE ratio set by the user. The objective is to maximize profits (or minimize costs) by adjusting the timing and amount of procurement from the market and grid, and by controlling the charging and discharging of its own EVs, while meeting the desired renewable energy consumption ratio (target RE ratio).
Equations (1)–(9) show the optimization equation for the economy mode. Each agent optimizes its own bid using this optimization equation. The objective function, Equation (1), to be minimized is the cost of procurement from the market (including revenue from electricity sales) + the cost of procurement from the grid + a penalty term, each of which is the sum of the values from the market one hour ahead to the market 48 h ahead of the target bid. The penalty term is expected to have the effect of preventing unnecessary trading from occurring, for example, buying 100 kWh and selling 99 kWh at the same price when one wants to buy 1 kWh. The variables to be optimized are B t m , S t m , B t g , C t , and D t and they are optimized by the calculations in Equations (1)–(9). In other words, we optimize the values from 1 h ahead to 49 h ahead for these variables. Each of these variables represents the amount of electricity purchased in the market, the amount of electricity sold in the market, the amount of electricity purchased from the retail business, and the amount of charging and discharging of the EV’s battery. In addition to optimizing the charging and discharging of the EV’s battery, the amount of electricity bought and sold in the market and the amount of electricity bought and sold from the retail business are simultaneously optimized. Since C h a r g e t is the amount of charge for a certain 30 min, the upper limit of C t is the maximum charging speed of the battery ( C m a x ) [kW] multiplied by 0.5. Similarly, the value obtained by multiplying D m a x [kW] by 0.5 is the upper limit of discharge ( D t ).
M i n i m i z e .   t = n n + 48 * 2 [ P t m ( B t m S t m ) + P t g B t g + C ( B t m + S t m ) ]
S u b j e c t   t o . B t m 0
S t m 0
C m a x 2 C t 0
D m a x 2 D t 0
A t d B t m ( A t p S t m ) + C t D t B t g = 0
E t E l l
E t E h l
E t + 1 = { E t E c a p + C t R c D t R d E c a p     ( i f   V t = F a l s e ) E t F t       ( i f   V t = T r u e )
Each variable is defined as follows.
B t m Amount of electricity to be purchased in the market at time t [kWh] (Optimization target)
S t m   Amount of electricity to be sold in the market at time t [kWh] (Optimization target)
B t g Amount of electricity to be purchased from electricity retailers at time t [yen/kWh] (Optimization target)
C t Amount of charge to the battery at time t [kWh] (Optimization target)
D t Amount of discharge from the battery at time t [kWh] (Optimization target)
P t m 
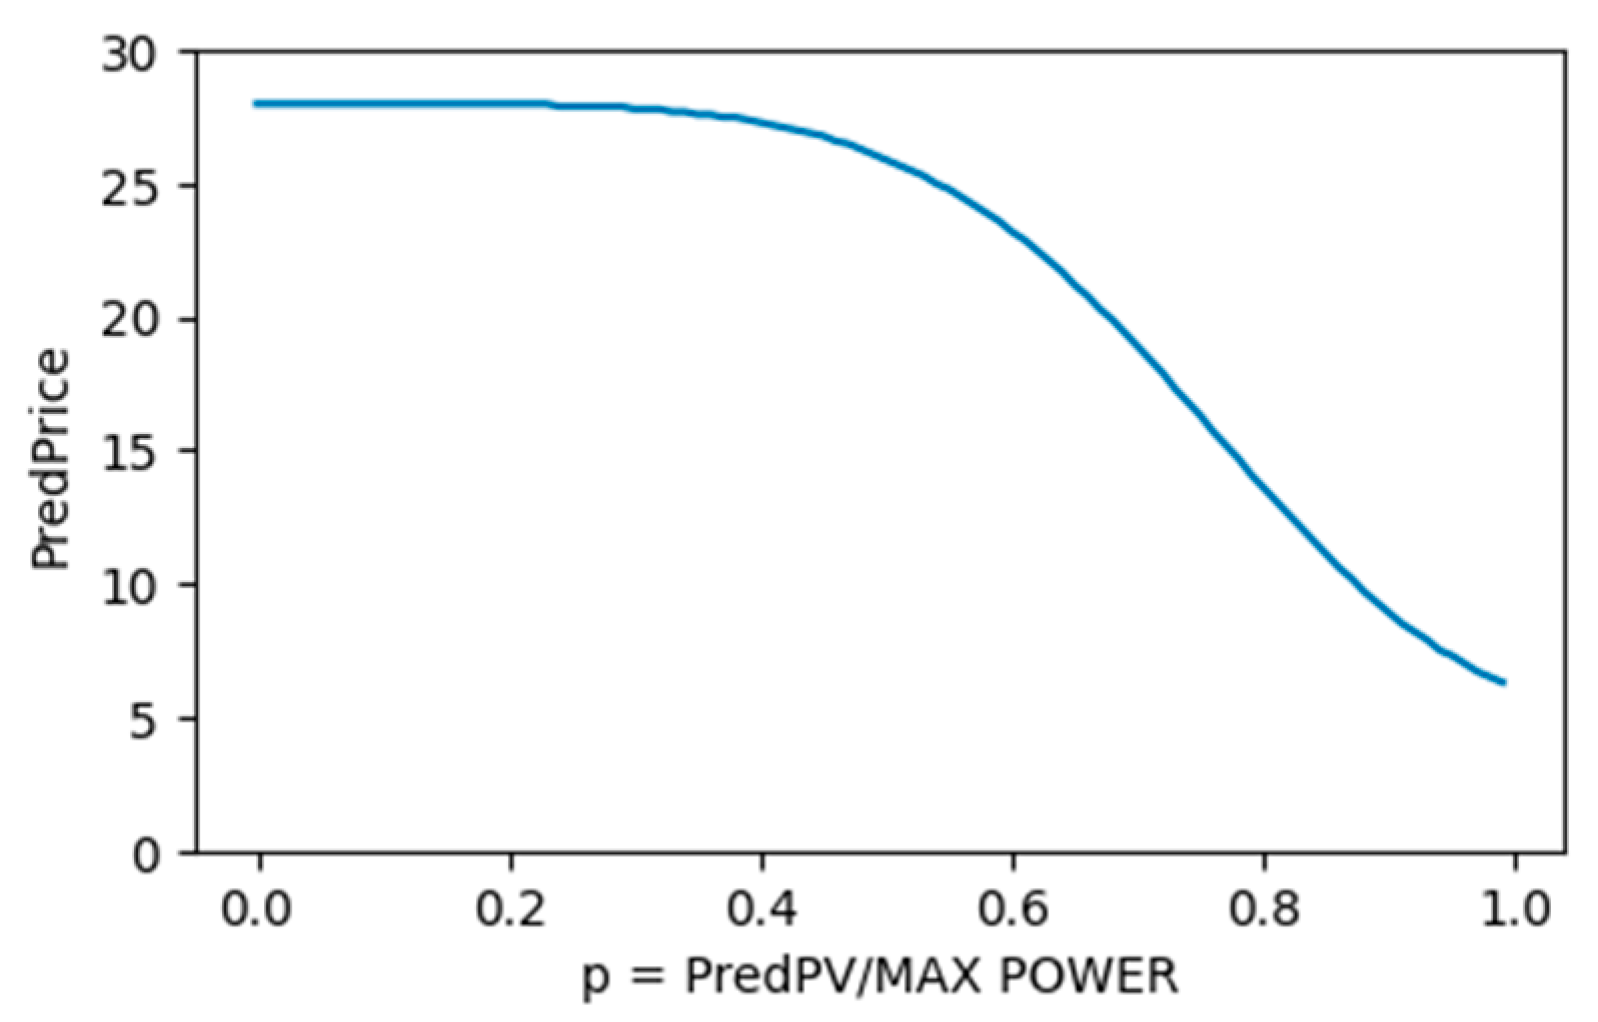
Expected price at time t [yen/kWh] (estimated by each agent based on expected power generation)
P t g Retail price of electricity at time t [yen/kWh] (defined in advance)
A t d Expected demand at time t [kWh] (calculated by demand forecast)
A t p Expected power generation at time t [kWh] (calculated by power generation forecast)
E t   Percentage of remaining charge of the battery at time t [%]
C m a x Maximum charging output of the battery [kW] (6.7 [kW])
D m a x Maximum discharge output of the battery [kW] (6.0 [kW])
E l l Lower limit of SOC [%] (set to 20 percent)
E h l Upper limit of SOC [%] (set to 90%)
E c a p Rated capacity of battery [kWh] (40 [kWh] was set.)
R c Battery charging efficiency [%] (set to 86.6%, so that CHARGE_RATE*DISCHARGE_RATE=75%)
R d   Discharge efficiency of the battery [%] (set to 86.6%, the same as CHARGE_RATE)
F t Expected energy consumption by driving at time t [kWh]. This is always set to 0 because the EV is not running in this demonstration experiment.
V t   The bool value indicating whether or not the EV is running at time t. It is always set to “false” because it is not run in this verification experiment.
P t m is the expected price in the market at time t. This expected price is calculated by each agent based on the weather information of the target day to predict the PV power generation on that day, and the expected price is calculated based on the power generation rate, which is the predicted PV power generation divided by the rated maximum output. Since the only electricity to be sold in the market in this case study is PV-derived, we believe it is a reasonable approach to forecast the PV power generation and predict the price according to the amount. The formula for calculating the expected price from the generation rate p t is defined in Equation (2). Figure 3 plots the relationship between the power generation rate defined in Equation (2) and the expected market price. As the power generation rate p increases, the price approaches D = 5. In addition, when p = 0, the price is C + D = 28. In this demonstration experiment, we have taken the approach of calculating the price based on the expected amount of electricity generated. However, if such a trading market has actually been in operation for some time and sufficient data have been accumulated, a better method would be to create a regression model to predict the price using past contract prices and the weather conditions of the target market.
P t m = C * e x p ( A * p t B ) + D
P t g gives the price list for each time. For the price list, we used the pay-as-you-go rates of the price table of “Hapi-e-time R” of Kansai Electric Power Co., Osaka, Japan [25]. This price list is shown in Table 1.
A t d   is the agent’s prediction of its own demand. The temperature and time information of the weather forecast data are used as explanatory variables, and a regression by random forest is conducted to make predictions. The predictions are made for 96 frames in 30-min increments for 48 h from 1:00 to 49:00 on the previous day.
A t p is the agent’s prediction of its own photovoltaic power generation. The prediction is made by using the predicted solar radiation and time information as explanatory variables and conducting a regression by random forest. The predictions are made for 96 frames in 30-min increments for 48 h from 1:00 to 49:00 on the previous day.
E t   is the percent [%] of remaining charge of the battery at time t. The current battery state is obtained from the EV GW, and it is given as the initial state, but the subsequent times are calculated in the optimization according to the amount of charge and discharge, so it can be said that it is also optimized as a result.
Equations (11)–(20) show the optimization equation for green mode. The fact that the objective function (11) to be minimized is the cost of procurement from the market (including the revenue from electricity sales) + the cost of procurement from the grid + the penalty term is the same as in the economy mode, but the condition that the ratio of RE to the electricity consumed by the user should exceed the target RE ratio ( R r e ) has been added to the constraints (12). This allows us to plan the bidding to the market and the charging and discharging of the EVs so that the target RE ratio is exceeded. It should be noted that there may be cases where no solution exists due to this constraint condition. If a solution does not exist, the target RE ratio will be temporarily lowered by 5% in stages until a solution is found.
M i n i m i z e .   t = n n + 48 * 2 [ P t m ( B t m S t m ) + P t g B t g + C ( B t m + S t m ) ]
S u b j e c t   t o . t ( A t p S t m + B t m ) R r e t [ A t d + F t + C t ( 1 R c ) + D t ( 1 R d ) ]  
B t m 0
S t m 0
C m a x 2 C t 0
D m a x 2 D t 0
A t d B t m ( A t p S t m ) + C t D t B t g = 0
E t E l l
E t E h l
E t + 1 = { E t E c a p + C t R c D t R d E c a p     ( i f   V t = F a l s e ) E t F t       ( i f   V t = T r u e )
Each variable is defined as follows.
R r e Target RE ratio (set by user between 0~100%)
The other items are the same as in (1)–(9).
In the case that the user does not own the EV, among the variables related to the EV ( E t ,   E l l ,   E h l ,   C t , D t ,   E c a p ) in Equations (1)–(9) and Equations (11)–(20), respectively, all variables other than E c a p are set to 0. B a t t e r y C a p can be any real number other than 0 since it can be the denominator in the constraint.
Next, in the bid submission section, among the results calculated by the above optimization, B t m and S t m   are bid into the blockchain market as the purchase and sales amount, respectively, and the unit price as P t m . Bidding is done for 48 markets every 30 min for the next 24 h. Here, optimization is performed until 48 h in the future, aiming to calculate the charging and discharging strategies for the last 24 h in a way that takes into account the future from 24 to 48 h in the future. If only the last 24 h are taken into account for optimization, even if the next two days are sunny and inexpensive electricity is supplied in abundance during the daytime, it is possible to store a lot of electricity in the batteries, so that when you try to store inexpensive electricity the next two days, the batteries are too full to store it. Therefore, the optimization is conducted for a longer period of time than the actual bidding.
In the contract results acquisition section, the contract status of the bids is obtained. Bids that have not yet been contracted are submitted under new conditions after optimization calculations. In this case, the existing bids are cancelled, and new bids are made.
This process of contract results acquisition, bid creation, bid cancelling, and bid submission is repeated every 30 min, and a time-evolving bidding experiment is conducted.
Regarding the optimization calculation of bidding agents, a single optimization calculation of an agent itself takes only a few seconds, and the calculation time increases linearly as the number of agents increases. Since the agents do not share information with each other, parallel computation is possible, and the problem can be solved by preparing multiple servers for computation.

5. About the Demonstration Experiment

5.1. Configuration of the Demonstration Experiment

The demonstration experiment was conducted with the following two main objectives.
Confirmation that electricity costs can be further reduced when EVs are owned in economy mode
Confirmation that the target RE ratio can be achieved at a relatively low cost when EVs are owned in green mode.
In the demonstration experiment, electricity trading was conducted in a P2P market with the participation of four consumers and one PV power generator as shown in Table 2.
This experiment was conducted over a period of two weeks, from 22 February 2021 to 7 March 2021. The settings were as follows.
Week 1 (22–28 February)
Setting: All in economy mode.
Objective: To confirm that the procurement costs of consumers who own EVs are lower than those of other consumers.
Week 2 (1–7 March)
Setting: Green mode for only EV owning consumers, economy mode for other users. In green mode, the setting is to conduct transactions aiming for a RE ratio of 40% or higher.
Objective: To confirm that EV-owning consumers can achieve a high RE ratio.

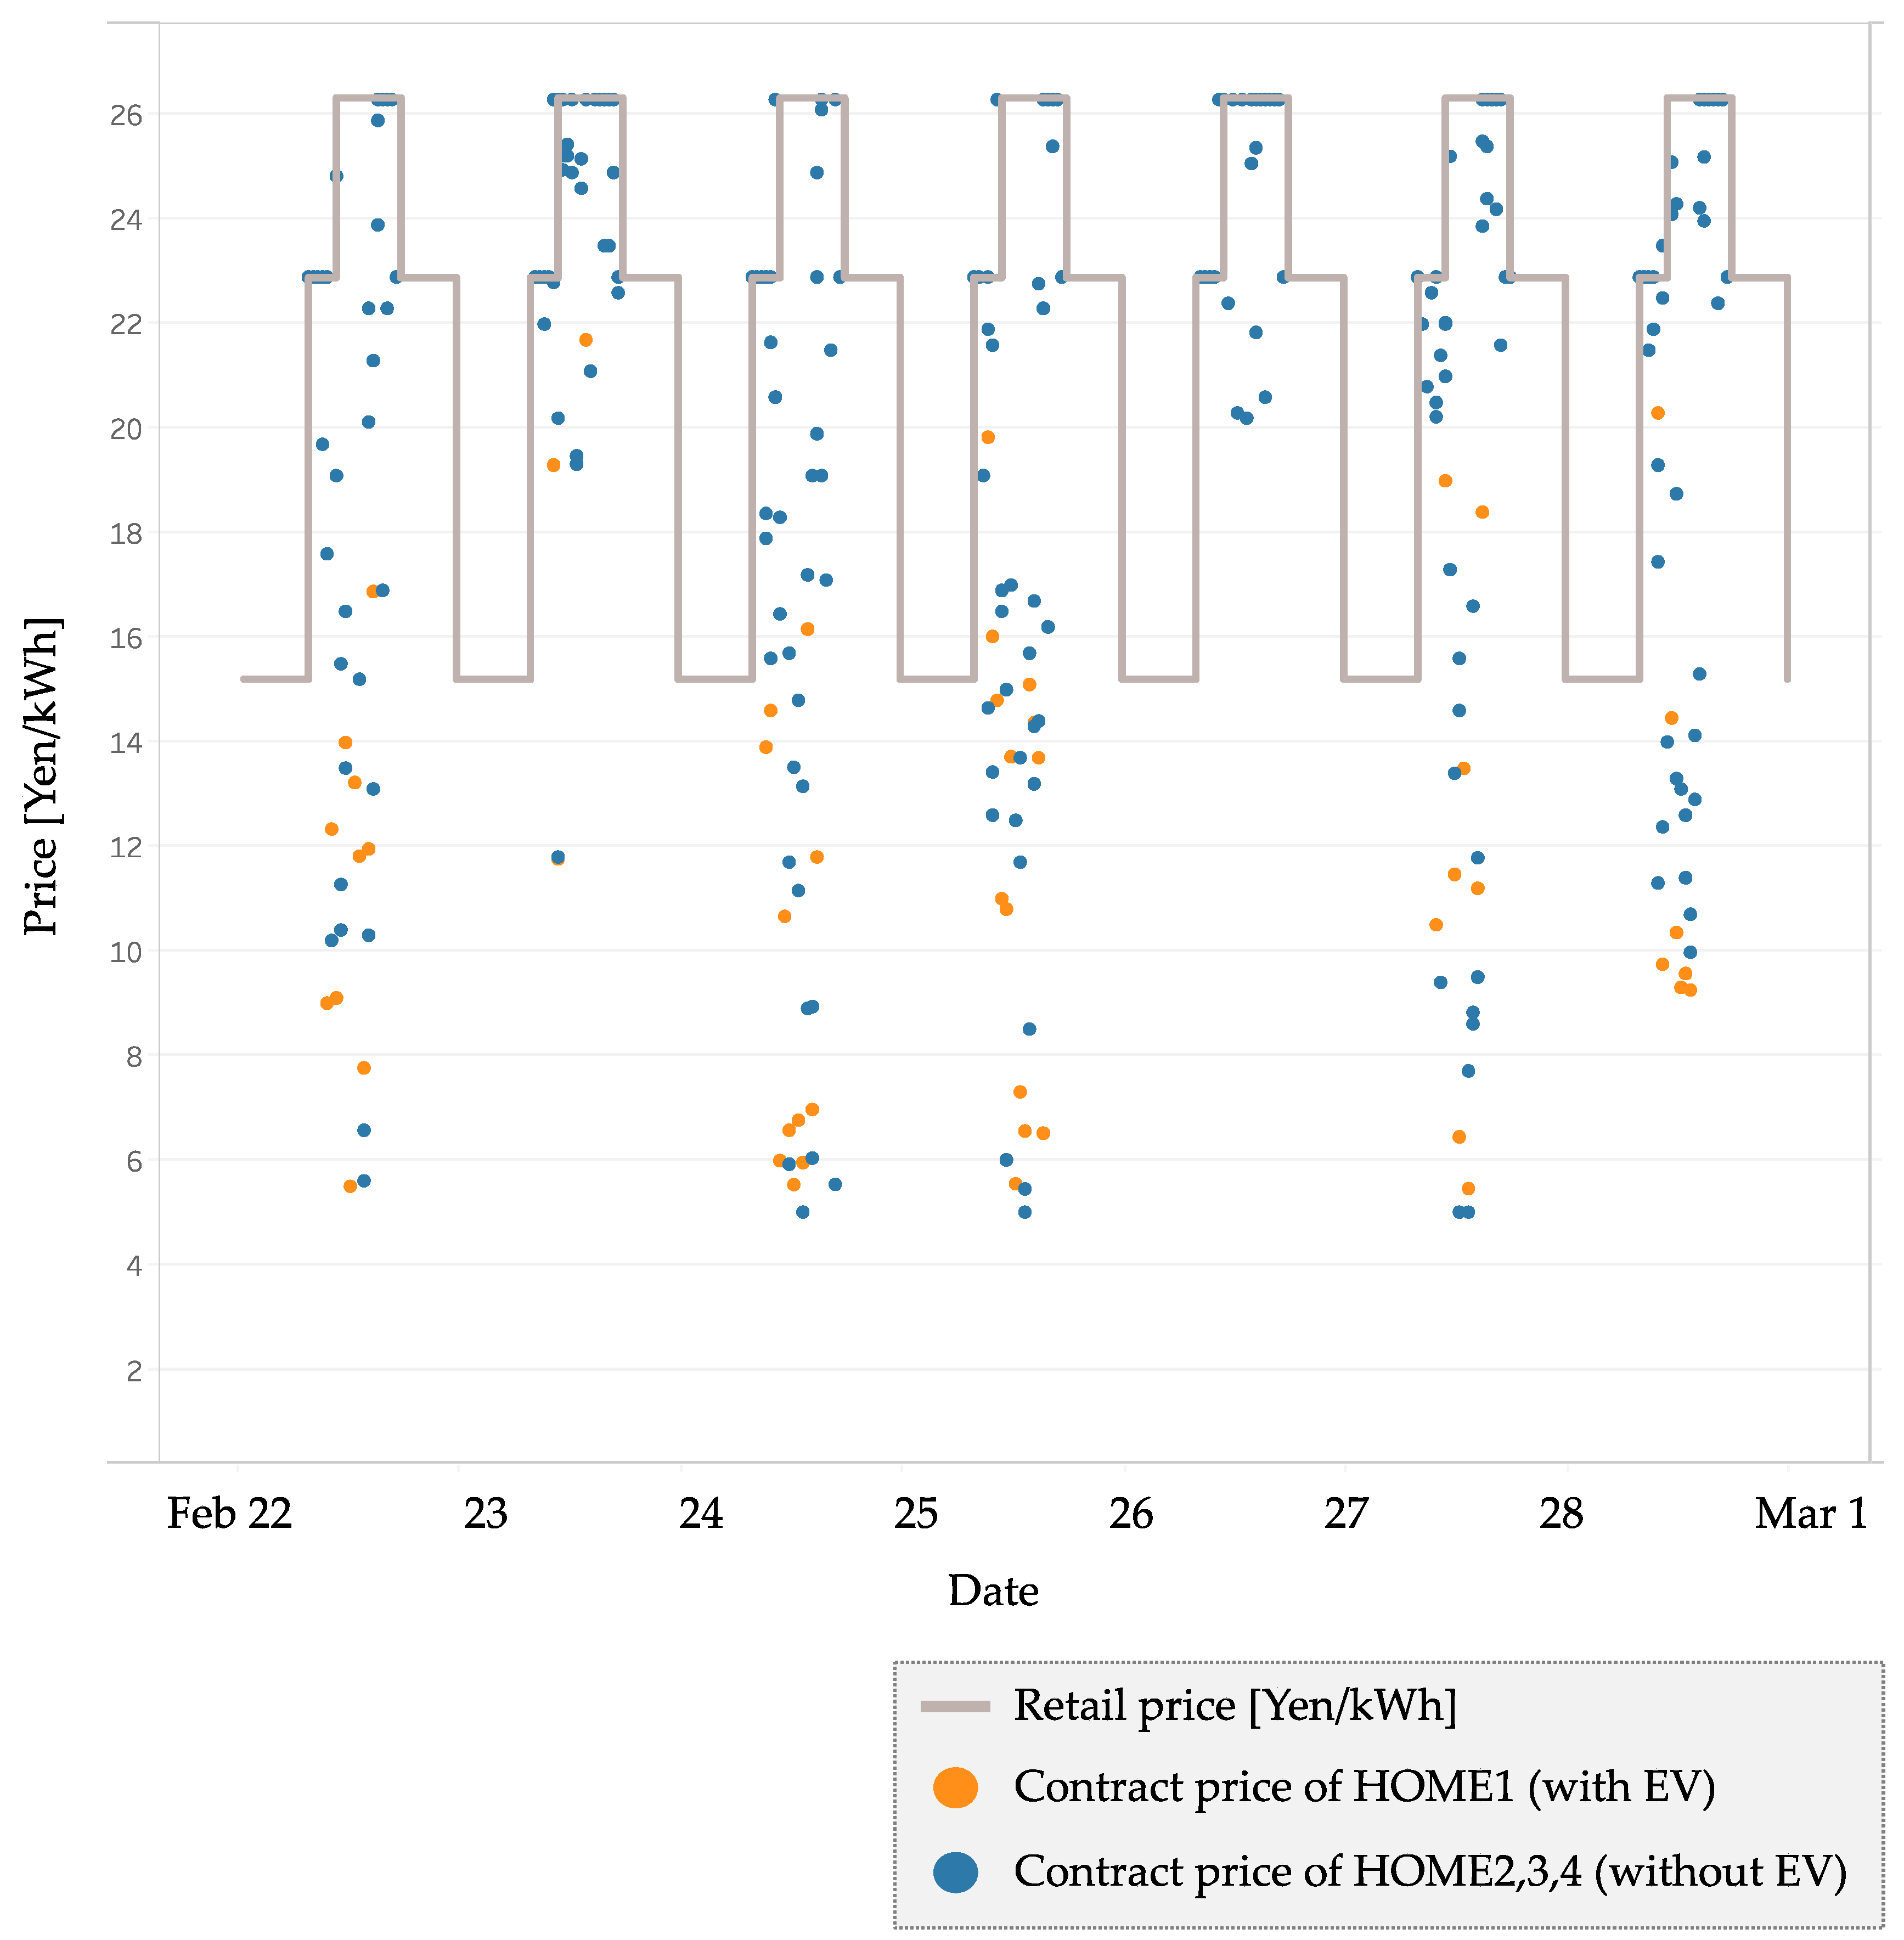
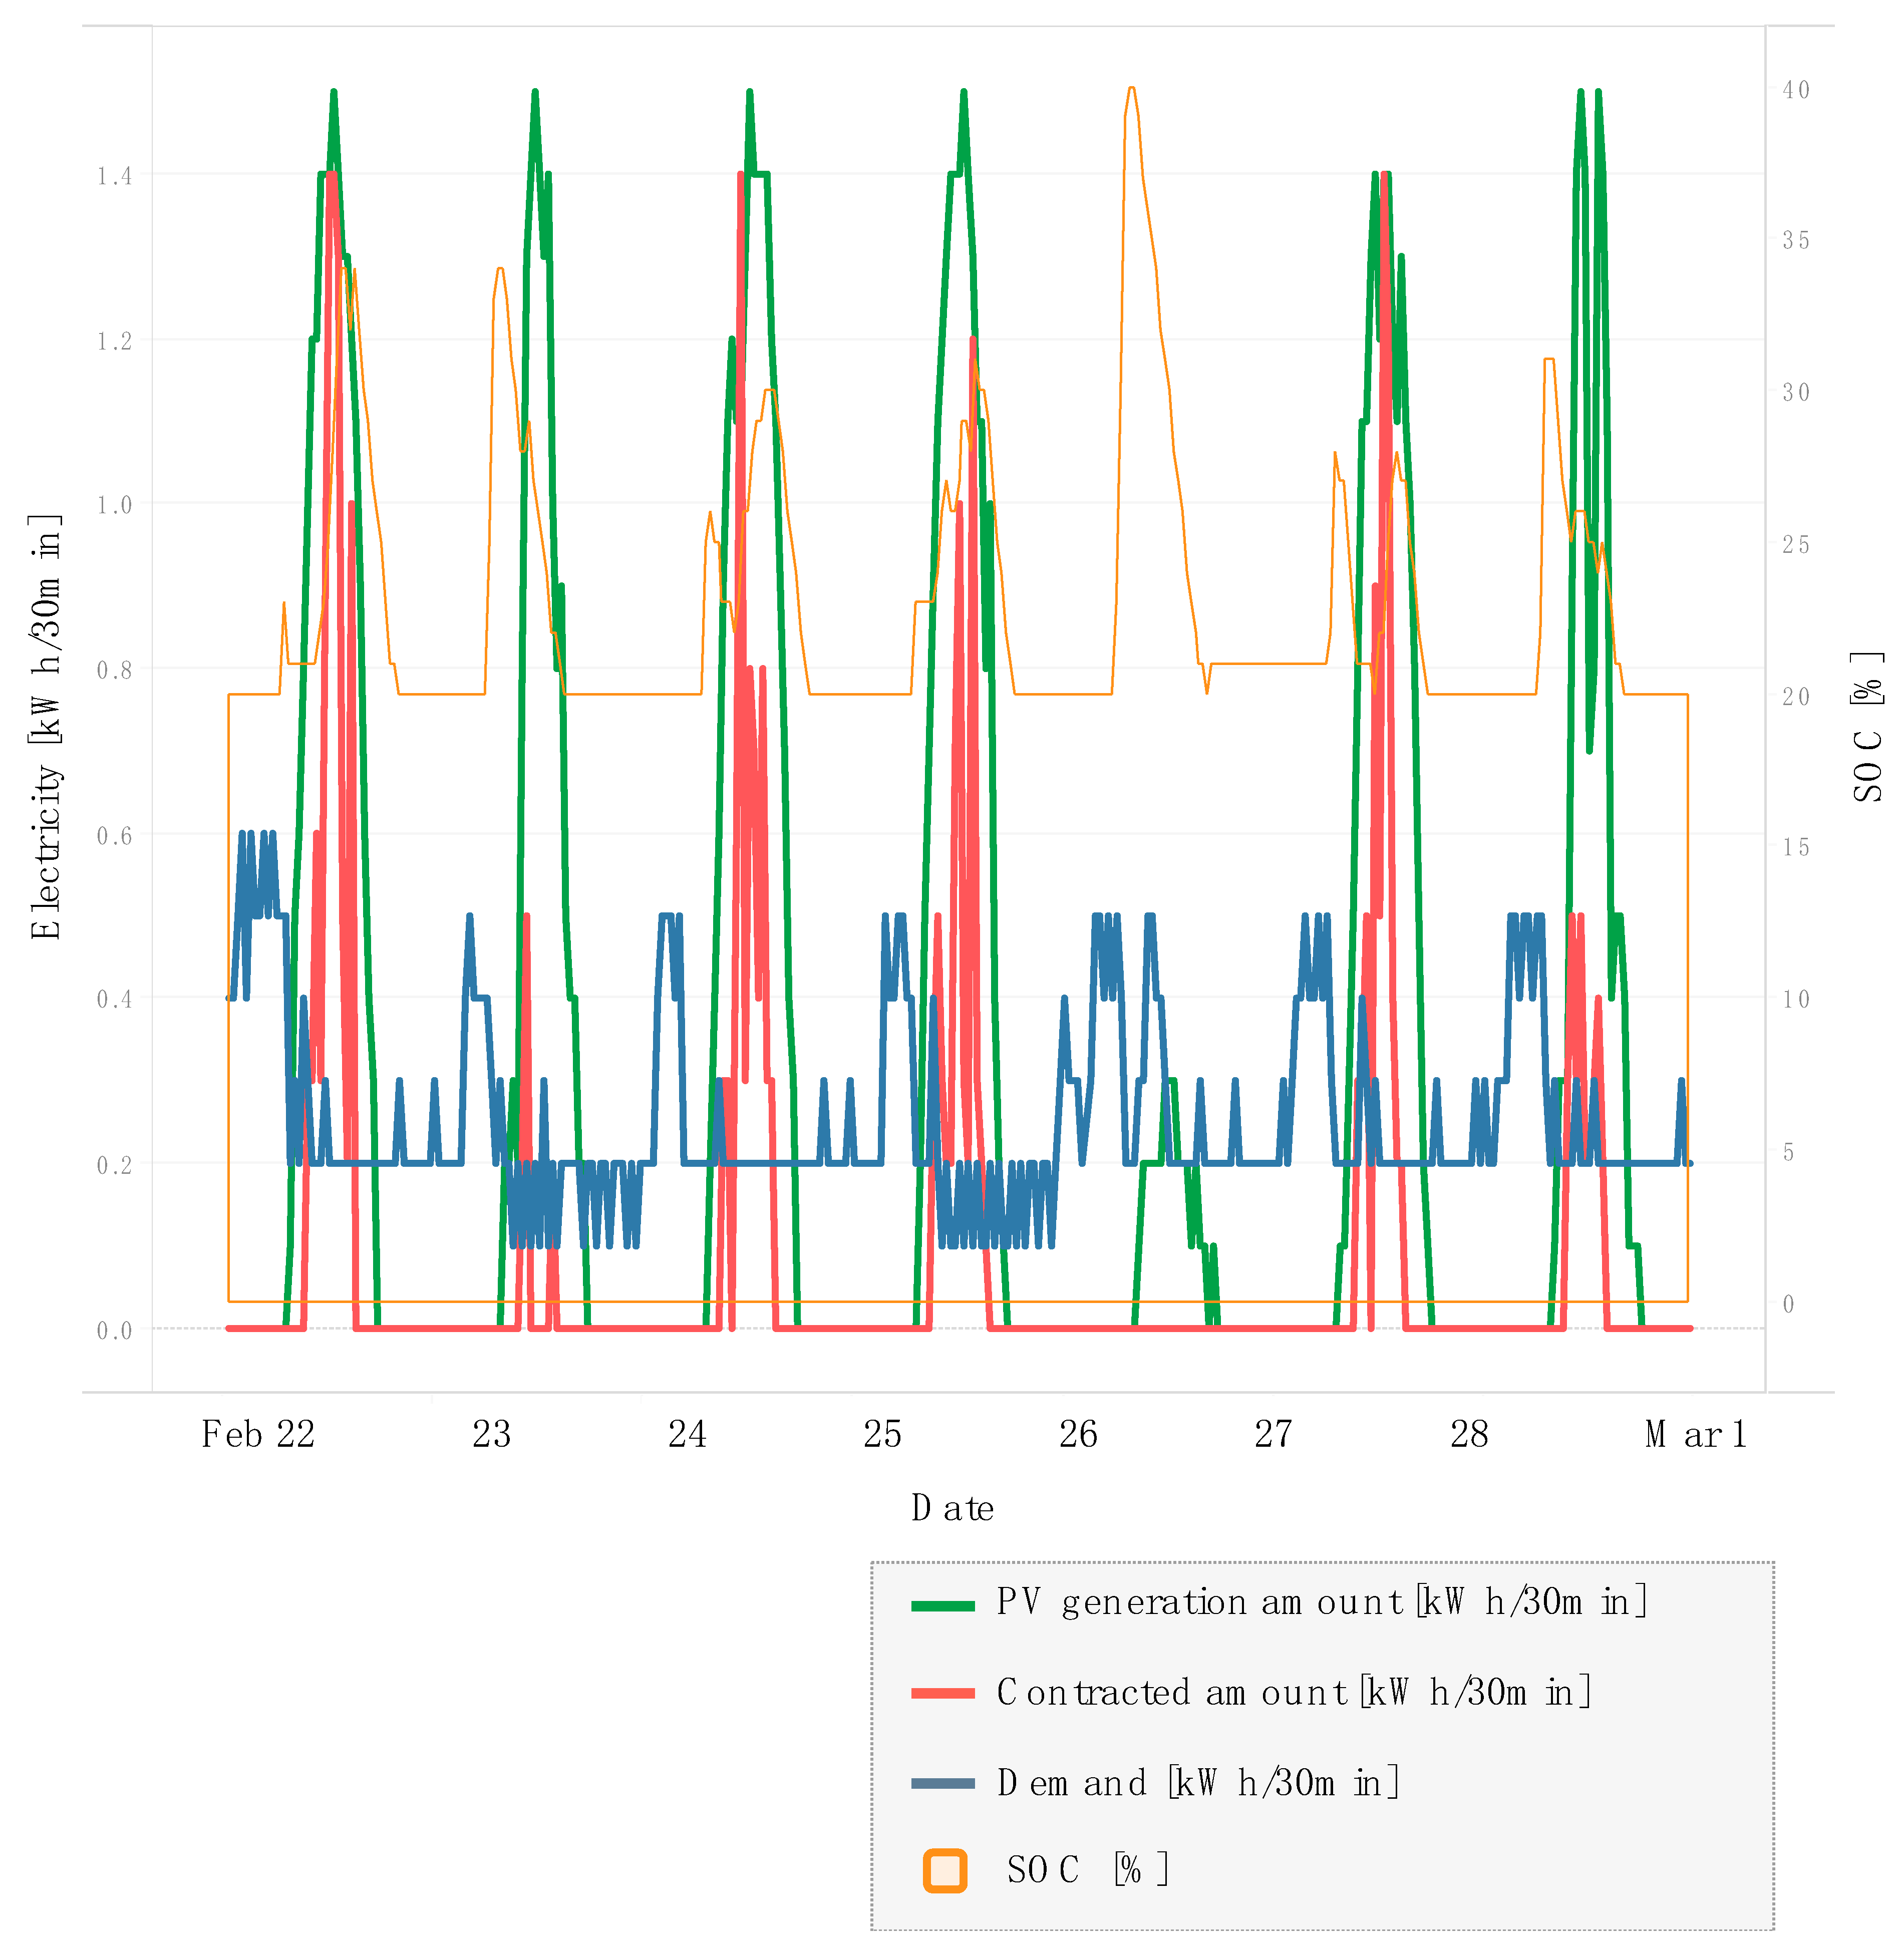
5.2. Results of the Demonstration Experiment

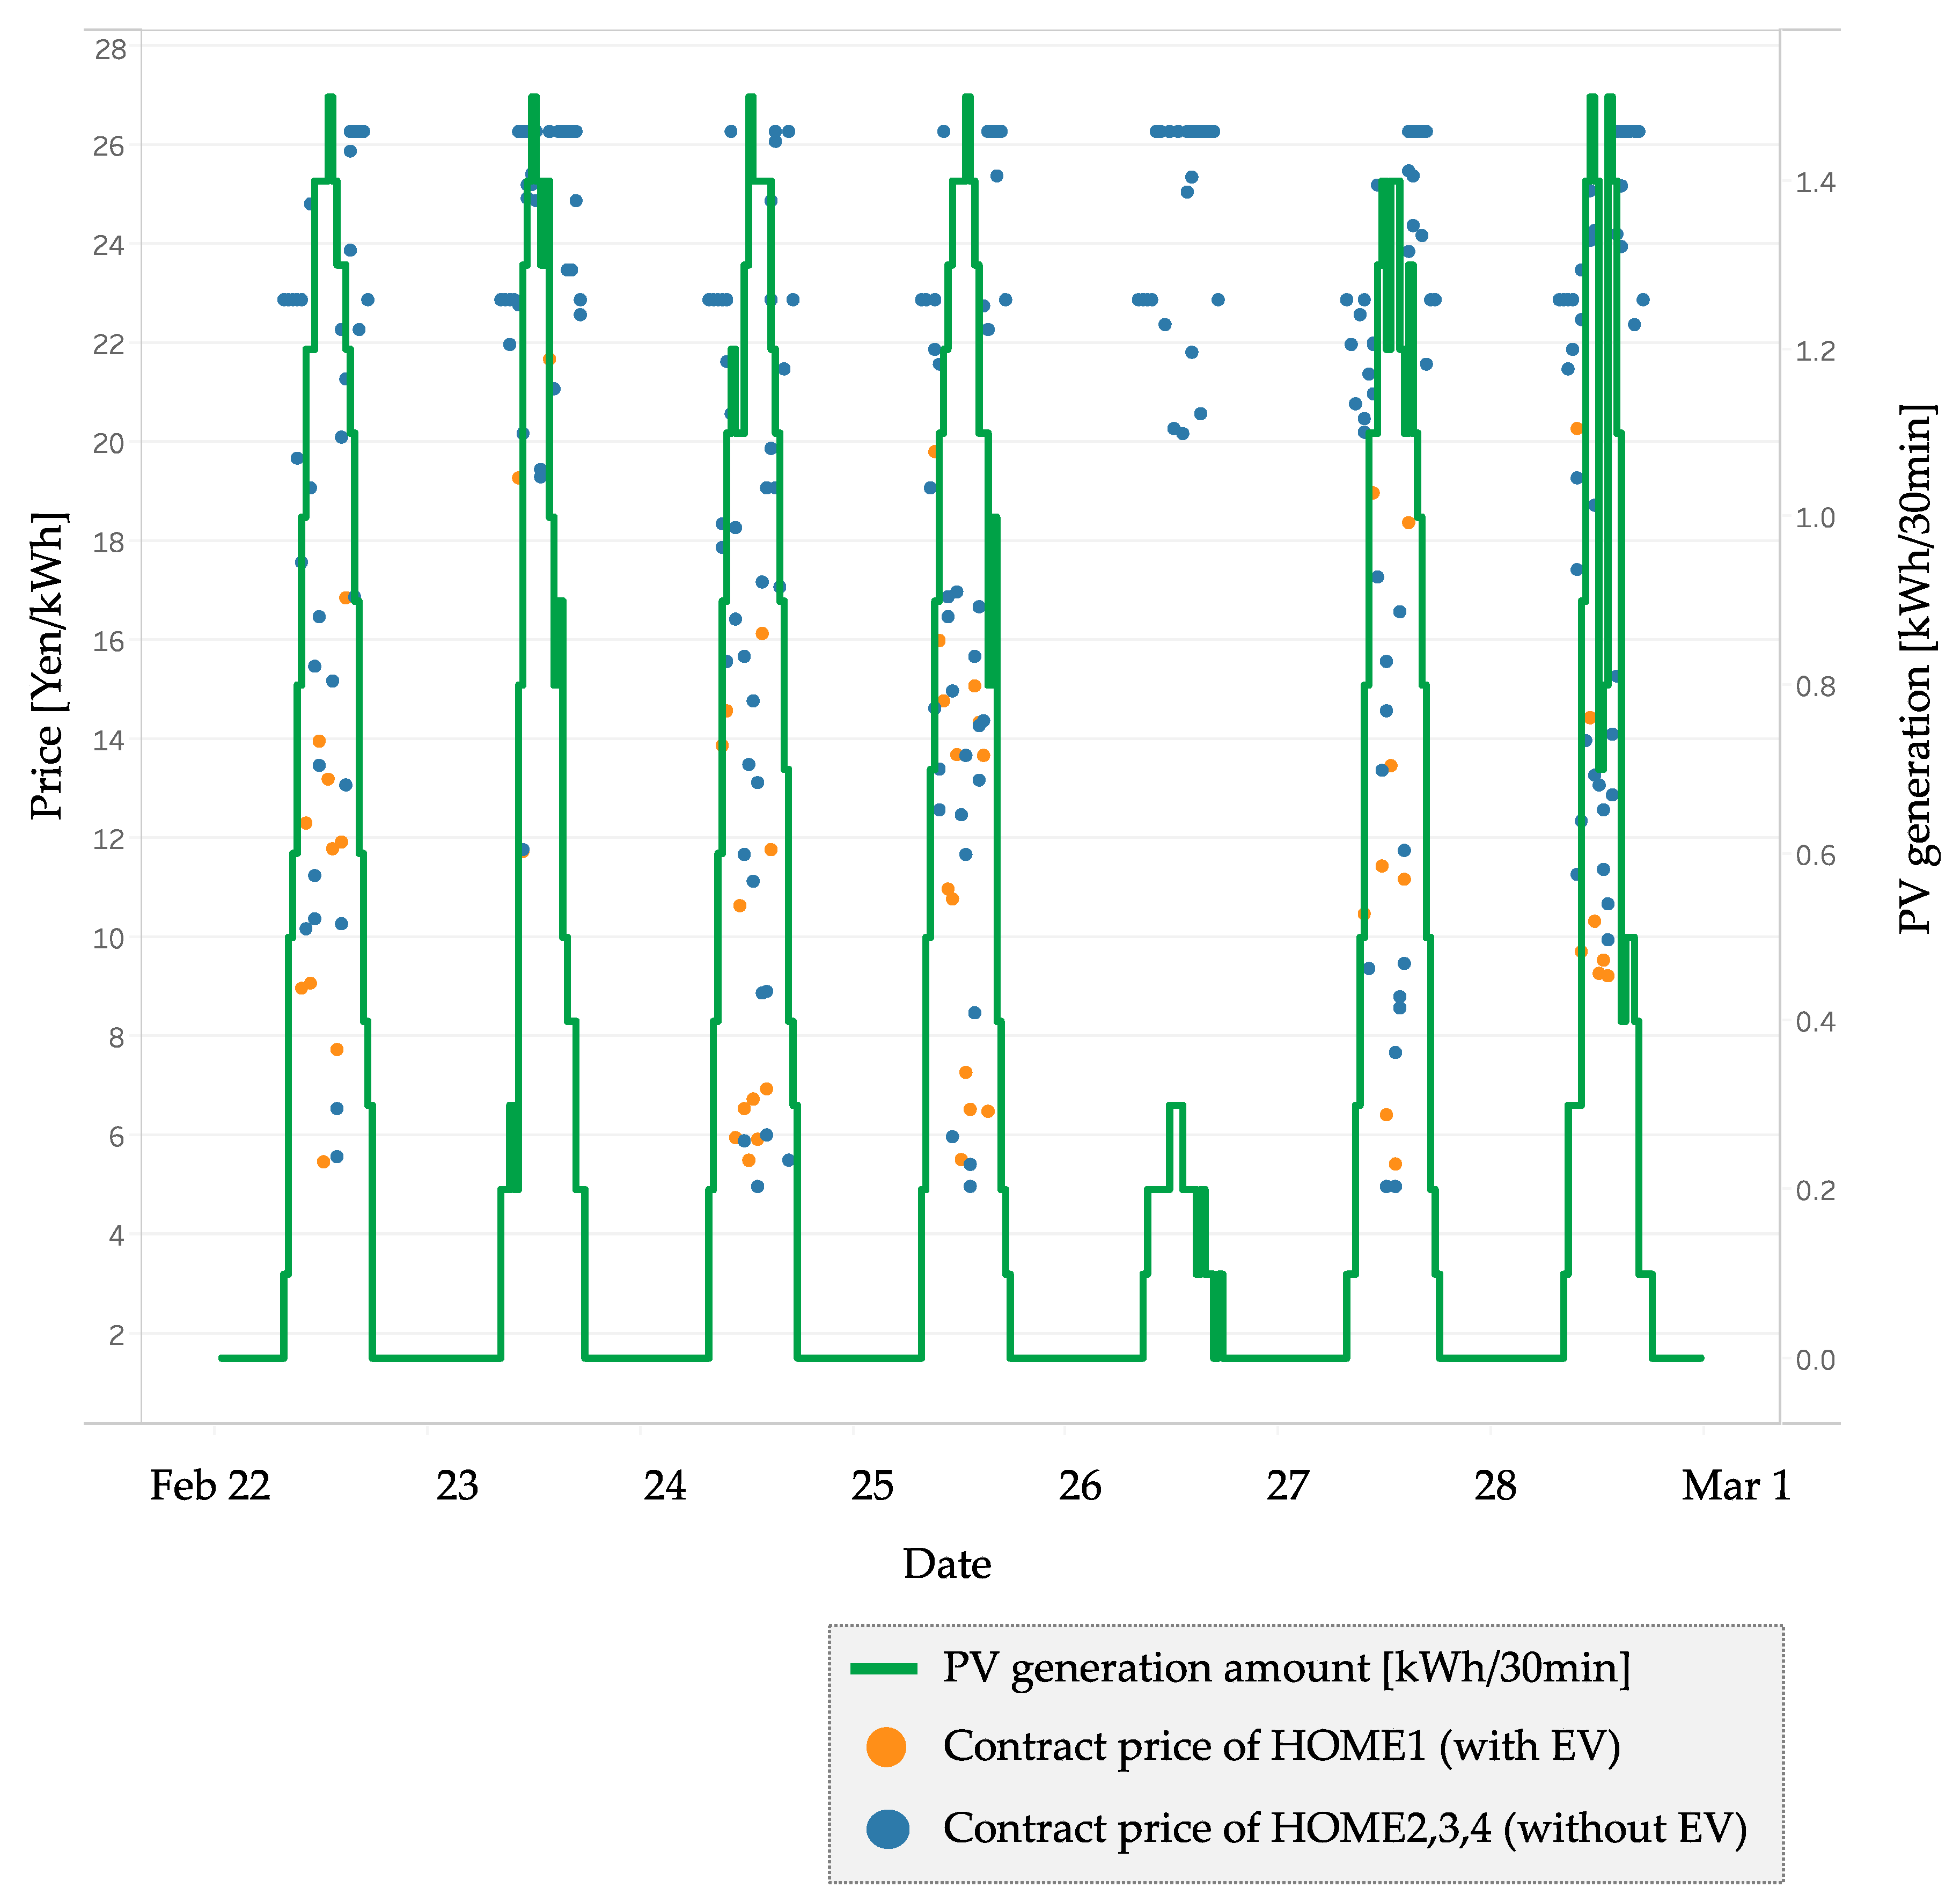
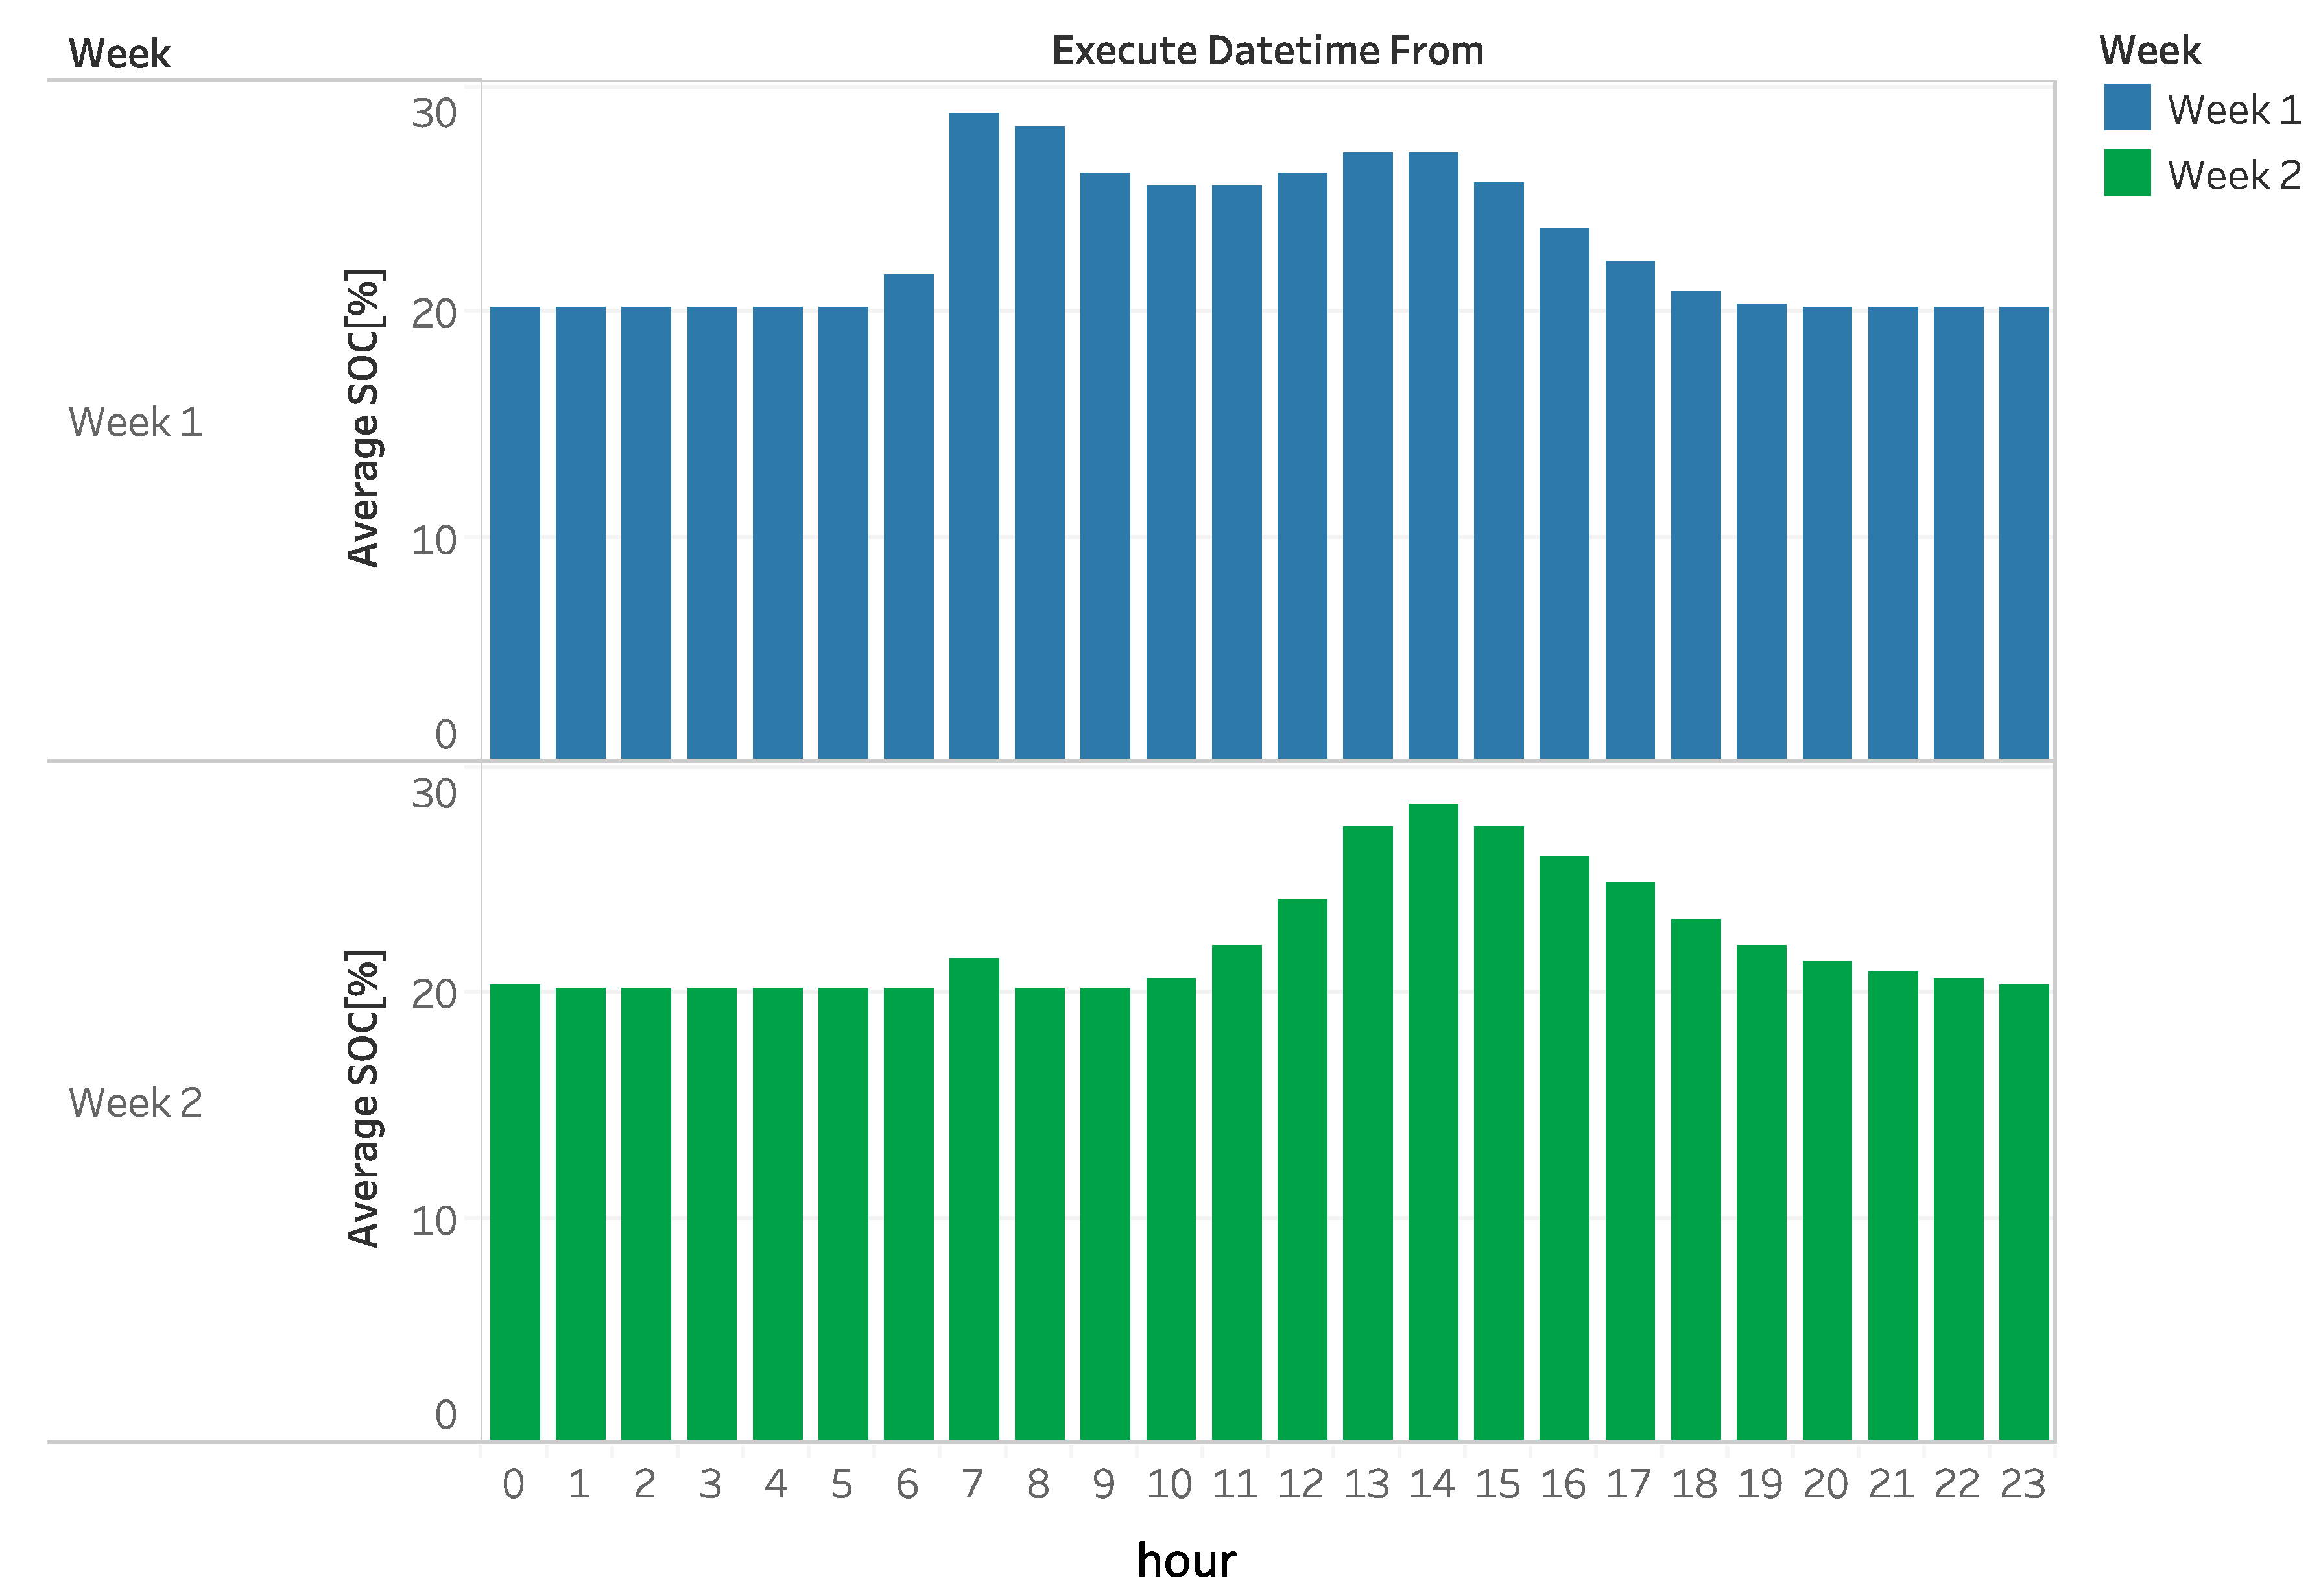
5.2.1. Results and Discussion of the First Week

Table 3 below shows a summary of the trading results for the first week, showing that consumers with EVs (Home1) were able to trade more favorably in the market with a lower average trading price of 11.22 yen compared to the other consumers who traded at around 18–20 yen.
Figure 4 shows the transition of the contract price and retail price for each user and time period. Here, the blue dots are the contract prices for users who do not own EVs, and the orange dots are the contract prices for users who own EVs. The gray line shows the retail price. From this figure, we can see that the contracted price is lower than the retail price for each corresponding time period, which means that agents were able to procure electricity more economically than purchasing electricity from retail. We can also see that most of the orange dots are distributed in the range of 5–15 yen, which is cheaper than the cheaper nighttime retail electricity. This means that users with EVs were able to implement the strategy of purchasing electricity if the market electricity is cheaper than the nighttime electricity, and otherwise charging their EVs at night through the bidding agent’s cost minimization optimization algorithm.
Figure 5 shows the execution price and the amount of electricity generated for each user and time period. It can be seen that the price did not drop significantly on the day with low power generation (26 February), and as a result, users who own EVs did not need to be contracted.
Figure 6 shows the state transition of the users who own EVs. The left axis shows the amount of electricity [kWh], the right axis shows the SOC [%], the blue line shows the amount of demand, the red line shows the contracted amount in the market, the green line shows the amount of PV generation, and the orange area shows the SOC. It can be seen that the red line, the contracted amount in the market, was higher during the day, indicating that PV generation could be purchased during the day. Furthermore, during the same time period, the SOC of the orange area increased, indicating that the agent charged EVs with inexpensive PV generation during the day. In addition, if we look at the SOC, we can confirm that the EVs were being recharged not only during the daytime, but also during the late-night hours when the retail electricity price is inexpensive. Particularly, on 26 February, PV power generation was low, and thus the market price did not fall and the agent could not purchase PV during the day. In anticipation of this, we can see that the agent purchased a large amount of late-night electricity in advance, stored it in its EV, and then discharged and used it during the daytime when retail electricity prices were high. This shows that the charging/discharging optimization that takes the power generation situation into account is working well.

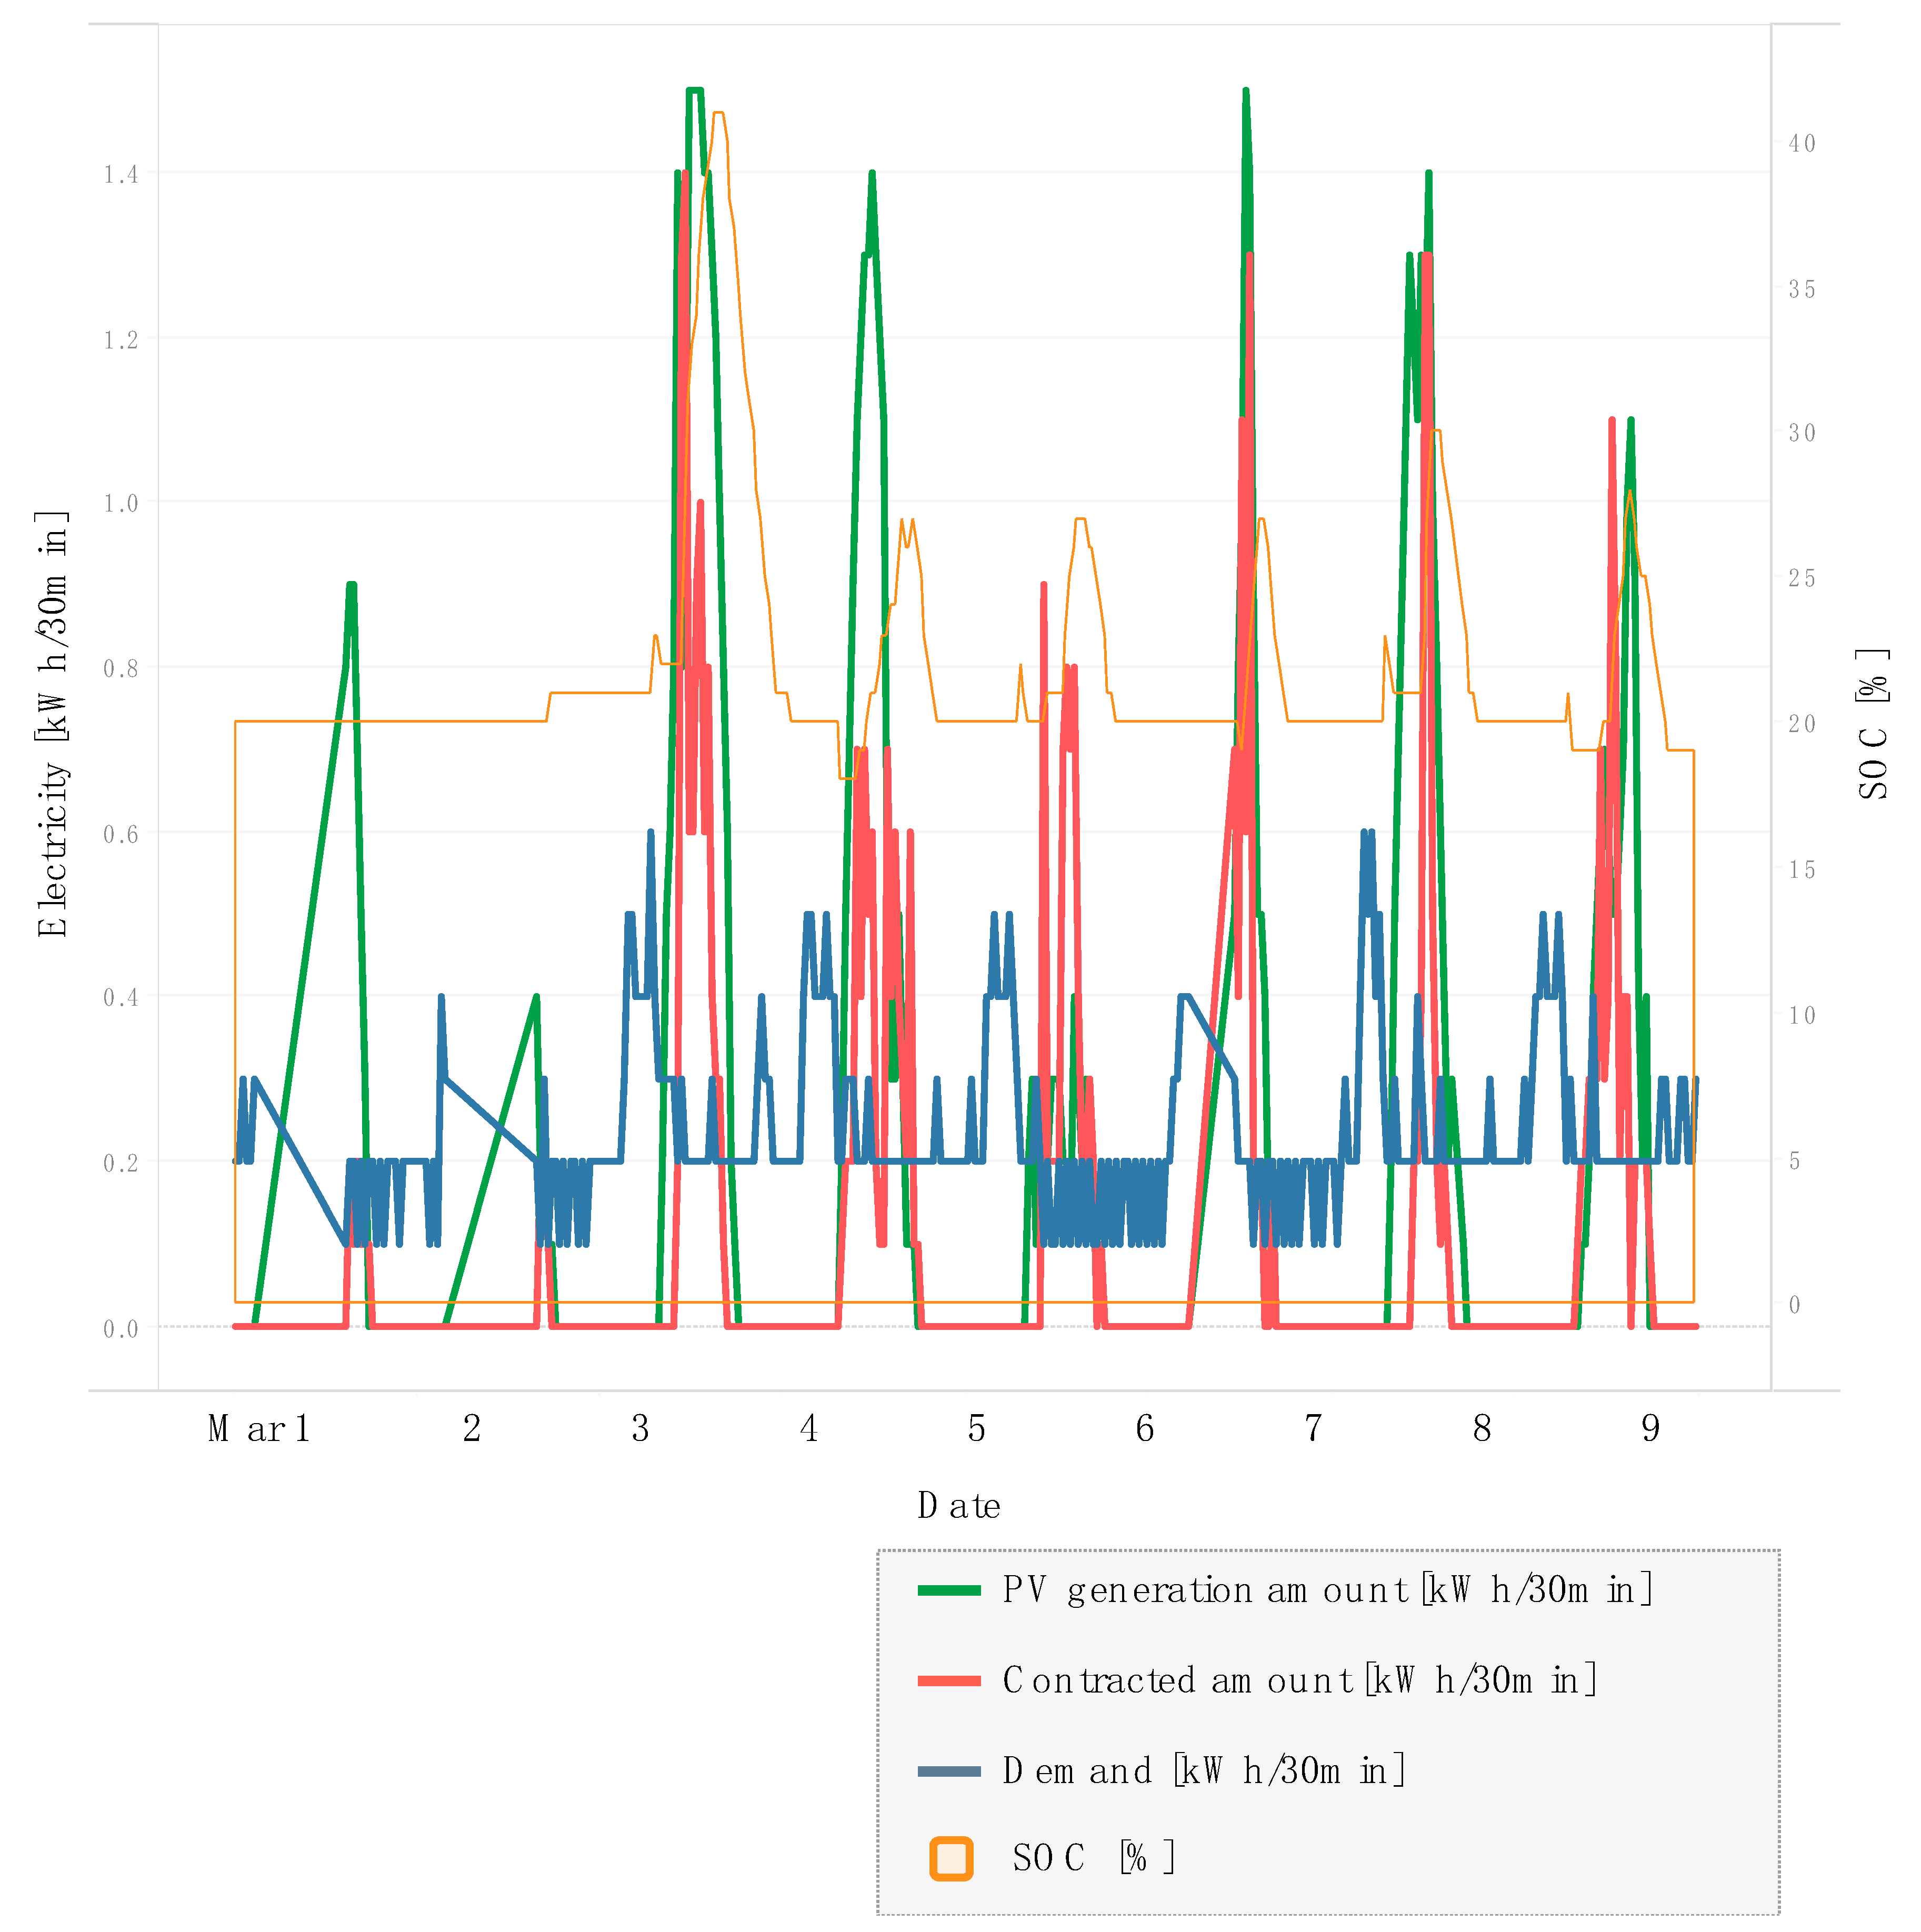
5.2.2. Results and Discussion of the Second Week

Table 4 shows the results for the second week (green mode for EV-owning users only). Compared with the results of the first week, the average execution price for the consumer owning the EV (Home1) increased from 11.22 yen to 22.75 yen, which is slightly higher than the other users where the price was around 20–21 yen. The green mode was set to trade with the goal of achieving an RE ratio of 40% or higher, and trading has been able to exceed the target RE ratio. In addition, compared to other users who had RE ratios of around 20–30%, the green mode user who owns the EV has an RE ratio of 57.2%, indicating that the agent was able to achieve a high RE ratio at a cost of around +1 yen/kWh.
Figure 7 shows the transition of the status of the user who owns the EV in the second week. Here, it can be read that the contracted amount of electricity generated from PV in the market was large, and that this amount was being recharged into EVs during the day. It can also be seen that the electricity charged during the day was discharged and consumed during the evening and night. In addition, compared to the first week, the amount of inexpensive electricity charged at night has decreased, confirming that the green mode movement to use PV power generation as much as possible has been realized. Figure 8 also shows that week 1 had a higher SOC in the early morning than week 2.

6. Conclusions

In this study, we developed an agent system that automatically trades electricity on behalf of users in a hypothetical power P2P trading market where consumers and generators trade with each other. The system not only makes bids based on the user’s assets such as electric vehicles and solar power generators, and the user’s power demand, but also takes into account the user’s orientation toward renewable energy and aims to enable power trading tailored to the individual user’s situation. The novelty of our research lies in two major aspects.
The fact that individuals optimize their bidding by using energy storage facilities with the aim of maximizing profits and satisfying their own preferences regarding the ratio of renewable energy.
By developing a bidding strategy that takes into account the individual’s preference for renewable energy, we have achieved both economic efficiency and satisfaction of the individual’s preference.
In order to consider users’ preferences for renewable energy and costs, we developed two modes in the creation of agent bids, a green mode oriented toward achieving the desired renewable energy ratio, and an economy mode oriented toward economic efficiency, and we conducted a demonstration experiment of P2P electricity trading. In the demonstration experiment, the following results were obtained.
The user who owns an EV and is economically oriented can trade at a lower average price than the users who do not own EVs.
It is possible to increase the economic efficiency of storing nighttime electricity in batteries in advance by anticipating future power generation and market prices through forecasting.
Users who own EVs and have a preference for renewable energy can achieve a high RE ratio at a cost of about +1 yen/kWh compared to other users.
In real scale experiments, it is possible to control charging and discharging by actually issuing charging and discharging commands to electric vehicles, and to optimize the actual use of electricity according to the user’s preferences.
As for future prospects, we envision devising optimization including the operation of electric water heaters as energy management that takes into account not only energy storage facilities but also demand-shifting devices, and conducting demonstration experiments. In terms of system configuration, the smart contract function of the Ethereum blockchain is currently being used to implement the electricity trading market but speeding up the processing of this function will be an issue in the future. Possible solutions include executing the market execution process in a system outside the blockchain and recording only the matching results in the blockchain.

Author Contributions

Conceptualization, D.S., K.T. and F.I.; methodology, D.S.; software, M.N., S.N. and N.A.; writing—original draft preparation, D.S.; project administration; K.T., F.I., H.S., N.T., K.S. All authors have read and agreed to the published version of the manuscript.

Funding

This research received no external funding.

Institutional Review Board Statement

Not applicable.

Informed Consent Statement

Not applicable.

Acknowledgments

The second and the third authors are supported by Grant-in-Aid for Scientific Research (A) 20H00285.

Conflicts of Interest

The authors declare no conflict of interest.

References

  1. European Union. 2030 Climate & Energy Framework. Available online: https://ec.europa.eu/clima/eu-action/climate-strategies-targets/2030-climate-energy-framework_en (accessed on 29 November 2021).
  2. European Union. European Climate Law. Available online: https://ec.europa.eu/clima/eu-action/european-green-deal/european-climate-law_en (accessed on 29 November 2021).
  3. Abdella, J.; Shuaib, K. Peer to Peer Distributed Energy Trading in Smart Grids: A Survey. Energies 2018, 11, 1560. [Google Scholar] [CrossRef][Green Version]
  4. Sousa, T.; Soares, T.; Pinson, P.; Moret, F.; Baroche, T.; Sorin, E. Peer-to-peer and community-based markets: A comprehensive review. Renew. Sustain. Energy Rev. 2019, 104, 367–378. [Google Scholar] [CrossRef][Green Version]
  5. Morstyn, T.; Teytelboym, A.; McCulloch, M.D. Bilateral Contract Networks for Peer-to-Peer Energy Trading. IEEE Trans. Smart Grid 2019, 10, 2026–2035. [Google Scholar] [CrossRef]
  6. Sorin, E.; Bobo, L.; Pinson, P. Consensus-Based Approach to Peer-to-Peer Electricity Markets with Product Differentiation. IEEE Trans. Power Syst. 2019, 34, 994–1004. [Google Scholar] [CrossRef][Green Version]
  7. Mengelkamp, E.; Gärttner, J.; Rock, K.; Kessler, S.; Orsini, L.; Weinhardt, C. Designing microgrid energy markets: A case study: The Brooklyn Microgrid. Appl. Energy 2018, 210, 870–880. [Google Scholar] [CrossRef]
  8. Shrestha, A.; Bishwokarma, R.; Chapagain, A.; Banjara, S.; Aryal, S.; Mali, B.; Thapa, R.; Bista, D.; Hayes, B.P.; Papadakis, A.; et al. Peer-to-Peer Energy Trading in Micro/Mini-Grids for Local Energy Communities: A Review and Case Study of Nepal. IEEE Access 2019, 7, 131911–131928. [Google Scholar] [CrossRef]
  9. Liu, T.; Tan, X.; Sun, B.; Wu, Y.; Guan, X.; Tsang, D.H.K. Energy management of cooperative microgrids with P2P energy sharing in distribution networks. In Proceedings of the 2015 IEEE International Conference on Smart Grid Communications (SmartGridComm), Miami, FL, USA, 2–5 November 2015; pp. 410–415. [Google Scholar]
  10. Longo, A.; Markandya, A.; Petrucci, M. The internalization of externalities in the production of electricity: Willingness to pay for the attributes of a policy for renewable energy. Ecol. Econ. 2008, 67, 140–152. [Google Scholar] [CrossRef][Green Version]
  11. Zorić, J.; Hrovatin, N. Household willingness to pay for green electricity in Slovenia. Energy Policy 2012, 47, 180–187. [Google Scholar] [CrossRef]
  12. Tabi, A.; Hille, S.L.; Wüstenhagen, R. What makes people seal the green power deal?—Customer segmentation based on choice experiment in Germany. Ecol. Econ. 2014, 107, 206–215. [Google Scholar] [CrossRef]
  13. Dagher, L.; Harajli, H. Willingness to pay for green power in an unreliable electricity sector: Part 1. The case of the Lebanese residential sector. Renew. Sustain. Energy Rev. 2015, 50, 1634–1642. [Google Scholar] [CrossRef]
  14. Morstyn, T.; McCulloch, M.D. Multiclass Energy Management for Peer-to-Peer Energy Trading Driven by Prosumer Preferences. IEEE Trans. Power Syst. 2019, 34, 4005–4014. [Google Scholar] [CrossRef]
  15. Park, D.-H.; Park, J.-B.; Lee, K.Y.; Son, S.-Y.; Roh, J.H. A Bidding-Based Peer-to-Peer Energy Transaction Model Considering the Green Energy Preference in Virtual Energy Community. IEEE Access 2021, 9, 87410–87419. [Google Scholar] [CrossRef]
  16. Park, D.-H.; Park, Y.-G.; Roh, J.-H.; Lee, K.Y.; Park, J.-B. A Hierarchical Peer-to-Peer Energy Transaction Model Considering Prosumer’s Green Energy Preference. Int. J. Control. Autom. Syst. 2021, 19, 311–317. [Google Scholar] [CrossRef]
  17. Kobashi, T.; Yoshida, T.; Yamagata, Y.; Naito, K.; Pfenninger, S.; Say, K.; Takeda, Y.; Ahl, A.; Yarime, M.; Hara, K. On the potential of “Photovoltaics + Electric vehicles” for deep decarbonization of Kyoto’s power systems: Techno-economic-social considerations. Appl. Energy 2020, 275, 115419. [Google Scholar] [CrossRef]
  18. Zepter, J.M.; Lüth, A.; del Granado, P.C.; Egging, R. Prosumer integration in wholesale electricity markets: Synergies of peer-to-peer trade and residential storage. Energy Build. 2019, 184, 163–176. [Google Scholar] [CrossRef]
  19. Iria, J.; Soares, F.; Matos, M. Optimal bidding strategy for an aggregator of prosumers in energy and secondary reserve markets. Appl. Energy 2019, 238, 1361–1372. [Google Scholar] [CrossRef]
  20. Iria, J.; Soares, F.; Matos, M. Optimal supply and demand bidding strategy for an aggregator of small prosumers. Appl. Energy 2018, 213, 658–669. [Google Scholar] [CrossRef]
  21. Vagropoulos, S.I.; Bakirtzis, A. Optimal Bidding Strategy for Electric Vehicle Aggregators in Electricity Markets. IEEE Trans. Power Syst. 2013, 28, 4031–4041. [Google Scholar] [CrossRef]
  22. Englberger, S.; Gamra, K.A.; Tepe, B.; Schreiber, M.; Jossen, A.; Hesse, H. Electric vehicle multi-use: Optimizing multiple value streams using mobile storage systems in a vehicle-to-grid context. Appl. Energy 2021, 304, 117862. [Google Scholar] [CrossRef]
  23. Meteorological Engineering Center, Inc. Solar Power Output Forecasting System Apollon. Available online: https://www.meci.jp/apollon.html (accessed on 29 November 2021).
  24. Breiman, L. Random forests. Mach. Learn. 2001, 45, 5–32. [Google Scholar] [CrossRef][Green Version]
  25. The Kansai Electric Power Co., Inc. Hapi-e-Time R. Available online: https://kepco.jp/ryokin/menu/hapie_r/ (accessed on 29 November 2021).
Figure 1. Diagram of the demonstration experiment.
Energies 14 08309 g001
Figure 2. Calculation flow of user agent.
Energies 14 08309 g002
Figure 3. Relationship between generation rate and predicted price.
Energies 14 08309 g003
Figure 4. Contract price and retail price by user and time period.
Energies 14 08309 g004
Figure 5. Contracted price by user and power generation.
Energies 14 08309 g005
Figure 6. Changes in the status of users who own EVs in the first week.
Energies 14 08309 g006
Figure 7. Changes in the status of users who own EVs in the second week.
Energies 14 08309 g007
Figure 8. Comparison of average SOC of week 1 and week 2.
Energies 14 08309 g008
Table 1. Price table of G r i d P r i c e t .
HourPrice [Yen/kWh]
7:00–10:0022.89
10:00–17:0026.33
17:00–23:0022.89
23:00–7:0015.20
Table 2. Composition of consumers and generators in the demonstration experiment.
TypeUserEV(40 kWh)Data Description
DemandHome1The electric load was reproduced in the experimental environment with a load device based on actual household demand data.
Home2-An almost constant demand pattern was generated in the experimental environment.
Home3-An almost constant demand pattern was generated in the experimental environment.
Home4-An irregularly fluctuating demand pattern was generated in the experimental environment.
SupplyPV1-A PV system placed in the experimental environment was actually generating power.
Table 3. Summary of trading results for the first week.
UserModeAverage Contracted Price [Yen/kWh]Contracted Amount [kWh]Demand [kWh]RE Rate [%]
Home1Economy11.2229.684.834.9
Home2Economy20.139.416.656.6
Home3Economy18.7532.570.646.0
Home4Economy20.3238.2102.637.2
Table 4. Summary of trading results for the second week.
UserModeAverage Contracted Price [Yen/kWh]Contracted Amount [kWh]Demand [kWh]RE Rate [%]
Home1Green22.7543.976.757.2
Home2Economy21.05.015.831.6
Home3Economy20.7515.771.721.9
Home4Economy21.621.4102.320.9
Publisher’s Note: MDPI stays neutral with regard to jurisdictional claims in published maps and institutional affiliations.

