Article

Numerical Modelling of Positive Surface Discharges in C-C4F8/CF3I/N2 Gas Mixture under Non-Uniform Field

1
Academy for Engineering & Technology, Fudan University, Shanghai 200433, China
2
Department of Light Sources and Illuminating Engineering, School of Information Science and Technology, Fudan University, Shanghai 200433, China
3
Department of Electrical Engineering, Shanghai Jiao Tong University, Shanghai 200240, China
*
Author to whom correspondence should be addressed.
Energies 2021, 14(24), 8299; https://doi.org/10.3390/en14248299
Submission received: 16 November 2021 / Revised: 3 December 2021 / Accepted: 7 December 2021 / Published: 9 December 2021
(This article belongs to the Section F: Electrical Engineering)

Abstract

:
As an environmentally friendly gas with good insulation and stable chemical properties, CF3I gas mixture is considered as a potential alternative to SF6 gas to compensate for the shortcomings of SF6 gas as a greenhouse gas. This article attempts to study the CF3I ternary gas mixtures with c-C4F8 and N2 by considering the process of streamer development in surface discharge. The model of surface discharge in CF3I gas mixture under DC voltage was established by COMSOL, and the drift-diffusion equations of particles was solved to show the discharge process, and the changes of electric field and particle concentration, etc. during the development of streamer were obtained, which provides the theoretical basis for the reliable diagnosis of partial discharge. On this basis, the model is compared with models for two other different gases (SF6/N2, artificial air) in terms of particle characteristics, streamer characteristics and streamer branches characteristics. Finally, it is concluded that under this model, although the insulation characteristics in CF3I gas mixture are weaker than those in SF6, the difference is not large and both are much better than those in artificial air, so c-C4F8/CF3I can be considered as a potential substitute for SF6.

1. Introduction

SF6 is a colorless, odorless, non-toxic and non-flammable gas with stable chemical properties and good insulating properties, so it is widely used in electrical equipment [1]. However, SF6 is a greenhouse gas; its GWP (global warming potential) is 23,900, and is listed as one of the main greenhouse gases in the Kyoto Protocol adopted in 1997 [2]. Therefore, it is urgent to find an alternative to SF6.
CF3I is considered as a potential SF6 replacement gas due to its chemical stability and excellent insulation properties. In a slightly non-uniform electrical field, the insulation strength of CF3I is approximately 1.2 times that of SF6 [3]. It has good compatibility with many electrical equipment materials. Its GWP is 5, which is much less than that of SF6 [4]. And the carbon-iodine bond in the CF3I molecule can be broken by solar radiation, leading to CF3I decomposition, which limits its diffusion into the stratosphere and thus reduces its impact on the greenhouse effect. However, its liquefaction temperature is −22.5 °C under normal temperature and pressure [5]. Thus, a buffer gas is needed to lower its liquefaction temperature.
C-C4F8 is also a potential replacement gas for SF6. It has a symmetrical molecular structure and two more fluorine atoms than SF6, so it is more electronegative than SF6 [6]. Its GWP is 3600 [7], which is about one-third of that of SF6. But similar to CF3I, it has a higher liquefaction temperature and requires a mixture of buffer gases [8].
Nowadays, the buffer gases generally chosen are CO2 and N2, and their liquefaction temperature are −78.5 °C and −195.8 °C, respectively, which can well make up for the disadvantage of high liquefaction temperature of electronegative gases [9].
At present, there are many studies on CF3I and c-C4F8 at home and abroad. In order to explore the insulation of CF3I/N2 mixture, Zhang et al. changed the ambient air pressure, gas mixing ratio and other conditions, and finally concluded that 30%CF3I/70%N2 mixture at 0.3 Mpa can replace pure SF6 gas under the low insulation requirement of the equipment [10]. Deng et al., concluded from simulation calculations and breakdown tests that the breakdown voltage of c-C4F8 gas mixtures with N2 or CO2 has a higher breakdown voltage than SF6 at 0.3 Mpa and above [8]. However, c-C4F8 also belongs to the greenhouse gas category, and thus these adverse effects may be attenuated if a mixture of CF3I, c-C4F8 and another buffer gas is used. After that, Zhong et al., conducted a power frequency breakdown tests as well as positive and negative lightning impulse breakdown tests, and found that the power frequency breakdown voltages of CF3I/c-C4F8/CO2 gas mixtures are basically the same as that of c-C4F8/CO2 gas mixture, but are higher than that of CF3I/CO2 gas mixture. In addition, the 50% breakdown voltage of c-C4F8/CF3I/CO2 gas mixtures under lightning impulse are higher than that of CF3I/CO2 [9]. After that, based on Boltzmann simulation method, they studied and analyzed c-C4F8/CF3I gas mixture in terms of electron energy distribution function (EEDF), reduced effective ionization coefficient, critical reduced electrical field strength, electric field sensitivity coefficient, and so on [6]. However, there is little study on the mechanism of streamer generation and the development law of surface discharge in c-C4F8/CF3I gas mixture.
Partial discharge is one of the main reasons that endanger the safe operation of power equipment [11]. And surface discharge is a common phenomenon of partial discharge, so it is necessary to study the surface discharge. The presence of insulators changes the distribution of the electric field and therefore plays a key role in the formation and propagation of the discharge [12]. During the past decades, experimental studies of surface discharge have focused on the measurement of flashover voltages [13] and surface charge accumulation [14]. However, the experimental microscopic study of insulator surface in surface discharge is extremely challenging because a method with low spatial resolution and low temporal resolution down to nanoseconds is required. Therefore, in order to get a closer understanding of surface discharge, a simulation approach is needed. Multiphysics software such as COMSOL have been used for modeling of streamer development in partial discharges. COMSOL, a commercial finite element package, is designed to address a wide range of physical phenomena by combining and coupling different physical phenomena in a single model, represented by partial differential equations. By accurately describing all relevant phenomena, multiphysics simulation can maximise physical insight and predictive power [15]. In the past decades, many simulations have been done by scholars using COMSOL Multiphysics. Peng et al., investigated the effects of primary and secondary streamer on the insulator surface at different pulse amplitudes and different dielectric constants of insulators through experiments and combined with simulations, and also discussed the effects on the particle generation and distribution [16]. Sima et al., studied the streamer transition from the gas gap to the insulator surface, and the surface charge accumulations on the dielectric insulators [17]. Li et al., studied the properties of negative surface discharge in artificial air and discussed the effect on the streamer characteristics under different applied voltages and different relative dielectric constants of the insulator [18]. However, the gases they chose were generally air or SF6 and its mixtures, and little research has been done to discuss some of the phenomenon that occur when the streamer conducts the electrode.
In this paper, a model of positive surface discharge under an environmentally friendly gas c-C4F8/CF3I/N2 mixture is simulated using COMSOL Multiphysics with the aim of revealing the streamer development characteristics of surface discharge in the gas mixture. The model is composed of a needle-plane electrode and an insulator made of epoxy resin. The effective ionization coefficients of the gas are verified in comparison with the results in the reference. The physical mechanism of the surface discharge is revealed by the electric field and particle concentration at the head of the streamer during the development of the streamer. And based on this model. The insulating properties of the gas are explored in comparison with the model of positive surface discharge under the gas as SF6/N2 and artificial air.

2. Model Description
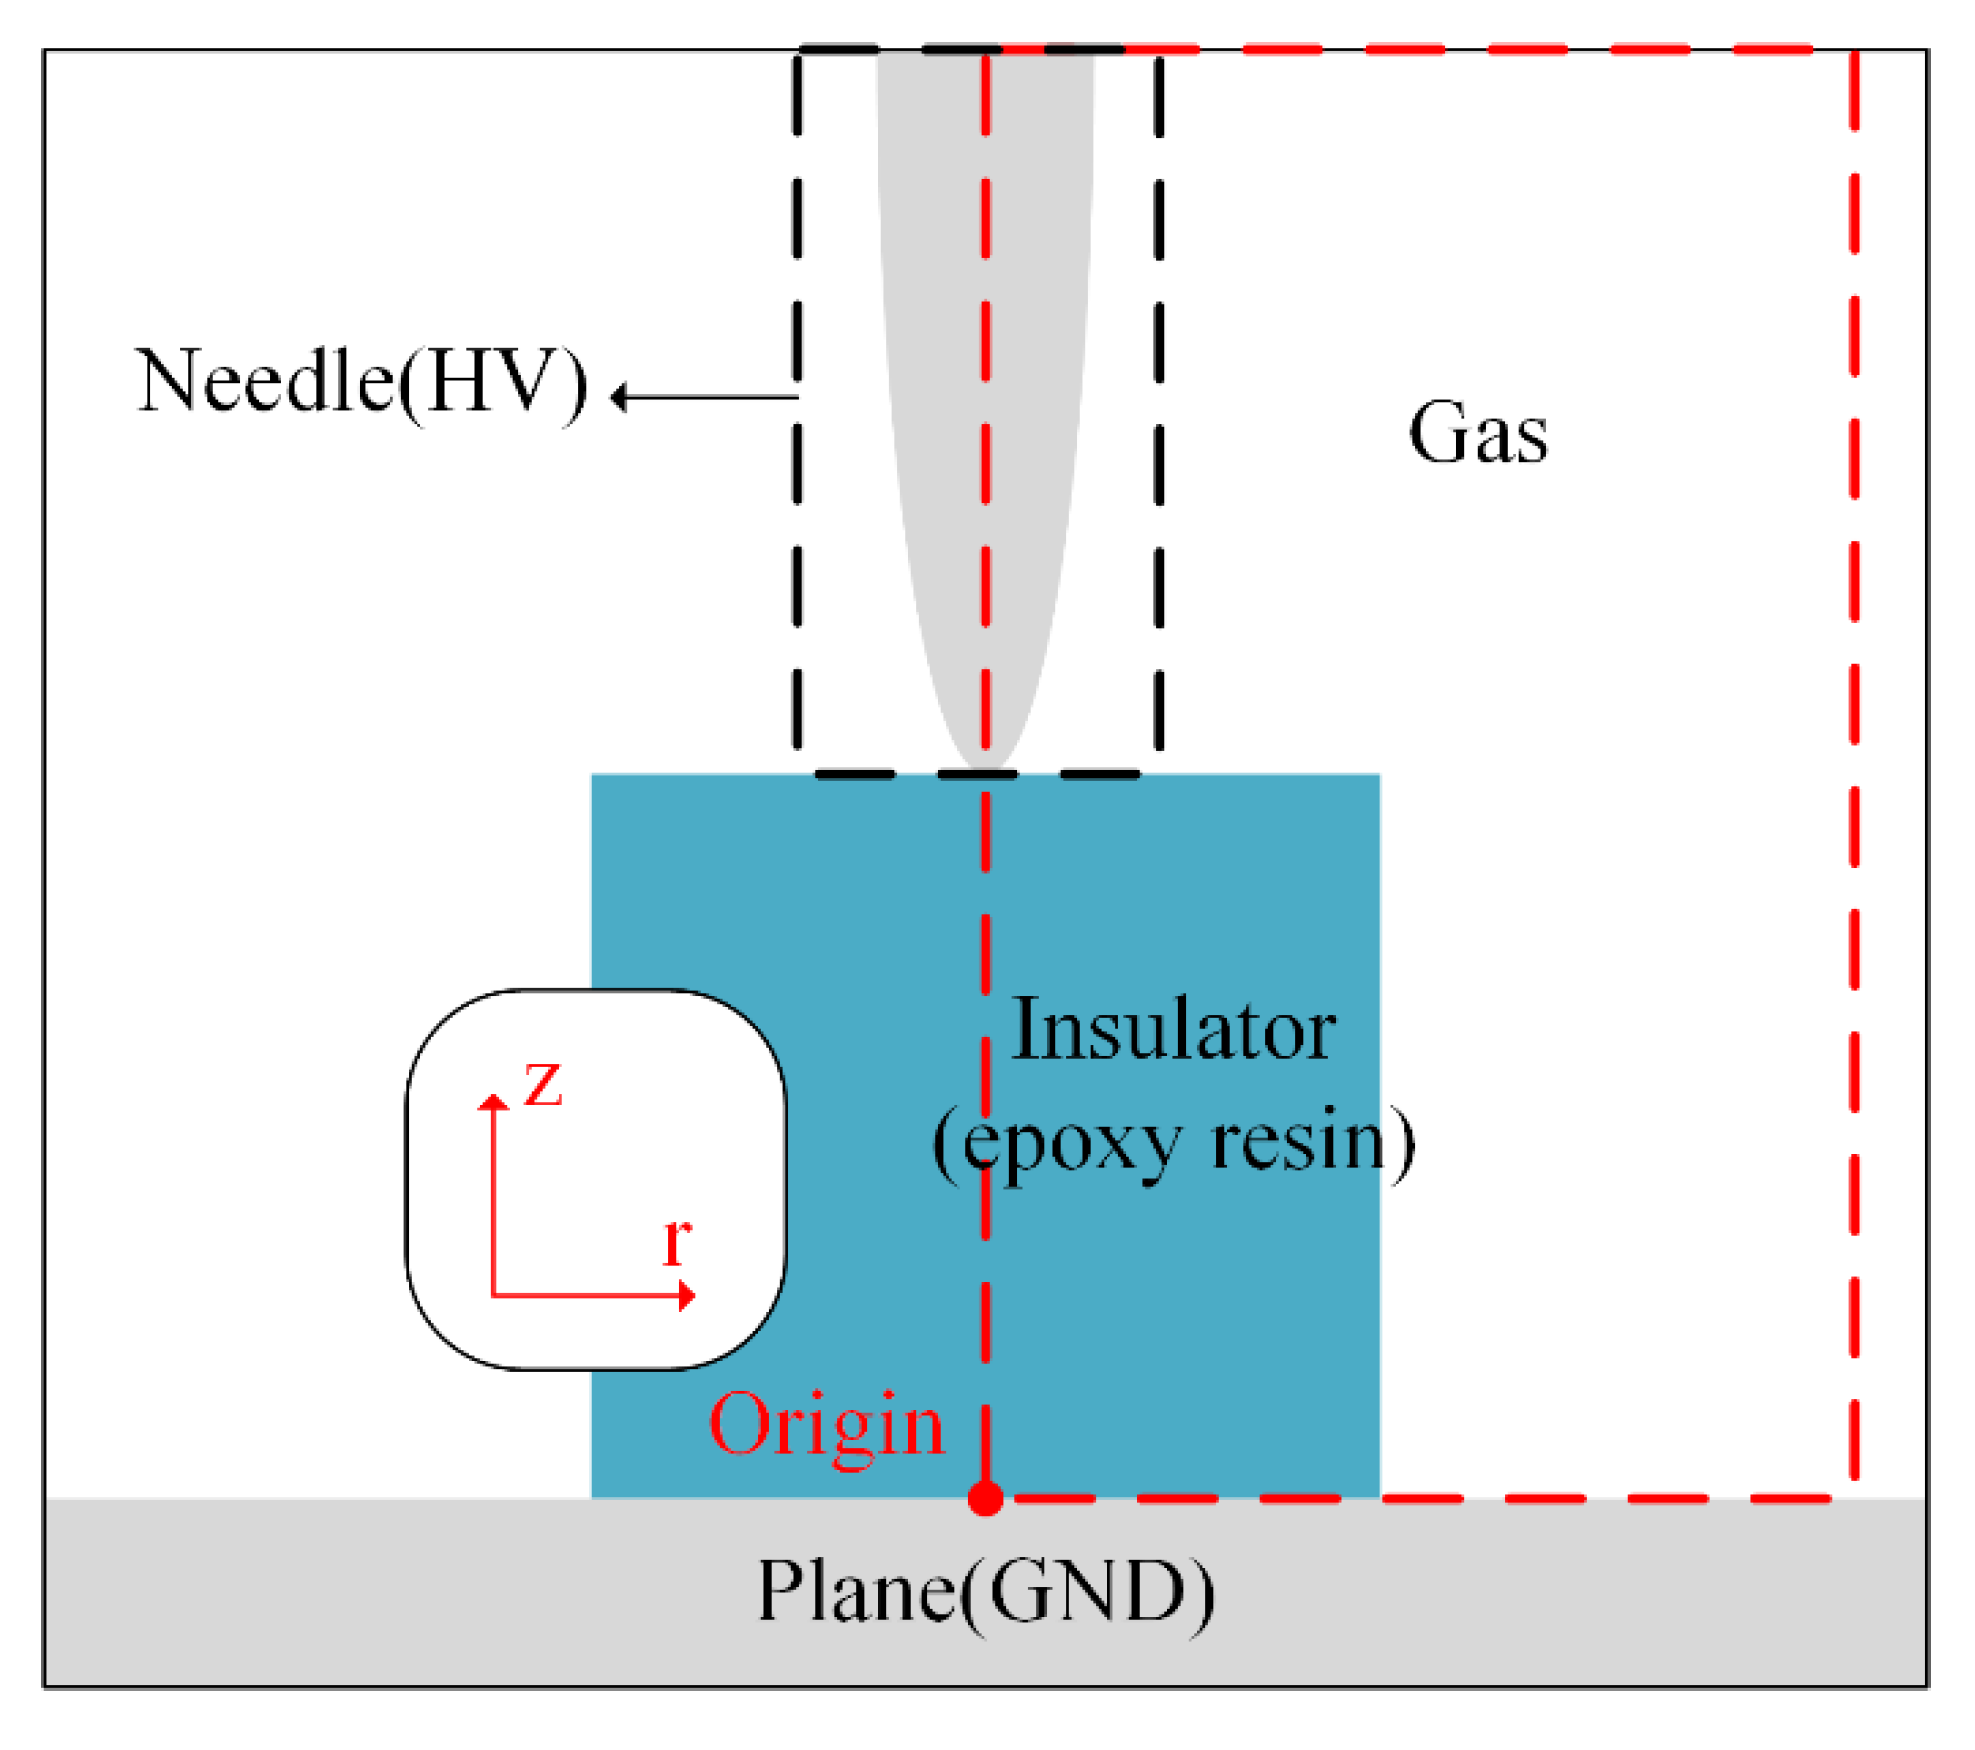
2.1. Physical Model

The model in this paper is a two-dimensional axisymmetric structure, consisting of a flat dielectric inserted between the needle-plane electrodes, as shown in Figure 1. The simulated area is the part enclosed by the red dotted line in the figure, whose size is 5 mm × 8 mm. The length of the needle electrode is taken as 4 mm, and a positive DC voltage is added to it, as shown in the part enclosed by the black dotted line in Figure 1. The plane electrode is grounded, which is the gray rectangle at the bottom in Figure 1, and the gap between the needle-plane electrode is 4 mm. In Figure 1, the white area part is the gas, and the blue part is the insulator, which is a cylinder with a height of 4 mm, a radius of 2 mm and its material is epoxy resin, which has been widely used in high voltage apparatus as insulation [19]. The mesh of the model is shown in Figure 2b. The streamer mainly develops along the insulator surface, so the mesh delineation is finer for the insulator surface and the vicinity of the needle.
The ionization coefficient and the attachment coefficient will be varied by the change of electric field. When the ionization coefficient minus the attachment coefficient is zero, the corresponding electric field at that time is called critical electric field. In general, as the electric field increases, the ionization coefficient increases, the ionization reaction is stronger and more electrons are generated, the attachment coefficient decreases, the attachment reaction weakens, and the electron production is hindered, so the critical electric field of the gas can be evaluated theoretically to assess the insulation strength of the gas. According to the Ref. [6], the critical electric field of CF3I/c-C4F8/70%N2 is higher than that of the same concentration ratio of CF3I/c-C4F8/70%CO2, so N2 is selected as the buffer gas in this article. At the same time, in this reference, it can be seen that when the k (k denotes the percentage of CF3I in CF3I/c-C4F8/70%N2) in the gas mixture is 10%, 15% and 20% are basically the same, but considering that c-C4F8 is also a greenhouse gas, it is used as little as possible, thus the gas chosen here is 20%CF3I/10%c-C4F8/70%N2.

2.2. Numerical Simulation Model

The processes of generation, loss and movement of charge particles, such as electrons, positive ions, negative ions, etc., can be considered as a fluid model. Based on the well-known drift-diffusion equation, the whole process of particles satisfies the following equation:
n e t + ( μ e n e E - D e n e ) = S p h + α n e | μ e E | η n e | μ e E |
n p t + ( μ p n p E D p n p ) = S p h + α n e | μ e E |
n n t + ( μ n n n E D n n n ) = η n e | μ e E |
These three equations are the drift-diffusion equations for electrons, positive ions and negative ions, respectively. In this set of equations, the combination reactions of positive ions with negative ions and electrons are not considered in this article. Where the subscripts e, n and p represent electrons, negative ions and positive ions, respectively. E denotes the electric field vector; n, μ, α, and η denote the number density, mobility, ionization coefficient, and diffusion coefficient of the gas, respectively. And Sph denotes the photoionization term. According to Refs. [20,21], the photoionization term can be simplified to a uniform background ionization, i.e., the source term Sph can be set to a constant, assuming the existence of a uniform ionization reaction in gas space that is not affected by the applied electric field, and replacing photoionization with that ionization reaction, and the validity of this method has been verified. And the ion can be considered as stationary in a few nanoseconds, because the charge-to-mass ratio of the ion is much smaller than that of the electron [22].
The set of drift-diffusion equations needs to be solved by coupling Poisson’s equation, as shown in Equation (4). However, the space charge dynamics inside the solid is different from that in gas, and the time required for the particles to move inside the insulator is much larger than the time required for the streamer propagation [17]. Therefore, the insulator interior can be considered as satisfying the condition of no space charge, as shown in Equation (5):
2 V = e ( n p n e n n ) ε 0
2 V = 0
where ε0 is the vacuum dielectric constant, V is the space electric potential, and e is the elementary charge.

2.3. Boundary and Initial Conditions

The pressure and the temperature of the 10%c-C4F8/20%CF3I/70%CO2 mixture gas is 0.1 Mpa and 300 K, respectively. The voltage applied on the needle electrode is 25 kV.
These three drift-diffusion equations coupled with Poisson’s equation are solved using commercial finite element package COMSOL, and the time step is chosen to be 0.01 ns. The initial density distribution of electrons and positive ions satisfies the Gaussian distribution [23]:
n e , p = n max × exp ( ( r r 0 ) 2 2 s 0 2 ( z z 0 ) 2 2 s 0 2 )
where n m a x = 10 20 ( 1 / m 3 ) , and (r0, z0) is the coordinates of needle tip. s 0 = 25   μ m represents the radius of the initial distribution of particles. The initial density distribution of negative ions is set to zero. The initial maximum value of the electric field is at the junction of the needle tip, insulator and gas, so a large number of particles will gather here.
The serial number of each boundary is marked in Figure 2a. The boundary conditions of B1–B5 are taken from the Ref. [24]. The most important boundary conditions in this model are the insulator surface (i.e., B6 and B7). The insulator surface allows electrons and negative ions to penetrate, but it is generally assumed that no positive ions will enter the gas from the insulator [24], so the boundary conditions for B6 and B7 satisfy the following equation in the drift-diffusion equation for positive ions:
n ( μ p n p E D p n p ) = 0
where n is the normal direction of gas-insulator interface. And in the drift-diffusion equation for negative ions, the boundaries B6 and B7 satisfy the convective flux condition as follows:
n D p n p = 0
In the drift-diffusion equation for electrons, there is a secondary emission of electrons due to electron impact on the insulator surface, satisfying the following [25]:
Γ e n = 1 γ e 1 + γ e [ μ e | E n | n e + 1 2 v e , t h n e ]
where Γe represents electron flux, and γe is the classical secondary emission coefficient. νe,th is the thermal velocity of electron:
v e , t h = 8 k B T π m e
where kB is the Boltzmann constant, me is the electron mass, T is the particle temperature.
And in Poisson’s equation, there is an accumulation of charge on the insulator surface satisfying the following boundary conditions:
ρ s t = n J
where ρs represents the surface charge density, and J are the total current density of electrons and ions, but due to the low mobility of ions, the current density generated by the ions can be neglected here [18].

2.4. Reactions in Gas Mixture

According to Ref. [26], under high electric field, the charge on the insulator surface mainly originates from the gas discharge. Gases involved in this paper are 10%c-C4F8/20%CF3I/70%N2 gas mixture, SF6/N2 gas mixture and artificial air. Electron collision reactions (elastic collision reactions, attachment reactions, ionization reactions and excitation reactions) of five gas molecules, SF6, c-C4F8, CF3I, N2, O2, are considered. The electron collision reactions involved in the four molecules are shown in Table 1, and for convenience, we have abbreviated the excitation reactions of each type of gas into one equation. Among them, the collisional cross section data for O2, N2 and SF6 are from the database LXcat database. The ionization, elastic and excitation cross section of CF3I are also from LXcat database, and the attachment cross section of CF3I is from Ref. [27]. The attachment cross section of c-C4F8 is from Ref. [28], the ionization cross section of c-C4F8 is from Ref. [29], and the elastic cross section and excitation cross-section are from Ref. [8]. Finally, the effective ionization coefficients of the gas mixture were obtained by solving with the BOLSIG+ software, which is in general agreement with the results in the Ref. [6], as shown in Figure 3.

3. Results and Discussion

3.1. Streamer Development Process

In the initial stage of the model, most of the positive ions and electrons are distributed near the needle electrode because they satisfy the Gaussian distribution. At this time, there is a voltage on the needle electrode, and the initial electrons will move away from the needle electrode, i.e., toward the high potential, and during the movement they will collide and react with the neutral molecules N2, CF3I and c-C4F8 in the environment, producing new electrons, positive and negative ions. If the voltage at the tip of the needle is sufficiently large to make the ionization intensity near the needle tip greater than that of the gas, then an electron avalanche will occur at this time, producing a large number of positive ions and electrons. Because the charge-to-mass ratio of positive ions is several orders of magnitude smaller compared to that of electrons, resulting in the movement of positive ions is much smaller than that of electrons. The electrons keep moving toward the needle electrode and are absorbed after contact, while the positive ions are left almost in place without movement. As the positive ions continue to accumulate, the space charge effect will be more significant, the electric field in the region will also continue to increase, if a critical value is reached, a new electron avalanche will be generated, prompting the streamer to continue to develop along the upper surface of the insulator.
After the streamer starts to develop, it will first develop along the upper surface of the insulator, as shown in Figure 4a–c, and this stage consumes about 0.36 ns. At this stage, as the streamer moves gradually away from the needle electrode along the upper surface of the insulator, the background electric field of the streamer head gradually becomes smaller, resulting in an increase in the attachment coefficient of the gas mixture and a decrease in the ionization coefficient, which inhibits the generation of electrons and leads to a slowdown in the development of the streamer and a gradual decrease in the electric field at the head of the streamer, and Figure 5 gives a graph of the electric field change throughout the streamer development process. It can also be seen that a strong electric field occurs inside the insulator in Figure 4b, which is consistent with the results in Ref. [18].
After that, the streamer enters the transition stage, from the upper surface of the insulator to the right surface. This stage has the slowest development speed. And the electric field at the streamer head is also the smallest, because the distance from the needle electrode and the plane electrode is very far, resulting in a small background electric field. At this stage, because the streamer has a positive velocity along the r-axis and according to Figure 6, the potential of the streamer head is greater than the surrounding potential, and the potential gap is especially obvious in the 90° range from the negative direction of the z-axis to the positive direction of the r-axis, which led to the streamer branches. This phenomenon is similar to the result in Ref. [30].
Then, the main streamer develops along the right surface of the insulator, and the speed of streamer gradually increases, and the electric field of the streamer head gradually becomes large, too. When it develops near the plane electrode, the electric field of the streamer will have a sudden change, and finally contact with the plane electrode. From Figure 4d–i, we can see this stage takes a total of 1.91 ns, which occupies most of the time of the whole process. According to the Figure 4e,f, we can see that the streamer channel of the main streamer and streamer branches gradually become inconspicuous. This is caused by the strong electronegativity of the gas. The gap molecules absorb a large number of electrons, so they cannot form enough reverse field strength to counteract the field strength of the needle-plane electrode, resulting in a less obvious channel. At the same time, it can be seen that the electric field at the head of the streamer branch is gradually decreasing, this is because the streamer branch is developing away from the insulator, which is also further away from the needle electrode, where the background electric field is very small, if the electric field is less than a critical value, the streamer will stop developing.
Finally, the streamer contacts the plane electrode. At the moment of contact, the discharge intensity around the plane electrode increases significantly, after which the discharge intensity on the insulator surface also gradually increases. The variation of electron concentration with time for the four points in Figure 2a is given in Figure 7. The streamer contacts with the plane electrode at 2.49 ns, and the electron concentration at point P4 show a significant increase at the moment of contact, indicating that the discharge intensity increases significantly at this time. P3 shows a sudden increase in electron concentration around 2.60 ns, and P1 and P2 start to become larger around 2.80 ns, indicating that the discharge on the insulator surface both start to increase. This result is in general agreement with the experimental results in the Ref. [31].

3.2. Comparison with SF6/N2 and Artificial Air

In order to further investigate the discharge characteristics of 10%c-C4F8/20%CF3I/70%N2 gas mixture, based on Section 3.1, we compare this model with the model of artificial air (20% O2, 80% N2) and the model of 30%SF6/70%N2 to investigate the 10%c-C4F8/20%CF3I/70%N2 gas mixture from a microscopic perspective. We refer to the model with 10%c-C4F8/20%CF3I/70%N2 gas mixture as model A, the model with 30%SF6/70%N2 gas mixture as model B, and the one with artificial air as model C.

3.2.1. Comparison of Particle Properties

The distribution of various types of particles in these three models when the streamer develops to the midpoint of the right surface of the insulator is given in Figure 8. Figure 8a–c show the electron concentration distribution of 10%c-C4F8/20%CF3I/70%N2, 30%SF6/70%N2 and artificial air, respectively. And the maximum values of electron concentration are 4.77 × 10 21 ( 1 / m 3 ) , 1.63 × 10 21 ( 1 / m 3 ) and 4.29 × 10 22 ( 1 / m 3 ) , respectively. It can be seen that the electron concentration in model A is higher than that in model B, but the difference is not obvious, while comparing to model C, it can be found that the value of electron concentration in model C is one order of magnitude larger than the first two models. Figure 8d–f are the distribution of negative ions in model A, B and C, respectively. The maximum values of negative ion concentration on the insulator surface are 9.36 × 10 22 ( 1 / m 3 ) , 3.75 × 10 22 ( 1 / m 3 ) and 1.43 × 10 21 ( 1 / m 3 ) . The negative ions in the model C is much smaller than the other two models, and the difference between the negative ion concentrations in the model A and B is not large.
At the same time, according to Figure 8c, we can see that in the model C, there is a very obvious layer of electrons on the insulator surface, while in the model A and B, the electron concentration can only be seen clearly in the streamer head, and the electrons are more uniformly distributed, which is because the gas molecules in 10%c-C4F8/20%CF3I/70%N2 gas mixture and 30%SF6/70%N2 have strong adsorption of electrons, and when the streamer passes through, the electric field strength at streamer channel is very small, and the smaller the electric field strength is, the larger the attachment reaction coefficient of the gas is, and the smaller the ionization coefficient is. Ionization reactions produce electrons and attachment reactions consume electrons. Therefore, the neutral molecules in the gas will absorb a large number of electrons, which leads to the adsorption of all the electrons in the streamer channel to generate negative ions, so there is a phenomenon that the density of negative ions in the model A, B is much larger than in the model C, but the concentration of electrons is much lower than in the model C.

3.2.2. Comparison of Streamer Characteristics

The process of streamer development in these three models is roughly the same. The whole process is described in Section 3.1, but there are still some differences.
First of all, there is a difference in the electric field at the head of the streamer. The electric field at the head of all three models A, B, C is decreasing as it develops on the upper surface of insulator. At the early stage of development, the difference in the electric field values between the three models is not large, and the difference in the development velocity is also not large. The timepoints corresponding to the development of streamer to the right end of the upper surface of the insulator in the three models are 0.36 ns, 0.42 ns and 0.30 ns, respectively, as shown in Figure 9a–c. However, according to the results in Section 3.1, we can see that this stage only accounts for about a quarter of the whole process time, and because all other conditions in the three models are the same except for the gas conditions, the difference in the starting speed of streamer propagation is not large, so although the strong adsorption of the gas has an inhibitory effect on the streamer propagation, the difference in the starting speed is not large and the development distance is not far, so no significant difference can be seen. And when the streamer propagates on the right surface of the insulator, according to the Figure 9d–i, the time corresponding to the three models at this stage are 1.90 ns, 2.60 ns, 0.83 ns, and model A, B are obviously much slower than the development speed of model C. The electric field strength of the head of the streamer in model A and B is obviously smaller than that in model C. It can be seen that when the streamer develops near the plane electrode, the electric field of the head of the streamer in model C is even an order of magnitude large than the other two. This is because the electron concentration in model C is significantly larger than that in model A, B according to Section 3.2.1, resulting in a lower frequency of ionization reactions occurring within the gas in model A, B, and a clear difference due to the fact that electric field in model C is larger than that in models A, B at the initial moment of the development of the streamer on the right surface.
Secondly, there is a difference in the streamer channel. As can be seen from the Figure 9g–i, the streamer channel in model C is more obvious compared to the other two. In models A and B, the streamer channel is almost only visible at the head of the streamer, while in model C, the channel from the needle electrode all the way to head of the streamer can be clearly seen. We know that the reason for the formation of the streamer channel is that the electrons move toward the anode and the electric field generated by the electrons and the positive ions is opposite to the electric field generated by the needle-plane electrode itself, so the electric field inside the channel will be small, while in the model C, the concentration of electrons is higher than the other two, and the electric field formed between them and the positive ions will be large, so the electric field inside the streamer channel is obviously smaller than the electric field outside the channel. And because the electron concentration in model A and B is much smaller than that in model C according to the results in Section 3.2.1, the streamer channel in these two models will be less obvious.

3.2.3. Comparison of Streamer Branch Characteristics

Firstly, the streamer branch is similar to the main streamer in model A and B, the streamer channel is not obvious, only the head of the streamer is obvious, while in model C, the channel of the streamer branch can be clearly seen, the reason for this result is also consistent with that described in Section 3.2.2.
Secondly, according to the Figure 7g–i, it can be seen that the streamer branches generated in the transition stage in all three models will develop away from the right surface of the insulator toward the direction close to the plane electrode, and the phenomenon is basically similar, but according to the red dashed part in Figure 9i, in model C, the streamer will also generate streamer branches when it develops on the right surface, and these branches will stop developing soon, while this phenomenon is not seen in model A, B. This is a consequence of the potential distribution generated. Figure 10 gives the potential distribution in the three models when the streamer develops on the right surface at a distance of 20 mm from the plane electrode. The dashed part is the location of the streamer head. It can be seen that at this time in model C, the electric field at the head of the streamer is almost close to the needle electrode potential, while in model A and B, it is about half of the needle tip potential, which is also the result of the low electron concentration in the streamer channel, because the electron concentration in the streamer channel is low and the electric field generated by the needle-plane electrode offset less, the electric field strength in the channel is significantly greater than that in model C, so there is a significant potential gradient in the channel. Thus, its potential gradient along the r-axis positive direction is much smaller than that in model C, resulting in an electric field in this direction that is not large enough to produce branches.

4. Conclusions

In this paper, the process of positive surface discharge under 10%c-C4F8/20%CF3I/70%N2 is studied and compared with the model in 30%SF6/70%N2 and artificial air in the three aspects of particle properties, streamer properties and streamer branches. The conclusions are as follows:
(1)
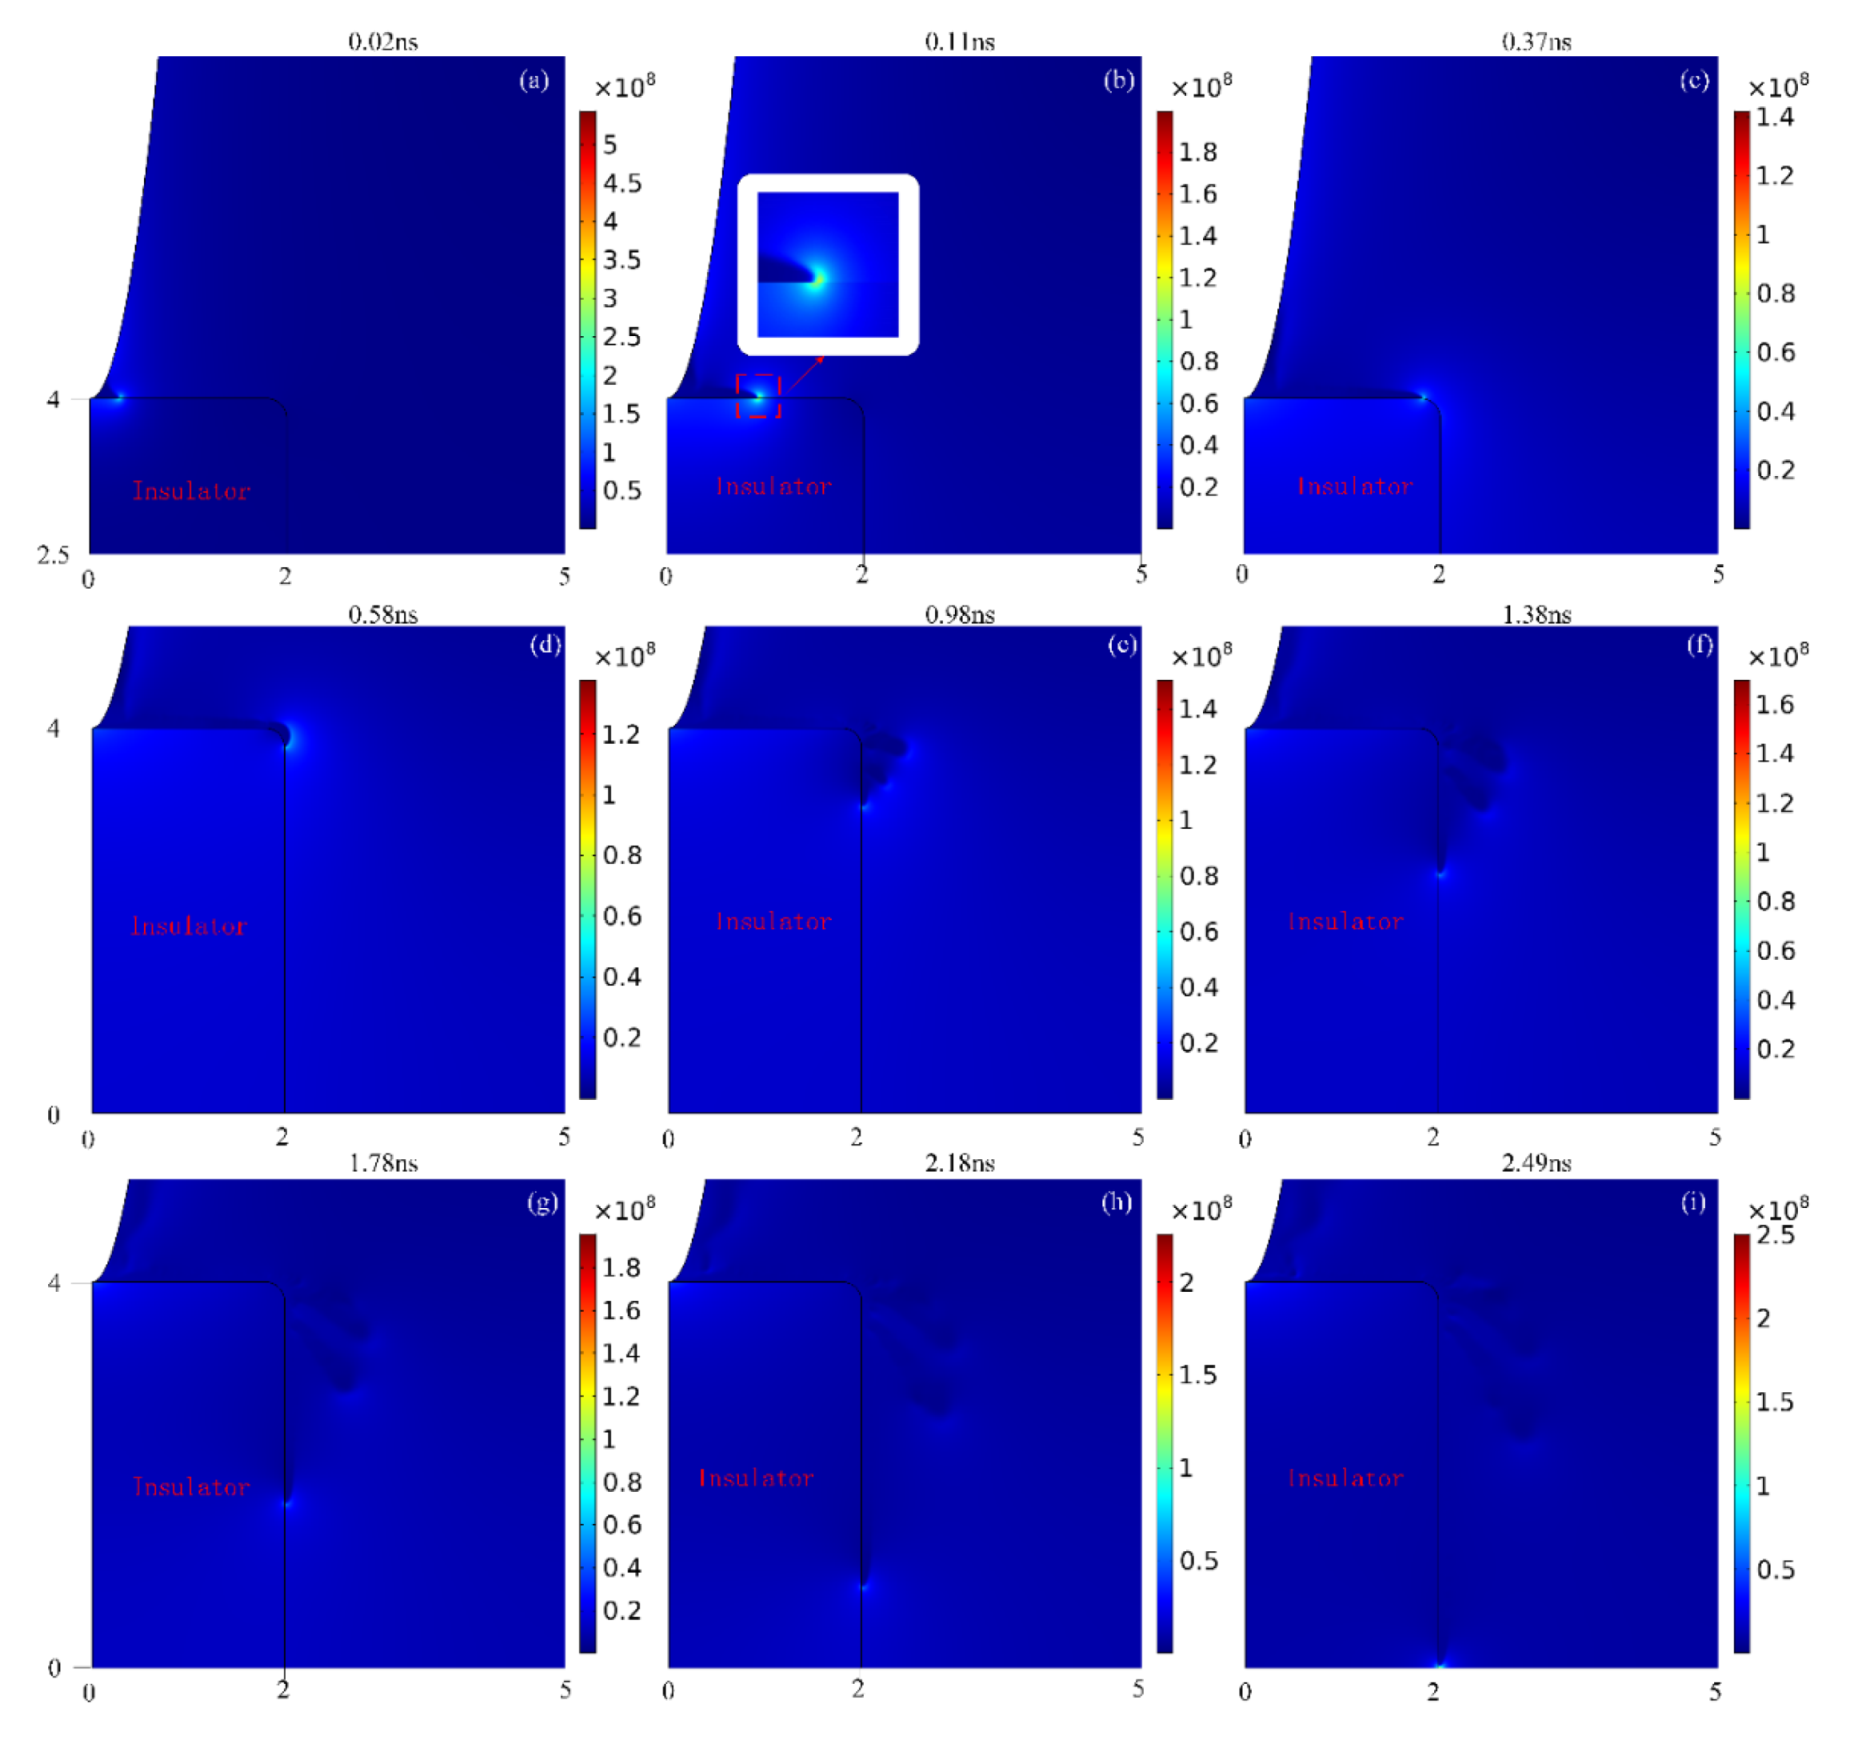
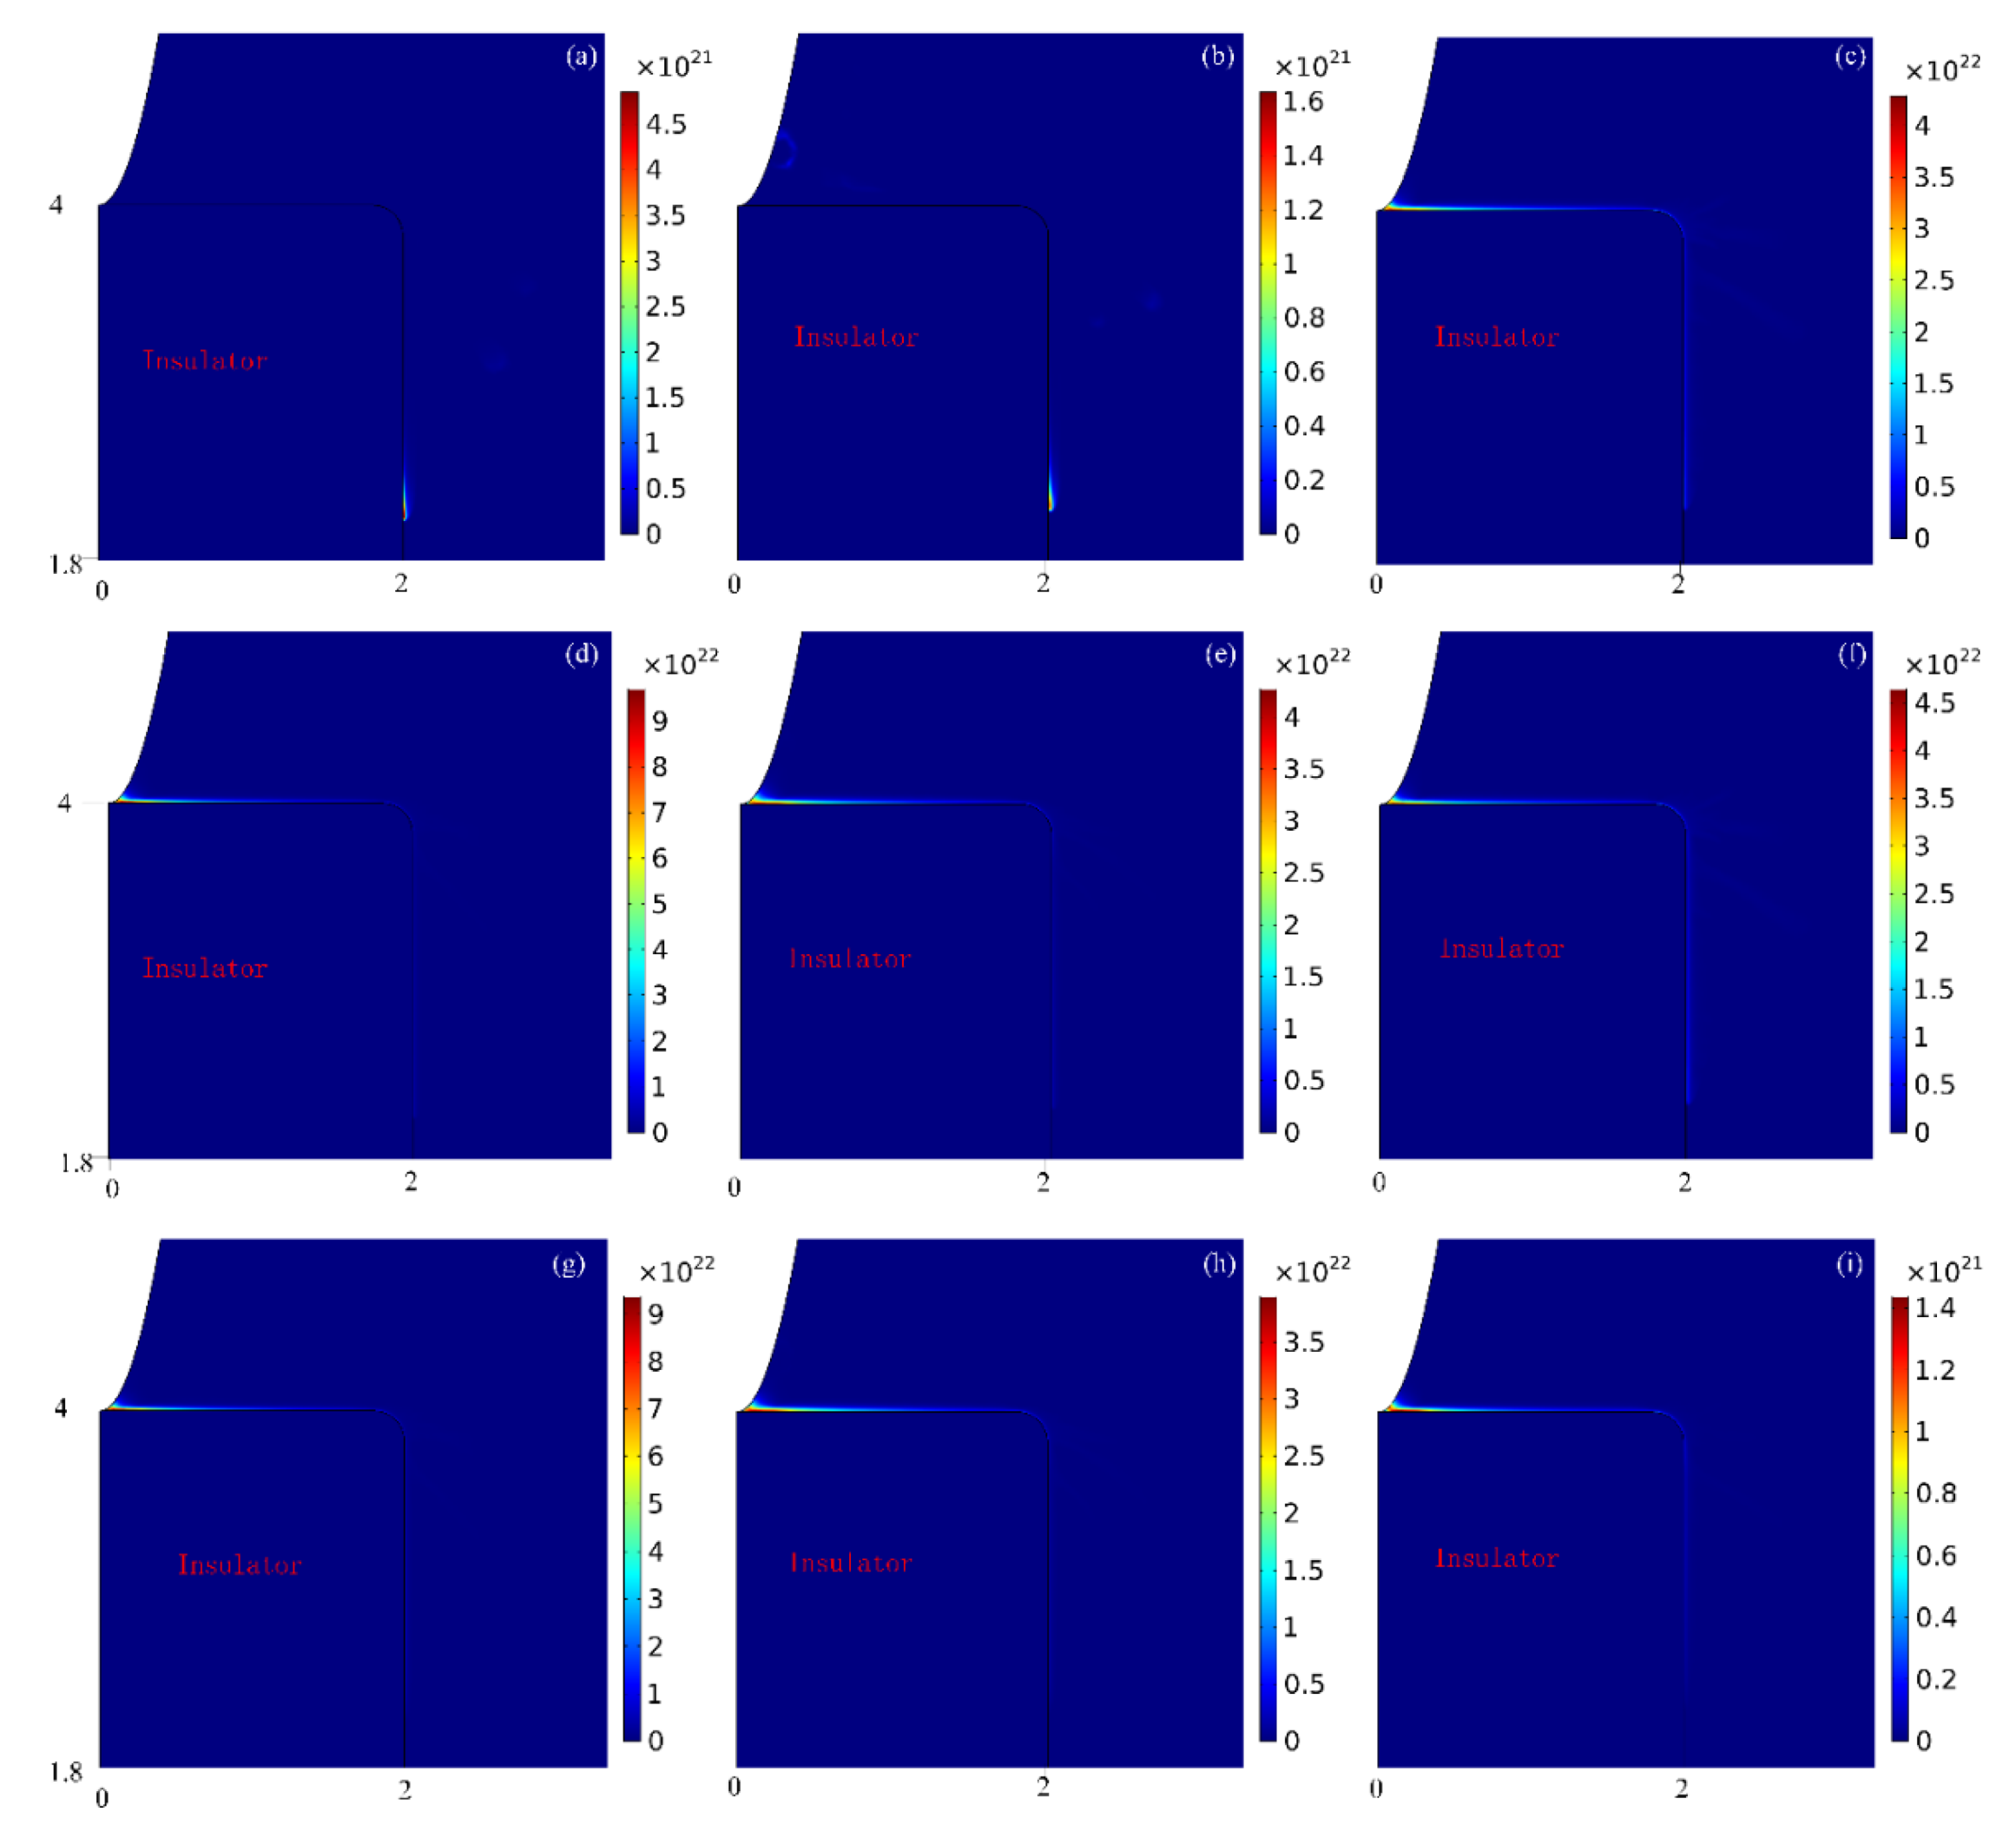
The development process of streamer is as follows: First, the streamer starts from generation and keeps developing along the upper surface of the insulator; then transitions form the upper surface of the insulator to the right surface, and at the meanwhile, the streamer branch appears; later, the streamer along the surface keeps accelerating towards the plane electrode, while the streamer branches become weaker and weaker. Finally, the moment of contact between the streamer and the plane electrode, the discharge in the area near the plane electrode is intensified, and after that the discharge on the insulator surface is also intensified.
(2)
In terms of particle properties, the differences in model A and B are not very different, while in model C, the electron concentration is much larger and more dispersed than the first two models, and its negative ion concentration is much smaller than that of the first two.
(3)
For the streamer properties, the streamer in model A develops faster than in model B, but the streamer development speed of both is much slower than that of model C. This is due to the SF6, CF3I and c-C4F8 molecules in model A and B have strong attachment, adsorbing a large number of electrons, and high electron density is also an important reason for the accelerated development of streamers. In addition, the streamer channels in models A and B are less obvious than those in model C, and the streamer channels in models A and B can almost only be seen near the streamer head.
(4)
Finally, in terms of streamer branches, model C is more prone to streamer branches, because many short streamer branches occur when the main streamer develops on the right surface of the insulator, whereas this phenomenon is not observed in models A and B.
Therefore, just from these three aspects, although the insulation capacity of 10%c-C4F8/20%CF3I/70%N2 is worse than that of 30%SF6/70%N2, the difference is not so great that it can be used as a potential substitute gas for SF6. However, simulations or experiments are still needed for this gas to fully analyze whether it can indeed become a substitute for SF6, such as its properties under other defects.

Author Contributions

Conceptualization, B.F.; software, B.F.; data curation, B.F.; formal analysis, B.F.; methodology, B.F.; funding acquisition, X.Z.; supervision, Y.Q., Y.Z., Z.L., and X.Z.; writing-original draft, B.F. All authors have read and agreed to the published version of the manuscript.

Funding

This work was supported by the National Natural Science Foundation of China (NO. 62075045).

Data Availability Statement

Not applicable.

Conflicts of Interest

The authors declare no conflict of interest.

References

  1. Deng, Y.; Xiao, D. The effective ionization coefficients and electron drift velocities in gas mixtures of CF3I with N2 and CO2 obtained from Boltzmann equation analysis. Chin. Phys. B 2013, 22, 035101. [Google Scholar] [CrossRef]
  2. Li, X.; Zhao, H.; Wu, J.; Jia, S. Analysis of the insulation characteristics of CF3I mixtures with CF4, CO2, N2, O2 and air. J. Phys. D Appl. Phys. 2013, 46, 345203. [Google Scholar] [CrossRef]
  3. Toyota, H.; Matsuoka, S.; Hidaka, K. Measurement of sparkover voltage and time lag characteristics in CF3I-N2 and CF3I-air gas mixtures by using steep-front square voltage. IEEJ Trans. Fundam. Mater. 2005, 125, 409–414. [Google Scholar] [CrossRef]
  4. Yokomizu, Y.; Ochiai, R.; Matsumura, T. Electrical and thermal conductivities of high-temperature CO2-CF3I mixture and transient conductance of residual arc during its extinction process. J. Phys. D Appl. Phys. 2009, 42, 215204. [Google Scholar] [CrossRef]
  5. Katagiri, H.; Kasuya, H.; Mizoguchi, H.; Yanabu, S. Investigation of the performance of CF3I gas as a possible substitute for SF6. IEEE Trans. Dielectr. Electr. Insul. 2008, 15, 1424–1429. [Google Scholar] [CrossRef]
  6. Zhong, R.; Zhao, S.; Xiao, D.; Wang, H.; Jiang, X.; Yu, Z.; Deng, Y. Investigation of the performance of CF3I/c-C4F8/N2 and CF3I/c-C4F8/CO2 gas mixtures from electron transport parameters. Plasma. Sci. Technol. 2020, 22, 055402. [Google Scholar] [CrossRef]
  7. Liu, X.; Wang, J.; Wang, Y.; Zhang, Z.; Xiao, D. Analysis of the insulation characteristics of c-C4F8/CO2 gas mixtures by the Monte Carlo method. J. Phys. D Appl. Phys. 2008, 41, 015206. [Google Scholar] [CrossRef]
  8. Deng, Y.; Xiao, D. Analysis of the insulation characteristics of c-C4F8 and N2 gas mixtures by Boltzmann equation method. Eur. Phys. J. Appl. Phys. 2012, 57, 20801. [Google Scholar] [CrossRef]
  9. Zhong, R.; Zhao, S.; Zhao, X.; Xue, P.; Jiao, J.; Xiao, D. Insulation characteristics of CF3I/c-C4F8/N2 gas mixtures in slightly non-uniform electric field. IEEE Trans. Dielectr. Electr. Insul. 2018, 25, 1371–1379. [Google Scholar] [CrossRef]
  10. Zhang, X.; Xiao, S.; Han, Y.; Cressault, Y. Experimental studies on power frequency breakdown voltage of CF3I/N2 mixed gas under different electric fields. Appl. Phys. Lett. 2016, 108, 092901. [Google Scholar] [CrossRef]
  11. Zang, Y.; Qian, Y.; Wang, H.; Xu, A.; Sheng, G.; Jiang, X. Method of GIL discharge localization based on natural neighbor interpolation and ECOC-MLP-SVM using optical simulation technology. High Volt. 2021, 6, 514–524. [Google Scholar] [CrossRef]
  12. Meyer, H.; Mauseth, F.; Marskar, R.; Pedersen, A.; Blaszczyk, A. Streamer and surface charge dynamics in non-uniform air gaps with a dielectric barrier. IEEE Trans. Dielectr. Electr. Insul. 2019, 26, 1163–1171. [Google Scholar] [CrossRef]
  13. Li, X.; Liu, Z.; Li, W.; Sun, G.; Xue, J.; Wang, C.; Zhang, G. 3D printing fabrication of conductivity non-uniform insulator for surface flashover mitigation. IEEE Trans. Dielectr. Electr. Insul. 2019, 26, 1172–1180. [Google Scholar] [CrossRef]
  14. Li, C.; Lin, C.; Chen, G.; Tu, Y.; Zhou, Y.; Li, Q.; Zhang, B.; He, J. Field-dependent charging phenomenon of HVDC spacers based on dominant charge behaviors. Appl. Phys. Lett. 2019, 114, 202904. [Google Scholar] [CrossRef]
  15. Dickinson, E.; Ekstrom, H.; Fontes, E. COMSOL Multiphysics®: Finite element software for electrochemical analysis. A mini-review. Electrochem. Commun. 2014, 40, 71–74. [Google Scholar] [CrossRef]
  16. Peng, B.; Jiang, N.; Yao, X.; Ruan, Y.; Wang, D.; Shang, K.; Lu, N.; Namihira, T.; Li, J.; Wu, Y. Experimental and numerical studies of primary and secondary streamers in a pulsed surface dielectric barrier discharge. J. Phys. D Appl. Phys. 2019, 52, 325202. [Google Scholar] [CrossRef]
  17. Sima, W.; Shi, J.; Yang, Q. Surface discharge simulation in SF6 and N2 mixtures with a plasmachemical model. Surf. Rev. Lett. 2014, 21, 1450010. [Google Scholar] [CrossRef]
  18. Li, X.; Sun, A.; Teunissen, J. A computational study of negative surface discharges: Characteristics of surface streamers and surface charges. IEEE Trans. Dielectr. Electr. Insul. 2020, 27, 1178–1186. [Google Scholar] [CrossRef]
  19. Bian, W.; Yao, T.; Chen, M.; Zhang, C.; Shao, T.; Yang, Y. The synergistic effects of the micro-BN and nano-Al2O3 in micro-nano composites on enhancing the thermal conductivity for insulating epoxy resin. Compos. Sci. Technol. 2018, 168, 420–428. [Google Scholar] [CrossRef]
  20. Luo, B.; He, H.; Cheng, C.; Xia, S.; Chen, W. Numerical simulation of the positive streamer propagation and chemical reactions in SF6/N2 mixtures under non-uniform field. IEEE Trans. Dielectr. Electr. Insul. 2020, 27, 782–790. [Google Scholar] [CrossRef]
  21. Dhali, S.; Pal, K. Numerical simulation of streamers in SF6. J. Appl. Phys. 1988, 63, 1355–1362. [Google Scholar] [CrossRef]
  22. Kulikovsky, A. Two-dimensional simulation of the positive streamer in N2 between parallel-plate electrodes. J. Phys. D Appl. Phys. 1995, 28, 2483–2493. [Google Scholar] [CrossRef]
  23. Dordizadeh, P.; Adamiak, K.; Castle, G. Numerical investigation of the formation of Trichel pulses in a needle-plane geometry. J. Phys. D Appl. Phys. 2015, 48, 415203. [Google Scholar] [CrossRef]
  24. Tran, T.; Golosnoy, I.; Lewin, P.; Georghiou, G. Numerical modelling of negative discharges in air with experimental validation. J. Phys. D Appl. Phys. 2011, 44, 015203. [Google Scholar] [CrossRef] [Green Version]
  25. Hagelaar, G.; Hoog, F.; Kroesen, G. Boundary condition in fluid models in gas discharges. Phys. Rev. E 2000, 62, 1452–1454. [Google Scholar] [CrossRef] [PubMed]
  26. Akaram, S.; Castellon, J.; Agnel, S. Progress in gas/solid interface charging phenomena. Coatings 2020, 10, 1184. [Google Scholar] [CrossRef]
  27. Christophorou, L.; Olthoff, J. Electron interactions with CF3I. J. Phys. Chem. Ref. Data 1999, 29, 553–569. [Google Scholar] [CrossRef]
  28. Itoh, H.; Mlyachi, T.; Kawaguchi, M.; Nakao, Y.; Tagashira, H. Electron transport coefficients in SF6 and c-C4F8 mixtures. J. Phys. D Appl. Phys. 2000, 24, 277–282. [Google Scholar] [CrossRef]
  29. Christophorou, L.; Olthoff, J. Electron interactions with c-C4F8. J. Phys. Chem. Ref. Data 2001, 30, 449–473. [Google Scholar] [CrossRef]
  30. Hua, W.; Fukagata, K. Near-surface electron transport and its influence on the discharge structure of nanosecond-pulsed dielectric-barrier-discharge under different electrode polarities. Phys. Plasmas 2019, 26, 013514. [Google Scholar] [CrossRef]
  31. Yu, R.; Gao, B.; Hu, G.; Zhou, P.; Wu, J. Development of white mark on pressboard surface and change of discharge characteristic parameters in needle-plane model. High Volt. Eng. 2020, 46, 240–249. [Google Scholar]
Figure 1. The geometry of the model (HV: high voltage; GND: grounded).
Energies 14 08299 g001
Figure 2. Simulation geometry (a) and mesh (b) of the discharge model.
Energies 14 08299 g002
Figure 3. Reduced effective ionization coefficients of 10%c-C4F8/20%CF3I/70%N2.
Energies 14 08299 g003
Figure 4. The distribution of the electric field (V/m), from 0.02 ns (a) to 2.47 ns (i); the scale unit is millimeters (mm). (ac) development of streamer on upper surface of insulator; (c,d) streamer transitions from the top surface of the insulator to the right surface; (di) development of streamer on the right surface of insulator.
Energies 14 08299 g004
Figure 5. Electric field changes during streamer development.
Energies 14 08299 g005
Figure 6. The potential (V) distribution at 0.57 ns (The longer the arrow, the larger the potential gradient).
Energies 14 08299 g006
Figure 7. Variation of electron concentration at 4 points: (a) P1; (b) P2; (c) P3; (d) P4.
Energies 14 08299 g007
Figure 8. Particle distribution: (ac) electron distribution (m−3) of 10%c-C4F8/20%CF3I/70%N2, 30%SF6/70%N2 and artificial air; (df) positive ions (m−3) distribution of 10%c-C4F8/20%CF3I/70%N2, 30%SF6/70%N2 and artificial air; (gi) negative ions (m−3) distribution of 10%c-C4F8/20%CF3I/70%N2, 30%SF6/70%N2 and artificial air; the scale unit is millimeters (mm).
Energies 14 08299 g008
Figure 9. Electric field (V/m) distribution in three models: (ac) streamer head at the end of the upper surface of the insulator in model A, B and C; (df) streamer head at the top of the right surface of the insular in model A, B and C; (gi) streamer head at the bottom of the right surface of the insular in model A, B and C; the scale unit is millimeters (mm).
Energies 14 08299 g009
Figure 10. The potential (V) distribution of streamer development to 20 mm from the plane electrode: (a) model A; (b) model B; (c) model C; (The red dotted lines are the location of the streamer head); the scale unit is millimeters (mm).
Energies 14 08299 g010
Table 1. Reactions included in this article (* indicates the excited states of molecules).
SeqReactionsType
R1 e + C 4 F 8 = > C 4 F 7 + F Attachment
R2 e + C 4 F 8 = > F Attachment
R3 e + C 4 F 8 = > C F 3 Attachment
R4 e + C 4 F 8 = > C 3 F 5 Attachment
R5 e + C 4 F 8 = > C 2 F 3 Attachment
R6 e + C 4 F 8 = > e + C 4 F 8 Elastic
R7 e + C 4 F 8 = > C F + Ionization
R8 e + C 4 F 8 = > C F 2 + Ionization
R9 e + C 4 F 8 = > C F 3 + Ionization
R10 e + C 4 F 8 = > C 2 F 3 + Ionization
R11 e + C 4 F 8 = > C 2 F 4 + Ionization
R12 e + C 4 F 8 = > C 3 F 5 + Ionization
R13 e + C F 3 I = > C F 3 + I Attachment
R14 e + C F 3 I = > C F 2 I + F Attachment
R15 e + C F 3 I = > C F 3 + I Attachment
R16 e + C F 3 I = > e + C F 3 I Elastic
R17 e + C F 3 I = > C F 3 I + Ionization
R18 e + C F 3 I = > C F 3 + Ionization
R19 e + C F 3 I = > C F 2 I + Ionization
R20 e + C F 3 I = > I + Ionization
R21 e + N 2 = > e + N 2 Elastic
R22 e + N 2 = > e + e + N 2 + Ionization
R23 e + S F 6 = > F Attachment
R24 e + S F 6 = > F 2 Attachment
R25 e + S F 6 = > S F 2 Attachment
R26 e + S F 6 = > S F 3 Attachment
R27 e + S F 6 = > S F 4 Attachment
R28 e + S F 6 = > S F 5 Attachment
R29 e + S F 6 = > S F 6 Attachment
R30 e + S F 6 = > e + S F 6 Elastic
R31 e + S F 6 = > e + e + S F 6 + Ionization
R32 e + O 2 = > O 2 Attachment
R33 e + O 2 = > O + O Attachment
R34 e + O 2 = > e + O 2 Elastic
R35 e + O 2 = > e + e + O 2 + Ionization
R36-37 C 4 F 8 = > C 4 F 8 * Excitation
R38-43 C F 3 I = > C F 3 I * Excitation
R44-66 N 2 = > N 2 * Excitation
R67-70 S F 6 = > S F 6 * Excitation
R71-83 O 2 = > O 2 * Excitation
Publisher’s Note: MDPI stays neutral with regard to jurisdictional claims in published maps and institutional affiliations.

