Article

Quantification of Uncertainty in CFD Simulation of Accidental Gas Release for O & G Quantitative Risk Assessment

1
Department of Energy, Politecnico di Milano, 20156 Milano, Italy
2
Department of Energy, Politecnico di Torino, 10141 Torino, Italy
3
Centre de Recherche sur les Risques et les Crises (CRC), MINES ParisTech, PSL Research University, 75272 Valbonne, France
*
Author to whom correspondence should be addressed.
Energies 2021, 14(23), 8117; https://doi.org/10.3390/en14238117
Submission received: 29 October 2021 / Revised: 21 November 2021 / Accepted: 29 November 2021 / Published: 3 December 2021
(This article belongs to the Special Issue Special Issue of ESREL2020 PSAM15)

Abstract

:
Quantitative Risk Assessment (QRA) of Oil & Gas installations implies modeling accidents’ evolution. Computational Fluid Dynamics (CFD) is one way to do this, and off-the-shelf tools are available, such as FLACS developed by Gexcon US and KFX developed by DNV-GL. A recent model based on ANSYS Fluent, named SBAM (Source Box Accident Model) was proposed by the SEADOG lab at Politecnico di Torino. In this work, we address one major concern related to the use of CFD tools for accident simulation, which is the relevant computational demand that limits the number of simulations that can be performed. This brings with it the challenge of quantifying the uncertainty of the results obtained, which requires performing a large number of simulations. Here we propose a procedure for the Uncertainty Quantification (UQ) of FLACX, KFX and SBAM, and show its performance considering an accidental high-pressure methane release scenario in a realistic offshore Oil & Gas (O & G) platform deck. The novelty of the work is that the UQ of the CFD models, which is performed relying on well-consolidated approaches such as the Grid Convergence Index (GCI) method and a generalization of Richardson’s extrapolation, is originally propagated to a set of risk measures that can be used to support the decision-making process to prevent/mitigate accidental scenarios.

1. Introduction

The Oil & Gas (O & G) industry is hazardous to the environment and to people due to the presence of dangerous fluids that may be toxic, flammable and pressurized [1]. To ensure O & G plants’ safety, national and international regulations impose mandatory risk assessment [2]. Modeling and simulation of accidental scenarios are essential for Quantitative Risk Assessment (QRA) [2,3], to evaluate the consequences of accidents in O & G facilities. For offshore plants characterized by complex congested geometries, the state of practice is to use semi-empirical models [4], which lead to a large overestimation of damages and a consequent oversizing of the safety systems with waste of economical and material resources.
Computational Fluid Dynamics (CFD) for accident simulation can guarantee more accurate results, even for complex phenomena and geometries [5]. Different tools and models, based on numerical techniques, are available: FLACS developed by Gexcon US and KFX developed by DNV-GL, but also innovative CFD approaches, such as the Source Box Accident Model (SBAM) developed by the SEADOG Lab Group of Politecnico di Torino.
However, the input parameters, numerical methods, and physical models used in CFD are affected by uncertainties, typically classified as: physical modeling uncertainties (e.g., boundary conditions, initial conditions, geometry, fluid properties, turbulence modeling uncertainties) and numerical uncertainties (e.g., discretization mesh size, round-off and iterative convergence uncertainties) [6]. These uncertainties need to be propagated through for quantifying the uncertainty of the CFD output in order to know the confidence on the results, and then used for decision-making on protective measures of the O & G facilities.
Physical modeling uncertainties include boundary and initial conditions’ uncertainties, turbulence model uncertainties, uncertainties due to the insufficient knowledge of the flow properties, uncertainties due to the approximation of the constitutive laws. They are due to assumptions in the formulation of the model and deliberate simplifications in the governing equations for the purpose of their solutions. Investigating physical modeling uncertainties is challenging due to the strong non-linearity of the models [7]. For this reason, appropriate probabilistic and non-probabilistic approaches are being developed [8], but they are still far from being adopted and implemented [9].
Numerical uncertainties include discretization uncertainties and uncertainties in the numerical schemes adopted. In particular, they are caused, for example by: (i) discretization of the mesh size, (ii) discretization of the Navier–Stokes (N-S) equations that require iterative procedures to be solved, and (iii) computing machine errors, which give an upper bound on the relative error due to rounding in floating points [10]: To minimize the discretization uncertainty, we may adopt two different strategies: either increase the order of the discretization scheme or adapt the mesh to improve the size/quality [11] with, in both cases, a dramatic increase of the computational burden.
In this work, we aim at structuring an Uncertainty Quantification (UQ) approach for CFD calculation that is computationally feasible, provides insights on the confidence of the results of the simulation, and supports decision-making, enabling robust design/reliability analysis and safety margins’ quantification for risk analysis [12,13]. We limit the scope of the UQ to the discretization source of uncertainty, related with the mesh size used to represent the governing (N–S) flow equations and other physical models, such as algebraic expressions in a discrete domain of space (finite-difference, finite-volume, finite-element). To ensure that the solution of the discretized equations closely approximates that of the original equations [14] and to quantify the spatial discretization uncertainty, we will rely on the Grid Convergence Index (GCI) method and a generalization of the Richardson’s extrapolation [15,16,17].
The paper proposes a first step towards the development of a methodology for the UQ of CFD simulation in risk assessment and management applications.
Without loss of generality, the extended UQ approach is presented in relation to the discretization mesh size of the alternative FLACS, KFX and SBAM models and with regard to the analysis of a typical accidental high-pressure methane release in an offshore O & G platform. The consideration of the effects of the propagation of the uncertainties onto the set of risk measures for decision making are the main novelty of the work here presented. In this regard, it is worth mentioning that in the O & G fields the state of practice is using the plume length of the flammable gas cloud as risk measure [18]; however, in a congested environment, as it usually is in O & G facilities, due to the presence of the obstacles, the gas cloud shape may differ from the typical “plume” and the severity of the accident might be underestimated. For a more realistic and risk-oriented analysis, the severity of the accident, e.g., the ratio between flammable volume and total volume (σDamage), the external perimeter of the platform reached by the flammable cloud ( σ target ), and the flammable volume developed under 1.5 m ( σ d 1.5 ), is considered in the risk measures used to support decision-making (for example, to decide the location of safety systems (e.g., fire-fighting system, fire doors, etc.) and setting of the control systems (e.g., sensors, gas detectors, etc.)):
  • Ratio between flammable volume and total volume (σDamage):
    σ Damage = V Flammable V T O T ~ [ 0 , 1 ]
    where V Flammable is the volume occupied by an air-methane mixture within the flammability limits and VTOT is the total volume of the domain. The larger σ Damage , the worse the damage; in particular, if σ Damage = 0, no accident has occurred, if σ Damage = 1, the worst-case scenario has occurred, i.e., the entire platform deck is enveloped within the flammable cloud.
  • External perimeter of the platform reached by the flammable cloud ( σ target ) can be seen as a measure of possible damage to specific targets (e.g., escape routes) that in the offshore platform are commonly located on the external perimeter:
    σ target = P danger P T O T ~ [ 0 , 1 ]
    where PTOT is the total perimeter of the deck and Pdanger is the perimeter of the deck reached by the flammable cloud. The larger σ target , the worse the damage; in particular, if σ target = 0, the flammable cloud does not reach the target; if σ target = 1 the whole target is enveloped within the flammable cloud.
  • Flammable volume developed under 1.5 m ( σ d 1.5 ) can be considered an important measure of the damage because the main electrical and mechanical components are placed on the floor; these can generate friction triggers and electrical triggers, which may ignite the flammable gas cloud, whereas, at higher elevation, the probability of having ignition sources is quite low:
    σ d 1.5 = V f l a | u 1.5 V Flammable ~ [ 0 , 1 ]
    where V f l a | u 1.5 is the volume of flammable gas under 1.5 m height and VFlammable is the total flammable volume on the platform. The scenarios with large σ d 1.5 are the most critical, because for such cases the volume of flammable gas is concentrated at low elevation, that increases the ignition probability.
The remainder of the paper is as follows: in Section 2, the CFD tools considered are briefly described. In Section 3, the validation of the FLACS, KFX and Fluent with respect to experimental data is presented, considering both the case of free-jet and of jet impinging a cylindrical obstacle. In Section 4, the realistic case study is described, and the qualitative and quantitative results presented. In Section 5, conclusions are drawn.

2. CFD Tools

In this Section, the CFD tools here used to carry out the release accident analysis are presented. In Section 2.1, the CFD modelling approach based on ANSYS Fluent, named SBAM (Source Box Accident Model) and developed by the research group of the SEADOG lab at Politecnico di Torino, is presented. In Section 2.2 FLACS, developed by Gexcon US, and KFX, developed by DNV-GL, are also introduced briefly. The interested reader may refer to [19], for further details.
For the sake of the CFD tools comparison and the description of the proposed UQ approach, without loss of generality, we will consider the simulation of a typical accidental high-pressure methane release in an offshore O & G platform that results in the build-up of a flammable cloud. The accidental scenario is widely known and consists of a gas release at high-pressure from a hole section in the form of an under-expanded jet [20], which leads to the formation of a Mach disk, with a compressible and supersonic flow (i.e., release phase). Moving away from the release point, the flow becomes slower until the gas reaches the ambient pressure and starts to disperse at low velocities (~10 m/s) and can be treated as incompressible (i.e., dispersion phase). As we shall see in what follows, the FLACS, KFX and SBAM differ in the way this phenomenon is modeled.

2.1. SBAM

The basic idea behind SBAM is to model the release and the dispersion phases separately, using different assumptions and models. In fact, two CFD simulations are realized using ANSYS Fluent, which solves the N–S equations by a finite volume approach: one simulation for the release phase and the other for the dispersion phase.
The former accounts for the initial jet expansion and its interaction with the nearby obstacle and is performed in a dedicated and limited domain called Source-Box (SB) [21], in which the flow can be assumed and modeled as compressible. The domain is defined large enough to contain all the compressibility effects. The mesh is refined enough to fully resolve the Mach cell and the boundary layer arising from the interaction with the nearby obstacle; therefore, all the geometric details are considered, while the gravitational forces are neglected due to the high inertia of the flow that reaches a supersonic regime. The results of the release simulation are, then, used as input of the dispersion simulation, in which the flow is assumed incompressible and gravitational forces become relevant, as the velocities are in a subsonic regime [21].
In SBAM, an unstructured tetrahedral mesh is created in ANSYS FLUENT for both the release and the dispersion simulations, as it permits saving setup-time and limits mesh skewness; in fact, as complex geometries are involved both in the release and dispersion phases, the creation of a structured mesh can be extremely time-consuming or not possible, or it could decrease the mesh quality. In addition, the unstructured mesh has a high-efficiency mesh distribution, which permits creation of fewer cells than a structured one [22].

2.2. FLACS and KFX

The idea behind the FLACS and KFX models is similar to SBAM, i.e., separating the analysis of the two phases (release and dispersion) in two different models. In FLACS and KFX, the supersonic jet behavior is described according to the semi-empirical Birch model, valid in a pressure range between 2 and 70 bars [23]. The main idea of the model is to calculate characteristic values for the jet description after it has reached environmental conditions; in particular, [23] defines the concept of pseudo-diameter (dps), which is the value of the jet diameter when it reaches the ambient conditions, and, in an analogous way, a pseudo-velocity is introduced in correspondence of the pseudo-diameter. These pseudo-values are imposed on the cell surface corresponding to the new pseudo release point, from where the subsonic dispersion starts. In FLACS and KFX, the governing equations that describe the dispersion phase of the phenomenon are characterized by the fact that geometries are represented as a porous media. This new formulation of the transport equation is popularly called PDR method (Porosity Distributed Resistance) [24]. The model is a generalization of the N–S equations for fluid flow and Darcy’s law commonly used for flows in porous regions [25]. Geometries are represented as porous regions, and the presence of obstructions modifies the governing equations in two ways: firstly, the volume of the obstruction is represented in the control volume in such a way that only the non-blocked areas are available for fluid flow; secondly, obstacles give additional flow resistance, which must be modeled. In FLACS and KFX, only a Cartesian structured mesh can be created, and a mesh refinement is applied near the release point to observe the gradients that develop. It is important to say that different levels of mesh refinement correspond to different geometric representations of the domain as a porous object. Among the Reynolds-averaged Navier–Stokes (RANS) equations, the most common is the Standard k-ε model [26], and it is the only model that is implemented in both KFX and FLACS.

3. CFD Validation

The presented CFD tools are here compared with respect to experimental data of commonly adopted benchmark cases (i.e., free-jet and jet impinging on a cylinder) [27,28]. In Section 3.1, the free-jet validation case is presented, whereas in Section 3.2 the validation of the case of jet impinging on a cylindrical obstacle is summarized. It is worth noting that in this paragraph the considered tools are FLACS, KFX and a generic 2D Fluent approach. The Fluent validation is performed in 2D to save computational time, taking advantage of the case studies’ regularity, and considering that only the jet evolution along the jet axis is of interest. Unfortunately, FLACS and KFX permit only 3D simulations; hence, the three-dimensions domain is considered. Since SBAM is a 3-D model, useful for large, congested domains, it is used in Section 4, where the realistic case of the O & G offshore platform is analyzed. The numerical models employed by the three software programs are described in detail in [19].

3.1. Free Jet Validation

3.1.1. Benchmark Description

The benchmark consists of a free-jet, high-pressure CH4 release in open environment. The scenario considered refers to that presented in [27,29]; the characteristic parameters are summarized in the following:
  • Hole diameter: de = 0.5 m;
  • Upstream pressure and temperature: prel = 11 bar Trel = 293 K;
  • Environmental pressure and temperature: pamb = 1 bar Tamb = 293 K;
  • Dimension of the simulated domain: 120 m (X-direction), 40 m (Y-direction), 8 m (Z-direction).
A schematic view of the simulated domain is presented in Figure 1.
The boundary conditions, on the external faces of the domain are:
-
FLACS
A mass flow is imposed on all the boundaries
Semi-empirical Birch model is used for the release phase
-
KFX
A static pressure (atmospheric) is imposed on all the boundaries
Semi-empirical Birch model is used for the release phase
-
Fluent
A static pressure (atmospheric) is imposed on all the boundaries
CH4 concentration equal to 1, and pressure equal to 11 bars are imposed on the release hole.

3.1.2. Results

In FLACS and KFX, the following simulation conditions are set: a 3-D transient solver is used to solve the Reynolds-Averaged N–S equations (in fact KFX allows modeling 3D processes), the Standard k-ε model is employed to model the turbulence of the flow (in fact the k-ε turbulence model is the only turbulence model implemented both in FLACS and KFX). More details about the numerical models are given in the previous work [19]. A cartesian grid is built since this is the only one type of grid available in the two software programs. This kind of grid is used also in the next test case, although there is a round shape. This is possible since the two software programs use the Porosity Distributed Resistance (PDR) approach; see details in [19].
In Fluent, the following simulation conditions are set: 2D steady simulation using a RANS formulation of the Navier–Stokes equations with a Standard k-ε model as the turbulence closure equation, in order to be consistent with the simulations implemented in FLACS and KFX. To account for the gas dispersion, a species transport equation without chemical reaction is solved, coupled with the ideal gas law [22]. The analysis is carried out on the X–Y symmetry plane (see Figure 1) realizing an unstructured nonuniform mesh, which is used also in the next test case. This kind of grid is useful, especially in round shapes that have to be modeled.
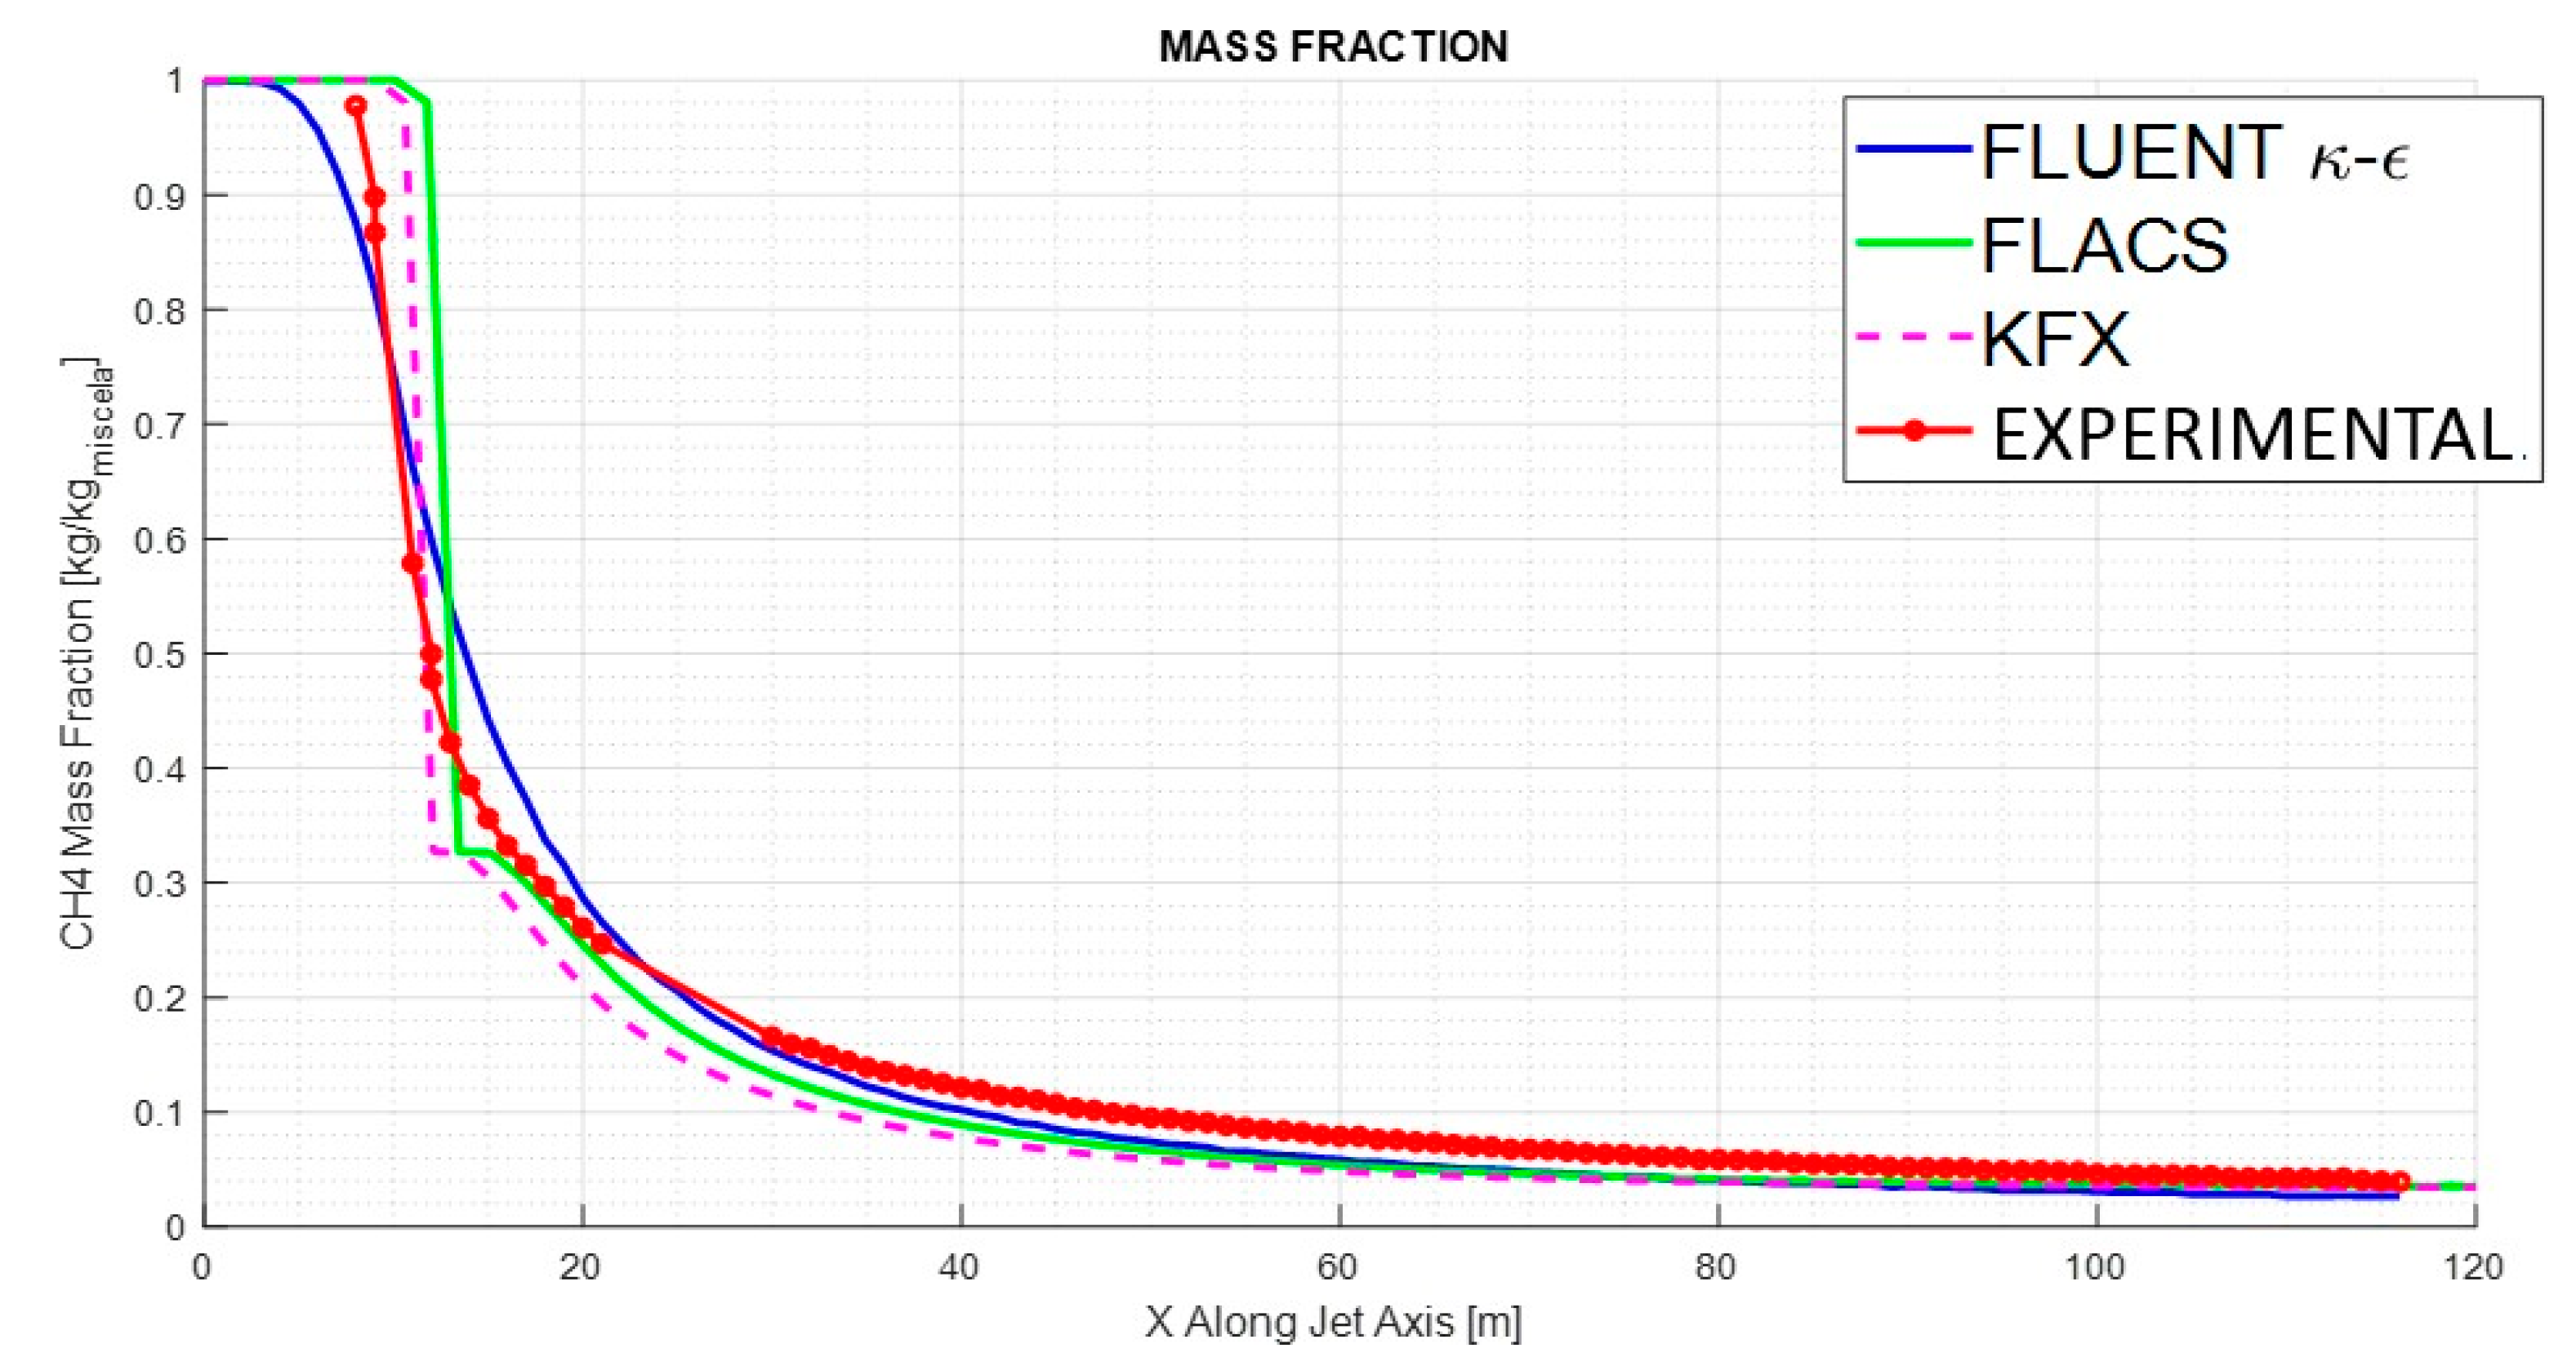
The obtained results are compared with the experimental data of [27], in relation to the CH4 mass fraction decay along the jet symmetry axis. In Figure 2, the results are shown: it is possible to notice that, qualitatively, all the tools are capable of describing the diffusion phenomenon well, especially in the far-field region where all the tools’ trends converge. Fluent, however, is more accurate than the others in following the trend, and KFX is the worst.
From a quantitative point of view, the relative error (Err) between the curves can be calculated through (Equation (4)) [30]:
E r r = Z e x p   Z s i m u l Z e x p
where ‖ZexpZsimul‖ is the norm of the difference between the experimental data and the FLACS, KFX, Fluent results, and ‖Zexp‖ is the norm of the experimental curve. In Table 1, the errors are listed for each considered tool: Fluent commits the smallest error and KFX the largest.

3.2. Jet Impinging on a Cylinder

3.2.1. Benchmark Description

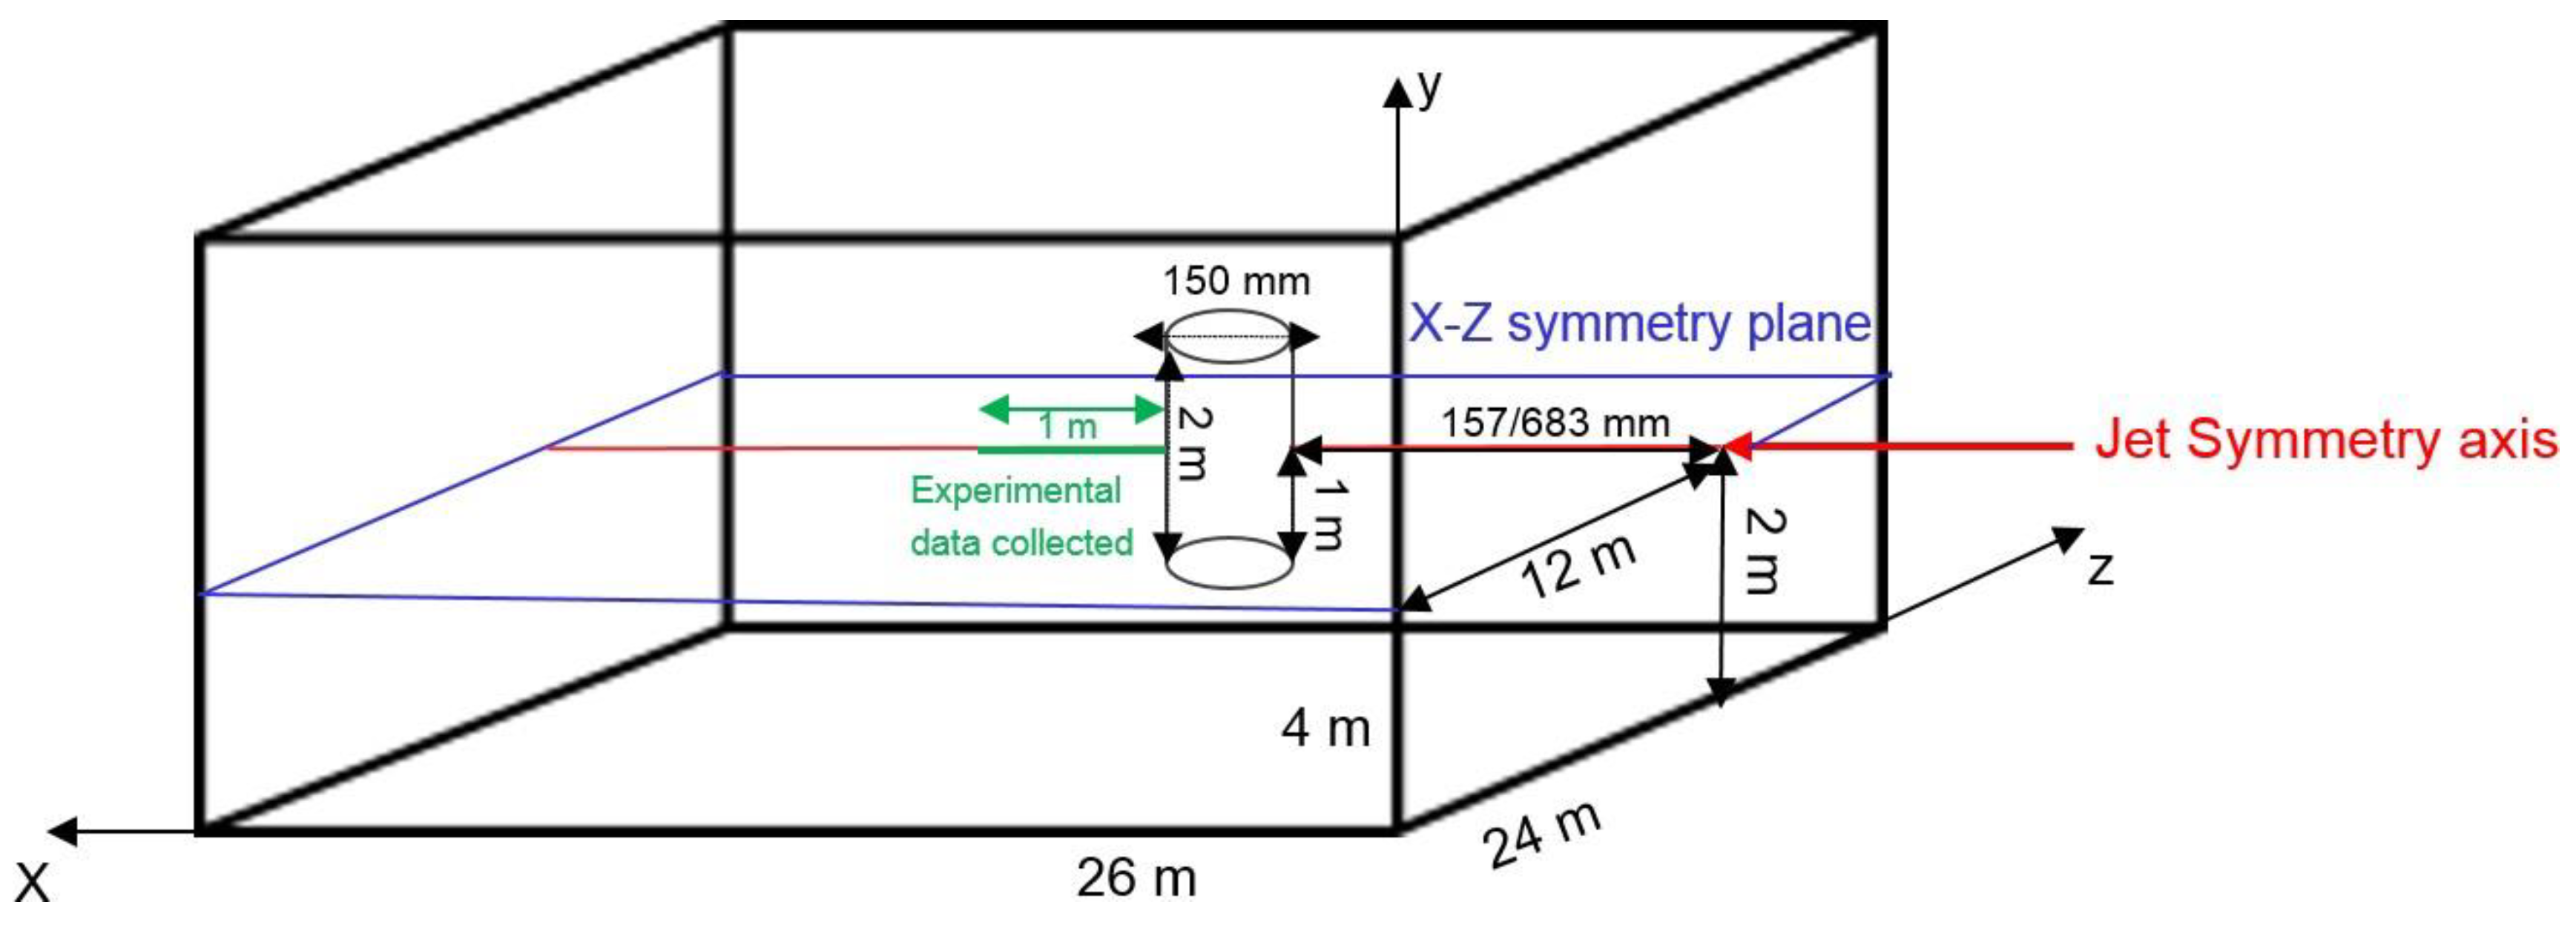
This benchmark regards the impact of a subsonic CH4 jet on a cylindrical obstacle. The scenario considered refers to that presented in [28], in which experimental data refer to the dispersion phase of a subsonic jet of CH4 horizontally released to impact on a single cylindrical obstacle, whose length is longer than the diameter of the jet, and it is positioned perpendicularly to the jet. The phenomenon was studied for two different distances between the release point and the obstacle: 157 mm and 683 mm. A schematic view of the simulated domain is presented in Figure 3. The characteristic parameters are summarized in the following:
  • Hole diameter: 0.0107 m;
  • Mass flow rate from the hole: m = 0.011 kg/s;
  • Obstacle diameter: dcyl = 0.150 m;
  • Distance, along the axis of symmetry, between the release point and the obstacle: l = 683 mm or 157 mm;
  • Dimensions of the simulated domain: 26 m (X-direction), 4 m (Y-direction), 24 m (Z-direction).
The boundary conditions on the external faces of the domain are:
-
FLACS
A mass flow is imposed on all the boundaries
-
KFX
A static pressure (atmospheric) is imposed on all the boundaries
-
Fluent
A static pressure (atmospheric) is imposed on all the boundaries
CH4 concentration equal to 1 and mass flow rate of 0.0107 kg/s are imposed on the release hole.

3.2.2. Results

Since FLACS and KFX do not model the release phase by numerical techniques [31], the following simulation conditions are set: a 3D transient solver to solve the N–S equations and the Standard k-ε turbulence model.
In Fluent, the following simulation conditions are set: 2D steady simulations using Standard k-ε model (to be consistent with the settings in FLACS and KFX) and SST k-ω as the turbulence closure equation. The analysis is carried out in the X–Z symmetry plane (see Figure 3).
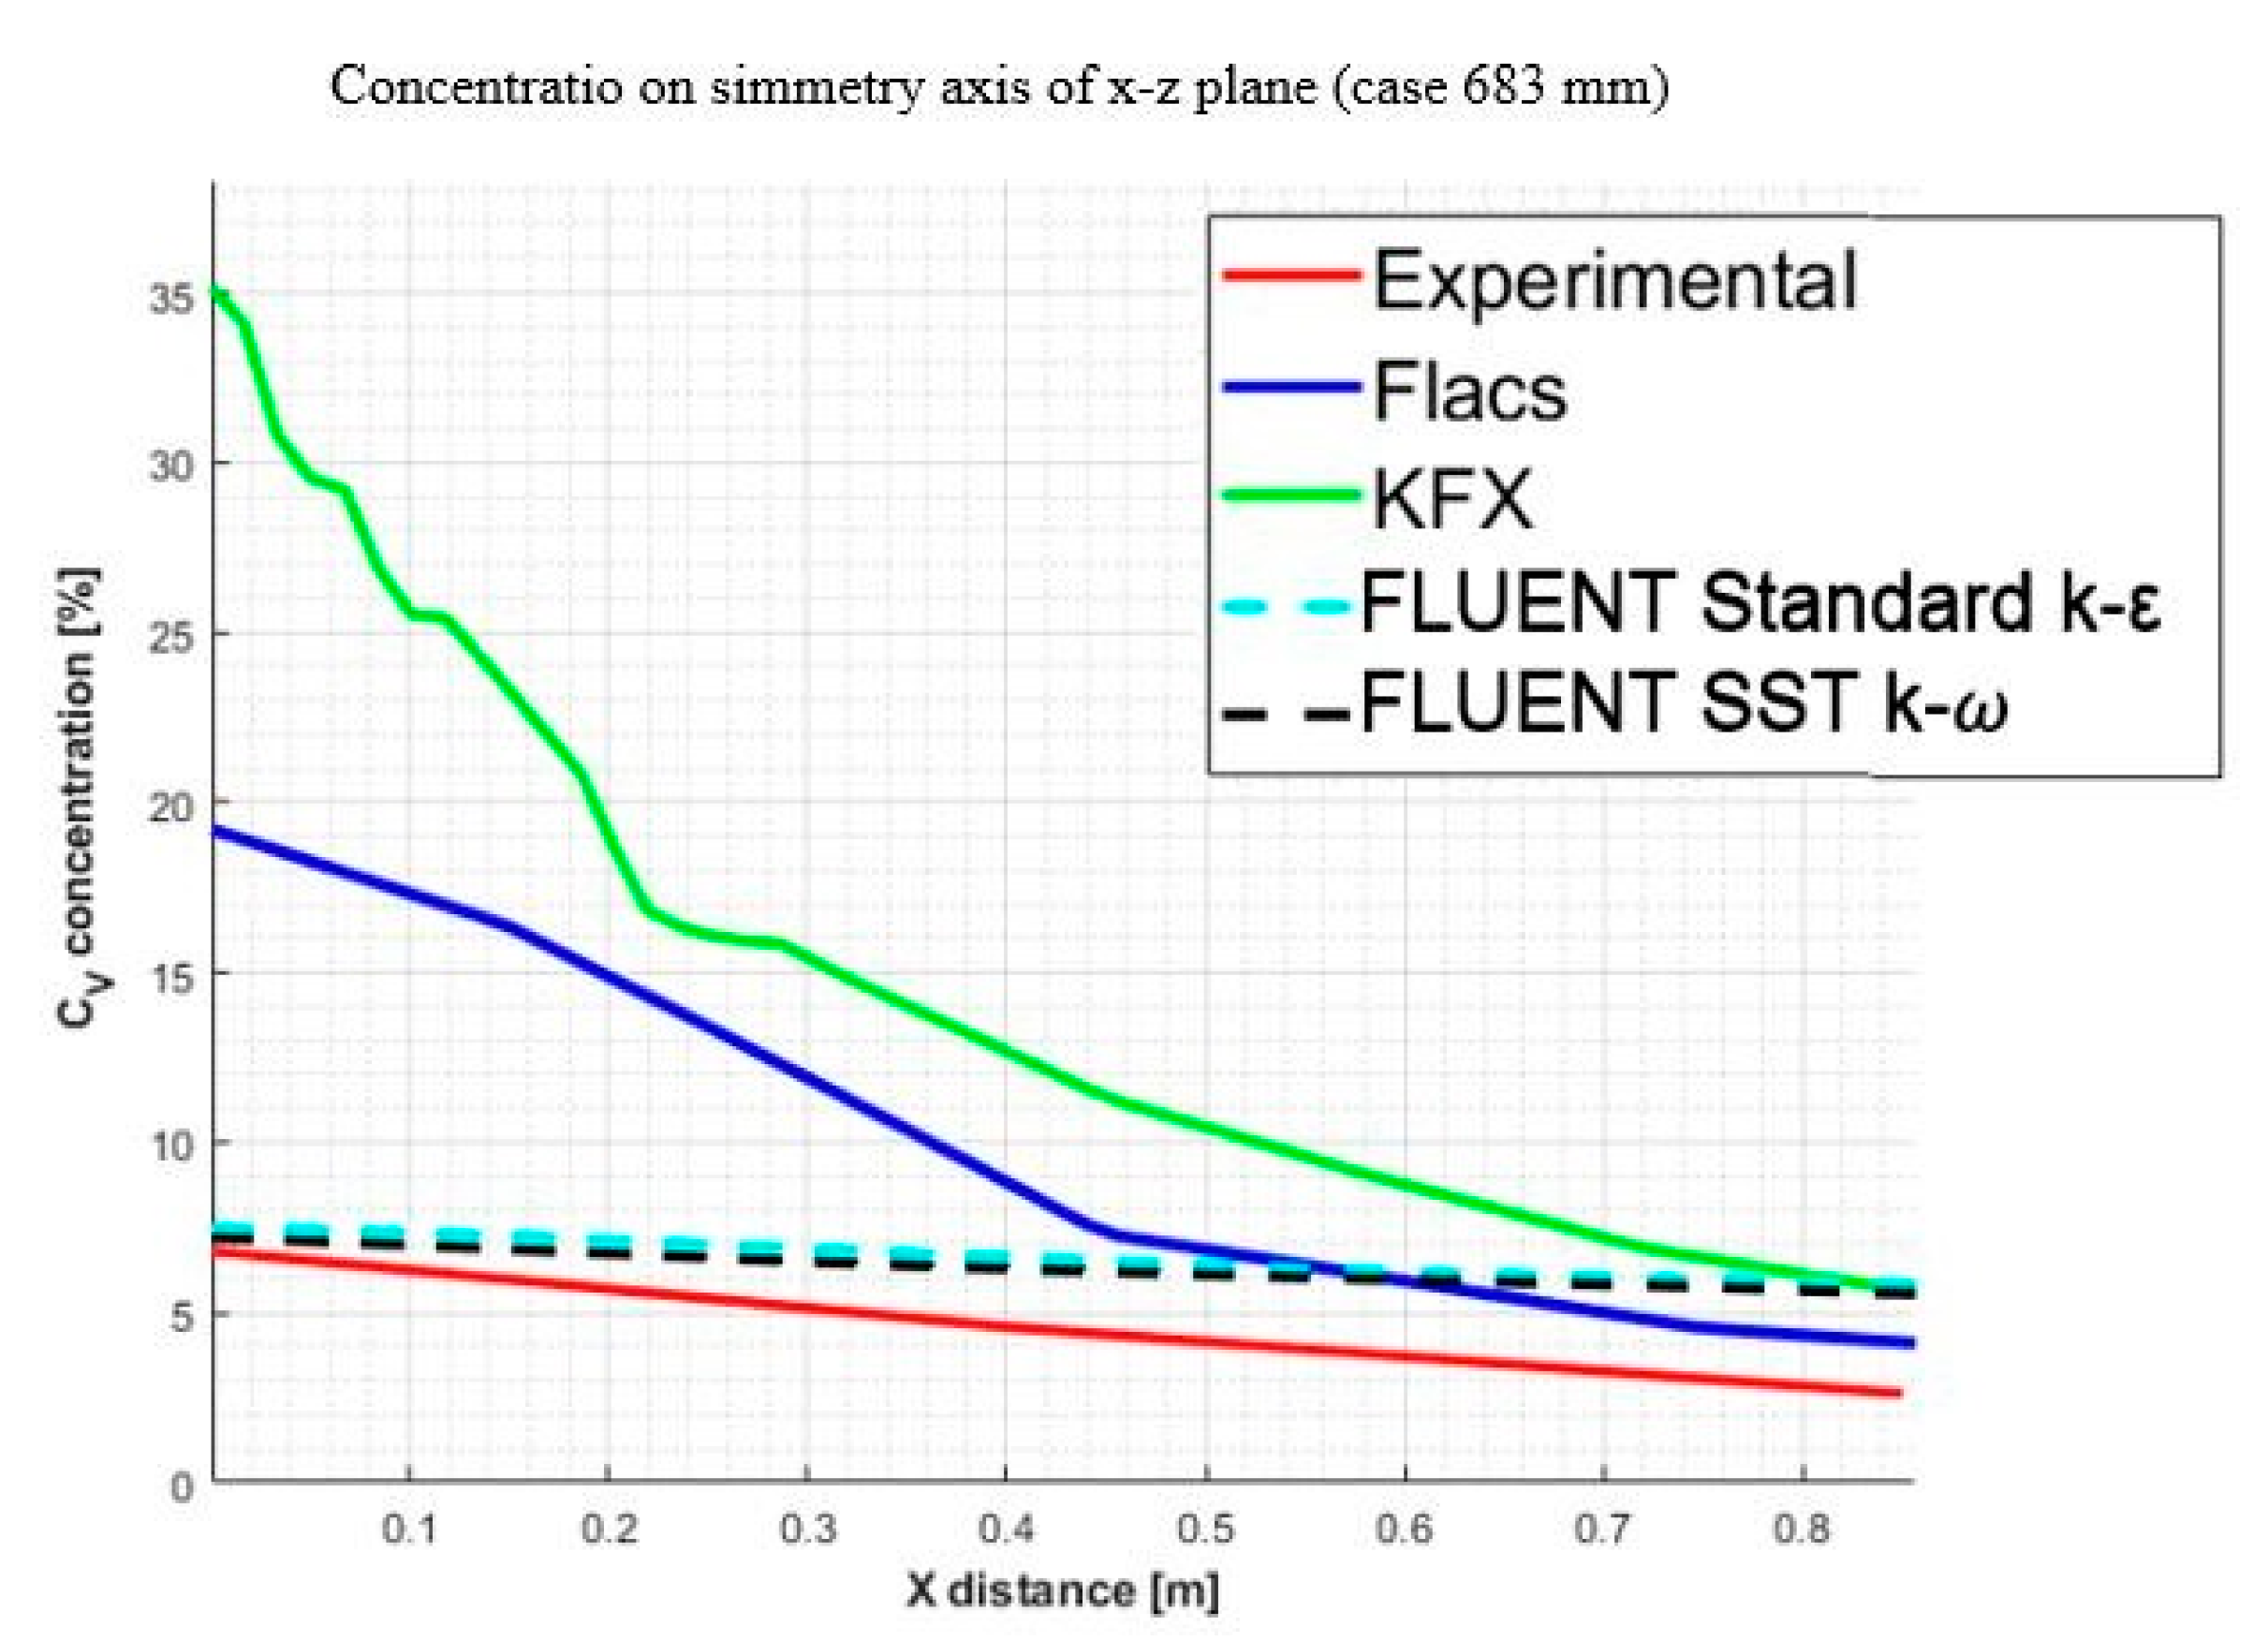
The obtained results are compared with the experimental data of [28], where CH4 volume concentration is measured using aspirating probes, along a segment of the jet symmetry axis located behind the obstacle (see Figure 3). In Figure 4 and Figure 5 (for the obstacle positioned at 157 mm and 683 mm from the release point, respectively), it is shown that, qualitatively, Fluent best reproduces the experimental data no matter the turbulence model, whereas KFX is the worst. In addition, this result is exacerbated by the smaller distance from the release point. In general terms, we can conclude that the off-the-shelf tools (i.e., FLACS and KFX), also in this case, seem to be less capable of catching the physics of the phenomenon, but are more conservative; in fact, they overestimate the CH4 volume concentration. This might be due to the fact that, with respect to the case of a release point far from the obstacle, the CH4 concentration naturally decreases along the X-axis, and a lower concentration gradient develops around the object: in other words, FLACS and KFX manage small gradients better than large ones. On the other hand, Fluent results are more consistent with the experimental data thanks to its better flexibility, allowing the implementation of appropriate types of mesh and turbulence models for the analyzed scenario.
From a quantitative point of view, the Err between the results obtained and the data is calculated with Equation (4) and reported in Table 2 and Table 3. It is worth noting that FLACS and KFX, being based on the Porosity Distributed Resistance (PDR) approach, are not suitable to model the interactions between the CH4 and the obstacle (in these cases, Err~200%, with respect to the experimental data).

4. The Realistic Case Study

The realistic case study concerns a “major accident” scenario, according to [32], that consists of an accidental high-pressure CH4 release in a realistic offshore platform deck. In particular, the supersonic jet impinges on a cylindrical near-obstacle with dcyl = 30 cm at l = 45 cm from the release point. This event is likely to occur in congested offshore installations, where a free-jet release is, on the other hand, improbable.
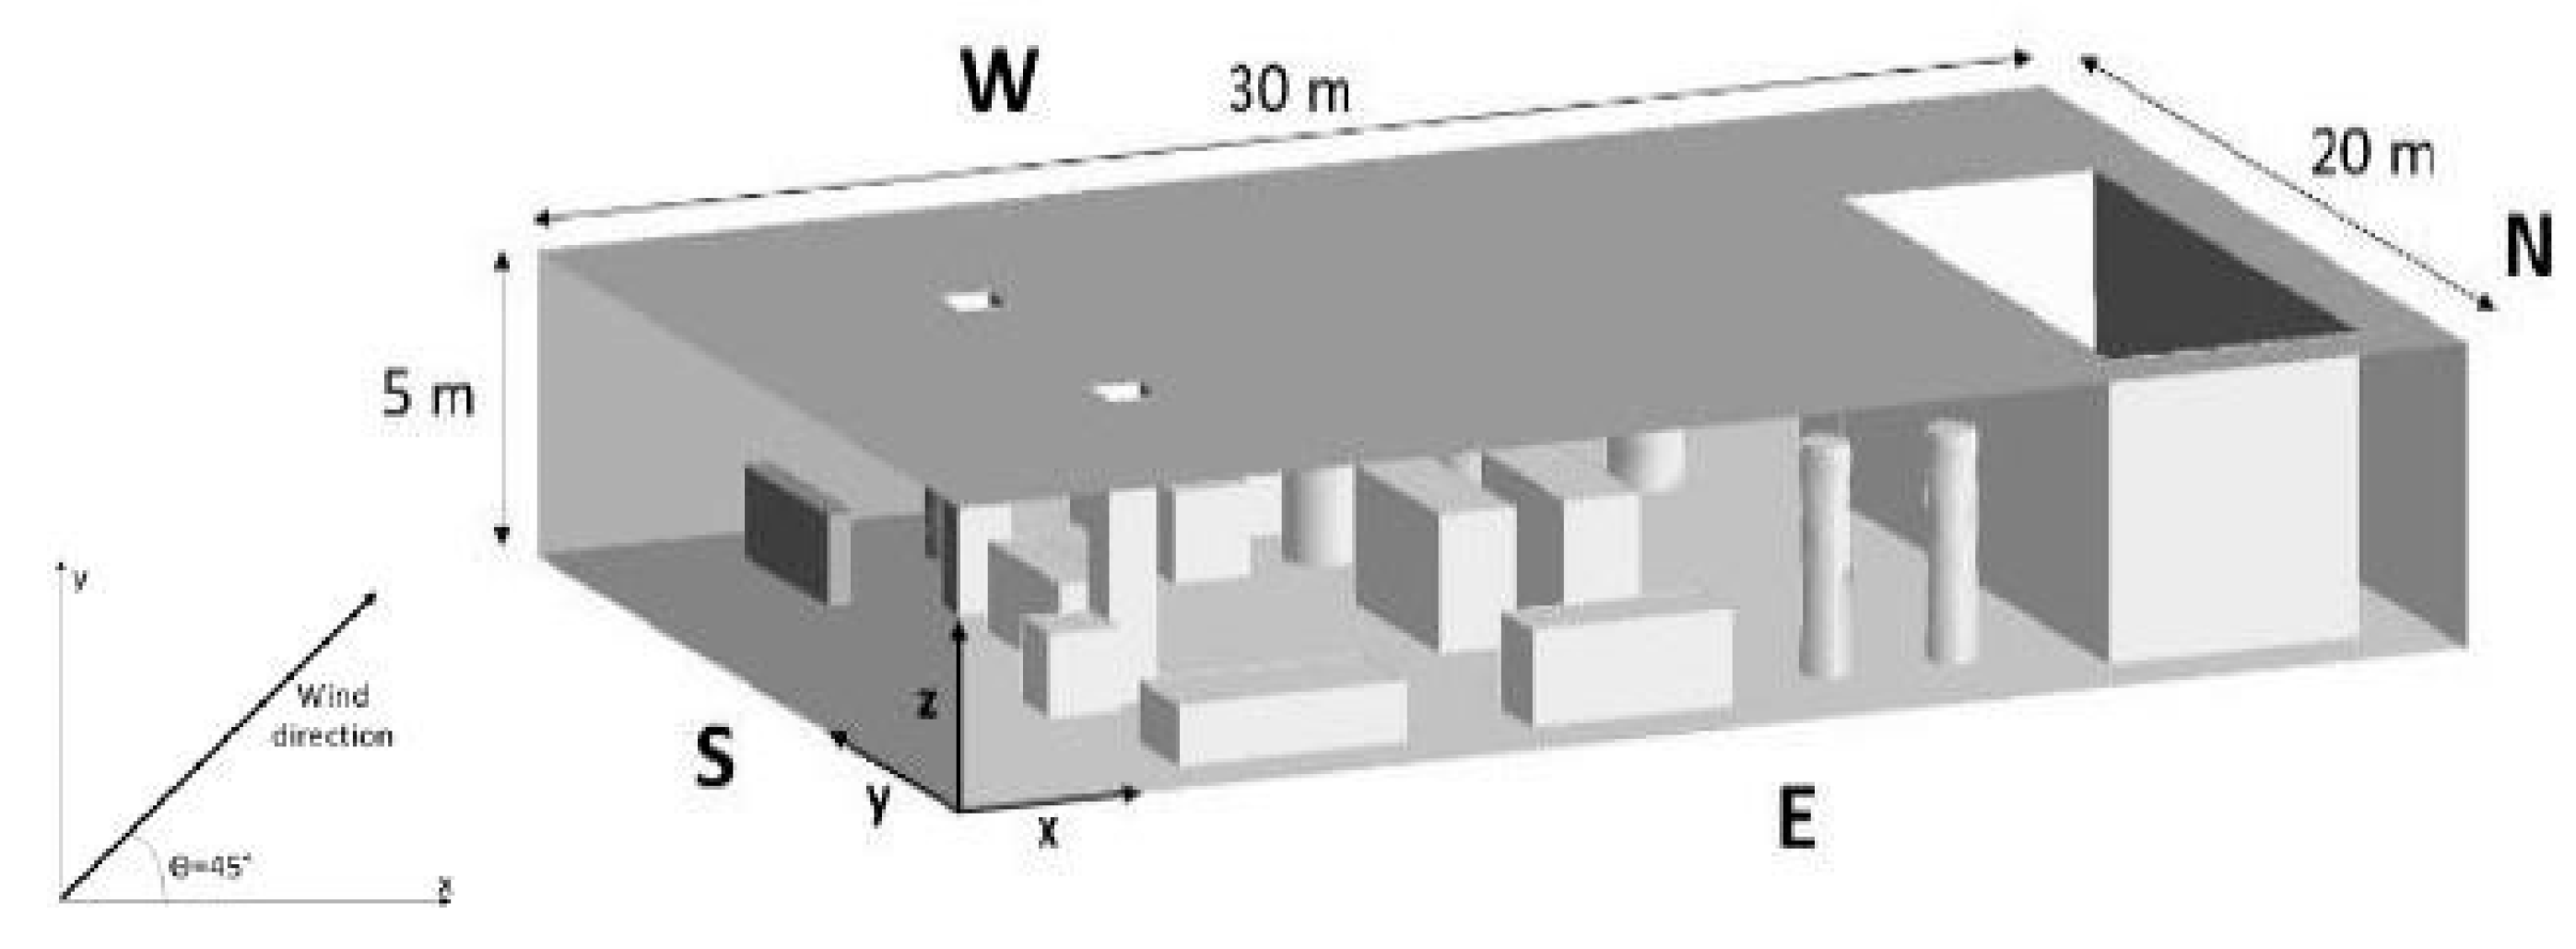
The simulation domain is shown in Figure 6 (i.e., a simplified 3D CAD version of an existing Italian natural gas extraction platform placed in Ravenna Punta Marina).
The representative parameters for simulating the scenario are chosen according to [33] and are summarized in the following:
  • Release pressure: prel = 50 bar;
  • Release hole diameter: de = 3 cm;
  • Domain dimensions: 5 m height (Z), 30 m lengths (X), 20 m width (Y);
  • Release point and direction: X = 3 m, Y = 2 m, Z = 1.5 m along the X direction;
  • Wind direction: 0.5 X + 0.5 Y;
  • Wind intensity: u = 6 m/s.
It is worth noting that, in this case, the used tools are FLACS, KFX and SBAM (based on Fluent).

4.1. Simulation Setup

In SBAM, the following boundary conditions are implemented for the release phase:
  • CH4 concentration equal to 1 and a pressure of 50 bar are imposed on the release hole;
  • The cylindrical nearby obstacle is modeled as a wall with no-slip conditions;
  • Ambient pressure is imposed on the external faces of the source box (SB).
In SBAM, the following boundary conditions are implemented for the dispersion phase:
  • Wind velocity with a magnitude of u = 6 m/s with a direction of 0.5 X + 0.5 Y is imposed on S and E sides;
  • Atmospheric pressure is imposed on N and W faces;
  • All the interactions with obstacle surfaces are modeled with walls with no-slip conditions.
SBAM simulations use a 3D solver for RANS equations and the SST k-ω model as turbulence closure equation, as suggested in [34] for the simulation of under-expanded jets, and validated in [35]. Simulations are performed in steady state with an unstructured tetrahedral mesh. The “Species Transport” model is used in order to solve a transport equation without chemical reactions, and the ideal gas law is used to evaluate the density field [19].
In FLACS and KFX the following boundary conditions are implemented:
  • Uniform wind profile is imposed on S and E sides (analogous to SBAM);
  • Ambient pressure is imposed in KFX on W and N sides (analogous to SBAM);
  • Mass flow outlet is used in FLACS, as suggested in [36], to obtain a convergent solution.
Both FLACS and KFX use a 3D solver to solve RANS equations and the Standard k-ε model [26] as turbulence closure equation. The analysis was conducted with a steady solver in FLACS, while KFX only allows for transient simulations.

4.2. Results

4.2.1. Simulation Results

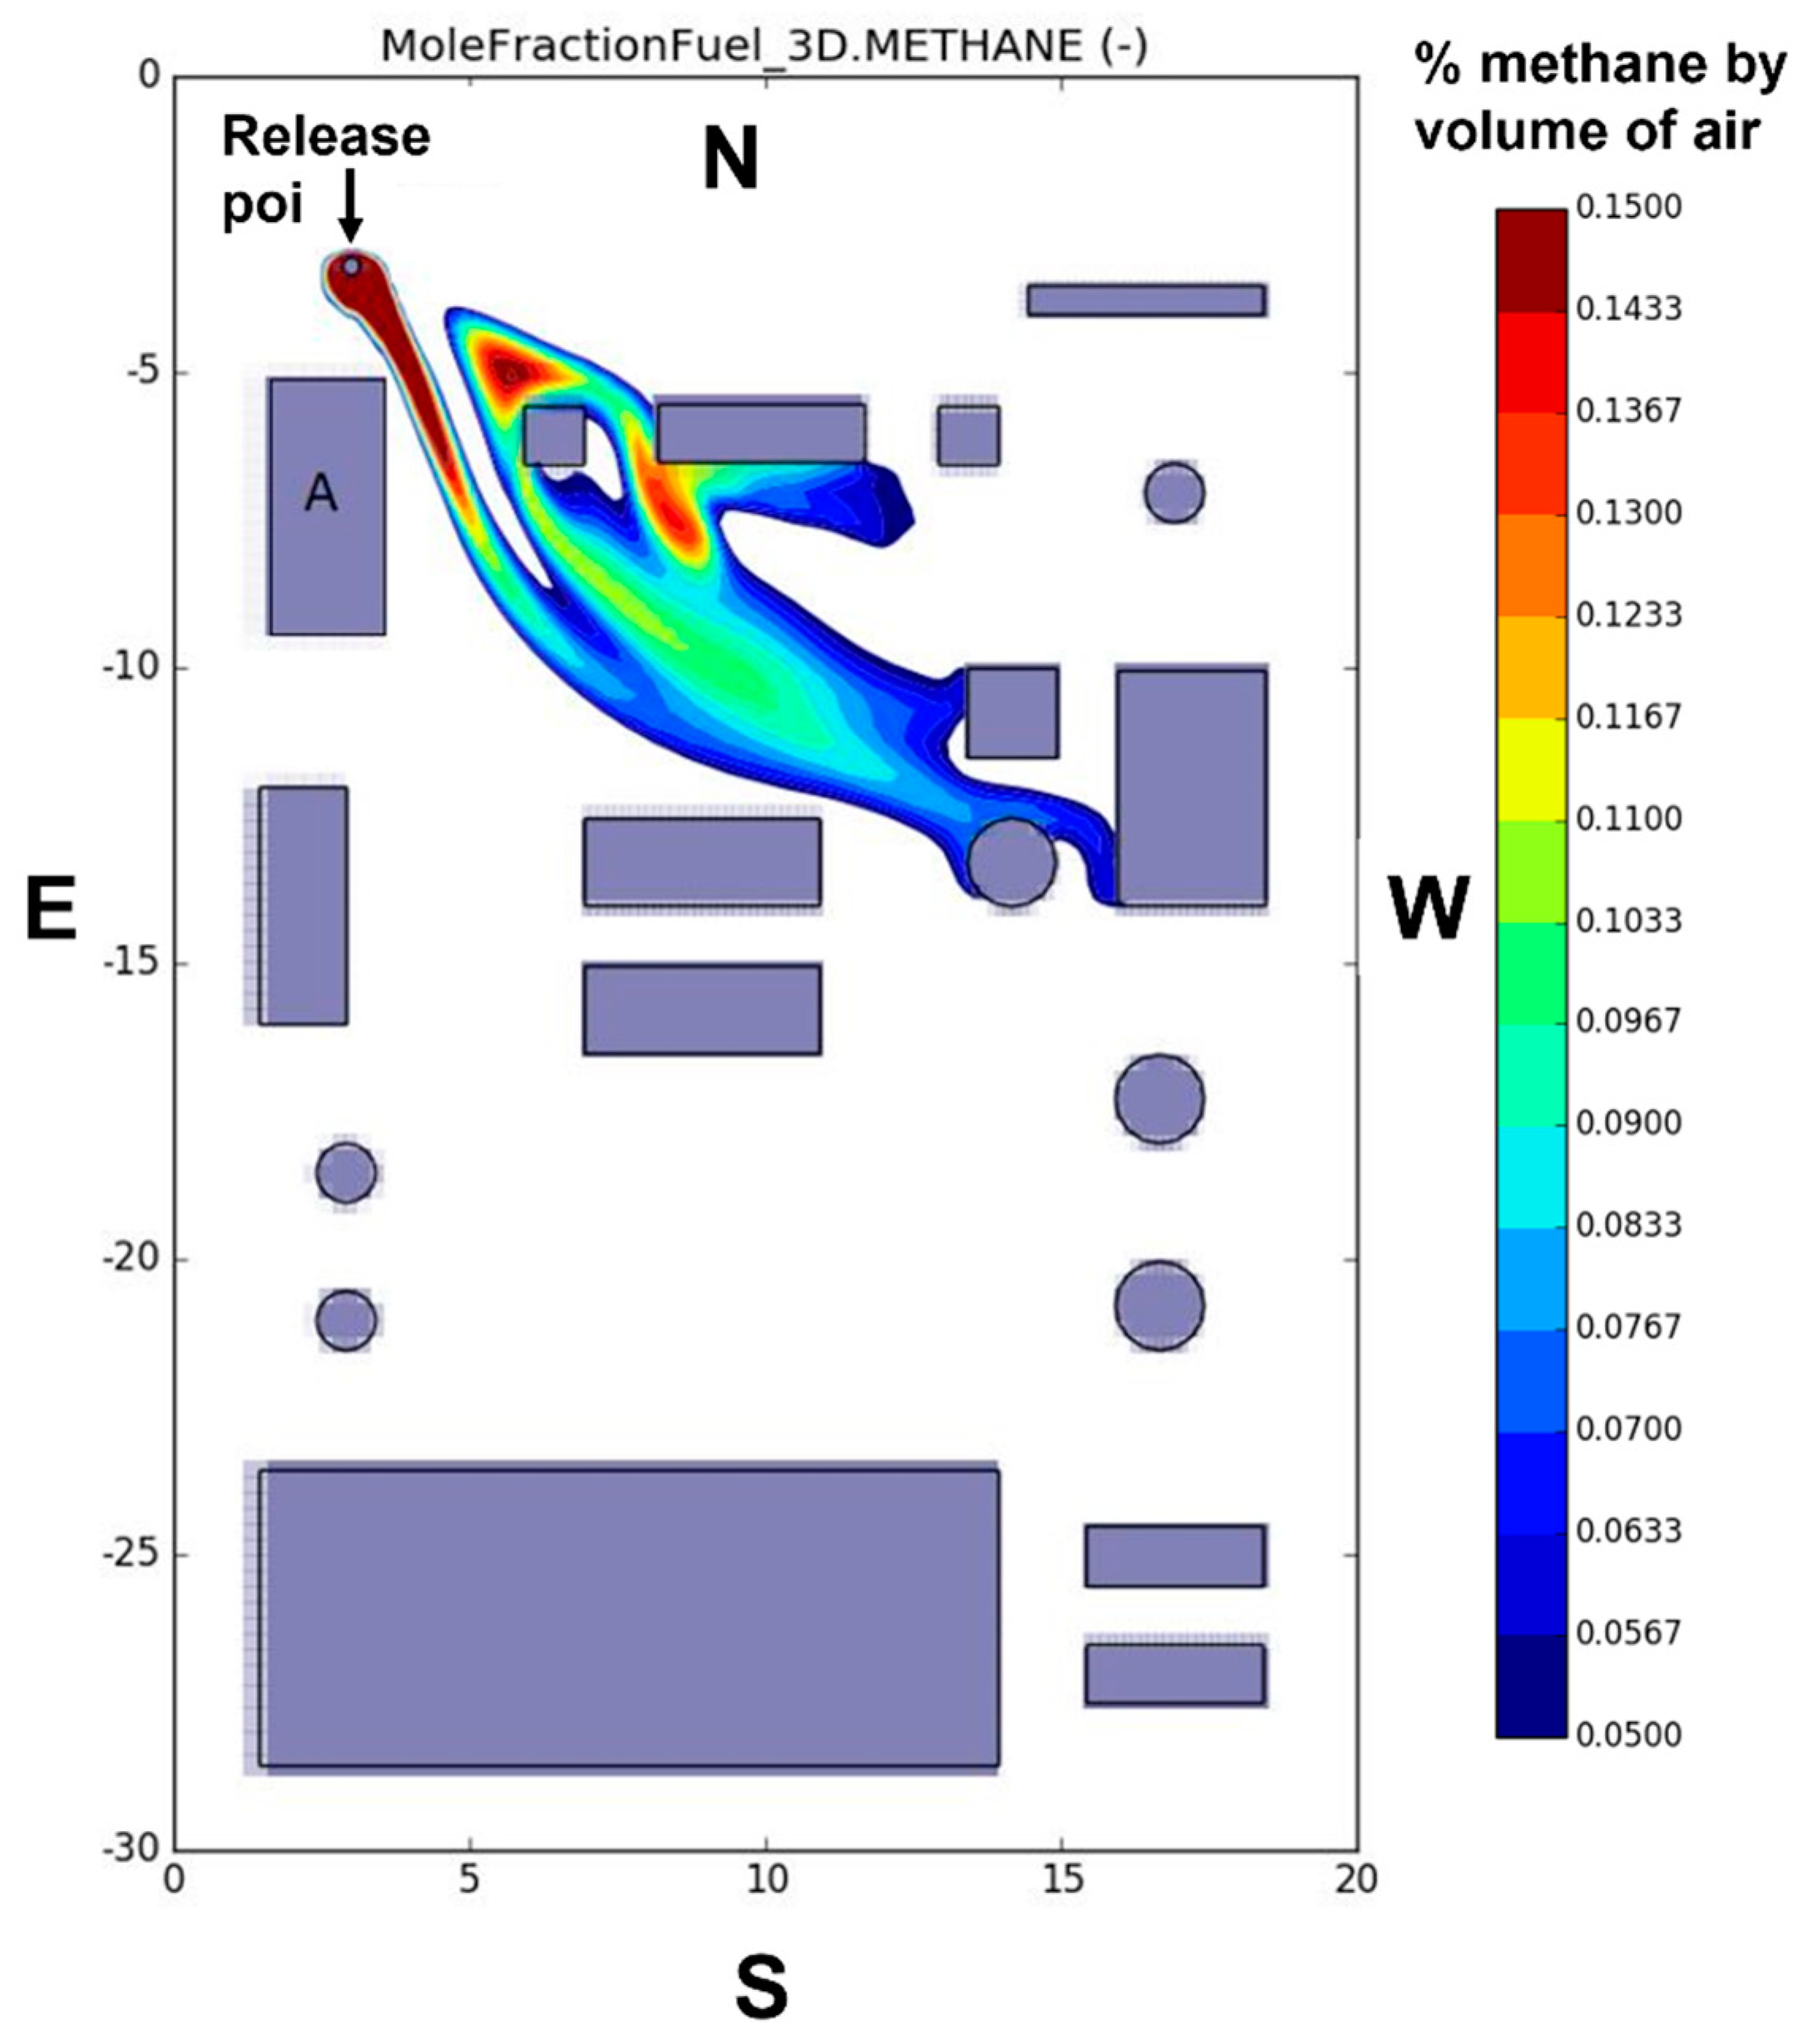
In this Section, the differences between the spatial distributions of the gaseous cloud release provided by FLACS, KFX and SBAM are analyzed. The comparative analysis is conducted considering the results on the plane at a height (z) of 0.5 m, since at this elevation, the ignition probability is larger than at higher elevations and, therefore, the comparison is conservative in the hypotheses adopted (i.e., large presence of mechanical and electrical equipment, and of personnel). The related contour maps are shown in Figure 7, Figure 8 and Figure 9 for SBAM, FLACS and KFX, respectively.
The flammable clouds obtained using FLACS and KFX (Figure 8 and Figure 9) are similar, whereas both deeply differ from the flammable cloud obtained with SBAM (Figure 7). On one hand, FLACS and KFX flammable clouds appear like a stretched free-jet plume, which is curved due to the wind effect and barely influenced by the congested environment. On the other hand, in SBAM map (Figure 7), the jet impacts the obstacle “A”, causing a deformation of the plume; this interaction influences the evolution of the cloud, generating a highly “irregular” shape of the area involved by accidental scenario, as it should be realistically. The difference is mostly due to the use of the PDR approach by FLACS and KFX, because the boundary layer near the obstacles is not solved and, therefore, the separation phenomenon of a flow impacting on an object is not correctly addressed: the PDR approach, used by FLACS and KFX, seems inappropriate to model the flow-obstacle interactions in a proper way, since it neglects or badly approximates many geometrical features. On the other hand, it should be acknowledged that the computational costs of FLACS and KFX are much smaller than those of SBAM.

4.2.2. Uncertainty Quantification for Risk-Informed Decision-Making

We here present an approach for UQ that considers the effects of the discretization source of uncertainty on the volume of the flammable cloud, and, ultimately, on the risk indicators σ D a m a g e , σ t a r g e t and σ d 1.5 (Equations (1)–(3)). The discretization source of uncertainty is unequivocally related to the mesh size used to represent the governing (N–S) flow equations. To ensure that the solution of the discretized equations closely approximates the solution of the original equations [14], and to quantify the spatial discretization uncertainty, we relied on the Grid Convergence Index (GCI) method and the identification of the exact value f0.
The calculation of f0 [17] and GCI [16] proceeds as follows:
  • Assume a discrete solution f as a function of the characteristic size of the grid h
    f = f 0 + g 1 h + g 2 h 2 + g 3 h 3 +
    where f 0 represents the exact value for the continuum case with the size of the grid h = 0 .
  • According to the method of order p, the Equation (5) becomes:
    f = f 0 + g p h p + O ( h p + 1 )   g i = 0   w i t h   i = 1 ,   2 , . ,   p 1
    and two solutions f 1 and f 2 of order p can be found (referring to the characteristic lengths of the grid h 1 and h 2 (with h 1 < h 2 and grid refinement ratio equal to r = h 1 / h 2 in the Equation (6)):
    f 1 = f 0 + g p h p + O ( h p + 1 )
    f 2 = f 0 + g p ( r h ) p + O ( ( r h ) p + 1 )
  • Linearly combining f 1 and f 2 , the general Richardson’s extrapolation is defined:
    f * = f 1 r p r p 1 f 2 r p 1 = f 1 + f 1 f 2 r p 1
    f * = f 0 + O ( h p + 1 )
    where f * approximates f 0 with order p + 1 .
  • If order p is unknown (i.e., the order of the solution is influenced by numerical schemes, boundary conditions…), three solutions f 1 ,   f 2 ,   f 3 with constant grid refinement ratio and h 1 < h 2 < h 3 can be used to estimate:
    p = l n ( f 3 f 2 f 2 f 1 ) ln ( r )
    the relative error ε of the solution f 1 :
    ε = f 2 f 1 f 1
    and a fine grid Richardson error estimator E 1 , which estimates the error in a fine-grid solution f 1 , by comparing this solution to the coarse grid f2 [16]:
    E 1 = ε r p 1
In order to define an index of the spatial discretization error, Roache [37] further developed the Richardson’s extrapolation method, defining the Grid Convergence Index (GCI) as:
G C I 1 = F s | ε | r p 1
where G C I 1 is the index for the grid h 1 (the finest one) and F s has a value of 3 (i.e., the ratio between E 1 and ε for grids with grid refinement ratio r and order p equal to 2). Repeating the same procedure for the grid with size h 2 , it is possible to define the ratio between G C I 1 and G C I 2 , verifying the asymptotic trend of the solutions f 1 and f 2 through the relation (the interested reader may refer to [37] for the proof of the derivation of Equation (15)):
G C I 2 = r p G C I 1
For performing the required simulations with the different mesh refinements, the same simulations features adopted in Section 4 have been kept to avoid adding in the solutions a bias not due to the spatial discretization of the mesh. A grid refinement ratio r = 2 is used, and the three meshes used for FLACS and KFX consist of 5 × 10⁵, 1 × 10⁶ and 2 × 10⁶ elements, while for SBAM of 2.2 × 10⁶, 4.5 × 10⁶ and 9 × 10⁶ elements. It is worth mentioning that the results obtained with SBAM are only due to the mesh discretization for the dispersion simulations, whereas the SB module is considered as a “black-source”; instead, as customary in FLACS and KFX the whole release-dispersion CFD simulation is performed. Results are:
  • FLACS: GCI = 7.8%, f 0   = 163 m3
  • KFX: GCI = 10.6%, f 0 = 199 m3
  • SBAM: GCI = 1.2%, f 0 = 83 m3
With respect to f 0 , it is interesting to note that FLACS and KFX provide more conservative results with respect to SBAM, to cover the simplifying modelling assumption adopted (and overcome by SBAM): f 0 estimated by KFX is >100% larger than for SBAM, whereas f 0 estimated by FLACS is ~100% larger than for SBAM, which means that the energies and damage towards which countermeasures and barriers are to be designed for are much larger than what they actually should be. The propagation of the results for GCI on the risk indicators is summarized in Table 4.
It is important to notice the important role played by the mesh size in the assessment of the risk indicators: for example, the uncertainty brought by the mesh size (0.7% of σ D a m a g e for KFX) accounts for ~10.5% of the nominal value (6.63%). In general terms, it can also be observed that the estimated risk measures are similar for FLACS and KFX, whereas the estimated risk measures with SBAM deeply differ: SBAM, indeed, being more realistic than the other CFD approaches (as widely analyzed in Section 2), provides less conservative estimation of the risk measures, whereas KFX is the most conservative (mainly due to the adopted PDR approach, which does not solve the boundary layer to reproduce the separation of a flow impacting an object): the flow-obstacle interactions are hardly approximated (see Figure 9), and, therefore, the jet seems to be insensitive (i.e., does not changes direction) to the interaction with the obstacle, leading to larger values of σ d 1.5 . Conversely, in Figure 8, we can also note, for SBAM, that the jet gets trapped near the release point because of the interaction with the obstacle: this, realistically, increases the dispersion and mixing of CH4 with the air, diminishing the flammable volume and generating a highly “irregular” shape of the area involved by the accident. Therefore, the calculated σ d 1.5 for SBAM is due to the slowdown of CH4 jet motion, caused by the collision with the obstacle, that moves the gas to elevation higher than 0.5 m, since CH4 density is lower than air density. Another interpretation can be imputed to a jet soaring along the axis of the obstacle, once the interaction fluid-solid occurs. As a last remark, we point out that σtarget is not significant whatever CFD approach is adopted, because, for all the simulated cases, the CH4 does not reach the perimeter of the domain.

5. Conclusions

In this work, a novel approach for the UQ of CFD calculations such as FLACS, KFX and SBAM and its propagation to a set of novel risk indices is proposed and tested on a realistic case study regarding an accidental high-pressure methane release scenario in a realistic offshore O & G platform deck. Among the sources of uncertainty affecting CFD calculations, such as modeling (boundary conditions, initial conditions, geometry, fluid properties, turbulence modeling errors) and numerical (discretization, round-off and iterative convergence errors) errors, in this work we have only considered the effects of mesh discretization on the uncertainty of the calculation results. The uncertainty due to the mesh size is quantified by means of the metrics GCI and f 0 and then propagated to the novel risk measures for a realistic and risk-oriented analysis. Results show that FLACS and KFX provide more conservative results with respect to SBAM to cover the simplifying modelling assumptions adopted, which may lead to preventive/mitigative oversizing of the safety systems with waste of economical and material resources. It is worth noting that the approach taken, based on the GCI, involves only the construction of three meshes, which seems very reproducible by nonexpert users. This methodology could also permit risk analysts, who are not CFD experts, to estimate the error on the results due to the domain discretization.

Author Contributions

Conceptualization, A.C., F.D.M., R.M. and E.Z.; methodology, A.M., G.L., A.C.U., R.G., A.C., F.D.M., R.M. and E.Z.; software, Not applicable; validation, F.P.; formal analysis, F.P.; investigation, F.P. and A.M.; resources, R.G. and A.C.; data curation, F.P. and A.M.; writing—original draft preparation, F.P. and A.C.U.; writing—review and editing, A.M., G.L., F.D.M., R.M. and E.Z.; visualization, F.P., A.M. and A.C.U.; supervision, G.L., R.G., A.C., F.D.M., R.M. and E.Z.; project administration, A.C., F.D.M., R.M. and E.Z.; funding acquisition, A.C. All authors have read and agreed to the published version of the manuscript.

Funding

This research received no external funding.

Institutional Review Board Statement

Not applicable.

Informed Consent Statement

Not applicable.

Acknowledgments

The research presented in this paper has been sponsored by the Italian Ministry of Economic Development’s Directorate General for Infrastructures and Energy Systems and Geo-Mining Safety.

Conflicts of Interest

The authors declare no conflict of interest.

References

  1. Ogwu, A.; Badamasuiy, S.; Joseph, C. Environmental Risk Assessment of Petroleum Industry in Nigeria Friday. Int. J. Sci. Res. Innov. Technol. 2015, 2, 4. [Google Scholar]
  2. Vinnem, J.E. Offshore Risk Assessment Vol 2—Chapter 14, 4th ed.; Springer: Berlin/Heidelberg, Germany, 2019. [Google Scholar]
  3. Casal, J. Evaluation of the Effects and Consequences of Major Accidents in Industrial Plants—Chapter 11; Elsevier: Amsterdam, The Netherlands, 2007. [Google Scholar]
  4. Carpignano, A.; Corti, T.; Uggenti, A.C.; Gerboni, R. Modelling of a supersonic accidental release in Oil&Gas offshore: Characterisation of a source box. GEAM Geoing. Ambient. 2017, 152, 58–64. [Google Scholar]
  5. Davis, S.; Gavelli, F.; Hansena, O.; Middhac, P. Onshore Explosion Studies—Benefits of CFD Modelling. Chem. Eng. Trans. 2013, 13, 205–273. [Google Scholar]
  6. Hanna, B.N.H.B.; Dinh, N.T.; Youngblood, R.W.; Bolotnov, I.A. Coarse-Grid Computational Fluid Dynamics (CG-CFD) Error Prediction using Machine Learning. Ph.D. Thesis, North Carolina State University, Raleigh, NC, USA, 2018. [Google Scholar]
  7. Gorle, C.; Zeoli, S.; Emory, M.; Larsson, J.; Iaccarino, G. Epistemic uncertainty quantification for Reynolds-averaged Navier-Stokes modeling of separated flows over streamlined surfaces. Phys. Fluids 2019, 31, 035101. [Google Scholar] [CrossRef]
  8. Gorle, C.; Iaccarino, G. A framework for epistemic uncertainty quantification of turbulent scalar flux models for Reynolds-averaged Navier-Stokes simulations. Phys. Fluids 2013, 25, 055105. [Google Scholar] [CrossRef]
  9. Xiao, H.; Cinnella, P. Quantification of Model Uncertainty in RANS Simulations. Prog. Aerosp. Sci. 2018, 108, 1–31. [Google Scholar] [CrossRef] [Green Version]
  10. Ke, W.C.; Chen, H.; Lin, H.W.W. A note of techniques that mitigate floating-point errors in PIN estimation. Financ. Res. Lett. 2019, 31. [Google Scholar] [CrossRef]
  11. Fraysse, F.; de Vicente, J.; Valero, E. Numerical Error Prediction and Its Applications in CFD Using τ-Estimation; BCAM: Bilbao, Spain, 2018. [Google Scholar]
  12. Colombo, E.; Inzoli, F.; Mereu, R. A methodology for qualifying industrial CFD: The Q3 approach and the role of a protocol. Comput. Fluids 2012, 54, 56–66. [Google Scholar] [CrossRef]
  13. Cutrono, A.; Visser, D.C.; Komen, E.M.J. Uncertainty Quantification method for CFD applied to the turbulent mixing of two water layers. Nucl. Eng. Des. 2018, 333, 1–15. [Google Scholar]
  14. Karniadakis, G.E. “Quantifying Uncertainty in CFD”. ASME J. Fluids Eng. 2002, 124, 2–3. [Google Scholar] [CrossRef] [Green Version]
  15. Richardson, L.F. The approximate arithmetical solution by finite differences of physical problems involving differential equations, with an application to the stresses in amasonry dam. J. Philos. Trans. R. Soc. Lond. Ser. A 1911, 210, 307–357. [Google Scholar]
  16. Roache, P.J. Verification and Validation in Computational Science and Engineering; Hermosa: Albuquerque, NM, USA, 1998. [Google Scholar]
  17. Stern, F.; Wilson, R.V.; Coleman, H.W.; Paterson, E.G. Verification and Validation of CFD Simulations; Report No. 407; Iowa Institute of Hydraulic Research: Iowa City, IA, USA, 1999. [Google Scholar]
  18. Lloyd’s Register. Comparative Study on Gas Dispersion; Lloyd’s Register: London, UK, 2012. [Google Scholar]
  19. Pappalardo, F.; Moscatello, A.; Uggenti, A.C.; Gerboni, R.; Carpignano, A.; Di Maio, F.; Mereu, R.; Zio, E. Comparison of CFD numerical ap-proaches for the simulation of accidental gas release in energy applications. In Proceedings of the ESREL2020 PSAM15 Conference, Venice, Italy, 2–5 November 2020; pp. 4067–4074. [Google Scholar]
  20. Franquet, E.; Perrier, V.; Gibout, S.; Bruel, P. Free under expanded jets in a quiescent medium: A review. Prog. Aerosp. Sci. 2015, 77, 25–53. [Google Scholar] [CrossRef]
  21. Moscatello, A.; Uggenti, A.C.; Gerboni, R.; Carpignano, A. A novel approach to high-pressure gas releases simulations. J. Loss Prev. Process. Ind. 2021, 72, 104531. [Google Scholar] [CrossRef]
  22. ANSYS. ANSYS Fluent 18.2 User’s Guide; ANSYS Inc.: Canonsburg, PA, USA, 2018. [Google Scholar]
  23. Birch, A.D.; Brown, D.R.; Dodson, M.G.; Swaffield, F. The Structure and Concentration Decay of High- Pressure Jets of Natural Gas. Combust. Sci. Technol. 1984, 36, 249–261. [Google Scholar] [CrossRef]
  24. Patankar, S.V.; Spalding, D.B. A calculation procedure for the transient and steady-state behaviour of shell-and-tube heat exchangers. In Heat Exchangers: Design and Theory Sourcebook; Afgan, N.H., Schundler, E.V., Eds.; McGraw-Hill: New York, NY, USA, 1974; pp. 155–176. [Google Scholar]
  25. Miguel, A.F.; Van de Braak, N.J.; Silva, A.M.; Bot GP, A. Wind-induced airflow through permeable materials. J. Wind. Eng. Ind. Aerodyn. 2001, 89, 59–72. [Google Scholar] [CrossRef]
  26. Launder, B.E.; Spalding, D.B. The numerical computation of turbulent flows. Comput. Methods Appl. Mech. Eng. 1974, 3, 269–289. [Google Scholar] [CrossRef]
  27. Eggins, P.L.; Jackson, D.A. Laser-Doppler velocity measurements in an under-expanded free jet. J. Phys. D Appl. Phys. 1974, 7, 14. [Google Scholar] [CrossRef]
  28. Cleaver, R.P.; Cooper, M.G.; Piper, D. Gas dispersion and build-up within offshore modules. In Proceedings of the SARSS’91: Safety and Reliability Society Symposium, Sutton Coldfield, UK, 18–19 September 1991. [Google Scholar]
  29. Novembre, N.; Podenzani, F.; Colombo, E. Numerical study for accidental gas releases from high-pressure pipelines. In Proceedings of the European Conference on Computational Fluid Dynamics ECCOMAS CFD, Egmond aan Zee, The Netherlands, 5–8 September 2006. [Google Scholar]
  30. Abramowitz, M.; Stegun, I.A. Handbook of Mathematical Functions with Formulas, Graphs, and Mathematical Tables, 9th Printing; Dover: New York, NY, USA, 1992. [Google Scholar]
  31. DNV-GL. KFX-EXISM V.3.4 User Manual, Technical Manual; DNV-GL: Bærum, Norway, 2019. [Google Scholar]
  32. European Union. Directive 2013/30EU of the European Parliament and of the Council of 12 June 2013; European Union: Brussels, Luxembourg, 2013. [Google Scholar]
  33. Vivalda, C.; Gerboni, R.; Carpignano, A. A practical approach to risk-based gas monitoring system design for oil and gas offshore platforms. In Proceedings of the 14th Probabilistic Safety Assessment and Management Conference, London, UK, 22–26 June 2018. [Google Scholar]
  34. Wilcox, D.C. Basic Fluid Mechanics Fift 96-508; DCW Industries, Inc.: La Cañada Flintridge, CA, USA, 2013. [Google Scholar]
  35. Li, X.J.; Zhou, R.P.; Konovessis, D. CFD analysis of natural gas dispersion in engine room space based on multi-factor coupling. Ocean. Eng. 2016, 111, 524–532. [Google Scholar] [CrossRef]
  36. Gexcon, A.S. FLACS v10.4r2 User’s Manual; Technical Report. Available online: https://www3.gexcon.com/files/manual/flacs/html/index.html (accessed on 1 December 2021).
  37. Roache, P.J. Perspective: A Method for Uniform Reporting of GridRefiniment Studies. J. Fluids Eng. 1994, 116, 405–413. [Google Scholar] [CrossRef]
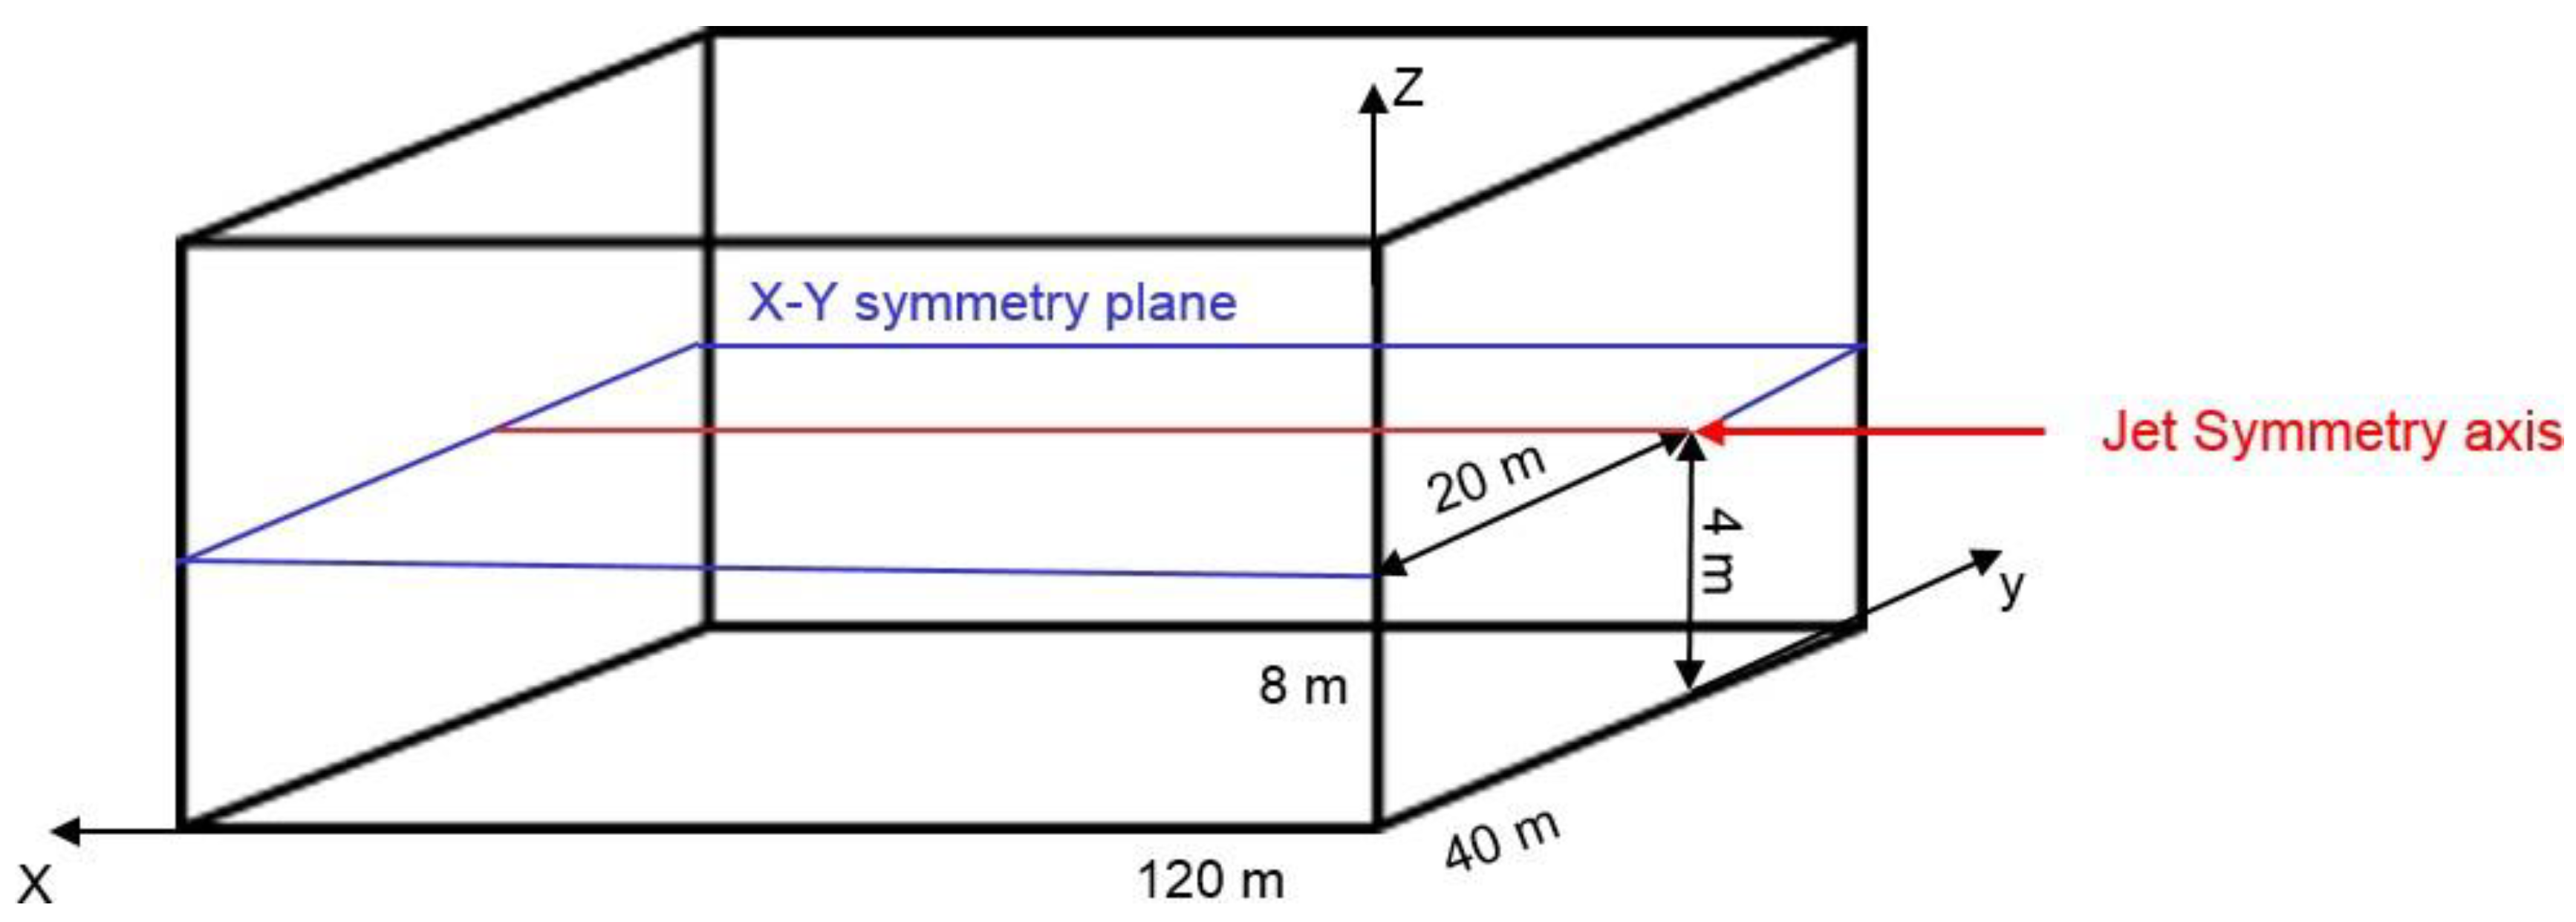
Figure 1. Simulation domain for the “free jet validation” benchmark case.
Energies 14 08117 g001
Figure 2. Mass fraction decay on the jet symmetry axis.
Energies 14 08117 g002
Figure 3. Simulation domain for the “jet impinging on a cylindrical obstacle” benchmark case.
Energies 14 08117 g003
Figure 4. Results for the case of jet and obstacle distance equal to 157 mm.
Energies 14 08117 g004
Figure 5. Results for the case of jet and obstacle distance equal to 683 mm.
Energies 14 08117 g005
Figure 6. CAD of the production deck.
Energies 14 08117 g006
Figure 7. SBAM flammable area at z = 0.5 m.
Energies 14 08117 g007
Figure 8. FLACS flammable area at z = 0.5 m.
Energies 14 08117 g008
Figure 9. KFX flammable area at z = 0.5 m.
Energies 14 08117 g009
Table 1. Error of the tools with respect to experimental data.
FLACSKFXFluent
Err5.0%12.2%1.46%
Table 2. Error of the tools with respect to experimental data (157 mm).
Case 157 mmFLACSKFXFluent (Standard k-ε)Fluent (SST k-ω)
Err223%230%55.9%42.3%
Table 3. Error of the tools with respect to experimental data (683 mm).
Case 683 mmFLACSKFXFluent (Standard k-ε)Fluent (SST k-ω)
Err42.8%98.2%22.4%18.2%
Table 4. Risk indexes with uncertainty.
FLACSKFXSBAM
σ D a m a g e (5.43 ± 0.45)%(6.63 ± 0.7)%(2.7 ± 0.01)%
σtarget0%0%0%
σ d 1.5 (39 ± 4.82)%(41 ± 5.6)%(29 ± 0.5)%
Publisher’s Note: MDPI stays neutral with regard to jurisdictional claims in published maps and institutional affiliations.