
Analysis of the Physicochemical Characteristics of Biochar Obtained by Slow Pyrolysis of Nut Shells in a Nitrogen Atmosphere

 , ,
, ,
Abstract
:1. Introduction
2. Materials and Methods
2.1. Feedstock
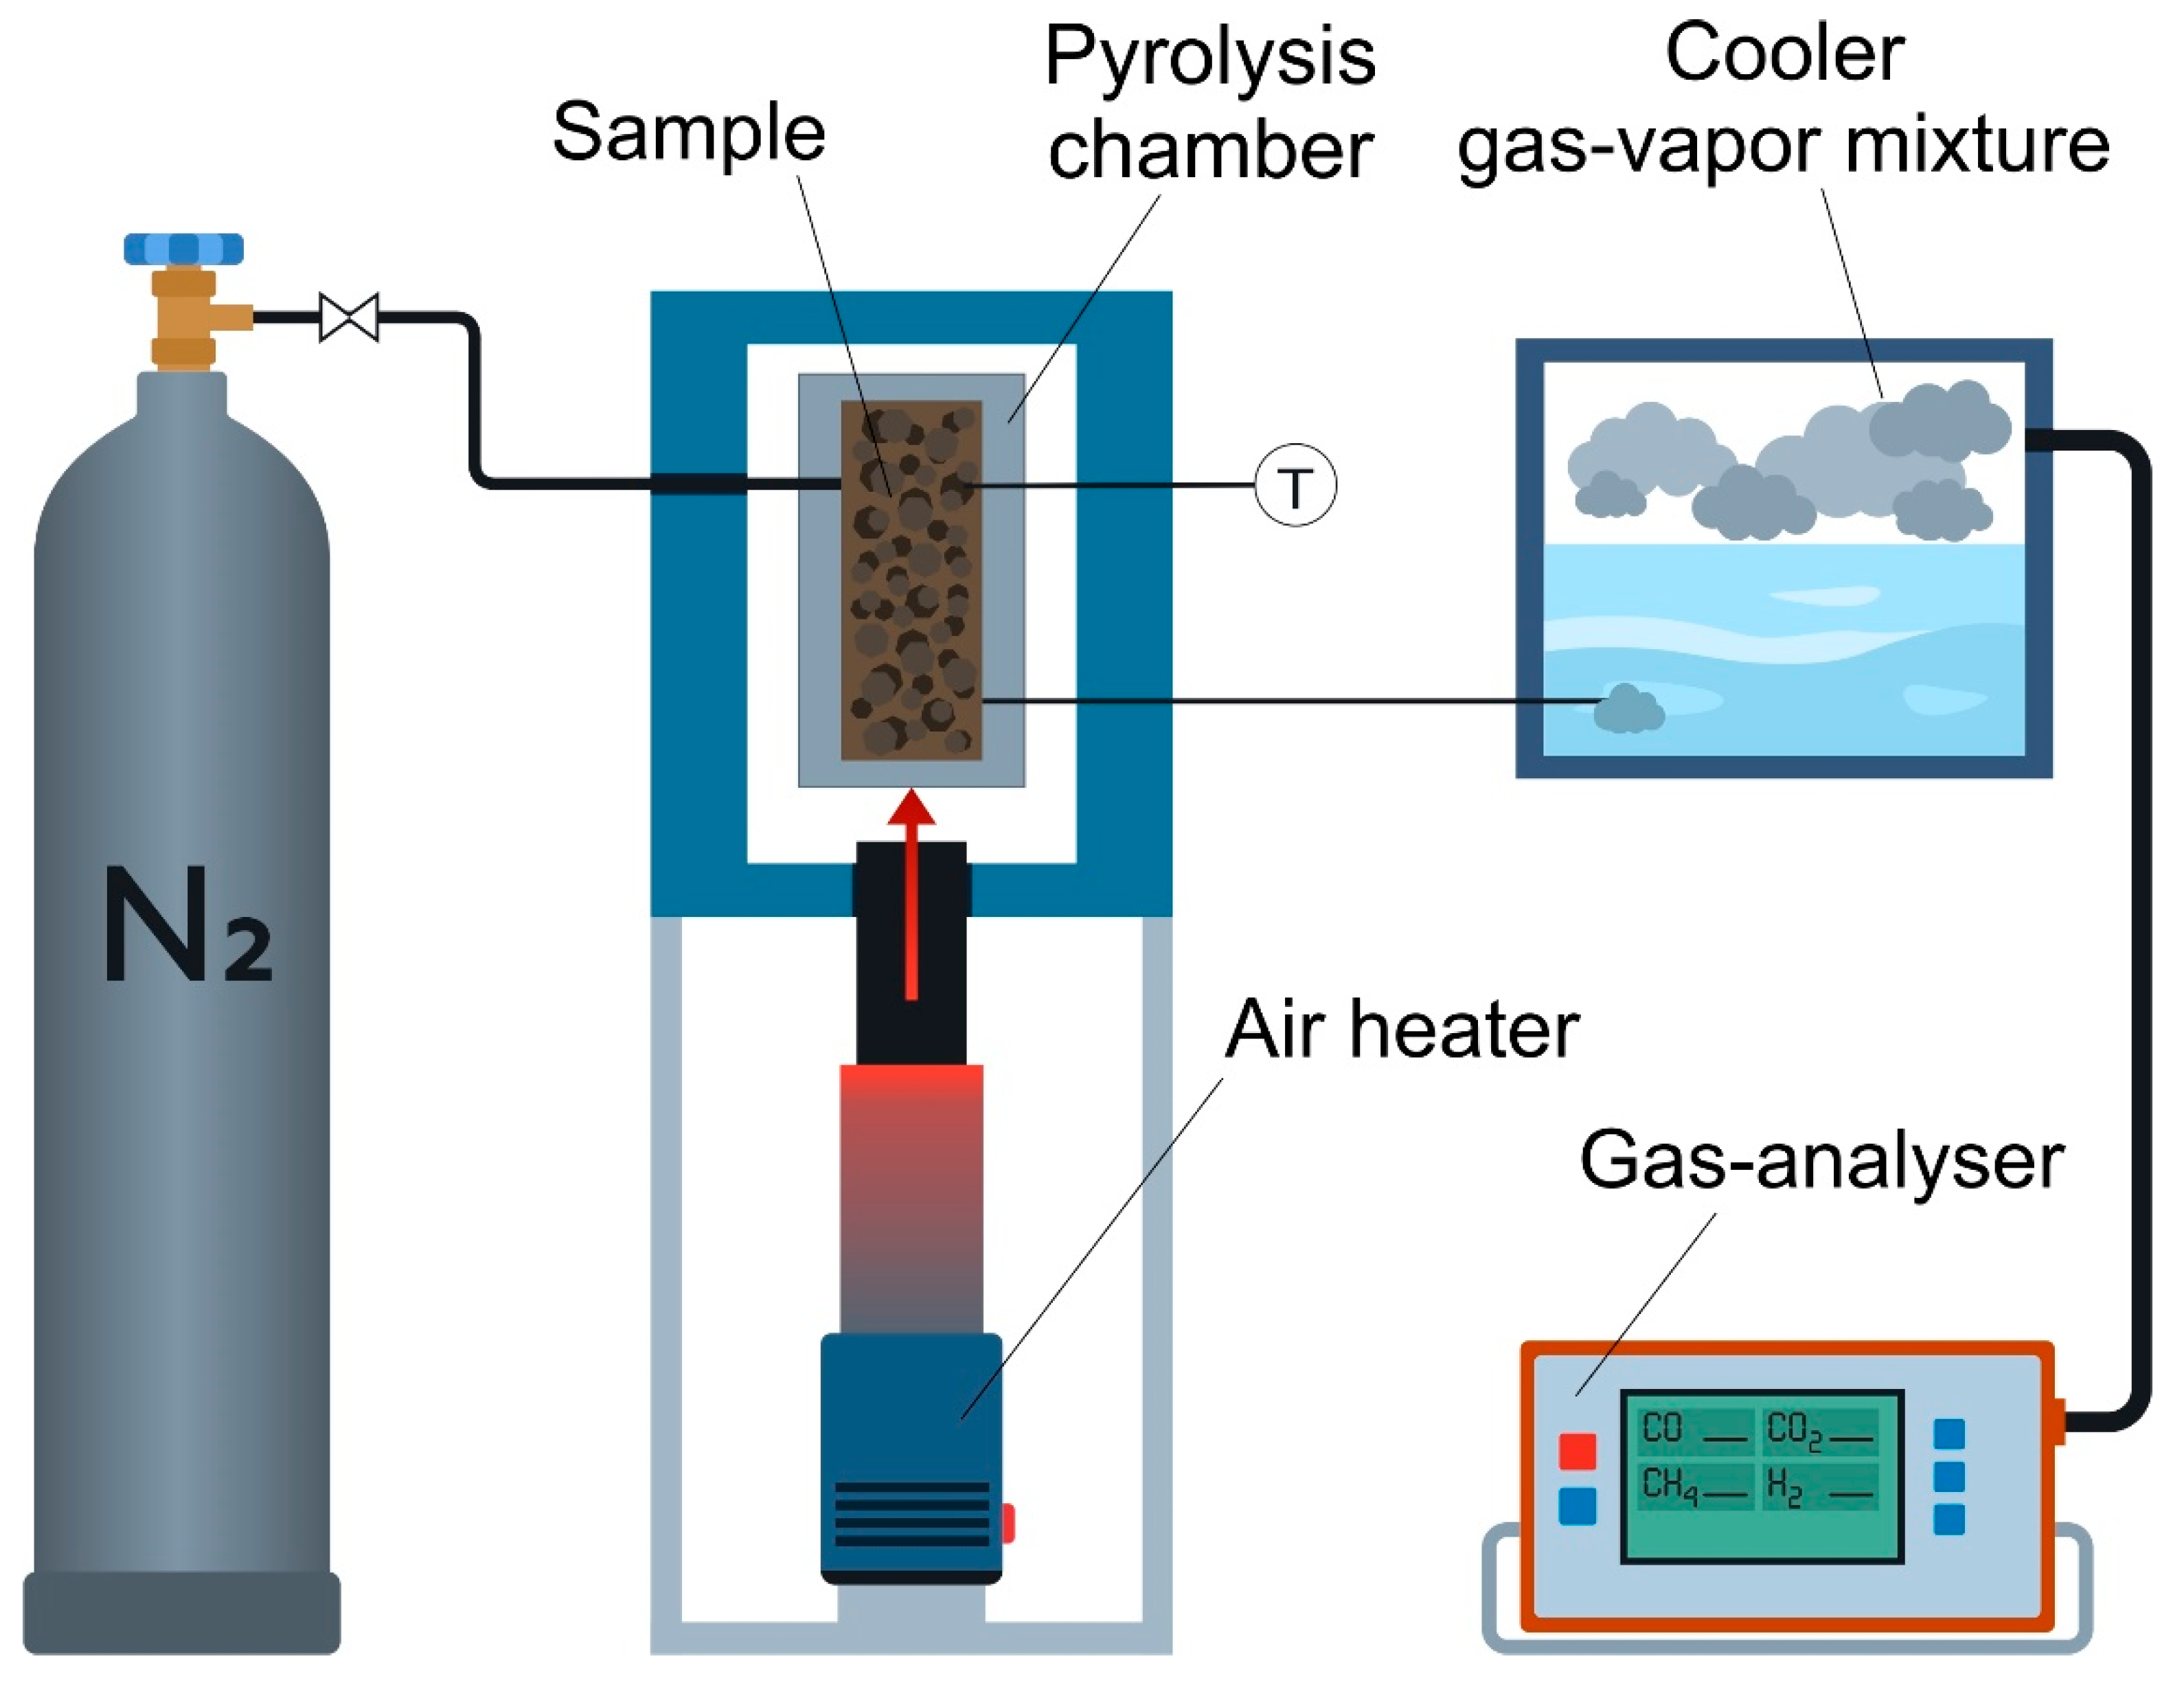
2.2. Pyrolysis
2.3. Characterization of Materials
2.4. Kinetic Analysis
3. Results and Discussion
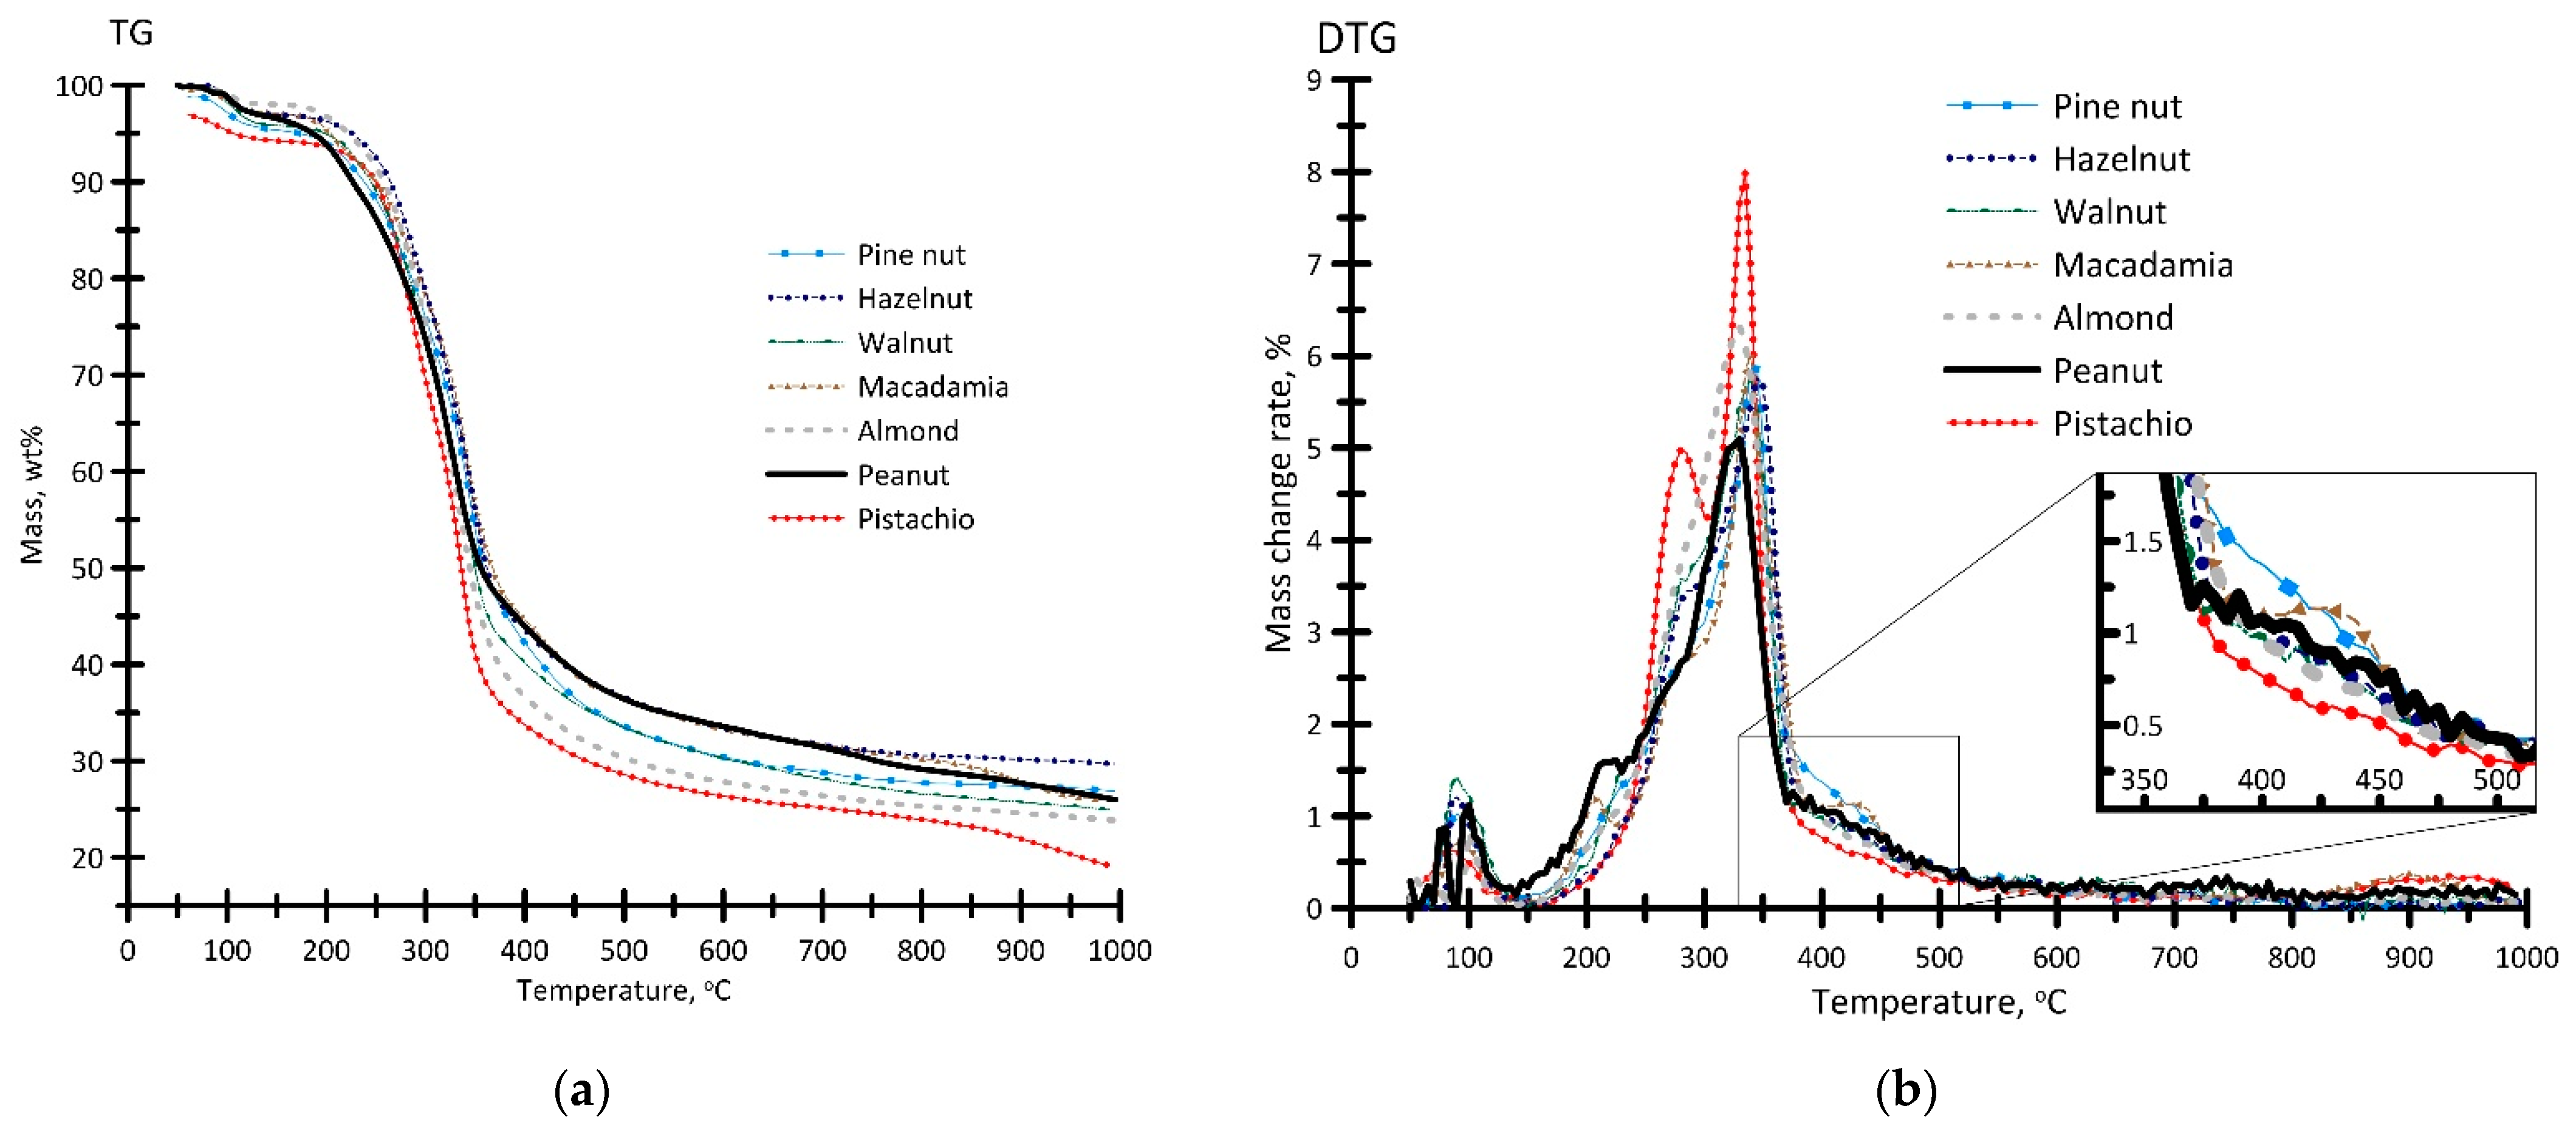
3.1. Nut Shell Characteristics
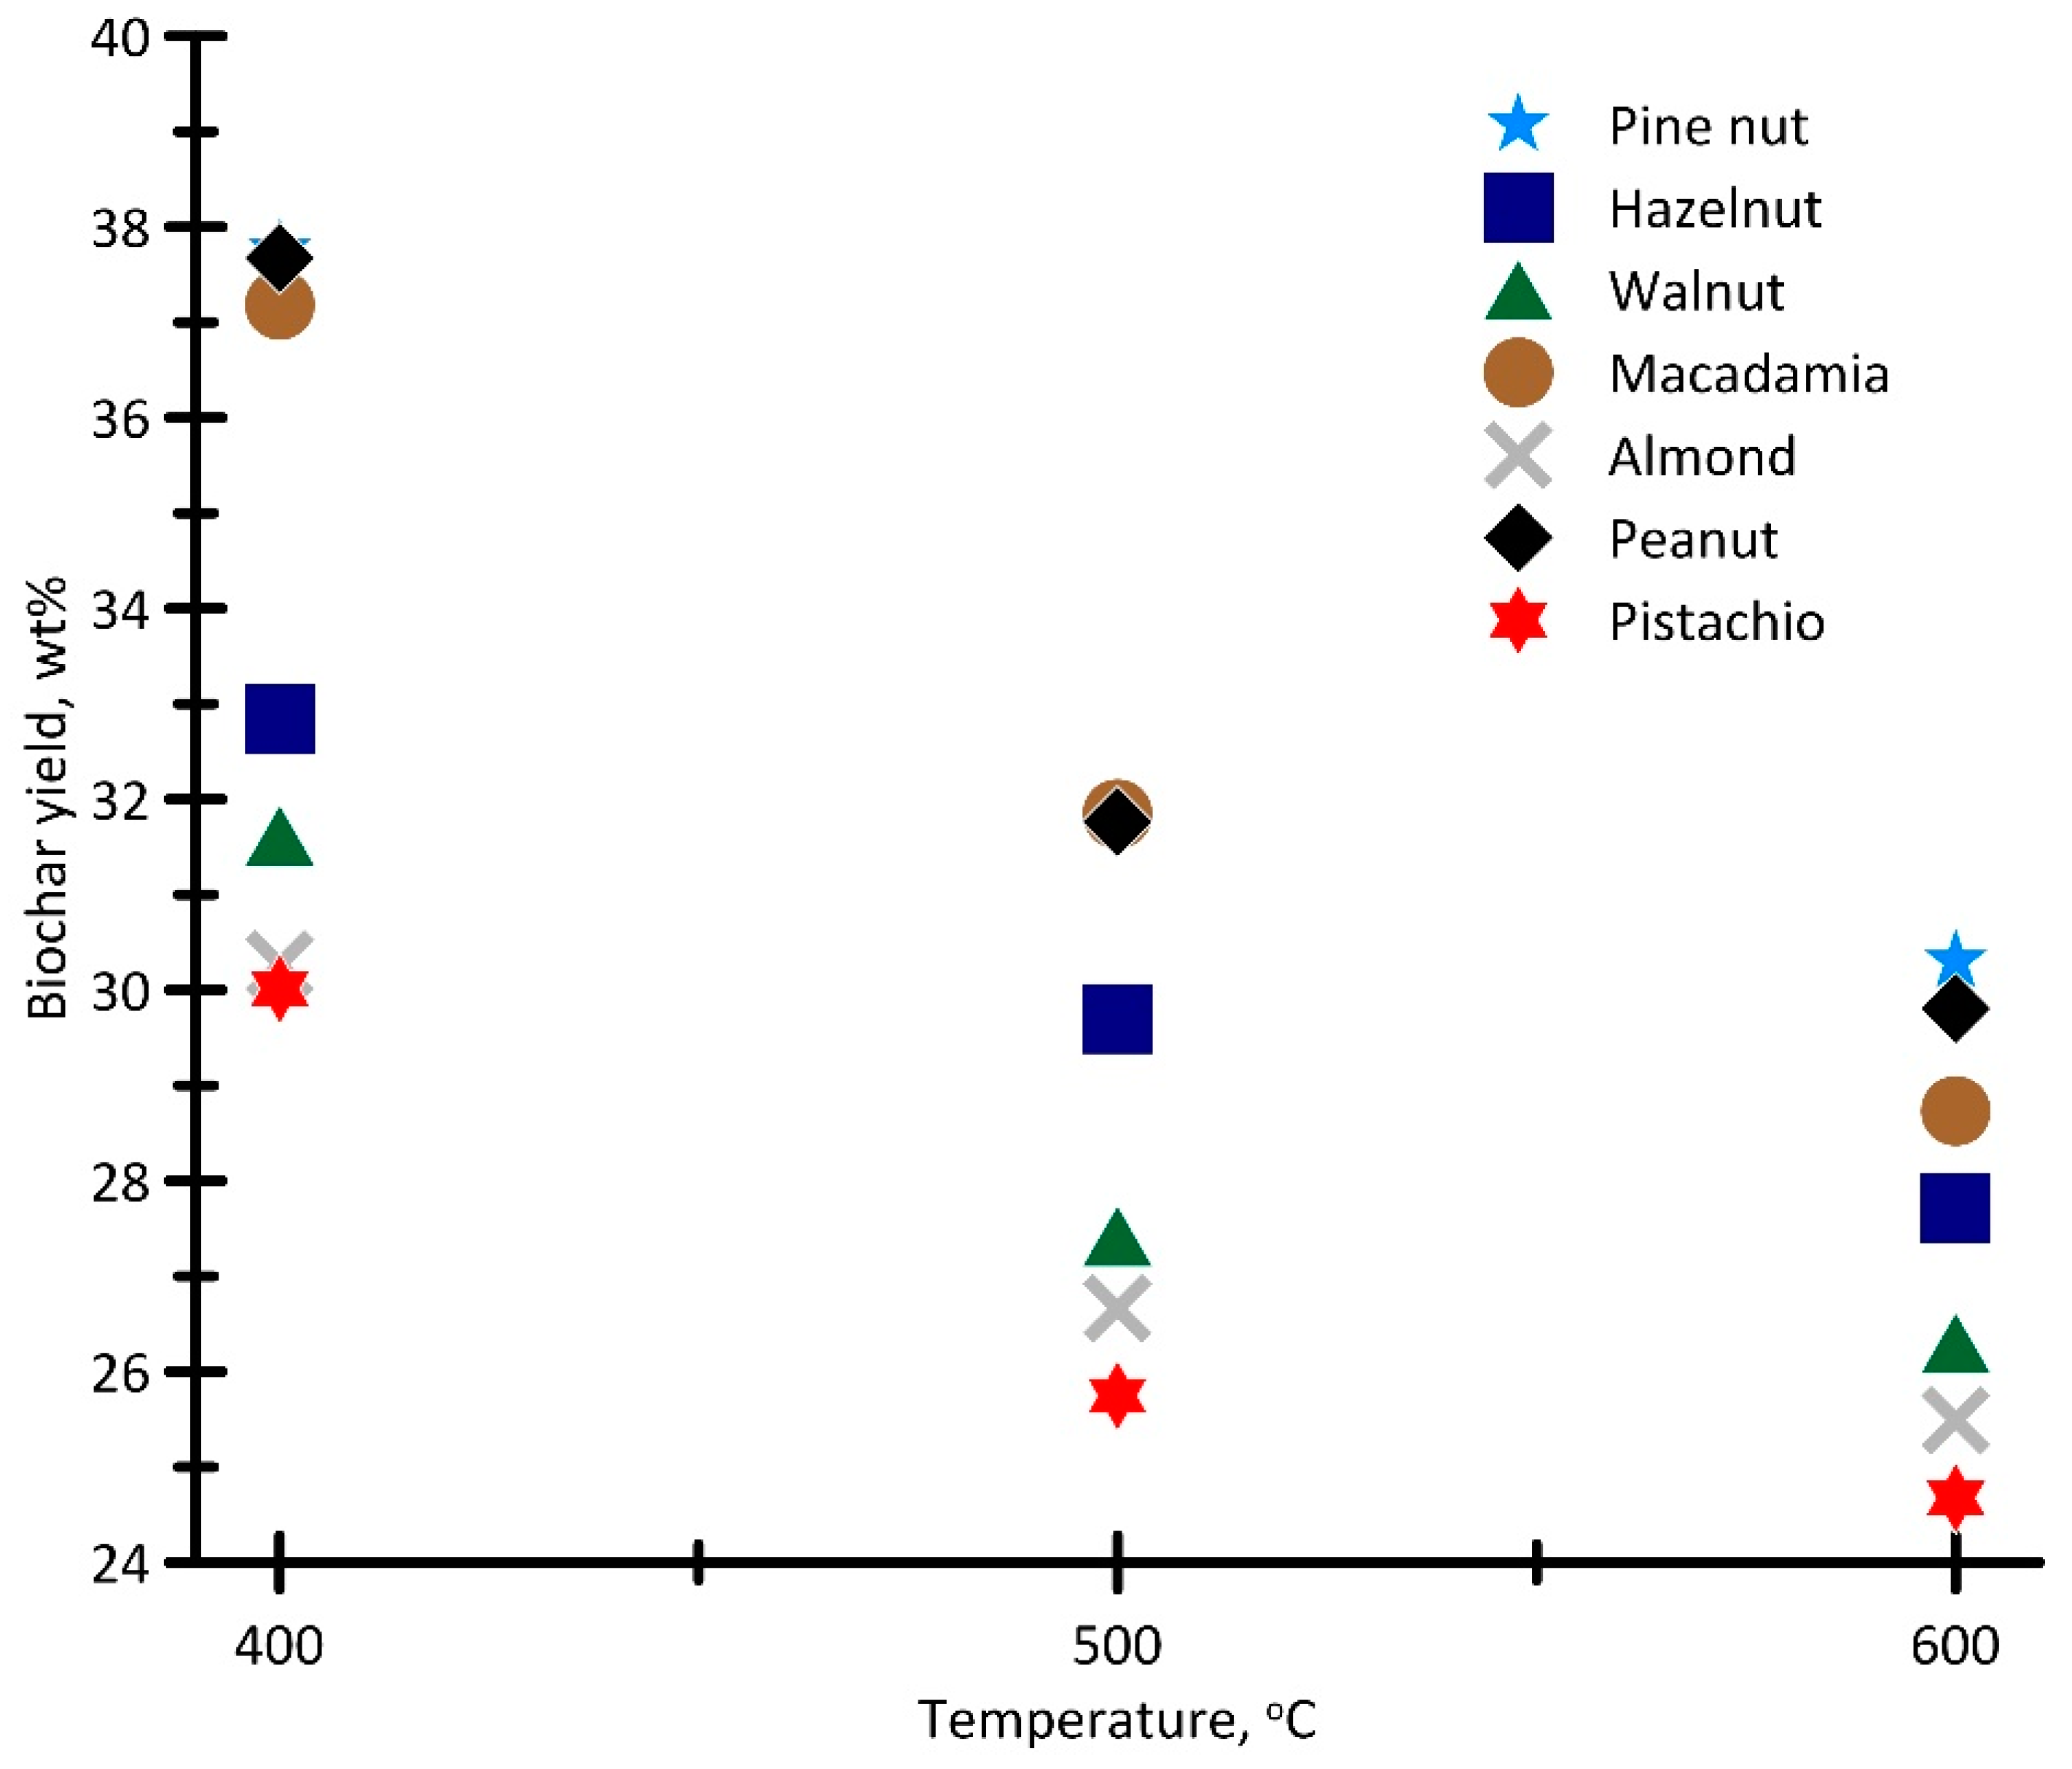
3.2. Biochar Yields
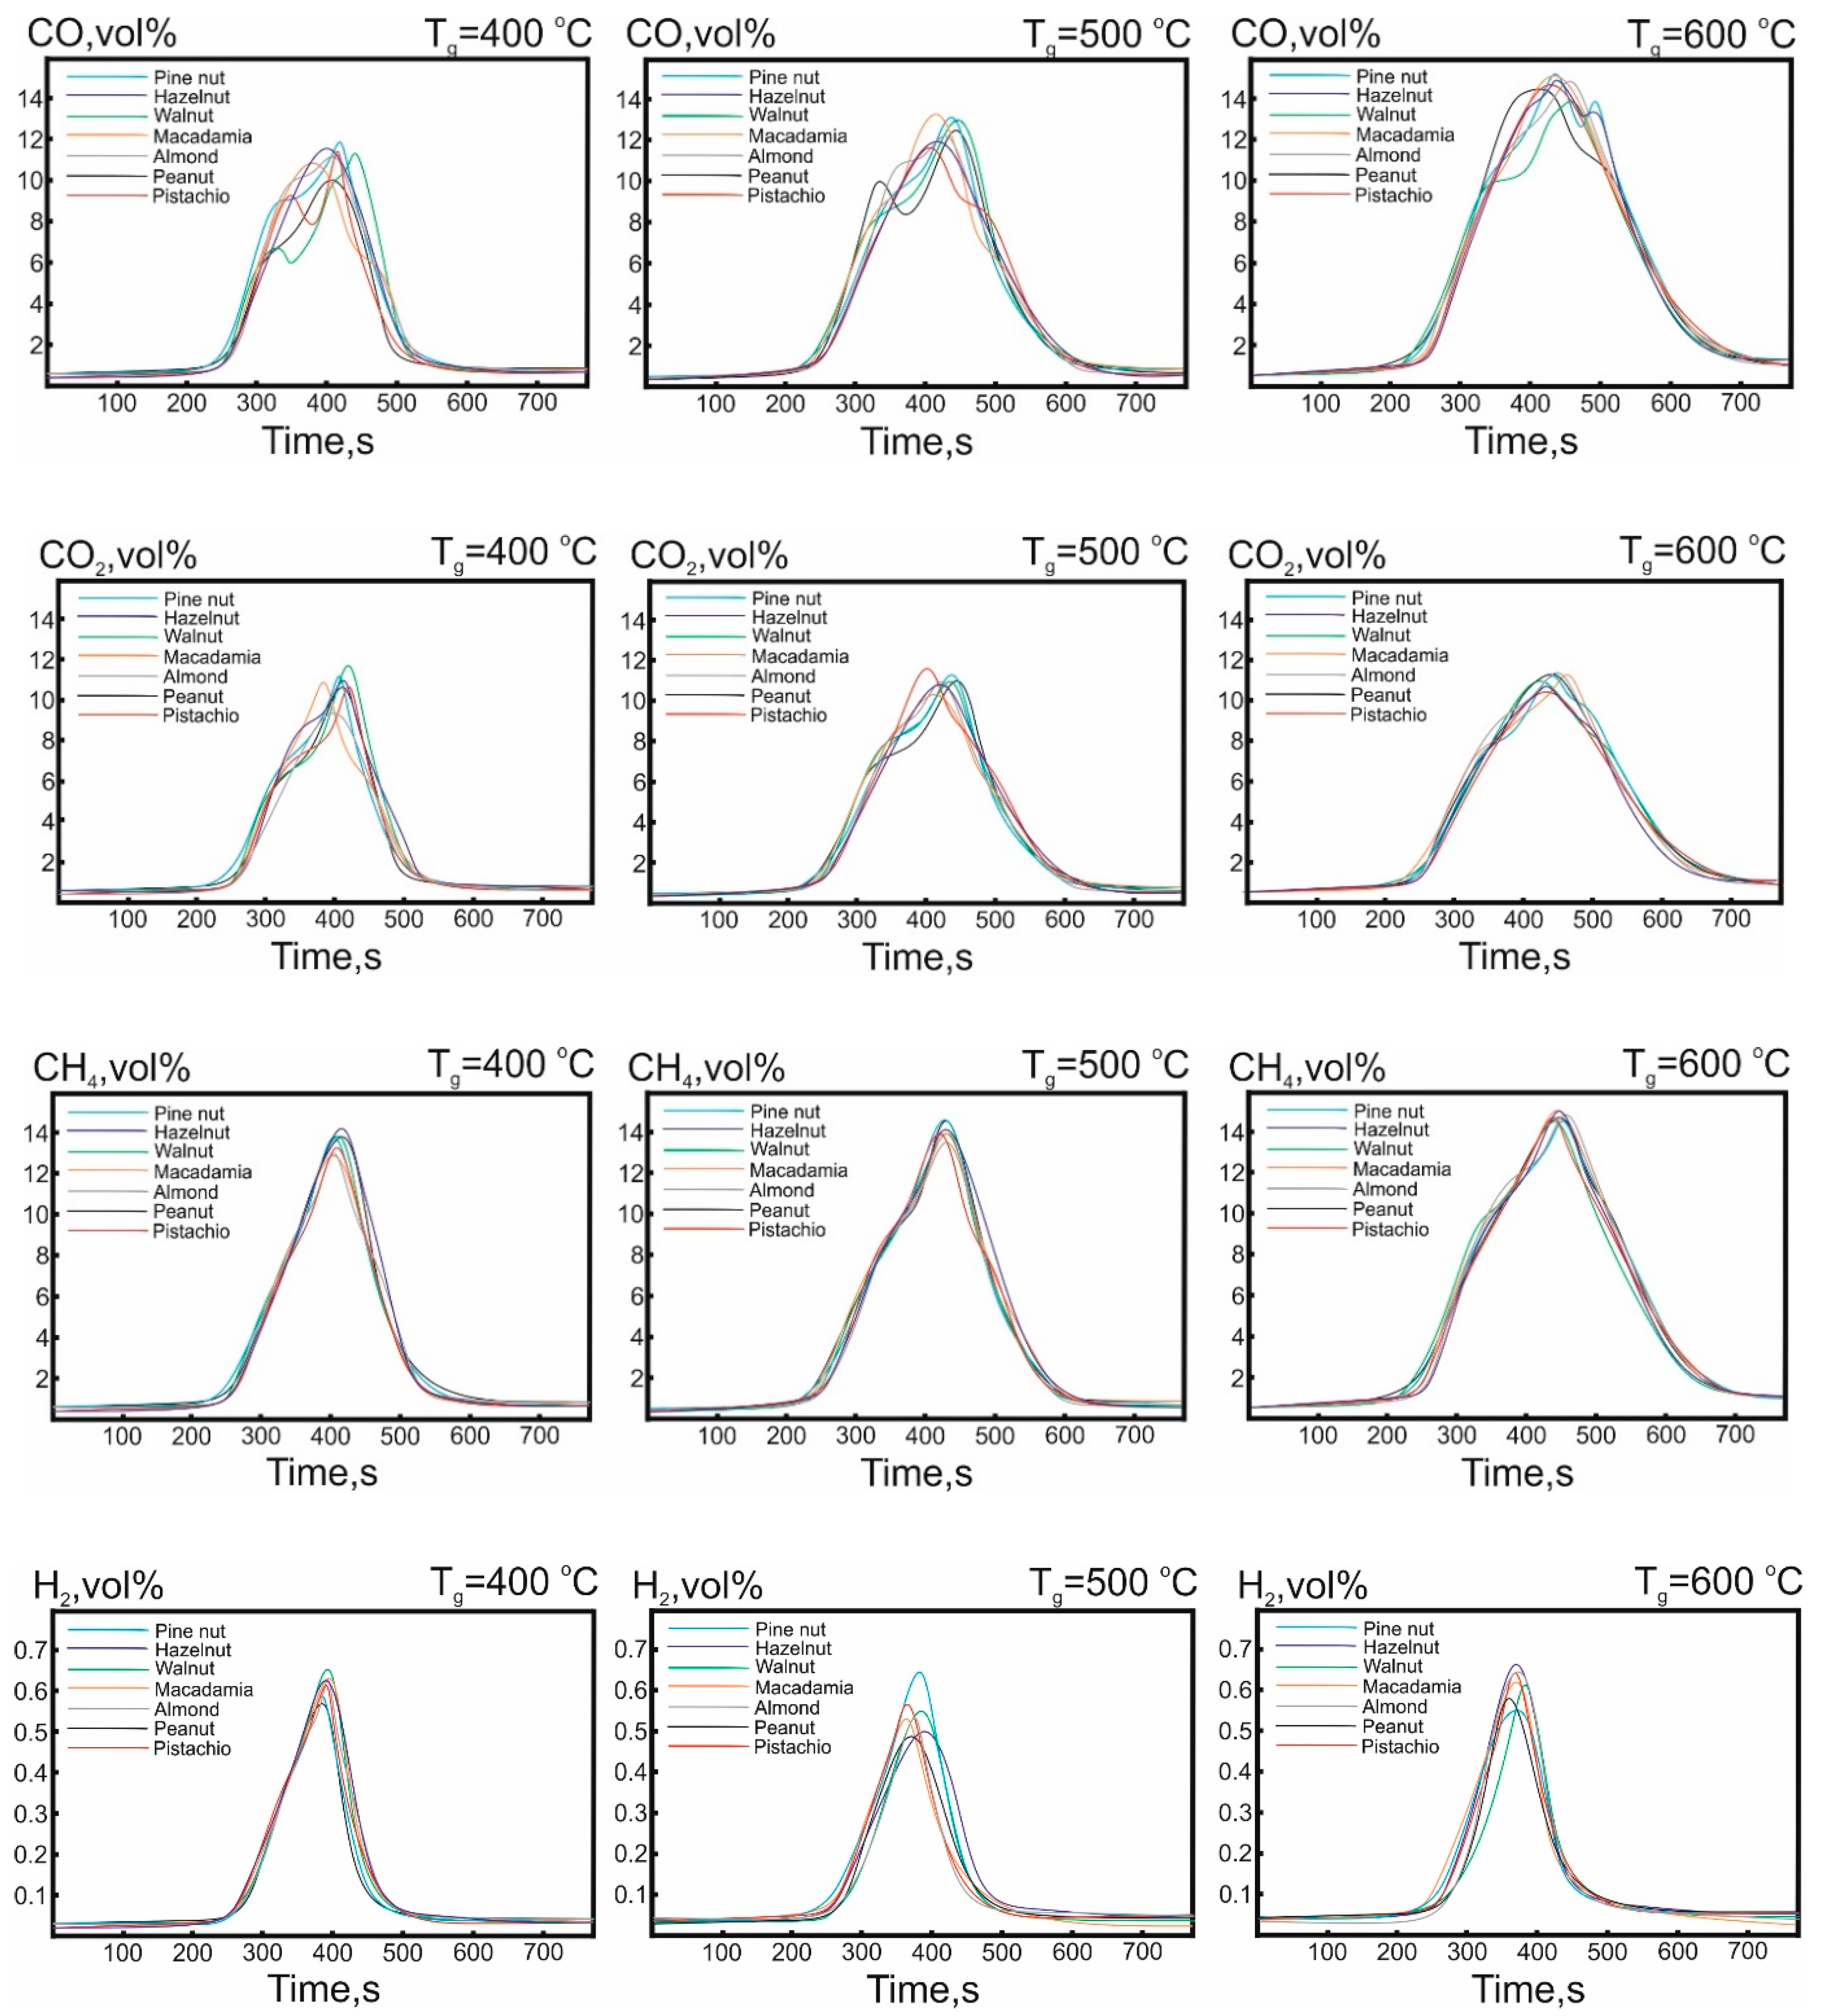
3.3. Analysis of Non-Condensed Gas-Phase Products
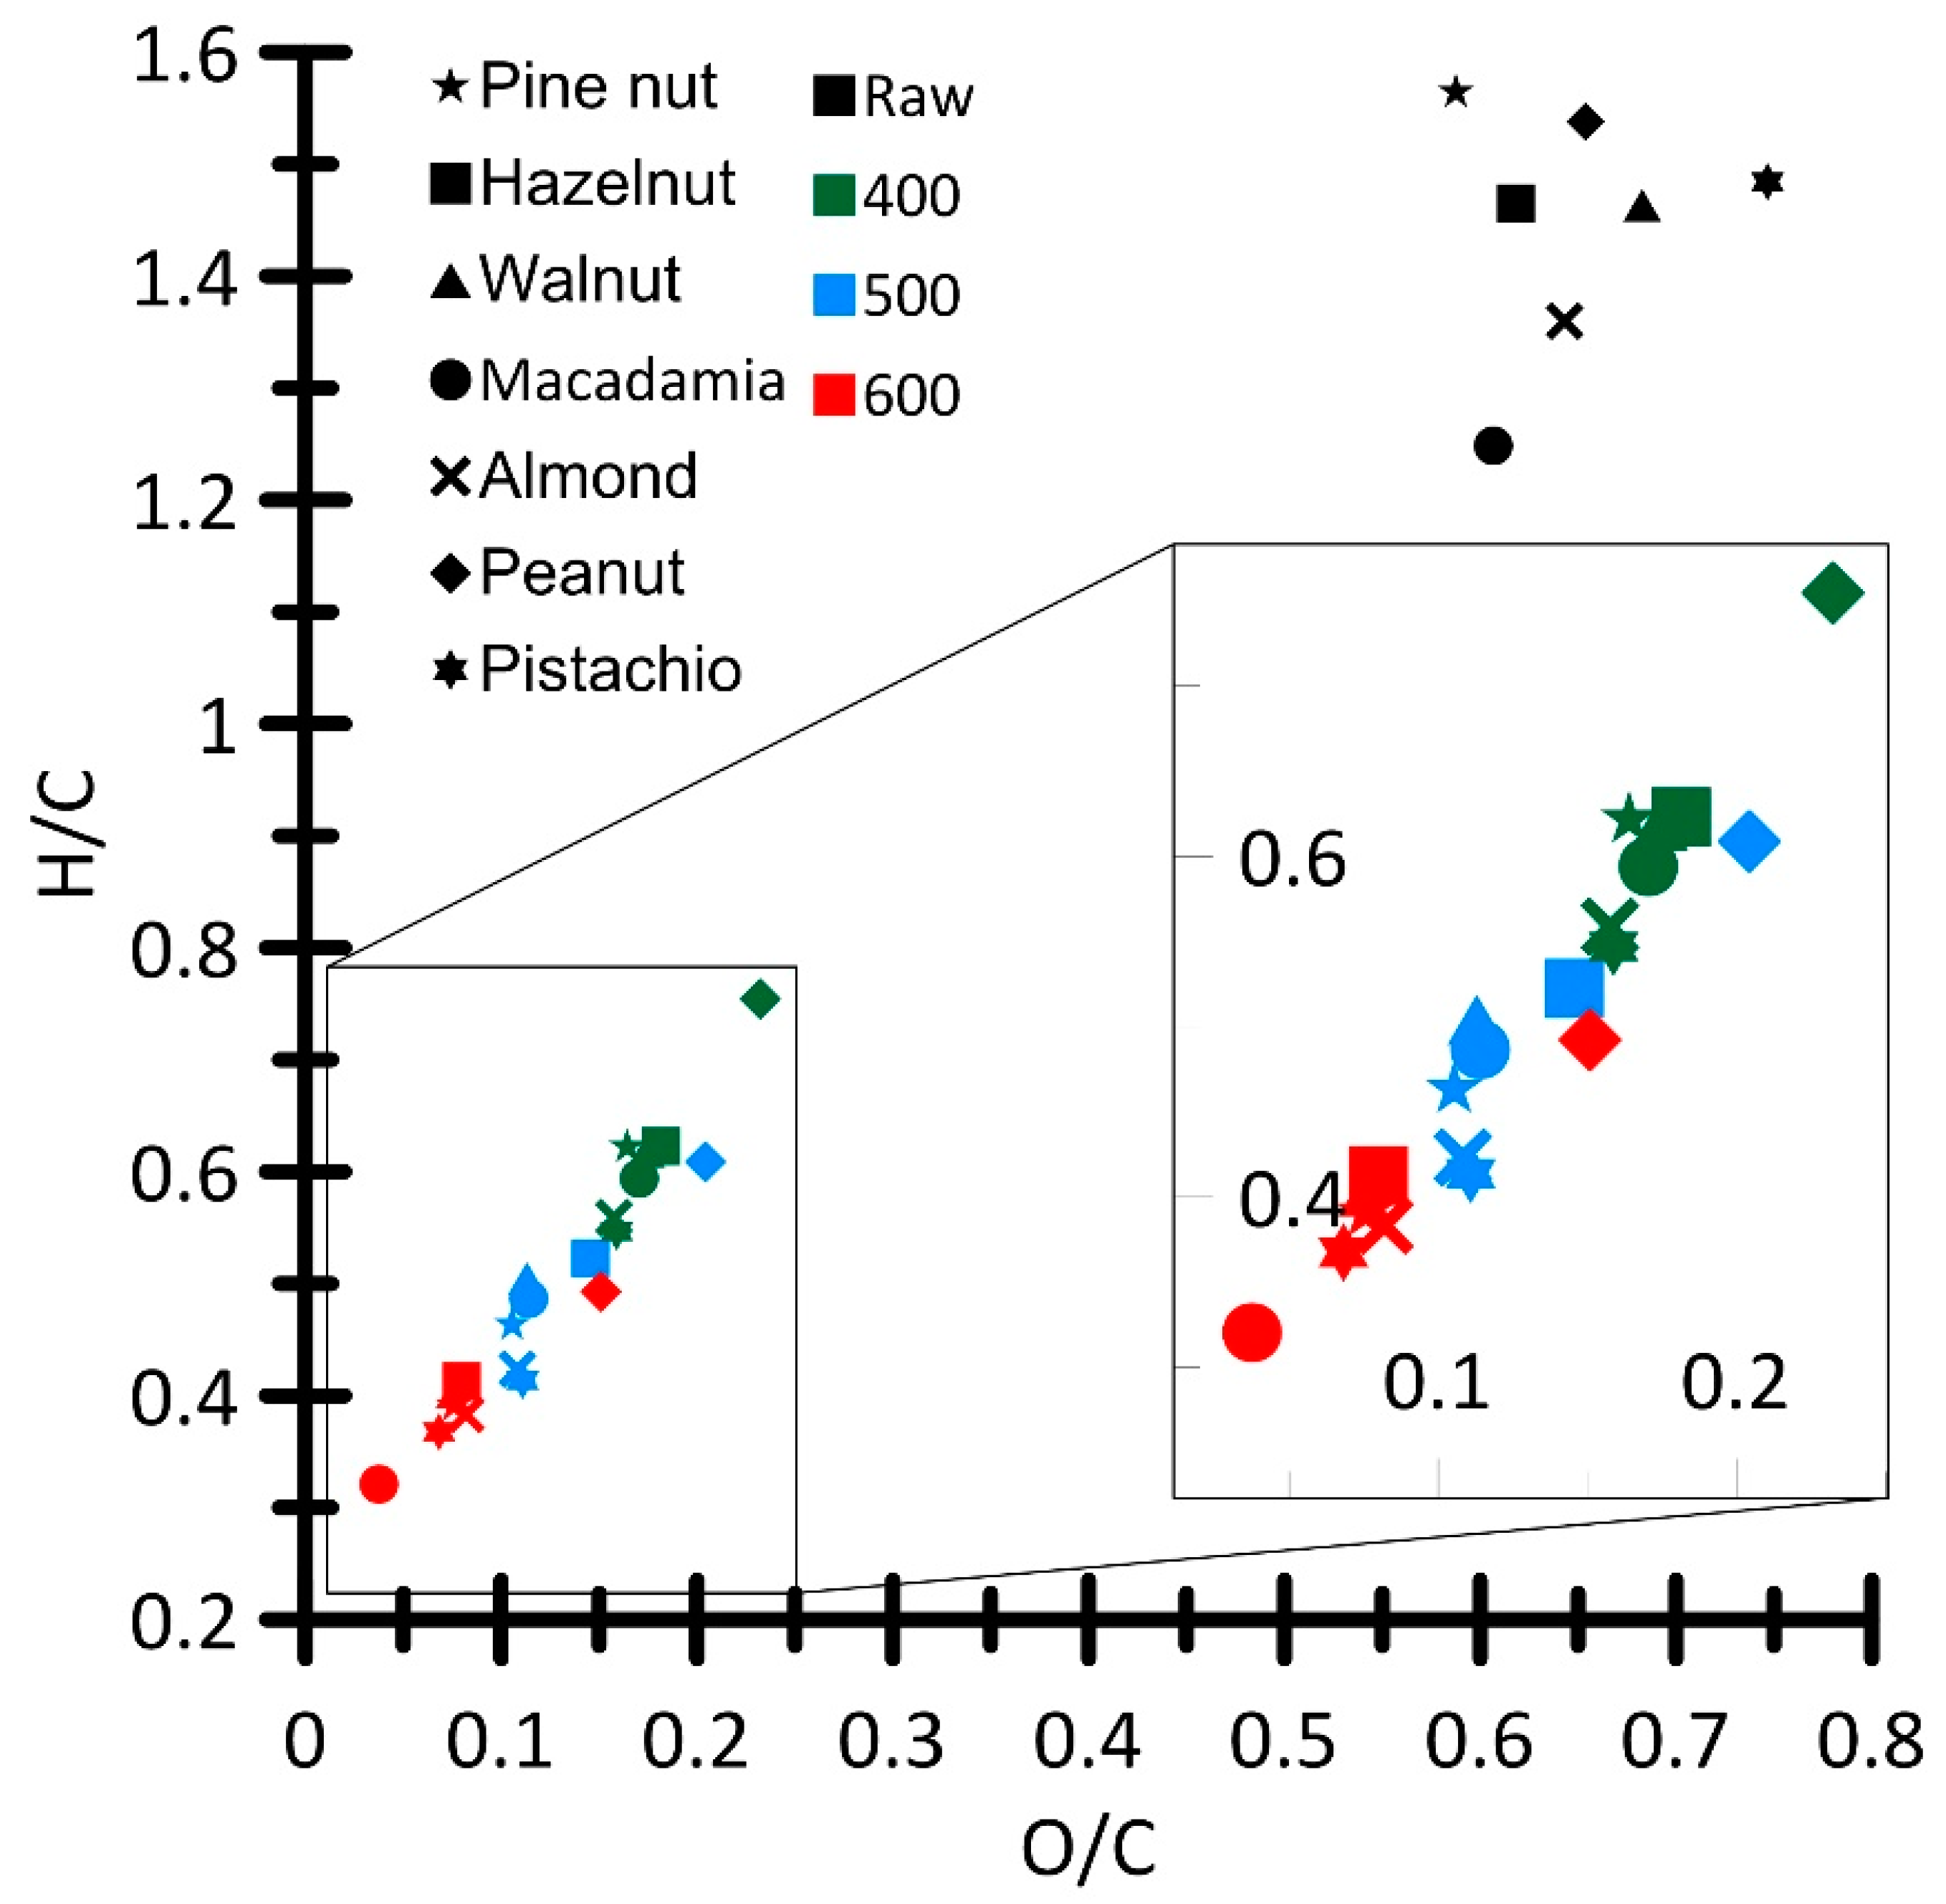
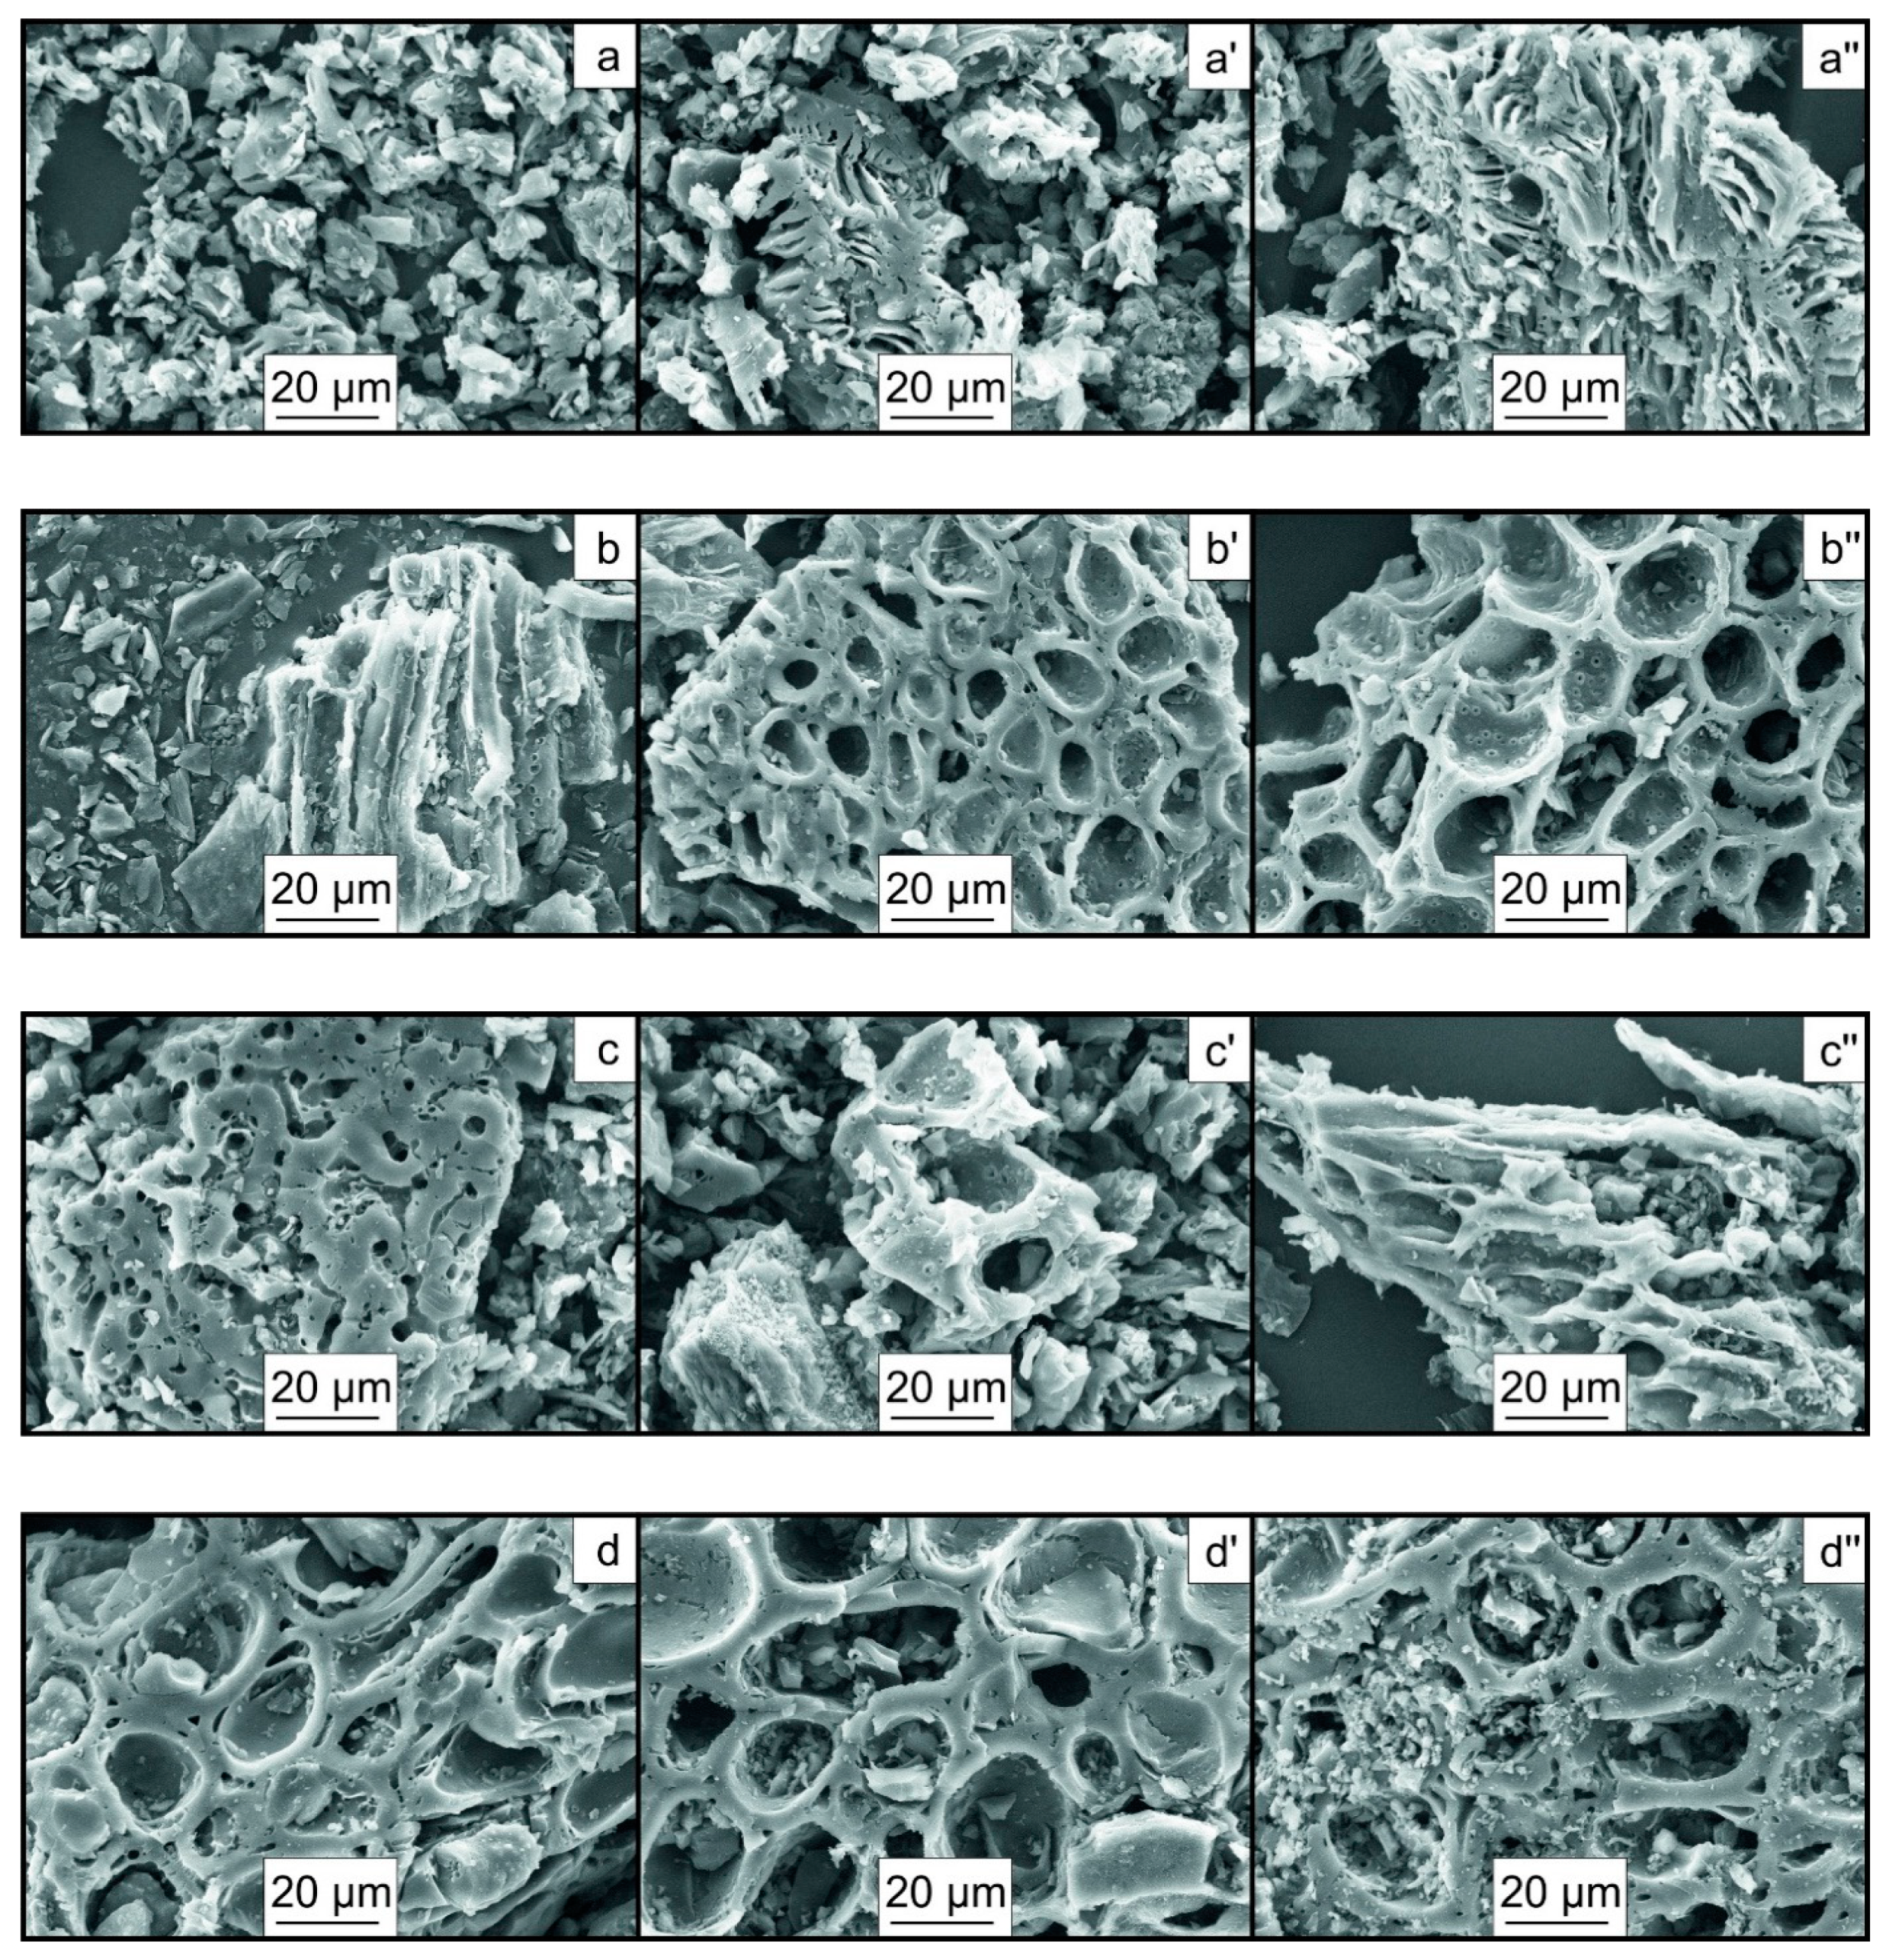
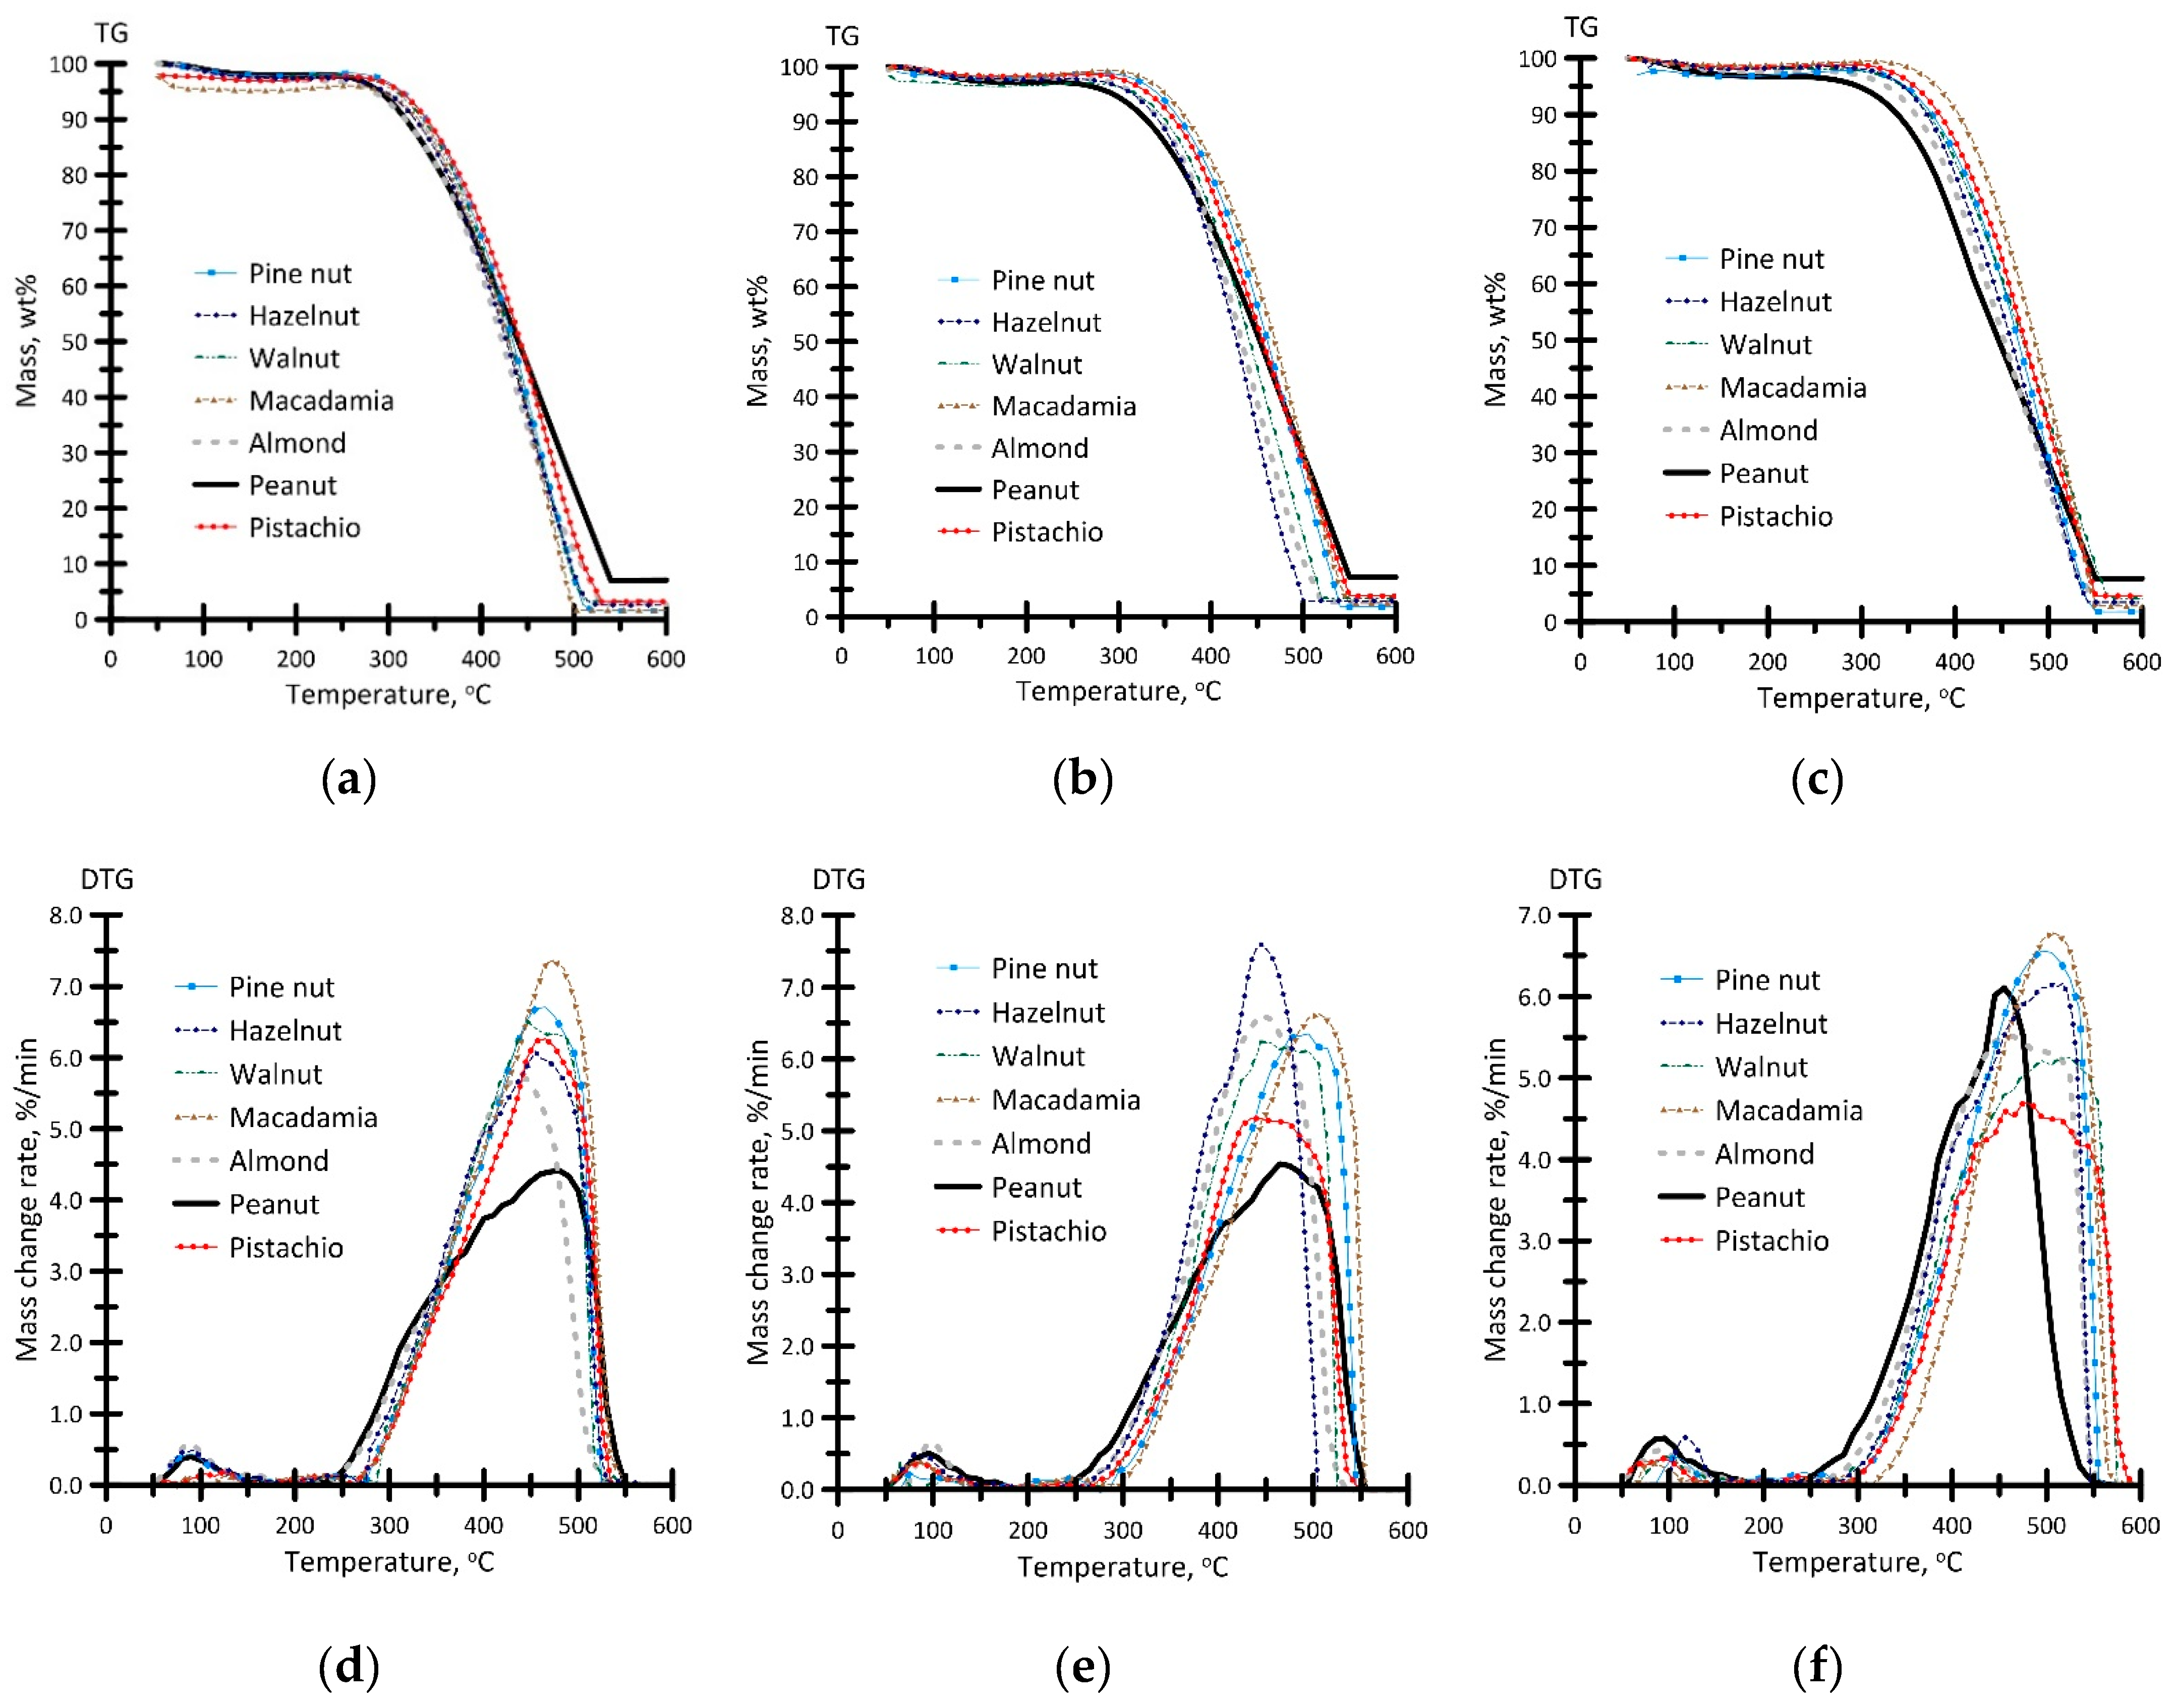
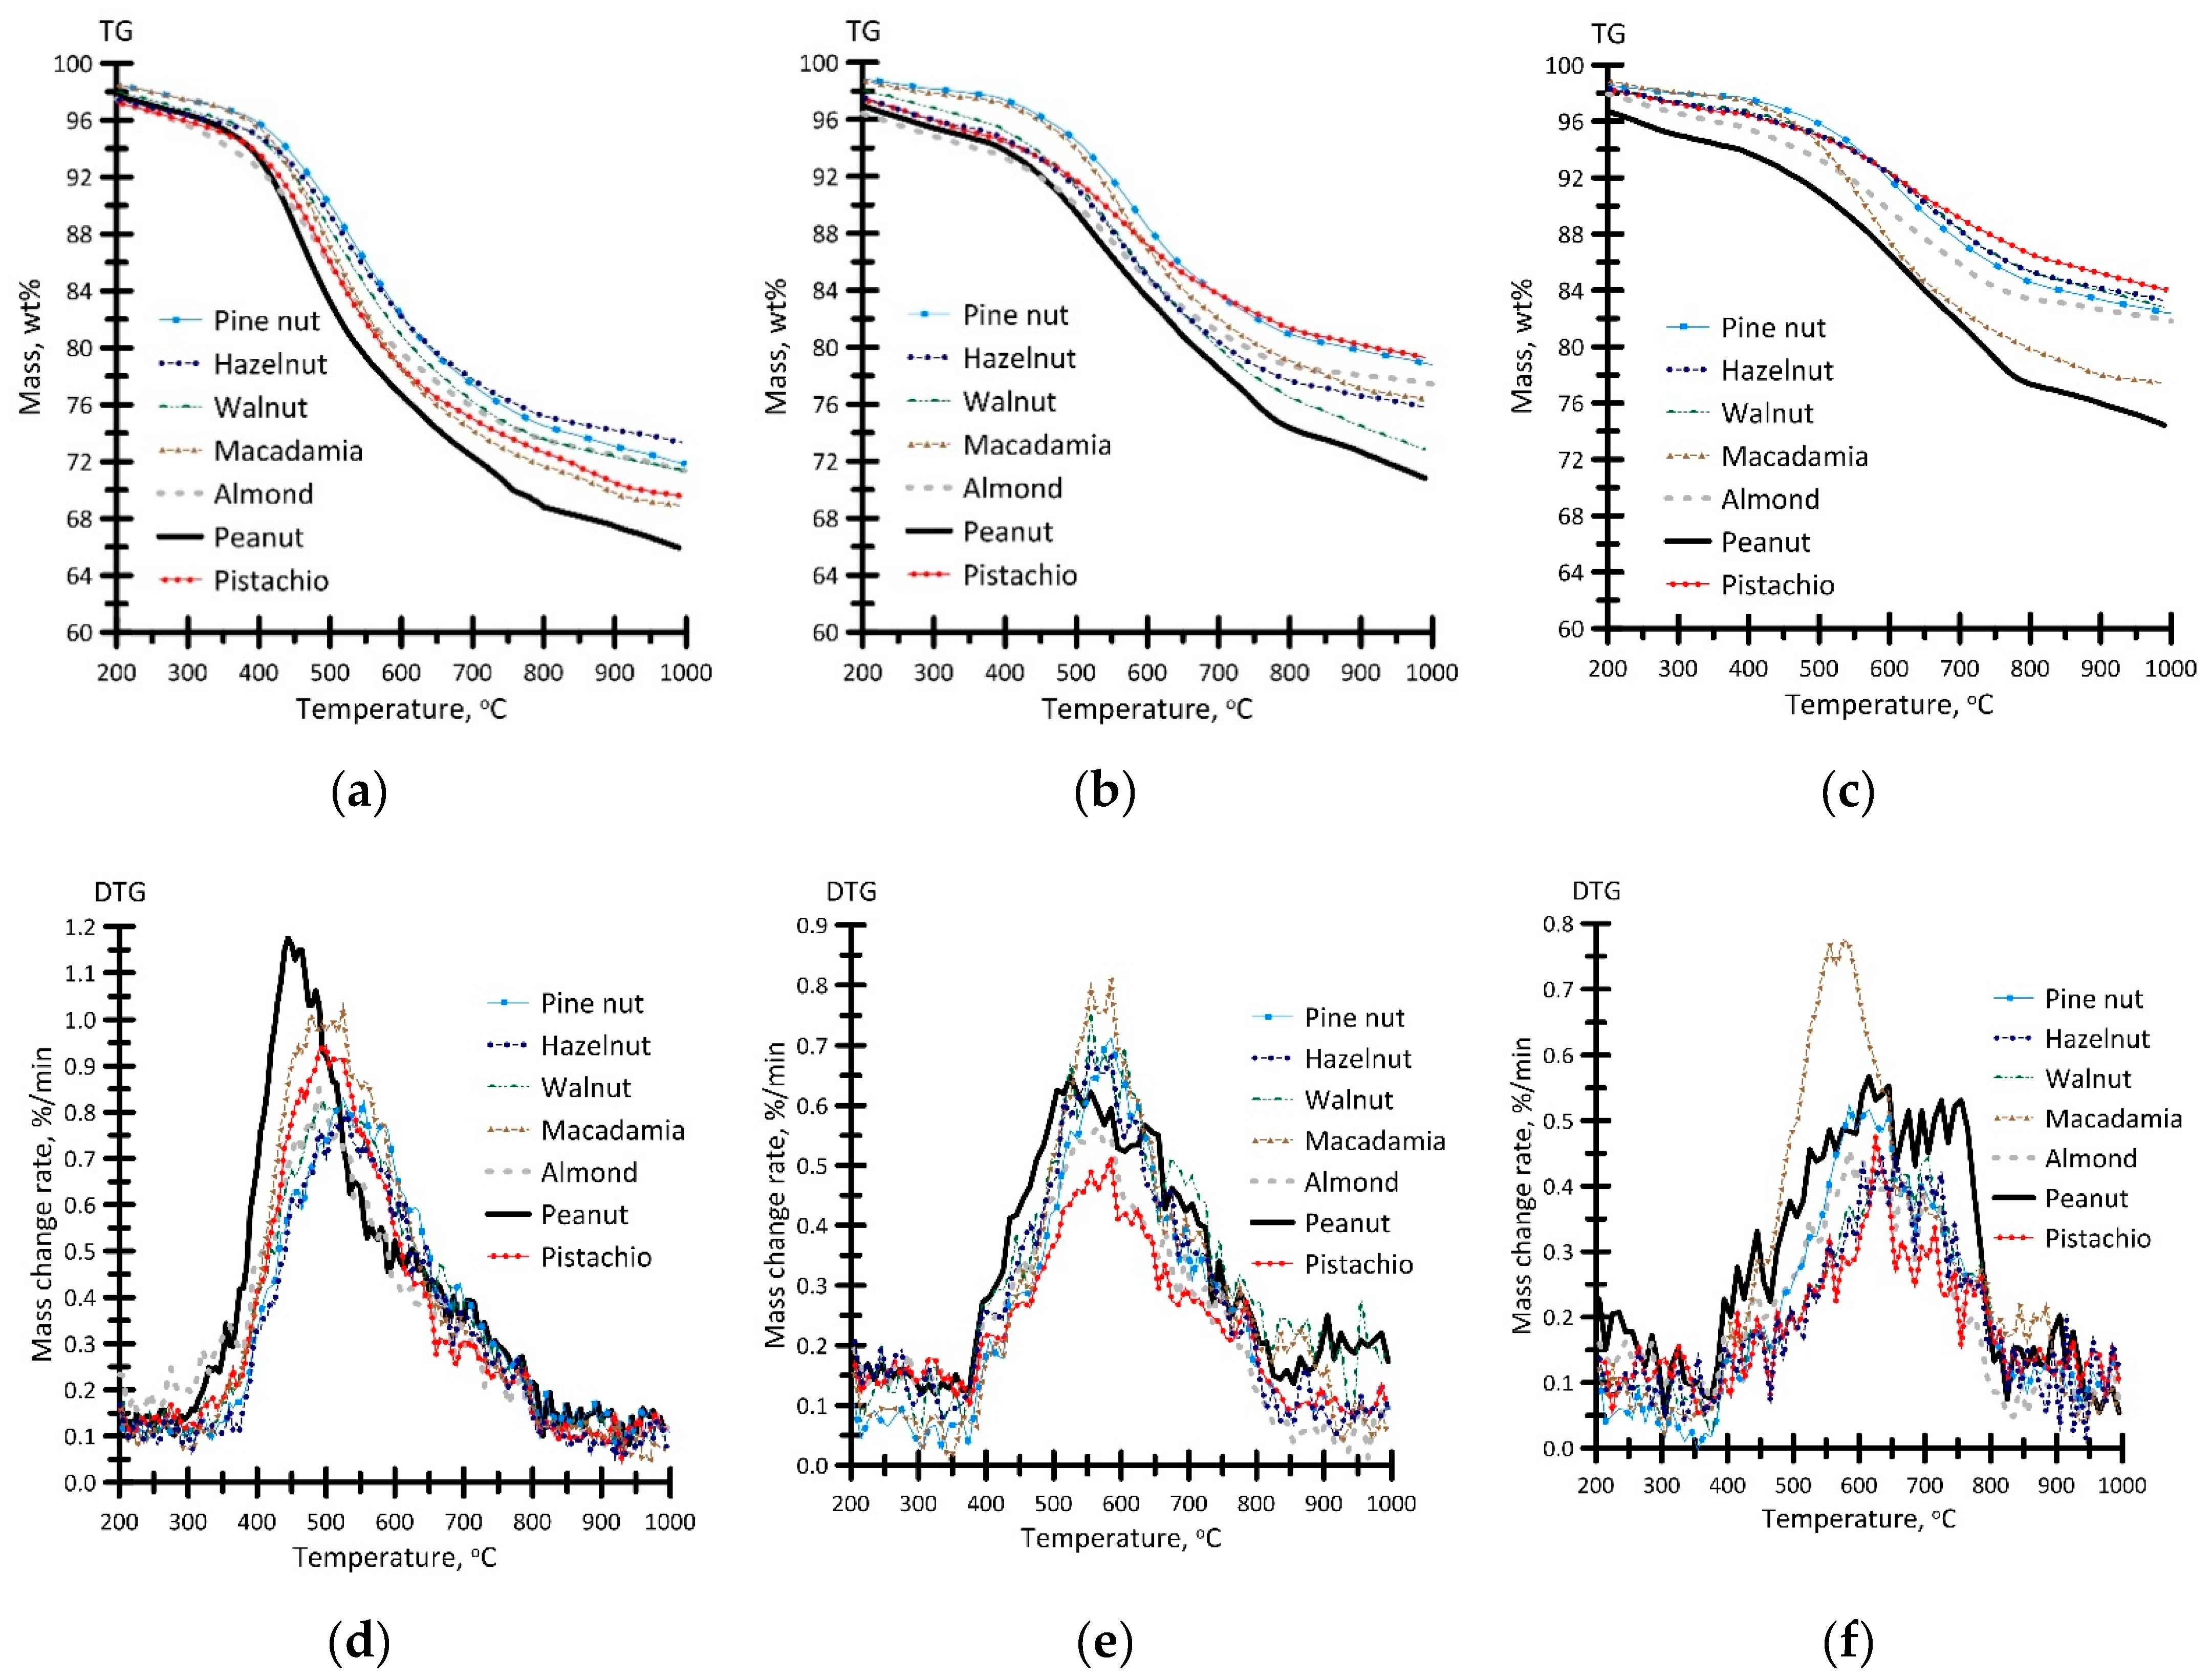
3.4. Biochar Characteristics
3.5. Kinetic Analysis of the Biochar Thermal Conversion
4. Conclusions
Author Contributions
Funding
Acknowledgments
Conflicts of Interest
References
- Zhou, X.-L.; Zhang, H.; Shao, L.-M.; Lü, F.; He, P.-J. Preparation and Application of Hierarchical Porous Carbon Materials from Waste and Biomass: A Review. Waste Biomass Valorization 2021, 12, 1699–1724. [Google Scholar] [CrossRef]
- Mohan, D.; Pittman, C.U.; Steele, P.H. Pyrolysis of Wood/Biomass for Bio-oil: A Critical Review. Energy Fuels 2006, 20, 848–889. [Google Scholar] [CrossRef]
- Vitoussia, T.; Brillard, A.; Kehrli, D.; Kemajou, A.; Njeugna, E.; Brilhac, J.-F. Thermogravimetric analyses and kinetic modeling of pellets built with three Cameroonian biomass. Biomass Convers. Biorefinery 2021, 11, 2107–2121. [Google Scholar] [CrossRef]
- Liu, L.; Dai, Y. Strong adsorption of metolachlor by biochar prepared from walnut shells in water. Environ. Sci. Pollut. Res. 2021, 28, 48379–48391. [Google Scholar] [CrossRef] [PubMed]
- Quesada, H.B.; de Araújo, T.P.; Cusioli, L.F.; de Barros, M.A.S.D.; Gomes, R.G.; Bergamasco, R. Evaluation of novel activated carbons from chichá-do-cerrado (Sterculia striata St. Hil. et Naud) fruit shells on metformin adsorption and treatment of a synthetic mixture. J. Environ. Chem. Eng. 2021, 9, 104914. [Google Scholar] [CrossRef]
- Wu, Y.; Sun, Y.; Liang, K.; Yang, Z.; Tu, R.; Fan, X.; Cheng, S.; Yu, H.; Jiang, E.; Xu, X. Enhancing Hydrodeoxygenation of Bio-oil via Bimetallic Ni-V Catalysts Modified by Cross-Surface Migrated-Carbon from Biochar. ACS Appl. Mater. Interfaces 2021, 13, 21482–21498. [Google Scholar] [CrossRef]
- Pepè Sciarria, T.; de Oliveira, M.A.C.; Mecheri, B.; D’Epifanio, A.; Goldfarb, J.L.; Adani, F. Metal-free activated biochar as an oxygen reduction reaction catalyst in single chamber microbial fuel cells. J. Power Sources 2020, 462, 228183. [Google Scholar] [CrossRef]
- Noszczyk, T.; Dyjakon, A.; Koziel, J.A. Kinetic Parameters of Nut Shells Pyrolysis. Energies 2021, 14, 682. [Google Scholar] [CrossRef]
- Kim, Y.-M.; Han, T.U.; Hwang, B.; Lee, B.; Lee, H.W.; Park, Y.-K.; Kim, S. Pyrolysis kinetics and product properties of softwoods, hardwoods, and the nut shell of softwood. Korean J. Chem. Eng. 2016, 33, 2350–2358. [Google Scholar] [CrossRef]
- Malika, A.; Jacques, N.; Jaafar, E.F.; Fatima, B.; Mohammed, A. Pyrolysis investigation of food wastes by TG-MS-DSC technique. Biomass Convers. Biorefinery 2016, 6, 161–172. [Google Scholar] [CrossRef]
- Xavier, T.P.; Lira, T.S.; Schettino, M.A., Jr.; Barrozo, M.A.S. A Study of pyrolysis of macadamia nut shell: Parametric sensitivity analysis of the ipr model. Braz. J. Chem. Eng. 2016, 33, 115–122. [Google Scholar] [CrossRef] [Green Version]
- Qin, L.; Shao, Y.; Hou, Z.; Jiang, E. Effect of temperature on the physicochemical characteristics of pine nut shell pyrolysis products in a screw reactor. Energy Sources Part A Recover. Util. Environ. Eff. 2020, 42, 2831–2843. [Google Scholar] [CrossRef]
- Qin, L.; Wu, Y.; Hou, Z.; Jiang, E. Influence of biomass components, temperature and pressure on the pyrolysis behavior and biochar properties of pine nut shells. Bioresour. Technol. 2020, 313, 123682. [Google Scholar] [CrossRef] [PubMed]
- Ortiz, L.R.; Torres, E.; Zalazar, D.; Zhang, H.; Rodriguez, R.; Mazza, G. Influence of pyrolysis temperature and bio-waste composition on biochar characteristics. Renew. Energy 2020, 155, 837–847. [Google Scholar] [CrossRef]
- Garg, D.; Kumar, S.; Sharma, K.; Majumder, C.B. Application of waste peanut shells to form activated carbon and its utilization for the removal of Acid Yellow 36 from wastewater. Groundw. Sustain. Dev. 2019, 8, 512–519. [Google Scholar] [CrossRef]
- Duwiejuah, A.B.; Cobbina, S.J.; Quainoo, A.K.; Abubakari, A.H.; Bakobie, N. Adsorption of Potentially Toxic Metals from Mono and Multi-Metal Systems Using Groundnut and Shea Nut Shell Biochars. J. Health Pollut. 2018, 8, 180607. [Google Scholar] [CrossRef] [Green Version]
- Williams, P.T.; Besler, S. The influence of temperature and heating rate on the slow pyrolysis of biomass. Renew. Energy 1996, 7, 233–250. [Google Scholar] [CrossRef]
- Jahirul, M.; Rasul, M.; Chowdhury, A.; Ashwath, N. Biofuels Production through Biomass Pyrolysis—A Technological Review. Energies 2012, 5, 4952–5001. [Google Scholar] [CrossRef]
- Vamvuka, D.; Kakaras, E.; Kastanaki, E.; Grammelis, P. Pyrolysis characteristics and kinetics of biomass residuals mixtures with lignite. Fuel 2003, 82, 1949–1960. [Google Scholar] [CrossRef]
- Sathe, P.S.; Adivarekar, R.V.; Pandit, A.B. Valorization of peanut shell biochar for soil amendment. J. Plant Nutr. 2021, 1–19. [Google Scholar] [CrossRef]
- Ahlström, J.M.; Alamia, A.; Larsson, A.; Breitholtz, C.; Harvey, S.; Thunman, H. Bark as feedstock for dual fluidized bed gasifiers-Operability, efficiency, and economics. Int. J. Energy Res. 2019, 43, 1171–1190. [Google Scholar] [CrossRef]
- Association, W.N. Heating Value of Various Fuels. Available online: https://world-nuclear.org/information-library/facts-and-figures/heat-values-of-various-fuels.aspx (accessed on 13 November 2021).
- Sarkar, J.K.; Wang, Q. Different Pyrolysis Process Conditions of South Asian Waste Coconut Shell and Characterization of Gas, Bio-Char, and Bio-Oil. Energies 2020, 13, 1970. [Google Scholar] [CrossRef]
- Kan, T.; Strezov, V.; Evans, T.J. Lignocellulosic biomass pyrolysis: A review of product properties and effects of pyrolysis parameters. Renew. Sustain. Energy Rev. 2016, 57, 1126–1140. [Google Scholar] [CrossRef]
- Moreira, K.C.C.S.R.; Xavier, T.P.; Araújo, J.C.S.; Santos, K.G.; Lira, T.S. Thermokinetic study of macadamia carpel pyrolysis using thermogravimetric analysis. Can. J. Chem. Eng. 2021, 24188. [Google Scholar] [CrossRef]
- Vicente, E.D.; Vicente, A.; Evtyugina, M.; Carvalho, R.; Tarelho, L.A.C.; Oduber, F.I.; Alves, C. Particulate and gaseous emissions from charcoal combustion in barbecue grills. Fuel Process. Technol. 2018, 176, 296–306. [Google Scholar] [CrossRef]
- Singh, B.; Singh, B.P.; Cowie, A.L. Characterisation and evaluation of biochars for their application as a soil amendment. Soil Res. 2010, 48, 516. [Google Scholar] [CrossRef]
- Crombie, K.; Mašek, O.; Sohi, S.P.; Brownsort, P.; Cross, A. The effect of pyrolysis conditions on biochar stability as determined by three methods. GCB Bioenergy 2013, 5, 122–131. [Google Scholar] [CrossRef] [Green Version]
- He, C.; Giannis, A.; Wang, J.-Y. Conversion of sewage sludge to clean solid fuel using hydrothermal carbonization: Hydrochar fuel characteristics and combustion behavior. Appl. Energy 2013, 111, 257–266. [Google Scholar] [CrossRef]
- Suman, S.; Panwar, D.S.; Gautam, S. Surface morphology properties of biochars obtained from different biomass waste. Energy Sources Part A Recover. Util. Environ. Eff. 2017, 39, 1007–1012. [Google Scholar] [CrossRef]
- Fu, P.; Hu, S.; Xinag, J.; Sun, L.; Yang, T.; Zhang, A.; Wang, Y.; Chen, G. Effects of Pyrolysis Temperature on Characteristics of Porosity in Biomass Chars. In Proceedings of the 2009 International Conference on Energy and Environment Technology, Guilin, China, 16–18 October 2009; pp. 109–112. [Google Scholar]
- Yuan, H.; Lu, T.; Wang, Y.; Huang, H.; Chen, Y. Influence of pyrolysis temperature and holding time on properties of biochar derived from medicinal herb (radix isatidis) residue and its effect on soil CO2 emission. J. Anal. Appl. Pyrolysis 2014, 110, 277–284. [Google Scholar] [CrossRef]
- Leng, L.; Xiong, Q.; Yang, L.; Li, H.; Zhou, Y.; Zhang, W.; Jiang, S.; Li, H.; Huang, H. An overview on engineering the surface area and porosity of biochar. Sci. Total Environ. 2021, 763, 144204. [Google Scholar] [CrossRef] [PubMed]
- Sun, K.; Kang, M.; Zhang, Z.; Jin, J.; Wang, Z.; Pan, Z.; Xu, D.; Wu, F.; Xing, B. Impact of Deashing Treatment on Biochar Structural Properties and Potential Sorption Mechanisms of Phenanthrene. Environ. Sci. Technol. 2013, 47, 11473–11481. [Google Scholar] [CrossRef]
- Sun, Y.; Yu, I.K.M.; Tsang, D.C.W.; Fan, J.; Clark, J.H.; Luo, G.; Zhang, S.; Khan, E.; Graham, N.J.D. Tailored design of graphitic biochar for high-efficiency and chemical-free microwave-assisted removal of refractory organic contaminants. Chem. Eng. J. 2020, 398, 125505. [Google Scholar] [CrossRef]
- Wang, S.; Jiang, D.; Cao, B.; Qian, L.; Hu, Y.; Liu, L.; Yuan, C.; Abomohra, A.E.-F.; He, Z.; Wang, Q.; et al. Bio-char and bio-oil characteristics produced from the interaction of Enteromorpha clathrate volatiles and rice husk bio-char during co-pyrolysis in a sectional pyrolysis furnace: A complementary study. J. Anal. Appl. Pyrolysis 2018, 135, 219–230. [Google Scholar] [CrossRef]
- Da Silva, J.C.G.; de Albuquerque, J.G.; Galdino, W.; de Sena, R.F.; Andersen, S.L.F. Single-step and multi-step thermokinetic study—Deconvolution method as a simple pathway for describe properly the biomass pyrolysis for energy conversion. Energy Convers. Manag. 2020, 209, 112653. [Google Scholar] [CrossRef]
- Bhavanam, A.; Sastry, R.C. Kinetic study of solid waste pyrolysis using distributed activation energy model. Bioresour. Technol. 2015, 178, 126–131. [Google Scholar] [CrossRef]
- Ko, K.-H.; Rawal, A.; Sahajwalla, V. Analysis of thermal degradation kinetics and carbon structure changes of co-pyrolysis between macadamia nut shell and PET using thermogravimetric analysis and 13C solid state nuclear magnetic resonance. Energy Convers. Manag. 2014, 86, 154–164. [Google Scholar] [CrossRef]
- Kim, Y.-M.; Kim, S.; Han, T.U.; Park, Y.-K.; Watanabe, C. Pyrolysis reaction characteristics of Korean pine (Pinus Koraiensis) nut shell. J. Anal. Appl. Pyrolysis 2014, 110, 435–441. [Google Scholar] [CrossRef]


| Sample | Symbol | Characteristics | Elemental Composition * | |||||||
|---|---|---|---|---|---|---|---|---|---|---|
| W r | A d | V r | LHV | C d | H d | N d | S d | O d | ||
| wt% | MJ/kg | wt% | ||||||||
| Pine nut | Pine | 5.2 | 0.4 | 67.9 | 20.3 | 51.4 | 6.7 | 1.2 | - | 40.3 |
| Hazelnut | H | 8.8 | 0.9 | 66.4 | 18.9 | 50.8 | 6.2 | 0.2 | - | 41.9 |
| Walnut | W | 3.7 | 1.1 | 69.3 | 17.8 | 48.4 | 5.9 | 0.5 | - | 44.1 |
| Macadamia | M | 3.1 | 0.3 | 66.9 | 19.5 | 51.9 | 5,4 | 0.2 | - | 42.0 |
| Almond | A | 3.9 | 0.7 | 72.7 | 18.5 | 50.3 | 5.7 | 0.2 | - | 43.1 |
| Peanut | Pean | 4.5 | 3.4 | 67.4 | 18.3 | 47.6 | 6.1 | 1.4 | - | 41.5 |
| Pistachio | Pist | 3.7 | 0.5 | 70.3 | 17.5 | 46.9 | 5.8 | 0.1 | - | 46.7 |
| Td, °C | Tf, °C | Tmax | wmax | Ea | |
|---|---|---|---|---|---|
| °C | wt%/min | kJ/mol | |||
| Pine nut | 250 | 420 | 340 | 5.9 | 20.1 |
| Hazelnut | 275 | 440 | 340 | 5.7 | 23.1 |
| Walnut | 250 | 400 | 345 | 5.8 | 18.4 |
| Macadamia | 275 | 430 | 340 | 6.0 | 19.2 |
| Almond | 250 | 400 | 330 | 6.4 | 12.4 |
| Peanut | 250 | 415 | 330 | 5.1 | 17.6 |
| Pistachio | 250 | 390 | 335 | 7.9 | 12.4 |
| Sample | Characteristics | Elemental Composition * | ||||||||
|---|---|---|---|---|---|---|---|---|---|---|
| W r | A d | V r | LHV | Iodine Number | C d | H d | N d | S d | O d | |
| wt% | MJ/kg | mg/g | wt% | |||||||
| Pine400 | 1.3 | 1.5 | 24.6 | 28.8 | 134.9 | 77.2 | 4.0 | 0.4 | - | 16.9 |
| Pine500 | 1.7 | 1.8 | 18.4 | 31.1 | 181.7 | 82.9 | 3.2 | 0.4 | - | 11.7 |
| Pine600 | 2.0 | 2.1 | 14.3 | 31.6 | 202.1 | 86.0 | 2.8 | 0.4 | - | 8.7 |
| H400 | 1.8 | 2.5 | 22.8 | 29.6 | 96.3 | 75.1 | 3.9 | 0.3 | - | 18.2 |
| H500 | 2.2 | 2.9 | 20.6 | 30.6 | 123.2 | 78.1 | 3.4 | 0.4 | - | 15.2 |
| H600 | 1.8 | 3.5 | 13.6 | 32.7 | 150.6 | 84.3 | 2.9 | 0.3 | - | 9.0 |
| W400 | 1.7 | 2.6 | 25.1 | 29.6 | 146.6 | 75.7 | 3.9 | 0.2 | - | 17.6 |
| W500 | 1.6 | 3.3 | 22.2 | 31.7 | 163.3 | 80.9 | 3.4 | 0.2 | - | 12.2 |
| W600 | 1.7 | 3.9 | 13.6 | 32.7 | 241.9 | 84.6 | 2.8 | 0.3 | - | 8.5 |
| M400 | 1.3 | 1.5 | 27.4 | 28.7 | 85.8 | 76.8 | 3.8 | 0.4 | - | 17.5 |
| M500 | 2.0 | 2.5 | 20.3 | 30.0 | 105.1 | 81.4 | 3.3 | 0.4 | - | 12.4 |
| M600 | 1.6 | 2.8 | 19.5 | 32.8 | 185.4 | 89.8 | 2.4 | 0.5 | - | 4.5 |
| A400 | 1.0 | 2.5 | 24.8 | 29.9 | 147.2 | 77.3 | 3.6 | 0.4 | - | 16.2 |
| A500 | 1.4 | 2.7 | 18.5 | 31.2 | 179.3 | 82.2 | 2.9 | 0.3 | - | 11.9 |
| A600 | 1.8 | 3.3 | 15.2 | 32.0 | 181.7 | 84.5 | 2.7 | 0.3 | - | 9.2 |
| Pean400 | 2.6 | 6.8 | 29.7 | 27.2 | 109.4 | 66.8 | 4.2 | 1.5 | - | 20.7 |
| Pean500 | 2.8 | 7.2 | 23.5 | 28.3 | 164.3 | 69.0 | 3.5 | 1.5 | - | 18.8 |
| Pean600 | 1.8 | 7.7 | 20.3 | 29.7 | 217.2 | 73.1 | 3.0 | 1.5 | - | 14.7 |
| Pist400 | 1.1 | 3.2 | 25.1 | 29.3 | 149.3 | 76.8 | 3.5 | 0.2 | - | 16.3 |
| Pist500 | 1.6 | 3.8 | 16.7 | 31.1 | 158.1 | 81.2 | 2.8 | 0.2 | - | 12.0 |
| Pist600 | 1.7 | 4.6 | 12.3 | 32.1 | 192.8 | 84.9 | 2.6 | 0.2 | - | 7.7 |
| Sample | Inert Medium | Oxidative Medium | ||||
|---|---|---|---|---|---|---|
| Pyrolysis Temperature, °C | ||||||
| 400 | 500 | 600 | 400 | 500 | 600 | |
| Pine nut | 29.0 | 34.1 | 35.0 | 67.6 | 74.2 | 78.8 |
| Hazelnut | 28.6 | 27.5 | 34.8 | 67.5 | 78.8 | 70.3 |
| Walnut | 23.6 | 25.4 | 26.2 | 49.0 | 72.3 | 75.6 |
| Macadamia | 29.9 | 32.8 | 34.8 | 70.9 | 73.4 | 91.0 |
| Almond | 19.4 | 22.0 | 25.1 | 60.6 | 74.1 | 70.2 |
| Peanut | 21.1 | 22.1 | 23.3 | 49.1 | 54.1 | 69.7 |
| Pistachio | 13.5 | 14.7 | 17.6 | 66.9 | 72.7 | 80.8 |
Publisher’s Note: MDPI stays neutral with regard to jurisdictional claims in published maps and institutional affiliations. |
© 2021 by the authors. Licensee MDPI, Basel, Switzerland. This article is an open access article distributed under the terms and conditions of the Creative Commons Attribution (CC BY) license (https://creativecommons.org/licenses/by/4.0/).
Share and Cite
Gorshkov, A.; Berezikov, N.; Kaltaev, A.; Yankovsky, S.; Slyusarsky, K.; Tabakaev, R.; Larionov, K. Analysis of the Physicochemical Characteristics of Biochar Obtained by Slow Pyrolysis of Nut Shells in a Nitrogen Atmosphere. Energies 2021, 14, 8075. https://doi.org/10.3390/en14238075
Gorshkov A, Berezikov N, Kaltaev A, Yankovsky S, Slyusarsky K, Tabakaev R, Larionov K. Analysis of the Physicochemical Characteristics of Biochar Obtained by Slow Pyrolysis of Nut Shells in a Nitrogen Atmosphere. Energies. 2021; 14(23):8075. https://doi.org/10.3390/en14238075
Chicago/Turabian StyleGorshkov, Alexander, Nikolay Berezikov, Albert Kaltaev, Stanislav Yankovsky, Konstantin Slyusarsky, Roman Tabakaev, and Kirill Larionov. 2021. "Analysis of the Physicochemical Characteristics of Biochar Obtained by Slow Pyrolysis of Nut Shells in a Nitrogen Atmosphere" Energies 14, no. 23: 8075. https://doi.org/10.3390/en14238075
APA StyleGorshkov, A., Berezikov, N., Kaltaev, A., Yankovsky, S., Slyusarsky, K., Tabakaev, R., & Larionov, K. (2021). Analysis of the Physicochemical Characteristics of Biochar Obtained by Slow Pyrolysis of Nut Shells in a Nitrogen Atmosphere. Energies, 14(23), 8075. https://doi.org/10.3390/en14238075