Article

Mineral Contents in Aboveground Biomass of Sedges (Carex L., Cyperaceae)

by
Magdalena Janyszek-Sołtysiak
1,
Mieczysław Grzelak
2,
Piotr Gajewski
3,
Andrzej M. Jagodziński
4,
Eliza Gaweł
5 and
Dorota Wrońska-Pilarek
6,*
1
Department of Botany, Poznań University of Life Sciences, Wojska Polskiego 71C, 60-625 Poznań, Poland
2
Department of Grassland and Natural Landscape, Poznań University of Life Sciences, Dojazd 11, 60-632 Poznań, Poland
3
Department of Soil Science and Microbiology, Poznań University of Life Sciences, Szydłowska 50, 60-656 Poznań, Poland
4
Department of Ecology, Institute of Dendrology, Polish Academy of Sciences, Parkowa 5, 62-035 Kórnik, Poland
5
Department of Forage Crop Production, Institute of Soil Science and Plant Cultivation—State Research Institute, Czartoryskich 8, 24-100 Puławy, Poland
6
Department of Botany and Forest Habitats, Poznań University of Life Sciences, Wojska Polskiego 71D, 60-625 Poznań, Poland
*
Author to whom correspondence should be addressed.
Energies 2021, 14(23), 8007; https://doi.org/10.3390/en14238007
Submission received: 9 October 2021 / Revised: 17 November 2021 / Accepted: 24 November 2021 / Published: 30 November 2021
(This article belongs to the Special Issue Research of Biomass Feedstock and Biomass Energy Conversion)

Abstract

:
The importance of mineral elements, both in animal and plant nutrition, has been well recognized, but, in the case of sedges, the mineral composition is relatively poorly known. Studies usually relate to the content of the elements in sedge communities, or sward or hay communities with sedge participation, and rarely of Carex representatives. The objective of our study was to determine the concentrations of C, N, Ca, P, Mg, Na, K, Si, Cu, Zn, Mn, Fe, Cr and Ni in the biomass of 11 Carex species commonly occurring on natural sites of Central European lowland. Interspecific differentiations have been observed in concentrations of the major and trace elements among studied sedge species. The elemental composition of examined Carex species is diversified but generally similar to the composition of grasses. The study shows that sedges can increase fodder value and, therefore, they should be considered in meadow management as a valuable component of economically important meadow communities. Moreover, the data reported herein can be used for modelling the phytoaccumulation of various elements in the biomass of sedges. This will help in creating different patches suitable for obtaining adequate fodder. Our results can supplement current knowledge concerning the fodder value of meadows with sedge participation.

1. Introduction

Sedges (Carex L., Cyperaceae), with about 2000 species, grow in very diversified habitats from extremely dry areas, such as xerothermic grasslands, to permanently moist and even flooded areas such as raised peats or salt marshes. The ability to colonize wide arrays of habitats and the resulting wide geographical distribution is the effect of many diversified species as well as a high ecological amplitude of some species [1,2,3,4,5]. Sedges, along with grasses, are common components of meadows or pastures and are an important element of vegetation. In many countries, sedges and communities with sedge participation are utilised as pastures for domestic animals, which constitute the components of fodder for animals, especially C. atherodes, C. rostrata, C. geyeri, C. eleocharis, C. macroechaeta, C. aquatilis and C. sprengelii. From the point of view of plant production for fodder, sedges play a significant role as forage, which is associated, among other factors, with the content of organic matter, digestibility and plant mineral composition, e.g., [6,7,8,9].
Some data have been reported about the forage value of sedge communities but rarely of Carex species representatives. The data usually relate to the contents of the elements in sward or hay from communities with sedge participation. However, only a few papers have presented the content of selected macro and microelements in selected sedge species [6,9,10,11,12,13,14,15,16,17,18,19,20,21,22]. Most of the works on the elemental composition of sedges are related to other issues (e.g., soil or water contamination and the ability of sedges to uptake particular elements).
The importance of mineral elements, both in animal and plant nutrition, has been well recognized. Macro and microelements are necessary for the normal growth of plants and animals and completion of their life cycles. Deficiencies in the nutrition of an animal can cause a variety of diseases. The presence of mineral elements in animal feed is vital for the animal’s metabolic processes. Adequate concentrations of the particular chemical components, especially the major and trace elements, are important for the classification of plant biomass as fodder [23,24,25,26,27,28,29].
Accumulation of the particular mineral elements in plant tissues depends on many factors such as the total and plant-available amounts of elements, method of cultivation and fertilization, plant and soil properties and species growth rate [28,30,31,32]. However, Hinzke et al. [20] mention also species-specific differences in biomass production (e.g., in C. acutiformis and C. rostrata).
Plants reveal various tendencies in the uptake of trace elements. The uptake of the majority of elements by plants is a metabolically regulated process, and the accumulation of chemical elements is also associated with processes of development and ageing taking place in them, which is connected with the growth stage of plants.
Meadow communities, including those with sedge participation, sometimes show a deficiency of Ca, P, Mg, Cu and Zn, as well as an excess of Fe and Mn [25,33,34,35,36,37]. The mineral content of plants’ tissues is also important for soil properties. This is related to the decomposition of plants as well as the ash content of the plants, e.g., in the ability of the ash to reduce soil fertility depletion, e.g., [38,39,40,41,42,43]. From the point of view of farming utilisation, investigations on the recognition of the mineral composition in the aboveground organs of sedges appears important, appropriate and useful. The results of the research on the elemental composition of commonly occurring sedges will make it possible to evaluate their importance in meadow management.
The basic objective of this study was to determine the concentration of selected macro and microelements in the biomass of selected sedge species, potentially used as fodder, commonly occurring in natural sites in Central Europe. This study is universal in character and may be used as comparative material in relation to other areas of sedge distribution.

2. Data Sources and Methodology

The study was carried out in the vegetation season of 2014 on plants from 11 sedges species commonly occurring in Central European lowlands: Carex acutiformis Ehrh., C. appropinquata Schum., C. diandra Schrank., C. disticha Huds., C. flava L., C. lepidocarpa Tausch., C. nigra (L.) Reich, C. paniculata L., C. pseudocyperus L., C. riparia Curt., C. vulpina L. Plant material was collected from natural sites. The nomenclature of the plants species follows [2].

2.1. The Soil Properties Analysis Method

Two open-cast pits were made in mineral soils (profiles 2, 6), and six in organic soils (profiles 1, 3, 4, 5, 7, 8) at representative points of large soil separated areas. They were Sapric Histosols (profiles 1, 5), Hemic Histosols (profile 4) and Murshic Sapric Histosols (profiles 3, 7, 8), Fluvic Cambisols (profile 2), Eutric Fluvisols (profile 6) [44].
After describing the morphological structure of each genetic horizon, samples with a disturbed structure were collected, in which the following parameters were marked: texture of the mineral horizons, using Casagrande method in the modification by Prószyński [45]; organic matter content (OMC), by placing samples in a muffle furnace at 550 °C [46]; total carbon (Ctot.) and total nitrogen (Ntot.) were determined using a Vario MAX CNS analyzer; the content of total macro and microelements by flame photometry method (K, Ca, Na), by absorption spectrophotometry method (Mg, Cu, Zn, Ni, Cr) and by colorimetric method (P) after their mineralization in temp. 550 °C and dissolved in 6 mol dm3 HCl, pH in 1 M KCl potentiometrically.

2.2. Elemental Analysis Method

For each species three samples were collected from three different patches located in different places. Therefore, for each species, the collected samples differed with respect to sites but their plant species composition was the same or was very similar. Plant materials for the study were collected from lowland meadow communities in Poland in late May and early June, the usual dates of the first hay harvest of the season. According to some authors the nutritional value of many plant species, including sedges, is higher at the beginning of the growth season as compared to its end, e.g., [6,8,47]. The plant material collected included complete aboveground parts of plants—stems, leaves and inflorescences. Because of specific growth forms of sedges (tufts and stolons), material represented two phases at the same time: flowering and early stages of seed formation. Thanks to sample collection from natural sites, not used by grazing, attempts were made to limit the impact of management on research results. This made it possible to avoid, to a certain extent, the influence of chemical substances on soil.
Collected material was dried at a temperature of 65 °C, ground and analysed using methods of [36]. The concentrations of K and Mg were determined by the method of atomic absorption spectrometry (ASA). In the cases of P, Ca, Na, Si and the trace elements: Cu, Zn, Mn, Fe, Cr, Ni, samples were first mineralized in a microwave-assisted acid digestion system (EPA method 3052, Ethos D microwave station, Milestone, Monroe, CT) and then elements were determined using an Inductively Coupled Plasma Optical Emission Spectrometer (ICP-OES). Additionally, the concentrations of total carbon and nitrogen were measured by elementary analysis on the Vario Max. As a reference scale for the evaluation of elemental concentrations, the optimal and extreme values of elements for animal fodder were obtained from several sources [14,48,49,50,51].

2.3. Statistical Analysis

One-factor analysis of variance (ANOVA) was used to examine differences in the mean content of each macro and microelement in aboveground biomass of the sedge species studied. When critical differences were noted, multiple comparisons were carried out based on Tukey’s test. To show similarities and differences among Carex species studied, Ward’s hierarchical clustering method was used to compute cluster groups based on mineral composition. Statistical analyses were performed using JMP Pro 12.1.0 (SAS Institute Inc., Cary, NC, USA; http:/www.sas.com/ (accessed on 10 September 2021). The statistical analysis of the results of soil properties was performed using the Statistica 9.0 program, and the significance of differences between the mean values was determined using the Tukey’s test at the significance level of α = 0.05.

3. Results and Discussion

3.1. Results

3.1.1. Physicochemical Properties of the Soil

The investigated genetic soil horizons varied in their reaction, dependent on their texture (in the case of the mineral soils), and differed in their genesis, degree of mineralisation and the rate of organic horizon decomposition. Their reaction expressed in terms of pH ranged from 5.41 (profile 3, depth 0–20 cm) to 7.63 (profile 8, depth 0–13 cm) (Table 1). They were values characteristic for soils with a similar texture, organic matter content and genesis [52]. Lower, strongly acidic pH values of organic soils were indicated by [53]. It was also observed that in the case of organic soils (profiles 1–7), the pH of the top horizons was typically lower compared to the endopedons of these soils. In most cases these differences were statistically significant.
The content of total carbon (Ctot.) oscillated within wide ranges (Table 1). In the epipedons, the smallest amounts of 11.1 g kg−1 (profile 4, depth 0–32 cm) and 97.7 g kg−1 and (profile 8, depth 13–32 cm) were found in mineral soils. The top horizons of organic soils had a much higher and statistically significantly different content ranging from 127.3 g kg−1 (profile 6, depth 0–31 cm) to 372.8 g kg−1 (profile 5, depth 0–15 cm). The top horizons of these soils were, in most cases, characterized by a lower and statistically significantly different Ctot content than endopedons, where the Ctot content was in the range of 150.2 g kg−1 (profile 6, depth 31–36 cm) to 446.6 g kg−1 (profile 3, depth: 20–160 cm). A similar content of Ctot was found by [54]. The content of total nitrogen (Ntot.) in epipedons of mineral soils ranged from 0.90 g kg−1 to 9.50 g kg−1 (profiles: 4, depth 0–32 cm; 8, depth 13–32 cm, respectively). A much higher content and statistically significantly different content of Ntot was found in epipedons of organic soils, i.e., from 11.70 g kg−1 to 32.10 g kg−1 (profiles: 6, depth 0–31; 5, depth 0–15 cm, respectively). Similar levels of this property were found, among others, by [52,54]. As in the case of total carbon, usually higher amounts of this element were found in the endopedons of these soils. However, most of these differences were not statistically significant. These differences were probably caused mainly by the diversity of the botanical composition and the different degree of decomposition of organic matter.
The C–N ratio was narrow in the studied soils (Table 1). In the top horizons of mineral soils, it ranged from 9.1 to 12.3 (profiles 4, 8, respectively). Its wider levels were found in organic soils: from 10.7 to 16.3. Most of these differences were statistically significant. Similar observations were made by [52,54,55].
Organic matter in hydrogenic soils plays a key role in shaping their physical, water and chemical properties. At the same time, its quality and balance in the soil are dictated by environmental conditions and anthropogenic activity, e.g., agriculture [56,57].
The content of organic matter in epipedons ranged from 27.40 g kg−1 (profile 4, depth 0–32 cm) to 712.4 g kg−1 (profile 5, depth 0–15 cm; Table 1.). In organic soils it was statistically significantly higher than in mineral soils. A similar content of organic matter and its similar differentiation between epi and endopedons were found in soils of similar origin by [58].
The quantitative proportions of macronutrients depend on numerous factors, including organic matter content [59]. In the soils developed from low peat, calcium was the dominant element in most cases, and its amount usually significantly decreased with depth (Table 2.). Similar conclusions were made by [52,54]. In the top horizons of all soils, a clear accumulation of phosphorus and potassium was found (Table 2). Their phosphorus content was highly diversified. Usually, it decreased with depth and ranged from 0.05 g kg−1 (profile 4) to 0.51 (profile 5) g kg−1 (in epipedons) and from 0.06 g kg−1 (profile 4) to 0.56 g kg−1 (profile 5) (in endopedons). Most of these differences were not statistically significant. The potassium content, just like the phosphorus content, oscillated within wide limits. In the epipedons of mineral soils, it ranged from 0.22 g kg−1 (profile 4) to 0.76 g kg−1 (profile 8), and 0.24 g kg−1 (profile 4) and 0.29 g kg−1 (profile 8) in the endopedons. In the top horizons of organic soils, it ranged from 0.08 g kg−1 to 0.32 g kg−1 (profiles 2, 3, respectively). In endopedons of these soils, it was usually lower and ranged from 0.09 g kg−1 (profile 7, depth 26–55 cm) to 0.38 g kg−1 (profile 6, depth 31–36 cm). Similar contents of both elements in soils of similar origin were noted by [52,54].
The content of trace elements in the studied soils was relatively low, and, in most cases, their significantly higher amounts were accumulated in the top horizons. Similar contents of the determined micronutrients and their similar diversity were noticed in organic soils by [53] and in Fluvisols by [60]. Detailed data on the values of individual trace elements are presented in Table 3.

3.1.2. Mineral Composition of the Studied Plants

Mineral composition was comparable in all studied species but differences in the concentrations of all elements studied were detected (Table 4, Table 5 and Table 6).
Mean carbon (C) concentrations ranged from 430.9 g kg−1 DM in C. appropinquata to 465.7 g kg−1 DM in C. disticha. The widest range of carbon was found in C. flava and the lowest in C. appropinquata. The highest concentration of nitrogen was found in C. diandra (20.66 g kg−1 DM) and the lowest in C. pseudocyperus (10.13 g kg−1 DM) (Table 4).

3.1.3. Macromineral Concentration in Studied Sedges

The concentrations of the studied macroelements are presented in Table 5. The highest concentration of phosphorus was observed in C. lepidocarpa (3.82 g kg−1 DM), C. riparia (3.63g kg−1 DM) and C. disticha (3.21 g kg−1 DM), where recorded P levels were in the optimal range (3.0–4.0 g kg−1 DM) for fodder purposes. The mean levels of P in the biomass of the remaining taxa showed visibly lower values around 2.0 g kg−1 DM. The concentration of potassium (K) was close to the optimal value (16.0–20.0 g kg−1 DM, but maximally 25.0 g kg−1 DM) in six species: C. diandra (20.1 g kg−1 DM), C. acutiformis (18.04 g kg−1 DM), C. riparia (17.75 g kg−1 DM), C. pseudocyperus (17.39 g kg−1 DM), C. lepidocarpa (17.11 g kg−1 DM) and C. appropinquata (15.75 g kg−1 DM). In four species, the amount of K exceeded the optimum level at different rates (two did not exceed the maximal level of 25 g kg−1 DM). The highest potassium contents were observed in C. nigra (35.95 g kg−1 DM) and were significantly the lowest in C. disticha (10.68 g kg−1 DM). Most of the investigated sedge species (9) were characterized by calcium concentrations ca. 6–7 g kg 1 DM, within the optimal range of 6.0–9.0 g kg−1 DM. The visibly lowest values were observed in C. disticha (4.58 g kg−1 DM) and C. lepidocarpa (3.27 g kg−1 DM). The optimal level of magnesium (about 2.0–3.0 g kg−1 DM) occurred in seven investigated species: C. disticha (3.17 g kg−1 DM), C. nigra (2.58 g kg−1 DM), C. appropinquata (2.56 g kg 1 DM), C. diandra (2.49 g kg−1 DM), C. pseudocyperus (2.26 g kg−1 DM), C. flava (2.22 g kg−1 DM) and C. lepidocarpa (2.15 g kg−1 DM). The lowest magnesium levels were detected in C. acutiformis (1.09 g kg−1 DM). The highest content of sodium was determined in C. disticha (4.42 g kg−1 DM), in this case, the optimal value (1.2–2.5 g kg−1 DM) was exceeded. Sodium concentrations within the optimal levels were measured for nine of the sedge species. The amount of silicon in the biomass of the studied species was relatively similar. The limit value estimated at 9 g kg−1 DM was not exceeded in any of the species examined.
The average content of studied major elements: C. acutiformis K > Si > Ca > P > Na > Mg; C. appropinquata K > Ca > Si > Mg > Na > P; C. diandra K > Si > Ca > Mg > Na > P; C. disticha K > Si > Ca > Na > P > Mg; C. flava K > Si > Ca > P > Mg > Na; C. lepidocarpa K > Si > P > Ca > Na > Mg; C. nigra K > Si > Ca > Mg > P > Na; C. paniculata K > Si > Ca > P > Mg > Na; C. pseudocyperus K > Ca > Si > Mg > Na > P; C. riparia K > Si > Ca > P > Na > Mg; C. vulpina K > Si > Ca > P > Mg > Na.

3.1.4. Micromineral Concentration in Studied Sedges
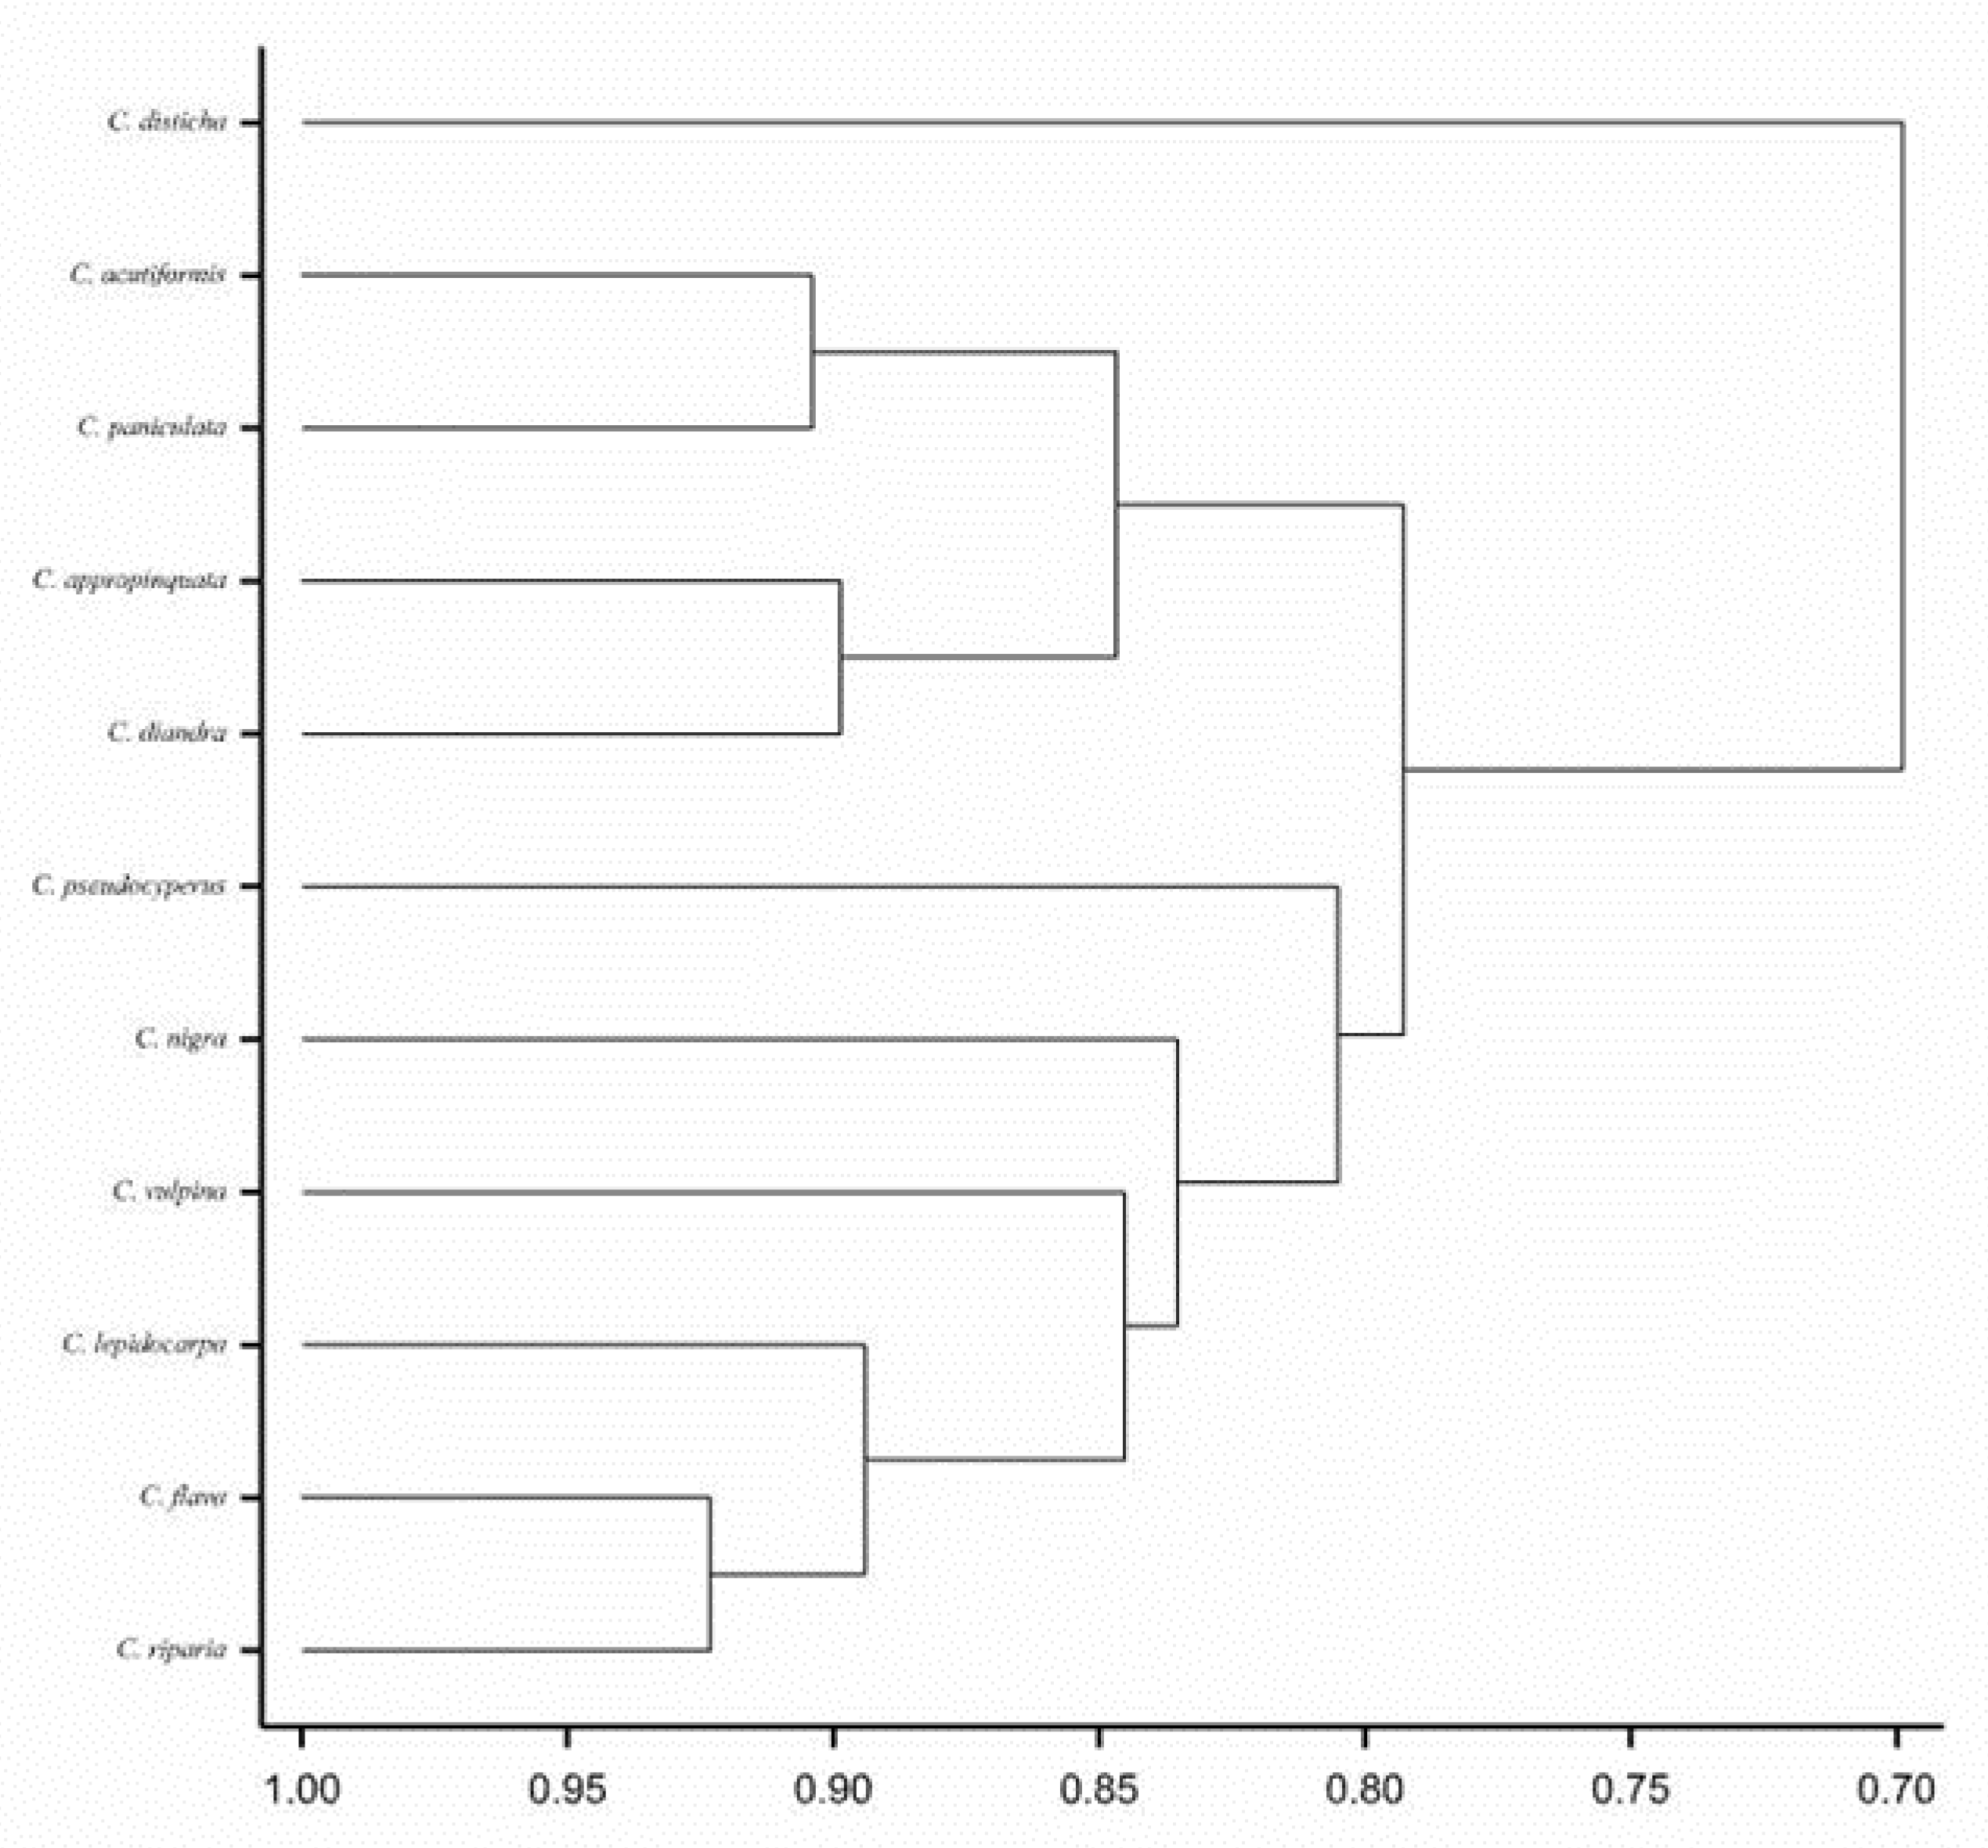
In the case of trace elements (Table 6), the amount of copper (requirement standards in forage estimated at about 10 mg) was relatively high in the biomass of five species: C. vulpina (12.44 mg kg−1 DM), C. pseudocyperus (10.37 mg kg−1 DM), C. nigra (10.25 mg kg−1 DM), C. lepidocarpa (8.77 mg kg−1 DM) and C. diandra (8.62 mg kg−1 DM). The remaining species contained visibly lower amounts, especially C. paniculata (3.99 mg kg−1 DM). The highest concentration of zinc detected, but still lower than optimal (estimated at about 50 mg kg−1 DM), were found in C. vulpina (42.24 mg kg−1 DM) and C. diandra (38.51 mg kg−1 DM). Manganese content variations were found among the species examined, ranging from approximately 74.19 mg kg−1 DM in C. paniculata, which covers the daily requirement for animals in fodder, to over 400 mg kg−1 DM in C. disticha. It should be stressed that in the group of species examined, the boundary considered as toxic, estimated at 1200 mg, was not exceeded. The concentration of iron also varied widely among the species studied, from 77.37 mg kg−1 DM (C. diandra) to 429.32 mg kg−1 DM (C. pseudocyperus). The results obtained exceeded the optimal content of iron in fodder (ca 30 mg kg−1 DM) for all species studied. Chromium varied widely from 0.51 mg kg−1 DM in C. diandra to 2.09 mg kg−1 DM in C. pseudocyperus. It is worth emphasising that at optimal values estimated at 0.3–5 mg kg−1 DM, no shortage or excess of chromium was recorded in any of the species examined. The amount of nickel varied from 0.05 mg kg−1 DM in C. disticha to 3.38 mg kg −1 DM in C. vulpina. No excess of nickel was found in any species. On the other hand, a shortage of this element was found only in C. disticha (0.05 mg kg−1 DM), below the limiting reference value of 0.1 mg kg−1 DM.
The carbon to nitrogen ratio (C–N), being an indicator of digestibility, exhibited the lowest values (most suitable for feeding purposes) in C. diandra and C. paniculata, while C. pseudocyperus was characterised by the highest (less suitable) C–N values (Table 4). The ratio of the elements is important for the fodder quality. The ratio of the Ca–P content in fodder should be about 2:1 [14,49]. Among the species investigated, Ca–P ratios close to optimum occurred in C. paniculata (2.3:1). Slightly higher ratios were detected in C. flava (2.8:1) and C. vulpina (2.6:1). The ratio of K–Ca + Mg content proportion should not exceed 2.2 [14,49]. Such values were determined in five species: (C. acutiformis 2.0, C. diandra 2.0, C. pseudocyperus 1.7, C. appropinquata 1.5 and C. disticha 1.4) and a value close to optimal in C. riparia (2.5). Appropriate K–Na proportions in fodder should equal 5:1 [14,49]. In the case of the examined group, only two species, namely: C. appropinquata (6:1) and C. lepidocarpa (7:1) were characterised by similar, albeit slightly larger than optimal, values. The remaining species, with the exception of C. disticha (2:1), were found to have considerably wider ratios, reaching even 32:1 in C. nigra (Table 7).
The average content of studied trace elements: C. acutiformis Fe > Mn > Zn > Cu > Cr > Ni; C. appropinquata Fe > Mn > Zn > Cu > Cr > Ni; C. diandra Mn > Fe > Zn > Cu > Cr > Ni; C. disticha Mn > Fe > Zn > Cu > Cr > Ni; C. flava Mn > Fe > Zn > Cu > Ni > Cr; C. lepidocarpa Fe > Mn > Zn > Cu > Cr > Ni; C. nigra Fe > Mn > Zn > Cu > Ni > Cr; C. paniculata Fe > Mn > Zn > Cu > Cr > Ni; C. pseudocyperus Fe > Mn > Zn > Cu > Cr > Ni; C. riparia Fe > Mn > Zn > Cu > Ni > Cr; C. vulpina Fe > Mn > Zn > Cu > Ni > Cr.
The dendrogram (Figure 1) shows some similarities among the taxa, and indicates a division into two groups of species. In the first group, the closest similarity is shown by C. flava and C. riparia relatively closely connected with C. lepidocarpa, C. vulpina, C. nigra and C. pseudocyperus. In the case of C. flava and C. lepidocarpa, the visible similarities reflect taxonomical connections (members of the section Ceratocystis Dumort.) and similarities of habitat conditions. Carex flava and C. lepidocarpa are a species occurring mainly on calcitrophic meadows, while C. riparia and C. pseudocyperus are a species of tall rush communities growing on peats. C. nigra and C. vulpina are connected with the communities occurring on mineralised peat soils or clay soils such as wet meadows, low peatlands and the marshy shores of rivers and ponds. These species, excluding the mentioned C. flava and C. lepidocarpa, do not reflect taxonomical connections. In the second group, a visible close connection between taxa concerns C. appropinquata, C. paniculata and C. diandra, which are taxonomically closely related species, classified in the same section Heleoglochin Dumort. and occurring on very similar habitats. In the second group of species evaluated by the dendrogram, the mineral composition particularly reflects taxonomic and habitat relationships. C. disticha is not connected with the remaining species, and was the only species in the group examined that showed optimal concentrations of only two of the mineral constituents examined.

3.2. Discussion

The levels of macroelements in the biomass are very important for evaluating its nutrient value. Plants can be characterized by differentiated amounts of mineral elements. Some species often contain an excess of some elements and, at the same time, a lack of others. Generally, the results of our work showed that sedges are potentially valuable and good sources of macro and microelements. However the analyses of the contents of investigated elements has pointed out some significant differences among the particular species. In spite of this, many of the species are characterized by the content of the studied elements appropriate for the feed. In the group of species examined, none were found to possess in their organs optimal quantities of all macro and microelements analysed. Species characterised by the highest number of constituents (5) at optimal levels were, namely: C. diandra (K, Ca, Mg, Na, Si), C. lepidocarpa (P, K, Mg, Na, Si) and C. pseudocyperus (K, Ca, Mg, Na, Si), whereas C. disticha (P, Si) and C. vulpina (Na, Si) were characterised by the lowest number (2) of constituents at optimal levels. Generally, the studied sedges contained excess Fe and Mn and lacked P, Cu and Zn.
Wild forage herbs are believed to have greater concentrations of most of the minerals investigated, followed by legumes and then grasses The mineral acquisition of a plant is regulated partly by the cation exchange sites of plant cell walls, which are more abundant in dicotyledonous plants compared with monocotyledonous plants like sedges. This leads to a greater concentration of some minerals in legumes and forage herbs compared with sedges or grasses [14,27,49,61].
Major and minor mineral elements play important roles in plant and animal nutrition, but can often be toxic for animals. None of the examined species exceeded toxic levels of the components analysed. At the same time, generally speaking, shortages of phosphorus and magnesium, as well as zinc and copper, were recorded. Shortages of the abovementioned elements were frequently observed in plants both in the sward of individual species and in the sward of entire patches of vegetation. Grasses were frequently low in Ca, P, Na, Cu and Zn, and sometimes in Mg, K and Fe [14,25]. The biomass of the sedge species studied was characterized by relatively high concentrations of carbon, while nitrogen concentration varied strongly and reached a relatively high level in only some of the investigated taxa. Similar results were obtained by [18] in C. paniculata, C. acutiformis and C. rostrata in mid-forest spring ecosystems and [17] in the case of C. brevicuspis in a lake ecosystem, although this finding is not fully in line with previous reports stating that species of the Cyperaceae family can accumulate relatively high amounts of N. However, an increase in nitrogen concentration has been observed after mowing and a general increase in mineral concentration during the vegetation season [61,62,63].
The C–N ratio was similar to that observed in grasses, e.g., [64], although its values varied strongly. The lowest C–N ratio in C. diandra and C. paniculata, indicated that these species have relatively good digestibility. Similar results were observed by [13] for C. aquatilis and C. subspathacea.
In the tissues of the majority of the species studied, the amount of K was at the levels optimal for fodder purposes (16–20 g kg−1 DM, but 10 g kg−1 DM covers the needs of plants and animals [14]) or, in some cases, even higher but below toxic concentrations. Our study shows the optimal level of potassium in the case of all studied species. Higher potassium contents were found for C. pilosa derived from montane sites (25–39 g kg−1 DM) [65]. The high potassium content in Carex was confirmed in the research of [11,66]. Sedges studied by [18] showed high, but slightly lower than our study, content of K. The concentration of K in graminoids is higher at the initial stages of growth, especially in fresh leaves and other parts with intensive metabolism. This is probably connected with the structure of the aboveground biomass. Sedges are characterised by intensive and rapid development of tufts and the creation of large quantities of leaves in all of the vegetation season and accumulate relatively large quantities of K. The contents of potassium among sedge species were similar or sometimes slightly lower than those observed for several species of grasses in agronomical use, such as Dactylis glomerata, Lolium perenne and Holcus lanatus [25,28,49].
The proportion ratio of the content of mineral constituents was very important for fodder value. Excessive amounts of potassium can occur in plants, especially in relation to sodium. At times, the K–Na ratio can reach 40:1, while a negative effect on metabolic processes is already observed when this ratio is 20:1 [49]. The proper K–Na ratio in the forage should be 5:1. In the species examined, values close to the above were recorded only in the case of two species. As to the remaining species (with the exception of C. disticha 2:1 where was noted), the ratio was significantly higher (reaching 32:1 in C. nigra). In the studied group of sedges, the sodium content generally ranged within the optimal limits and the values were comparable with those observed in grasses (e.g., Lolium perenne, Dactylis glomerata, Holcus lanatus) and many pasture plant species (e.g., Achillea millefolium, Poterium sanguisorba and Cichorium intybus) but lower than observed in the case of C. pilosa. However, in the sward of meadows, deficits of this element could be found, particularly in monocotyledonous plants [49,65,67].
Among the studied sedges, C. disticha was characterized by high concentrations of Mg (more than 3 g kg−1 DM). Four of the studied species showed magnesium deficiencies. In fact, the values identified in the current study were lower than those reported in dicotyledonous plants, generally depicted as “magnesium plants”, e.g., Alchemilla vulgaris or Trifolium pratense. Interestingly, the Mg contents recorded were higher than in Carex pilosa detected by [65] and in some fodder grasses, such as Phleum pratense, Lolium westerwoldicum or Dactylis glomerata and comparable with Festuca arundinacea [25,49]. However, in the study of Parzych et al. [18], the average content of magnesium in Carex remained at a slightly higher level than in our study. The range of calcium content in the examined material was high, on average, fluctuating from 3.3 to 8 g kg−1 DM. Ca content seems to be associated with the plant habit, e.g., [49]. Species characterised by leaf abundance (e.g., C. pseudocyperus, C. paniculata) accumulated greater Ca quantities in comparison with those which produced tufts or stolons poor in leaves (e.g., C. lepidocarpa, C. disticha). In 2 from the 11 studied species the level of calcium was significantly lower than optimal. Similar results were obtained by [9] in C. sprengelii, [10] and in C. geyeri and C. atherodes in [68] of the grassy sward. In spite of this, the majority of sedge species investigated in this study were characterized by comparable (and sometimes higher) Ca contents as C. pilosa [65] or many grasses, e.g., Poa pratensis, Lolium perenne, Lolium multiflorum, Dactylis glomerata, Brachypodium sylvaticum, Phleum pratense, Nardus stricta or Digitaria sanguinalis [28,49]. Phosphorus concentrations for sedge biomass were generally found to be low compared to the expected level in fodder. Only four species of studied sedges had a satisfactory (oscillated close optimal values) level of P. However, the problem of P deficiency in plants is frequently encountered, particularly in graminoids, where its content is lower than in papilionaceous and herbaceous plants. Alldrege et al. [10] reported that P concentrations rapidly decreased early in the growing season but stabilized in early summer and there were declines in P concentration late in the growing season in C. geyeri and C. atherodes. In C. mulinensis, P content gradually decreased along the growing season [22]. Similar results were obtained by [9] in C. sprengelii. However, the P concentration in Sprengel’s sedge in the mentioned study never declined below livestock requirements [69], maintaining a minimum P level throughout the growing season. This may be related to the fact that flowers accumulate twice as much P as that found in leaves and stems. Carex genus are characterised by specific flowers equipped in an additional element, perigynium, situated practically within the inflorescence [2]. Unfortunately, no research results can be found in the literature regarding the capability of accumulation of any macro and microelements by perigynium tissues. The current study indicated that, in spite of P deficiencies in Carex, the remaining minerals showed values comparable with some grasses such as Elymus repens, Dactylis glomerata or Lolium perenne and even some herbaceous plants like Lotus corniculatus, Cichorium intybus, Plantago lanceolata and Taraxacum officinale [49]. Comparable results were obtained in C. acutiformis and C. paniculata [18,25] and opposite results [28] in the case of the grasses of South India and by Li et al. [17] in tissues of the C. brevicuspis.
The widest Ca–P ratio in studied species was noted in C. acutiformis (4.8:1) and C. pseudocyperus (4.4:1) and the narrowest in C. lepidocarpa (0.9:1). In most cases, very suitable for feed. At the same time, these were much narrower than those of herbs and legumes, e.g., [70,71].
Silicon occurs in plants in varying amounts. Si is a common constituent of plants, and its amounts may vary by two orders of magnitude [34]. The admissible value in fodder is estimated at 9.0 g kg−1 DM. However, in the case of silicon, the quoted values are not treated as optimal but only as ones whose levels should not be exceeded because high Si concentration is a factor that often decreases the fodder value of plants. Metson et al. [72], Kabata-Pendias and Pendias [34] reported the mean Si content to range from about 3 to 12 g kg−1 DM in grass, but some plants may accumulate a much higher amount of Si (e.g., sedges). In the studied species, Si content did not exceed this limit for any of the species and, in several cases, it was even significantly lower. In the species studied, the recorded concentrations were frequently even lower than those found in many species of grasses, e.g., in Festuca rubra, Deschampsia cespitosa, Phleum pratense or Lolium multiflorum and comparable with those observed in some herbaceous plants: Urtica dioica, Taraxacum officinale or Alchemilla pastoralis.
The studied sedges’ biomass was rich in iron, especially in the case of C. pseudocyperus and C. nigra, with an Fe level significantly above the limit permissible in fodder (but not above the toxic level). Similar results were obtained by Parzych et al. [18] in mid-forest spring ecosystems. According to [18], such a situation was observed in places where iron is easily soluble and plants may take up a very large amount of Fe, e.g. in the case of species growing on wet soils. According to some authors, e.g., [34,49], the zinc content of plants varies considerably, reflecting factors in the various ecosystems and of the genotypes, but usually this is not at levels considered sufficient for fodder, particularly in grasses. Zn also frequently occurs in deficient amounts in other meadow species, especially from the monocotyledonous class. This was the case for the Carex species investigated, where only C. vulpina had values similar to those accepted as sufficient for fodder. An optimal concentration of copper was found only in three Carex species (C. vulpina, C. pseudocyperus, C. nigra). Cu content in sedges is generally comparable with Cu content in grasses and in papilionaceous plants and herbs [73,74]. Loneragan [75], Kabata-Pendias and Pendias [34], and Pirhofer-Walzl et al. [61] stated that Mn showed a particularly wide variation among plant species grown on the same soil. Grasses, however, often had greater Mn concentrations than legumes and herbs. In our study, all Carex species significantly exceeded the required level estimated at 50 g kg−1 DM. Because of a great range of the optimal Cr and Ni concentrations in plant biomass, the requirement for these elements in fodder was satisfied by the plants analysed (except C. disticha in the case of Ni). The Ni content of plants species may vary considerably because it reflects both environmental and biological factors [34].
Results presented in our study showed significant interspecific differentiation in the major and trace elements among studied species. The content of the mineral components for a majority of the sedge species was comparable with the values reached by many grass species eagerly used in the fodder economy. The data of our study show that sedges can increase fodder value and, therefore, should be used in meadow management (e.g., by undersowing of the most favourable species). They can be used for modelling the retention of various elements in the biomass of plants, or to create or modify different plant communities suitable for obtaining fodder, including sedge meadows. Accordingly, the fodder value can be modified and shaped by including species able to accumulate desired chemical elements.
As mentioned in the Introduction, plant ash, due to its contents of micro and macroelements, may be used as a fertilizer, especially on depleted, extensively managed soils [76]. According to some authors, the aboveground parts of sedges contained from 4.2% to 7.3% minerals [77,78,79]. Murawski et al. [80] recorded 6.5–7.1% mineral substances in grasses and sedges harvested from extensively managed meadows. Ash from biomass combustion belongs to the oldest mineral fertilizers with valuable nutrients [81,82]. Our earlier studies [77] showed that the species in which a markedly higher ash content was recorded turned out to be C. riparia (12.3%), analysed in the current study. It is worth noting that C. riparia is one of the dimensionally largest sedges. It forms compact, frequently single-species patches in the Caricetum ripariae association. It occurs commonly over large expanses of meadows and is characterised by a long-term—up to late autumn—maintenance of green aboveground shoots and significant increase in biomass within a single vegetation season. Our analyses shows that C. riparia has adequate microelement and macroelement indexes in the biomass of the aboveground parts and, potentially, can be considered as a fertilizer. Therefore, one can state that sedges, potentially, can be used as fodder or for other purposes, in order to supplement the deficits in particular components that may occur in grassland.

4. Conclusions

  • According to the hypothesis, studied sedges are a good source of macroelements and microelements.
  • Species characterized by the highest numbers of constituents at optimal level are namely: C. diandra, C. lepidocarpa and C. pseudocyperus.
  • None of the examined species contained the optimal amount of all analysed elements.
  • Generally, the studied sedges contained excess Fe and Mn and lacked P, Cu and Zn.
  • The elemental composition of studied Carex is diversified but is generally similar to the composition of the meadow grasses.
  • Aboveground parts of Carex are suitable for fodder purposes or in order to supplement the deficits in particular components.
  • Sedges can increase the fodder value and can be used in meadow management.

Author Contributions

Conceptualization, M.J.-S., P.G.; methodology, M.J.-S., P.G.; software, P.G., A.M.J.; validation, M.J.-S.; formal analysis, P.G., A.M.J.; investigation, M.J.-S., P.G., M.G., E.G.; data curation, M.J.-S., P.G.; writing—original draft preparation, M.J.-S., P.G., D.W.-P.; writing—review and editing, M.J.-S., D.W.-P.; visualization, P.G.; funding acquisition, M.J.-S., M.G. All authors have read and agreed to the published version of the manuscript.

Funding

Publication was co-financed within the framework of the Polish Ministry of Science and Higher Education’s program: “Regional Initiative Excellence” in the years 2019–2022 (No. 005/RID/2018/19)”, financing amount 12 000 000 PLN.

Institutional Review Board Statement

Not applicable.

Informed Consent Statement

Not applicable.

Data Availability Statement

The data presented in this study are available on request from the corresponding author.

Conflicts of Interest

The authors declare no conflict of interest.

References

  1. Goetghebeur, P. Cyperaceae. In The Families and Genera of Vascular Plants. Monocotyledons, 4th ed.; Springer: Hamburg, Germany, 1998. [Google Scholar]
  2. Egorova, T.V. The Sedges Carex L. of Russia and Adjacent States; State Chemical-Pharmaceutical Academy St Petersburg: St Petersburg, Russia, 1999. [Google Scholar]
  3. Janyszek, M.; Jagodzinski, A.M.; Janyszek, S.; Wronska-Pilarek, D. Morphological variability of Carex spicata Huds utricles among plant communities. Flora 2008, 203, 386–395. [Google Scholar] [CrossRef]
  4. Govaerts, R.; Simpson, D.A.; Bruhl, J. World Checklist of Cyperaceae; Royal Botanic Gardens Kew: London, UK, 2009. [Google Scholar]
  5. Janyszek, M.; Jagodzinski, A.M. Variability of perigynium morphology of Central European members of Carex sect Phaestoglochin Cyperaceae from variable plant communities. Plant Syst. Evol. 2009, 278, 87–99. [Google Scholar] [CrossRef]
  6. Catling, P.M.; McElroy, A.R.; Spicer, K.W. Potential forage value of some eastern Canadian sedges Cyperaceae. Carex. J. Rang. Manag. 1994, 47, 226–230. [Google Scholar] [CrossRef]
  7. Larter, N.C.; Nagy, J.A.; Hik, D.S. Does sesonal variation in forage quality influence the potential for resource competition between muskoxen and Peary Caribou on Banks Island? Ragnifer 2002, 22, 143–153. [Google Scholar]
  8. Clark, P.E. Date and plant community effects on elk sedge forage quality. J. Rang. Manag. 2003, 56, 21–26. [Google Scholar] [CrossRef]
  9. Meehan, M.A.; DeKeyser, E.S.; Sedivec, K.K.; Norland, J.E. Nutrition composition of Sprengel’s sedge Carex sprengelii. Can. J. Plant Sci. 2012, 92, 867–871. [Google Scholar] [CrossRef]
  10. Alldrege, M.W.; Peek, J.M.; Wall, W.A. Nutritional quality of forages used by elk in Northern Idaho. J. Rang. Manag. 2002, 55, 253–259. [Google Scholar] [CrossRef]
  11. Choo, Y.S.; Lee, C.B.; Albert, R. Effects of nitrogen nutrition on the pattern of ions and organic solutes in five sedges (Carex spp.). Flora 2002, 197, 56–66. [Google Scholar] [CrossRef]
  12. Ringqvist, L.; Oborn, I. Cooper and zinc adsorption onto poorly humified Sphagnum and Carex peat. Water Res. 2002, 36, 2233–2242. [Google Scholar] [CrossRef]
  13. Ngai, J.T.; Jeffers, R.L. Nutrient limitation of plant growth and forage quality in Arctic coastal marshes. J. Ecol. 2004, 92, 1001–1010. [Google Scholar] [CrossRef]
  14. Krasicka-Korczyńska, E.; Dembek, R.; Korczyński, M.; Stosik, T. Natural and fodder values of community with Carex nigra in the Bydgoszcz Canal Valley. Acta Sci. Pol. Agric. 2014, 134, 77–91. [Google Scholar]
  15. Veselkin, D.V.; Konoplenko, M.A.; Betekhtina, A.A. Means for soil nutrient uptake in sedges with different ecological strategies. Russ. J. Ecol. 2014, 45, 547–554. [Google Scholar] [CrossRef]
  16. Nekhoroshkov, P.S.; Kravtsova, A.V.; Kamnev, A.N.; Duliu, O.; Bunkova, O.M.; Frontasyeva, M.V.; Yermakov, I.P. Assessment of major and trace elements in aquatic macrophytes soils and bottom sediments collected along different water objects in the lack Sea Coastal zone by using Neutron Activation Analysis. Mod. Chem. Appl. 2017, 5, 1. [Google Scholar]
  17. Li, F.; Gao, H.; Zhu, L.; Xie, Y.; Yang, G.; Hu, C.; Deng, Z. Foliar nitrogen and phosphorus stoichiometry of three wetland plants distributed along an elevation gradient in Dongting Lake, China. Sci. Rep. 2017, 7, 1–9. [Google Scholar]
  18. Parzych, A.E.; Sobisz, Z.; Jonczak, J. Comparing Carex species of mid-forest spring ecosystem in terms of ability to accumulate macro- and microelements. J. Ecol. Eng. 2017, 18, 125–136. [Google Scholar] [CrossRef] [Green Version]
  19. Wang, H.; Nie, L.; Xu, Y.; Li, M.; Lv, Y. Traffic-emitted metal status and uptake by Carex meyeriana Kunth and Thelypteris palustris var. pubescens Fernald growing in roadside turfy swamp in the Changbai Mountain area, China. Environ. Sci. Pollut. Res. Int. 2018, 25, 18498–18509. [Google Scholar]
  20. Hinzke, T.; Tanneberger, F.; Aggenbach, C.; Dahlke, S.; Knorr, K.H.; Kotowski, W.; Kozub, Ł.; Lange, J.; Li, G.; Pronin, E.; et al. Can nutrient uptake by Carex counteract eutrophication in fen peatlands? Sci. Total Environ. 2021, 785, 1–7. [Google Scholar] [CrossRef] [PubMed]
  21. Lopez-Rodriguez, C.C.; Izquiredo-Ramirez, C.R.; Lanfranco-Colina, L.J.; Ciraco-Mosqueira, J.E.; Cervantes-Peralta, M.E.; Sanchez-Pena, M.A. Phytoextraction of heavy metals from the soil of aurora-patricia mining environmental liability by herbaceous species Carex mandoniana, Equisetum bogotense, and Muehlenbeckia tamnifolia, La Encañada-Peru 2020. Conference paper. In Proceedings of the Brasilian Technology Symposium, Virtual Event, 8–10 November 2021. [Google Scholar]
  22. Zhao, L.; Ma, X.; Liu, H.Q.; Xiong, L.H.; Guo, X.L.; Li, L.P.; Dong, L.Q.; Zhang, K. Responses of leaf carbon, nitrogen, and phosphorus stoichiometry of Carex muliensis to water table drawdown in an alpine marsh on the Ruoergai Plateau, China. J. Appl. Ecol. 2021, 32, 2426–2432. [Google Scholar]
  23. Bennett, J.P.; Chiriboga, E.; Coleman, V.; Waller, D.M. Heavy metals in wild rice from northern Wisconsin. Sci. Total Ennviron. 2000, 246, 261–269. [Google Scholar] [CrossRef]
  24. Ozcan, M. Mineral contents of some plants used as condiments in Turkey. Food Chem. 2003, 84, 437–440. [Google Scholar] [CrossRef]
  25. Juknevicius, S.; Sabiene, N. The content of mineral elements in some grasses and legumes. Ekologija 2007, 53, 44–52. [Google Scholar]
  26. Soetan, K.O.; Olaiya, C.O.; Oyewole, O.E. The importance of mineral elements for humans domestic animals and plants, A review. Afr. J. Food Sci. 2010, 45, 200–222. [Google Scholar]
  27. Marschner, H. Mineral Nutrition of Higher Plants III; Academic Press: London, UK, 2011. [Google Scholar]
  28. Babu, R.H.; Savithramma, N. Studies on mineral analysis of grasses of Poaceae. Int. J. Pharma Sci. 2014, 4, 526–531. [Google Scholar]
  29. Grzegorczyk, S.; Alberski, J.; Olszewska, M.; Grabowski, K.; Bałuch-Małecka, A. Content of calcium and phosphorus and the Ca, P ratio in selected species in leguminous and herbaceous plants. J. Elem. 2017, 22, 663–669. [Google Scholar]
  30. Wyłupek, T. Rolnicza charakterystyka zespołu Caricetum acutae Tx1937 z doliny Poru. Woda-Środ-Obsz Wiej. 2001, 1, 171–183. (In Polish) [Google Scholar]
  31. Bengtsson, H.; Oborn, L.; Jonsson, S.; Nilsson, I.; Andersson, A. Field balances of some mineral nutrients and trace elements in organic and conventional dairy farming—A case study at Ojebyn Sweden. Eur. J. Agron. 2003, 20, 101–116. [Google Scholar] [CrossRef]
  32. Warman, P.R.; Termeer, W.C. Evaluation of sewage sludge septic waste and sludge compost applications to corn and forage, yields and N P and K content of crops and soils. Bioresour. Technol. 2005, 96, 955–961. [Google Scholar] [CrossRef] [PubMed]
  33. Chapin, F.S. The mineral nutrition of wild plants. Ann. Rev. Ecol. Syst. 1980, 11, 233–260. [Google Scholar] [CrossRef]
  34. Kabata-Pendias, A.; Pendias, H. Trace Elements in Soil and Plants, 3rd ed.; CRC Press: Boca Raton, FL, USA, 2000. [Google Scholar]
  35. Malzahn, E. Igły sosny zwyczajnej jako bioindykator zagrożeń środowiska leśnego Puszczy Białowieskiej. Biul. Monit. Przyr. 2002, 1, 24–31. (In Polish) [Google Scholar]
  36. Ostrowska, A.; Porębska, G. Skład Chemiczny Roślin Jego Interpretacja i Wykorzystanie w Ochronie Środowiska; Inst Ochr Środ.: Warszawa, Poland, 2002. (In Polish) [Google Scholar]
  37. Parzych, A. Azot fosfor i węgiel w roślinności leśnej Słowińskiego Parku Narodowego w latach 2002–2005. Ochr. Środ. Zas. Nat. 2010, 43, 45–64. (In Polish) [Google Scholar]
  38. Demeyer, A.; Voundi Nkana, J.C.; Verloo, M.G. Characteristics of wood ash and influence on soil properties and nutrient uptake, an overview. Biores. Technol. 2001, 77, 287–295. [Google Scholar] [CrossRef]
  39. Mandre, M.; Korsjukov, R.; Ots, K. Effect of wood ash on the biomass distribution and physiological state of Norway spruce seedlings on sandy soils. Plant Soil 2004, 265, 301–314. [Google Scholar] [CrossRef]
  40. Saarsalmi, A.; Malkonen, E.; Kukkola, M. Effects of wood ash fertilization on soil chemical properties and stand nutrient status and growth of some coniferous stands in Finland. Scand. J. For. Res. 2004, 19, 217–233. [Google Scholar] [CrossRef]
  41. Mandre, M. Influence of wood ash on soil chemical composition and biochemical parameters of young Scots pine. Proc. Estonian Acad. Sci. Biol. Ecol. 2006, 55, 91–107. [Google Scholar] [CrossRef]
  42. Doongar, R.C.; Ghosh, A. Bioaccumulation of nutrient elements from fly ash-amended soil in Jatropha curcas L., a biofuel crop. Environ. Monit. Assess. 2013, 185, 6705–6712. [Google Scholar]
  43. Brannvall, E.; Wolters, M.; Sjoblom, R.; Kumpiene, J. Elements availability in soil fertilized with pelletized fly ash and biosolids. J. Environ. Manag. 2015, 159, 27–36. [Google Scholar] [CrossRef] [PubMed]
  44. IUSS Working Group WRB. World Reference Base for Soil Resources 2014, up-Date 2015 International Soil Classification System for Naming Soil and Creating Leg-Ends for Soil Maps; World Soil Resources Reports No. 106; FAO: Rome, Italy, 2015. [Google Scholar]
  45. Mocek, A.; Drzymała, S. Geneza, Analiza i Klasyfikacja Gleb; Wyd. UP Poznań: Poznań, Poland, 2010. (In Polish) [Google Scholar]
  46. Bojko, O.; Kabała, C. Organic carbon pools in mountain soils—Sources of variability and predicted changes in relation to climate and land use changes. Catena 2017, 149, 209–220. [Google Scholar] [CrossRef]
  47. Broadley, M.R.; Bowen, H.C.; Cotterill, H.L.; Hammond, J.P.; Meacham, M.C.; Mead, A.; White, P.J. Phylogenetic variation in the shoot mineral concentration of angiosperms. J. Exp. Bot. 2004, 33, 321–336. [Google Scholar] [CrossRef] [Green Version]
  48. Domański, P. Poradnik dla Użytkowników łąk i Pastwisk; Prodruk: Poznań, Poland, 1998. (In Polish) [Google Scholar]
  49. Falkowski, M.; Kukułka, I.; Kozłowski, S. Właściwości Chemiczne Roślin Łąkowych; Wydawnictwo AR w Poznaniu: Poznań, Poland, 2000. (In Polish) [Google Scholar]
  50. NRC (National Research Council). Nutrient Requirements of Beef Cattle, 2000 ed.; National Academy Press: Washington, DC, USA, 2000; Available online: http//www.nap.edu/books/0309069343/html (accessed on 12 September 2021).
  51. NRC (National Research Council). Nutrient Requirement of Dairy Cattle, 2001 ed.; Academic Press: Washington, DC, USA, 2001; Available online: http,//www.nap.edu/catalog/9825.html (accessed on 12 September 2021).
  52. Smólczyński, S.; Orzechowski, M.; Kalisz, B.; Sowiński, P. Content of selected elements and exchangeable cations in soils formed from glacio-lacustrine sediments. J. Elem. 2020, 25, 347–361. [Google Scholar]
  53. Zharikova, E.A. Geochemical characterization of soils of the eastern coast of the Northern Sakhalin Lowland. Eurasian Soil Sci. 2017, 50, 34–41. [Google Scholar] [CrossRef]
  54. Smólczyński, S.; Orzechowski, M.; Kalisz, B.; Sowiński, P. Content of selected elements and exchangeable cations in soils developed from glacio-lacustrine sediments of Sępopolska Plain (NE Poland). J. Elem. 2020, 20, 417–434. [Google Scholar]
  55. Glina, B.; Kołodziejczyk-Prażmo, K.; Bogacz, A.; Tomaszewska, K.; Kaczmarek, Z.; Gajewski, P. Application of Shumann and Joosten classification in fen peatland degradation stage assessment—A case study from southern Poland. Ecol. Quest. 2017, 27, 89–96. [Google Scholar]
  56. Glina, B.; Gajewski, P.; Mendyk, Ł.; Zawieja, B.; Kaczmarek, Z. Recent changes in soil properties and carbon stocks in fen peatlands adjacent to open-pit lignite mines. Land Degrad. Dev. 2019, 30, 2371–2380. [Google Scholar] [CrossRef] [Green Version]
  57. Wiesmeier, M.; Urbansk, L.; Hobley, E.; Lang, B.; von Lützow, M.; Marin-Spiotta, E.; Kögel-Knabner, I. Soil organic carbon storage as a key function of soils—A review of drivers and indicators at various scales. Geoderma 2019, 333, 149–162. [Google Scholar] [CrossRef]
  58. Liu, H.; Janssen, M.; Lennartz, B. Changes in flow and transport patterns in fen peat following soil degradation. Eur. J. Soil Sci. 2016, 67, 763–772. [Google Scholar] [CrossRef]
  59. Jarnuszewski, G.; Meller, E. Total content of macroelements and trace elements in Holocene calcareous gyttja from the post-bog area of North-western Poland. Soil Water Res. 2019, 14, 40–46. [Google Scholar] [CrossRef] [Green Version]
  60. Smólczyński, S.; Orzechowski, M.; Kalisz, B. Distribution of elements in soil catenas developed in ice-dammed lake and morainic landscapes in NE Poland. J. Elem. 2015, 25, 347–361. [Google Scholar]
  61. Pirhofer-Walzl, K.; Søegaard, K.; Høgh-Jensen, H.; Eriksen, J.; Sanderson, M.A.; Rasmusen, J.; Rasmussen, J. Forage herbs improve mineral composition of grassland herbage. Grass Forage Sci. 2011, 66, 415–423. [Google Scholar] [CrossRef] [Green Version]
  62. Elgersma, A.; Soegaard, K.; Jensen, S.K.; Sehested, J. Herbage mineral contents in grass and legume species. Conference paper, Sustainable meat and milk production from grasslands. In Proceedings of the 27th General Meeting of the European Grassland Federation, Cork, Ireland, 17–21 June 2018; pp. 169–171. [Google Scholar]
  63. Whitehead, D.C. Nutrient Elements in Grasslands, Soil-Plant-Animal Relationship; CABI Publishing: Wallingford, UK, 2000. [Google Scholar]
  64. Goliński, P.; Spychalski, W. Effect of Trifolium pratense cultivars on yield and chemical composition of grass-legume swards Workshop on dynamics N-flows and forage utilization in legume-based systems. Grado 2005, 2, 45–49. [Google Scholar]
  65. Bucinova, K.; Jamnicka, G.; Havrantova, J.; Kukla, J.; Kuklova, M. Content of Selected Elements in Aboveground of Parts of Carex Pilosa Scop in Sporocarps of Some Microfungi at the Ecological Experimental Site in the Kremnicke Vrchy Mts Bratislava; Slovak Library of Forestry and Wood Sciences: Bratislava, Slovakia, 2008. [Google Scholar]
  66. Czerwiński, Z.; Pracz, J. Content of mineral components in the over-ground parts of herb layer plants in the Sphagno girgensohnii-Piceetum community. Pol. Ecol. Stud. 1995, 21, 195–205. [Google Scholar]
  67. Marinas, A.; Garcia-Gonzalez, R. Preliminary data on nutritional value of abundand species in supraforestal pyrenean pastures. Pirineos 2006, 161, 85–109. [Google Scholar] [CrossRef]
  68. Jankowska-Hufejt, H.; Wróbel, B.; Barszczewski, J. Ocena wartości pokarmowej pasz z użytków zielonych na tle zasobności gleb i bilansu składników N P K w wybranych gospodarstwach ekologicznych. J. Res. Appl. Agric. Eng. 2000, 543, 95–102. (In Polish) [Google Scholar]
  69. NRC (National Research Council). Nutrient Requirements of Beef Cattle, 1996 ed.; National Academy Press: Washington, DC, USA, 1996; Available online: http://www.nap.edu/books/0309069343/html (accessed on 15 September 2021).
  70. Ayan, I.; Mut, H.; Onal-Asci, O.; Basaran, U.; Acar, Z. Effects of manure application on the chemical composition of rangeland hay. J. Anim. Vet. Adv. 2010, 9, 1852–1857. [Google Scholar]
  71. Kumar, K.; Soni, A. Elemental ratio and their importance in feed and fodder. Int. J. Pure App. Biosci. 2014, 2, 154–160. [Google Scholar]
  72. Metson, A.J.; Gibson, E.J.; Hunt, J.L.; Sauders, W.M.H. Seasonal variations in chemical composition of pasture. N. Zealand J. Agric. Res. 1979, 22, 309–318. [Google Scholar] [CrossRef]
  73. Grzegorczyk, S.; Alberski, J. Zawartość niektórych mikroelementów w wybranych gatunkach ziół łąkowo-pastwiskowych. Zesz. PTPN. 2000, 471, 705–710. (In Polish) [Google Scholar]
  74. Warda, M.; Ćwintal, B. Zawartość boru miedzi żelaza manganu i cynku w wybranych gatunkach roślin pastwiskowych. Zesz. PTPN. 2000, 471, 841–846. (In Polish) [Google Scholar]
  75. Loneragan, J.F. The Availability and Absorption of Trace Elements in Soil-Plant Systems and Their Relation to Movement and Concentration of Trace Elements in Plants, in Trace Elements in Soil-Plant Animal Systems; Nicholas, D.J.D., Egan, A.R., Eds.; Academic Press: New York, NY, USA, 1975. [Google Scholar]
  76. Piekarczyk, M.; Kotwica, K.; Jaskólski, D. The elemental composition of ash from straw and hay in the content of their agricultural utilization. Acta Sci. Pol. 2011, 10, 97–104. [Google Scholar]
  77. Waliszewska, B.; Janyszek, M.; Grzelak, M.; Gaweł, E. Characteristic of thermochemical parameters of aboveground parts of selected sedges (Carex L. Cyperaceae). IOSR-JAVS 2013, 5, 1–6. [Google Scholar] [CrossRef]
  78. Grzelak, M.; Gaweł, E.; Majchrzak, L. Diversity of floristic, habitat and energy value of selected species of genus Carex L. Acta Sci. Pol. 2019, 18, 181–187. [Google Scholar]
  79. Waliszewska, B.; Grzelak, M.; Gaweł, E.; Spek-Dźwigała, A.; Sieradzka, A.; Czekała, W. Chemical characteristic of selected grass species from Polish meadows and their potential utilization for energy generation purposes. Energies 2021, 14, 1669. [Google Scholar] [CrossRef]
  80. Murawski, M.; Grzelak, M.; Waliszewska, B.; Knioła, A.; Czekała, W. Energy value and yelding from extensively used meadows. Fragm. Agron. 2015, 32, 71–78. [Google Scholar]
  81. Szczepanik, M.; Szyszlak-Bargłowicz, J.; Zając, G.; Koniuszy, H.; Hawrot-Paw, M.; Wolak, A. The Use of Multivariate Data Analysis (HCA and PCA) to Characterize Ashes from Biomass Combustion. Energies 2021, 14, 6887. [Google Scholar] [CrossRef]
  82. Zając, G.; Szyszlak-Bargłowicz, J.; Gołębiowski, W.; Szczepanik, M. Chemical Characteristics of Biomass Ashes. Energies 2018, 11, 2885. [Google Scholar] [CrossRef] [Green Version]
Figure 1. Dendrogram of cluster groupings of Carex taxa based on major and trace element contents in the aboveground biomass.
Energies 14 08007 g001
Table 1. Basic chemical properties of examined soils. The same letters indicate a lack of statistically significant differences among species analysed according to Tukey’s tests.
No. of SiteSpeciesGenetic Horizon
Acc, to
FAO-WRB
Soil Material/TextureDepth
(cm)
pHe in 1MKClC tot,
(g·kg−1)
N tot,
(g·kg−1)
C–NOMC
(g·kg−1)
1C. acutiformisHa1sapric peat0–165.44 g223.3 d17.10 cd13.1 c430.1 e
Ha2sapric peat16–316.61c d203.6 e18.30 c11.1 d408.3 e
2C. appropinquataHa1murshic0–276.72 c274.1 cd25.50 b10.7 de621.3 cd
Ha2murshic27–425.84 e324. 5b28.60 ab11.3 d614.3 d
3C. diandraHe1hemic peat0–205.41 g294.4 c27.40 b10.7 de642 c
He2hemic peat20–1605.63 f446.6 a29.90 a14.9 b802.3 a
4C. distichaAsand0–325.68 ef11.1 j0.90 i12.3 c27.40 k
Bwsilt32–725.84 e5.6 k0.50 i11.2 d15.30 l
5C. flavaHa1sapric peat0–155.94 e372.8 b32.10 a11.6 cd712.4 b
Ha2sapric peat15–336.72 c193.2 e17.90 c10.8 de302.6 fg
5C. lepidocarpaHa1sapric peat0–155.94 e372.8 b32.10 a11.6 cd712.4 b
Ha2sapric peat15–336.72 c193.2 e17.90 c10.8 de302.6 fg
6C. nigraHa1murshic0–317.51 a127.3 fg11.70 e10.9 de230.7 g
Ha2sapric peat31–367.04 b150.2 f11.50 e13.1 c326.2 f
2C. paniculataHa1murshic0–276.72 c274.1 cd25.50 b10.7 de621.3 cd
Ha2murshic27–425.84 e324.5 b28.60 ab11.3 d614.3 d
7C. pseudocyperusHa1murshic0–266.18 d174.5 ef16.30 d10.7 de323.4 f
Ha2sapric peat26–557.35 ab289.3 c17.7 cd16.3 a619.3 d
7C. ripariaHa1murshic0–266.18 d174.5 ef16.30 d10.7 de323.4 f
Ha2sapric peat26–557.35 ab289.3 c17.7 cd16.3 a619.3 d
8C. vulpinaAh1silt0–137.63 a46.2 h5.10 g9.1 f88.9 i
Ah2silt13–326.92 c97.7 g9.50 f10.3 e187.6 h
Csilty loam32–567.44 a33.2 i2.61 h12.7 c65.1 j
Mean marked with different letters differ significantly at the level of α = 0.05.
Table 2. Total content of macroelements in the examined soils. The same letters indicate a lack of statistically significant differences among species analysed according to Tukey’s tests.
No. of SiteSpeciesGenetic Horizon
Acc, to
FAO-WRB
Soil MaterialDepth (cm)Macroelements Content
(g·kg−1)
PKCaMgNa
1C. acutiformisHa1sapric peat0–160.41 ab0.31 b14.41 d0.62 bc0.61 cd
Ha2sapric peat16–310.32 b0.26 bc11.20 d0.70 b0.44 e
2C. appropinquataHa1murshic0–270.39 b0.08 e2.10 f0.70 b0.80 c
Ha2murshic27–420.28 bc0.19 cd1.56 g0.44 cd0.54 d
3C. diandraHe1hemic peat0–200.32 b0.32 b23.90 b0.62 bc0.71 cd
He2hemic peat20–1600.25 bc0.13 d32.10 a0.40 cd1.12 b
4C. distichaAsand0–320.05 d0.22 c0.56 h0.44 cd0.22 f
Bwsilt32–720.06 d0.24 c0.33 h0.28 d0.13 g
5C. flavaHa1sapric peat0–150.51 a0.28 bc30.10 a0.62 bc1.02 b
Ha2sapric peat15–330.56 a0.15 d5.89 e1.01 a0.66 cd
5C. lepidocarpaHa1sapric peat0–150.51 a0.28 bc30.10 a0.62 bc1.02 b
Ha2sapric peat15–330.56 a0.15 d5.89 e1.01 a0.66 cd
6C. nigraHa1murshic0–310.35 b0.22 c33.21 a0.54 c0.52 de
Ha2sapric peat31–360.24 bc0.38 b12.20 d0.65 bc0.32 e
2C. paniculataHa1murshic0–270.39 b0.08 e2.10 f0.70 b0.80 c
Ha2murshic27–420.28 bc0.19 cd1.56 g0.44 cd0.54 d
7C. pseudocyperusHa1murshic0–260.36 b0.14 d4.01 ef0.51 c0.31 e
Ha2sapric peat26–550.28 bc0.09 de1.56 g0.61 bc0.60 cd
7C. ripariaHa1murshic0–260.36 b0.14 d4.01 ef0.51 c0.31 e
Ha2sapric peat26–550.28 bc0.09 de1.56 g0.61 bc0.60 cd
8C. vulpinaAh1silt0–130.08 d0.19 cd23.1 b1.22 a3.67 a
Ah2silt13–320.18 c0.76 s5.18 e0.66 bc0.44 e
Csilty loam32–560.20 c0.29 bc20.1 c1.02 a1.77 b
Mean marked with different letters differ significantly at the level of α = 0.05.
Table 3. Total content of microelements in the examined soils. The same letters indicate a lack of statistically significant differences among species analysed according to Tukey’s tests.
No of SiteSpeciesGenetic Horizon
Acc, to
FAO-WRB
Soil MaterialDepth (cm)Microelements Content
(mg·kg−1)
CuZnCrNi
1C. acutiformisHa1sapric peat0–1612.01 b62.33 a12.88 e11.2 cd
Ha2sapric peat16–3110.1 c41.27 c15.41 d12.4 c
2C. appropinquataHa1murshic0–2711.2 b13.4 f9.97 f12.31 c
Ha2murshic27–4212.8 b12.04 g9.5 f15.41 b
3C. diandraHe1hemic peat0–2011.2 b5.63 i7.14 h10.21 d
He2hemic peat20–16010.21 c8.01 h6.32 h9.41 e
4C. distichaAsand0–325.87 de31.77 d6.98 h6.03 f
Bwsilt32–726.21 d22.9 e9.32 f5.04 g
5C. flavaHa1sapric peat0–159.05 c14.21 f8.01g h18.5 ab
Ha2sapric peat15–338.87 c56.32 ab23.14 b15.21 b
5C. lepidocarpaHa1sapric peat0–159.05 c14.21 f8.01g h18.5 ab
Ha2sapric peat15–338.87 c56.32 ab23.14 b15.21 b
6C. nigraHa1murshic0–3117.2 a39.82 c19.63 bc12.7 c
Ha2sapric peat31–364.01 e3.65 ij12.01 e6.57 f
2C. paniculataHa1murshic0–2711.2 b13.4 f9.97 f12.31 c
Ha2murshic27–4212.8 b12.04 g9.5 f15.41 b
7C. pseudocyperusHa1murshic0–266.23 d23.17 e27.85 a8.07 ef
Ha2sapric peat26–553.24 e2.97 j8.96 fg9.32 e
7C. ripariaHa1murshic0–266.23 d23.17 e27.85 a8.07 ef
Ha2sapric peat26–553.24 e2.97 j8.96 fg9.32 e
8C. vulpinaAh1silt0–134.12 e12.03 g15.18 d20.1 a
Ah2silt13–325.21 de22.33 e17.42 c11.4 cd
Csilty loam32–563.50 e21.14 e8.31 g10.6 d
Mean marked with different letters differ significantly at the level of α = 0.05.
Table 4. Ranges (min–max) and mean values (±SE) of carbon and nitrogen content and C–N in aboveground biomass of the Carex taxa. One way analysis of variance (ANOVA) were performed separately for C, N, and C–N. The same letters indicate a lack of statistically significant differences among species analysed according to Tukey’s a posteriori test (p < 0.05).
SpeciesC (g kg−1 DM)N (g kg−1 DM)C–N
Min–MaxMean (SE)Min–MaxMean (SE)Min–MaxMean (SE)
C. acutiformis434–438436.2 (0.4) G12.8–14.713.81 (0.27) EF29.7–34.331.68 (0.66) D
C. appropinquata429–433430.9 (0.4) H15.0–16.015.71 (0.10) D26.8–28.727.44 (0.18) E
C. diandra447–449447.7 (0.3) E20.0–21.320.66 (0.19) B21.0–22.421.68 (0.19) IJ
C. disticha464–468465.7 (0.4) A18.0–18.818.48 (0.09) C24.7–25.925.20 (0.13) FG
C. flava444–452447.5 (1.0) E11.8–13.912.59 (0.26) GH32.6–37.835.64 (0.65) BC
C. lepidocarpa453–458455.3 (0.7) C12.5–13.813.29 (0.15) FG33.1–36.634.30 (0.37) C
C. nigra459–463461.0 (0.5) B12.0–13.012.53 (0.13) GH35.4–38.536.83 (0.41) B
C. paniculata453–456455.4 (0.3) C19.1–20.519.93 (0.15) B22.2–23.922.86 (0.18) HI
C. pseudocyperus435–437435.8 (0.3) G9.9–10.610.13 (0.08) I41.0–44.043.03 (0.35) A
C. riparia441–444442.6 (0.3) F11.0–12.812.04 (0.19) H34.5–40.236.83 (0.60) B
C. vulpina440–442440.7 (0.3) F12.0–12.912.43 (0.10) H34.1–36.735.48 (0.28) BC
ANOVA P > F <0.0001 <0.0001 <0.0001
Table 5. Ranges (min–max) and mean values (±SE) of six major elements content in aboveground biomass of the Carex taxa. One way analysis of variance (ANOVA) were performed separately for each macroelement studied. The same letters indicate a lack of statistically significant differences among species analysed according to Tukey’s a posteriori test (p < 0.05).
SpeciesP (g kg−1 DM)K (g kg−1 DM)Ca (g kg−1 DM)Mg (g kg−1 DM)Na (g kg−1 DM)Si (g kg−1 DM)
Min–MaxMean (SE)Min–MaxMean (SE)Min–MaxMean (SE)Min–MaxMean (SE)Min–MaxMean (SE)Min–MaxMean (SE)
Optimal value3.0–4.016.0–20.06.0–9.02.0–3.01.2–2.5ca 9.0
C. acutiformis1.54–1.681.598 (0.019) J17.1–18.718.04 (0.20) H7.0–8.17.75 (0.12) B1.00–1.271.099 (0.038) L1.13–1.341.255 (0.022) I7.1–8.27.87 (0.13) ABC
C. appropinquata1.87–2.001.942 (0.016) GH15.0–16.715.75 (0.26) J7.4–8.17.70 (0.11) BC2.43–2.632.560 (0.023) B2.29–2.692.447 (0.046) D6.5–7.06.77 (0.07) EF
C. diandra1.87–1.931.900 (0.006) GHI19.6–20.520.10 (0.10) G7.1–7.67.34 (0.06) CD2.21–2.672.489 (0.073) B2.20–2.412.326 (0.027) DE7.2–7.77.46 (0.06) CD
C. disticha3.12–3.273.208 (0.015) D10.0–11.010.58(0.14) K4.4–4.84.58 (0.05) I3.12–3.243.171 (0.014) A4.33–4.494.422 (0.018) A6.0–7.26.60 (0.16) EF
C. flava2.28–2.372.317 (0.010) F23.5–24.924.22 (0.17) E6.4–6.66.54 (0.02) F2.18–2.292.219 (0.011) C1.29–1.351.313 (0.007) I6.5–6.66.56 (0.02) EF
C. lepidocarpa3.69–3.903.821 (0.026) B16.3–17.517.11 (0.11) I3.2–3.33.27 (0.02) J2.08–2.242.151 (0.019) CD2.20–2.312.262 (0.011) EF6.5–7.06.62 (0.06) EF
C. nigra1.76–1.871.801 (0.012) HI35.2–36.935.95 (0.16) A6.2–6.66.40 (0.05) FG2.49–2.642.589 (0.015) B1.00–1.171.090 (0.017) J6.1–6.66.48 (0.05) EF
C. paniculata2.59–2.742.676 (0.019) E22.9–23.323.12 (0.04) F6.0–6.26.12 (0.03) G1.19–1.431.332 (0.025) JK1.24–1.341.299 (0.011) I8.2–8.38.26 (0.01) A
C. pseudocyperus1.67–1.841.751 (0.021) IJ17.0–18.117.39 (0.16) HI7.7–8.27.97 (0.05) B2.09–2.562.259 (0.052) C2.03–2.422.212 (0.049) EF6.8–7.16.95 (0.03) DE
C. riparia3.00–4.113.628 (0.116) C17.0–18.017.56 (0.13) HI5.1–5.95.56 (0.12) H1.34–1.571.467 (0.024) HI1.59–1.761.691 (0.015) GH6.3–6.96.59 (0.07) EF
C. vulpina2.00–2.152.076 (0.018) G28.0–29.128.48 (0.16) B5.3–5.65.50 (0.03) H1.70–1.781.742 (0.011) EF1.57–1.701.630 (0.015) H6.5–7.16.85 (0.09) E
ANOVA P > F <0.0001 <0.0001 <0.0001 <0.0001 <0.0001 <0.0001
Table 6. Ranges (min–max) and mean values (±SE) of six trace elements content in aboveground biomass of the Carex taxa. One way analysis of variance (ANOVA) were performed separately for C, N, and C–N. The same letters indicate a lack of statistically significant differences among species analysed according to Tukey’s a posteriori test (p < 0.05).
Optimal Value
Species
Cu (mg kg−1 DM)Zn (mg kg−1 DM)Mn (mg kg−1 DM)Fe (mg kg−1 DM)Cr (mg kg−1 DM)Ni (mg kg−1 DM)
Min–MaxMean (SE) Min–MaxMean (SE) Min–MaxMean (SE) Min–MaxMean (SE) Min–MaxMean (SE) Min–MaxMean (SE)
ca 10.0ca 50.0ca 50.0ca 30.00.3–5.00.1–5.0
C. acutiformis5.0–6.05.36 (0.15)FG26.1–27.326.84 (0.14)H77.8–78.978.22 (0.15)O97.6–98.998.21 (0.16)M1.67–1.881.773 (0.031)B1.19–1.241.213 (0.007)E
C. appropinquata6.6–6.96.74 (0.04)E24.7–26.125.22 (0.18)IJ86.3–87.286.87 (0.09)N205.3–208.0206.67 (0.37)F0.65–0.690.667 (0.005)LM0.24–0.280.252 (0.005)I
C. diandra8.4–8.88.62 (0.05)D38.1–39.138.51 (0.16)C88.8–90.289.30 (0.18)N76.0–80.077.37 (0.47)N0.49–0.530.505 (0.005)N0.33–0.390.355 (0.007)HI
C. disticha6.3–7.06.54 (0.10)E25.2–27.126.49 (0.21)H419.7–424.2421.38 (0.69)A131.0–132.1131.44 (0.15)K0.56–0.660.609 (0.012)M0.05–0.050.050 (0.000)J
C. flava6.3–6.56.45 (0.02)E28.9–29.329.04 (0.05)FG95.0–99.097.19 (0.47)M95.0–96.895.83 (0.19)M0.68–0.780.714 (0.010)JKL2.67–2.882.776 (0.025)B
C. lepidocarpa8.6–8.98.77 (0.04)D32.8–33.633.08 (0.09)E100.2–103.9102.14 (0.50)L143.0–147.0145.13 (0.52)J0.76–0.810.786 (0.005)JK0.40–0.490.444 (0.010)H
C. nigra10.0–10.610.25 (0.08)B25.2–26.025.72 (0.10)HI181.2–185.0183.12 (0.52)C339.6–347.0343.89 (1.07)C0.77–0.830.796 (0.006)J0.83–0.870.847 (0.005)F
C. paniculata2.2–4.33.99 (0.23)H27.5–29.128.25 (0.22)G72.9–75.174.19 (0.25)P151.2–156.5153.65 (0.69)I1.49–1.551.526 (0.006)D0.20–0.250.226 (0.006)IJ
C.pseudocyperus10.0–11.010.37 (0.14)B34.0–35.134.29 (0.13)D170.0–177.9174.37 (1.12)E422.0–437.1429.32 (2.12)B1.98–2.312.090 (0.038)A1.49–1.691.558 (0.021)D
C. riparia5.0–5.45.16 (0.06)G27.1–29.028.13 (0.23)G95.9–100.198.24 (0.59)M118.9–121.0119.61 (0.27)L1.67–1.881.742 (0.022)B1.76–2.011.890 (0.030)C
C. vulpina12.0–13.012.44 (0.13)A41.8–42.942.24 (0.15)B164.0–167.5166.05 (0.51)F193.7–198.0195.52 (0.57)G0.68–0.770.707 (0.008)KL3.25–3.563.376 (0.036)A
ANOVA P > F <0.0001 <0.0001 <0.0001 <0.0001 <0.0001 <0.0001
Table 7. Proportion (ratio) of the selected elements.
Optimal Value
Species
K–NaK–Ca + MgCa–P
C. acutiformis14:12.04.8:1
C. appropinquata6:11.53.9:1
C. diandra9:12.03.8:1
C. disticha2:11.41.4:1
C. flava19:13.12.8:1
C. lepidocarpa7:13.10.86:1
C. nigra32:14.23.6:1
C. paniculata18:13.12.3:1
C. pseudocyperus8:11.74.4:1
C. riparia10:12.51.6:1
C. vulpina18:13.92.6:1
Publisher’s Note: MDPI stays neutral with regard to jurisdictional claims in published maps and institutional affiliations.

