Article

Key Factors Influencing the Achievement of Climate Neutrality Targets in the Manufacturing Industry: LMDI Decomposition Analysis

by
Kristiāna Dolge
* and
Dagnija Blumberga
Institute of Energy Systems and Environment, Faculty of Electrical and Environmental Engineering, Riga Technical University, LV-1048 Riga, Latvia
*
Author to whom correspondence should be addressed.
Energies 2021, 14(23), 8006; https://doi.org/10.3390/en14238006
Submission received: 9 November 2021 / Revised: 25 November 2021 / Accepted: 28 November 2021 / Published: 30 November 2021
(This article belongs to the Section A: Sustainable Energy)

Abstract

:
The manufacturing industry is often caught in the sustainability dilemma between economic growth targets and climate action plans. In this study, a Log-Mean Divisia Index (LMDI) decomposition analysis is applied to investigate how the amount of industrial energy-related CO2 emissions in Latvia has changed in the period from 1995 to 2019. The change in aggregate energy-related CO2 emissions in manufacturing industries is measured by five different factors: the industrial activity effect, structural change effect, energy intensity effect, fuel mix effect, and emission intensity effect. The decomposition analysis results showed that while there has been significant improvement in energy efficiency and decarbonization measures in industry, in recent years, the impact of the improvements has been largely offset by increased industrial activity in energy-intensive sectors such as wood processing and non-metallic mineral production. The results show that energy efficiency measures in industry contribute most to reducing carbon emissions. In the future, additional policies are needed to accelerate the deployment of clean energy and energy efficiency technologies.

1. Introduction

The 2021 Emissions Gap Report from UN states that current targets in national climate action plans are insufficient to meet the commitments of the Paris Agreement. In fact, it is estimated that at the current rate of improvement, global temperatures will rise by 2.7 °C by the end of the century, well above the 2 °C target, and would, therefore, cause irreversible damage to the Earth’s climate. To limit the rate of global warming and keep the temperature increase below 1.5 °C, global yearly GHG emissions must be reduced by at least 50% by 2030 [1].
Industry, and in particular carbon- and energy-intensive manufacturing, will play a crucial role in meeting global climate change mitigation targets. Since energy-intensive industries and power plants account for nearly half of world’s total greenhouse gas emissions, they are key cornerstones in achieving net-zero carbon emission goals [2]. The constant battle between economic growth targets and climate commitments in industry makes it particularly difficult to achieve long-term sustainability in industrial companies [3,4].
The latest study assessing progress in reducing carbon emissions by European industry shows alarming results. A study by [2] analyzed CO2 emissions data from the European Union Emissions Trading System (EU ETS) for the 13 years of operation of the program for the United Kingdom, Spain, France, Italy, and Germany, which are the largest European economies. The results show that the largest European manufacturing sectors have not yet achieved significant reductions in carbon emissions. Only a few plants have managed to achieve gradual decarbonization and reduce emissions, while a large number of companies have increased their annual emission levels. The study’s findings make it urgent for European manufacturing companies to adopt alternative technologies to restructure the energy mix currently used towards cleaner production. The authors argue that additional policies are needed to meet the binding targets of achieving net zero emissions by 2050. In addition, more in-depth research is needed to examine the key drivers of carbon emissions growth and barriers to the implementation of decarbonization measures by manufacturing firms [2].
Research on energy efficiency and decarbonization in the industrial sector is very complex due to the different production processes in the various industrial subsectors and the importance of the energy sources used for energy supply and as production feedstock. Due to this heterogeneity and the multitude of factors to be taken into account, it is difficult to make a sufficient assessment of the key factors affecting changes in the sector’s energy consumption and carbon emissions [5]. Due to the fragmented nature of industry, most studies on energy efficiency and decarbonization in industry tend to narrowly focus only on a sub-sector of industry, and therefore, ignore the whole industrial energy system, which does not allow for a comprehensive assessment of the industrial pathway towards adaptation to low-carbon energy systems [6]. For industry to meet ambitious net-zero emissions targets over the next three decades, deep decarbonization is required at all levels of industrial processes and economic activity. Therefore, an integrated examination of industrial carbon emissions across all sub-sectors is crucial to shape more effective future climate policy [2].
This study aims to fill the research gap in the assessment of mitigation progress in carbon emissions from the manufacturing sector in the European Union. This study takes the Latvian manufacturing industry as a case study for assessing changes in industrial emissions using Log-Mean Divisia Index (LMDI) methodology. LMDI is applied to study the changes in energy-related carbon emissions of ten different manufacturing sub-sectors and their cumulative impact on the overall decarbonization level of Latvian industry. It allows for a comprehensive and complete assessment of industrial carbon emissions and draws relevant conclusions for a sector as a whole, leading to relevant results that can be used by governments for more efficient climate and energy policymaking. Latvian industrial energy efficiency and climate policy has undergone significant changes over the last decade [7]. Fiscal instruments, subsidies, and mandatory energy efficiency audits and monitoring have been imposed on industrial companies to promote and support decarbonization, energy efficiency, and the transition to more sustainable energy systems in manufacturing companies in order to move closer to climate neutrality goals [8]. Therefore, it is necessary to assess what progress Latvian industry has made in achieving the carbon reduction targets and whether any improvement can be observed as a result of the implemented policies. In Latvia, there is no research that uses LMDI decomposition analysis to decompose changes in energy-related CO2 emissions from industry. Therefore, this research will make an important contribution to the general knowledge generation in the field of energy policy.

2. Literature Review

2.1. Methods for Analyzing Changes in CO2 Emissions in the Manufacturing Industry

A lot of research has been done to analyze the factors affecting energy consumption and carbon emissions in different sectors of the economy. However, there is no consensus among scholars on a universal method for in-depth assessment of carbon emission changes in manufacturing industries.
A study by [9] developed an econometric model and analyzes different pathways of industrial carbon emissions in China through regression analysis and Monte Carlo simulation [9]. Econometric methodology is also used by [10], who built a random effects panel model to study the relationship between climate policy goals and manufacturing industry investment in energy efficiency [10]. A novel econometric method was introduced by [11], who used second-generation tests to investigate how innovation, export diversification, and fiscal decentralization affect the achievement of climate neutrality goals [11]. An advanced dual-channel supply chain network (DCSCN) equilibrium method was constructed by [12], which analyzed the effectiveness of a progressive carbon tax policy in the manufacturing industry [12].
When analyzing changes in energy intensity and carbon emissions in various sectors of the economy [13], including manufacturing industry, decomposition analysis is one of the most commonly used methods, both by scientists and international regulatory organizations, such as the International Energy Agency (IEA), European Commission, United Nations, and others [14].

2.2. Theoretical Foundation of Index Decomposition Analysis (IDA) Methods

The use of the index decomposition analysis method (IDA) has increased in energy policy and sustainability research since the 1980s, when its theoretical framework began to appear in energy studies around the world [15,16]. The method allows to measure the impact of the main factors influencing changes either in total energy consumption [17] or in the emissions [18] produced by specific sectors [16]. The method has gained its recognition in energy policy research due to several advantageous features, such as the availability of data to build the model, the ease of interpretation, and comparison of the results [19].
The methods of IDA are generally divided into two main approaches, namely the methods of Laspeyres IDA and Divisia IDA [19,20]. The main difference between the methods lies in their basic assumptions. The Laspeyres approach considers that when one aggregate value changes, other factors remain unchanged. Moreover, the Laspeyres framework is expressed as a percentage change. The Divisia approach, on the other hand, considers the change in factors over time and is expressed as logarithmic change. While the Laspeyres approach is easier to comprehend, it lacks precision and the representation of real change. The Divisia approach, on the other hand, is considered more scientific and reasonable [15,19].
The Divisia IDA method is further subdivided into the Arithmetic Mean Divisia Index (AMDI) method or the Logarithmic Mean Divisia Index (LMDI) method. The disadvantage of the AMDI method, which is based on the arithmetic mean, is that it produces a large residual value and cannot handle zero values. In contrast, the LMDI method that is based on logarithmic mean provides a perfect decomposition and provides techniques for dealing with zero values in the dataset. Furthermore, the LMDI method can be further divided into an additive and a multiplicative approach. The additive approach measures the change in quantitative volume, while the multiplicative approach measures the change as a proportion [15,19].

2.3. LMDI Decomposition Analysis in the Manufacturing Industry

Scientists around the world have conducted extensive research using the LMDI approach to conduct ex post analyses for changes in carbon dioxide emissions from global economies [15,16]. However, in recent years, only a few papers have been found that focus specifically on the manufacturing industry.
A study by [21] conducted a multisectoral decomposition analysis of CO2 emissions in China’s 22 economic sectors. The emission intensity effect was the main compensator for the growth of embodied carbon emissions in the sectors analyzed. The authors argued that international exports, which are strongly linked to economic growth, have the greatest impact on the increase in carbon emissions in the manufacturing sector. Therefore, effective policy measures should be taken to reconcile the rapid growth of exports with environmental sustainability in the long run [21].
A study by [22] combined Log-mean Divisia Index (LMDI) decomposition analysis with two-stage data envelope analysis (DEA) to analyze the drivers of change in energy consumption and carbon emissions of four sectors of BRI (Belt and Road Initiative) countries, namely (1) agriculture, fisheries, and forestry; (2) manufacturing; (3) transport; (4) other sectors. To measure changes in energy efficiency, indicators such as energy intensity, economic structure, labor productivity, and labor market were used as input parameters in DEA. To measure changes in CO2 emissions, indicators such as emission intensity, energy structure, population, and energy consumption per number of inhabitants were used in DEA. The results show that energy intensity and labor market productivity have the largest impact on the increase in total energy consumption, while emission intensity and population trends influence most changes in aggregate CO2 emissions. The study concludes that economic growth and activity factors have a significant impact on both energy consumption and the CO2 emissions generated. Developed countries have higher levels of eco-efficiency, but should focus more on improving the environmental sustainability of the manufacturing sector [22].
Another study [23] used the LMDI decomposition of the multiplicative approach to analyze the changes in CO2 emissions and carbon intensity in the Thai manufacturing sector over a 12-year period. The results showed that while the structural shift to manufacturing sectors with lower carbon intensity contributed significantly to the reduction of CO2 emissions, increasing energy intensity and production volume increased both total emissions and emission intensity in manufacturing. The authors pointed out that more stringent policy measures should be taken to reduce energy intensity in Thailand’s manufacturing sector. Otherwise, the economic benefits of industrial growth will be offset by a larger increase in emissions generated, with negative implications for long-term sustainability [23].
The importance of energy efficiency in manufacturing sectors was highlighted in a study by [24]. The authors applied LMDI decomposition analysis to examine whether national policies aimed at reducing emissions intensity in industry have led to reductions in CO2 emissions in 28 subsectors of China’s manufacturing industry over a 15-year period. The results show that both the effect of industrial activity and the effect of energy intensity are the main drivers of the increase in CO2 emissions. It is important to consider sectoral heterogeneity, as larger reductions in CO2 emissions can be achieved through tailored policies targeting high carbon intensity sectors. The authors recommend that governments increase investment in industrial technology development by introducing policy instruments that encourage manufacturing firms to adopt energy-saving measures, as energy efficiency is the most important factor in reducing overall emissions in industry [24].
A study by [25] came to similar conclusions. The study focused on examining changes in CO2 emissions from six highly energy-intensive sectors in China, which together consume 90% of total industrial energy consumption. The results of the LMDI decomposition analysis show that over the period from 1986 to 2013, the rapid increase in industrial activity was the main driver of the increase in carbon emissions. Energy efficiency is the largest contributor to the decline in CO2 emissions, with the chemical and non-metal manufacturing subsectors being particularly affected. Compared to other factors, structural changes and changes in the energy mix had a relatively smaller impact on the changes in CO2 emissions in industry. The authors put forward number of policy recommendations to reduce both total industrial energy consumption and the CO2 emissions generated. It is assumed that promoting industrial agglomeration will lead to large energy savings. In the past, mergers and acquisitions of large industrial companies producing steel and iron products have led to more efficient large-scale production. Therefore, the consolidation of energy-intensive companies should be encouraged in the future in order to achieve the climate targets in the manufacturing industry. In addition, the authors argue that technological advancement in this industry should be significantly accelerated. Although the results showed significant improvements in reducing the overall energy intensity of manufacturing, the pace of improvement was not fast enough to compensate the impact of industrial activity that increased emissions. Therefore, more incentives are needed for manufacturing companies to adapt advanced technological solutions that will lead to significantly higher energy savings. Moreover, the study concludes that governments should use fiscal instruments to encourage the restructuring of the energy mix of energy-intensive industries that are currently dependent on high fossil fuel consumption. Clean energy should be made more attractive by using policy instruments such as taxes or subsidies to encourage the transition to low-carbon systems in companies [25].
A study by [26] applied extended LMDI decomposition analysis to study how CO2 emissions in China’s manufacturing industry have changed in the period from 1995 to 2015. Fifteen manufacturing subsectors are included in the decomposition model that represents the overall structure of industry. The changes in total CO2 emissions of the manufacturing industry are decomposed by eight different indicators, such as CO2 emission factor of a particular fuel, energy mix, total energy consumption, production volume per unit of R&D expense, R&D investment per level of fixed asset investment, level of fixed assets, and share in value added. The authors conclude that sectors with high emissions and high energy intensity, such as the production of ferrous metals, chemicals, and non-metallic minerals, account for the largest share of total industrial emissions. The authors argued that the differences between subsectors have a significant impact on the achievement of overall industrial climate targets and should, therefore, be taken into account by policy makers. The increase in industrial activity over the period studied was the main factor that increased carbon emissions, while the effect of energy intensity was the main offsetting factor that decreased emissions. The results show that investment intensity was also an important factor in the increase in carbon emissions. However, investment in research and development played a crucial role in reducing CO2 emissions in the manufacturing sector [26].
A research paper by [5] used the LMDI decomposition to analyze how technological progress and economic growth have influenced changes in greenhouse gas (GHG) emissions in Canadian industry from 1990 to 2014. The study found that the shift to less carbon-intensive industries and cleaner energy has contributed greatly to the reduction in GHG emissions. However, the effect of industrial activity was the main dominant effect driving the overall increase in GHG emissions in industry during the period analyzed. Based on the results of the decomposition analysis, the authors set out three policy recommendations, each targeting the main contributors to LMDI. First, eco-efficiency should be significantly promoted, and therefore, more aggressive policies should be adopted that promote the transition to carbon-neutral energy systems while supporting stable economic growth. Second, industry-specific requirements that set concrete benchmarks for energy and emissions intensity are necessary to promote energy efficiency in industry. Third, the government should continue to support policies that promote clean energy by phasing out fossil fuels and carbon-intensive energy sources such as coal in power generation [5].
To summarize, a study by [27] was one of the first to propose and formulate a decomposition analysis model for industrial energy efficiency and decarbonization analysis. This study applied the LMDI method and determined that changes in the total industrial energy consumption are measured by three main factors—the activity effect, structure effect, and energy intensity effect. To assess changes in industrial carbo emissions two additional factors are added to energy consumption decomposition analysis. As a result, changes in industrial carbon emissions are measured by five main factors—the activity effect, structure effect, energy intensity effect, energy mix effect, and emission factor effect [27]. Numerous studies have followed the approach introduced by [27] to decompose industrial carbon emissions—[28] for China’s industrial sector, [29] for the Korean manufacturing sector, [30] for the Turkish manufacturing industry, [5] for the Canadian industrial sector, and [31] for the Mexican industry. However, no such study has yet been performed in Latvia. Given its sound theoretical basis and proven practical applicability, as well as the in-depth analysis and valuable findings found in previous studies applied in other countries, the model developed in this study is based on the framework introduced by [27], which uses the same factors to decompose energy-related carbon emissions from industry.

3. Methodology

Total energy-related CO2 emissions in the manufacturing industry is determined as a sum of energy-related CO2 emissions of each industrial sub-sector. The manufacturing sub-sectors are selected according to the classification nomenclature NACE Rev. 2 and grouped according to the statistical subdivision of the industrial sector [32]. Energy-related CO2 emissions in industry are decomposed according to Equation (1). The following steps for decomposing industrial energy-related CO2 emissions are based on the equations and procedures demonstrated in the studies by [5,27]. The LMDI decomposition analysis indicators for industrial energy-related CO2 emissions are summarized in Table 1.
C = i j C i j   =   i j Q Q i Q E i   Q i E i j   E i C i j   E i j = i j Q S i I i F i j M i j
where:
  • C—total aggregated energy-related CO2 emissions;
  • Q—total produced volumes expressed as total value added;
  • E—total energy consumption;
  • Si—industrial production activity;
  • Ii—energy intensity;
  • Fij—fuel mix;
  • Mij—emission factor.
A subscript i denotes the representative value of a subsector; the absence of a subscript i represents the total value of the industry. A subscript j denotes the type of energy product in the total energy balance, e.g., natural gas, electricity, biofuels, and others. Si (=Qi/Q) and Ii (=Ei/Qi) are the levels of production activity and energy intensity of each industrial subsector, and thus, they represent the structural and energy intensity effects. Fij (=Eij/Ei) represents the fuel mix of a sector and Mij (=Cij/Eij) the emission factor of a particular fuel in the overall energy balance.
Since change in the aggregate level of C changes from initial year 0 to year T, then generated CO2 emissions in a base year E0 = i Q 0 S i 0 I i 0 F i j 0 M i j 0 and ET = i Q T S i T I i T F i j T M i j T . The effect of each component is determined using LMDI I additive decomposition analysis technique, according to Equation (2), which was chosen for its ability to measure the absolute change in CO2 emissions and the ease of interpreting the results:
C = C T C 0   =   C a c t   +   C s t r   +   C e n i   +   C f u e l   +   C e m i
where:
  • act—effect from changes in industrial activity;
  • str—effect from changes in structure;
  • eni—effect from changes in energy intensity;
  • fuel—effect from changes in fuel mix;
  • emi—effect from changes in emission intensity.
Each effect is further expressed in Equations (3)–(7):
C a k t = i j C i j T C i j 0 l n C i j T l n C i j T l n Q T Q 0
C s t r = i j C i j T C i j 0 l n C i j T l n C i j T l n S i T S i 0
C e n i = i j C i j T C i j 0 l n C i j T l n C i j T l n I i T I i 0
C f u e l = i j C i j T C i j 0 l n C i j T l n C i j T l n F i j T F i j 0
C e m i = i j C i j T C i j 0 l n C i j T l n C i j T l n M i j T M i j 0
where:
  • E T —energy consumption in future year T;
  • E 0 —energy consumption in initial year.
Data utilized in this study were collected from the Eurostat and Central Statistical Bureau of Latvia (CSB) databases [33,34,35]. For industrial energy consumption, data on the final consumption of each industrial subsector were used. Chain-linked values of value-added data were used in order to consider possible variations in the data due to price changes affecting the representation of industrial output produced. Data on emission factors for utilized fuels were taken from IPCC guidelines for national greenhouse gas inventories on default emission factors for stationary combustion in manufacturing industries and construction [36]. Emission factors were converted from TJ to MWh, using the conversion factor of 277.78. Table 2 summarizes the emission factors of fuels used in the decomposition analysis.
The data for CO2 emission factor for electricity produced in Latvia were collected from the European Environment Agency [37]. The CO2 emission factor for heat produced in heat plants and combined heat and power plants in Latvia was calculated according to the Equation (8), which was obtained from Cabinet Regulation No. 42. of the Republic of Latvia “Methodology for Calculating Greenhouse Gas Emissions” [38]:
C h e a t = Q t h   f o s s i l   · C f u e l Q t h
where:
  • C h e a t —CO2 emission factor for heat produced in heat plants and combined heat and power plants in Latvia, tCO2/MWh;
  • Q t h   f o s s i l —amount of produced heat in heat and CHP plants in Latvia using fossil fuels;
  • C f u e l —emission factor of the utilized fuel according to the Appendix 1 of the Cabinet Regulation No. 42.
The data for the calculations were obtained from the Central Statistical Bureau of Latvia [39,40]. Data on produced heat in heat and CHP plants in Latvia and utilized fuel included the values for the time period from 2012 to 2019. Since the scope of the decomposition analysis included the historical data analysis for the time period from 1995 to 2019, the emission factor for heat for the years from 1995 to 2012 was assumed to be equal to the emission factor of natural gas, taking the value 0.202 tCO2/MWh. This should be considered as a limitation of the study; however, it has a low impact on the overall results.

4. Results and Discussion

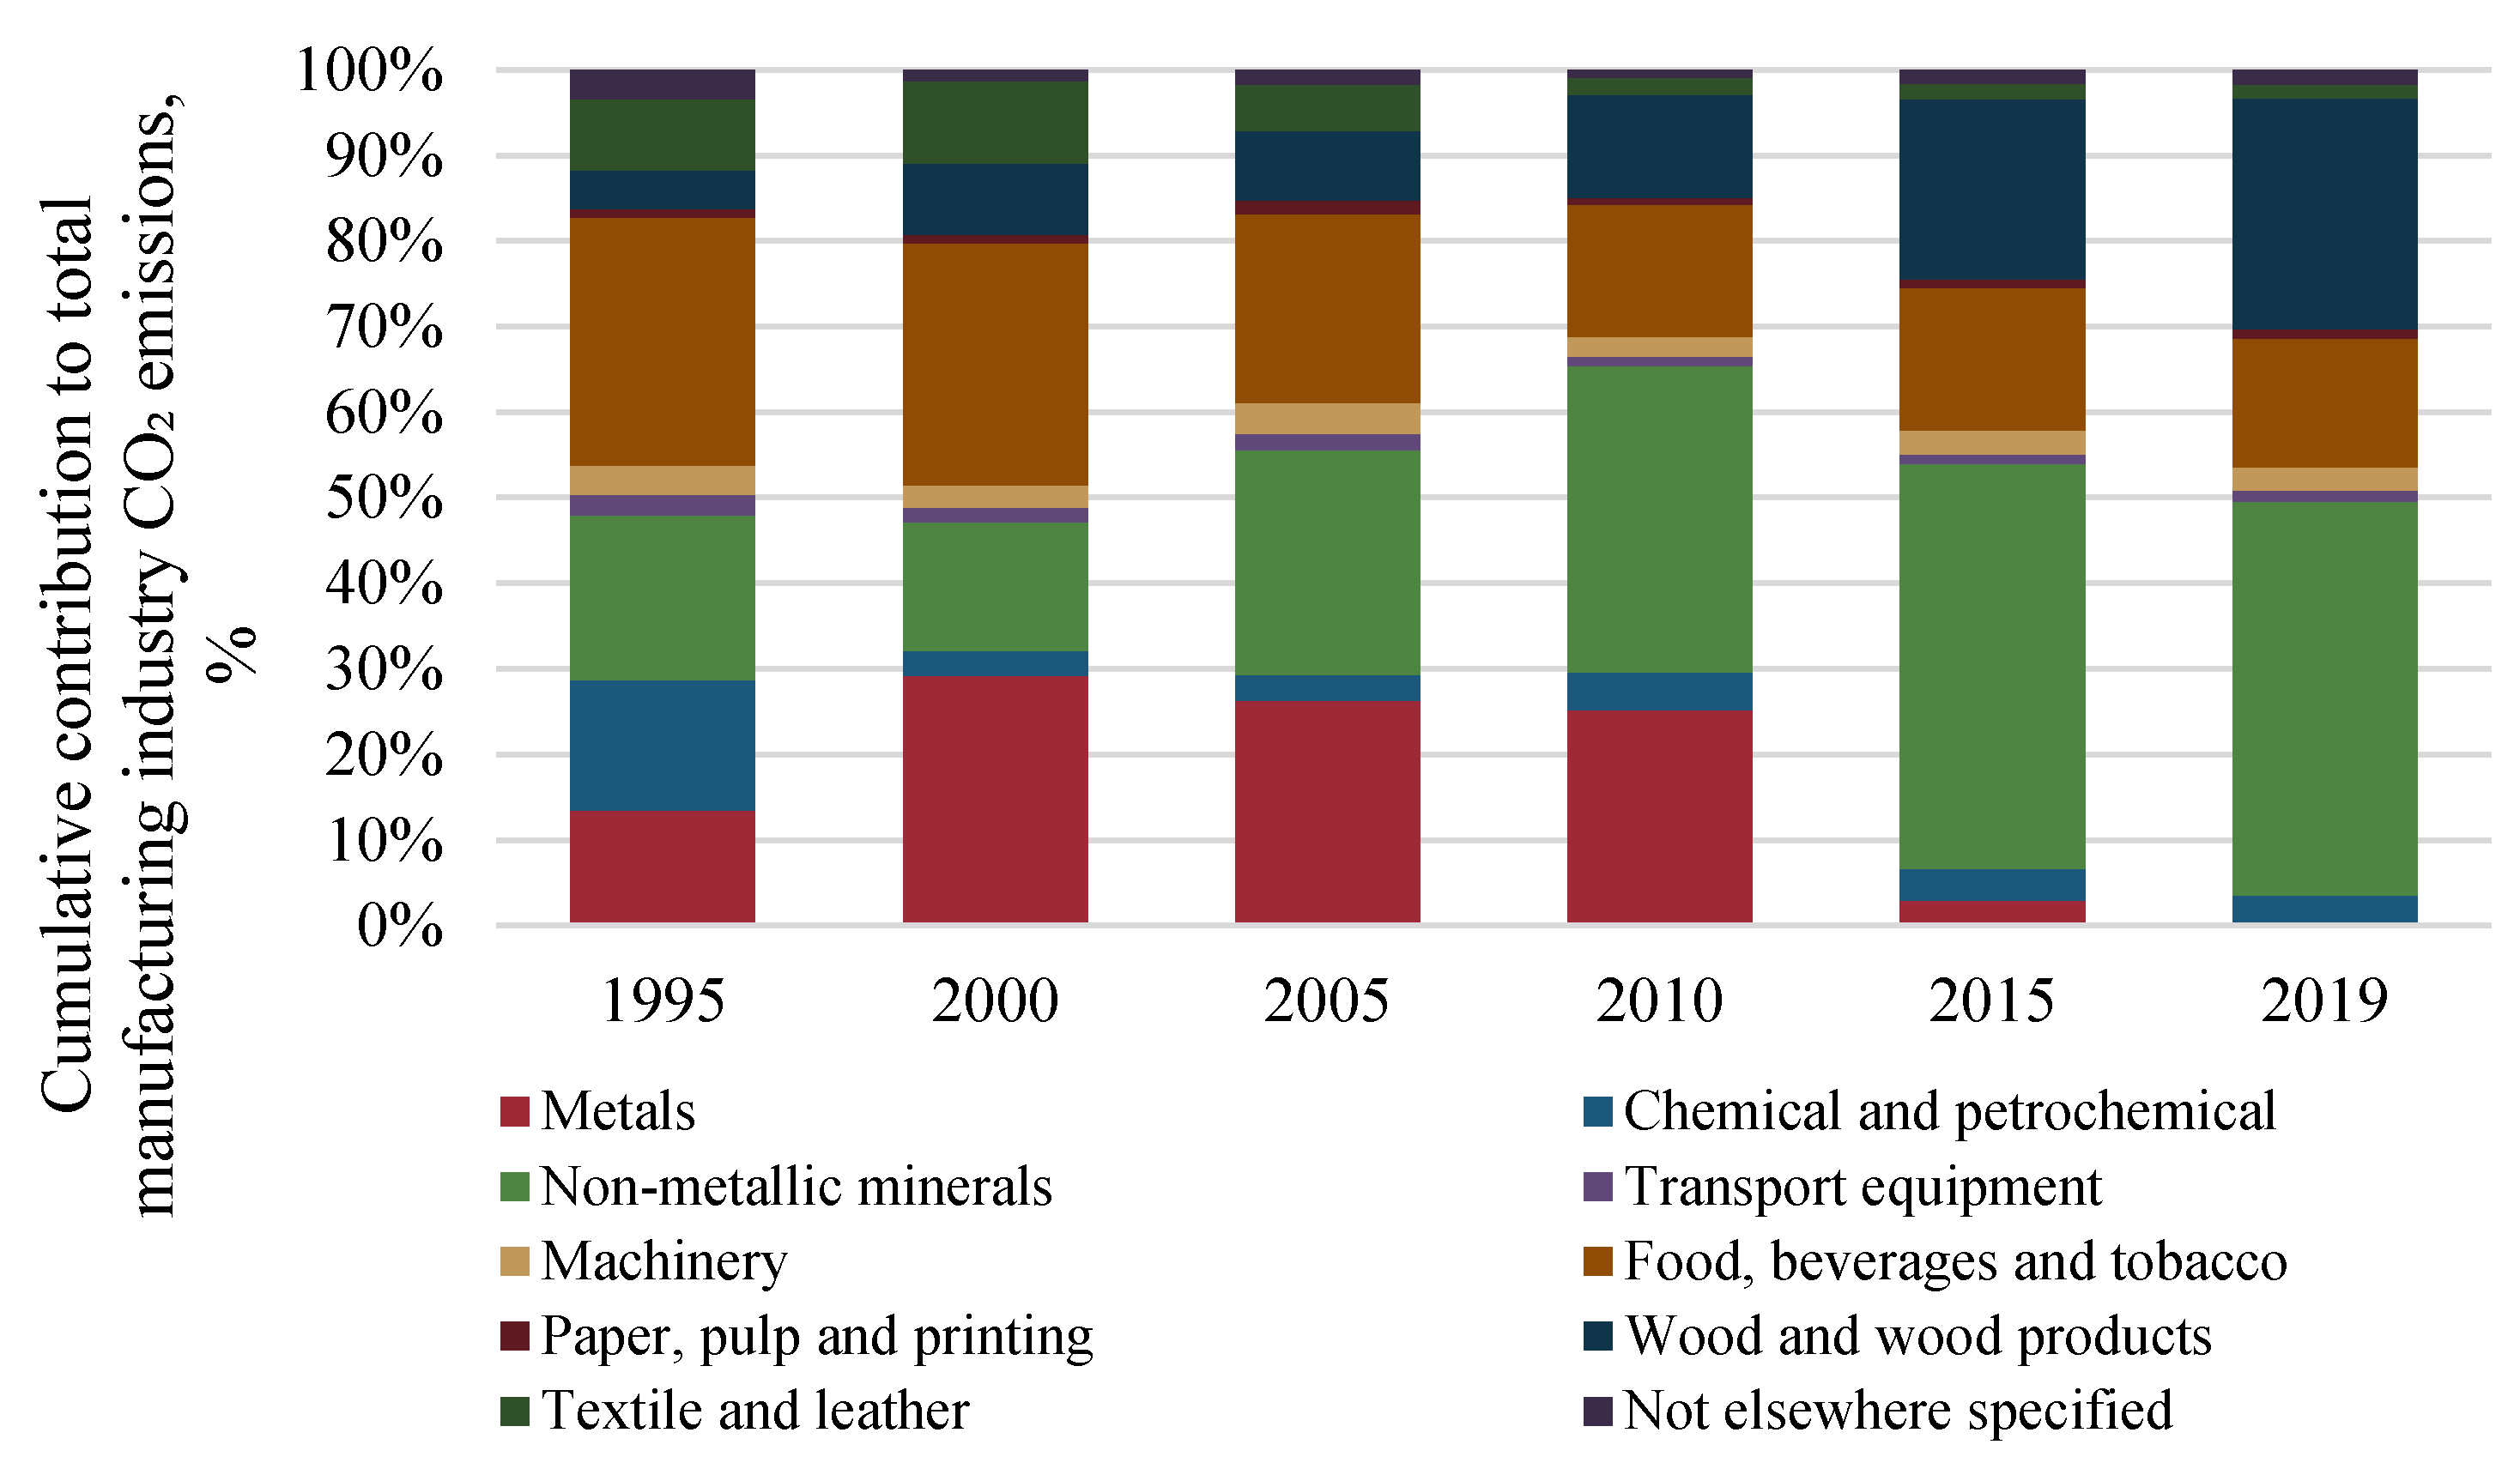
4.1. Manufacturing Industry Description

4.1.1. Total Energy Consumption and CO2 Emissions in Latvian Manufacturing Industry

A historical data analysis of the Latvian manufacturing sector shows that in the period from 1995 to 2019, the total CO2 emissions in the industry decreased by 41%. Figure 1 illustrates the aggregated values of total energy consumption and CO2 emissions of the Latvian manufacturing industry. However, while the overall trend is downward, the total CO2 emissions have fluctuated over the years. The largest decreases were observed in the period from 1995 to 2000. A large drop in the period is explained by the significant decrease in the consumption of coal (−11%), peat (−100%), oil and petroleum products (−39%), and heat (−67%) in 2000 compared to 1995 levels. The decrease in fossil fuel consumption was offset by the increase in renewable energy and biofuels, which increased by 16% over this period. The second largest decrease in CO2 emissions was observed during the period of the global financial crisis, when total CO2 emissions decreased by 21% in 2009 compared to 2008. However, after the financial crisis, CO2 emissions increased back to the original level and then gradually decreased on an annual basis until 2017. CO2 emissions data in recent years show that a significant increase in CO2 emissions was observed in 2018, when emissions increased by 31% compared to 2017. Therefore, more attention should be paid to investigating the possible sustainability and energy efficiency gaps in the Latvian manufacturing industry in recent years.
Regarding the distribution of energy consumption between sectors, it can be noted that a significant structural change has taken place in this sector in the last decade. The manufacturing sector in Latvia experienced a significant structural change in the period from 2000 to 2019, as after the bankruptcy of the largest metal producer, the share of iron and steel in total energy consumption decreased from 25% in 2000 to 0.13% in 2019. However, a huge increase was achieved by the wood and wood products sector (44 percentage points) and the non-metallic minerals sector (8 percentage points). In 2019, the three largest manufacturing sectors in Latvia—wood processing (5676 GWh), non-metallic minerals production (1888 GWh) and food processing (907 GWh)—consumed 89% of the total manufacturing energy consumption.
There are differences between the sectoral contributions to total energy consumption and the total CO2 emissions generated. Figure 2 shows the cumulative contribution to the total CO2 emissions of the manufacturing industry. The non-metallic minerals production sector produced the highest amount of total CO2 emissions in 2019, accounting for 46% of the total CO2 emissions generated by the Latvian manufacturing sector. The second largest emitter was the wood processing sector, which produced 27% of the total CO2 emissions of the manufacturing sector in 2019, followed by the food processing sector, which produced 15% of the total CO2 emissions of the manufacturing sector. The impact of structural change in the period from 2010 to 2015 was also observed for the CO2 emission distribution of the Latvian manufacturing sector. In 2010, the metal processing sector in Latvia accounted for a quarter (25%) of total emissions, while in 2015, it accounted for only 3%. A sharp decrease in the share of the metal sector in total CO2 emissions changed the overall CO2 emission distribution between sectors in the following years. The highest increase in the share of CO2 emissions was observed in the wood processing (+15 pp and non-metallic mineral production (+10 pp) sectors.
The amount of CO2 emissions generated by the sector is highly dependent on the overall fuel mix used for combustion and the overall production processes of the sector. Figure 3 shows the fuel mix for each manufacturing subsector and presents the average values for the period 2015–2019. Significant differences between sectors can be observed. Part of the explanation behind higher generated CO2 emissions by the non-metallic mineral sector can be explained by the fact that the sector consumes a considerable amount of solid fossil fuels, non-renewable waste, and natural gas, which each individually possess high emission factors. The wood processing sector stands out with the highest share of renewables, where biomass accounts for 80% of the total consumed energy products. The advantage of wood processing sector is that one of the main production byproducts are wood residues and wood chips, which can later be utilized for the combustion process. The metals sector (59%), textile and leather sector (54%), paper, pulp, and printing sector (45%), food processing sector (41%), and chemicals and petrochemical sector (38%) each consume considerable amounts of natural gas accounting for a substantial share of the subsector’s total energy mix. The transport equipment manufacturing sector stands out as the most electricity-intensive compared with other subsectors. Electricity accounts for 57% of the total energy consumption in the transport equipment manufacturing sector. High electricity consumption is also observed in the paper, pulp, and printing sector (46%) and machinery sector (47%) where electricity accounts for almost half of the total energy consumption in the representative sectors.

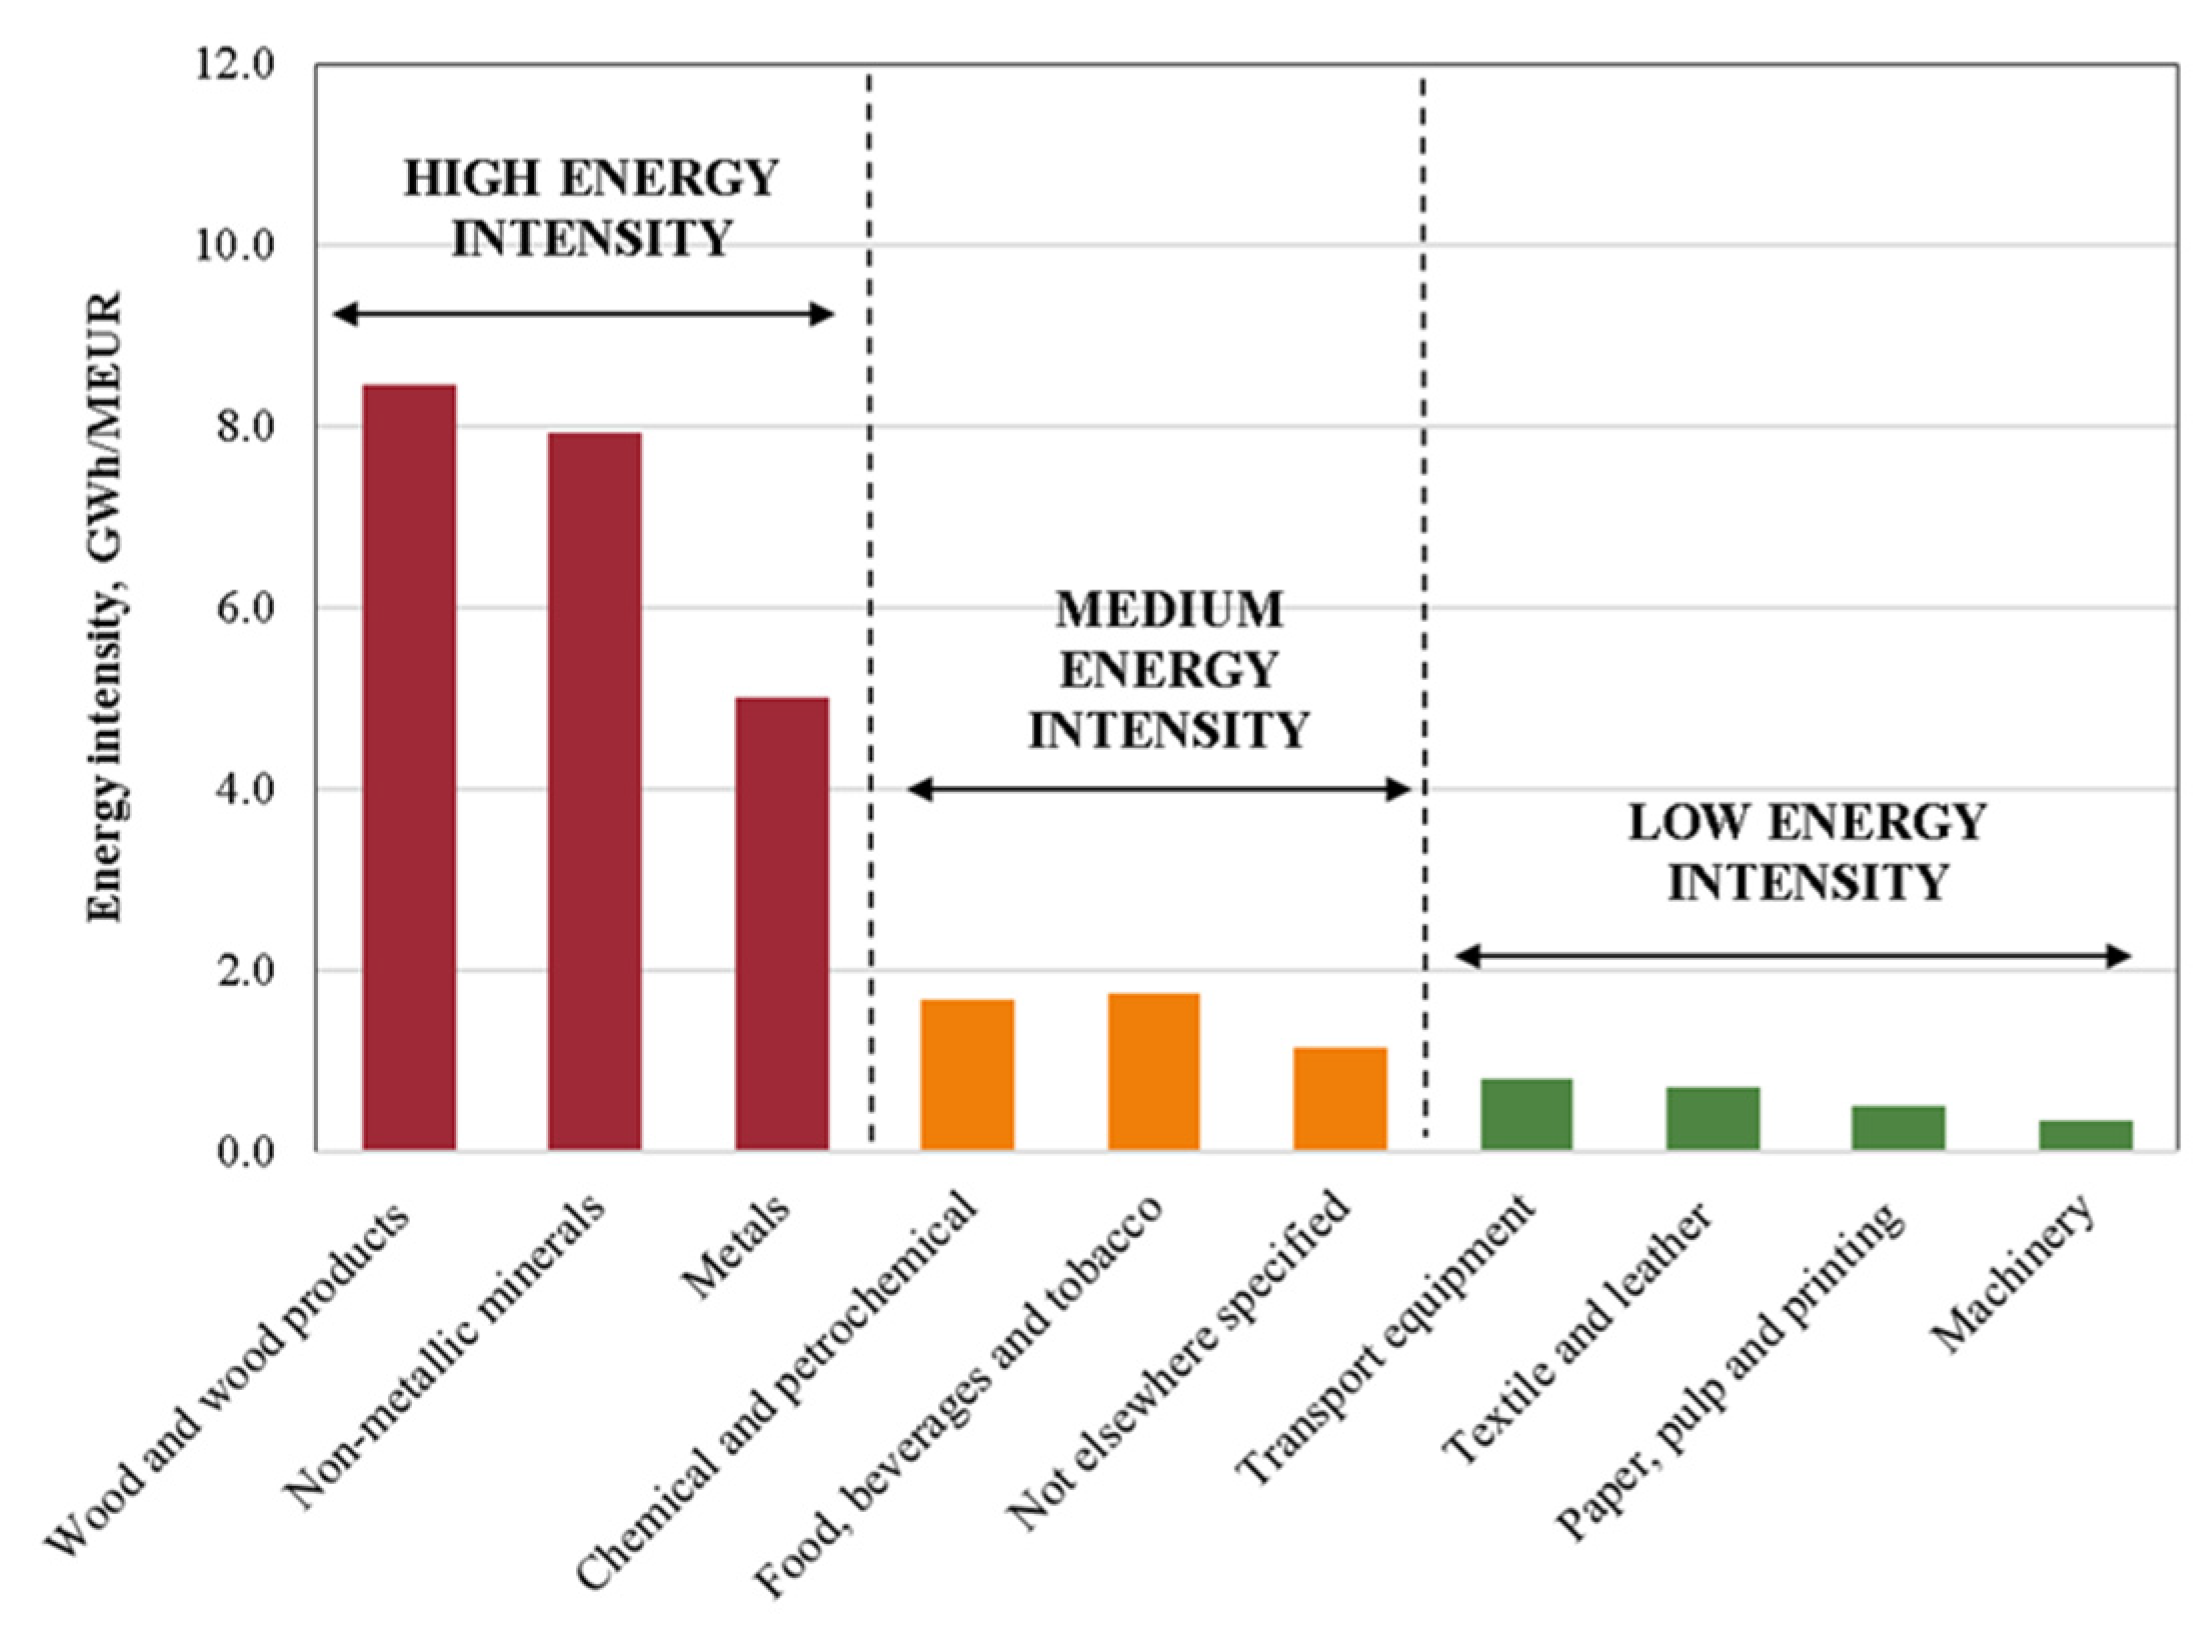
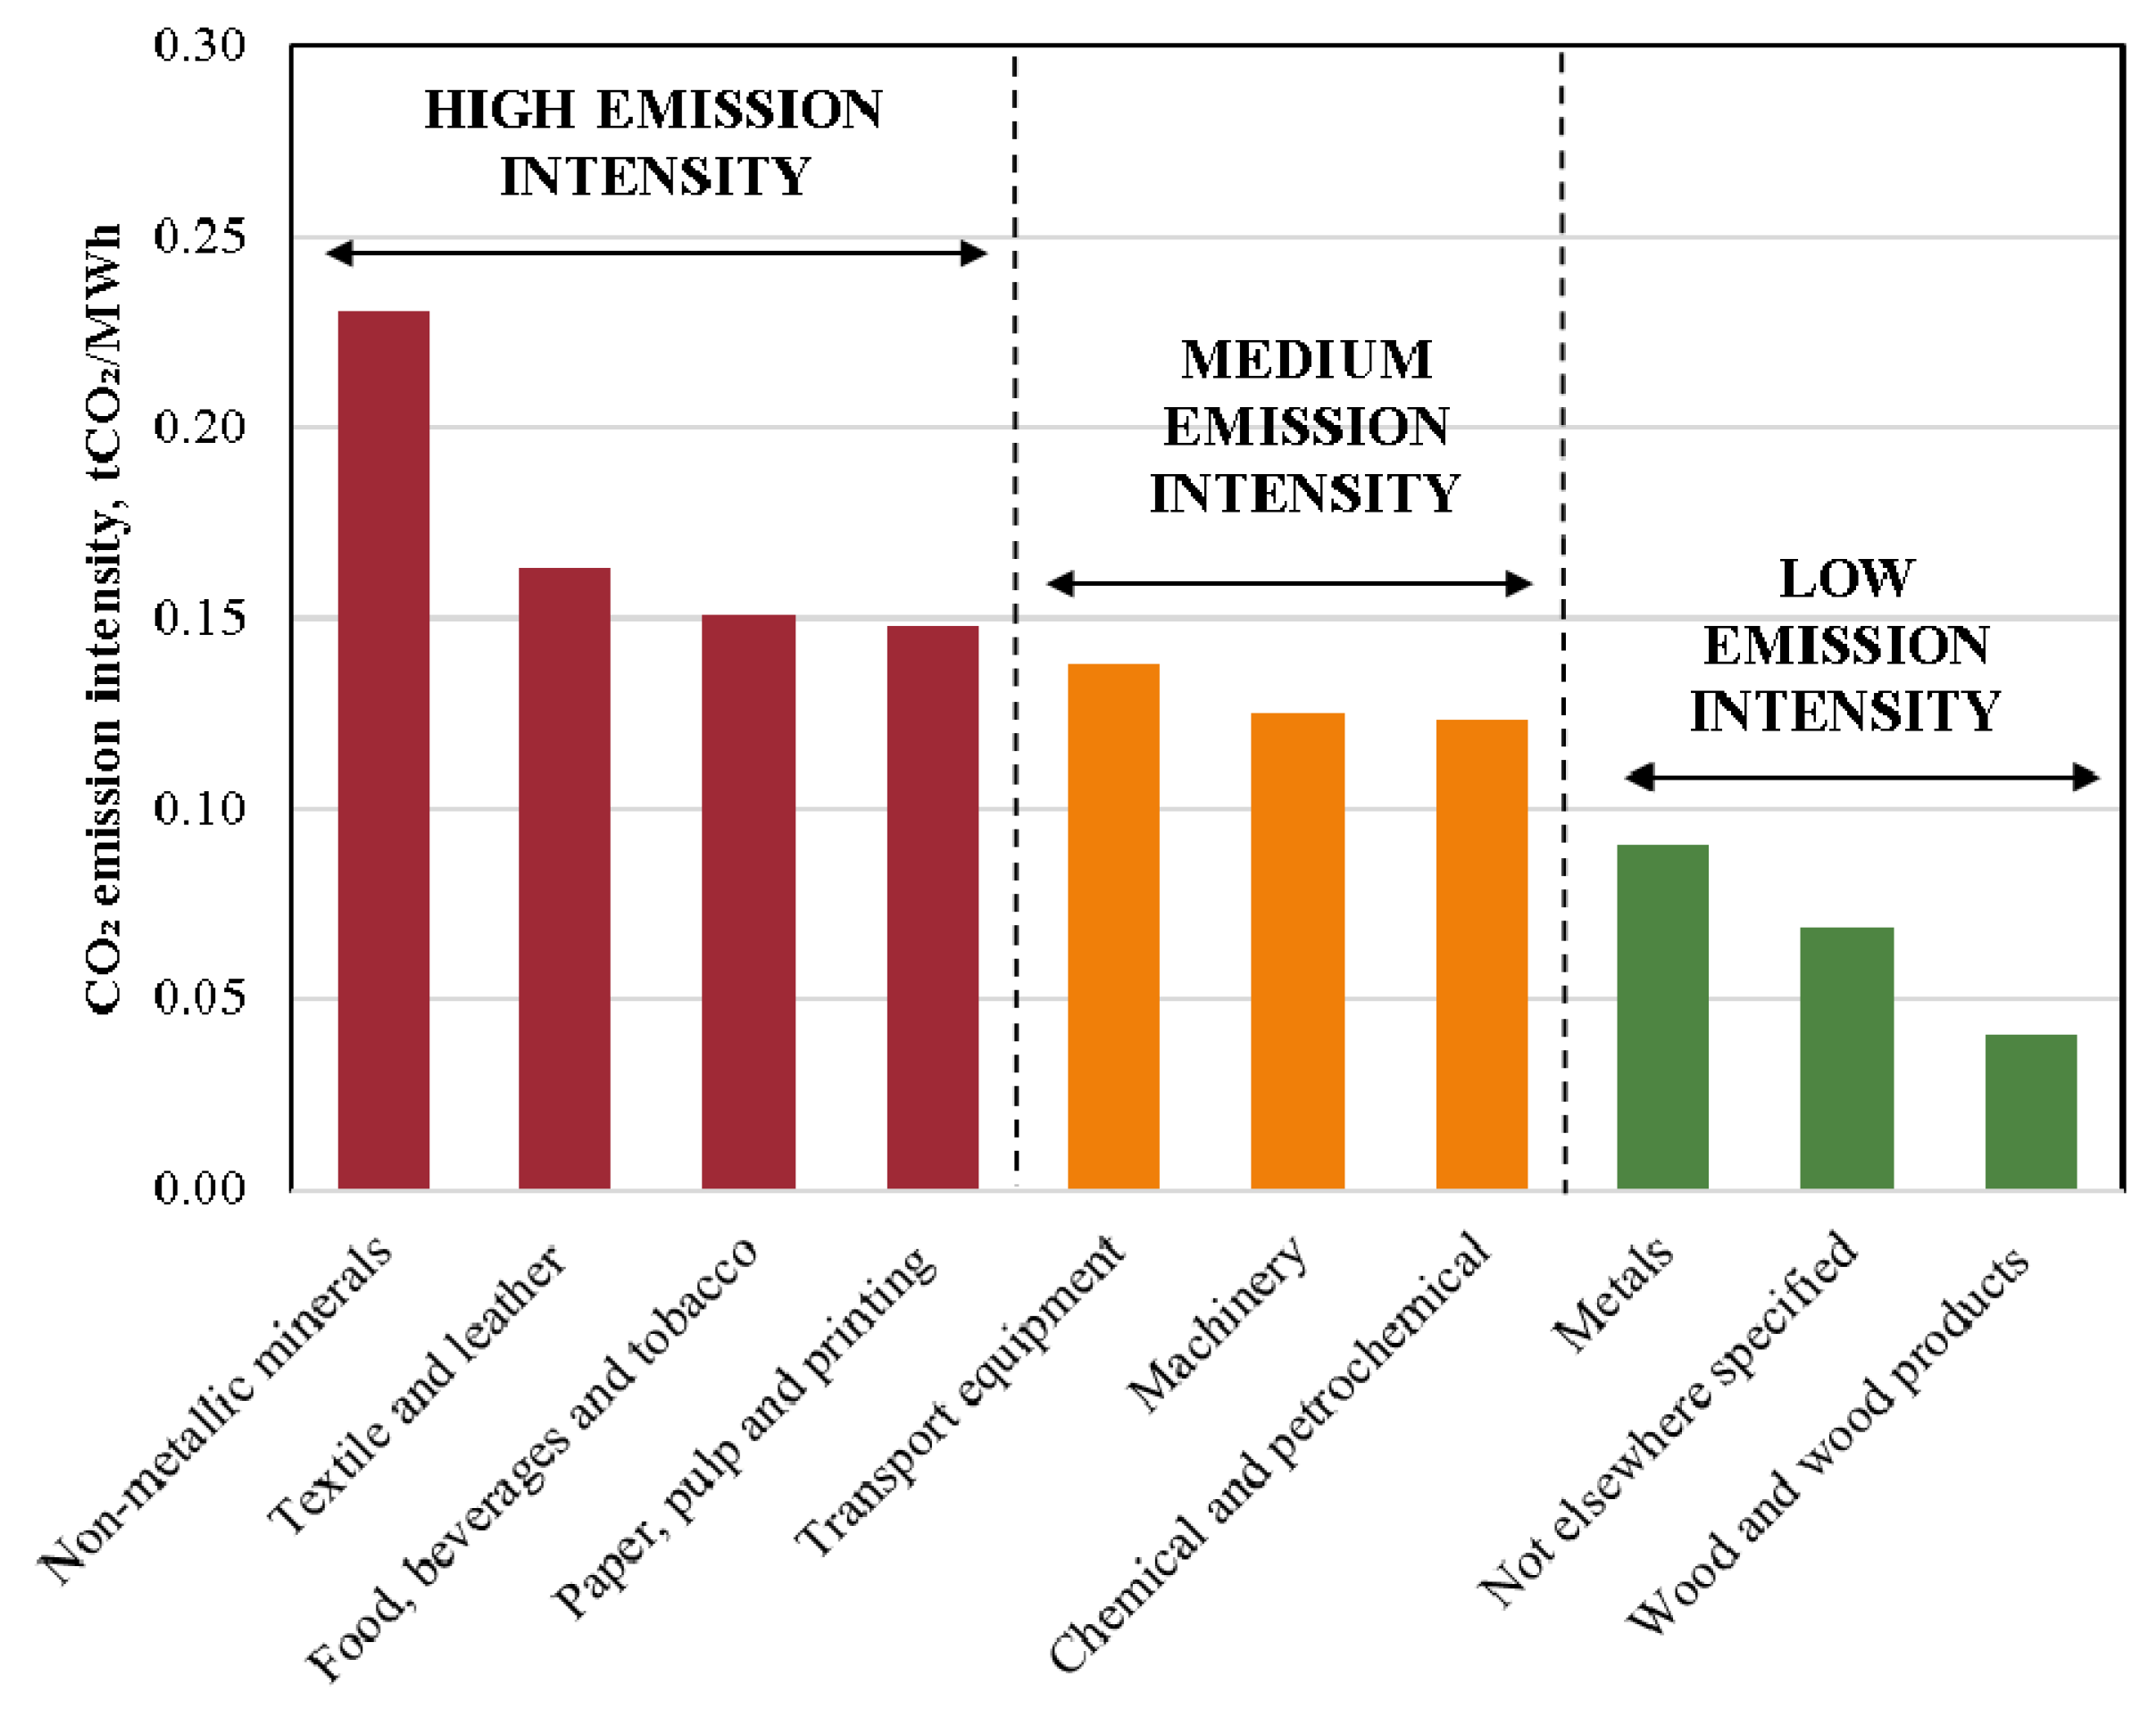
4.1.2. Energy and CO2 Emission Intensities

In order to examine the specifics of energy consumption patterns of each sector and make comprehensive comparison between the sectors, energy and emission intensities are calculated for each subsector. According to the obtained values sectors are classified into three groups—high, medium, and low intensity, as illustrated in Figure 4 and Figure 5. The energy intensity indicator is expressed as the ratio between energy consumed in the sector (GWh) and value added generated in chain-linked volumes (MEUR).
High energy intensity group included three sectors—wood processing (8.45 GWh/MEUR), non-metallic mineral production (7.94 GWh/MEUR), and metals manufacturing (5.02 GWh/MEUR). The energy intensity values of the medium intensity group are on average five times lower than for the high energy intensity group. Moreover, low energy intensity group values are on average almost twelve times lower than high intensity and three times lower than medium intensity group values. Medium energy intensity group also included three sectors—chemical and petrochemical (1.74 GWh/MEUR), food, beverages, and tobacco (1.69 GWh/MEUR), and other or not elsewhere specified sectors (1.15 GWh/MEUR). Low energy intensity group included four sectors—transport equipment (0.81 GWh/MEUR), textile and leather (0.72 GWh/MEUR), paper, pulp, and printing (0.51 GWh/MEUR), and machinery (0.35 GWh/MEUR).
From the assessment of energy intensity and grouping, it can be concluded that the production of basic goods and raw materials such as wood products, building materials, and metals requires high energy input and the goods produced are not realized at high prices. Therefore, the overall ratio of energy consumption to value added generated is much higher in these sectors than in sectors that produce higher value-added final goods that can be realized at a much higher selling price. Wood, non-metallic minerals, and metal products are usually not an end product in the overall production supply chain, but an important raw material that is further used for the assembly of the higher value final product. On the contrary, high value-added sectors such as machinery and transport equipment show low energy intensity, since these sectors produce end products that are usually sold at significantly higher prices due to their production complexity, which requires high knowledge intensity.
The emission intensity indicator is expressed as the ratio between the generated energy-related CO2 emissions and the consumed energy resources (tCO2/MWh). Figure 5 shows the emission intensity values for each subsector. Similarly, as was shown in the energy intensity analysis, the emission intensity values were grouped according to high, medium, and low emission intensities.
The high emission intensity group include four sectors—the non-metallic mineral production sector (0.23 tCO2/MWh), textile and leather production sector (0.16 tCO2/MWh), transport equipment manufacturing sector (0.15 tCO2/MWh), and paper, pulp, and printing manufacturing sector (0.15 tCO2/MWh). The high emission intensity in these sectors can be explained by the energy mix used, as described above. All these sectors have the lowest concentration shares of renewables in the overall fuel mix and natural gas is a strong component in the overall energy balance of these sectors.
The medium emission intensity group include four sectors—the food processing sector (0.14 tCO2/MWh), machinery manufacturing sector (0.13 tCO2/MWh), and chemical and petrochemical manufacturing sector (0.12 tCO2/MWh). Low intensity group sectors possess on average three times lower emission intensity than for the high emission group and two times lower emission intensity than for the medium emission intensity group. The low emission intensity group include three sectors—the metals manufacturing sector (0.09 tCO2/MWh), other or not elsewhere specified sectors (0.07 tCO2/MWh), and wood processing sector (0.04 tCO2/MWh). Wood processing and other sectors contain the highest share of biomass in the overall energy mix, which explains the substantially lower emission intensity compared to other sectors.

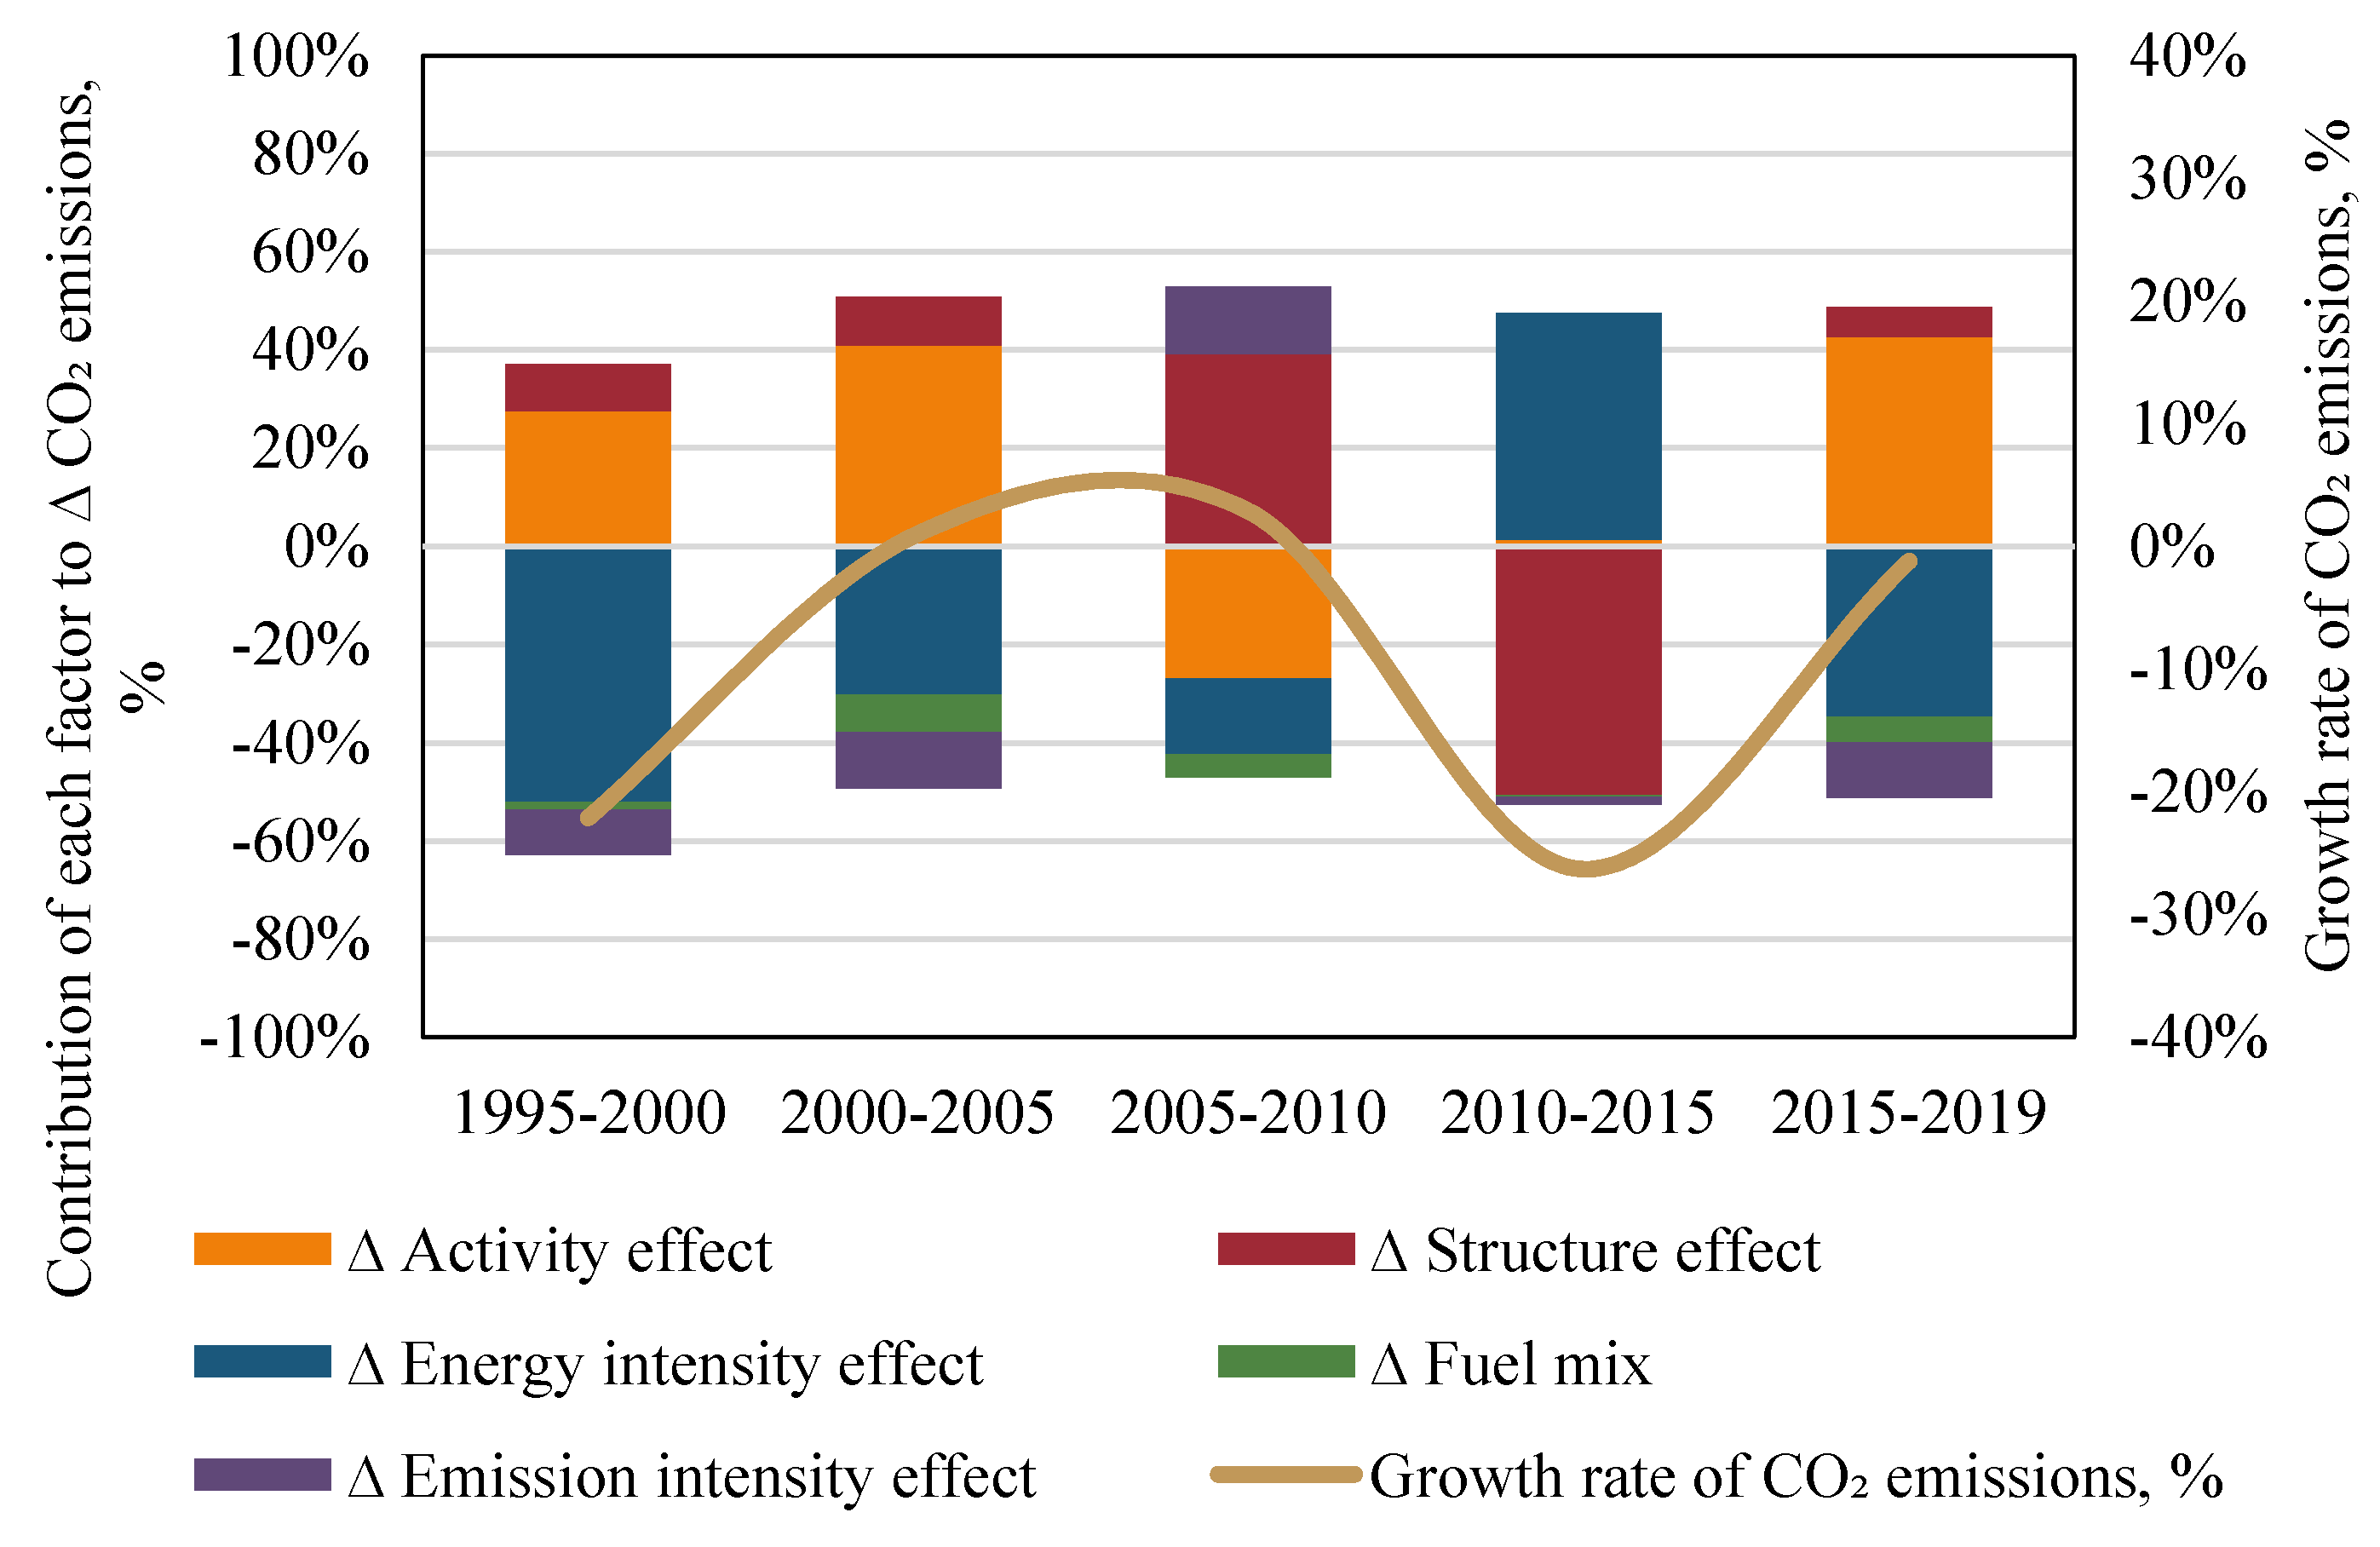
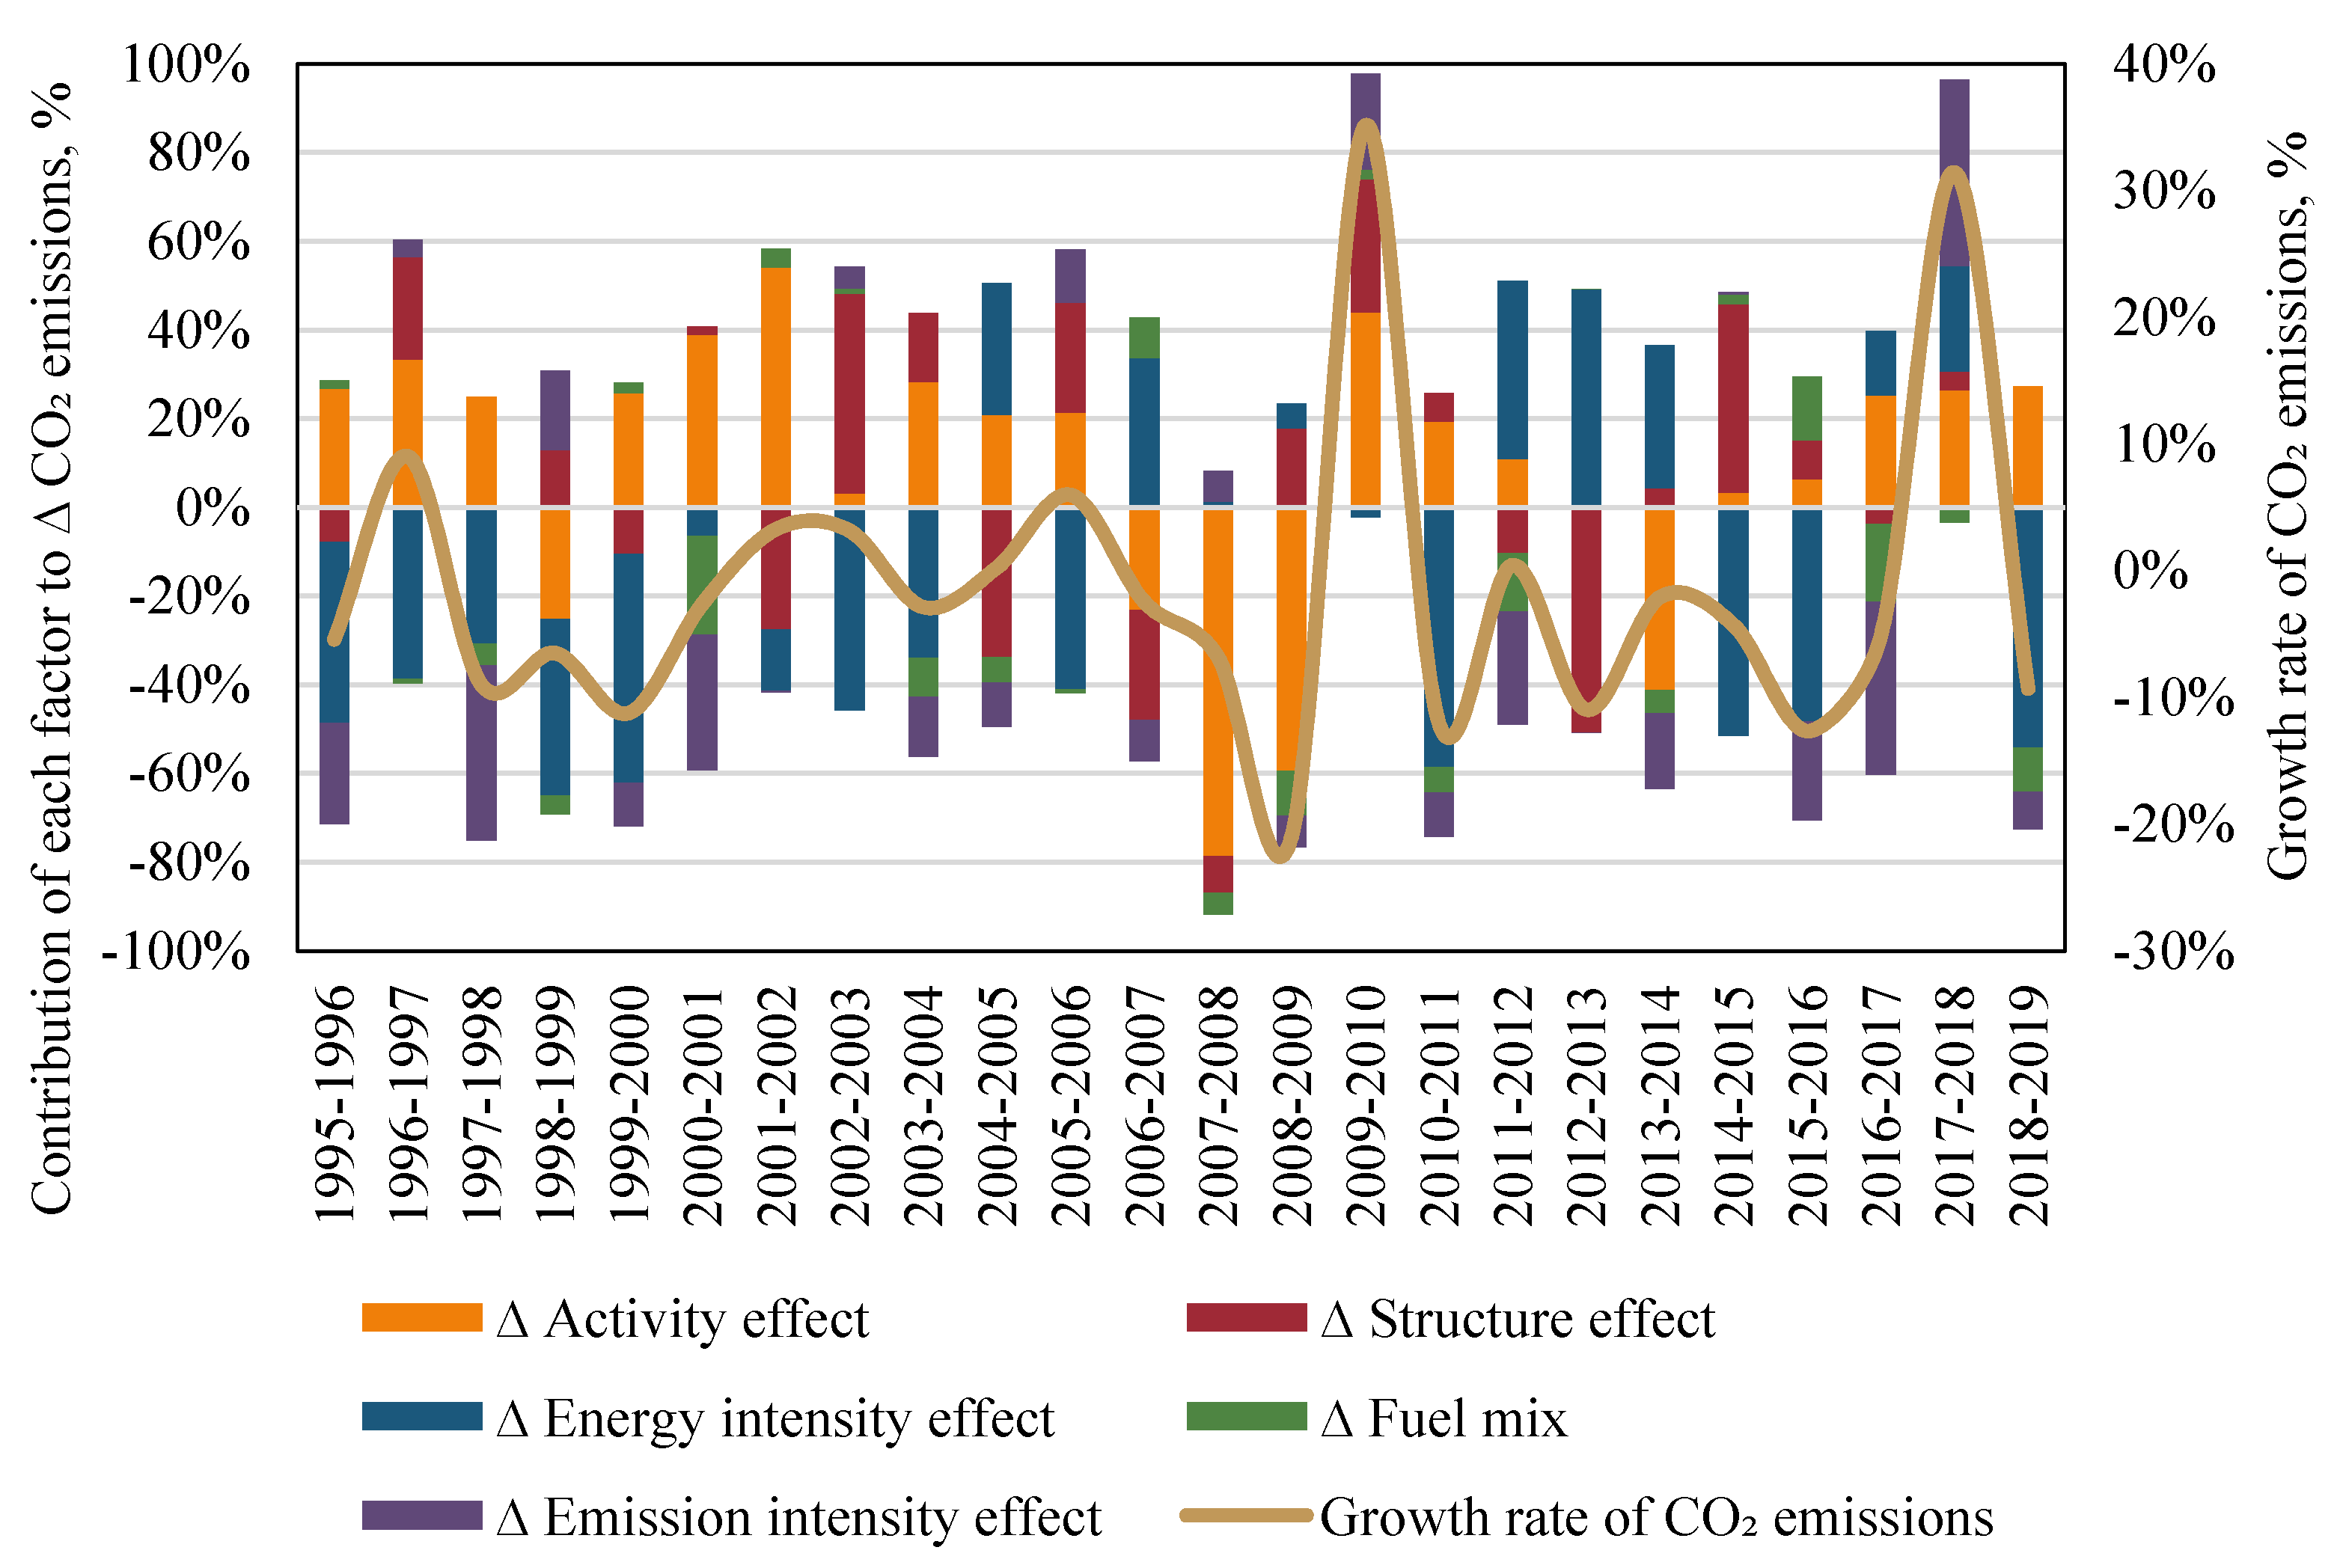
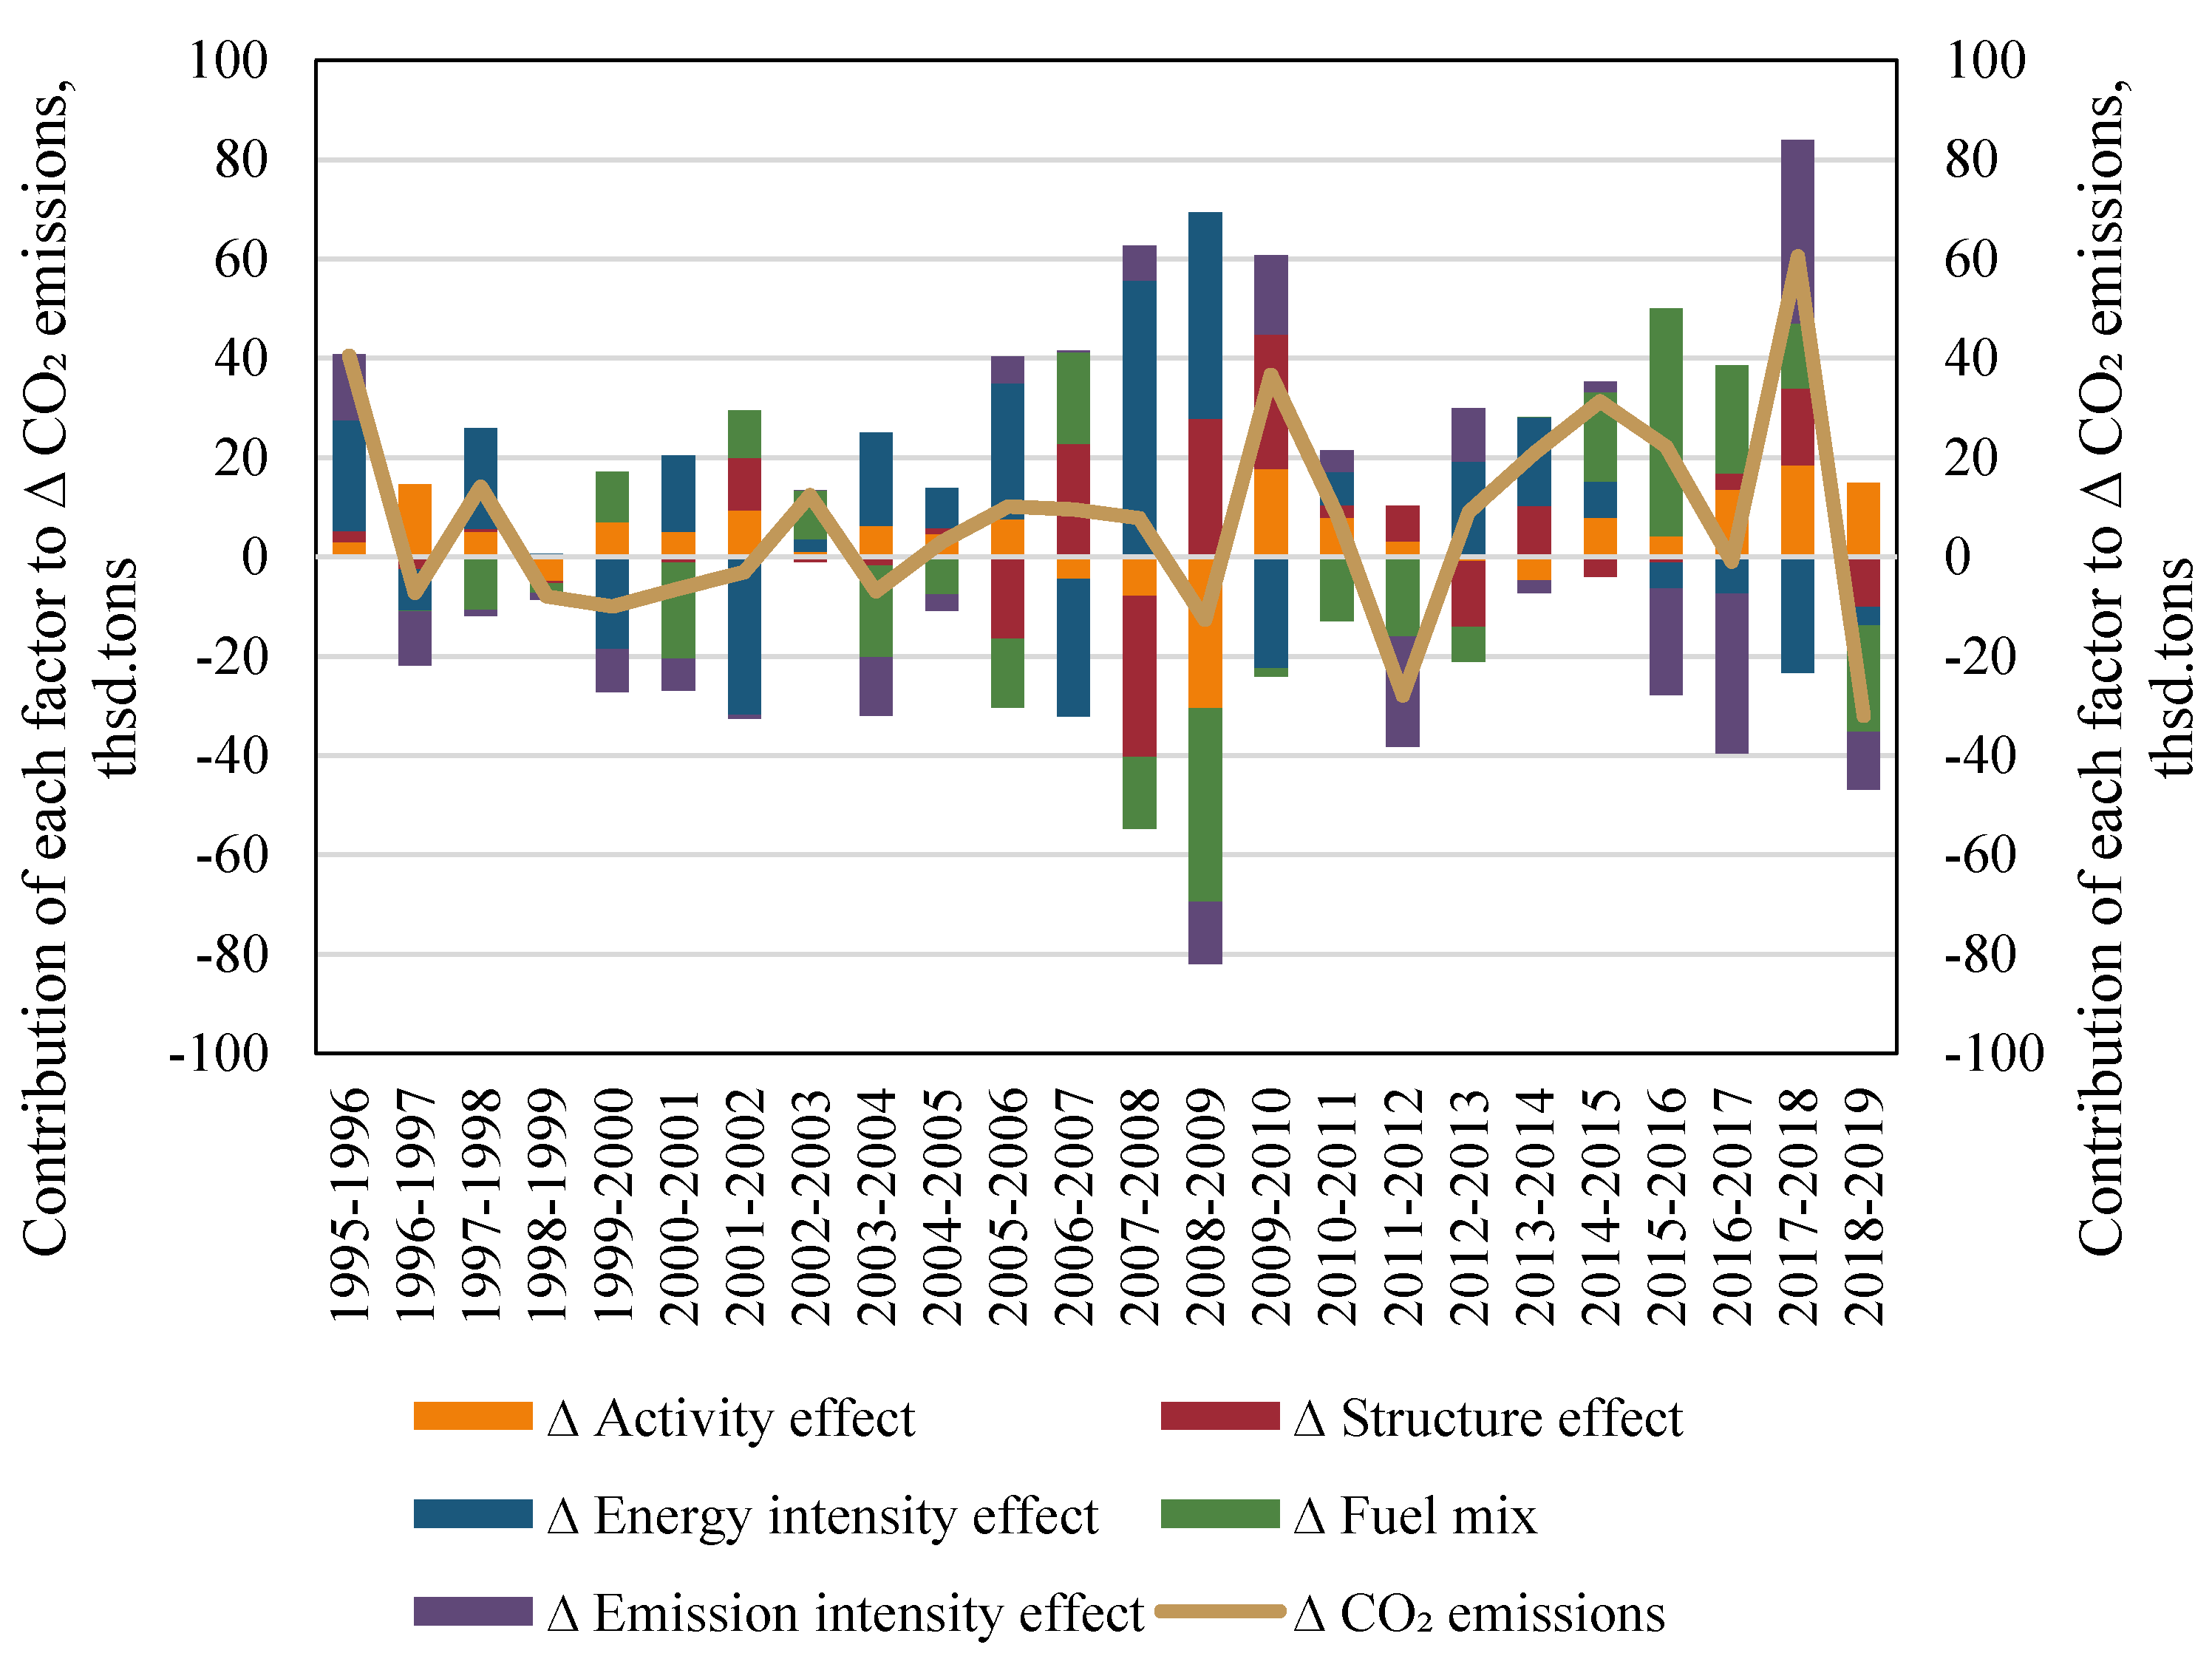
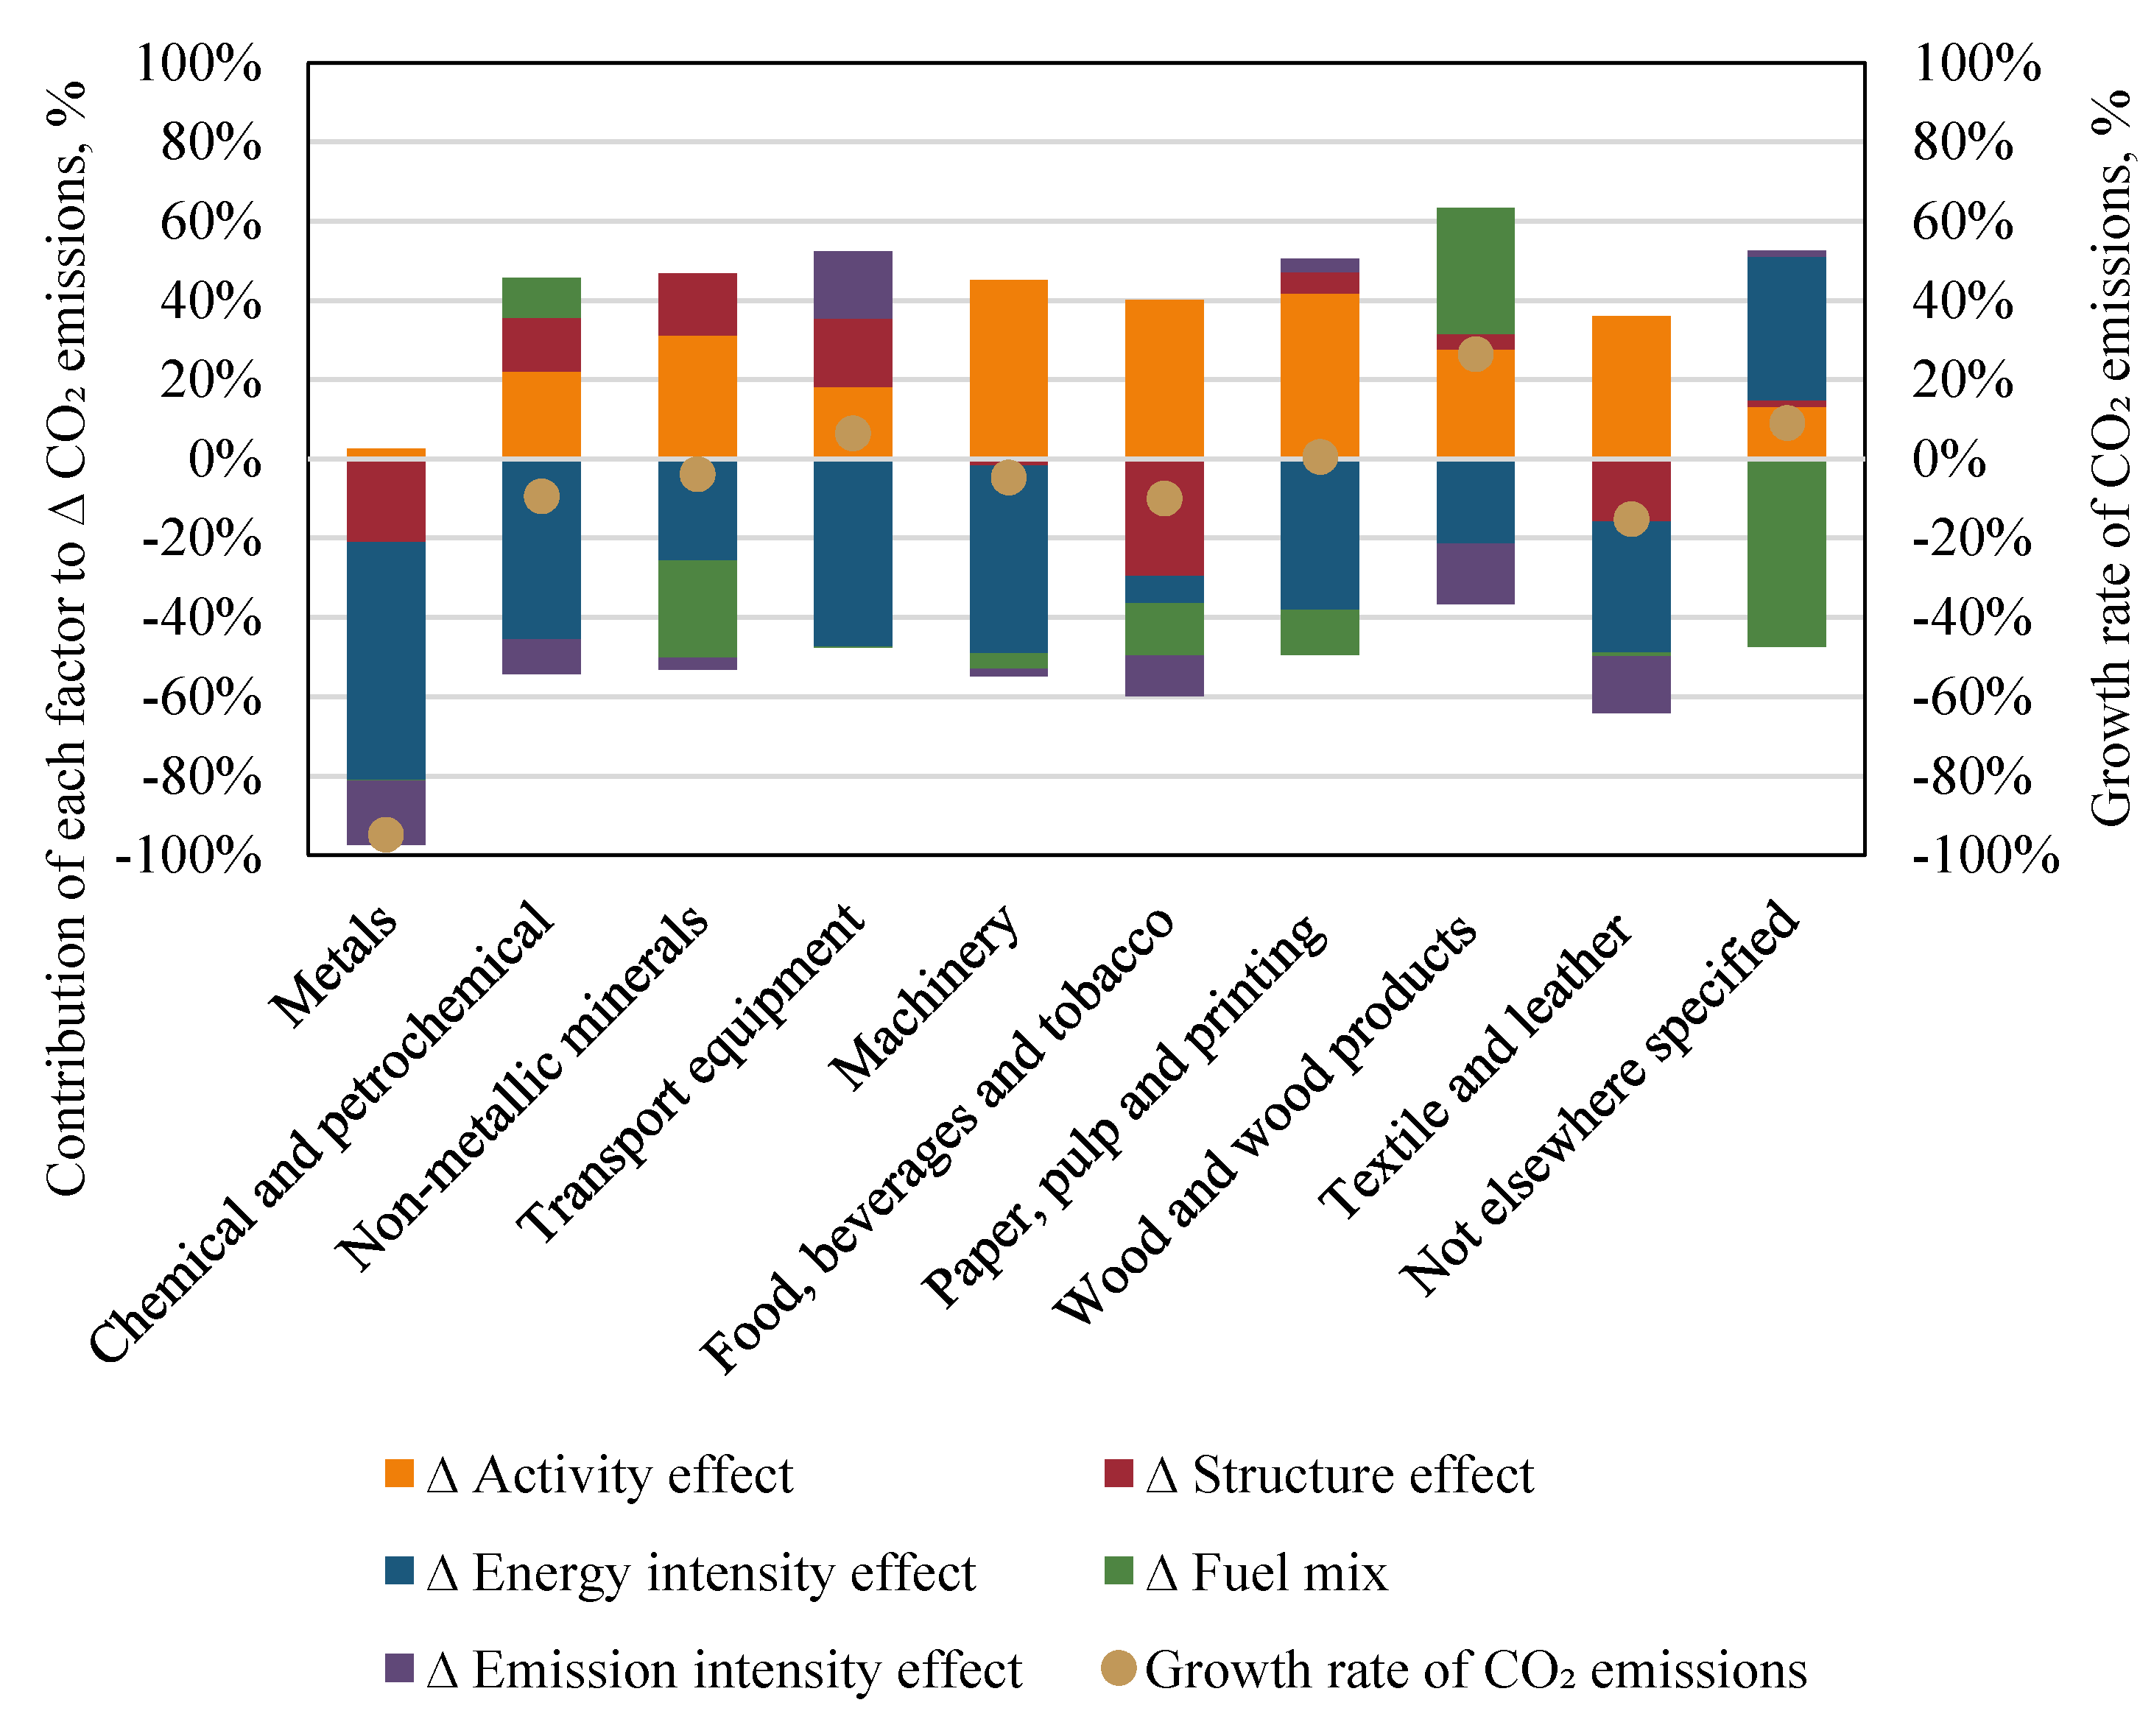
4.2. Decomposition Analysis Results

Measures to save carbon dioxide emissions in the manufacturing industry are particularly challenging, as the sector faces a constant struggle between economic growth drivers and sustainability issues [3]. Decomposition analysis have been constructed for Latvian manufacturing industry to monitor changes in total industrial CO2 emissions over the period from 1995 to 2019 determined by five main factors—the industrial activity effect, structure effect, energy intensity effect, fuel mix effect, and emission intensity effect. The study period was divided in five groups, each accounting for a 5-year time interval, except for the last group, which represents the time period from 2015 to 2019 and, thus, includes a 4-year time interval. Since there were no data on 2020 yet available, year 2019 values were the latest available data that were included in the study. Figure 6 shows the results of the decomposition analysis in combination with the CO2 growth rates during the representative period.
The overall CO2 growth rate in the Latvian manufacturing industry have been fluctuating over the study period. Steady decreases were observed for the periods from 1995 to 2000 and from 2010 to 2015, when the CO2 growth rates were −22% and −26%, respectively. However, in the intervals from 2000 to 2005 (+1%) and from 2005 to 2010 (+3%), the CO2 growth rate indicated an upward trend, while in the interval from 2015 to 2019, the CO2 growth rate was equal to −1%. It can be concluded that CO2 reduction in the manufacturing industry has stagnated in recent years, and there has been little improvement in the last 5 years. Furthermore, the fluctuations in the results show that the changes in CO2 emissions are unsteady, so a more detailed study of the influencing factors should be conducted.
Table 3 summarizes the main decomposition results in total absolute values. Significant differences are observed between periods. In the first period (1995–2000), the main driver of changes in industrial CO2 emissions was a decrease in energy intensity. This can be explained by the significant changes in the general economic restructuring and structure of the economy, when, after the restoration of independence in Latvia, the existing enterprises were forced to reorganize their original production methods and numerous new manufacturing companies entered the market. Therefore, significant investments were made and modernization measures were carried out in the manufacturing companies, which led to an increase in efficiency. In addition, the consumption of coal and petroleum products was significantly reduced during this period, which contributed to the overall reduction of CO2 emissions.
In the second period (2000–2005), an increase in CO2 emissions from manufacturing industries was observed. In the first period, the main driver of changes in CO2 emissions was the effect of industrial activity. Increasing demand in both local and export markets led to a significant increase in production volumes, which increased production capacity and drove the overall development of the industry. Improvements in energy and emissions intensity could not compensate for the effect of increasing industrial activity, so CO2 emissions increased during this period.
In the third period (2005–2010), similar to what was observed in the second period, total CO2 emissions increased by 33.8 thousand tons in absolute values and showed a 3% CO2 growth rate. The period is characterized as the period before the global financial crisis, when a general decrease in industrial activity was observed in all manufacturing subsectors. During this period, a significant shift to more energy-intensive sectors was observed.
The fourth period (2010–2015) shows a large decrease in CO2 emissions. The period is characterized by a large significant restructuring that occurred due to the existence of the largest metal producer in the market. As the metal production sector accounted for 25% of the total CO2 emissions of the manufacturing sector in the past, the bankruptcy of the largest player in the market subsequently affected the overall reduction of industrial CO2 emissions. During this period, a large effect was also observed in the factor of energy intensity, which can be explained by the inefficiency of the production processes of the respective metal production company.
The fifth period (2015–2019), or the period representing the latest trends in the industry, showed a modest reduction in CO2 emissions, where the total decreased in absolute terms by 10.7 thousand tons of CO2 emissions and a negative growth rate of −1%. Although a significant improvement in energy efficiency and decarbonization measures can be observed, the effect from the improvements was largely offset by the increasing industrial activity. This suggests that the current pace of improvements may not be sufficient to achieve greater CO2 emission reductions in industry in the future. Table 4 summarizes the main events during the analyzed time intervals that influenced the change in CO2 emissions.
Figure 7 illustrates year-to-year changes in the contribution of each decomposition factor to the changes in CO2 emissions and the overall growth rate of CO2 emissions with all subsectors included and Table 5 summarizes the results in absolute values. The growth rate of CO2 emissions is negative and shows a fluctuation pattern. However, two significant peaks are observed in the periods from 2009 to 2010 and from 2017 to 2018. The first one is explained by the recovery of the manufacturing industry after the financial crisis. However, a more detailed investigation is carried out to explain the reasons for the second peak observed in recent years.
Over the period of ten years, the manufacturing industry experienced a shift from one energy intensive sector (metal manufacturing) to other no less energy intensive sector (wood processing). However, the competitive advantage of the wood products manufacturing sector is the high share of RES utilization where wood residues and chips are used in thermal processes, which is a CO2-neutral fuel. If the aggregate values of the period are analyzed excluding 2013, which distorted the entire industry, the energy intensity effect played the most important role in reducing CO2 emissions.
The overall decomposition results show a positive trend towards the implementation of decarbonization measures, which in aggregate contributed to a reduction in overall emissions intensity in the industry. However, energy efficiency measures had a more than six times larger overall effect on CO2 reduction compared to RES measures. The results prove that energy efficiency improvements are the most important strategy for the long-term development of companies to achieve energy and emission savings. The main reason for the increase in industrial CO2 emissions is the effect of industrial activity, explained by the gradual annual increase in the volume of industrial production, which subsequently also led to an increase in total energy consumption to compensate for the increase in demand [6].
These findings are consistent with the decomposition results of the Odysee-Mure energy efficiency decomposition model for Latvian industry [41]. The Odysee-Mure energy consumption decomposition of industry for the period from 2000 to 2018 showed that the total energy consumption of industry increased by 2.5% annually in the studied period, which is mainly due to the increase in industrial activity in two important subsectors of Latvian industry—wood processing and non-metallic mineral production. The Odysee-Mure decomposition of energy efficiency in industry concludes that the improvements in energy efficiency, which enabled significant energy savings in industry and reduced the overall energy intensity of industry, contributed to the fact that total energy consumption did not increase even more [41].
In total, in the time period from 2015 to 2019, a larger decrease in energy intensity in the manufacturing industry was observed compared with the first half of the decade. Part of the explanation in energy efficiency activity in past five years can be explained by autonomous developments in the companies, where in order to increase company competitiveness, there is a constant need to look for ways to decrease energy costs. However, another part of the explanation lies in the effect from policies that might have stimulated larger energy savings and the achievement of more ambitious energy efficiency targets [34].
The results of the decomposition analysis showed that improvements in energy intensity have contributed most to reducing CO2 emissions in the manufacturing sector in the past. Therefore, in order to observe how recent energy efficiency measures might have affected the green transformation in industry, a more detailed analysis is conducted for a period from 2015 to 2019. Figure 8 illustrates the contribution of each effect on changes in CO2 emissions and overall change in generated CO2 emissions in each sub-sector in the time period from 2015 to 2019.
In total, in 2019, almost all manufacturing industry sub-sectors indicated a reduction in CO2 emissions compared to the levels of year 2015. However, three sectors reported the opposite. In 2019, CO2 emissions increased by 6% in transport equipment production sector, by 26% in wood processing sector, and by 9% in other sub-sectors compared to 2015.
The energy intensity effect was the main driver that contributed to the reduction of CO2 emissions in most of the sectors, except for not elsewhere specified sectors (plastics, rubber, furniture, and other manufacturing) in the period of the last five years. The wood processing sector and chemical and petrochemical production sector were the only sectors that indicated a negative tendency towards increasing the share of RES. Both sectors showed the opposite trend in their fuel mixes, indicating a decrease of RES in the total energy mix. The results show that despite significant energy efficiency improvements in these sub-sectors, total rise in industrial activity, structural effect, and fuel mix effect counteracted the energy intensity effect. Therefore, the current energy efficiency improvements could not compensate these effects, which drove up the overall CO2 emissions at a much higher pace than the implemented energy efficiency measures.
The structural effect shows the overall change in the contribution of a particular sector to the total industrial activity. That is, if the structural effect is positive, then the total industrial activity in the sector has increased as has the total contribution to the total industrial value added. On the other hand, a negative value means that the sector’s contribution to the total value added generated has decreased. The results show that the share of metals production sector, food processing sector, and textile production sector in the total industrial generated value added has decreased. This structural effect also contributed to the achievement of higher CO2 reductions in the sector. On the contrary, the chemicals production sector, non-metallic mineral production sector, and transport equipment production sector has raised their contribution to the overall generated industrial added value over the period from 2015 to 2019.
Year-to-year changes in CO2 emissions were examined in more detail for the largest manufacturing sector in Latvia—wood processing, which alone consumes almost two-thirds of all industrial energy use in Latvia. Figure 9 illustrates the results of the CO2 emission decomposition for the wood processing sector.
Industrial activity was the main reason for the sharp increase in the total energy consumption of the wood processing sector during the studied period. The increasing demand for wood chips, wood pellets, and other wood products in the largest global export markets made the wood processing sector the fastest growing sector of Latvian industry and led to a significant annual increase in production volume over the last decade [6]. The influence of export demand on industrial manufacturing activity and its embodied carbon emissions was demonstrated in the study of [21], where a decomposition analysis of manufacturing CO2 emissions in China showed that the growth of international exports of produced goods had the greatest influence on the increase in industrial CO2 emissions [21]. Similarly, Latvia’s wood processing sector has seen exports increase by 82% in the last decade (over the period 2010–2019) [42] and 60% of the total wood products produced in Latvia were exported in 2019. Thus, the development of the sector is strongly influenced by the demand on international export markets [33].
According to the decomposition analysis results, the fuel mix effect in the wood processing sector has been the main driver of the increase in CO2 emissions over the last five years. It shows that the sector has reduced its overall share of RES the total fuel mix, signaling a negative trend. An increase in fossil energy consumption in the wood sector was observed during the periods from 2014 to 2018. In part, this could be explained by the fact that overall demand for wood products, particularly wood pellets and chips, has increased across the global trade market, which has also pushed factories to increase their capacity. As a result, deficiencies in wood residues and wood chips, which are mostly used for combustion processes, have been compensated by natural gas or fossil energy. This also increased the total CO2 emissions generated in the industry.
Figure 10 illustrates the changes in the total distribution of energy products consumed in the wood-processing sector during the last five years. The change index shows the amplitude of how the consumption of certain products has changed compared to the values of 2015, which is taken as the base year. In general, it can be observed that the demand for heat has more than doubled; additionally, the consumption of oil products, natural gas, and electricity has gradually increased. However, the consumption of wood products has decreased. Therefore, the results indicate that there is an overall negative trend towards higher consumption of fossil energy resources.
Subsequently, this trend affects both the overall share of RES in the total fuel mix and the emission intensity of the sector, as shown in Figure 11. It can be observed that the total share of wood products in the total fuel mix gradually decreased except in 2019. As a result, the emission intensity indicator fluctuates in the representative years. A significant peak in emission intensity is observed in 2018, when the share of RES in the total fuel mix reached the lowest value.
In addition, a correlation analysis was performed to investigate the relationship between the volumes of wood products produced and the RES share in the energy balance of the wood processing sector, as shown in Figure 12. The results for the period from 2013 to 2019 show a strong correlation (R2 = 0.9059), with a downward slope between the two variables. The correlation analysis confirms that the increase in industrial activity in the wood processing sector caused the share of RES to decrease. The exception of 2019 can be explained by the fact that in 2019 in Latvia was observed a winter with mild temperatures; therefore, there was also a lower demand for wood products, including pellets.

5. Conclusions and Policy Recommendations

In this study, an ex-post assessment of industrial energy-related CO2 emissions were carried out. The Log-Mean Divisia Index (LMDI) decomposition analysis method was applied to decompose changes of industrial energy-related CO2 emissions based on five main drivers, i.e., the industrial activity effect, structural change effect, energy intensity effect, fuel mix effect, and emission intensity effect. Decomposition analysis results showed that although there is a significant improvement in energy efficiency and decarbonization measures in the industry, the effect from the improvements has been largely offset by increasing industrial activity. In this paper, the relationship between economic growth and climate change measures was demonstrated. The rapid growth of industrial production activity, especially in energy-intensive sectors such as the wood processing sector, will require a much greater improvement in industrial energy efficiency in the future. The results of this study confirm that energy efficiency measures have the greatest impact on reducing carbon emissions in industrial companies.
The results suggest that sectoral heterogeneity should be taken into account to design more efficient energy and emission saving policies, as there exist different incentives between high and low carbon intensity sectors. For high carbon intensive sectors, such as non-metallic mineral manufacturing, emissions trading schemes or fiscal instruments such as carbon taxes are effective mechanisms to achieve energy and carbon savings. For sectors with low emission intensity, such as the wood processing industry, financial incentives, subsidies, and obligation schemes, e.g., mandatory energy audits, could be used as effective mechanisms to promote energy efficiency and decarbonization activities. Sector-specific benchmarks and standards could potentially be created and defined in industrial energy policy, as suggested in the study by [5]. Specific regulations and climate targets for each sector would make it possible to identify underperforming companies and develop tailored measures to promote decarbonization and energy efficiency in companies. Therefore, quantifying and monitoring energy efficiency targets specifically for each industrial subsector are the priority to realize the untapped energy efficiency potential of Latvian industry [5].
The results of this study suggest that greater upscaling of clean energy technologies will be needed in the future to accelerate the pace of decarbonization, and additional policy measures should, therefore, be taken. Policies should support both investment in capital for companies deploying clean technologies and investment in research and development to ensure the development of innovative technologies for sustainable energy systems. Encouraging investment in R&D was highlighted as a critical policy measure in the studies by [28,43], who examined the key drivers of changes in industrial carbon emissions and used the findings to develop recommendations to promote deep decarbonization in industry. Investment in R&D provides more opportunities for the development and adaptation of energy-saving technologies and the further development of technological solutions for energy conservation and clean energy adaptation, which bring both economic and environmental benefits to industrial enterprises [28,43]. The government should develop policy instruments to support R&D activities in industry. Mechanisms such as financial subsidies, tax exemptions, and additional access to capital could be used as effective tools for long-term industrial development and sustainability policies.
Given the high energy intensity of the manufacturing sector in Latvia, which is mainly dominated by two sectors—wood processing and non-metallic mineral production—investments in heat recovery technologies could be one of the main drivers of energy and carbon emission savings in the industry. As both wood processing and non-metallic minerals production require large amounts of heat for production processes, the installation of heat recovery systems in companies, especially in large industrial plants, could lead to CO2 savings of up to 35% [44]. Therefore, the government should support the adaptation of heat recovery technologies by providing financial incentives that would reduce the overall payback period of these technologies.
Moreover, fiscal instruments such as energy taxes and carbon pricing could be used as effective tools to promote clean energy sources and to restructure the overall energy mix of sub-sectors that depend on high fossil fuel consumption [25]. Phasing out of carbon-intensive energy sources could be achieved by making their price less attractive and renewable energy sources more affordable for businesses [5,25].

Author Contributions

Conceptualization, K.D. and D.B.; methodology, K.D.; validation, D.B.; formal analysis, K.D.; investigation, K.D. and D.B.; resources, D.B.; data curation, K.D.; writing—original draft preparation, K.D.; writing—review and editing, K.D.; visualization, K.D.; supervision, D.B.; project administration, D.B.; funding acquisition, D.B. All authors have read and agreed to the published version of the manuscript.

Funding

This research is funded by the Ministry of Economics of the Republic of Latvia, project “The pathway to energy efficient future for Latvia (EnergyPath)”, project No. VPP-EM-EE-2018/1-0006.

Institutional Review Board Statement

Not applicable.

Informed Consent Statement

Not applicable.

Data Availability Statement

Not applicable.

Conflicts of Interest

The authors declare no conflict of interest.

Nomenclature

Ctotal aggregated energy-related CO2 emissions
Qtotal produced volumes expressed as total value-added
Etotal energy consumption
Siindustrial production activity
Iienergy intensity
Fijfuel mix
Mijemission factor
irepresentative value of a subsector
jthe type of energy carrier in the total energy balance
acteffect from changes in industrial activity
streffect from changes in structure
enieffect from changes in energy intensity
fueleffect from changes in fuel mix
emieffect from changes in emission intensity
ETenergy consumption in future year T
E0energy consumption in initial year

References

  1. UNEP; UNEP DTU Partnership. UNEP Emissions Gap Report 2021. Available online: https://www.unep.org/resources/emissions-gap-report-2021 (accessed on 15 November 2021).
  2. Vieira, L.C.; Longo, M.; Mura, M. Are the European manufacturing and energy sectors on track for achieving net-zero emissions in 2050? An empirical analysis. Energy Policy 2021, 156, 112464. [Google Scholar] [CrossRef]
  3. Dolge, K.; Blumberga, D. Economic growth in contrast to GHG emission reduction measures in Green Deal context. Ecol. Indic. 2021, 130, 108153. [Google Scholar] [CrossRef]
  4. Wang, M.; Feng, C. Towards a decoupling between economic expansion and carbon dioxide emissions in resources sector: A case study of China’s 29 non-ferrous metal industries. Resour. Policy 2021, 74, 102249. [Google Scholar] [CrossRef]
  5. Talaei, A.; Gemechu, E.; Kumar, A. Key factors affecting greenhouse gas emissions in the Canadian industrial sector: A decomposition analysis. J. Clean. Prod. 2020, 246, 119026. [Google Scholar] [CrossRef]
  6. Sovacool, B.K.; Bazilian, M.; Griffiths, S.; Kim, J.; Foley, A.; Rooney, D. Decarbonizing the food and beverages industry: A critical and systematic review of developments, sociotechnical systems and policy options. Renew. Sustain. Energy Rev. 2021, 143, 110856. [Google Scholar] [CrossRef]
  7. Locmelis, K.; Blumberga, D.; Bariss, U. Energy efficiency in large industrial plants. Legislative aspects. Energy Procedia 2018, 147, 202–206. [Google Scholar] [CrossRef]
  8. Dolge, K.; Kubule, A.; Blumberga, D. Composite Index for Energy Efficiency Evaluation of Industrial Sector: Sub-Sectoral Comparison. Environ. Sustain. Indic. 2020, 8, 100062. [Google Scholar] [CrossRef]
  9. Fang, K.; Li, C.; Tang, Y.; He, J.; Song, J. China’s pathways to peak carbon emissions: New insights from various industrial sectors. Appl. Energy 2021, 306, 118039. [Google Scholar] [CrossRef]
  10. García-Quevedo, J.; Jové-Llopis, E. Environmental policies and energy efficiency investments. An industry-level analysis. Energy Policy 2021, 156, 112461. [Google Scholar] [CrossRef]
  11. Iqbal, N.; Abbasi, K.R.; Shinwari, R.; Guangcai, W.; Ahmad, M.; Tang, K. Does exports diversification and environmental innovation achieve carbon neutrality target of OECD economies? J. Environ. Manag. 2021, 291, 112648. [Google Scholar] [CrossRef]
  12. Zhang, G.; Cheng, P.; Sun, H.; Shi, Y.; Zhang, G.; Kadiane, A. Carbon reduction decisions under progressive carbon tax regulations: A new dual-channel supply chain network equilibrium model. Sustain. Prod. Consum. 2021, 27, 1077–1092. [Google Scholar] [CrossRef]
  13. Trotta, G. Assessing energy efficiency improvements and related energy security and climate benefits in Finland: An ex post multi-sectoral decomposition analysis. Energy Econ. 2020, 86, 104640. [Google Scholar] [CrossRef]
  14. Dolge, K.; Āzis, R.; Lund, P.D.; Blumberga, D. Importance of Energy Efficiency in Manufacturing Industries for Climate and Competitiveness. Environ. Clim. Technol. 2021, 25, 306–317. [Google Scholar] [CrossRef]
  15. Pan, X.; Guo, S.; Xu, H.; Tian, M.; Pan, X.; Chu, J. China’s carbon intensity factor decomposition and carbon emission decoupling analysis. Energy 2021, 239, 122175. [Google Scholar] [CrossRef]
  16. Xu, X.; Ang, B. Index decomposition analysis applied to CO2 emission studies. Ecol. Econ. 2013, 93, 313–329. [Google Scholar] [CrossRef]
  17. Ang, B.; Xu, X. Tracking industrial energy efficiency trends using index decomposition analysis. Energy Econ. 2013, 40, 1014–1021. [Google Scholar] [CrossRef]
  18. Cahill, C.J.; Gallachóir, B.P.Ó. Combining physical and economic output data to analyse energy and CO2 emissions trends in industry. Energy Policy 2012, 49, 422–429. [Google Scholar] [CrossRef]
  19. Ang, B.W. Decomposition analysis for policymaking in energy: Which is the preferred method? Energy Policy 2004, 32, 1131–1139. [Google Scholar] [CrossRef]
  20. Ang, B.; Liu, F.; Chew, E. Perfect decomposition techniques in energy and environmental analysis. Energy Policy 2003, 31, 1561–1566. [Google Scholar] [CrossRef]
  21. Xu, W.; Xie, Y.; Xia, D.; Ji, L.; Huang, G. A multi-sectoral decomposition and decoupling analysis of carbon emissions in Guangdong province, China. J. Environ. Manag. 2021, 298, 113485. [Google Scholar] [CrossRef]
  22. Singpai, B.; Wu, D.D. An integrative approach for evaluating the environmental economic efficiency. Energy 2021, 215, 118940. [Google Scholar] [CrossRef]
  23. Chontanawat, J.; Wiboonchutikula, P.; Buddhivanich, A. An LMDI decomposition analysis of carbon emissions in the Thai manufacturing sector. Energy Rep. 2020, 6, 705–710. [Google Scholar] [CrossRef]
  24. Shi, Y.; Han, B.; Zafar, M.W.; Wei, Z. Uncovering the driving forces of carbon dioxide emissions in Chinese manufacturing industry: An intersectoral analysis. Environ. Sci. Pollut. Res. 2019, 26, 31434–31448. [Google Scholar] [CrossRef] [PubMed]
  25. Du, G.; Sun, C.; Ouyang, X.; Zhang, C. A decomposition analysis of energy-related CO2 emissions in Chinese six high-energy intensive industries. J. Clean. Prod. 2018, 184, 1102–1112. [Google Scholar] [CrossRef]
  26. Liu, J.; Yang, Q.; Zhang, Y.; Sun, W.; Xu, Y. Analysis of CO2 Emissions in China’s Manufacturing Industry Based on Extended Logarithmic Mean Division Index Decomposition. Sustainability 2019, 11, 226. [Google Scholar] [CrossRef] [Green Version]
  27. Ang, B. The LMDI approach to decomposition analysis: A practical guide. Energy Policy 2005, 33, 867–871. [Google Scholar] [CrossRef]
  28. Ouyang, X.; Lin, B. An analysis of the driving forces of energy-related carbon dioxide emissions in China’s industrial sector. Renew. Sustain. Energy Rev. 2015, 45, 838–849. [Google Scholar] [CrossRef] [Green Version]
  29. Jeong, K.; Kim, S. LMDI decomposition analysis of greenhouse gas emissions in the Korean manufacturing sector. Energy Policy 2013, 62, 1245–1253. [Google Scholar] [CrossRef]
  30. Akbostancı, E.; Tunç, G.I.; Türüt-Aşık, S. CO2 emissions of Turkish manufacturing industry: A decomposition analysis. Appl. Energy 2011, 88, 2273–2278. [Google Scholar] [CrossRef]
  31. González, D.; Martinez, M. Changes in CO2 emission intensities in the Mexican industry. Energy Policy 2012, 51, 149–163. [Google Scholar] [CrossRef]
  32. Eurostat. Energy Balance Guide—Methodology Guide for the Construction of Energy Balances & Operational Guide for the Energy Balance Builder Tool; Eurostat: Luxembourg, 2019; Available online: https://ec.europa.eu/eurostat/documents/38154/4956218/ENERGY-BALANCE-GUIDE-DRAFT-31JANUARY2019.pdf (accessed on 15 October 2021).
  33. Central Statistics Bureau of Latvia. Entrepreneurship Indicators of Enterprises (SBG010) 2020. Available online: http://data1.csb.gov.lv/pxweb/en/uzn/uzn__uzndarb/SBG010.px/ (accessed on 10 February 2020).
  34. Eurostat. GDP and Main Components (Output, Expenditure and Income) Nama_10_Gdp. Available online: https://appsso.eurostat.ec.europa.eu/nui/show.do?dataset=nama_10_gdp&lang=en (accessed on 15 October 2021).
  35. Eurostat. Complete Energy Balances [nrg_bal_c]. Available online: https://appsso.eurostat.ec.europa.eu/nui/show.do?dataset=nrg_bal_c&lang=en (accessed on 15 October 2021).
  36. Gómez, D.R.; Watterson, J.D.; Americano, B.B.; Ha, H.; Marland, G.; Matsika, E.; Namayanga, N.; Osman-Elsha, B.; Kalenga-Saka, J.D.; Trenton, K. Stationary Combustion. In 2006 IPCC Guidelines for National Greenhouse Gas Inventories; IPCC: Geneva, Switzerland, 2006; Volume 2, Available online: https://www.ipcc-nggip.iges.or.jp/public/2006gl/pdf/2_Volume2/V2_2_Ch2_Stationary_Combustion.pdf (accessed on 8 October 2021).
  37. European Environment Agency. Greenhouse Gas Emission Intensity of Electricity Generation 2020. Available online: https://www.eea.europa.eu/data-and-maps/daviz/co2-emission-intensity-6#tab-googlechartid_googlechartid_googlechartid_googlechartid_chart_11111 (accessed on 2 September 2021).
  38. Cabinet of Ministers. Regulation No. 42. Methodology for Calculating Greenhouse Gas Emissions. Available online: https://likumi.lv/ta/en/en/id/296651 (accessed on 3 June 2021).
  39. Central Statistics Bureau of Latvia. Fuel Consumption, Heat and Electricity Produced in Combined Heat and Power Plants by CHP, Energy Resources, Indicator and Time period [ENB140]. Available online: https://data.stat.gov.lv/pxweb/en/OSP_PUB/START__NOZ__EN__ENB/ENB140/ (accessed on 3 June 2021).
  40. Central Statistics Bureau of Latvia. Fuel Consumption and Heat Produced in Heat Plants, TJ by Heat Plants, Energy Resources, Indicator and Time Period [ENB110]. Available online: https://data.stat.gov.lv/pxweb/en/OSP_PUB/START__NOZ__EN__ENB/ENB110/ (accessed on 3 June 2021).
  41. ODYSSEE-MURE. Latvia Energy Profile. Energy Efficiency Trends and Policies 2021. Available online: https://www.odyssee-mure.eu/publications/efficiency-trends-policies-profiles/latvia.html (accessed on 20 November 2021).
  42. Central Statistical Bureau of Latvia. ATN010 Exports and Imports by Commodity Section and by Economic Activity (NACE Rev.2) of the Importer (Thsd Euro) by Flow of Goods, Economic Activity (NACE Rev.2), Commodity Group (CN) and Time period. Available online: https://data.stat.gov.lv/pxweb/en/OSP_PUB/START__TIR__AT__ATN/ATN010/table/tableViewLayout1/ (accessed on 20 November 2021).
  43. Gao, Z.; Geng, Y.; Wu, R.; Chen, W.; Wu, F.; Tian, X. Analysis of energy-related CO2 emissions in China’s pharmaceutical industry and its driving forces. J. Clean. Prod. 2019, 223, 94–108. [Google Scholar] [CrossRef]
  44. Broniszewski, M.; Werle, S. CO2 reduction methods and evaluation of proposed energy efficiency improvements in Poland’s large industrial plant. Energy 2020, 202, 117704. [Google Scholar] [CrossRef]
Figure 1. Energy consumption of the Latvian manufacturing industry.
Energies 14 08006 g001
Figure 2. Cumulative contribution of CO2 emissions by sector.
Energies 14 08006 g002
Figure 3. Fuel mix of manufacturing sub-sectors.
Energies 14 08006 g003
Figure 4. Energy intensities of Latvian manufacturing industry sectors.
Energies 14 08006 g004
Figure 5. Emission intensities of Latvian manufacturing industry sectors.
Energies 14 08006 g005
Figure 6. Aggregated decomposition analysis results for the time periods.
Energies 14 08006 g006
Figure 7. CO2 emission decomposition results for the manufacturing industry.
Energies 14 08006 g007
Figure 8. CO2 emission decomposition for the time period from 2015 to 2019.
Energies 14 08006 g008
Figure 9. CO2 emission decomposition results for the wood processing sector (C16).
Energies 14 08006 g009
Figure 10. Changes in the energy balance of the wood processing sector (C16).
Energies 14 08006 g010
Figure 11. Changes in emission intensity and share of RES in the wood processing sector (C16).
Energies 14 08006 g011
Figure 12. Correlation analysis between wood production amounts and share of RES.
Energies 14 08006 g012
Table 1. LMDI decomposition analysis indicators for industrial energy-related CO2 emissions.
IndicatorNotationTime PeriodVariableExplanationData Source
Activity effectAct1995–2019 Aggregated   industrial   value   added   ( i E U R i ) *Measures changes in the growth of the total production output[33,34]
Structural effectStr1995–2019 Share   of   production   output   of   a   subsector   in   the   total   industrial   production   ( E U R i / i E U R i ) *Measures the level of restructuring in industry by shifting to less energy-intensive sectors[33,34]
Energy intensity effectInt1995–2019The amount of energy consumed per unit of production output (GWhi/EURi) *Measures the level of energy efficiency improvement[34,35]
Fuel mix effectFuel1995–2019 Share   of   energy   consumption   of   non - renewable   energy   products   ( E i j / i E i )Measures the decarbonization effect of the industry[35]
Emission intensity effectEmi1995–2019Emission intensity of consumed energy resources (tCO2/GWh) *Measures the emissions intensity of the fuel mix[36]
* chain-linked volumes of base year 2015.
Table 2. Emission factors of fuels.
Fuel TypeEmission Factor, tCO2/MWh
Anthracite0.354
Other bituminous coal0.341
Coke oven coke0.385
Natural gas0.202
Gas oil and diesel oil0.267
Fuel oil0.279
Other oil products n.e.c.0.264
Renewables and biofuels0
Peat0.382
Liquefied petroleum gases0.227
Motor gasoline0.249
Other kerosene0.259
Lignite0.364
Petroleum coke0.351
Non-renewable waste0.330
Kerosene-type jet fuel0.257
Table 3. Decomposition analysis results in aggregated values for the determined periods.
1995–20002000–20052005–20102010–20152015–2019
∆ Activity effect353.1336.8−154.786.9186.9
∆ Structure effect123.981.4225.3−3242.626.5
∆ Energy intensity effect−668.5−248.8−88.52956.1−151.5
∆ Fuel mix−19.5−62.2−27.0−21.4−23.3
∆ Emission intensity effect−119.1−95.078.8−96.9−49.4
∆ CO2 emissions−330.212.333.8−317.8−10.7
Table 4. Main events during the representative period driving change in CO2 emissions.
Time PeriodMain Events during the Representative Period Driving Change in CO2 Emissions
1995–2000Period after the restoration of independence during which the entire Latvian economy, including the manufacturing industry, was significantly restructured. Significant reforms in the form of ownership and changes in the foreign trade regime affected the overall development of manufacturing industry. Imported raw materials and energy resources were now subject to world market prices, which meant that some factories that had previously been successful due to low energy costs were no longer competitive in export markets. This forced manufacturing companies to redesign production processes and invest in energy efficiency measures.
2000–2005The period before the financial crisis was mainly characterized by high economic growth and the increase in industrial production and energy consumption. Investments in the modernization of factories and in energy efficiency could not compensate for the effect of increasing activity, which drove up CO2 emissions.
2005–2010Period of the global financial crisis, during which a sharp decline in total production volumes was observed from 2006 to 2009. As a result, a significant reduction in energy consumption and emissions produced was achieved. However, in 2010, a sharp increase in industrial activity led to an increase in total CO2 emissions during this period. A shift towards more energy intensive sectors was observed during this period. The entire industrial sector experienced a significant structural change.
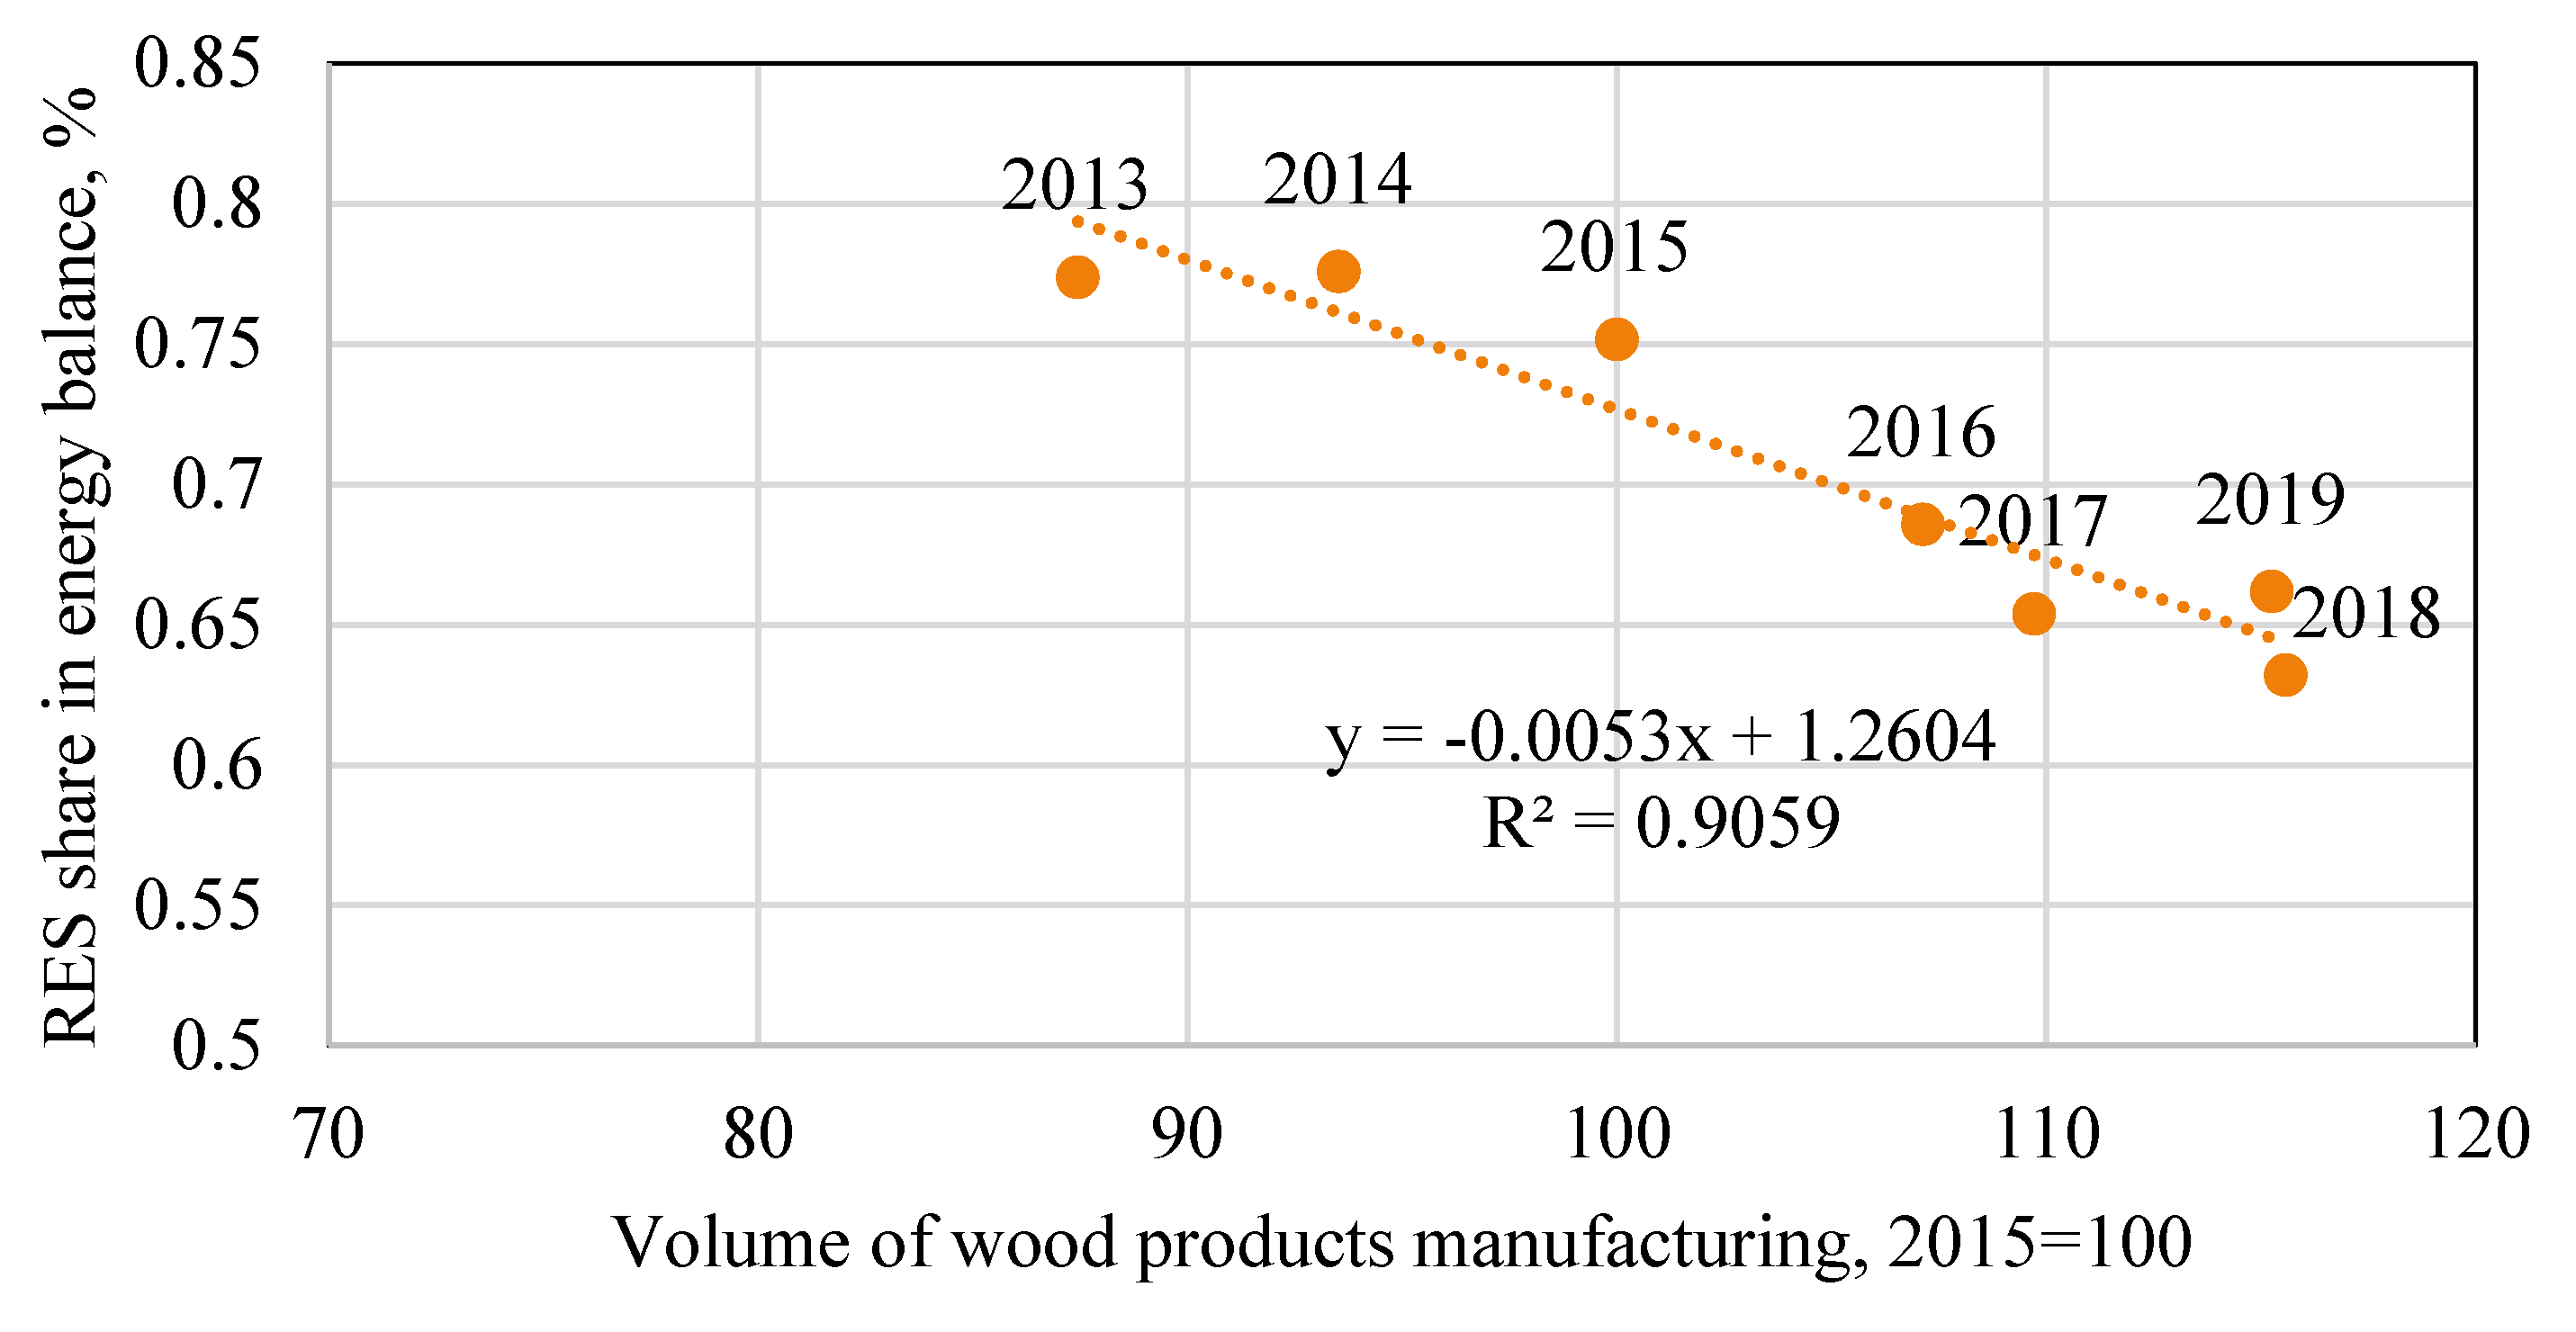
2010–2015Bankruptcy and market exit of the largest metal producer led to significant structural changes in the entire industry. The sudden decline in metal production was largely offset by the rapid expansion of the wood processing sector, which drove up energy consumption overall in the industry.
2015–2019Higher economic growth and rising demand in the largest export markets led to an increase in production output and caused energy consumption to rise. Although there is a positive trend in the overall decarbonization of the fuel mix and reduction of the emission factor, the overall growth rate of CO2 emissions shows an upward trend and reduction of CO2 is stagnating.
Table 5. Aggregate year-to-year changes in decomposition factors and CO2 emissions.
2010–20112011–20122012–20132013–20142014–20152015–20162016–20172017–20182018–2019
∆ Activity effect5824−7−304217496655
∆ Structure effect19−23−3787354524−711−1
∆ Energy intensity effect−17690367724−659−1332959−107
∆ Fuel mix−17−302−42840−34−9−20
∆ Emission intensity effect−30−57−2−135−61−76105−17
∆ CO2 emissions−1465−117−20−40−113−40232−90
Publisher’s Note: MDPI stays neutral with regard to jurisdictional claims in published maps and institutional affiliations.

