1. Introduction
The modern consumer more and more often does not want to be just a passive recipient of goods and services offered by producers but wants to be more active and creative during the consumption process [
1]. The consumer wants to participate not only in consuming but also in creating products and services, he wants his voice to be heard by producers not only at the stage of use but also at the stage of creation [
2,
3]. Prosumer behavior related to running a household is part of the model of green economic growth and contributes to the practical implementation of the concept of sustainable development [
4].
A phenomenon of the intertwining of consumption and production processes until the boundaries between them are blurred is called prosumption, therefore consumers become producers at the same time [
5]. The term “prosumption” comes from the combination of the two words “production” and “consumption” and means the interpenetration of production and consumption [
6]. Units become producers—they design or modify products to their liking [
7]. Prosumer is a creative and active consumer who disseminates his knowledge of good and bad experiences related to products or services among consumers, thus affecting their purchasing decisions, as well as exerting influence on the quality of goods and services produced [
8]. Prosumption is an expression of consumer opposition to mass, standardized production. The consumer wants to be treated individually because everyone has different needs, preferences, and tastes [
9].
The consumer is faced with the choice between buying goods and services on the market and prosumption, which is the most effective way of meeting the needs of household members, minimizing the effects of inflation, and helping to protect the level of meeting needs [
10]. Prosumers are people who choose to produce or coproduce specific goods and services. Some of them pursue their passions in this way. Others wish to become independent from mass production in the process of meeting their own needs. Various factors lead to buyer involvement in prosumption. These are, among others: shortening the working time, reluctance of educated people to take up boring jobs, rising costs of qualified labor, increased interest in physical activity as a method of mental rest, the desire to improve the quality of goods, and the need for self-expression [
11].
The main factors of prosumption development include general determinants related to consumption (biological, economic, social, cultural, and technological factors), as well as specific factors that can be attributed only to prosumption. They can be distinguished among [
12]:
- -
increasing the amount of free time and the need for its management,
- -
the opportunity to perform professional work at home and intertwine it with consumer activities,
- -
development and dissemination of education,
- -
changes in work organization and reevaluation of its role in human life,
- -
evolution of work towards creativity.
There are also other divisions of specific factors of prosumption development, which include economic and social trends, technological progress, development of knowledge and research methods as well as the activity of enterprises [
13]. Prosumption affects the dissemination of a new life model and a new style of work. The traditional division into working time and free time disappear, and the increase in free time favors the development of prosumption. According to Zalega (2014), prosumer consumption is also affected by the rising costs of many services, the collapse of the bureaucratic system of second-wave services, and the development of new technologies [
14]. A factor in the development of prosumption is the decline in real household income. This can be particularly visible in times of crisis when the decreasing purchasing power of households forces them to take up activities, produce products on their own, or limit the use of services to perform them yourself. This form of prosumption is associated with natural consumption and the self-production of products [
15].
An additional factor affecting home production and service activities in households are the consumer’s skills. Virtualization of life, easier access to new technologies, such as the internet or mobile phone, means that consumers can communicate with each other, sharing their skills and opinions about products and services by uploading photos and videos of things they made [
16].
Prosumer behavior not only applies to tasks taken over by active consumers from enterprises, but also to non-marketable forms of work and production that can only be carried out in the household sector. Such activities include preparing food, cleaning, raising children, and maintaining a social life. They play a key role in the entire economy because they largely determine the physical and mental characteristics of employees, as well as the number and structure of supply on the labor market [
17].
On television and the internet (especially in social media), you can find instructions and videos on how to perform actions yourself at home [
18]. An important effect of prosumption is also the creation of (often virtual) communities with similar interests, jointly developing new concepts, cooperating, and cocreating new solutions [
19].
The recognition of farmers as food prosumers from Toffler’s Third Wave made the topic re-emerge. In the era of globalization and the phenomenon of overconsumption, considering the conditions of sustainable development and sustainable consumption, consumers think about returning to nature and following such a consumer trend [
20].
The importance of the role of self-supply in the concept of sustainable development is supported by the fact that food obtained from self-supply is fresh—without the need to undergo industrial preservation processes, does not lose nutrients during storage, and does not contain food additives (e.g., preservatives). In addition, it does not generate costs in long-distance transport, energy costs during refrigerated storage and does not pollute the environment with an excess of organic and packaging waste [
21]. Self-grown food does not go through the industrial processing phase and the market. This means that the supply chain is the shortest possible in this case [
22]. It also helps to reduce unethical food waste [
10].
One of the first detailed studies on self-supply in agriculture was conducted in Poland by Chmielewska [
23]. The author showed that the level of self-supply of food differs due to the socio-economic characteristics of households. Interesting research on the role of food self-supply in the theory of sustainable development and sustainable consumption was presented by Głowicka–Wołoszyn and coauthors [
21]. The study by Strzelecka, where the source of data was the FADN database, is also noteworthy. Research showed that during the economic crisis, as a result of a decrease in income from conducted activity, there is an increase in self-supply of farms [
24].
In Poland, research on the prosumer activity of consumers in terms of both the production of goods and services by the same group of respondents was, so far, carried out only by Nowak [
25] and Murawska and Długosz [
26].
Nowak in his research on consumption and prosumption in housekeeping in Kujawy and Pomerania Region in Poland defines prosumption as “replacing the use of market services through their performance”. His research showed that households predominated that more than 50% of services were performed as part of their household (57%), while 43% of households commissioned over half of the work to professionals. Simple but time-consuming activities such as washing and organizing nutrition were most often performed at home. The organization of special events constituted a significant part of services performed on their own. Over half of the respondents carried out the renovation of the apartment on their own. A small percentage of people performed on their own: home appliances repair, furniture repairs, hairdressing services, radio, and TV equipment repair, house construction, or sewing. This meant giving up specialized services as part of the household [
25].
The research carried out by Murawska and Długosz shows that consumers are active in the field of prosumption. They express their opinions on products and services, using modern technologies and devices offered on the market of goods and services, i.e., they often design the interior of the apartment on their own, renovate it, run a garden, or prepare preserves, and thus reduce costs. [
26].
According to Czuba, consumers decide to limit the use of certain types of services and products on market terms for proecological reasons and indicate the great importance of such activities for the practical implementation of the concept of sustainable development [
4].
Other reasons for prosumption are given by Veen, Dagevos, and Jansma. The respondents of their research indicate personal and pragmatic reasons, such as the pleasure of producing food or the enjoyment of gardening, as reasons for engaging them in some form of prosumption. These motivations are not due to concerns about sustainability or the creation of an alternative food system. The authors argue that it is more appropriate to take a pragmatic approach to the concept of prosumption in the field of food than to combine it with themes related to power, capitalism, or activism [
27].
Kosnik in her research dealt with the ethical issues of undertaking various forms of self-supply by farmers in Central Europe and New Zealand [
28].
Community gardens are also one example of prosumer behavior [
29,
30]. Establishing community gardens is a long-term process without an imposed project where the local community collaborates. During cyclical meetings of all those interested in the subject, the area is tidied up, the garden infrastructure is created, and plants are planted. All activities are made by hand, and the items that are handled are made by hand using recycled materials.
Do-it-yourself (DIY) housework is another manifestation of prosumer behavior related to running a household. According to the DIY concept, consumers relatively often demonstrate prosumer activity in the scope of running a household; they design and modify products according to their preferences and needs [
31,
32,
33]. Therefore, a new type of consumer was created—a consumer-craftsman who designs and manufactures products himself, using his skills, knowledge, and passion, while being motivated by the desire for self-expression [
34,
35,
36].
Since 14 March 2020, an epidemic threat was announced in the Republic of Poland in connection with SARS-CoV-2 virus infections. The appeal of the authorities to stay at home led to the mobilization of the population for prosumer activities in the household. For many people, it turned out to be the time to do all the things that were put off at home for later. General cleaning at home, window cleaning, refrigerator, washing machine, oven, etc., as well as furniture, renovations, replanting flowers on the balcony, or garden care.
The main goal of this research is to assess consumer behavior in terms of various forms of prosumer activity on the market of household-related services. The study used principal component analysis (PCA) and selected descriptive statistics. During the survey, the respondents indicated the level of prosumer activity related to running a household. On this basis, using selected statistical methods, the division of services related to running a household into three categories was made.
The paper contributes to the existing literature in several ways. First of all, it concerns rural households, and secondly, it concerns various forms of prosumer activity.
The novelty of these studies is the characterization and evaluation of the phenomenon of prosumption in the category of goods, including food production, but also the provision of services on one’s own, which is not analyzed by researchers at the same time. In this case, both the prosumption of goods and services were treated comprehensively, using the PCA method to evaluate individual indices, which were separated based on the conducted analysis. The research results have shown that the services performed can be grouped into three categories, i.e., the index of basic living self-sufficiency of households, the index of renovation and repair self-sufficiency, the index of professional self-sufficiency of farms. Another interesting element of this study is the fact that the surveyed group of respondents lives in rural areas. It is a group of farmers, as well as agricultural and labor farms, and farms not related to agriculture at all.
The authors chose the following logical structure of the article. The first part of the article contains an introduction that includes justification of the relevance of the topic, the purpose of the research, and the structure of the article. In addition, provides an appropriate theoretical basis for the development of prosumption and the importance of this form of consumption for both consumers and producers.
Section 2 contains research methodology. The results of the research are discussed in the section Results, which consists of three subsections:
Section 3.1,
Section 3.2,
Section 3.3. The paper ends with conclusions containing the most important research findings.
2. Materials and Methods
To analyze prosumer behavior related to running a household, direct research was conducted regarding the self-supply of food and household services. The empirical material contained in the work comes from surveys conducted in rural areas of Masovian Voivodeship, in the form of a questionnaire on a sample of 302 respondents in 2017 in Poland. The group of respondents is a non-representative sample. A questionnaire survey of the incident group was conducted, from which only respondents from the area of Masovian Voivodeship were selected. The research was conducted during an on-site interview. The respondents filled in a paper questionnaire, which was later entered into the database at SPSS.
Masovian Voivodeship was selected as the area of empirical research on purpose. Although it is the richest region in Poland, assessed according to the level of GDP per capita, it is also the most spatially diversified region in terms of socio-economic development. In turn, the self-supply of households, according to the Central Statistical Office data, in Masovian Voivodeship is at the average level for the entire country.
During the survey, the respondents indicated the level of prosumer activity related to running a household, choosing respectively: lack of services, low, average, high. The types of services that respondents were asked about in the questionnaire were identified based on a literature review [
25,
26] and previous authors’ research [
37].
The collected research material was further coded, while the data set created on the basis was processed with the SPSS statistical package. Statistical analysis was performed in SPSS. Then, after grouping, counting, and initial description of the collected data, they were analyzed. For this purpose, among others, the principal component analysis method.
Principal component analysis (PCA) is one of the statistical methods of factor analysis. The first use of the principal component analysis method was initiated by Pearson in 1901 [
38]. However, the main development of this method (the 1930s) is due to the work of the American statistician Harold Hotelling, who used it to analyze school achievement tests [
39]. Principal components analysis (PCA) is used among others to reduce the number of variables describing a phenomenon or to discover patterns between variables. It consists of determining components that are a linear combination of the variables studied [
40].
The algorithm for proceeding in the principal components analysis is as follows [
41]:
Before starting the analysis of principal components, one should check the basic assumption to assess the legitimacy of its application, namely, the correlation of variables—the higher the correlation between primary variables, the more justified the use of this analysis. The correlation is examined by analyzing the correlation matrix for variables taken for analysis.
Assumptions:
Normality of distribution—this assumption is not necessary when analyzing a large data set.
Size and representativeness of the sample—analysis is started when the sample has at least 50 observations. The sample should be taken at random. The set of observations must be homogeneous.
Outliers—often distort true relationships between variables. It is good to detect such points at the beginning of the analysis and remove them from the data.
Missing data—in the case of missing data in the analyzed sample, the missing values should be replaced by means or the cases with missing data should be removed.
If the analyzed variables are comparable (they are expressed in the same units and are of the same order), then the covariance matrix is used in further analysis. However, if the variables have different units or are of a different order, the principal components analysis is performed using the correlation matrix. This is an important step to start the whole analysis because the main components obtained for the covariance and correlation matrix do not have to be the same.
is a vector of variables used for analysis. Principal components are a linear combination of initial variables:
The next step is to determine the matrix of coefficients for for the given observation vector X.
Important information is that each subsequent determined main component explains a smaller and smaller part of the variability of the initial variables. At some point, it turns out that one component determines a negligible part of the variability. Therefore, components should be reduced, using only the most important ones in further considerations.
The most commonly used reduction criteria are:
The criterion of sufficient proportion—the degree of explained variance of the original variables must be at least 75%. In practice, usually with 2–3 main components, the degree of explanation of variance is sufficient.
Kaiser criterion—elimination of principal components whose eigenvalues are less than 1.
Scree plot—determination of further eigenvalues on the line graph. The interpretation consists in finding a place from which a slight decrease in eigenvalues occurs to the right. No more factors should be considered than those to the left of this point. The selection of the appropriate criterion is the subjective decision of the researcher.
Interpretation of the results obtained is carried out using factor loadings. Factor loadings are the correlation coefficients between a given variable and components.
If the above analysis is performed based on the covariance matrix, then the correlation coefficient between the
i-th variable
and the
j-th component
for
is calculated from the formula:
where:
—the standard deviation of the variable ,
—the variance of the main component , as well as the j-th eigenvalue of the correlation matrix (covariance), on which the entire analysis is based,
—component standard deviation .
However, if the components are generated from a correlation matrix, then:
The sum of all eigenvalues of the correlation matrix (covariance)
is the total variance of the system. This allows you to define a part of the total variance determined by the
j-th component:
The percentage share of total variation explained by the first
K components is calculated as follows:
Accurate analysis of the principal components allows indicating those initial variables that have a large impact on the appearance of individual principal components, i.e., those that form a homogeneous group. The main component (in which variance is maximized) is then a representative of this group [
42].
3. Results
3.1. Descriptive Statistics
Table 1 presents the structure of the studied population. A total of 58.9% women and 41.1% men participated in the study. The most numerous age group were people aged 45–54 (29%). In the sample of respondents, according to the adopted research assumptions, people were living in rural areas from ten municipalities in the Mazowieckie voivodship in Poland. The survey asked respondents about their level of education. The interview questionnaire presents seven categories of education: primary, lower secondary, basic vocational, general secondary, vocational secondary, postsecondary, and higher. The most populated group was people with general secondary education, comprising about 38% of respondents. Almost one-in-five respondents had higher education (18.2%). In the sample examined, the smallest group consisted of people with basic education (4%) and basic vocational education (4.3%). The researched farms are mainly two- and three-generation families, where four-person households predominate. In the structure of households according to a number of people in a household, the largest group was constituted by 4-person households—29%. Approximately 32% of households surveyed had children up to the age of 14. Households without children up to 14 years old constituted 68% of respondents, with one child 18%, with two—10%, with three and more—4%. The largest group among the respondents were people whose monthly income was in the range of EUR 119.00–237.00 (28.8%). For 9.3% of respondents, the monthly household income per capita did not exceed EUR 118.00. The group of respondents for whom the income was over EUR 474.00 per month constituted 17.9% of the surveyed population.
Respondents were asked to specify to what extent they perform services related to running a household, and to what extent they outsource these activities to third parties, and how important this form of satisfying consumer needs is for them. To measure the level of household self-supply in services, a service consumption structure meter was used to determine the share of services performed alone in total services. The declared level of service (lack of services, low, average, high) was a subjective answer of respondents. Household members participating in the survey showed great interest in performing home services themselves (
Table 2).
The number of respondents who do not undertake the provision of household services at all is shown in column 2 in
Table 2. The least frequently outsourced activities are preparation of meals, cleaning the house, ironing, and laundry. These are simple but time-consuming activities. Laundry services are primarily subject to availability. A small number of laundries are noticeable in the villages, and the use of facilities offering this type of service is unpopular. The respondents used laundries mainly for items requiring specialized washing or cleaning (85%).
In response to a question about preparing meals at home, 55% of respondents indicated that they prepare meals only on their own, which is mainly associated with family tradition. Eating together at a time when society is very busy with work allows you to meet together at least at a shared meal. A significant part of services performed on their own was the organization of special events, i.e., birthdays, name days, anniversaries, child’s communion, etc. About 20% of the respondents performed the renovation of the apartment (painting walls and ceilings and wallpapering).
The results of research on tailoring services showed that every fourth respondent does not deal with sewing on their own. This may be mainly due to a decrease in interest in learning to sew. Fewer households have sewing machines, and the tradition of passing on sewing skills from generation to generation is not continued. Besides, the market is flooded with all kinds of clothing, which significantly reduces the need and desire for self-sewing. Many stores offer various types of modifications—shortening, narrowing, and this frees you from having to do it yourself. Nearly 30% of respondents can sew and do this type of tailoring at home.
Concerning running a household, respondents most often use truck transport services (67%). Research has shown that it is very difficult for farmers to complete their applications for direct payments. While completing the application documents (applications to the Agency for Restructuring and Modernization of Agriculture), over half of the respondents used the help of another person—public or private agricultural advisory. Only 13% of respondents did not have any problems completing the documents themselves.
3.2. Correlations
In the first step of the statistical analysis, correlations between input variables were calculated (
Table 3). Correlations between most questions are quite high, but there are no statistically significant correlations between some questions. The presence of a large number of statistically significant correlations suggests the use of the principal component analysis method (PCA), however, it is expected to isolate more than one component, as the relationships between questions are not uniform.
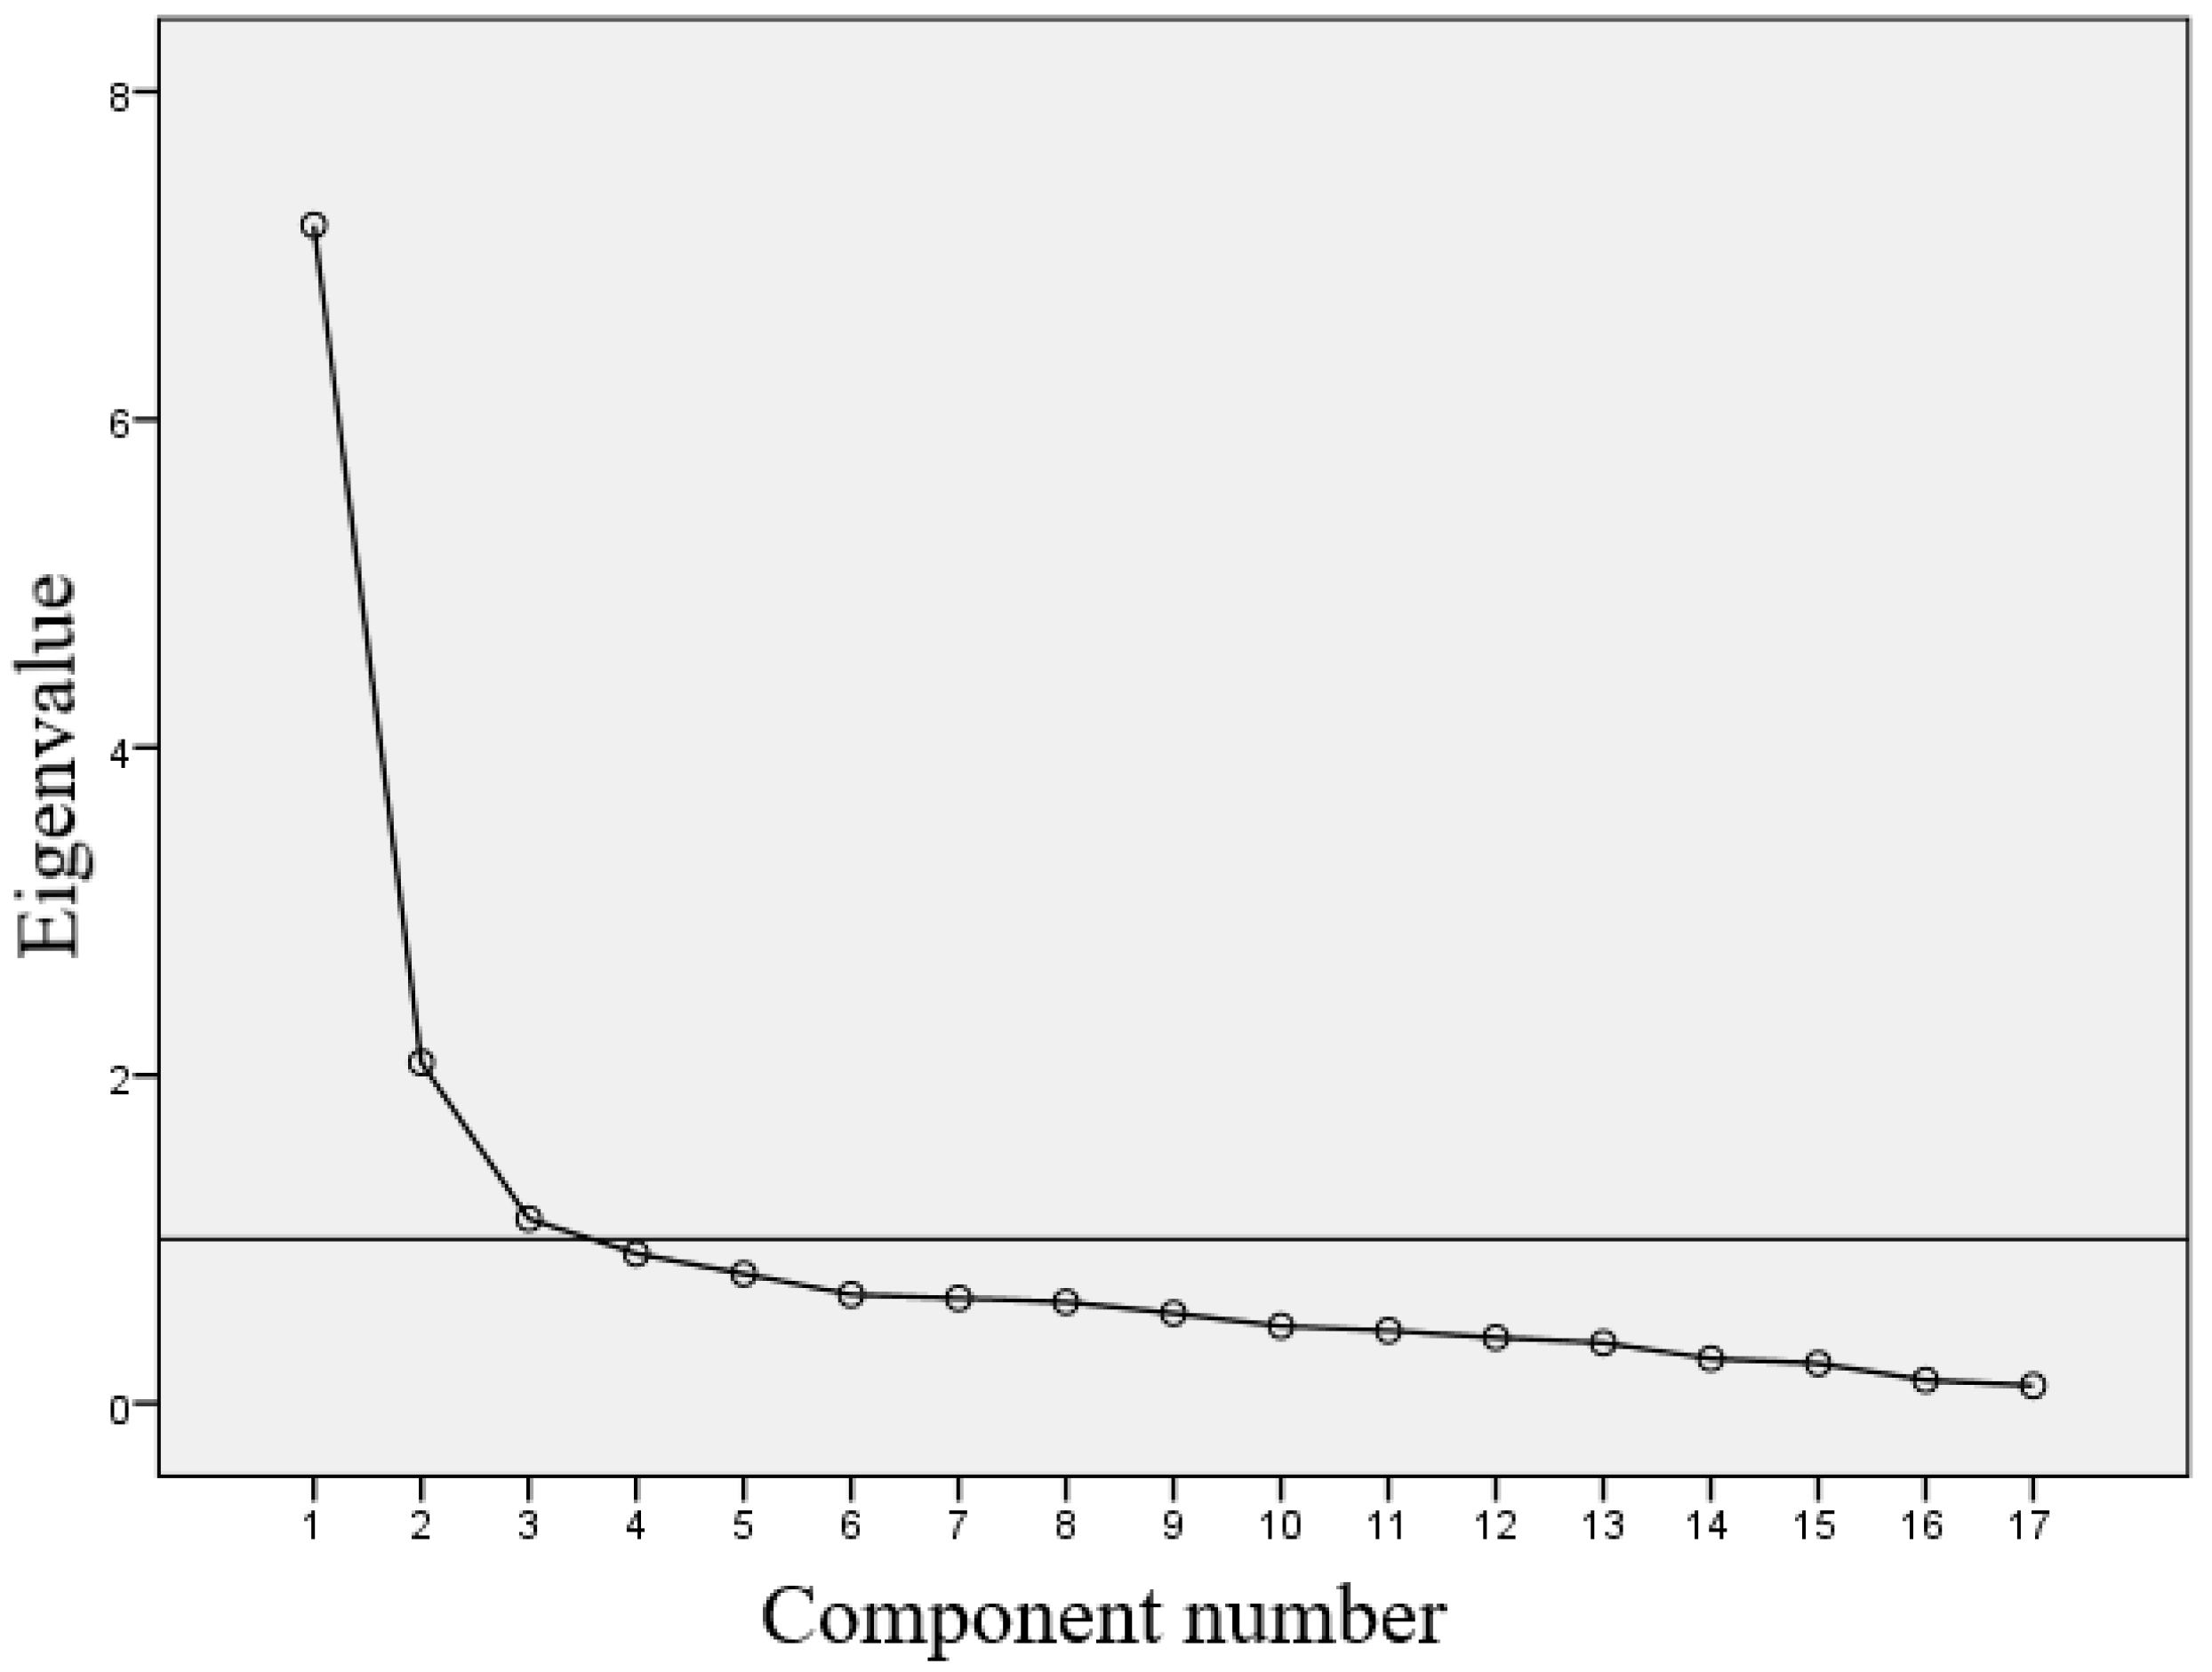
3.3. Principal Component Analysis
In the second step, the actual PCA was started. Firstly, the number of extracted components was determined. For this purpose, the scree plot and the size of variance extracted by individual components were used. The scree plot (
Figure 1) indicates that three components should be distinguished, as the eigenvalues obtained for them are greater than 1.
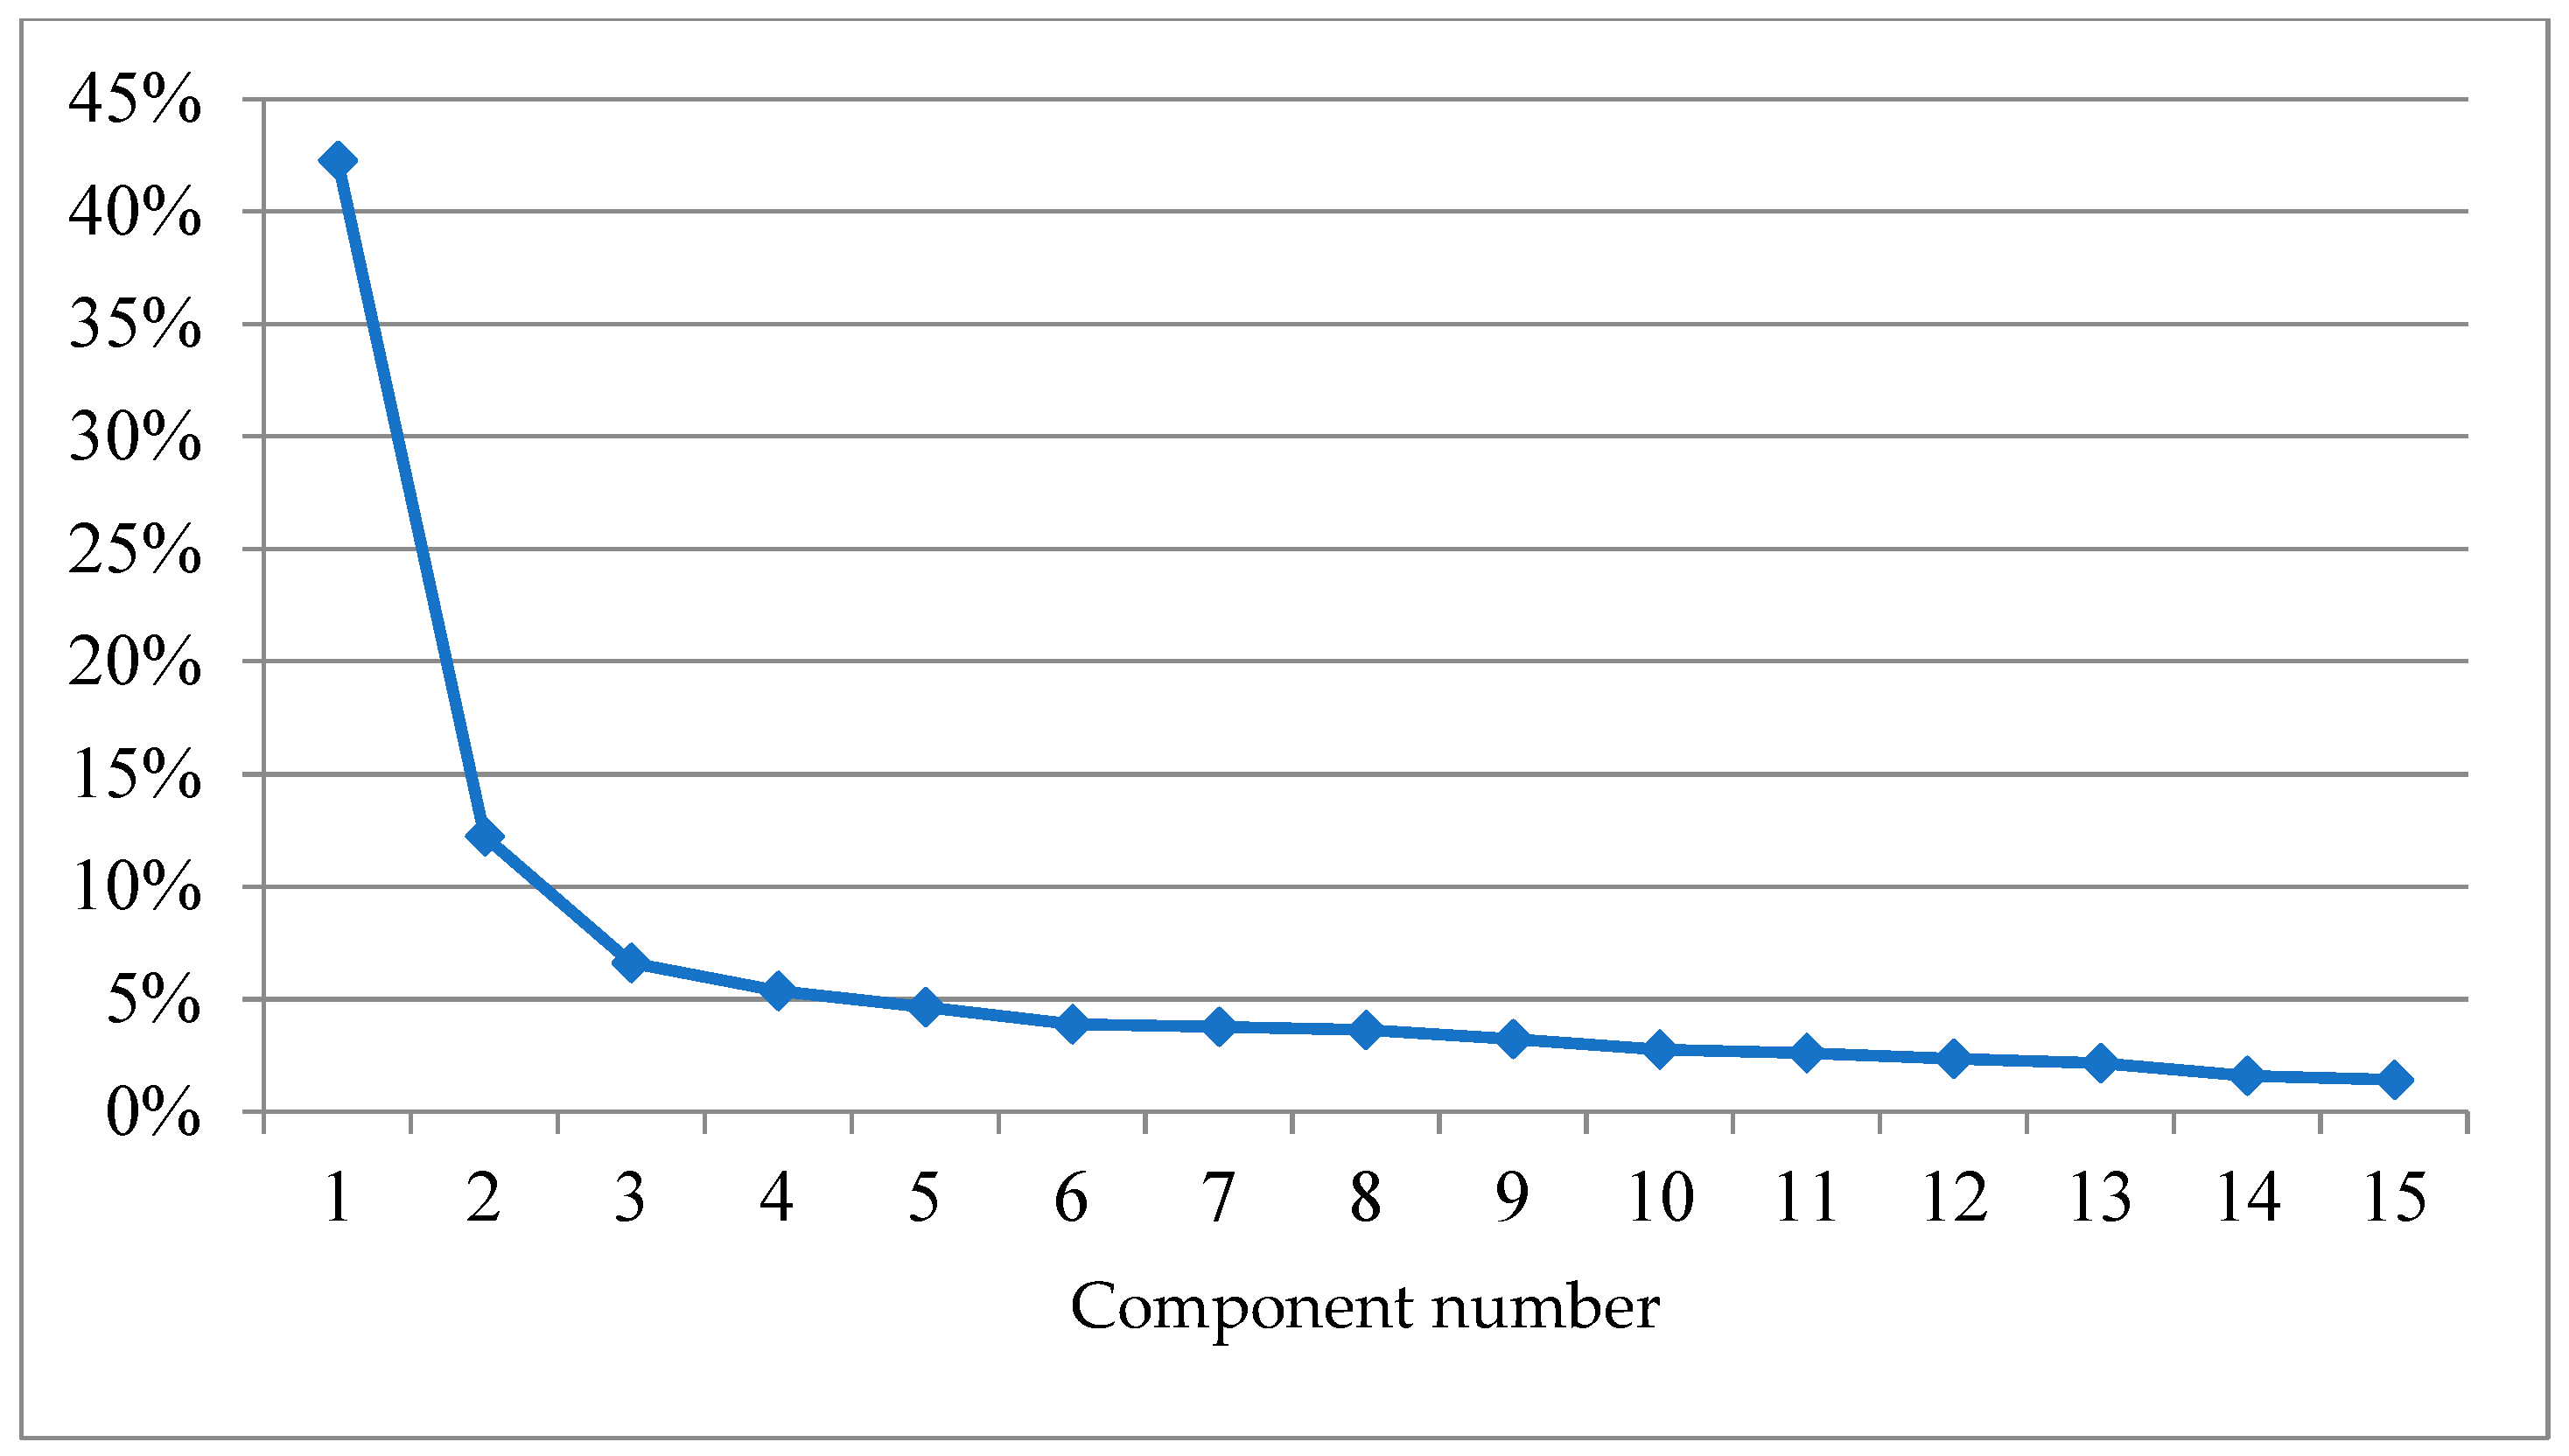
Similar conclusions are provided by the graph showing the extracted percentage of variance (
Figure 2). It is quite high for the first 3 components, but for the fourth one, it falls below 5%. Based on this criterion, one can postulate the separation of 2 or 3 components. The third component has interesting content to interpret, so the solution with three components was left.
Overall, the solution retains 61% of the data set variance, which is a satisfactory result [
41]. Most information is provided by the first component (31% after rotation); the next components, 18% and 12% (
Table 4).
Table 5 presents the share of extracted variance in each of the input questions. For most of them over 50% was identified. There are no questions about the low share of isolated variance, so all can be left in the analysis.
The next step of the analysis presents the interpretation of the isolated components.
Table 6 show the relationship between original questions and components. The higher the ratio, the stronger the relationship. On this basis, we proceed to component interpretations.
The selected varimax rotation method minimizes the number of factors needed to explain each variable. This method simplifies the interpretation of the observed variables.
The first component (C1) has a strong relationship with the variables X1, X2, X7, X8, X9, X10, X11, X12, X13, i.e., with most variables. There is no link with variable X6 describing the scope of transport services for truck transport, variable X4 (repair of means of transport), X14 (agricultural machinery repair), X15 (filling out applications for direct payments), X16 (plumbing services), i.e., so more specialized services related to business and professional activities. Therefore, the first component (C1) can be interpreted as an index of basic household self-sufficiency. This index describes simple housework related to physical work directly related to running a household.
The second component (C2) has strong connections with the questions X16 (plumbing services), X17 (flat renovation), X3 (repair of home appliances, electronics in the home), X4 (repair of means of transport), and X5 (transport service (passenger car). These are more technically advanced services, requiring some technical knowledge and physical strength, commonly known as “men’s works”. These are not the basic tasks necessary for the survival of a household, they do not respond to basic living needs. This component can be defined as an index of self-sufficiency in renovation and repair. This index describes activities related to professional knowledge and skills, and it sometimes supported tips that can be found in professional magazines or the internet on special blogs and forums.
The third component (C3) has clear connections with three variables: X6 (transport service (lorry)), X14 (agricultural machinery repair), and X15 (filling out applications for direct payments). These are not living needs, but specialized needs typical of farms, necessary not for the survival of family members, but the economic functioning of these farms. Therefore, this component can be defined as the index of professional self-sufficiency of farms.
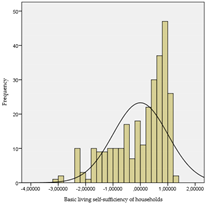
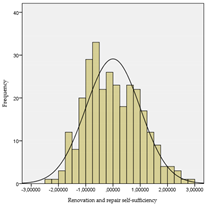
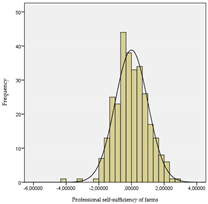
Three indexes were obtained as a result of the analysis:
C1—the index of basic living self-sufficiency of households,
C2—the index of renovation and repair self-sufficiency,
C3—the index of professional self-sufficiency of farms.
Descriptive statistics and histograms for all three indexes are presented below (
Table 7 and
Table 8).
Indexes have different distributions. In terms of living self-sufficiency, most households record high and very high self-sufficiency. In terms of repair and renovation self-sufficiency, most farms are below average; they use the services of external entities. The last index seems to be quite uniformly distributed.
The conducted analyses show that consumers are active in the area of prosumption related to running a household and, in the case of farmers, also of a farm.
The level of satisfying consumer needs in such a way is so high that in the era of excessive consumption and striving for sustainable development practices, it can be assumed that this is good practice.
4. Discussion
The current article is devoted to the problem of prosumption, which can be considered as a phenomenon not often analyzed by the researchers; in particular, when it comes to the scope of selection of prosumer activities—in our study, these are behaviors related to running a household.
The conducted research shows that households are still active in designing, producing, and delivering goods and services necessary to meet consumer needs. Only farms participated in the study, which can be divided into three groups: typically, agricultural farms, agricultural and labor farms, and rural farms not associated with agriculture at all. Taking into account the criterion of linking farms with agriculture, the respondents were also asked about services related to running a farm.
The level of self-supply of households with goods and services was very high. Similar results were obtained by Nowak in their research, but also by Murawska and Długosz. Statistical analysis showed that individual categories of services can be divided into three groups of prosumer behavior. The first group is prosumer behavior related to the basic living self-sufficiency of households. These are simple household chores related to manual work directly related to running a household: cooking, washing, ironing, cleaning the house, and caring for children and the elderly. The second group of prosumer behavior is basic renovation and repair work. They require more work, technical knowledge, and physical strength. These are not essential jobs for the survival of a household but are part of a lower-order need. Not every person has the range of knowledge and skills to perform such tasks on their own, hence you can often use the advice contained in special blogs and internet forums. This group of services includes plumbing services, apartment renovation, repair of household appliances, electronics, and means of transport. The third group of prosumer behaviors are specialist needs typical of farms, necessary not for the survival of family members, but the economic functioning of these farms. This type of prosumer behavior is typical of agricultural or agricultural-worker households. Typical agricultural services can be distinguished: scope of transport services for truck transport, repair of agricultural machinery, and filling out applications for direct payments.
The obtained research results show that Polish consumers are interested in prosumer activities related to running a household, and the time of the COVID-19 pandemic is now even more conducive to such behavior [
43].
The conducted research, in the context of its political consequences, are important for creating activities supporting small family households producing food for self-supply. This type of prosumer behavior is part of the theory of sustainable development, sustainable consumption, and responsible consumption.
Prosumer behavior is important both from the point of view of caring for the natural environment, but also for economic reasons. They save money if done on their own, especially during economic crises, rising inflation, and higher costs.
In subsequent research activities, it would be interesting and worth analyzing if the research sample consisted of both rural and urban households and to investigate how prosumer behavior changed during the COVID-19 pandemic. The planned future research on the impact of the COVID-19 pandemic on the prosumer behavior of households will also take into account the energy aspect (prosumption on the energy market).
The limitation of the conducted studies is that they are not representative and cannot be generalized to the entire Polish population. But a sample of 302 respondents is appropriate for a correct statistical analysis from which correct conclusions can be drawn.
5. Conclusions
Prosumption is defined as the activity of consumers in the selection and creation of products and services tailored to their needs. Prosumption requires consumers to be involved, devote time, contribute their effort, a specific commitment, and create not only for themselves, but also for others.
Based on the analyses, prosumption is popular among consumers living in rural areas. Only a few households outsource their basic domestic services. Only 7% of the respondents do not prepare meals at home, but eat meals in restaurants or bars, or buy ready-made meals. Ironing and cleaning the house 8% of respondents outsource to companies specializing in these services on the market, which means that the remaining group of respondents (92%) perform them entirely or partially at home. The most frequently outsourced services are truck transport services, filling out applications for direct payments, agricultural machinery repair—these are more specialized services related to running a farm.
Most of them do household work on their own and in the future also intend to exhibit such forms of prosumer activity. Prosumer voluntarily and willingly participates in the processes of cocreating and improving products and services, creating new ideas and solutions related to running a home. This is due to the inclusion of prosumption in new consumer trends, but also the economic aspect. A factor in the development of prosumption in recent years was also the economic crisis, which forced consumers to take up more activity, to manufacture products on their own, or to limit the use of services to perform them themselves. The PCA method assessed the level of prosumer activities related to running a household. The types of services performed were grouped into three categories: the index of basic living self-sufficiency of households, the index of renovation and repair self-sufficiency, and the index of professional self-sufficiency of farms. This means that as part of running a household, simple household activities are carried out, such as washing or cleaning, but also renovation work that requires more skills or work strictly related to running a farm. Obtained conclusions can be a valuable source of knowledge about a phenomenon of prosumption, both for producers of goods and enterprises providing services. There are areas of activity in which prosumers are the most active, and knowledge of this allows better tailor the company’s offer to the needs of households. It may translate into the development of an innovative economy in coexistence with rational and responsible consumption.


 ,
, 
