
Experimental Investigation on the Performance and Emission Characteristics of a Compression Ignition Engine Using Waste-Based Tire Pyrolysis Fuel and Diesel Fuel Blends


Abstract
:1. Introduction
2. Methodology
2.1. Measured Engine Operating Points
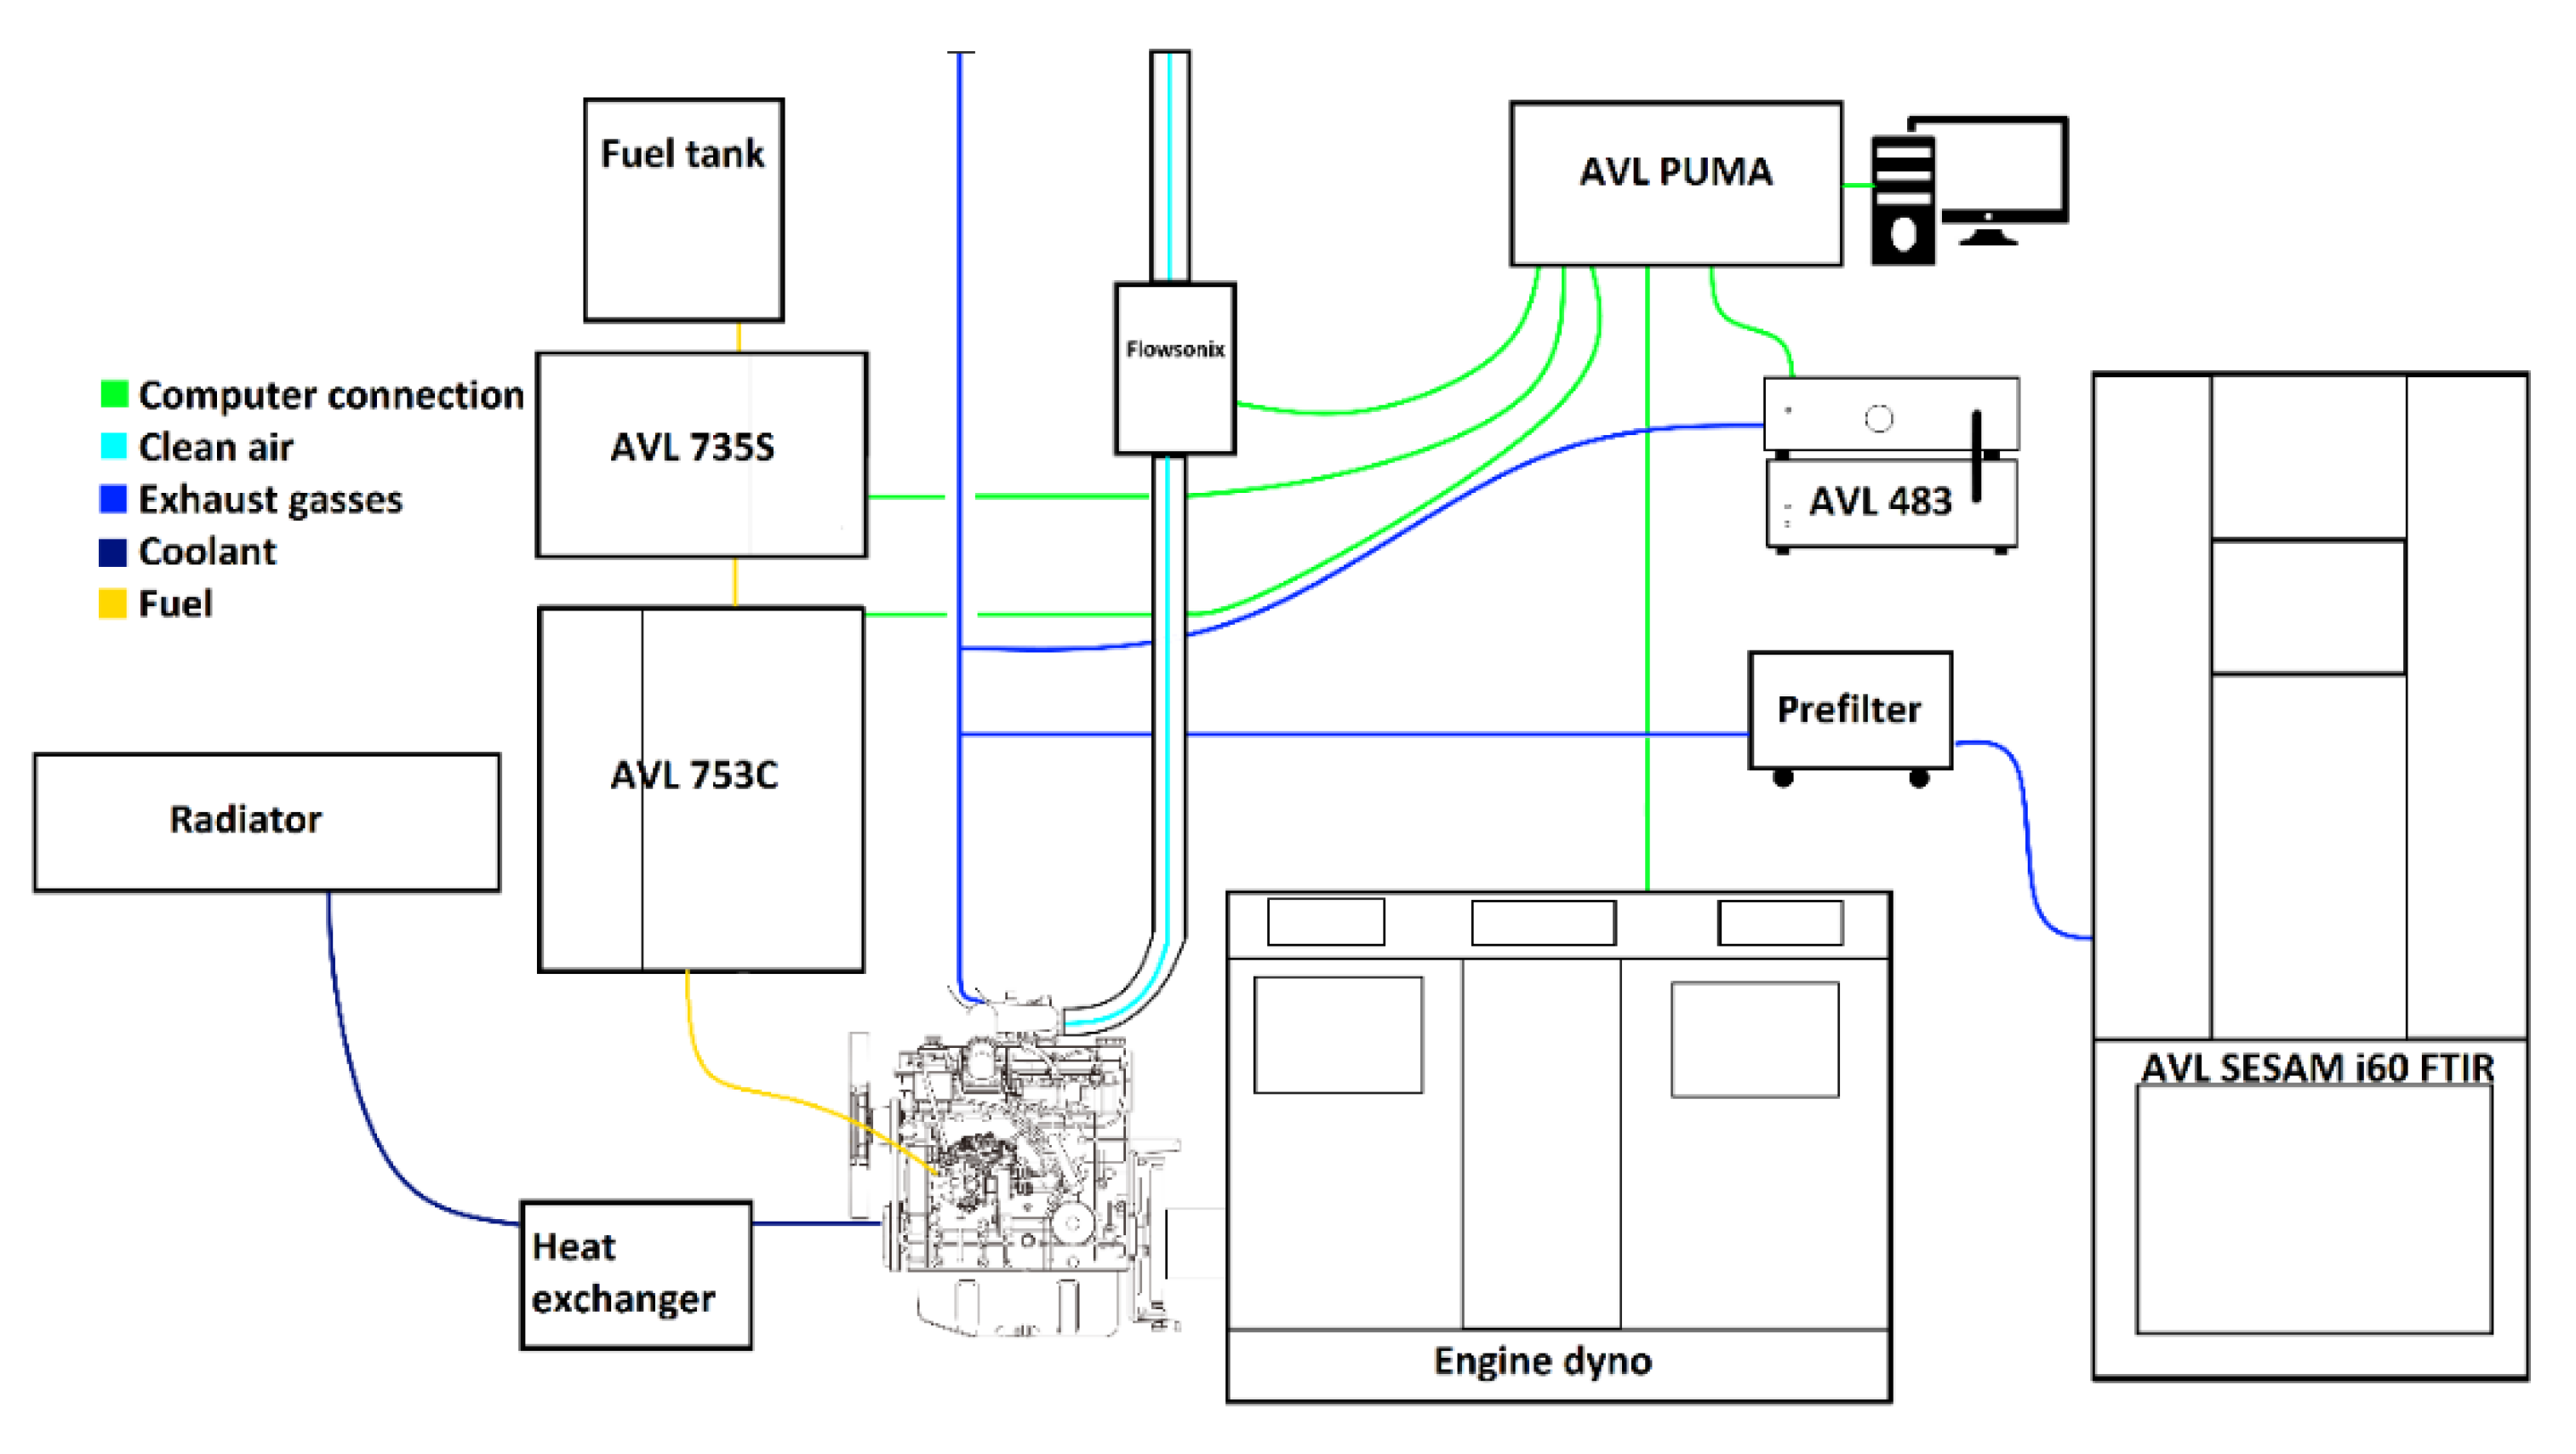
2.2. Exhaust Gas and Particulate Matter Measurement Method
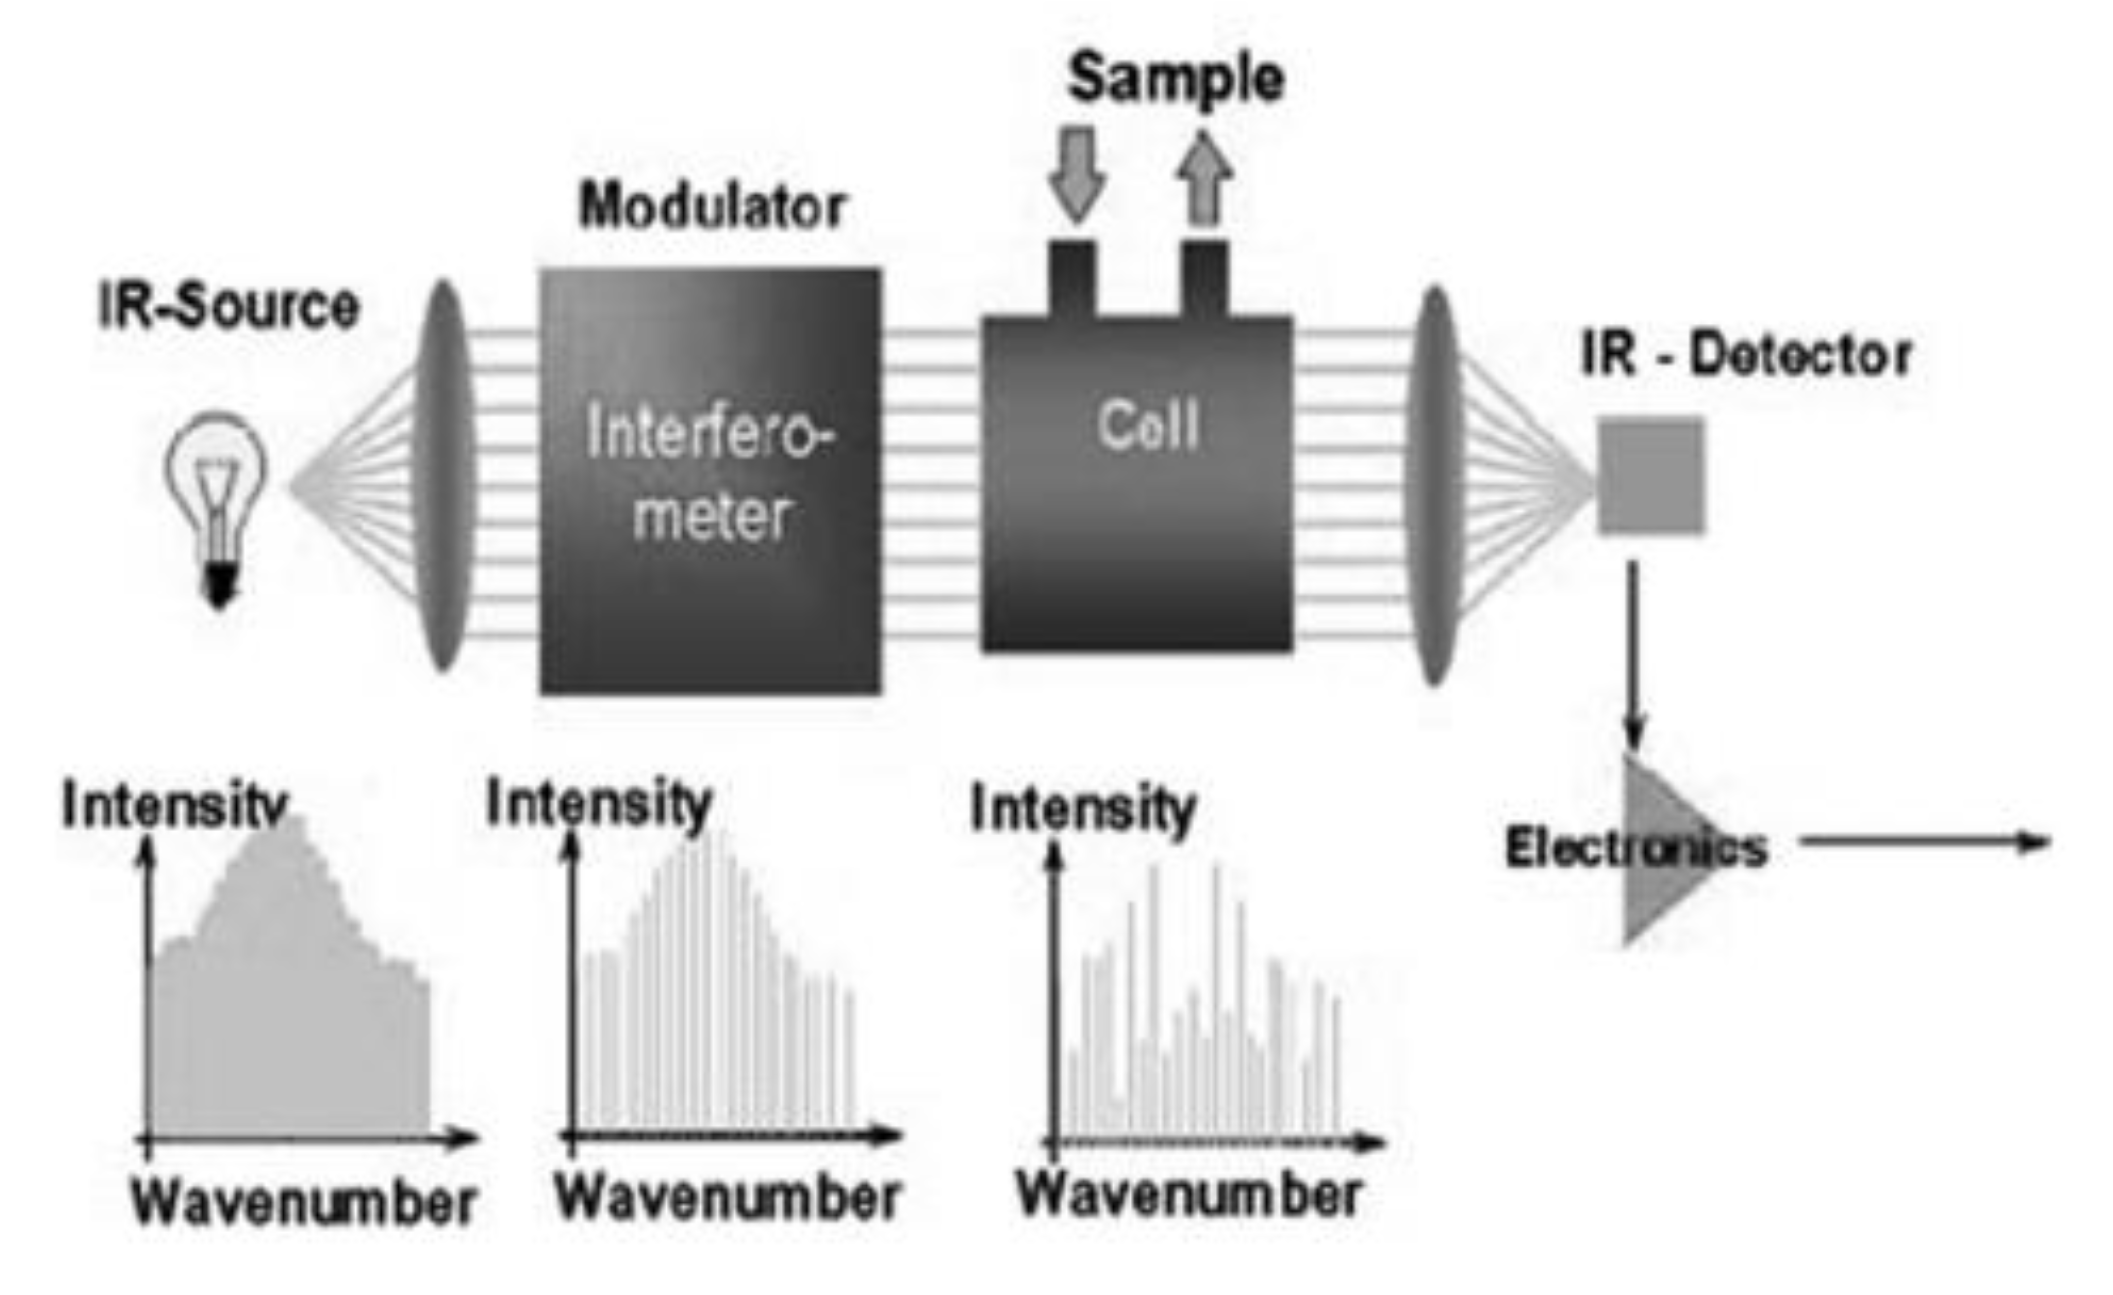
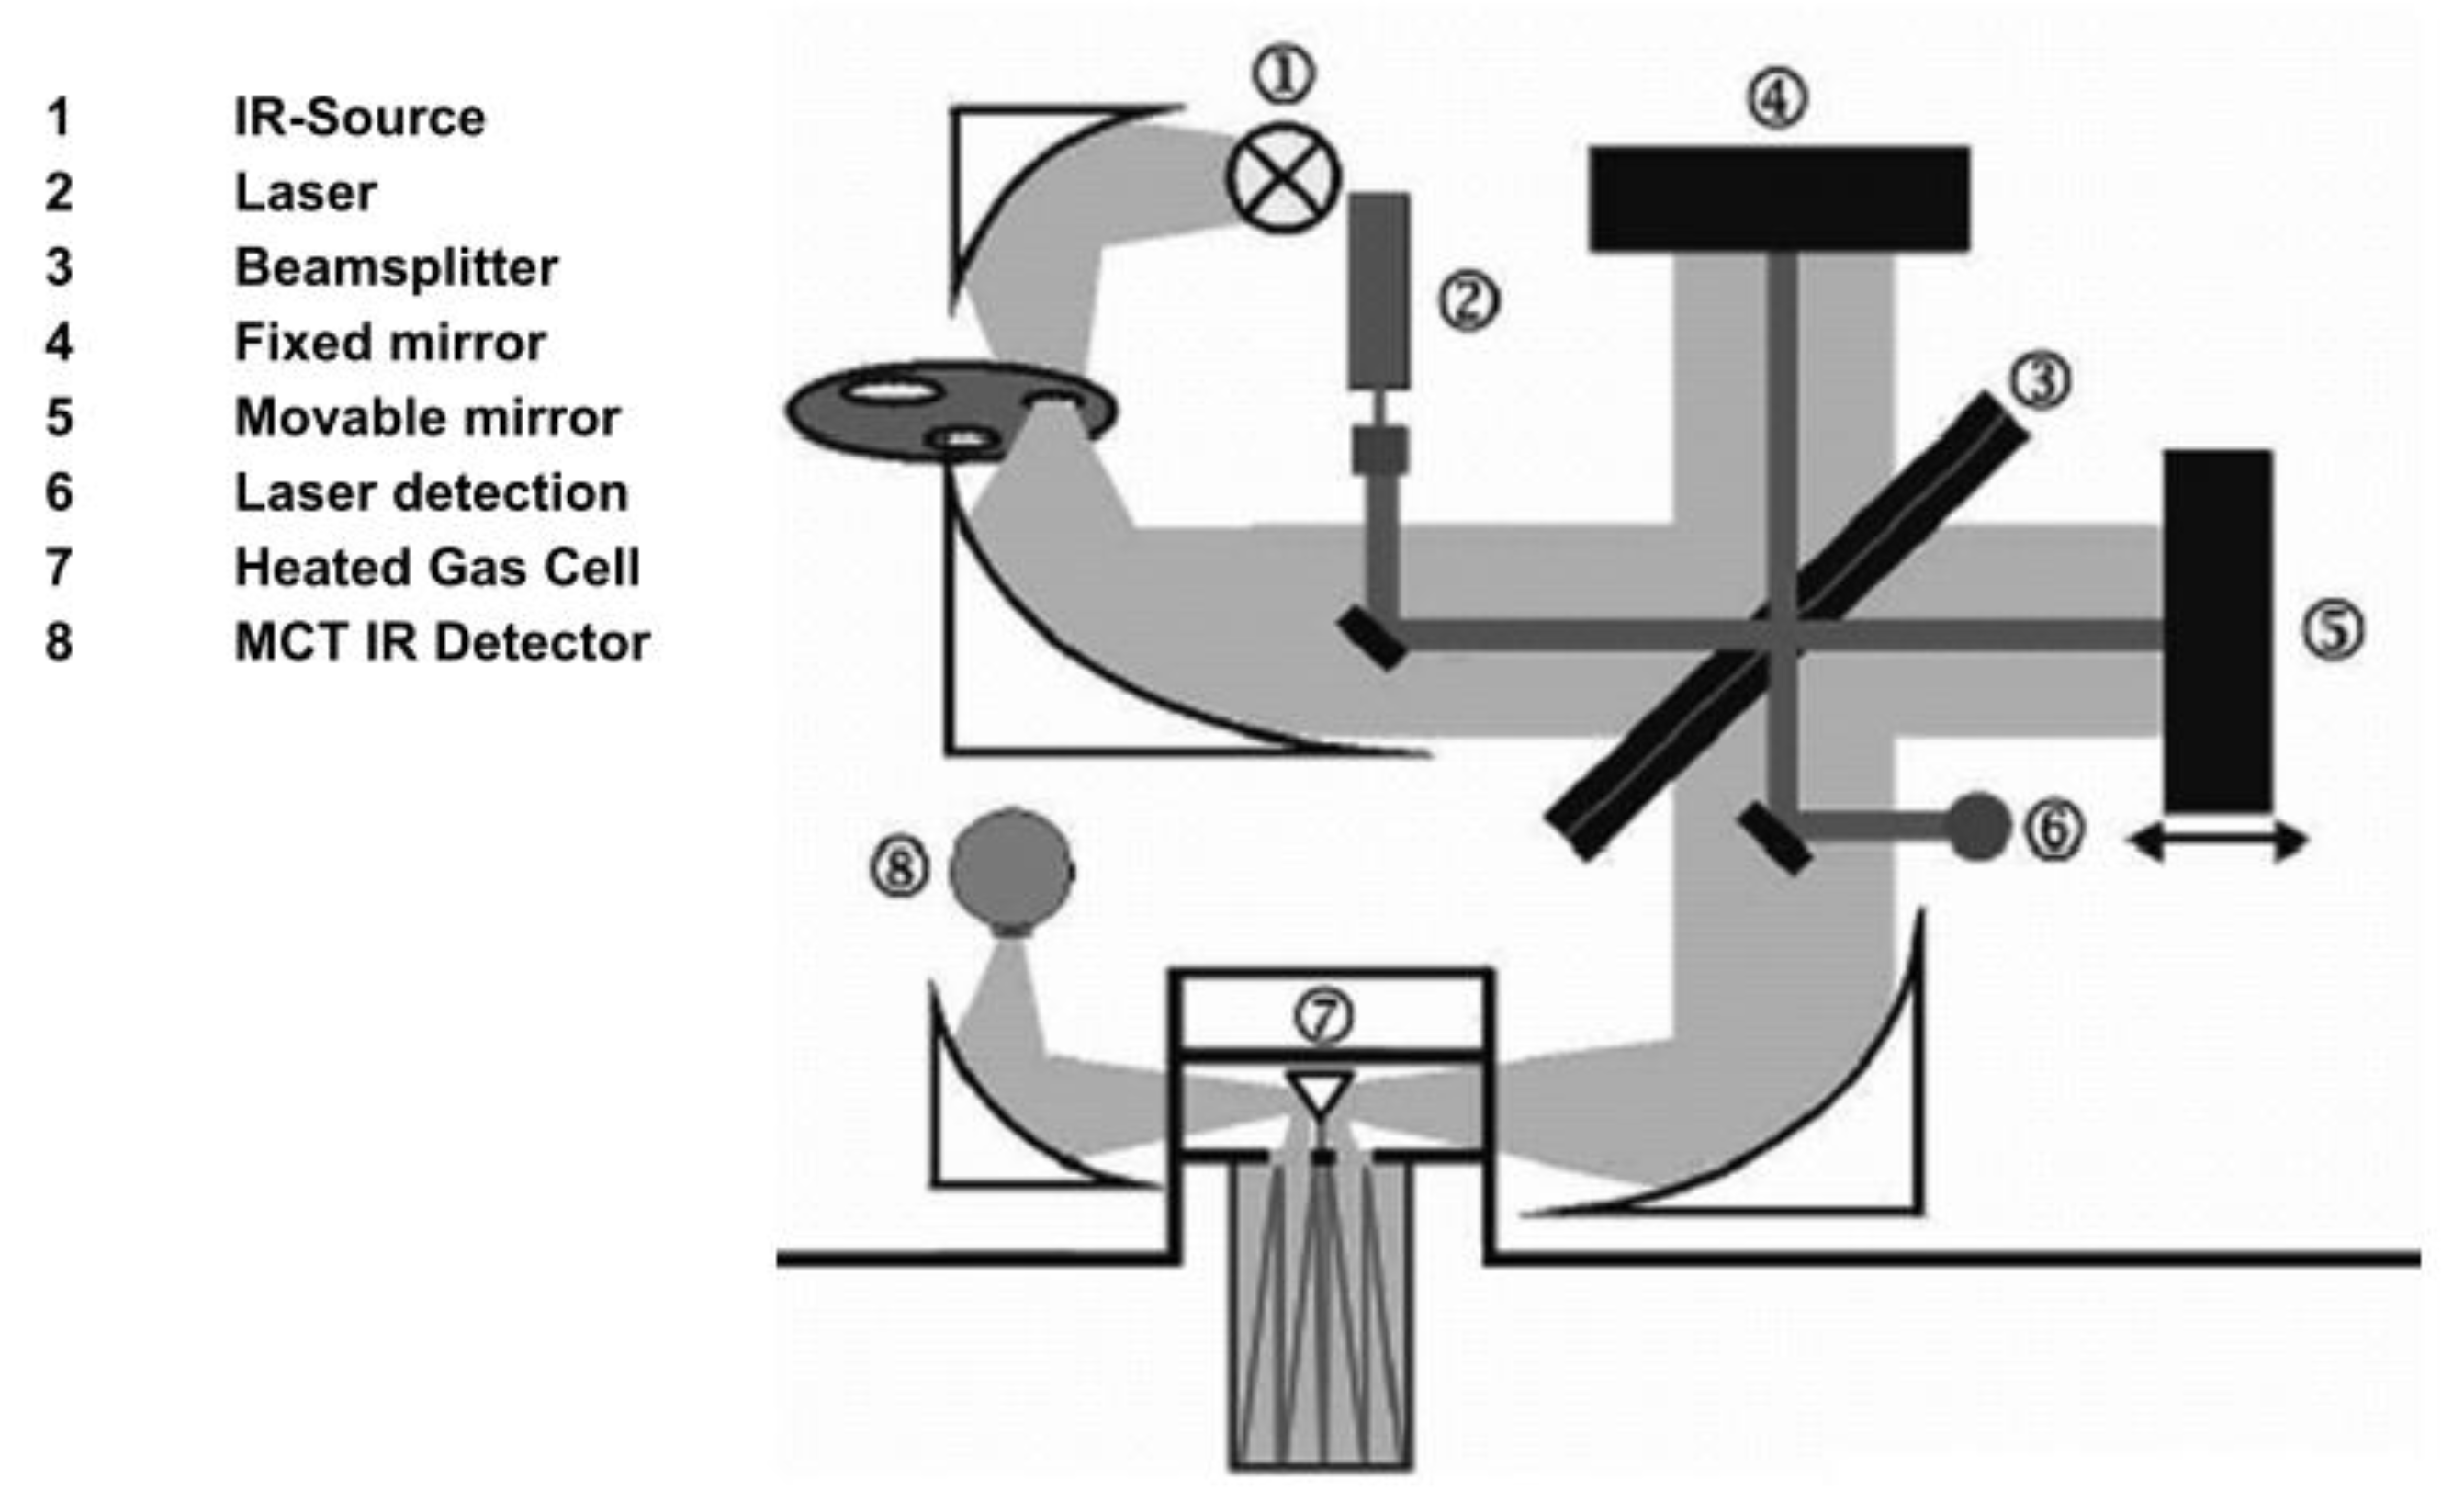
2.2.1. Exhaust Gas Analyzer
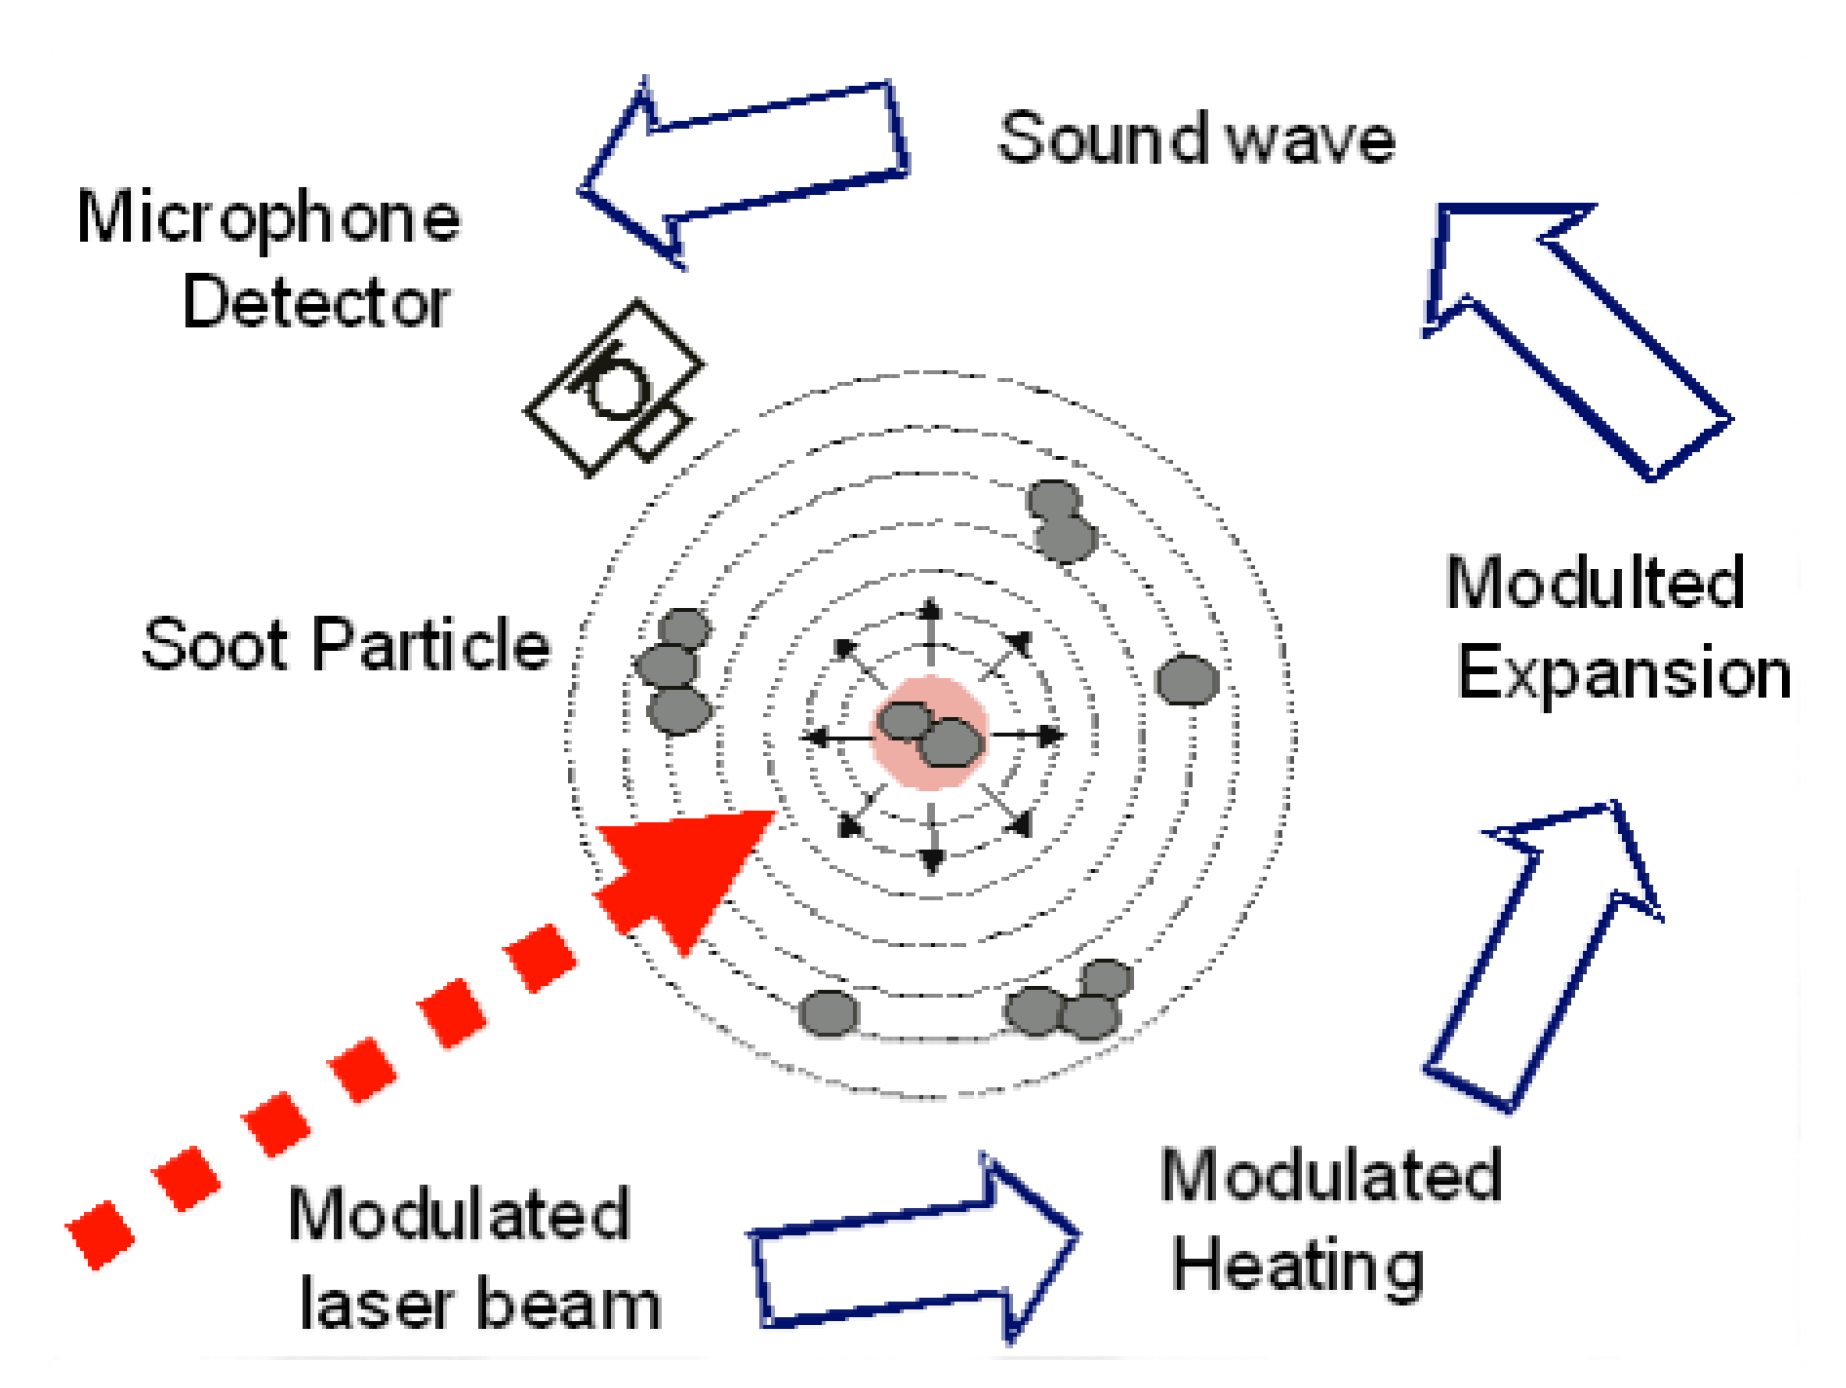
2.2.2. Particulate Matter Measurement Method
3. Examination of the Measured Data
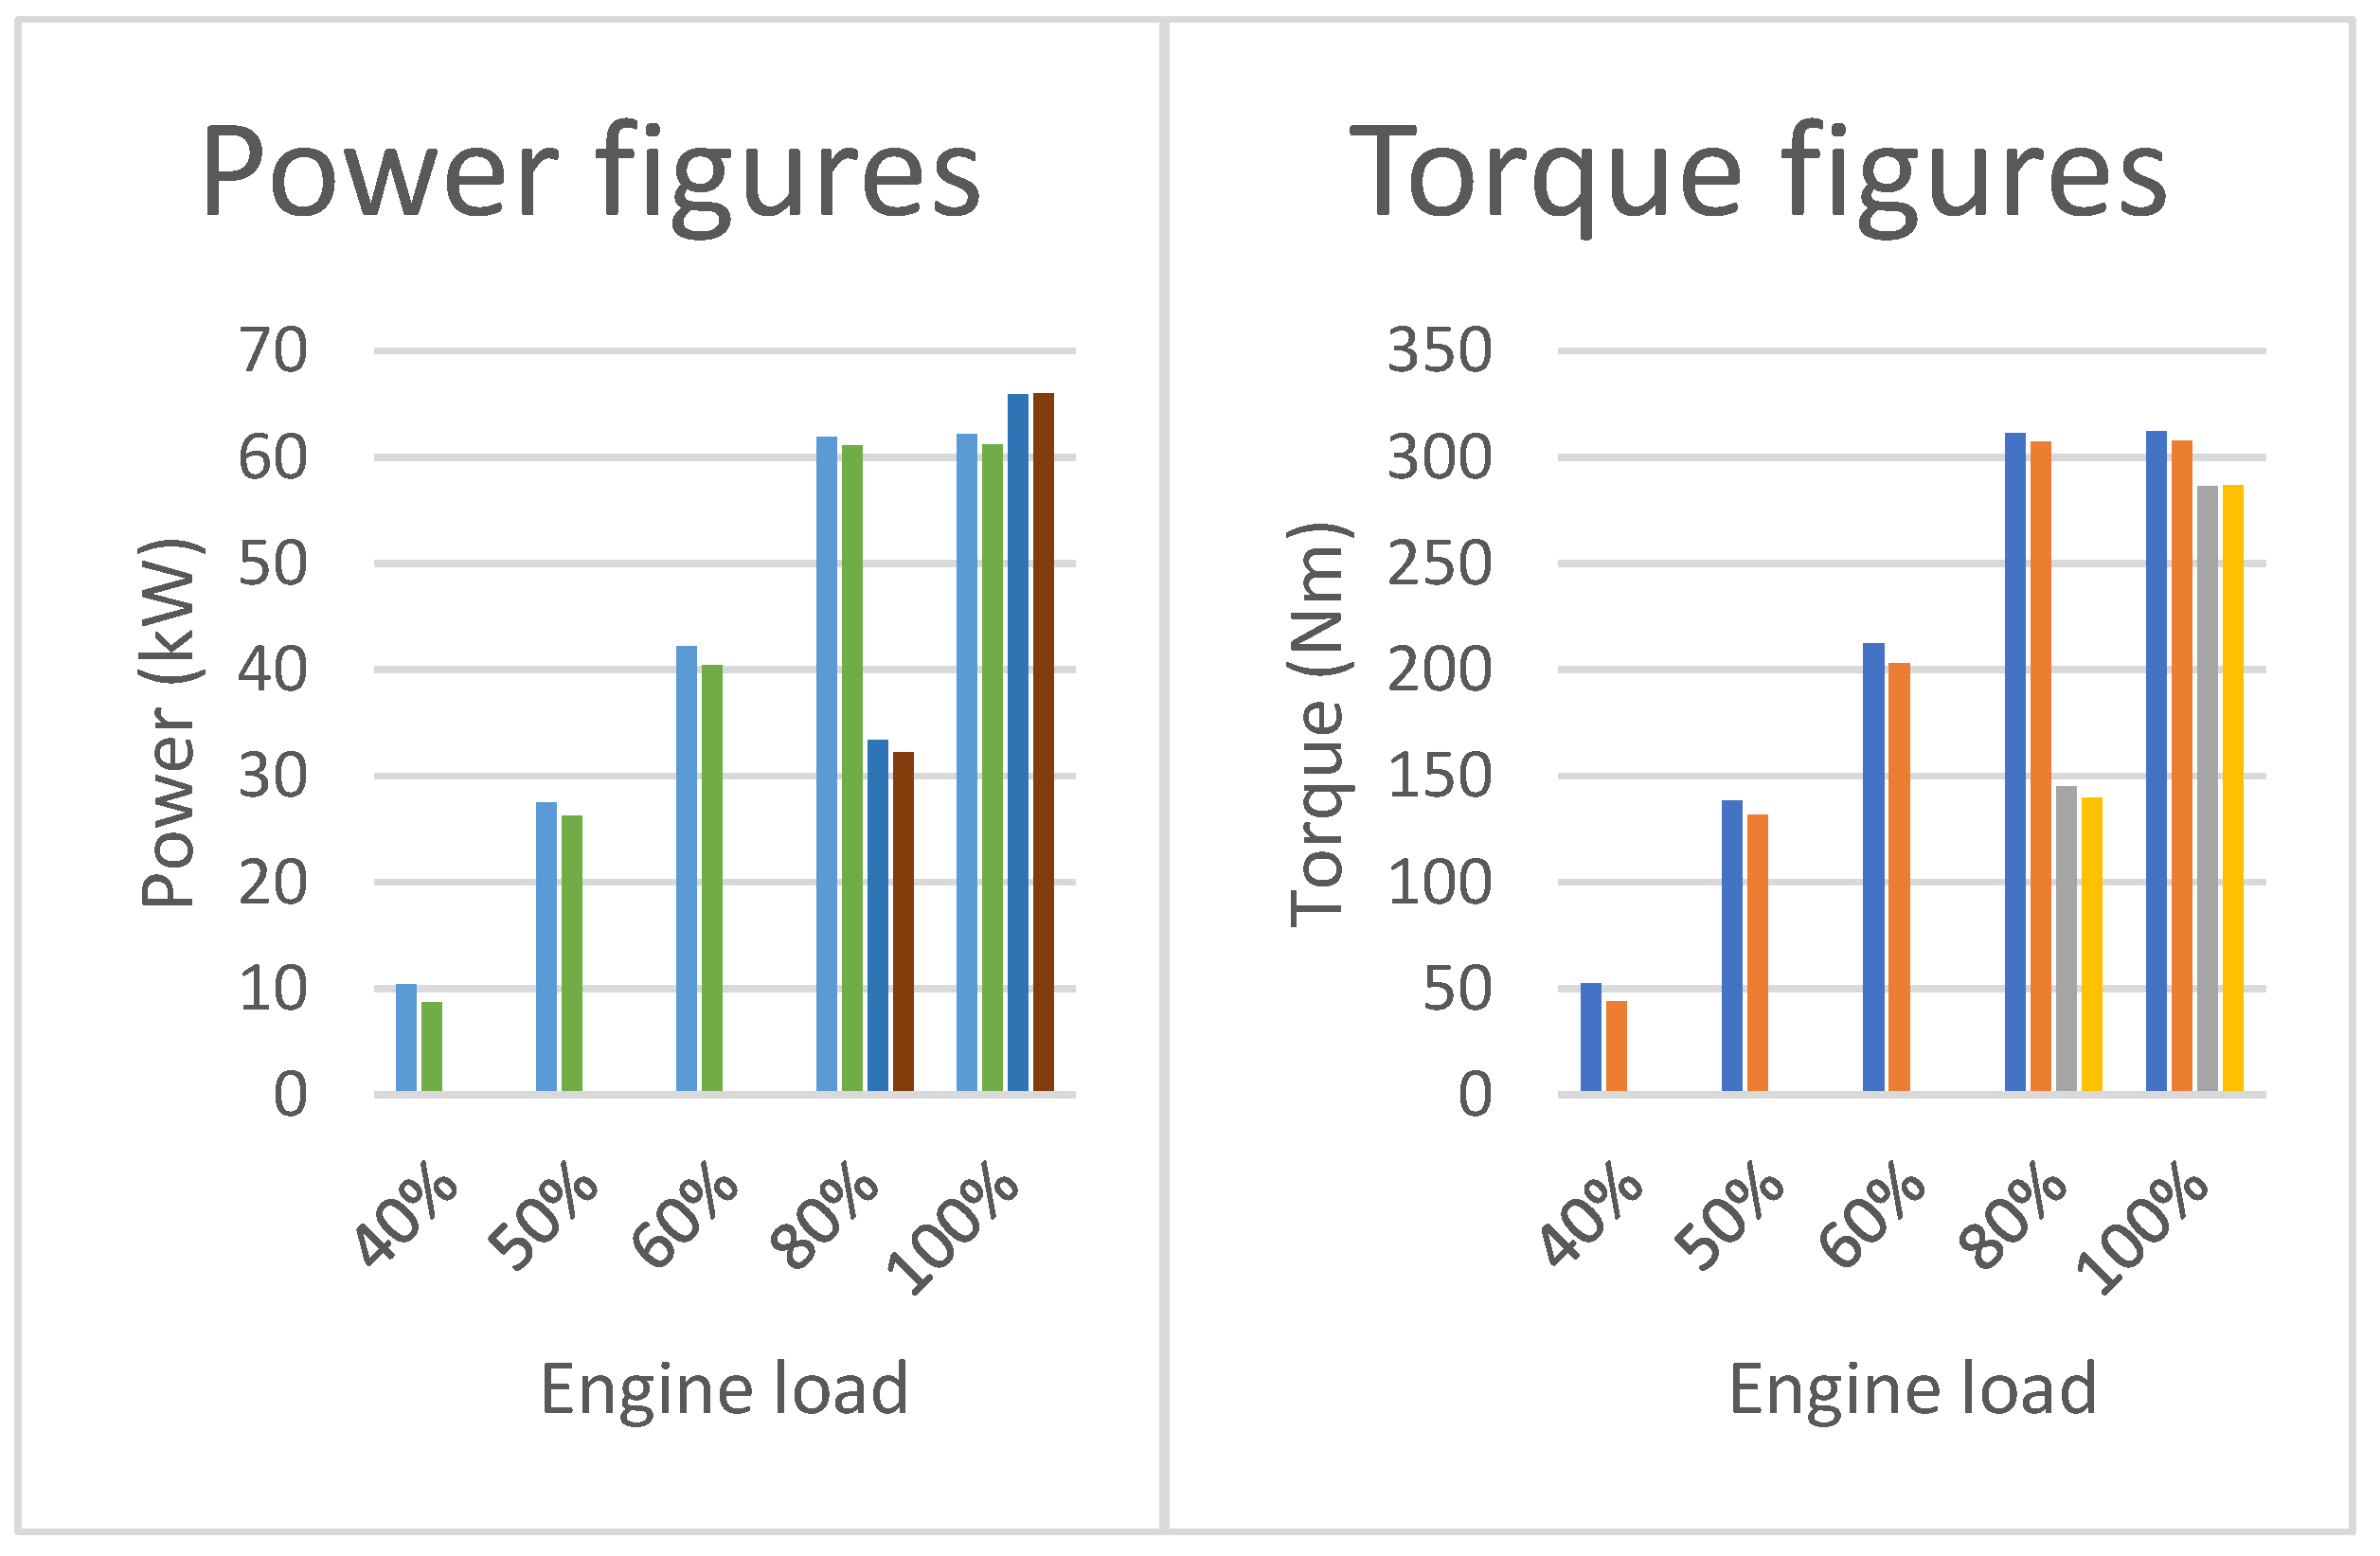
3.1. Engine Performance
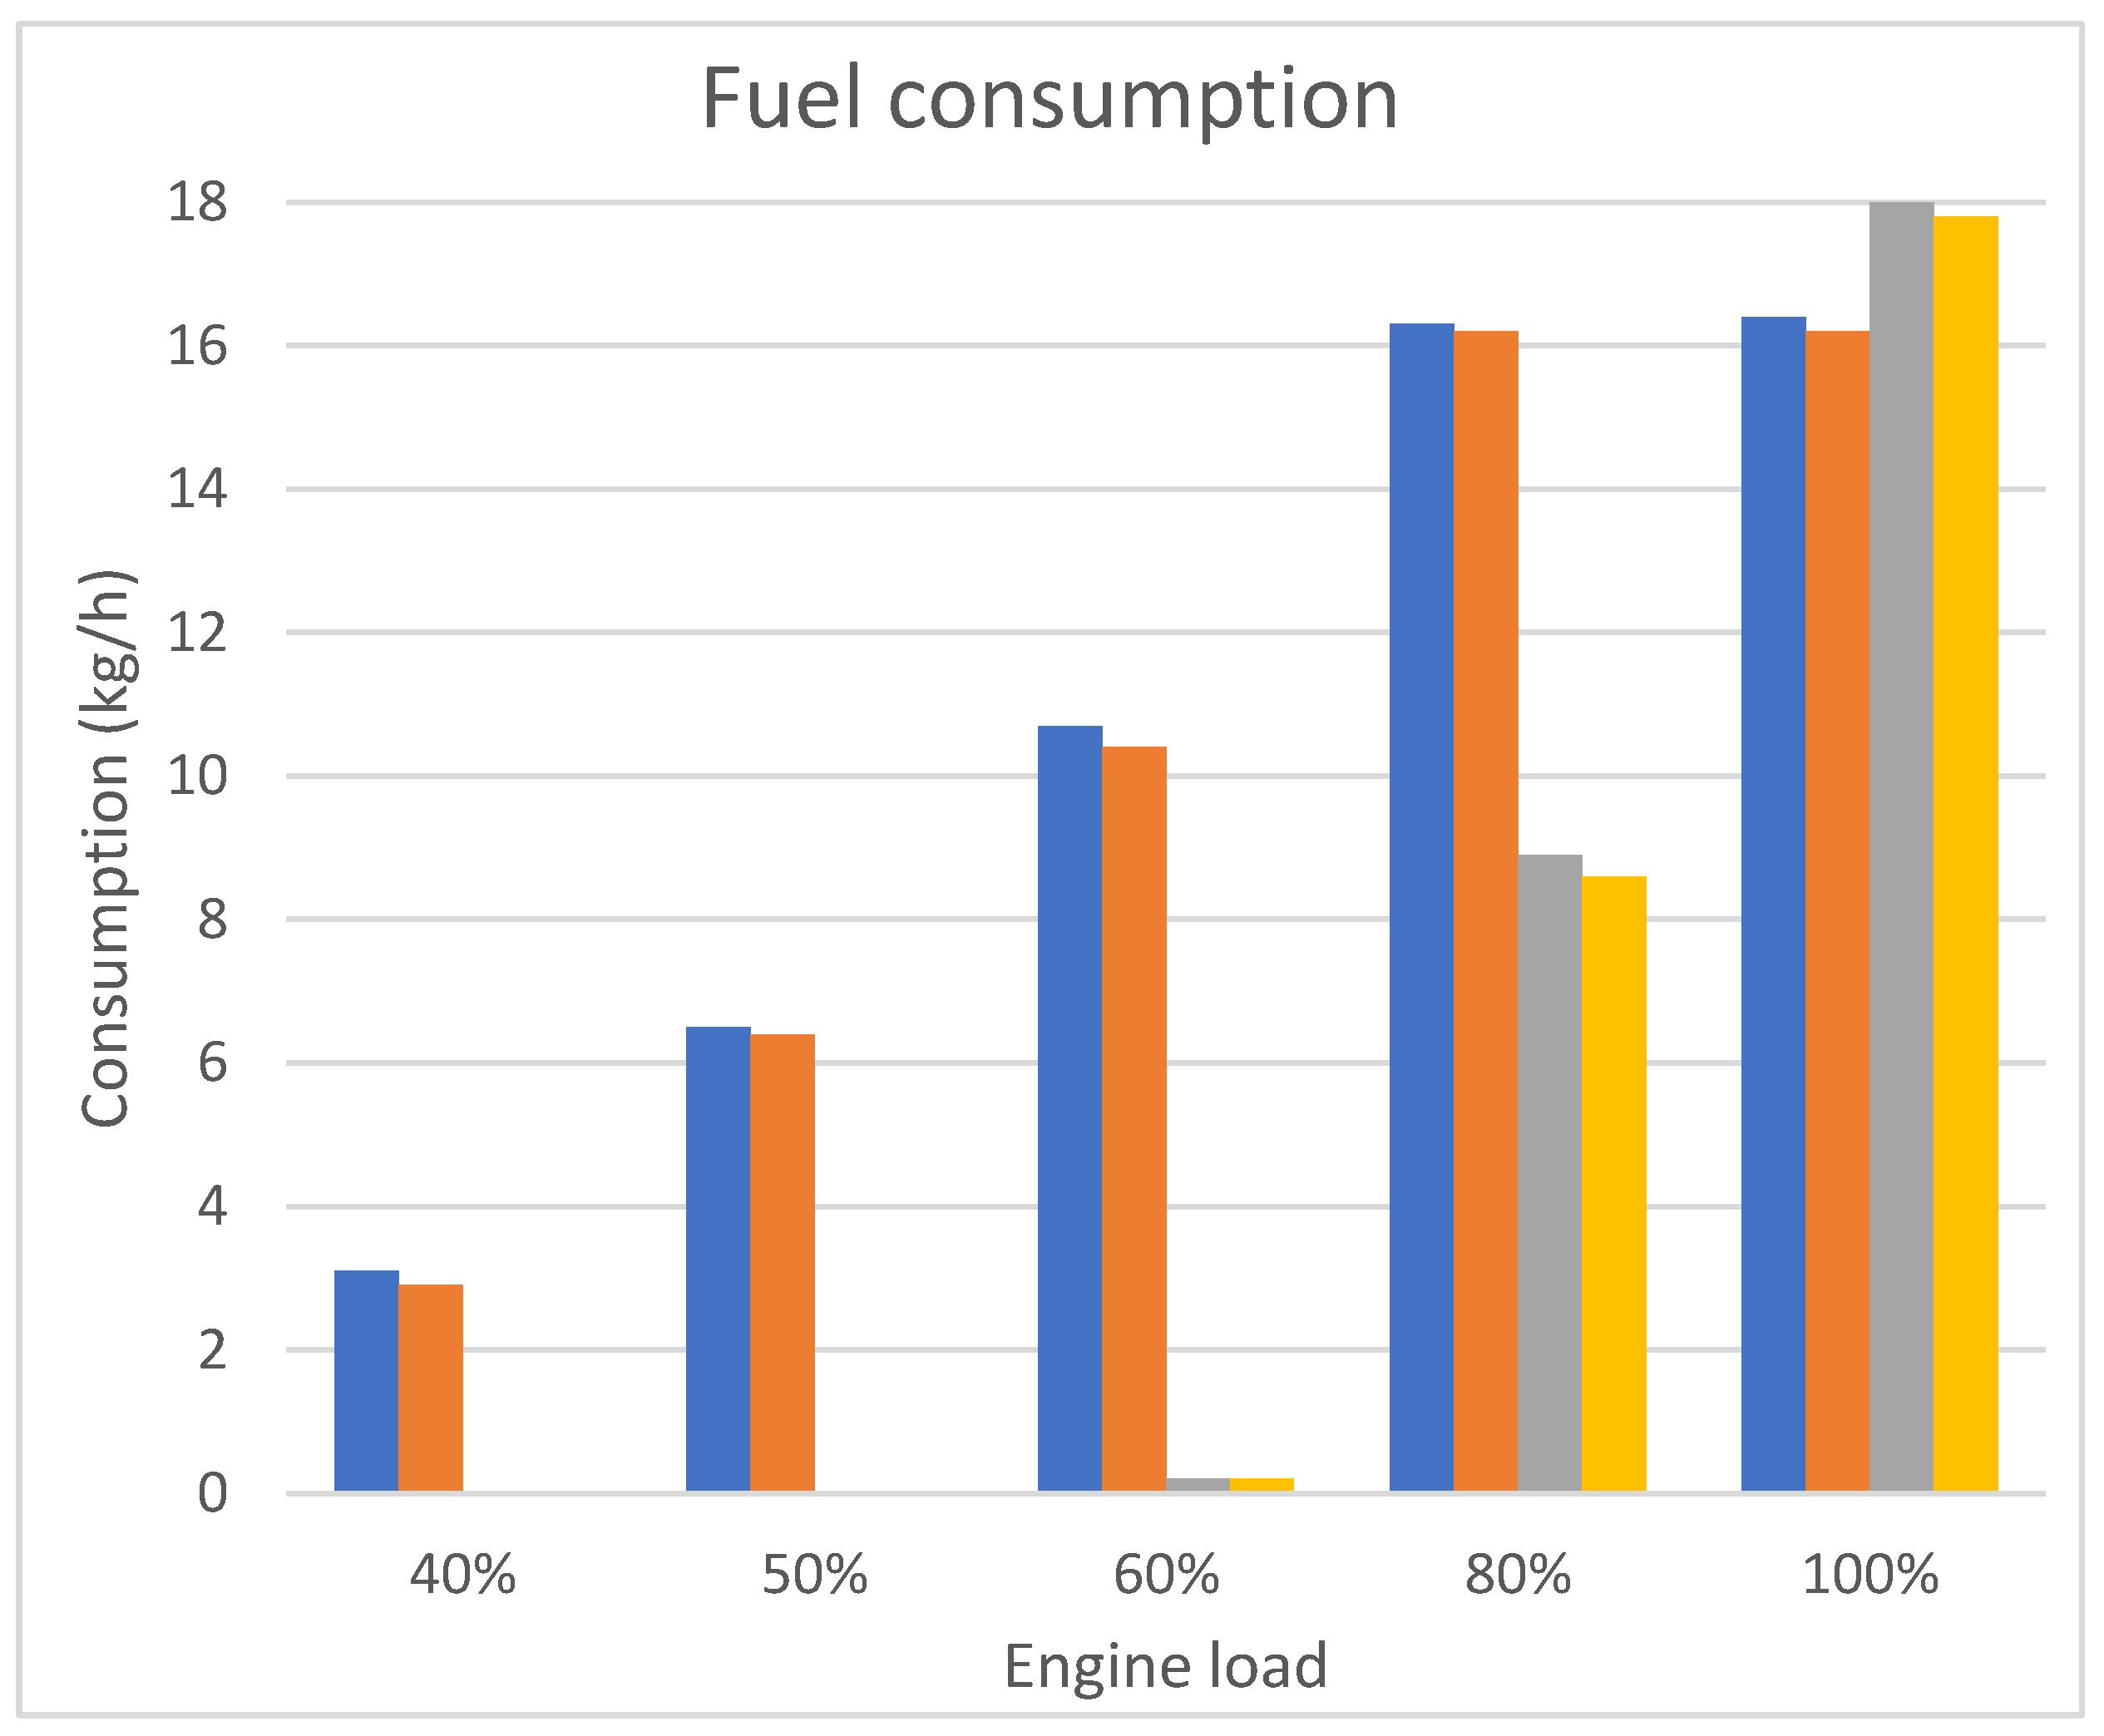
3.2. Fuel Consumption
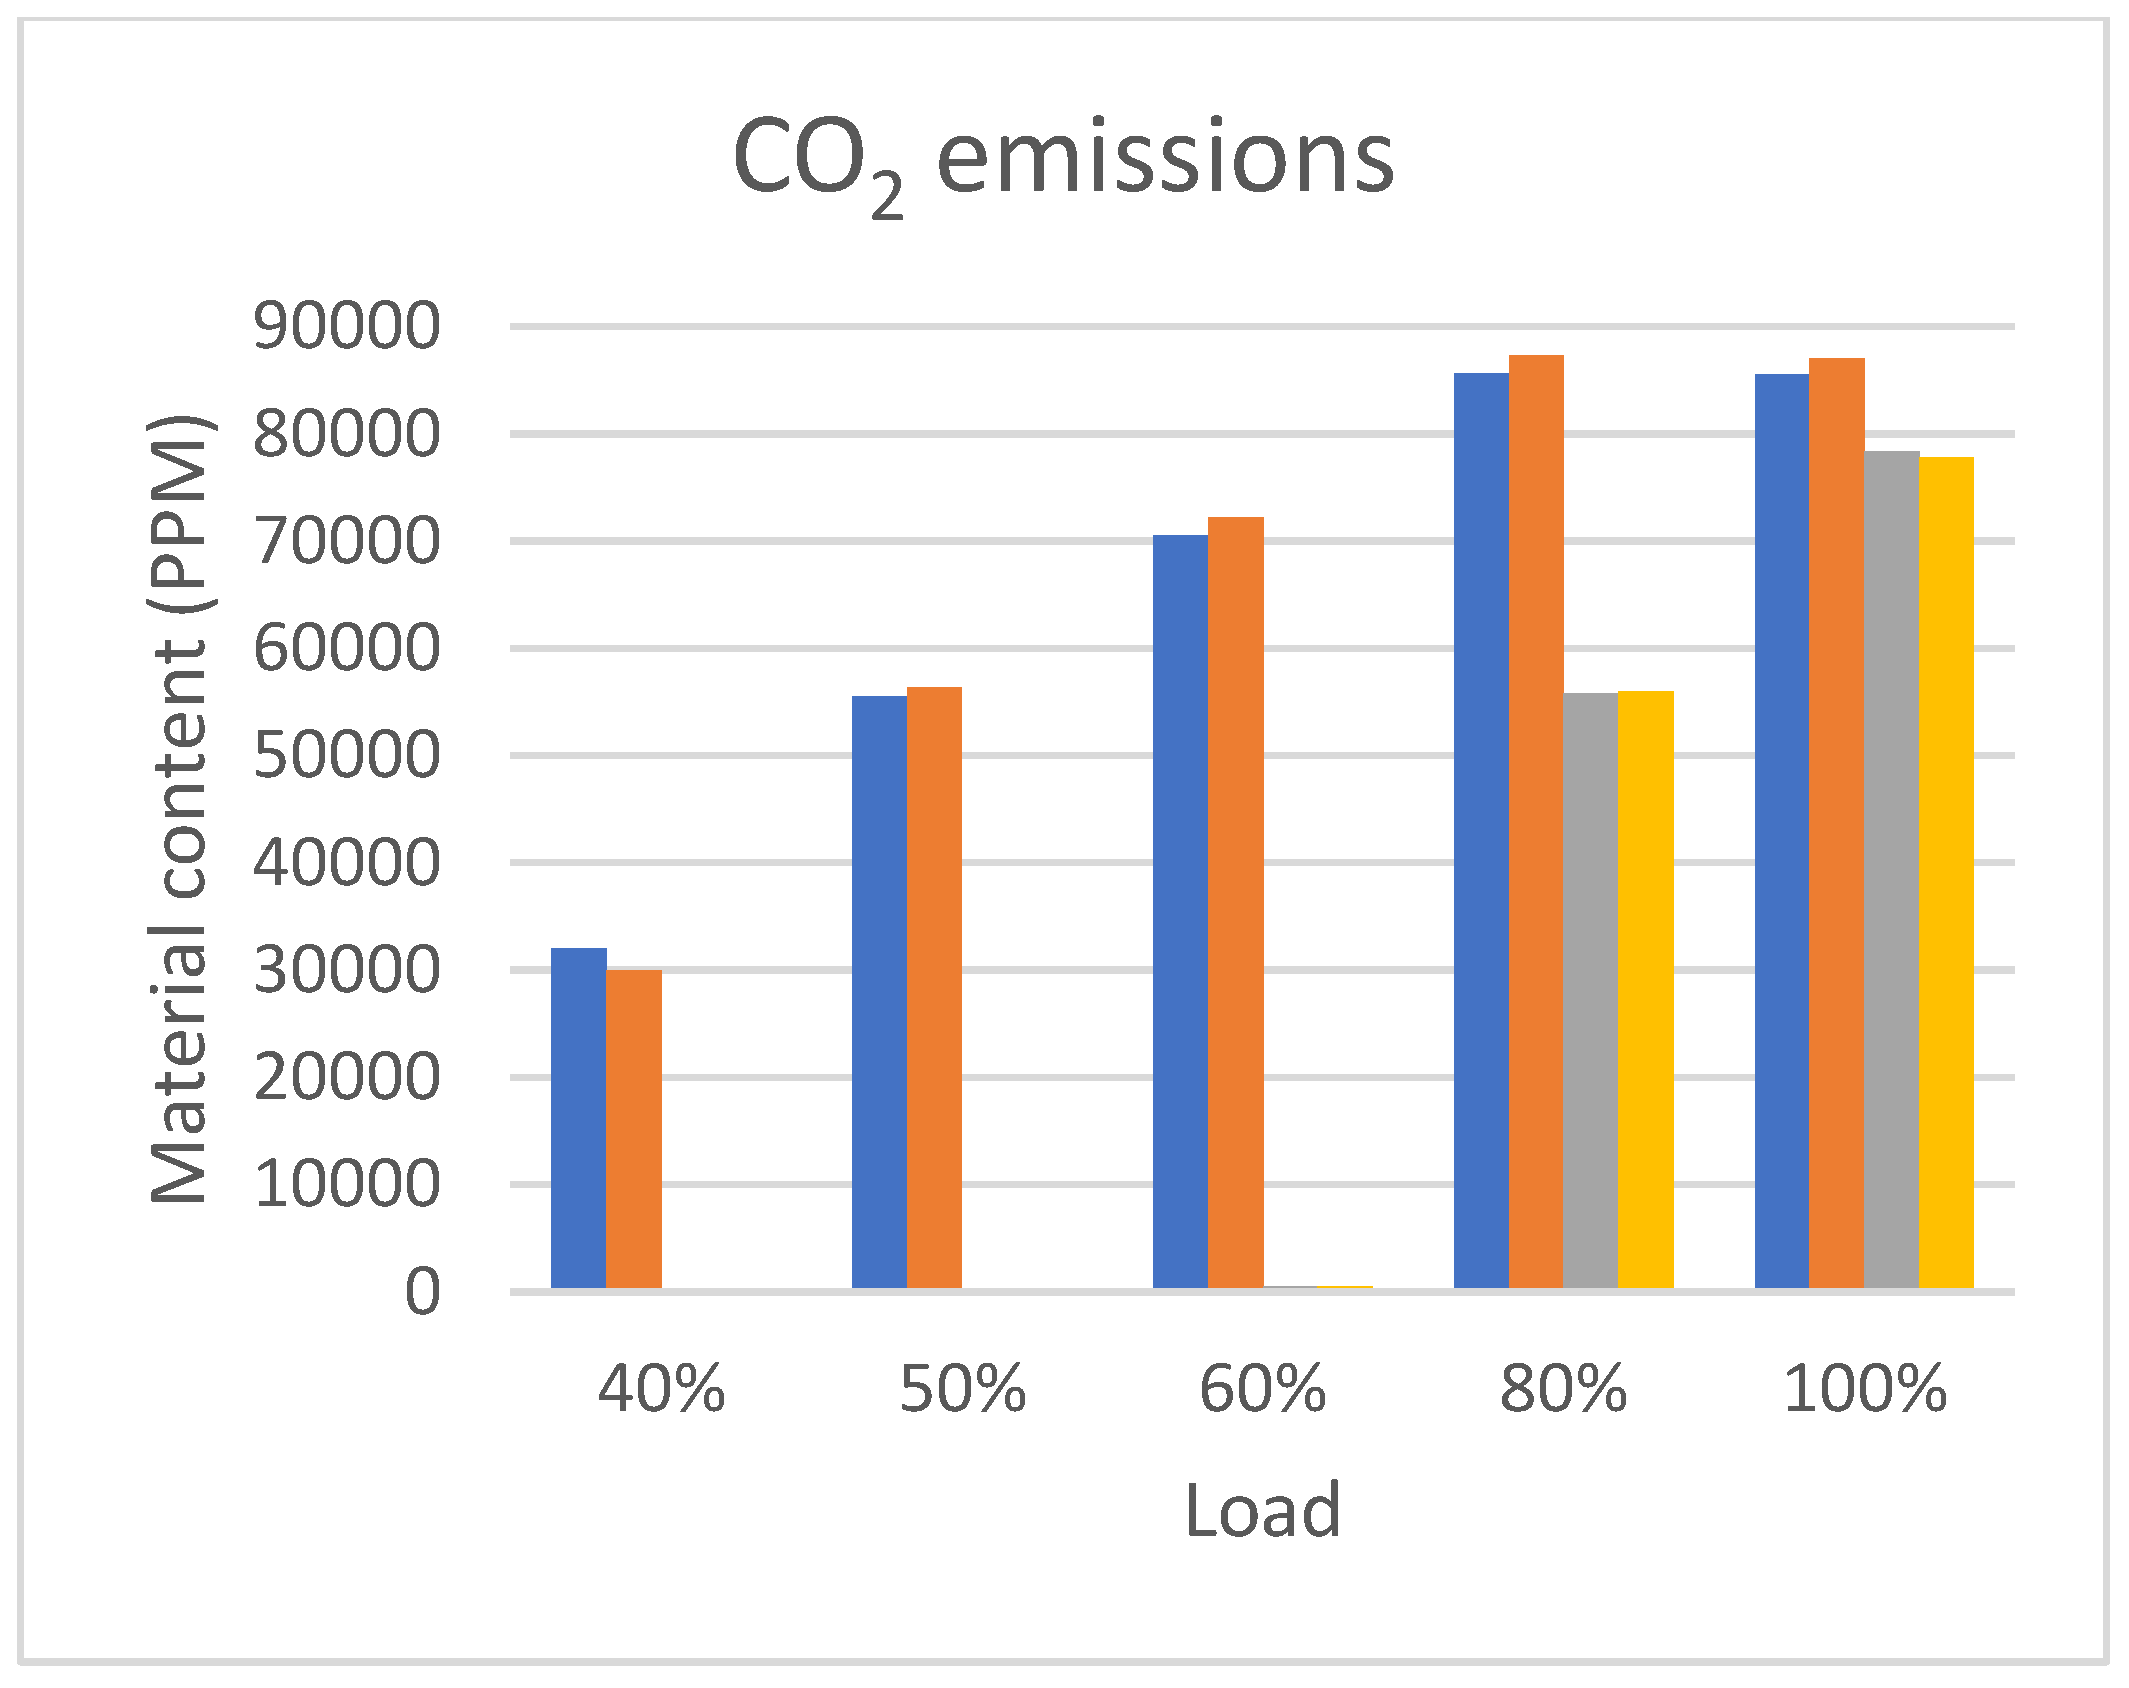
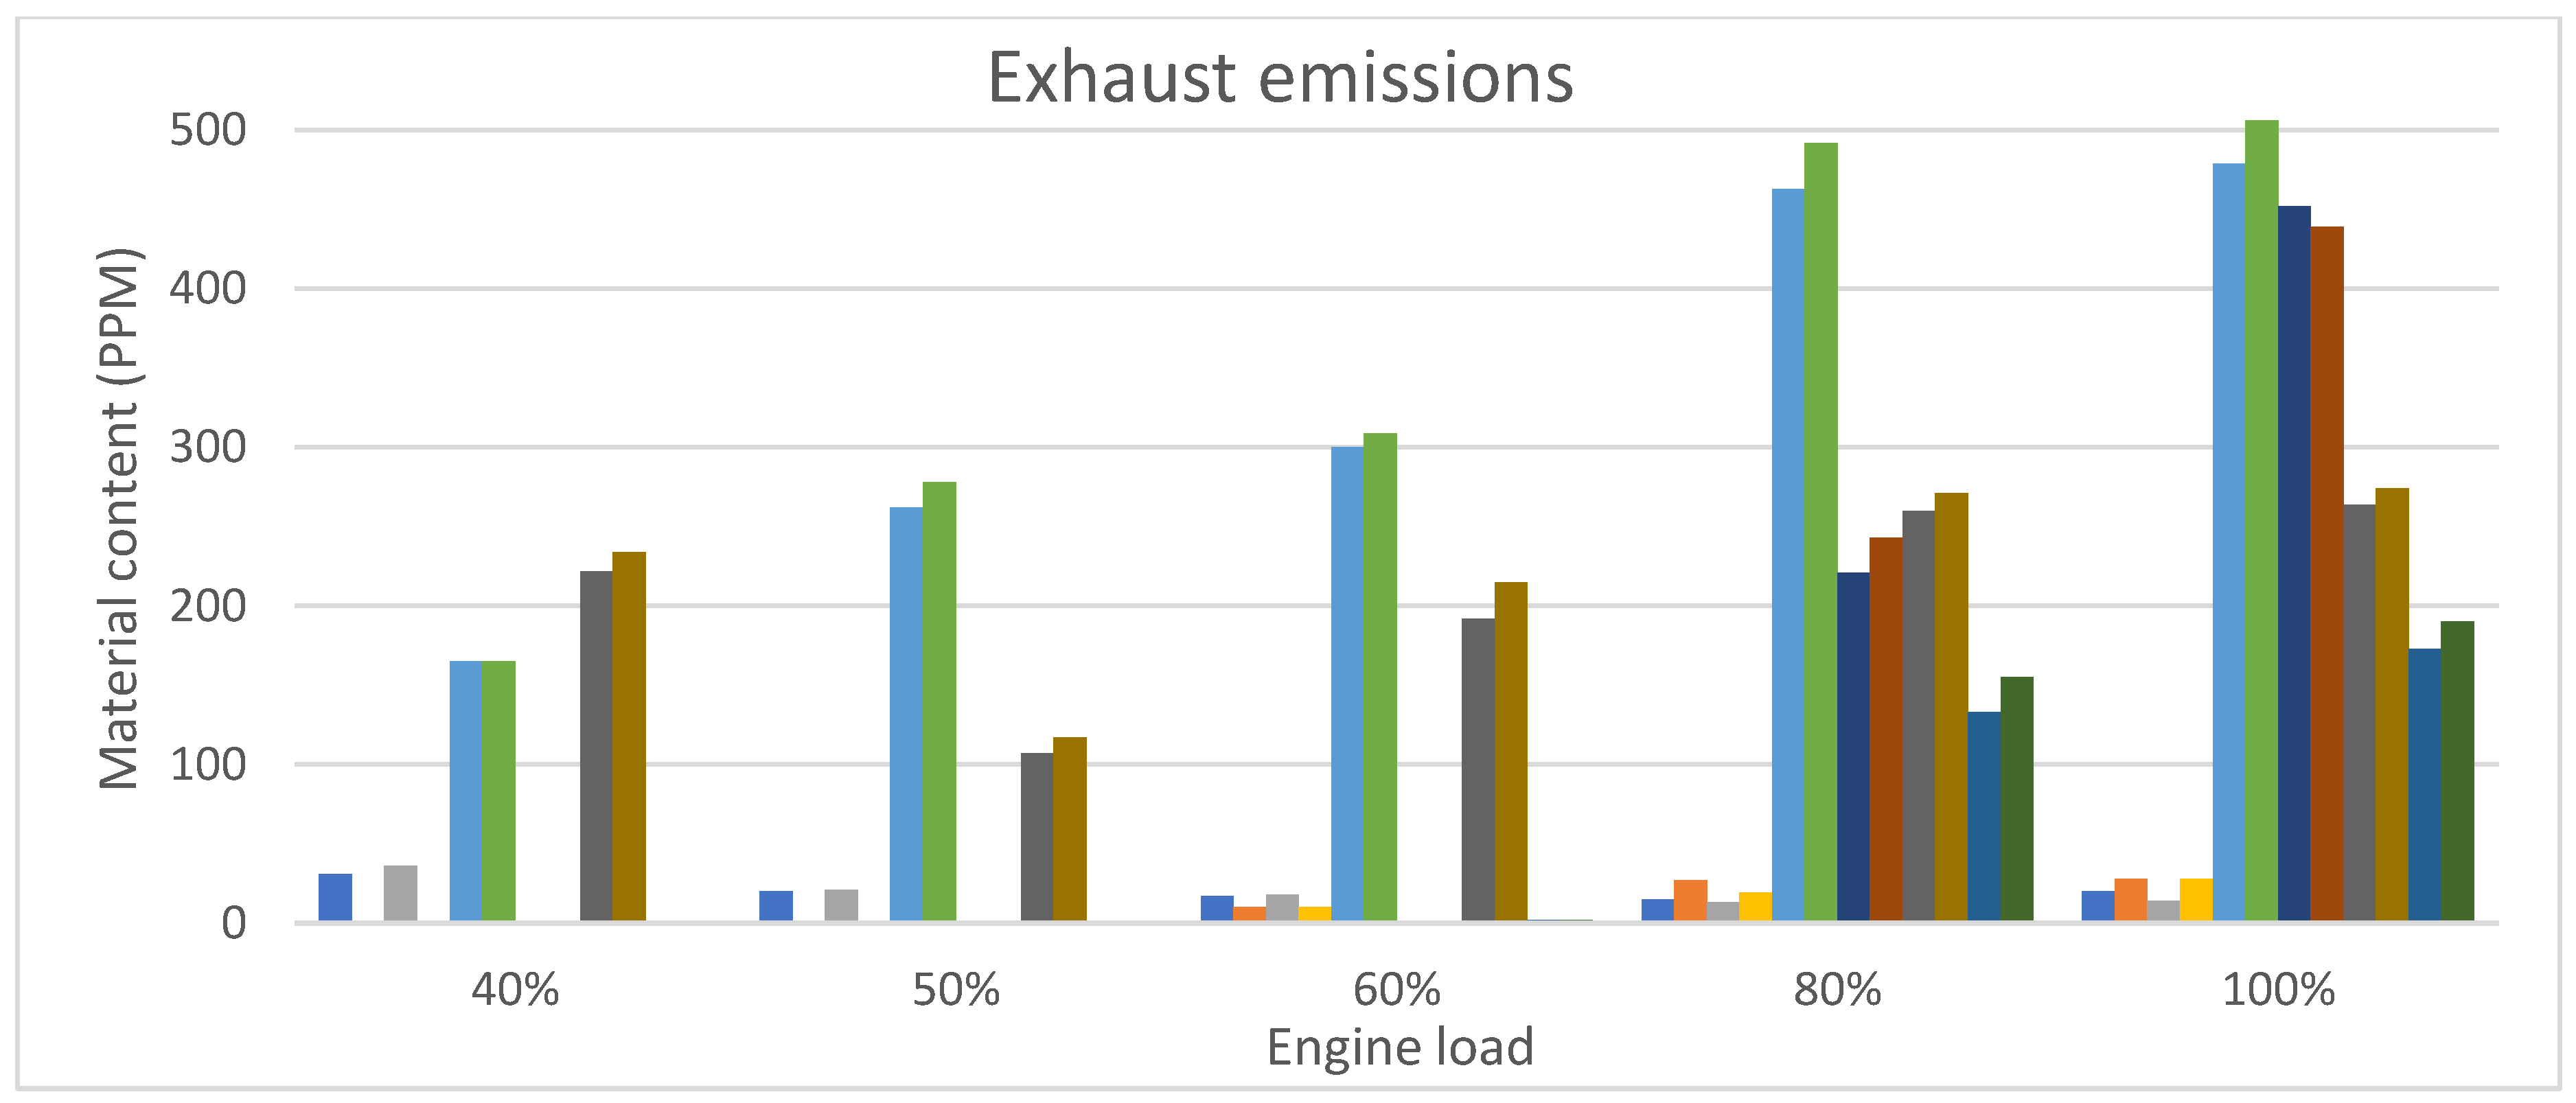
3.3. Exhaust Emissions
3.4. Data Validity for General Use
4. Conclusions
Author Contributions
Funding
Acknowledgments
Conflicts of Interest
Nomenclature
| AVL | Anstalt für Verbrennungskraftmaschinen List |
| CO | Carbon monoxide |
| CO2 | Carbon dioxide |
| FTIR | Fourier-transform infrared |
| HC | Hydrogen carbon |
| IR | Infrared |
| ISO | International Organization for Standardization |
| KW | Kilowatt |
| MSS | Micro soot sensor |
| MSZ | Hungarian standard |
| NOx | Nitrogen dioxide |
| MCT | Mercury cadmium telluride |
| NDIR | Nondispersive infrared sensor |
| NM | Newton meter |
| PM | Particulate matter |
| PPM | Parts per million |
| RPM | Revolution per minute |
| PUMA | Prüf und Mess Automatisierung |
| THC | Total hydrocarbons |
| TPO | Tire pyrolysis Oil |
References
- Kordoghli, S.; Paraschiv, M.; Kuncser, R.; Tazerout, M.; Prisecaru, M.; Zagrouba, F.; Georgescu, I. Managing the environmental hazards of the waste tires. J. Eng. Des. 2014, 20, 1466–1837. [Google Scholar] [CrossRef]
- Martínez, J.D.; Puy, N.; Murillo, R.; García, T.; Navarro, M.V.; Mastral, A.M. Waste tyre pyrolysis—A review. Renew. Sustain. Energy Rev. 2013, 23, 179–213. [Google Scholar] [CrossRef]
- Zöldy, M. Investigation of Correlation Between Diesel Fuel Cold Operability and Standardised Cold Flow Properties. Period. Polytech. Transp. Eng. 2021, 49, 120–125. [Google Scholar] [CrossRef] [Green Version]
- Ramalingam, K.; Balasubramanian, D.; Chellakumar, P.J.T.J.S.; Padmanaban, J.; Murugesan, P.; Xuan, T. An assessment on production and engine characterization of a novel environment-friendly fuel. Fuel 2020, 279, 118558. [Google Scholar] [CrossRef]
- Zöldy, M. The Changes of Burning Efficiency Emission and Power Output of a Diesel Engine Fueled by Bioethanol—Biodiesel-Diesel Oil Mixtures; FISITA: Yokohama, Japan, 2006. [Google Scholar]
- Valeika, G.; Matijošius, J.; Górski, K.; Rimkus, A.; Smigins, R. A Study of Energy and Environmental Parameters of a Diesel Engine Running on Hydrogenated Vegetable Oil (HVO) with Addition of Biobutanol and Castor Oil. Energies 2021, 14, 3939. [Google Scholar] [CrossRef]
- Zöldy, M.; Kondor, I.P. Simulation and Injector Bench Test Validation of Different Nozzle Hole Effect on Pyrolysis Oil-Diesel Oil Mixtures. Energies 2021, 14, 2396. [Google Scholar] [CrossRef]
- Vass, S.; Zöldy, M. Detailed model of a common rail injector. Acta Univ. Sapientiae Electr. Mech. Eng. 2019, 11, 22–33. [Google Scholar] [CrossRef] [Green Version]
- Baškovič, U.Ž.; Seljak, T.; Katrašnik, T. Feasibility analysis of 100% tire pyrolysis oil in a common rail Diesel engine. Energy 2017, 137, 980–990. [Google Scholar] [CrossRef] [Green Version]
- Pejić, G.; Bijelić, F.; Zovak, G.; Lulić, Z. Model for Calculating Average Vehicle Mileage for Different Vehicle Classes Based on Real Data: A Case Study of Croatia. Promet-Traffic Transp. 2019, 31, 213–222. [Google Scholar] [CrossRef]
- AVL SESAM i60 Fourier-Transform Infrared Spectrometer Measurement Device User Manual. Available online: https://www.avl.com/testing-solutions-for-large-engines/-/asset_publisher/gYjUpY19vEA8/content/avl-sesam-i60-ft-multi-component-exhaust-measurement-system (accessed on 9 November 2021).
- AVL MSS Micro Soot Sensor Measurement Device User Manual. Available online: https://www.avl.com/-/mssplus-avl-micro-soot-sensor (accessed on 9 November 2021).
- Rimkus, A.; Matijošius, J.; Bogdevičius, M.; Bereczky, Á.; Török, Á. An investigation of the efficiency of using O2 and H2 (hydrooxile gas-HHO) gas additives in a ci engine operating on diesel fuel and biodiesel. Energy 2018, 152, 640–651. [Google Scholar] [CrossRef]
- Kirchen, P.; Obrecht, P.; Boulouchos, K. Soot Emission Measurements and Validation of a Mean Value Soot Model for Common-Rail Diesel Engines during Transient Operation. SAE Int. J. Engines 2009, 2, 1663–1678. [Google Scholar] [CrossRef]
- Kirchen, P.; Obrecht, P.; Boulouchos, K.; Bertola, A. Exhaust-Stream and In-Cylinder Measurements and Analysis of the Soot Emissions From a Common Rail Diesel Engine Using Two Fuels. J. Eng. Gas Turbines Power 2010, 132, 112804. [Google Scholar] [CrossRef]
- Breitegger, P.; Schriefl, M.A.; Nishida, R.T.; Hochgreb, S.; Bergmann, A. Soot mass concentration sensor using quartz-enhanced photoacoustic spectroscopy. Aerosol Sci. Technol. 2019, 53, 971–975. [Google Scholar] [CrossRef]
- Kontses, D.; Geivanidis, S.; Fragkiadoulakis, P.; Samaras, Z. Uncertainties in Model-Based Diesel Particulate Filter Diagnostics Using a Soot Sensor. Sensors 2019, 19, 3141. [Google Scholar] [CrossRef] [PubMed] [Green Version]


| TPO | Diesel | Standard | |
|---|---|---|---|
| Cetane | <30 | ≥51.0 | MSZ EN ISO 5165 |
| Sulfur [mg/kg] | ≤10 | ≤10 | MSZ EN ISO 20846 |
| Water (ppm) [mg/kg] | 1804 | ≤200 | MSZ EN ISO 12937 |
| Pensky–Martens flashpoint | <24 | >55 | MSZ EN 2719 |
| Caloric Value [MJ/kg] | 40.8 | 42.7 | |
| Ash [%/m/m] | 0.005 | ≤0.01 | MSZ EN ISO 6245 |
| Viscosity [mm2/s] | 4.443 | 2.00–4.50 | MSZ EN ISO 3104 |
| Mechanical inpurities [mg/kg] | 0.027–0.16 | ≤24 | MSZ EN 12662 |
| Density [kg/m3] | 926.1 | 0.83 | |
| Coke residue [%/m/m] | 0.6 | ≤0.30 | EN ISO 10370 |
| Cold filter plugging point (CFPP) | ≤5 | MSZ EN 116 | |
| Policyclic carbohidrates | 22–35 | <8.0 | MSZ EN 12916 |
| Speed | Alpha | ||||
|---|---|---|---|---|---|
| 1900 RPM | 40% | 50% | 60% | 80% | 100% |
| 2200 RPM | 80% | 100% | |||
| Parameters | Details |
|---|---|
| Engine series | Mitsubishi S4S-DT |
| Engine type | 4 stroke diesel |
| Cylinder layout | Inline |
| Number of cylinders | 4 |
| Displacement | 3331 cm3 |
| Stroke × bore (mm) | 120 × 94 |
| Aspiration | Turbocharged |
| Dry weight | 250 kg |
| Fuel injection | Direct injection |
| Fuelpump type | Rotary pump |
| Maximum power output | 70 kW |
| Maximum engine speed | 2500 1/min |
| Engine Performance | ||||||||
|---|---|---|---|---|---|---|---|---|
| Engine Speed | TPO Concentration | Measured Substance | Engine Load | Color | ||||
| 40% | 50% | 60% | 80% | 100% | ||||
| 1900 RPM | 0% | Torque (Nm) | 52.3 | 138.2 | 212.1 | 311.1 | 312.1 | |
| 1900 RPM | 10% | Torque (Nm) | 43.7 | 131.7 | 203.0 | 307.1 | 307.6 | |
| 2200 RPM | 0% | Torque (Nm) | −51.7 | 145.0 | 286.0 | |||
| 2200 RPM | 10% | Torque (Nm) | −51.7 | 139.8 | 286.5 | |||
| 1900 RPM | 0% | Power (kW) | 10.4 | 27.5 | 42.2 | 61.9 | 62.1 | |
| 1900 RPM | 10% | Power (kW) | 8.7 | 26.2 | 40.4 | 61.1 | 61.2 | |
| 2200 RPM | 0% | Power (kW) | −11.9 | 33.4 | 65.9 | |||
| 2200 RPM | 10% | Power (kW) | −11.9 | 32.2 | 66 | |||
| Brake-Specific Fuel Consumption (g/kWh) | |||||||
|---|---|---|---|---|---|---|---|
| Engine Speed | TPO Concentration | Engine Load | Color | ||||
| 40% | 50% | 60% | 80% | 100% | |||
| 1900 RPM | 0% | 298.07 | 236.36 | 253.55 | 263.33 | 264.09 | |
| 1900 RPM | 10% | 333.33 | 244.27 | 257.42 | 265.14 | 264.71 | |
| 2200 RPM | 0% | 266.47 | 273.14 | ||||
| 2200 RPM | 10% | 267.08 | 269.70 | ||||
| CO2 Emissions (PPM) | |||||||
|---|---|---|---|---|---|---|---|
| Engine Speed | TPO Concentration | Engine Load | Color | ||||
| 40% | 50% | 60% | 80% | 100% | |||
| 1900 RPM | 0% | 32,049 | 55,498 | 70,533 | 85,571 | 85,537 | |
| 1900 RPM | 10% | 29,938 | 56,343 | 72,183 | 87,284 | 87,020 | |
| 2200 RPM | 0% | 472 | 55,793 | 78,303 | |||
| 2200 RPM | 10% | 481 | 56,008 | 77,809 | |||
| Emission (PPM) | ||||||||
|---|---|---|---|---|---|---|---|---|
| Engine Speed | TPO Concentration | Measured Substance | Engine Load | Color | ||||
| 40% | 50% | 60% | 80% | 100% | ||||
| 1900 RPM | 0% | THC | 31 | 20 | 17 | 15 | 20 | |
| 2200 RPM | 0% | THC | 10 | 27 | 28 | |||
| 1900 RPM | 10% | THC | 36 | 21 | 18 | 13 | 14 | |
| 2200 RPM | 10% | THC | 10 | 19 | 28 | |||
| 1900 RPM | 0% | NOx | 165 | 262 | 300 | 463 | 479 | |
| 1900 RPM | 10% | NOx | 165 | 278 | 309 | 492 | 506 | |
| 2200 RPM | 0% | NOx | 0 | 221 | 452 | |||
| 2200 RPM | 10% | NOx | 0 | 243 | 439 | |||
| 1900 RPM | 0% | CO | 222 | 107 | 192 | 260 | 264 | |
| 1900 RPM | 10% | CO | 234 | 117 | 215 | 271 | 274 | |
| 2200 RPM | 0% | CO | 2 | 133 | 173 | |||
| 2200 RPM | 10% | CO | 2 | 155 | 190 | |||
Publisher’s Note: MDPI stays neutral with regard to jurisdictional claims in published maps and institutional affiliations. |
© 2021 by the authors. Licensee MDPI, Basel, Switzerland. This article is an open access article distributed under the terms and conditions of the Creative Commons Attribution (CC BY) license (https://creativecommons.org/licenses/by/4.0/).
Share and Cite
Kondor, I.P.; Zöldy, M.; Mihály, D. Experimental Investigation on the Performance and Emission Characteristics of a Compression Ignition Engine Using Waste-Based Tire Pyrolysis Fuel and Diesel Fuel Blends. Energies 2021, 14, 7903. https://doi.org/10.3390/en14237903
Kondor IP, Zöldy M, Mihály D. Experimental Investigation on the Performance and Emission Characteristics of a Compression Ignition Engine Using Waste-Based Tire Pyrolysis Fuel and Diesel Fuel Blends. Energies. 2021; 14(23):7903. https://doi.org/10.3390/en14237903
Chicago/Turabian StyleKondor, István Péter, Máté Zöldy, and Dénes Mihály. 2021. "Experimental Investigation on the Performance and Emission Characteristics of a Compression Ignition Engine Using Waste-Based Tire Pyrolysis Fuel and Diesel Fuel Blends" Energies 14, no. 23: 7903. https://doi.org/10.3390/en14237903
APA StyleKondor, I. P., Zöldy, M., & Mihály, D. (2021). Experimental Investigation on the Performance and Emission Characteristics of a Compression Ignition Engine Using Waste-Based Tire Pyrolysis Fuel and Diesel Fuel Blends. Energies, 14(23), 7903. https://doi.org/10.3390/en14237903