
Operational Analysis of Fire Alarm Systems with a Focused, Dispersed and Mixed Structure in Critical Infrastructure Buildings


Abstract
1. Introduction
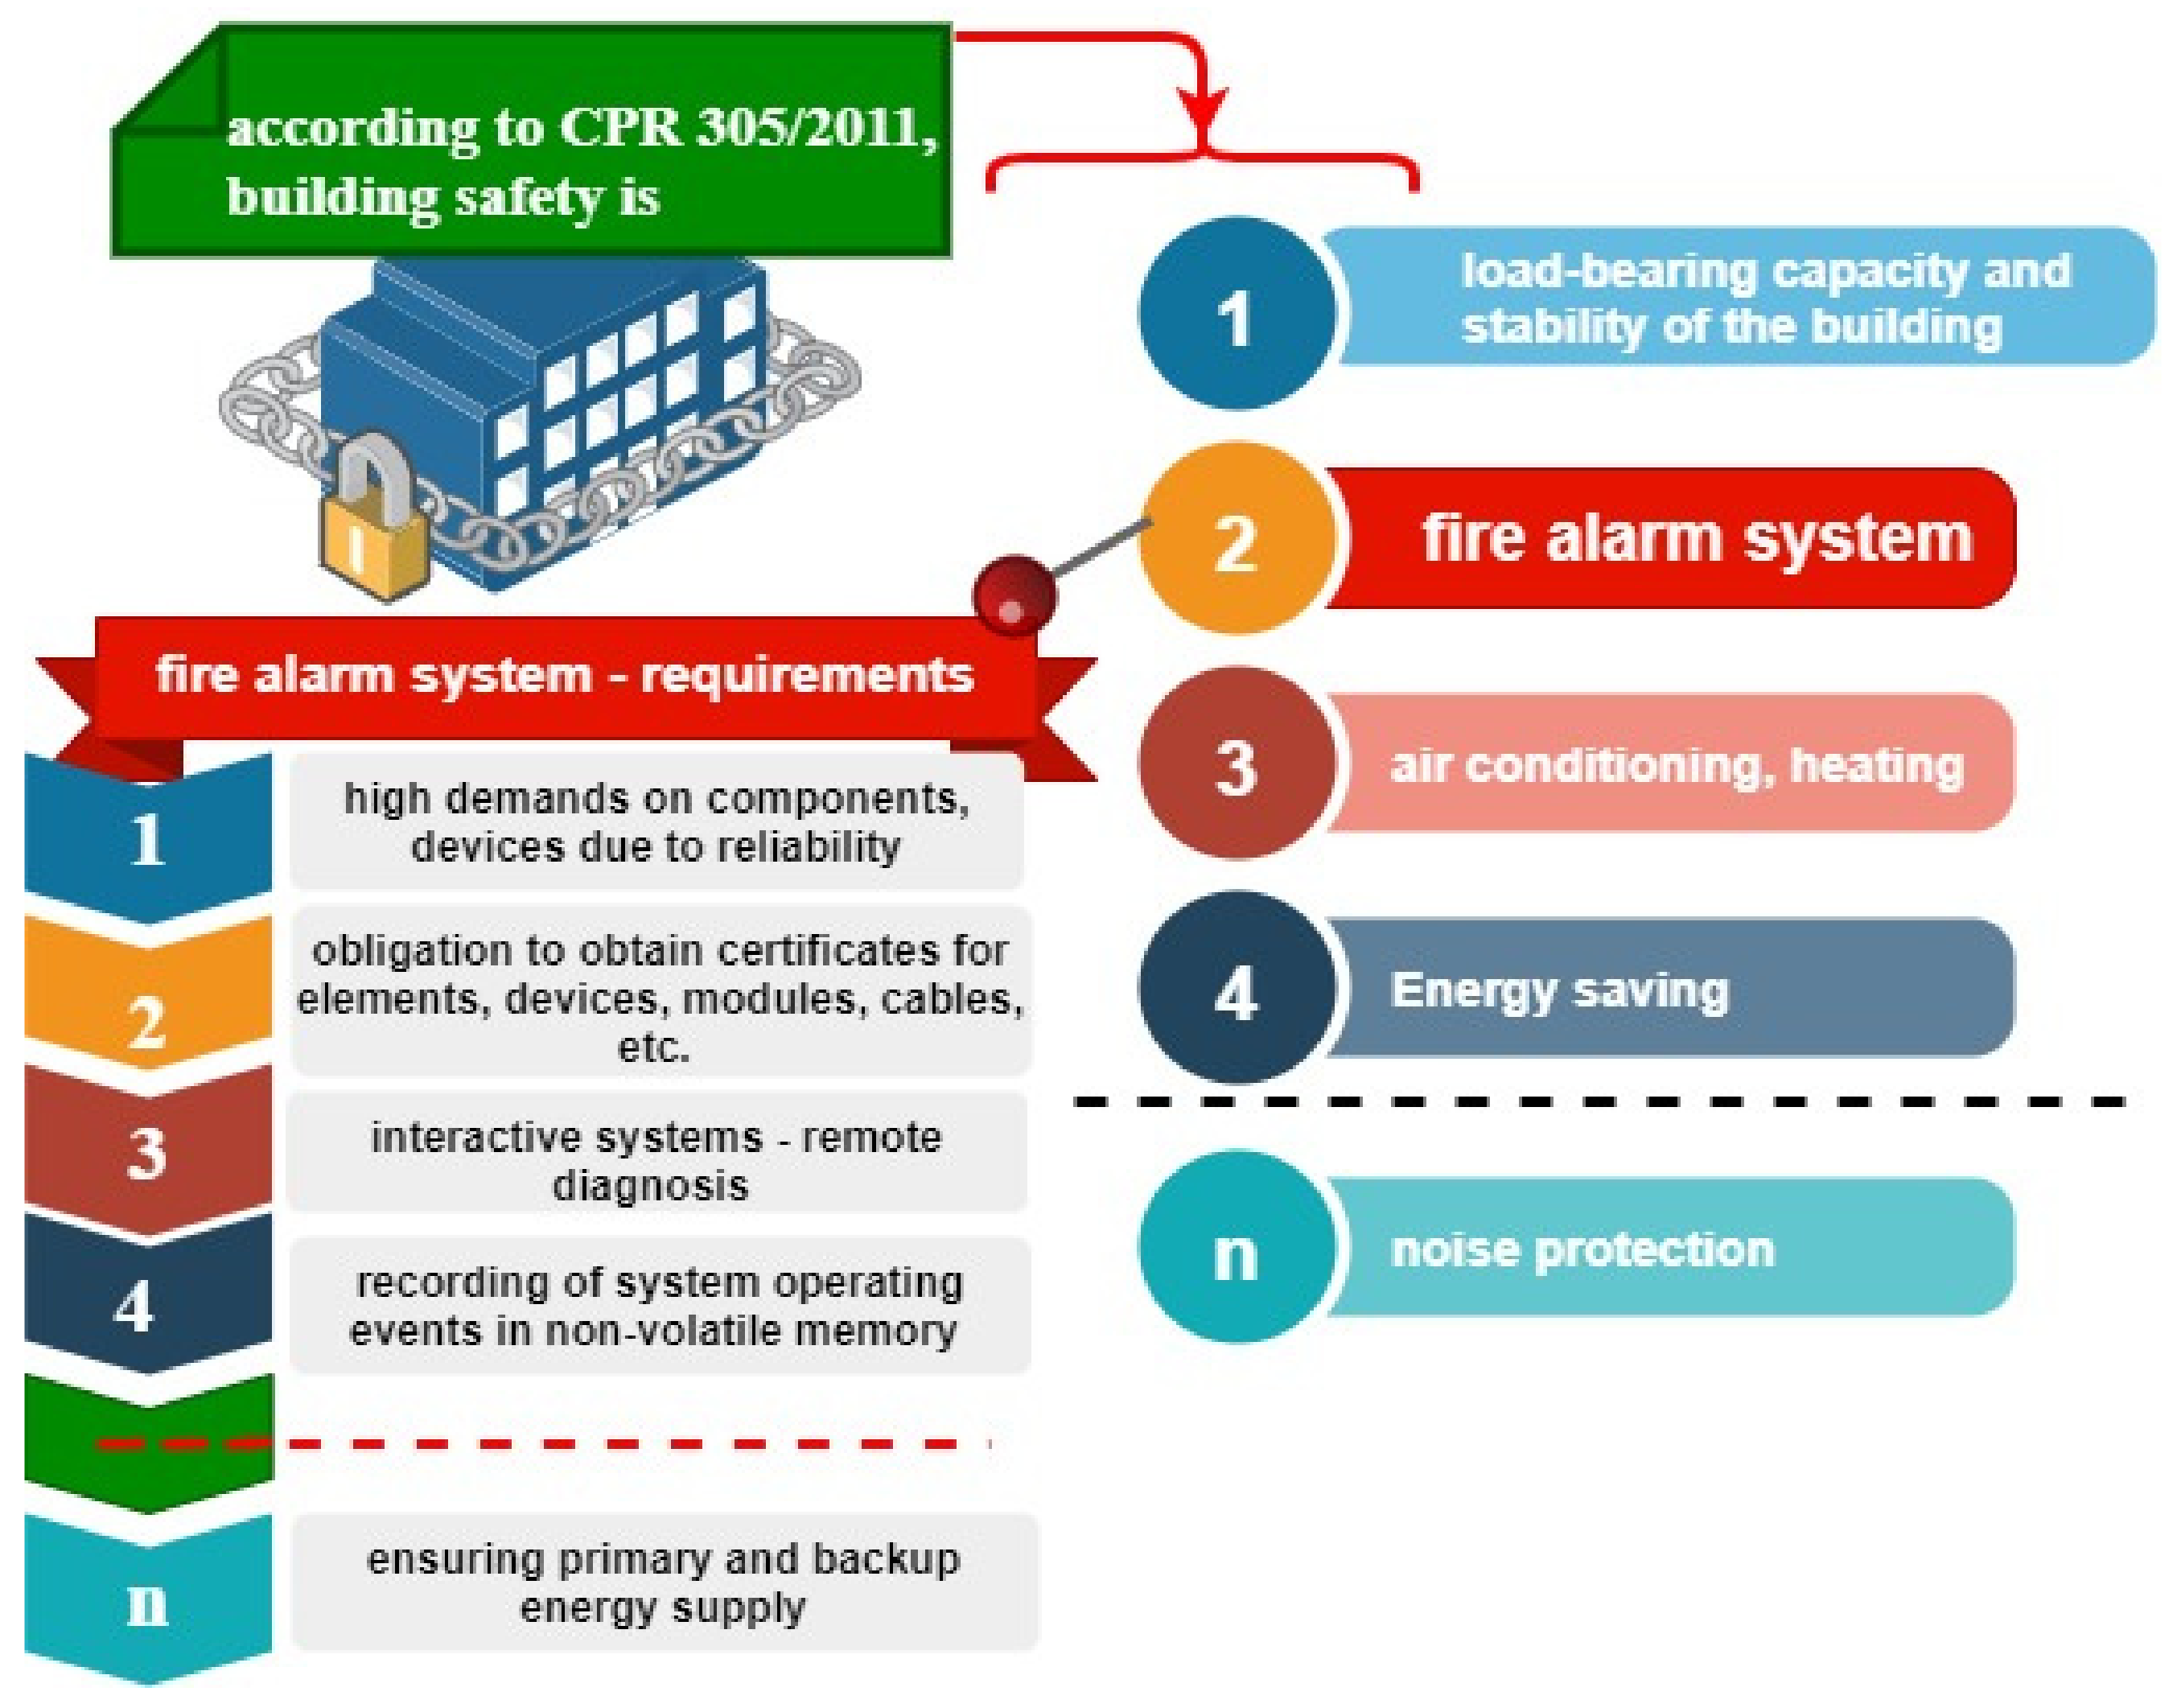
- Legislation in force within a given country (e.g., in Poland, Regulation of the Minister of Interior and Administration of 7 June 2010, (Dz.U. 109, item 719) [1];
- FAS installation and operation follows a statement or independent decision of an investor, buyer or tenant of a given building; the owner, administrator or user of a given building shall be responsible for operating the system [2].
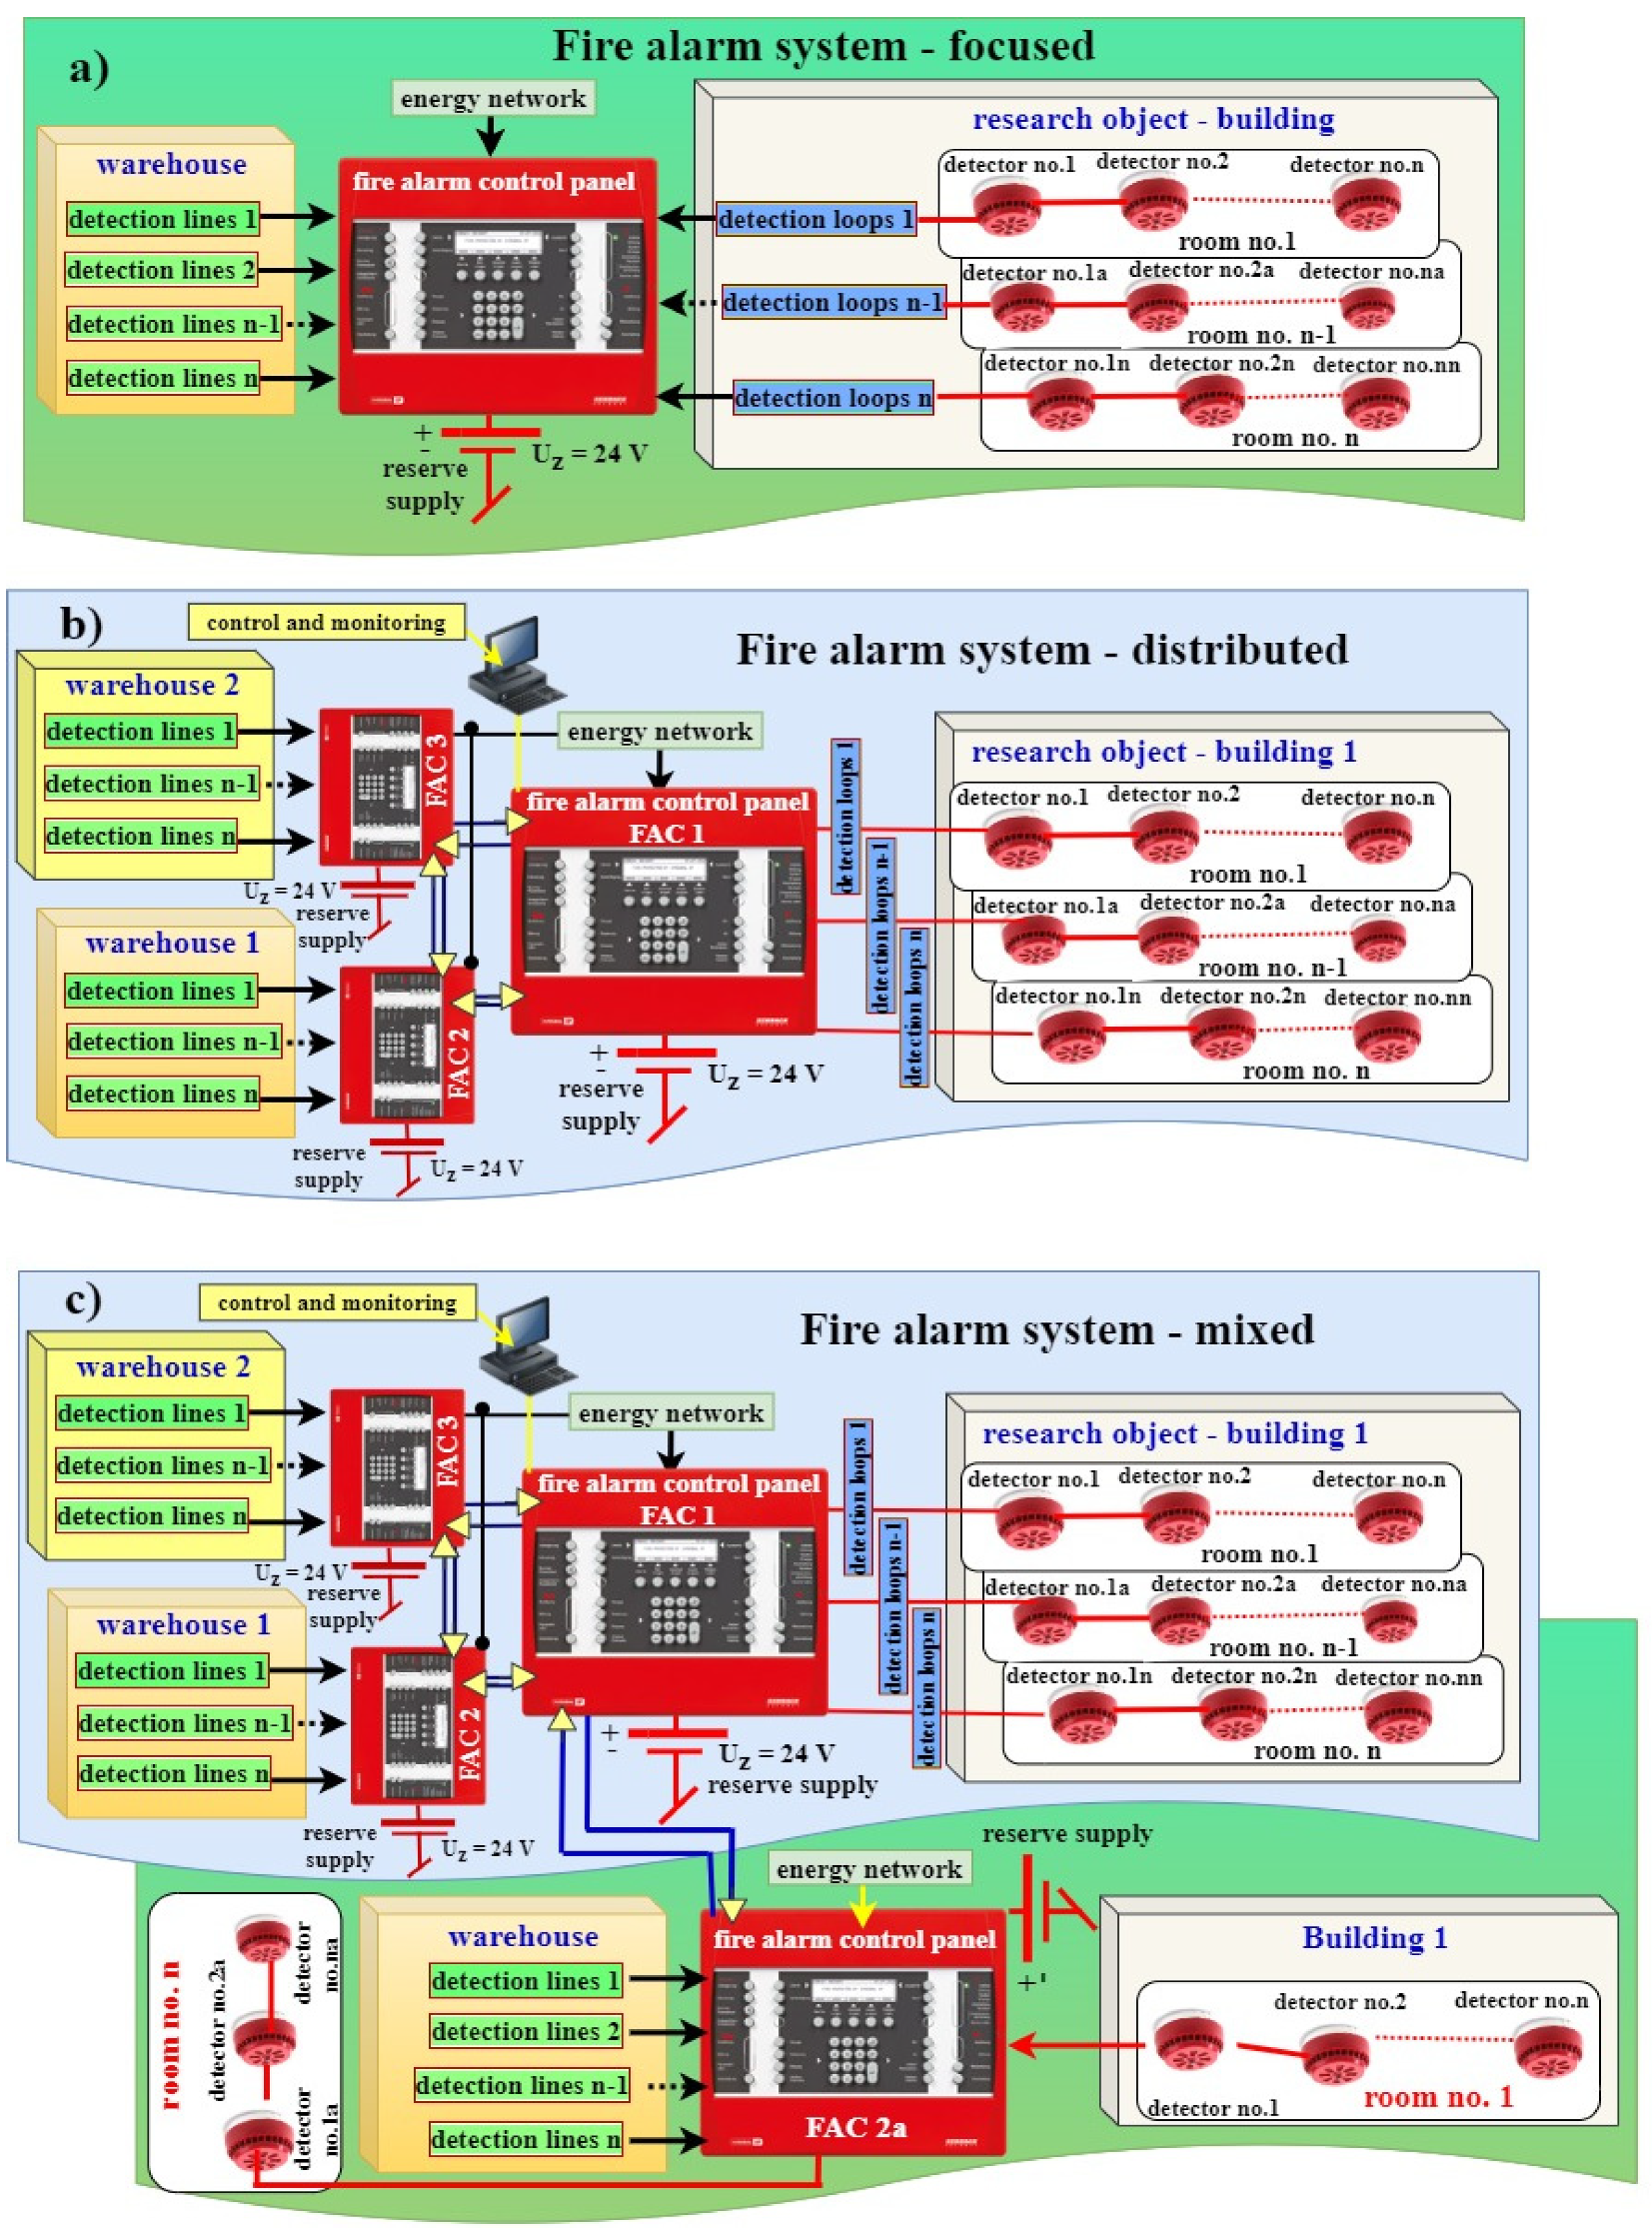
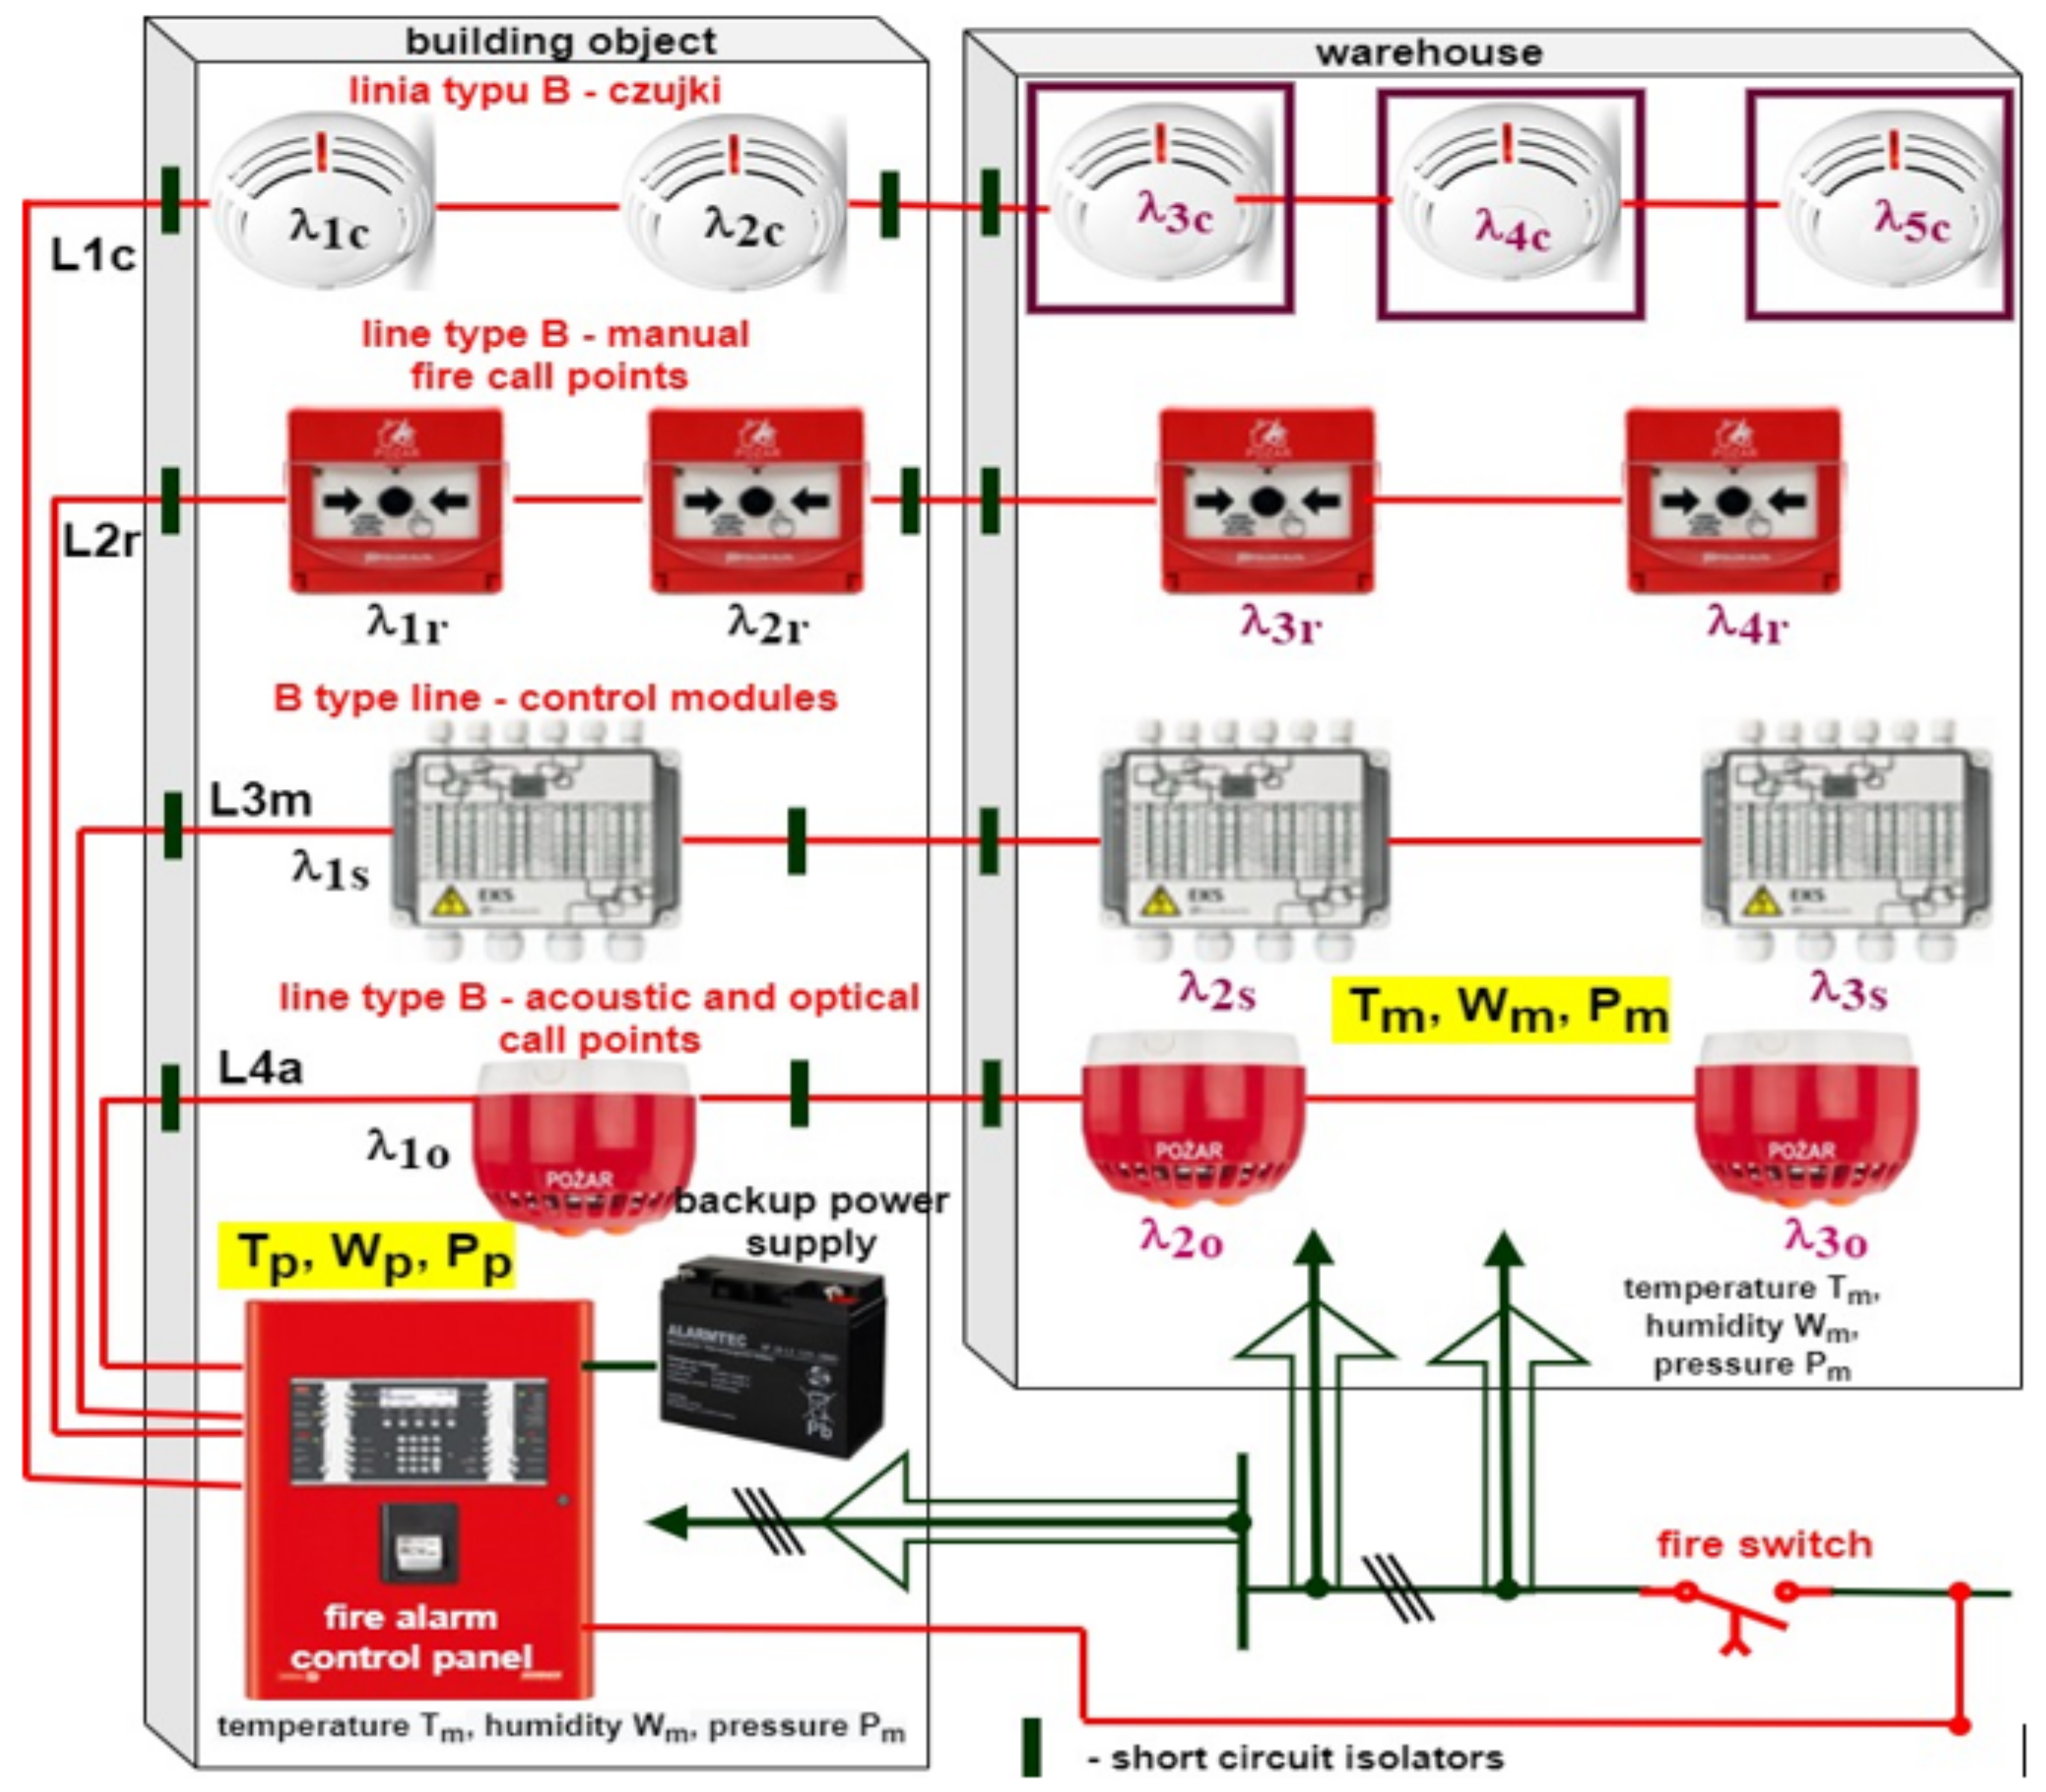
- Fire alarm systems of focused structure, where all loops, B-type radial lines, control lines, audio and optical signaling devices, etc. are connected to a fire alarm control unit (FACU) [1,10]. A single so-called connection node is present in the FACU in such a case. The distance of the most remote locations monitored by the FACU does not exceed the permissible detection line or circuit length due to the alarm signal transmission process [11,12]. The alarm control unit contains a single so-called connection node [13] (Figure 2).
- Fire alarm systems of the so-called distributed and scalable structure, have an advantage of simple system expansion through adding, e.g., a control device of an alarm sub-panel to a circuit. It is achieved through hooking-up additional fire alarm system sub-panels, which are slaves to a master FACU [14,15]. In such a case, A-type detection circuits, B-type radial lines with detectors and audio–optical signaling devices monitor separate fire zones within buildings that may be located over a vast area. In this case, the power and backup supplies are routed to each fire alarm control unit separately, from another internal supply line (ISL) [16]. All of these measures are introduced in order to ensure reliability and due to the current power load within the facility [17,18]. All FACUs monitoring a given structure or such a vast area in terms of fire safety are connected through a double transmission cable, a so-called ring, for reliability purposes or operate in a so-called star system, where a master FACU is located in its central place [19,20]. In the case of these systems, the distance of remote locations supervised by a given FACU can exceed the permissible length of lines, detection circuits or control lines [21,22]. Due to the costs of executing a given fire system (e.g., execution of several detection lines to a remote protected part or facility) over a vast area, such a solution may be cheaper or more reliable than, e.g., the application of a focused FAS [23,24]. Due to the potential electromagnetic interference over a vast area, it is possible to connect individual FACUs using a fiber optic cable [25,26] (Figure 2).
- Fire alarm systems of mixed structure are executed taking into account the sole costs of executing a given FAS, but also due to the possibility of applying various complex reliability structures when integrating the entire system [27,28]. In such a case, two different FAS structures shall be used, one distributed for monitoring a vast area and a high number of buildings, and a focused one [29,30]. A focused-structure fire alarm system is in such a case connected to a distributed FACU via a transmission line. A focused or distributed system in a given building or facility may be additionally fitted with a fixed fire equipment (FFE) gas suppression system (GSS) [31,32] (Figure 2).
2. Literature Review
3. Power Supply Implementation for Fire Alarm Systems
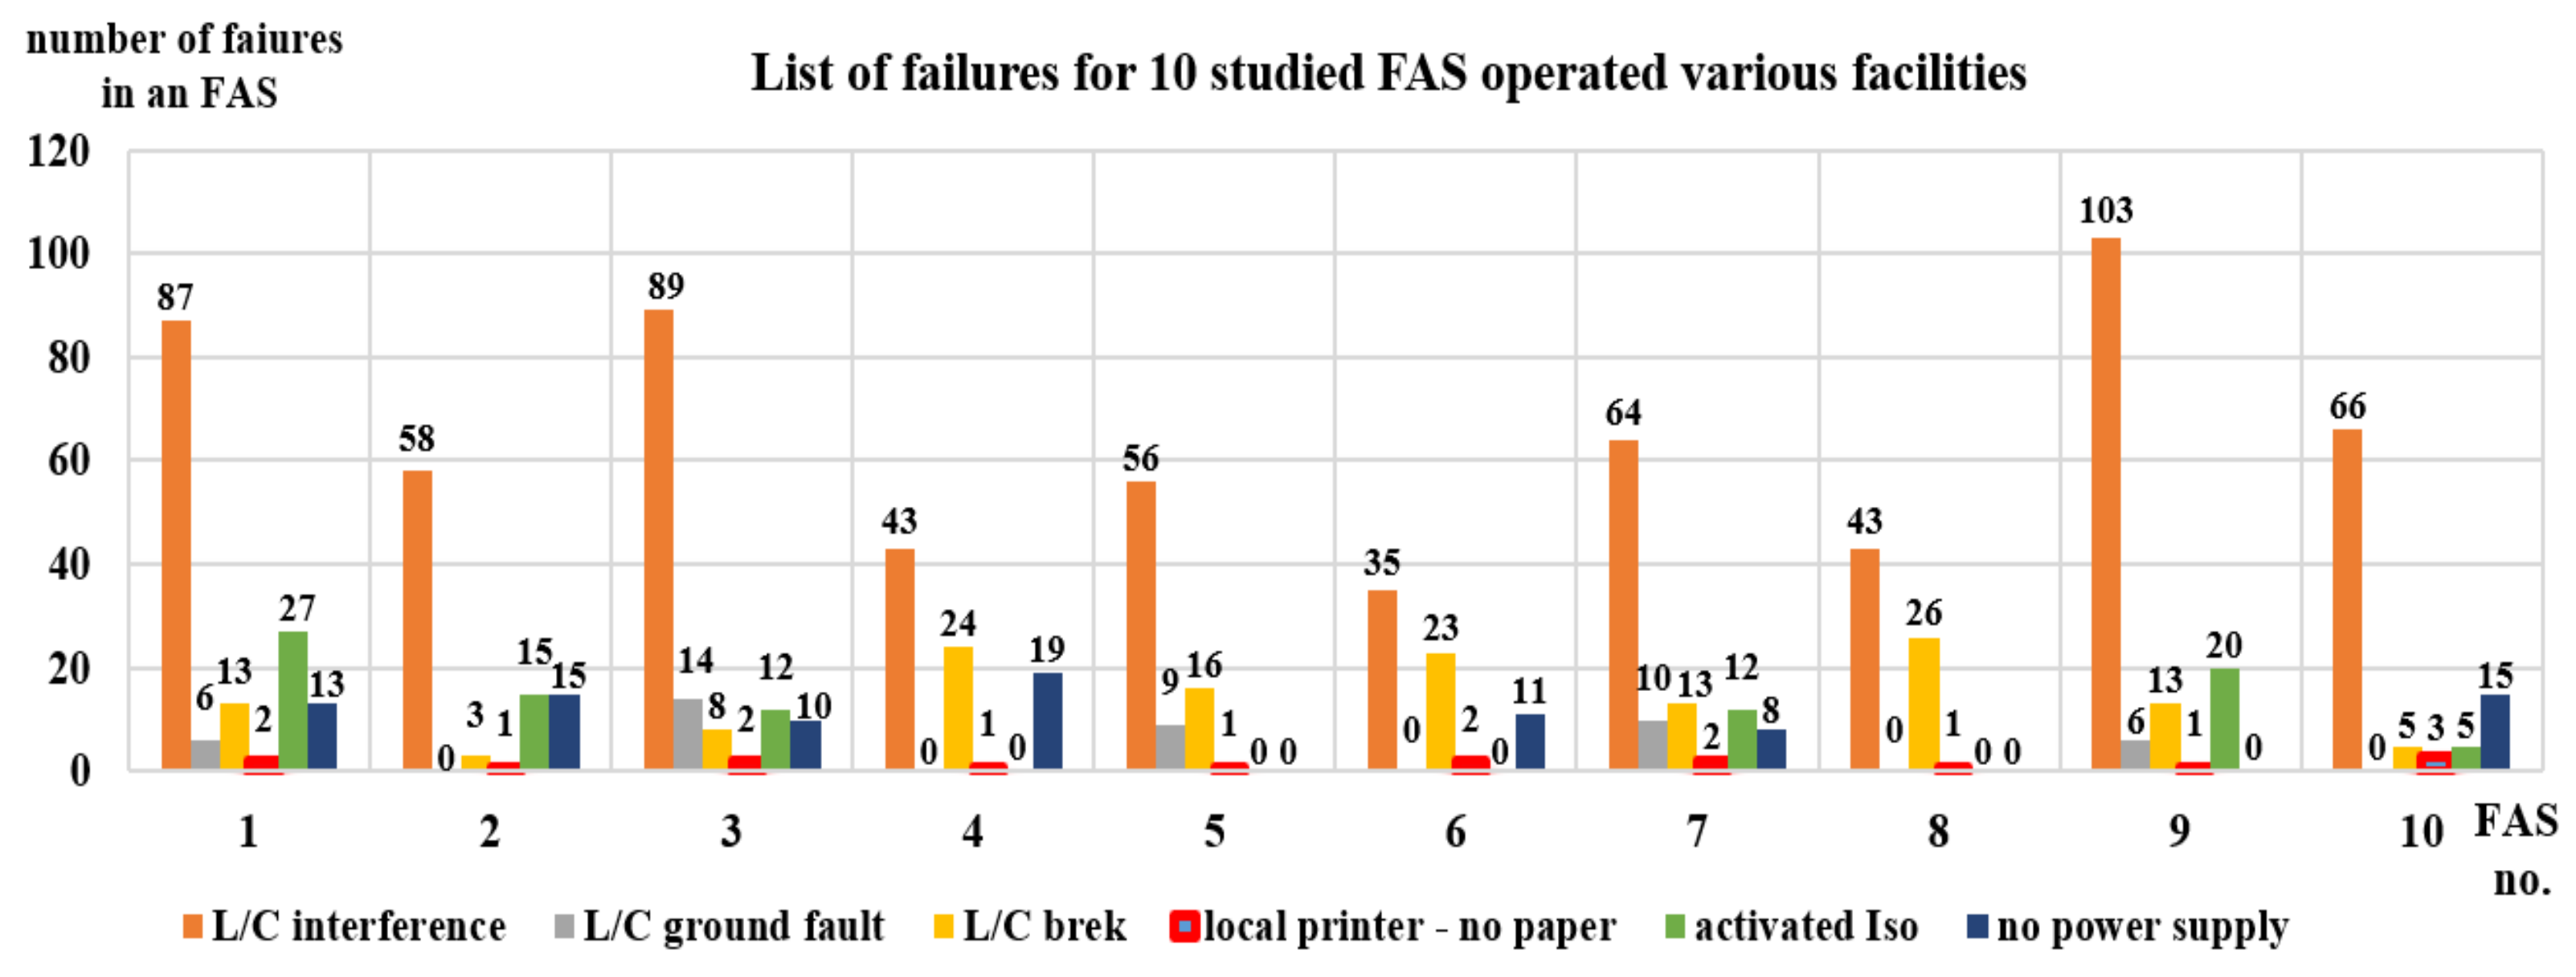
4. Determination of Operating Process Indicators for Selected Fire Alarm Systems
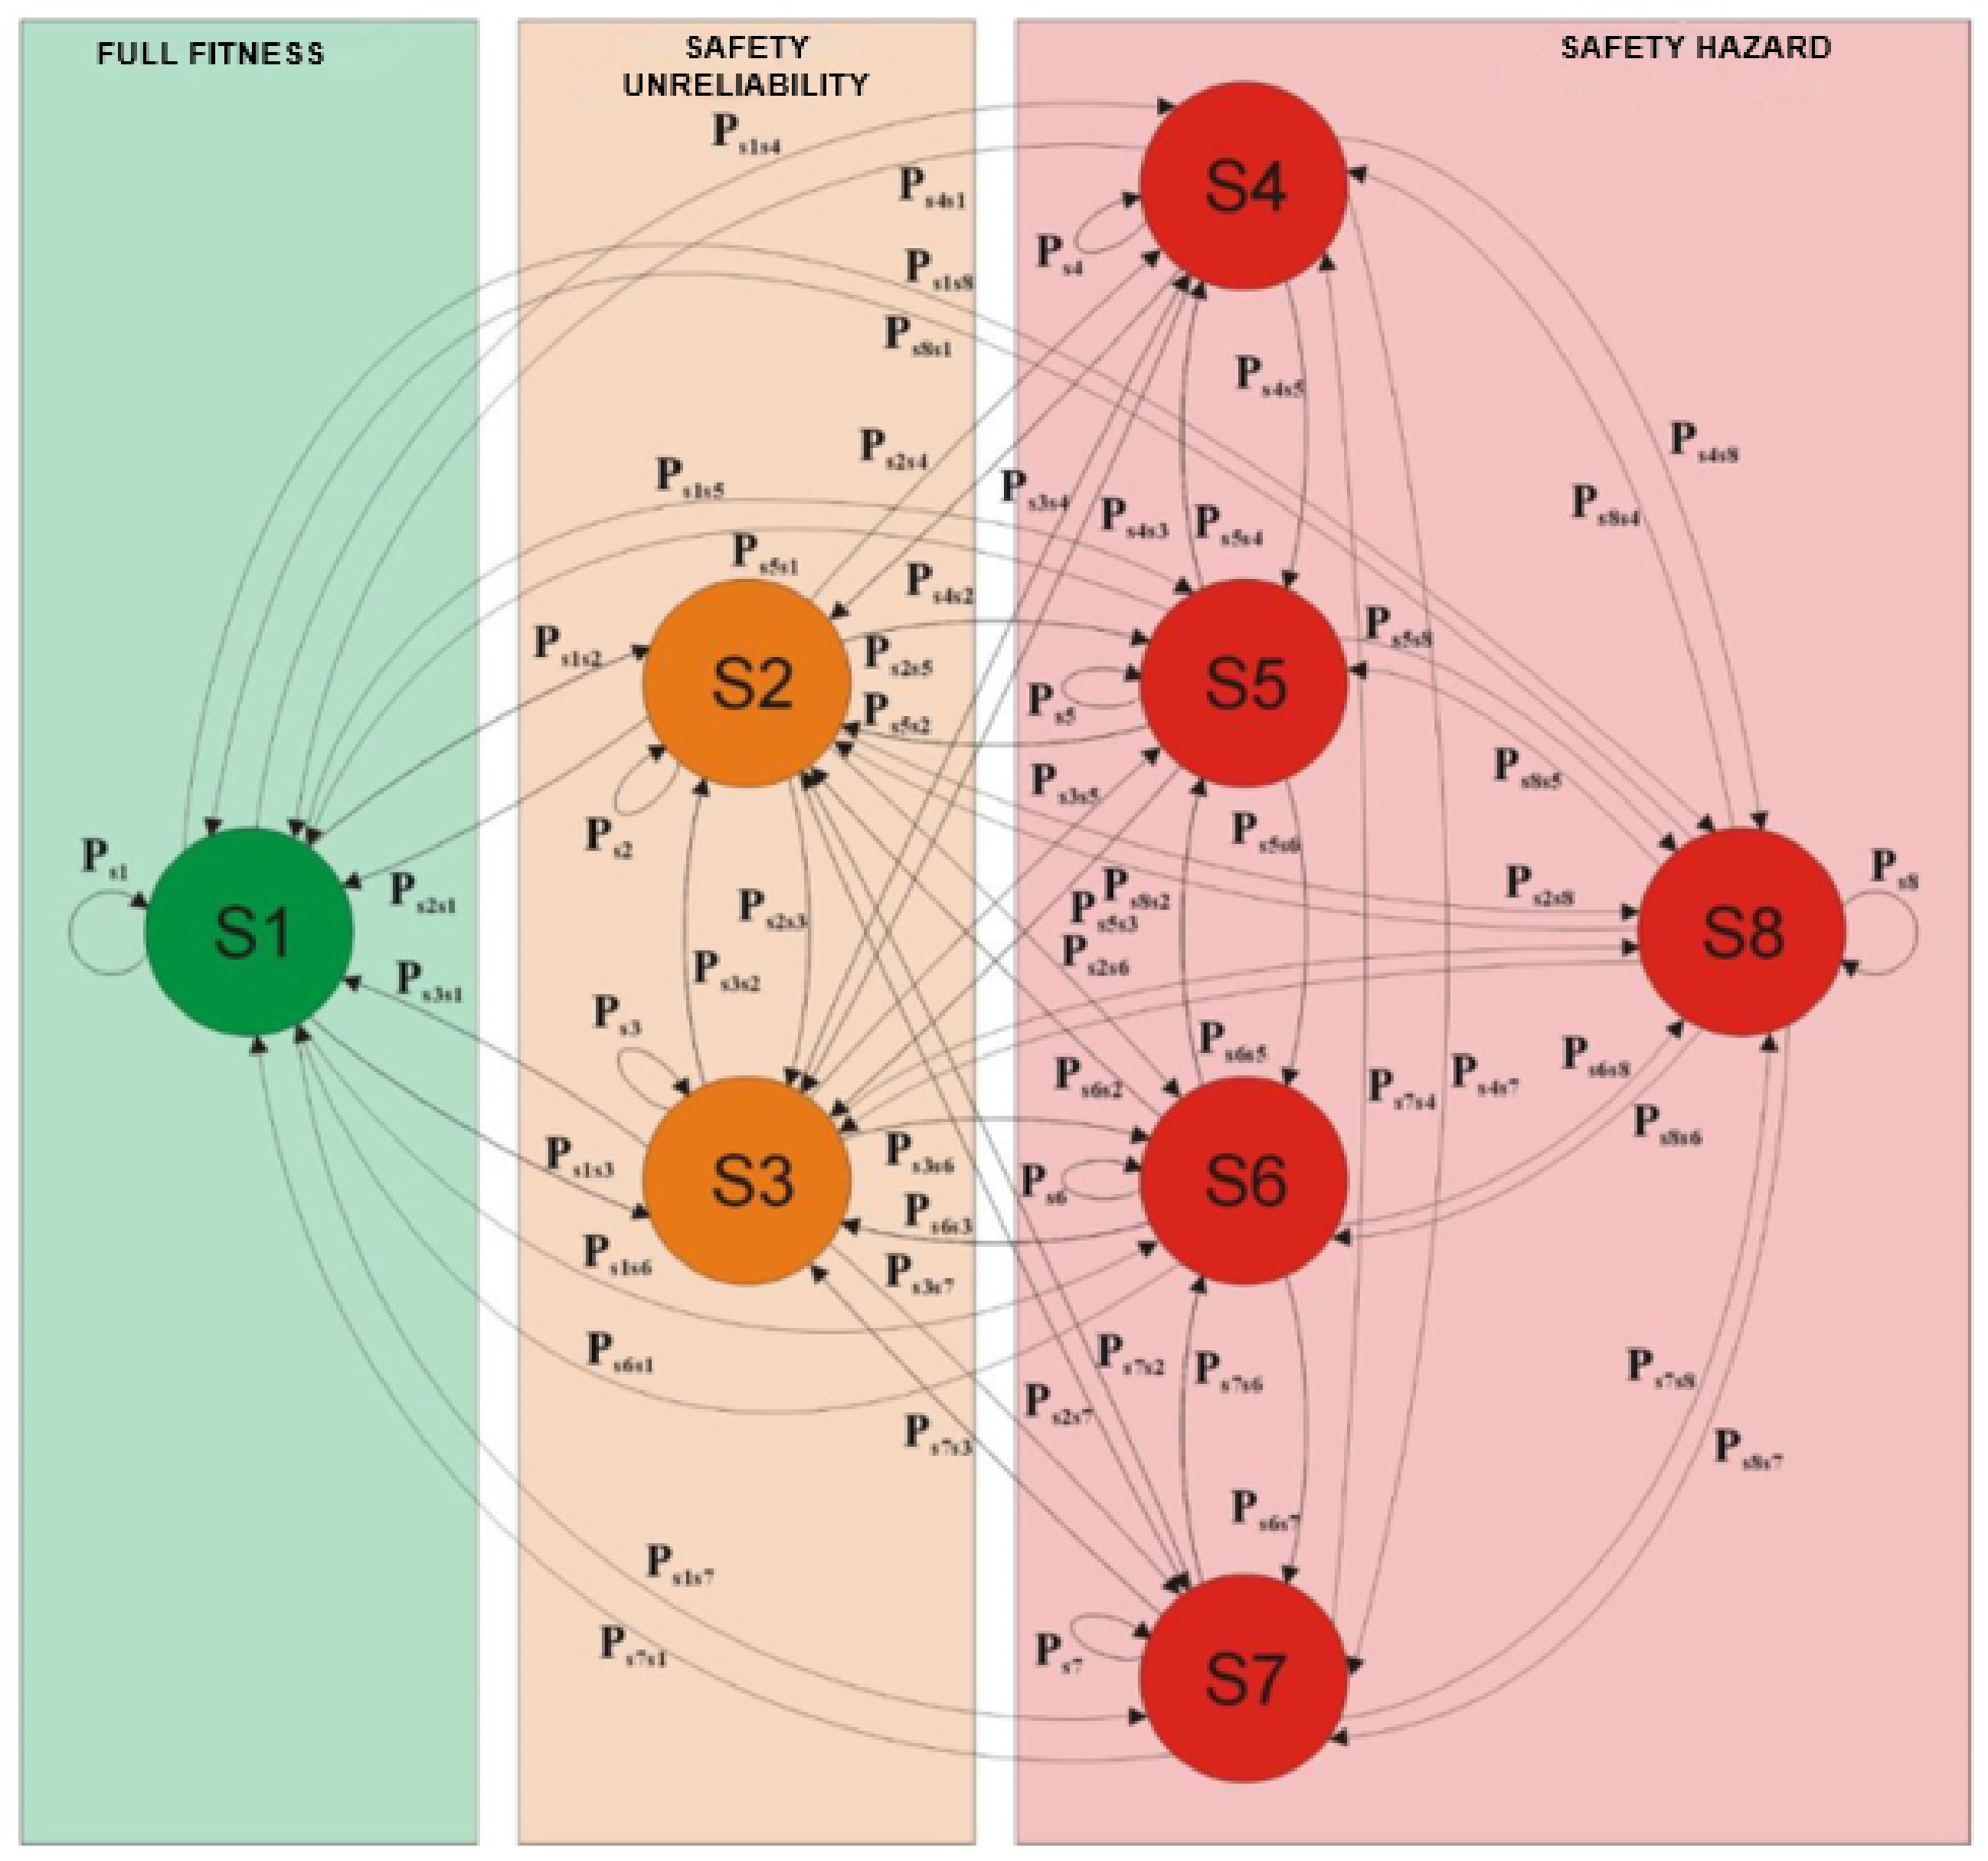
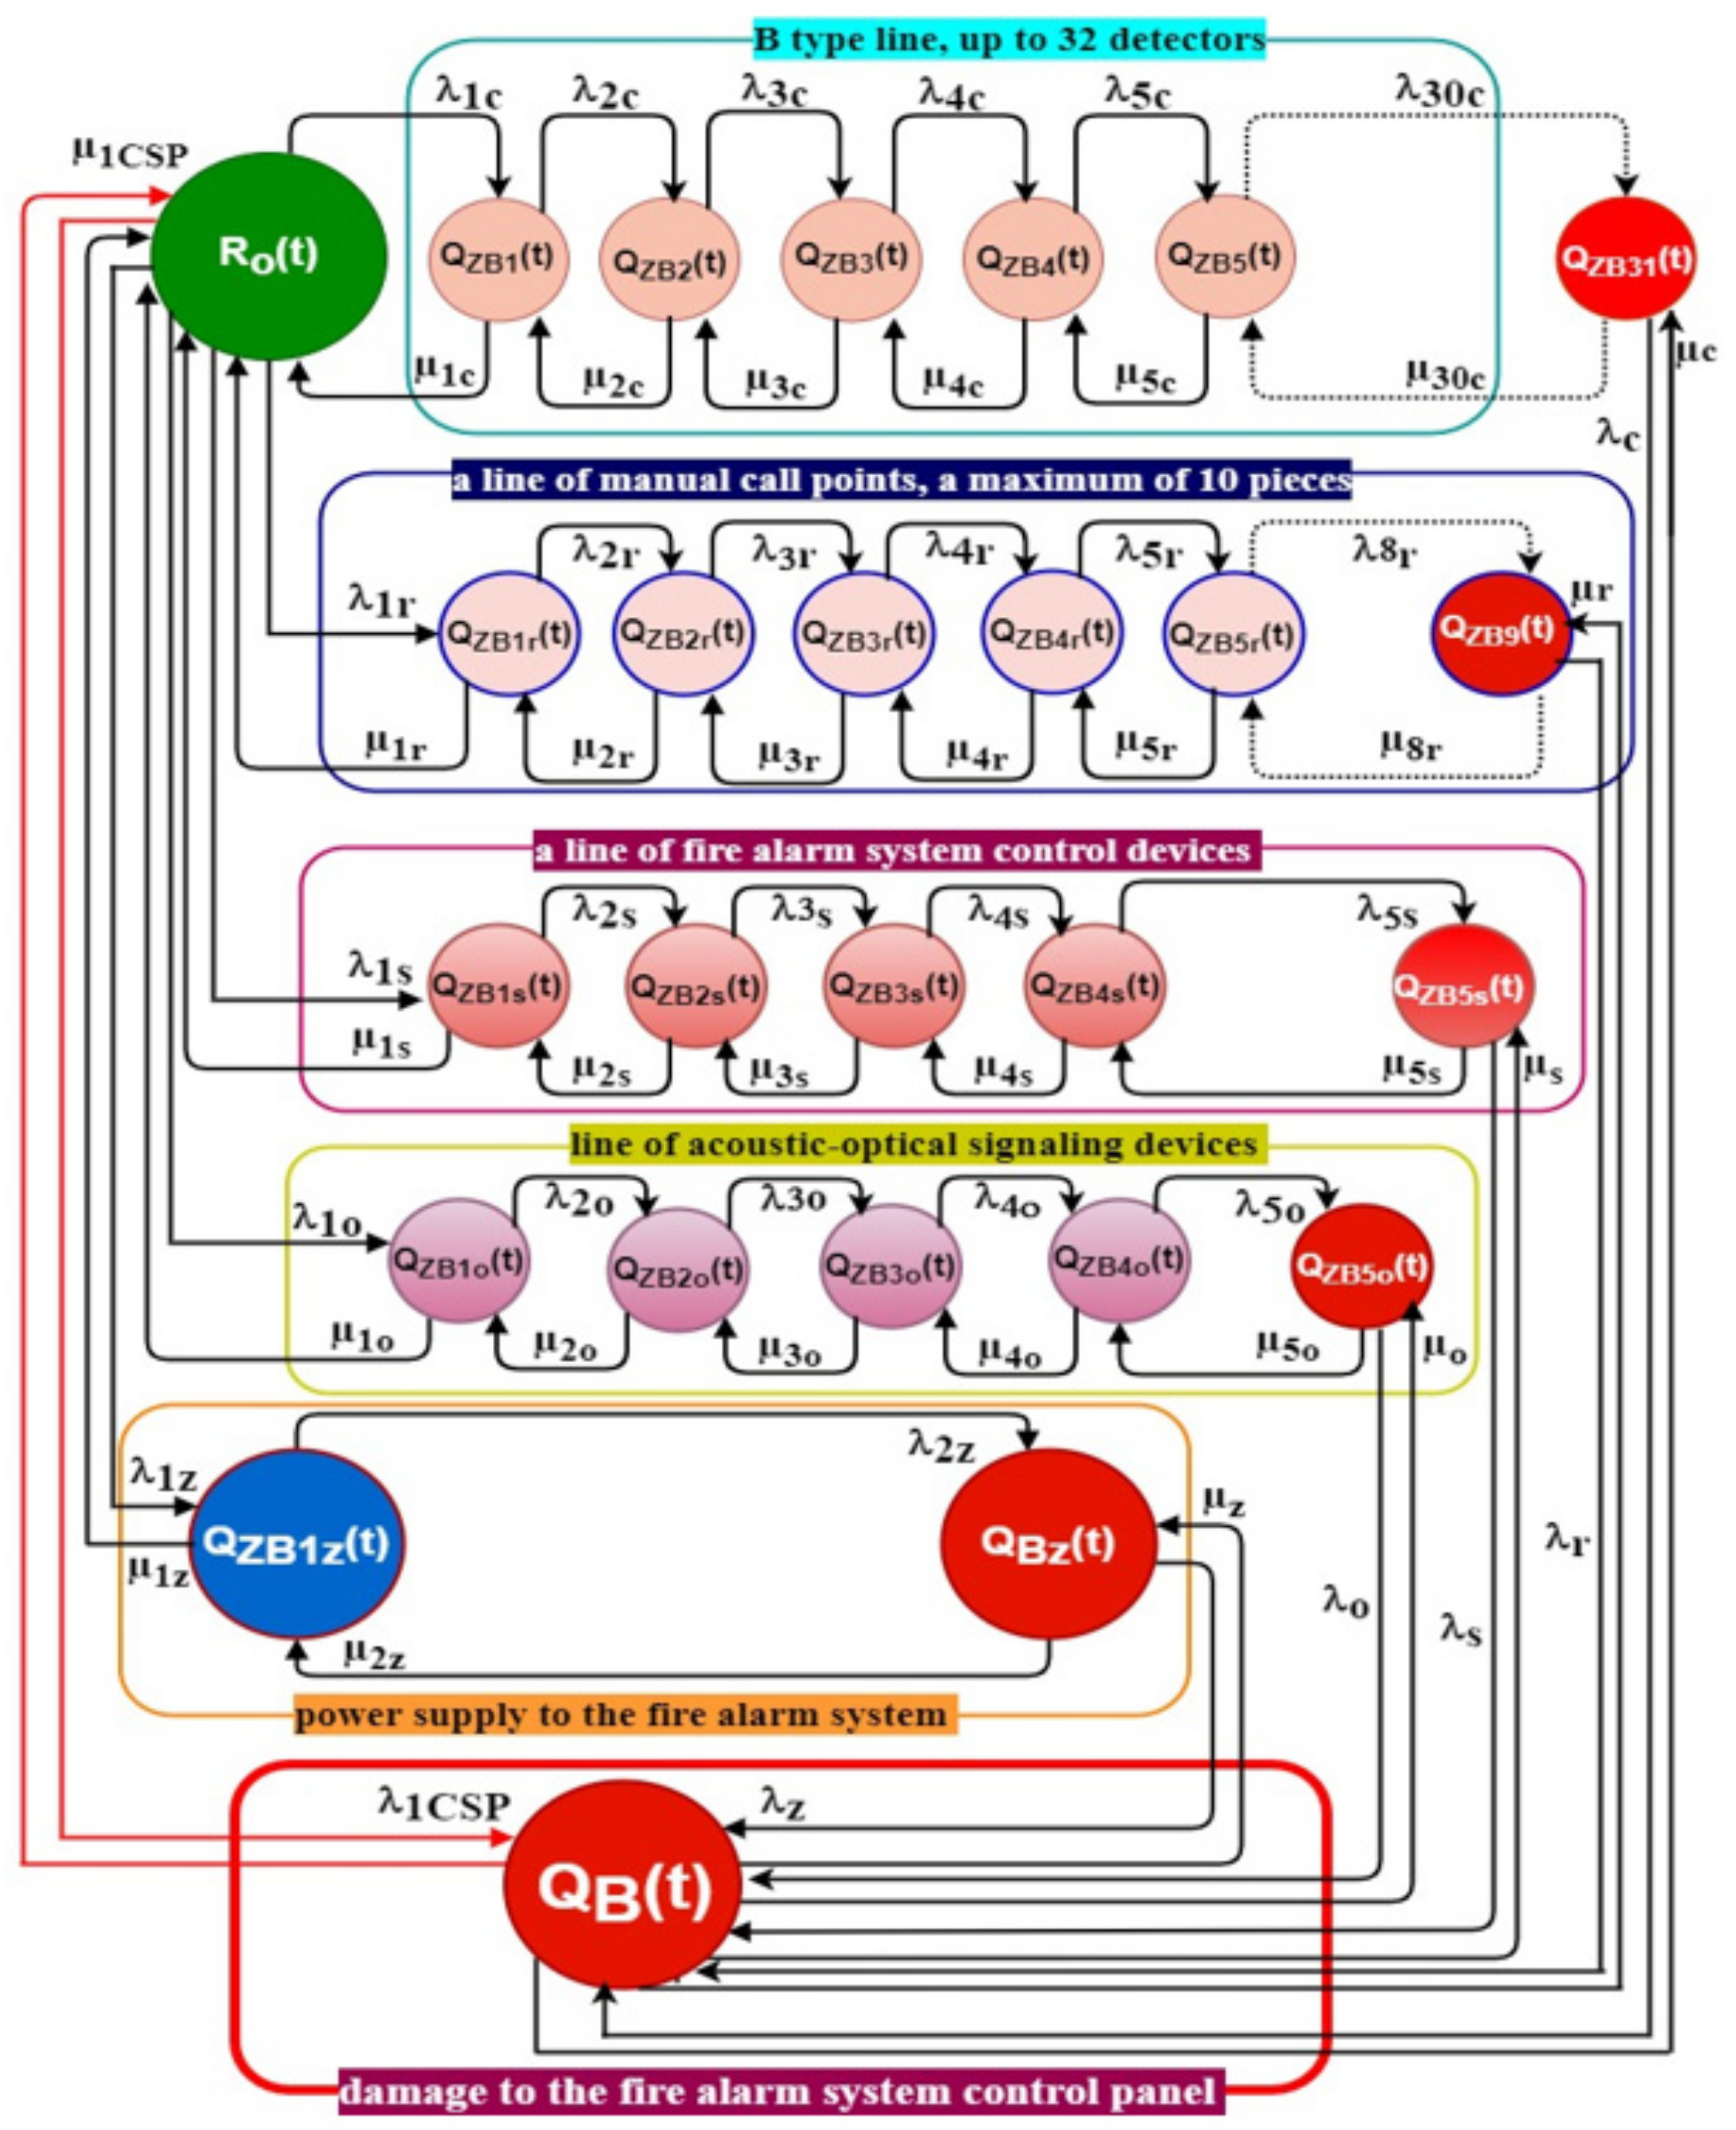
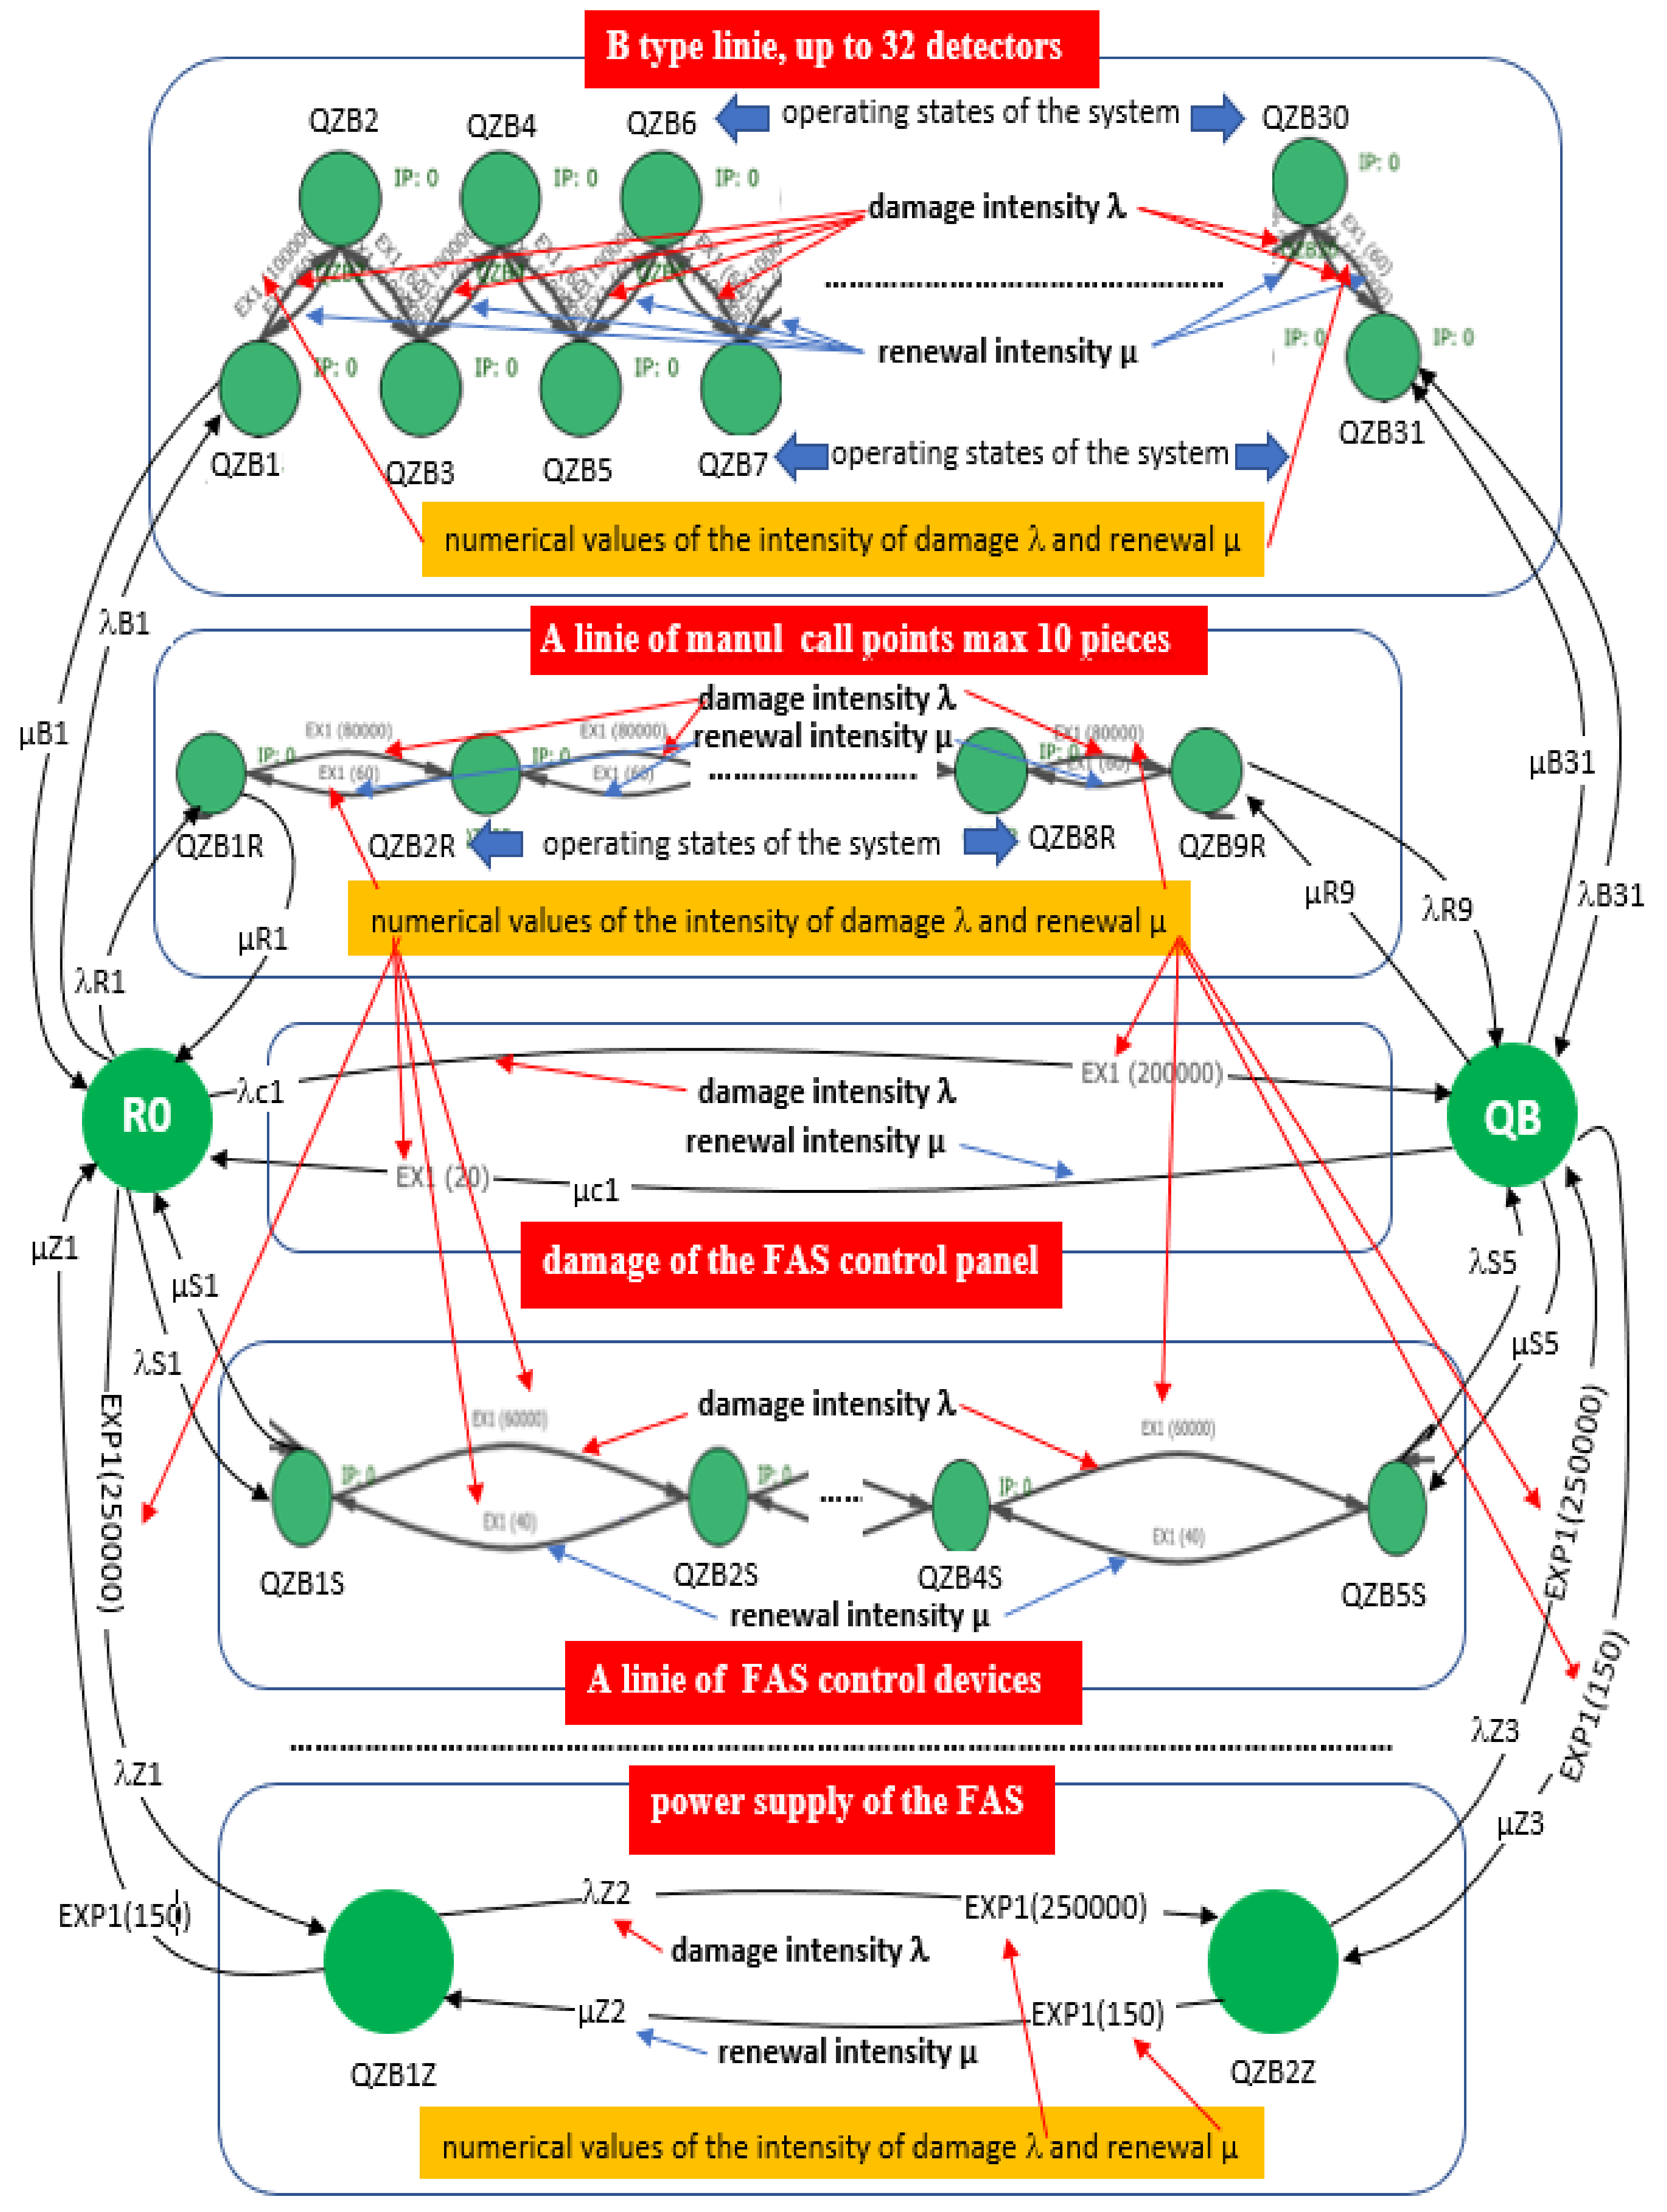
5. Operation Process of Selected Fire Alarm Systems
- S1—all system elements operate correctly—FACU, Cz1, Cz2;
- S2—the only damaged fire detector is No. 1—Cz1;
- S3—the only damaged fire detector is No. 2—Cz2;
- S4—only the fire alarm control unit—CSP is damaged;
- S5—both fire detectors damaged—Cz1, Cz2;
- S6—the only working fire detector is No. 1—Cz1;
- S7—the only working fire detector is No. 2—Cz2;
- S8—all system elements damaged—FACU, Cz1, Cz2;
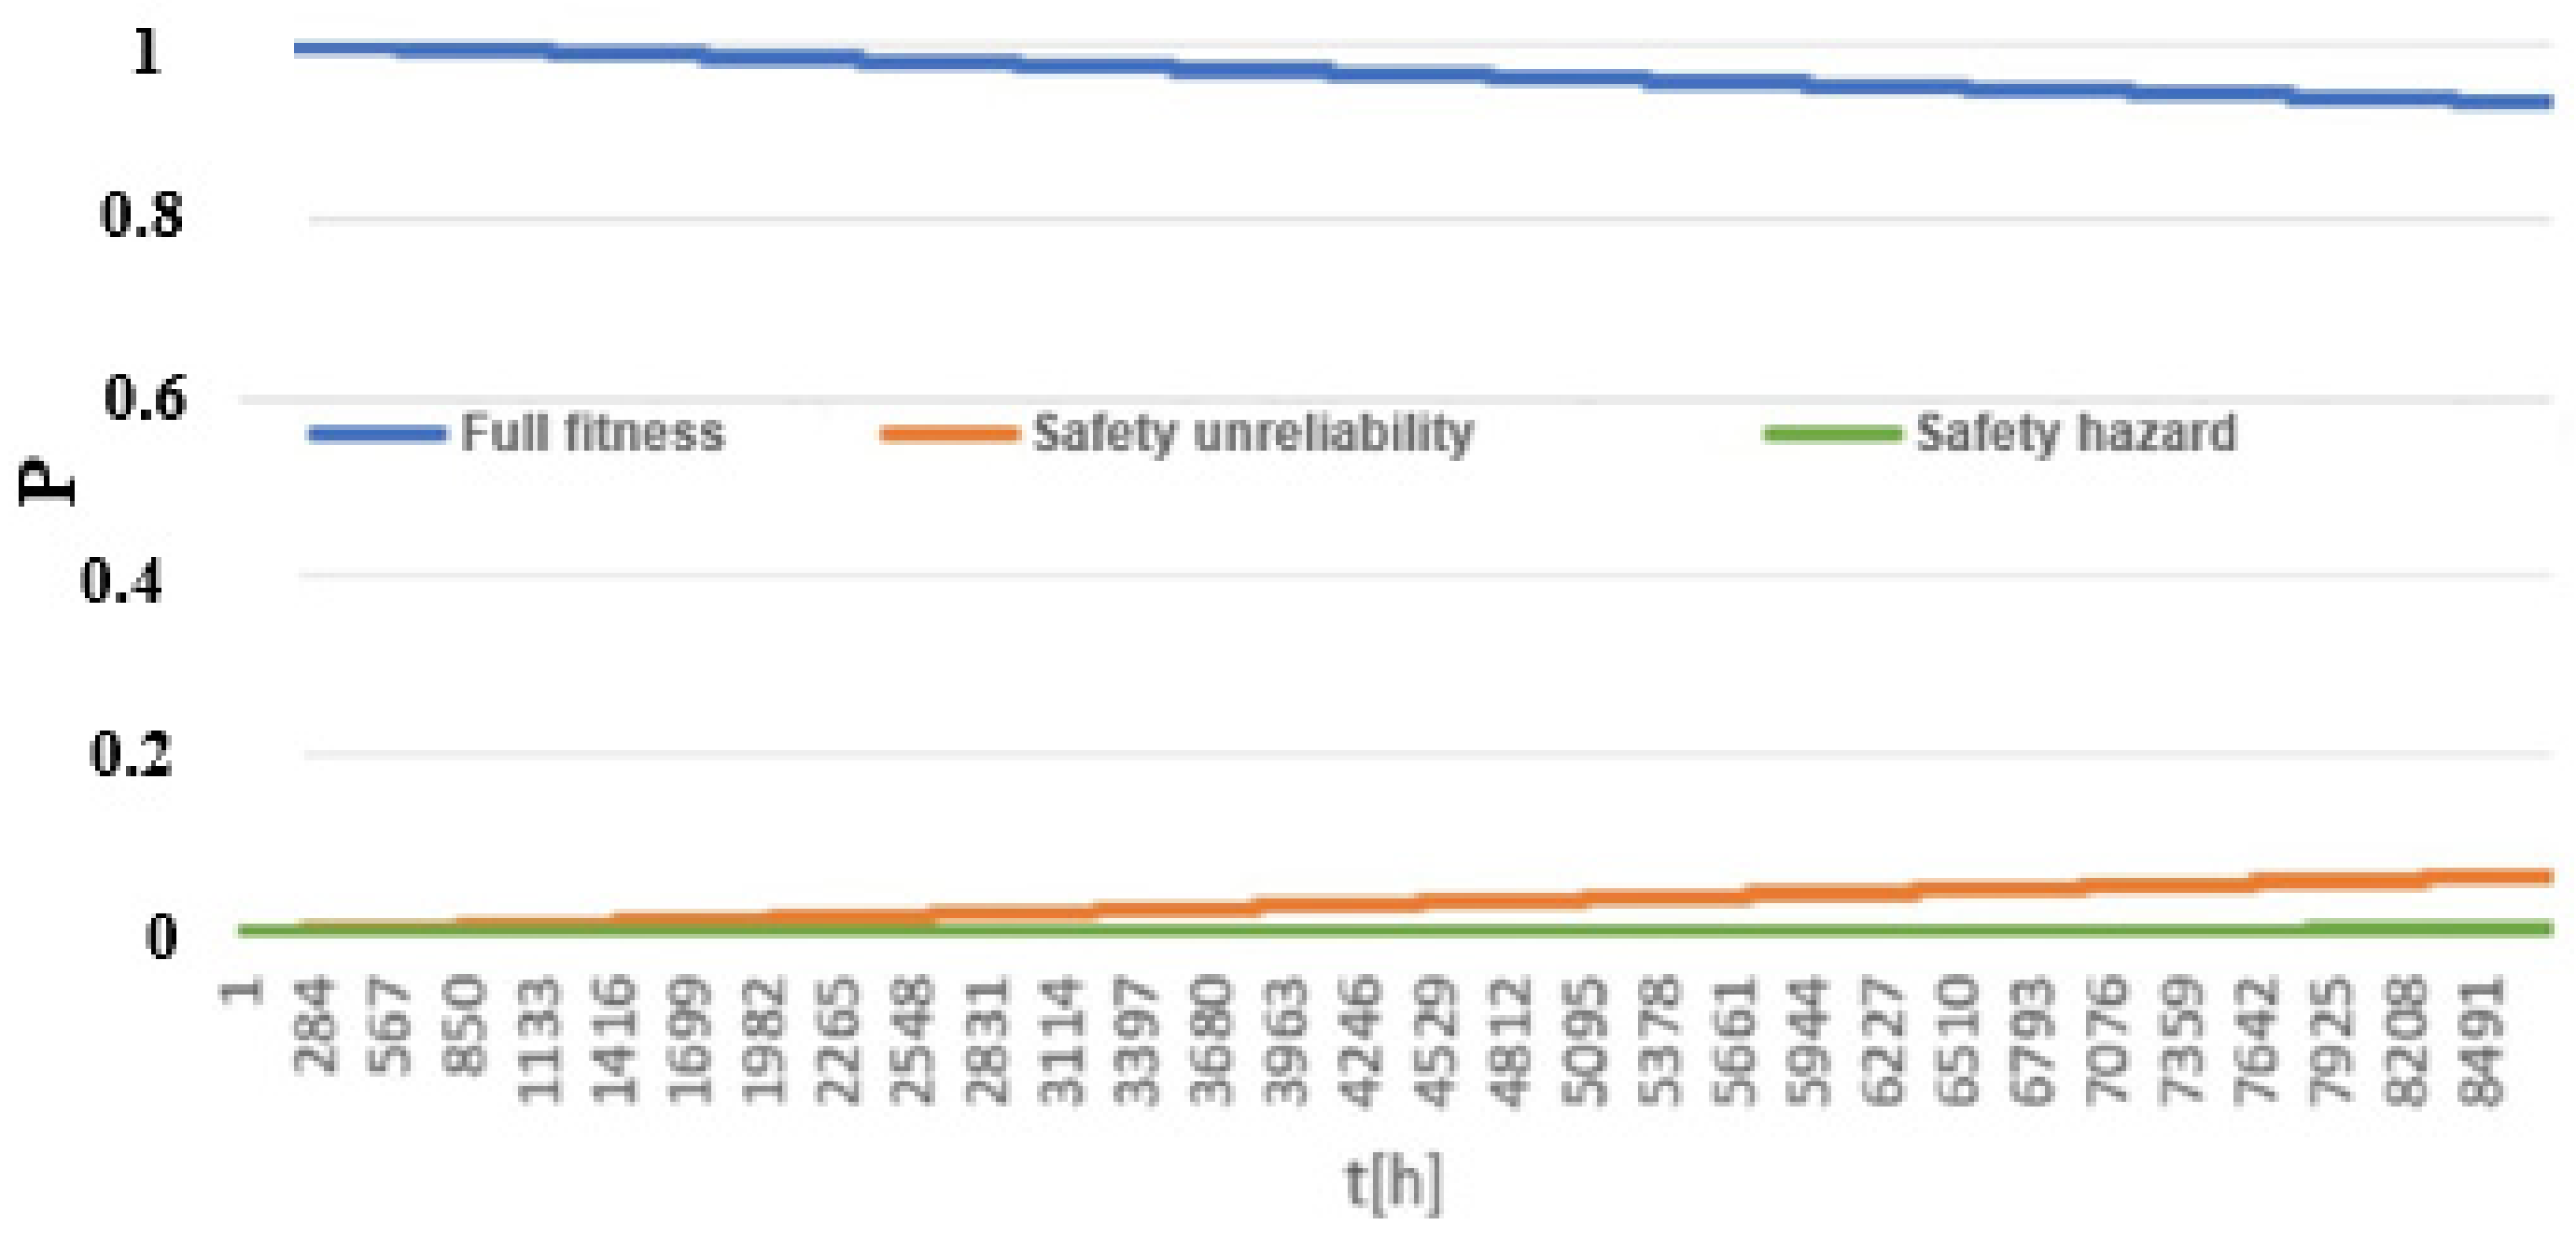
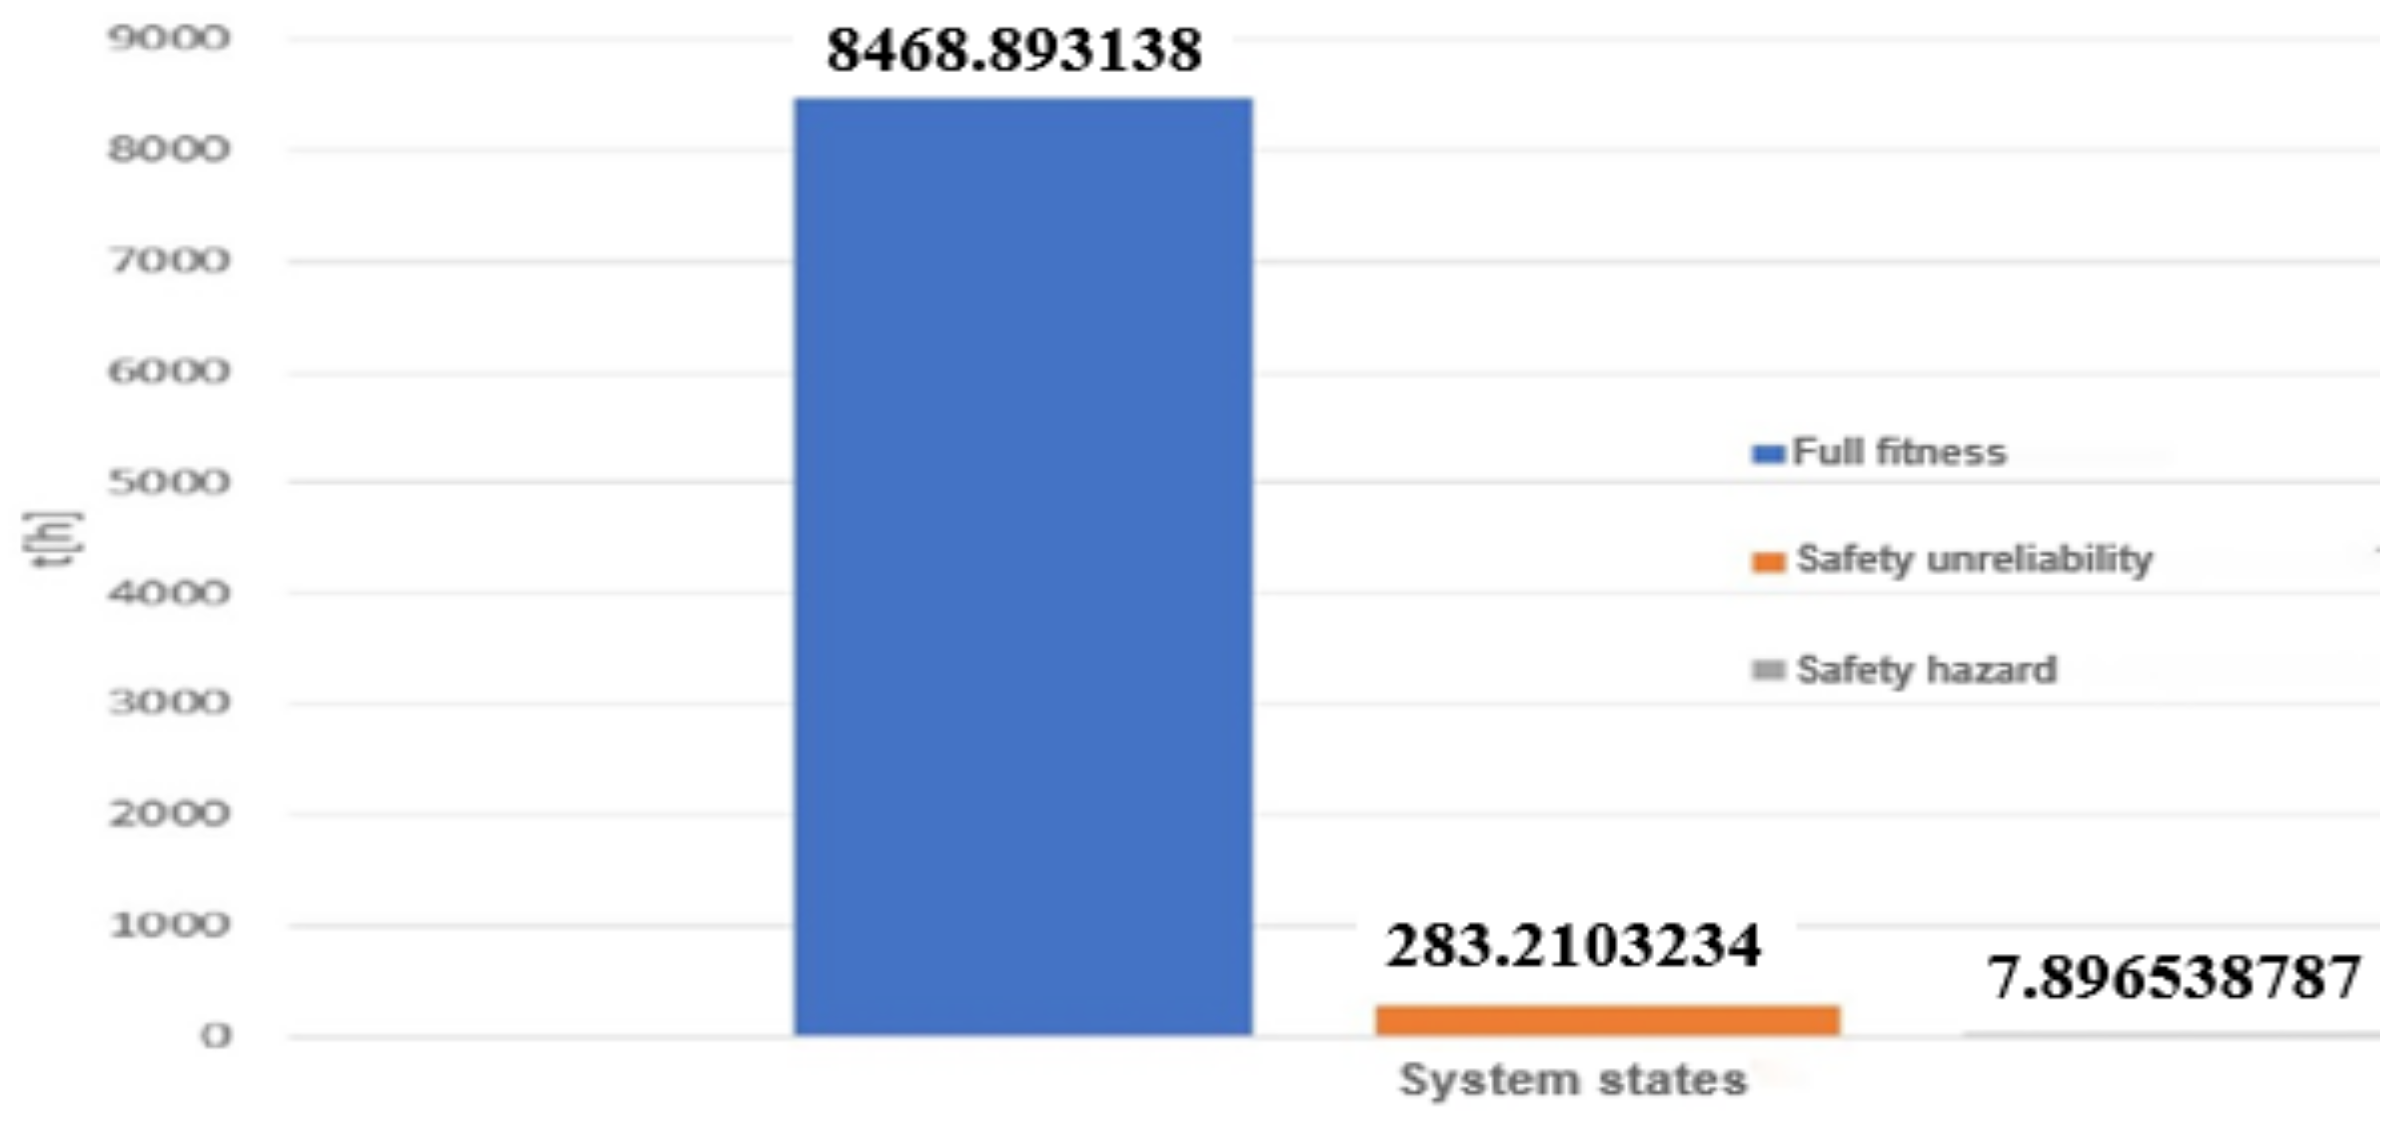
- Full fitness SPZ—if occurring in state S1;
- Safety unreliability QB—if occurring in state S2 or S3;
- Safety hazard QZB—if occurring in state S4 or … S5, S6, S7, S8.
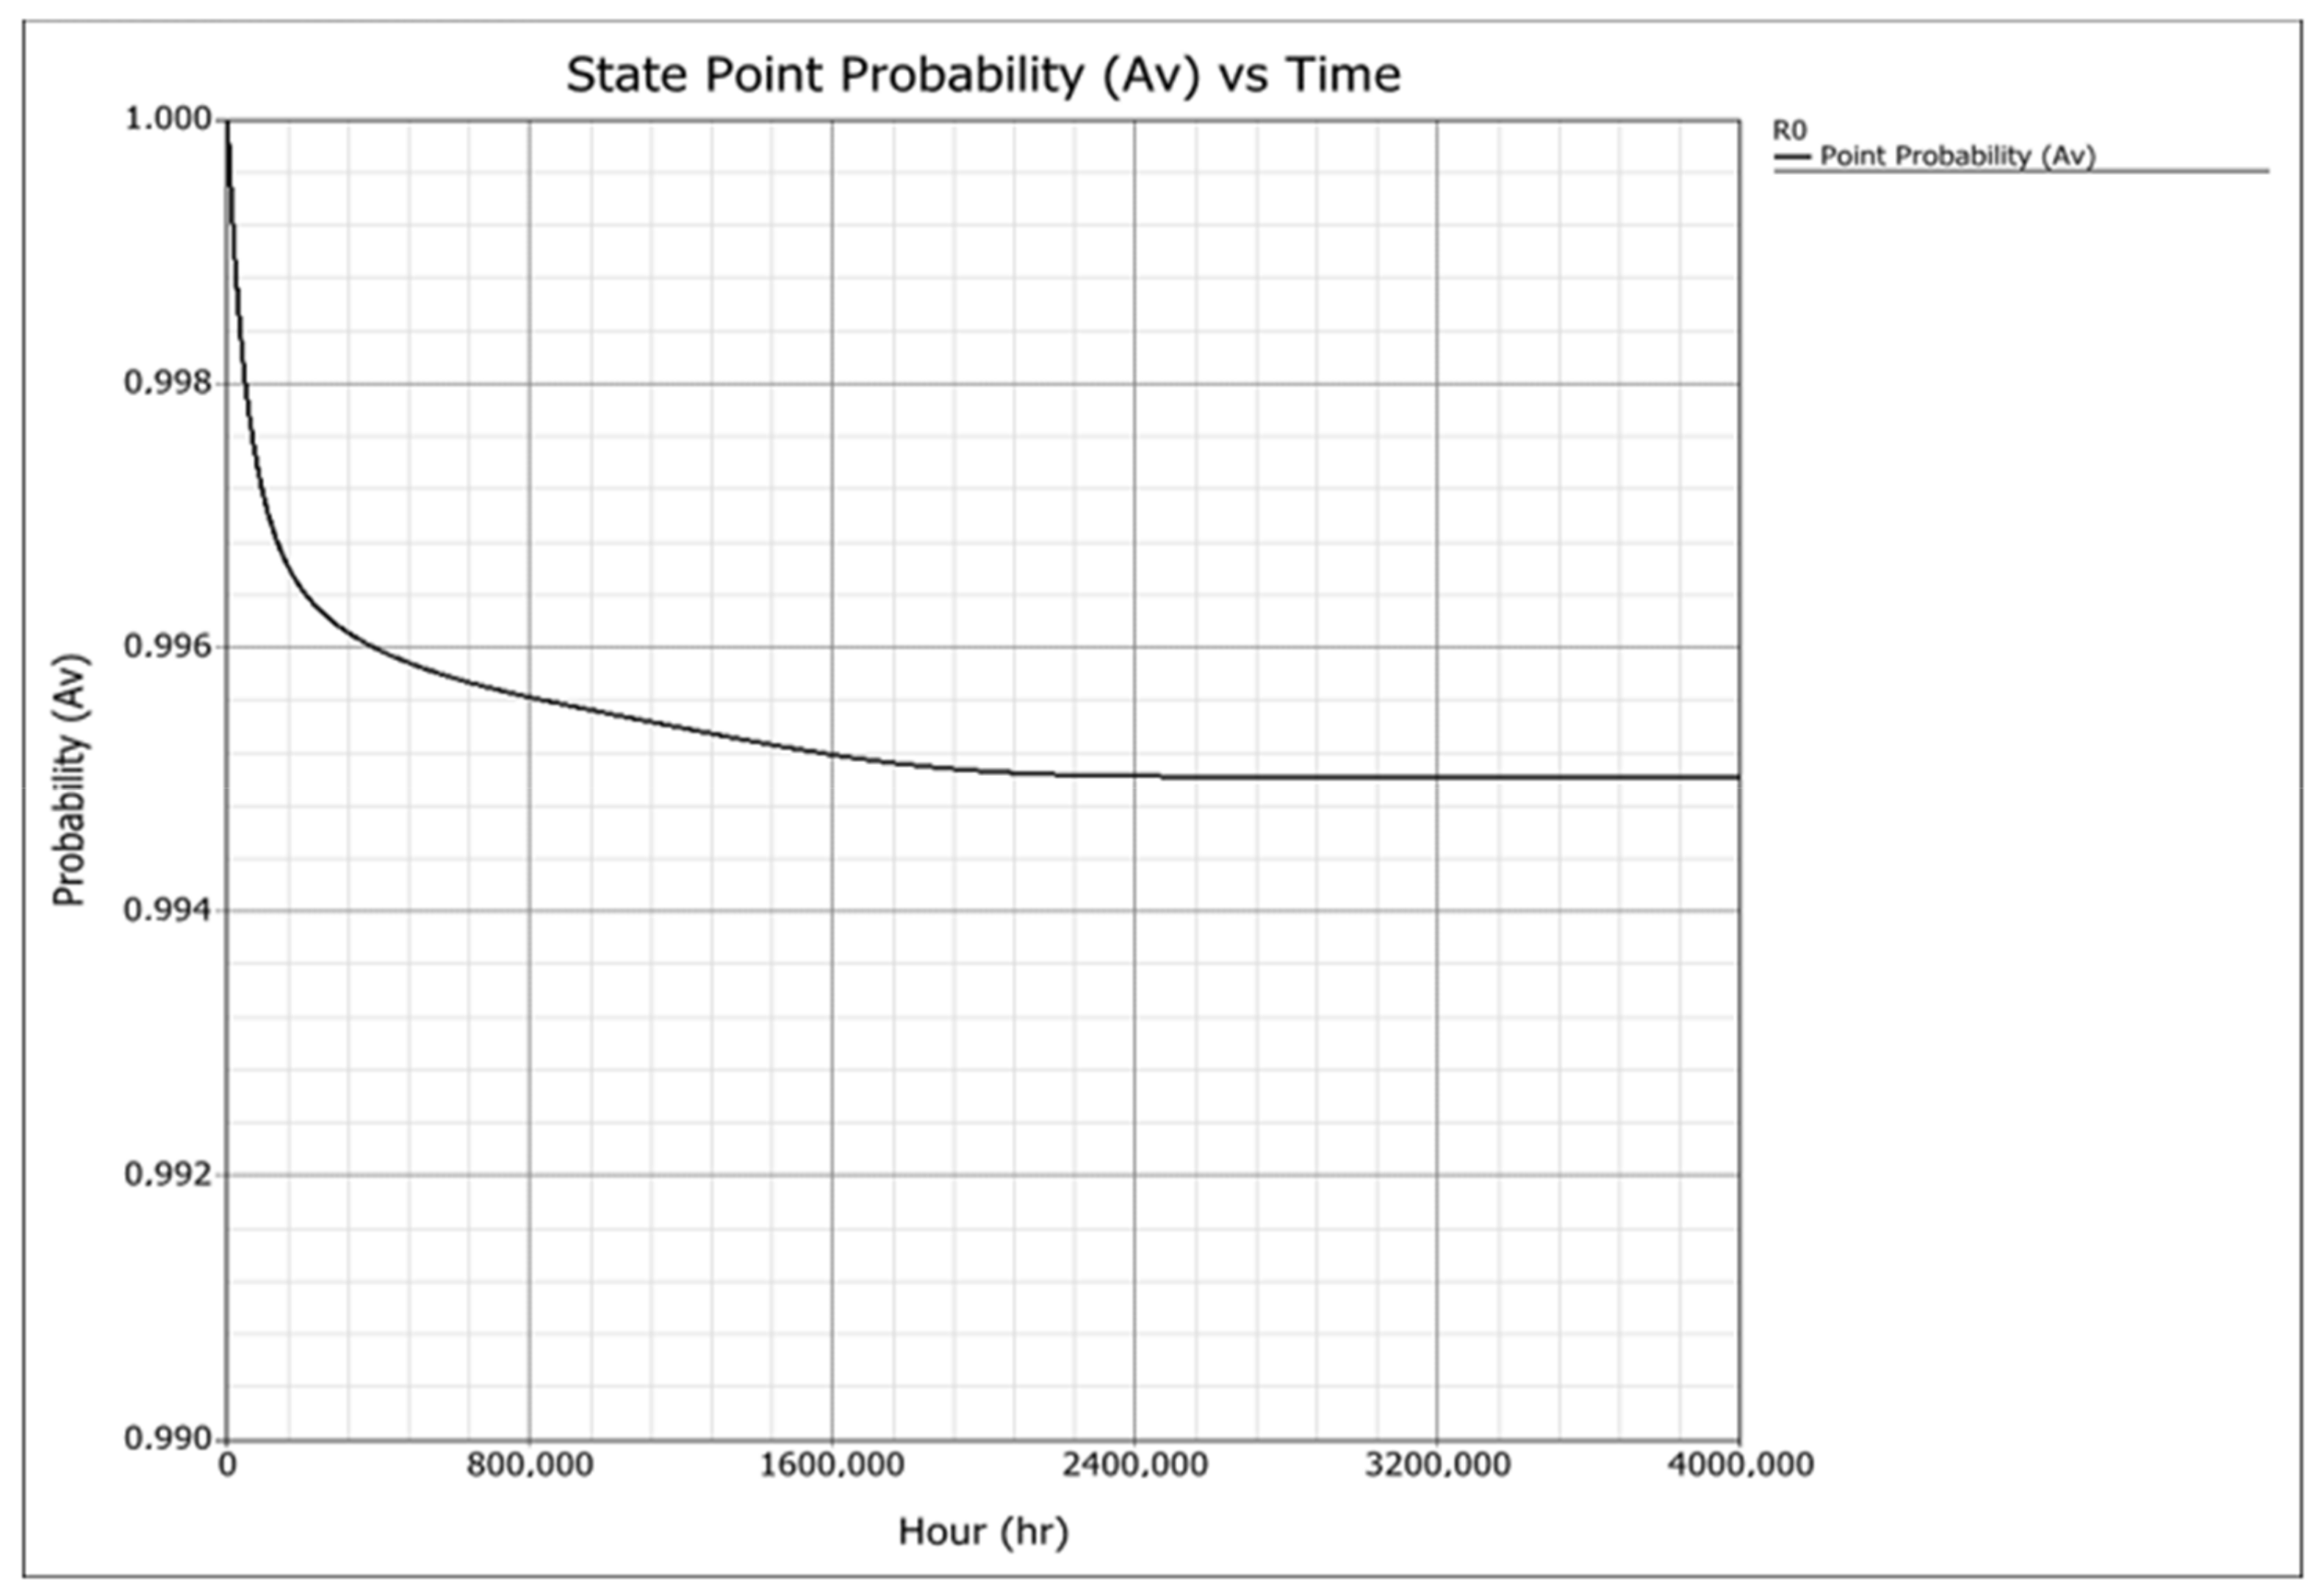
- —
- mean probability of staying in a state of full fitness;
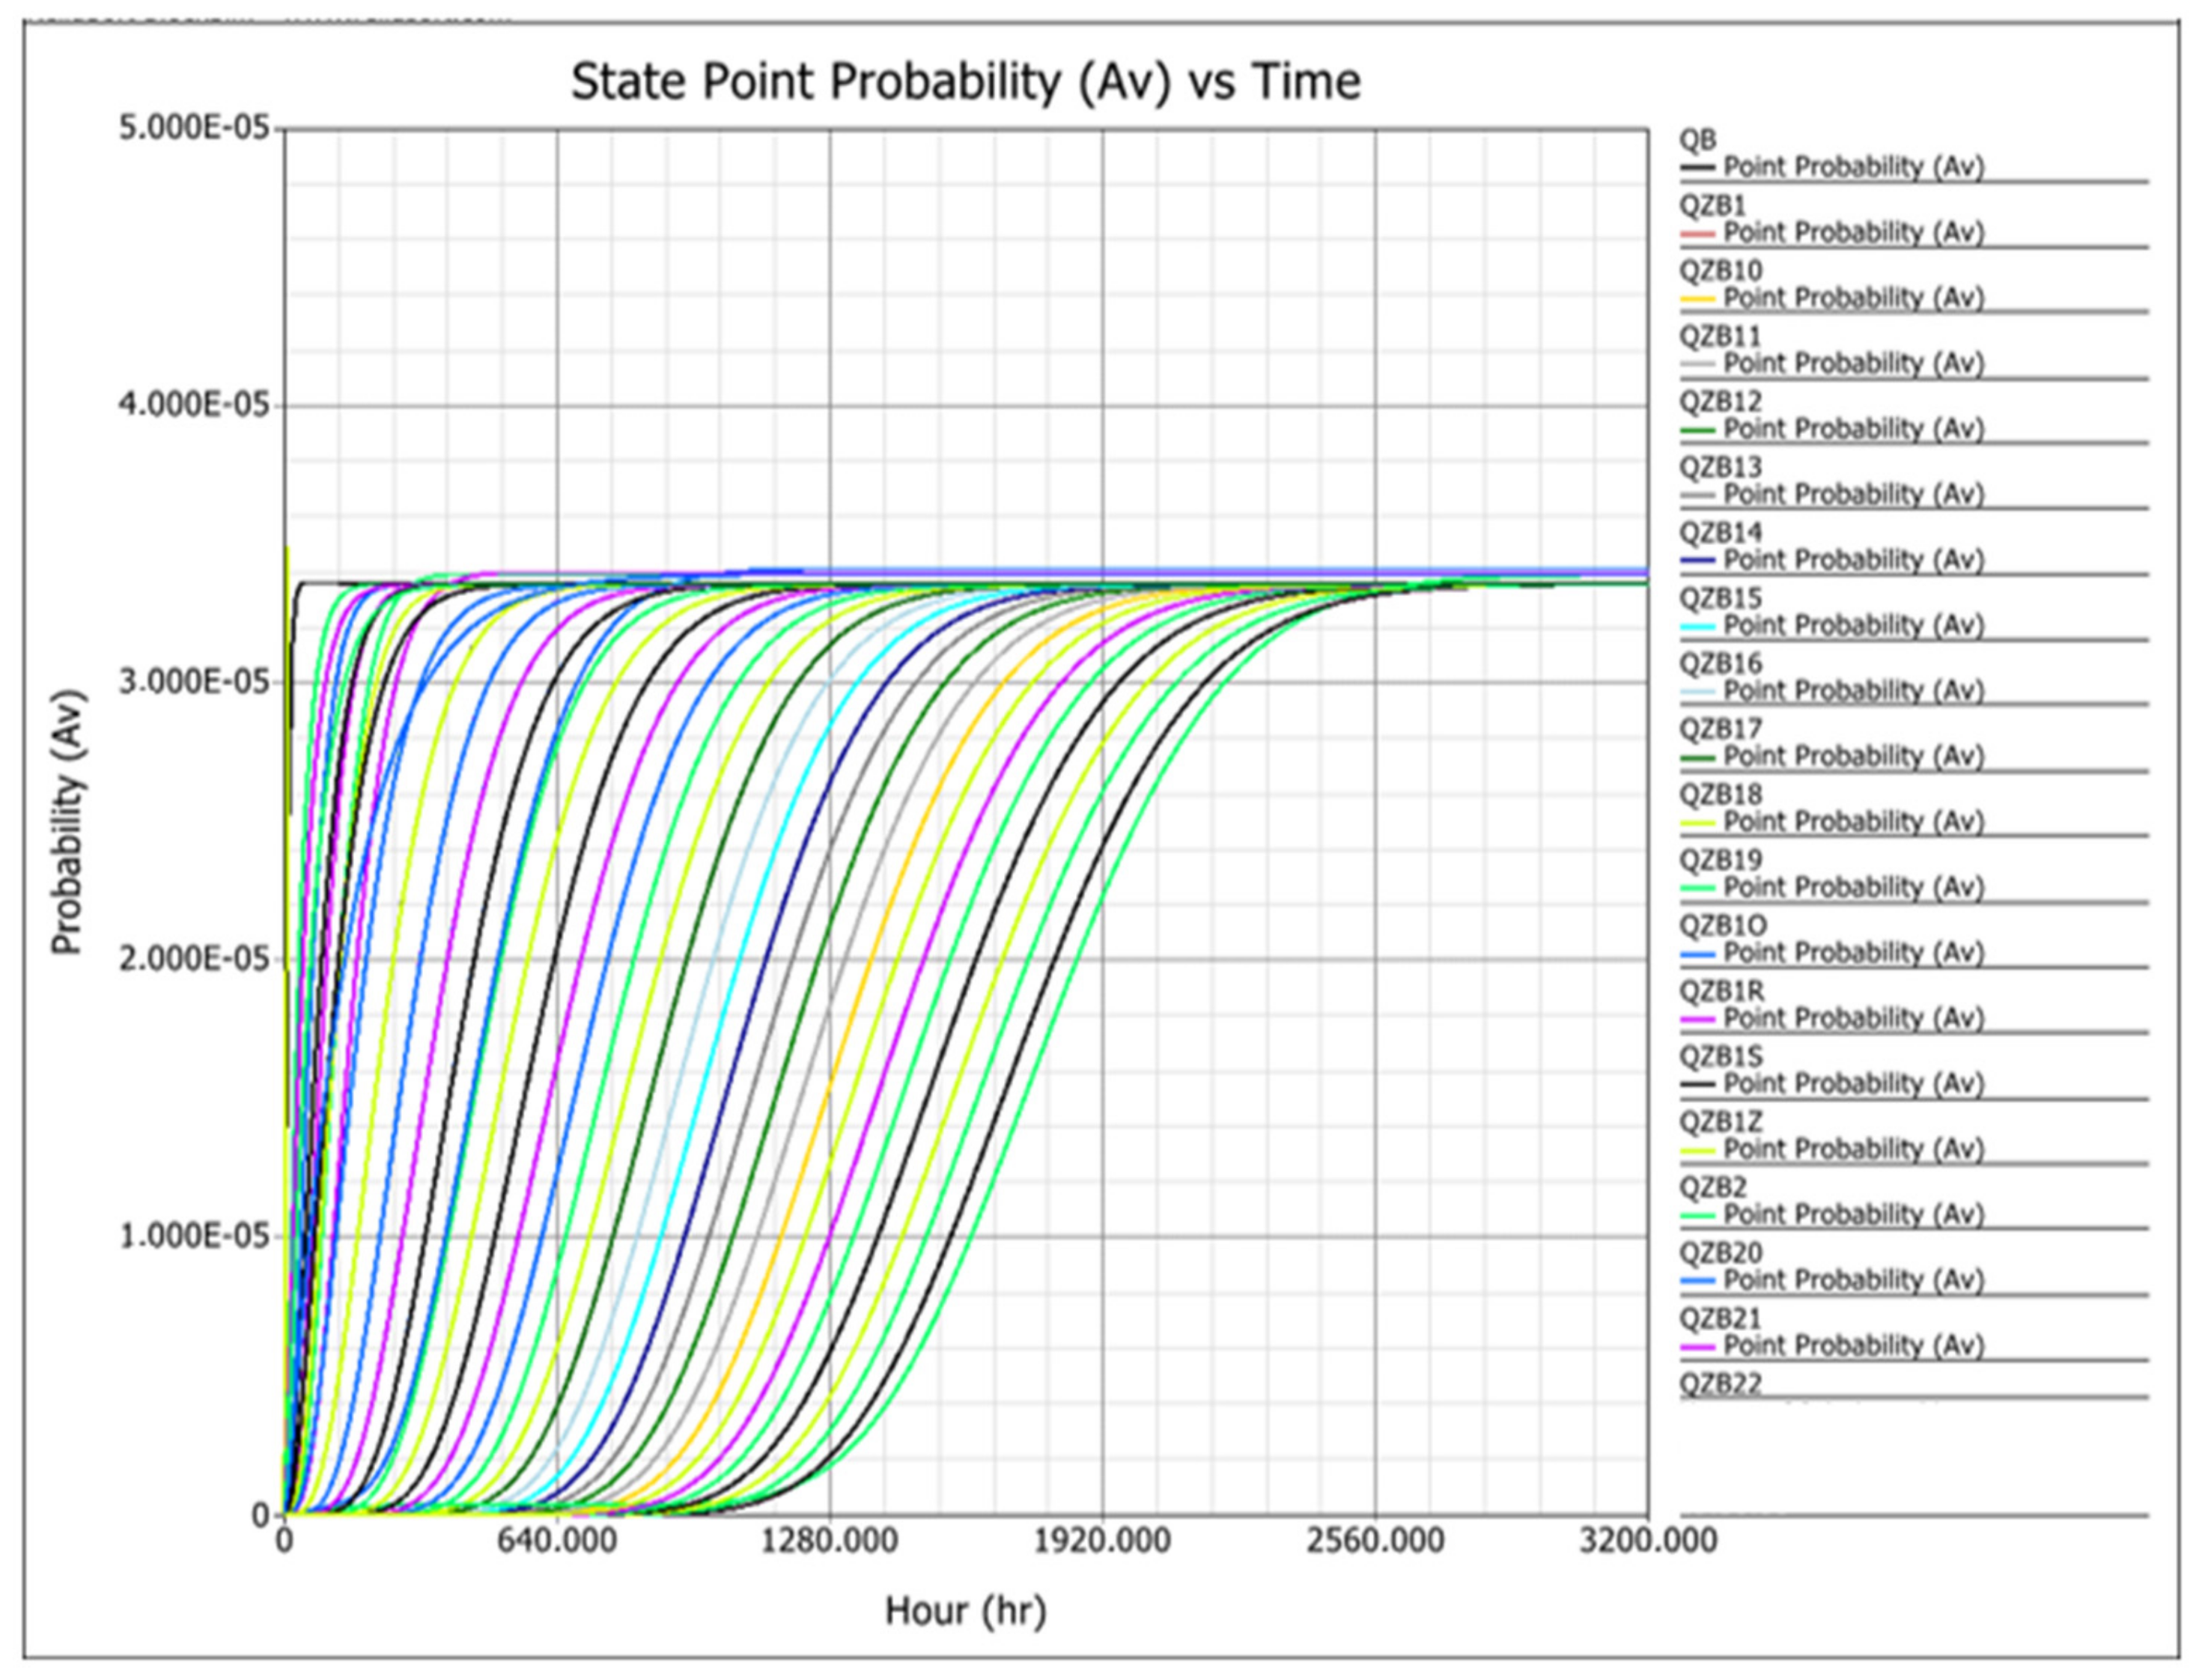
- —
- mean probability of staying in a state of safety unreliability;
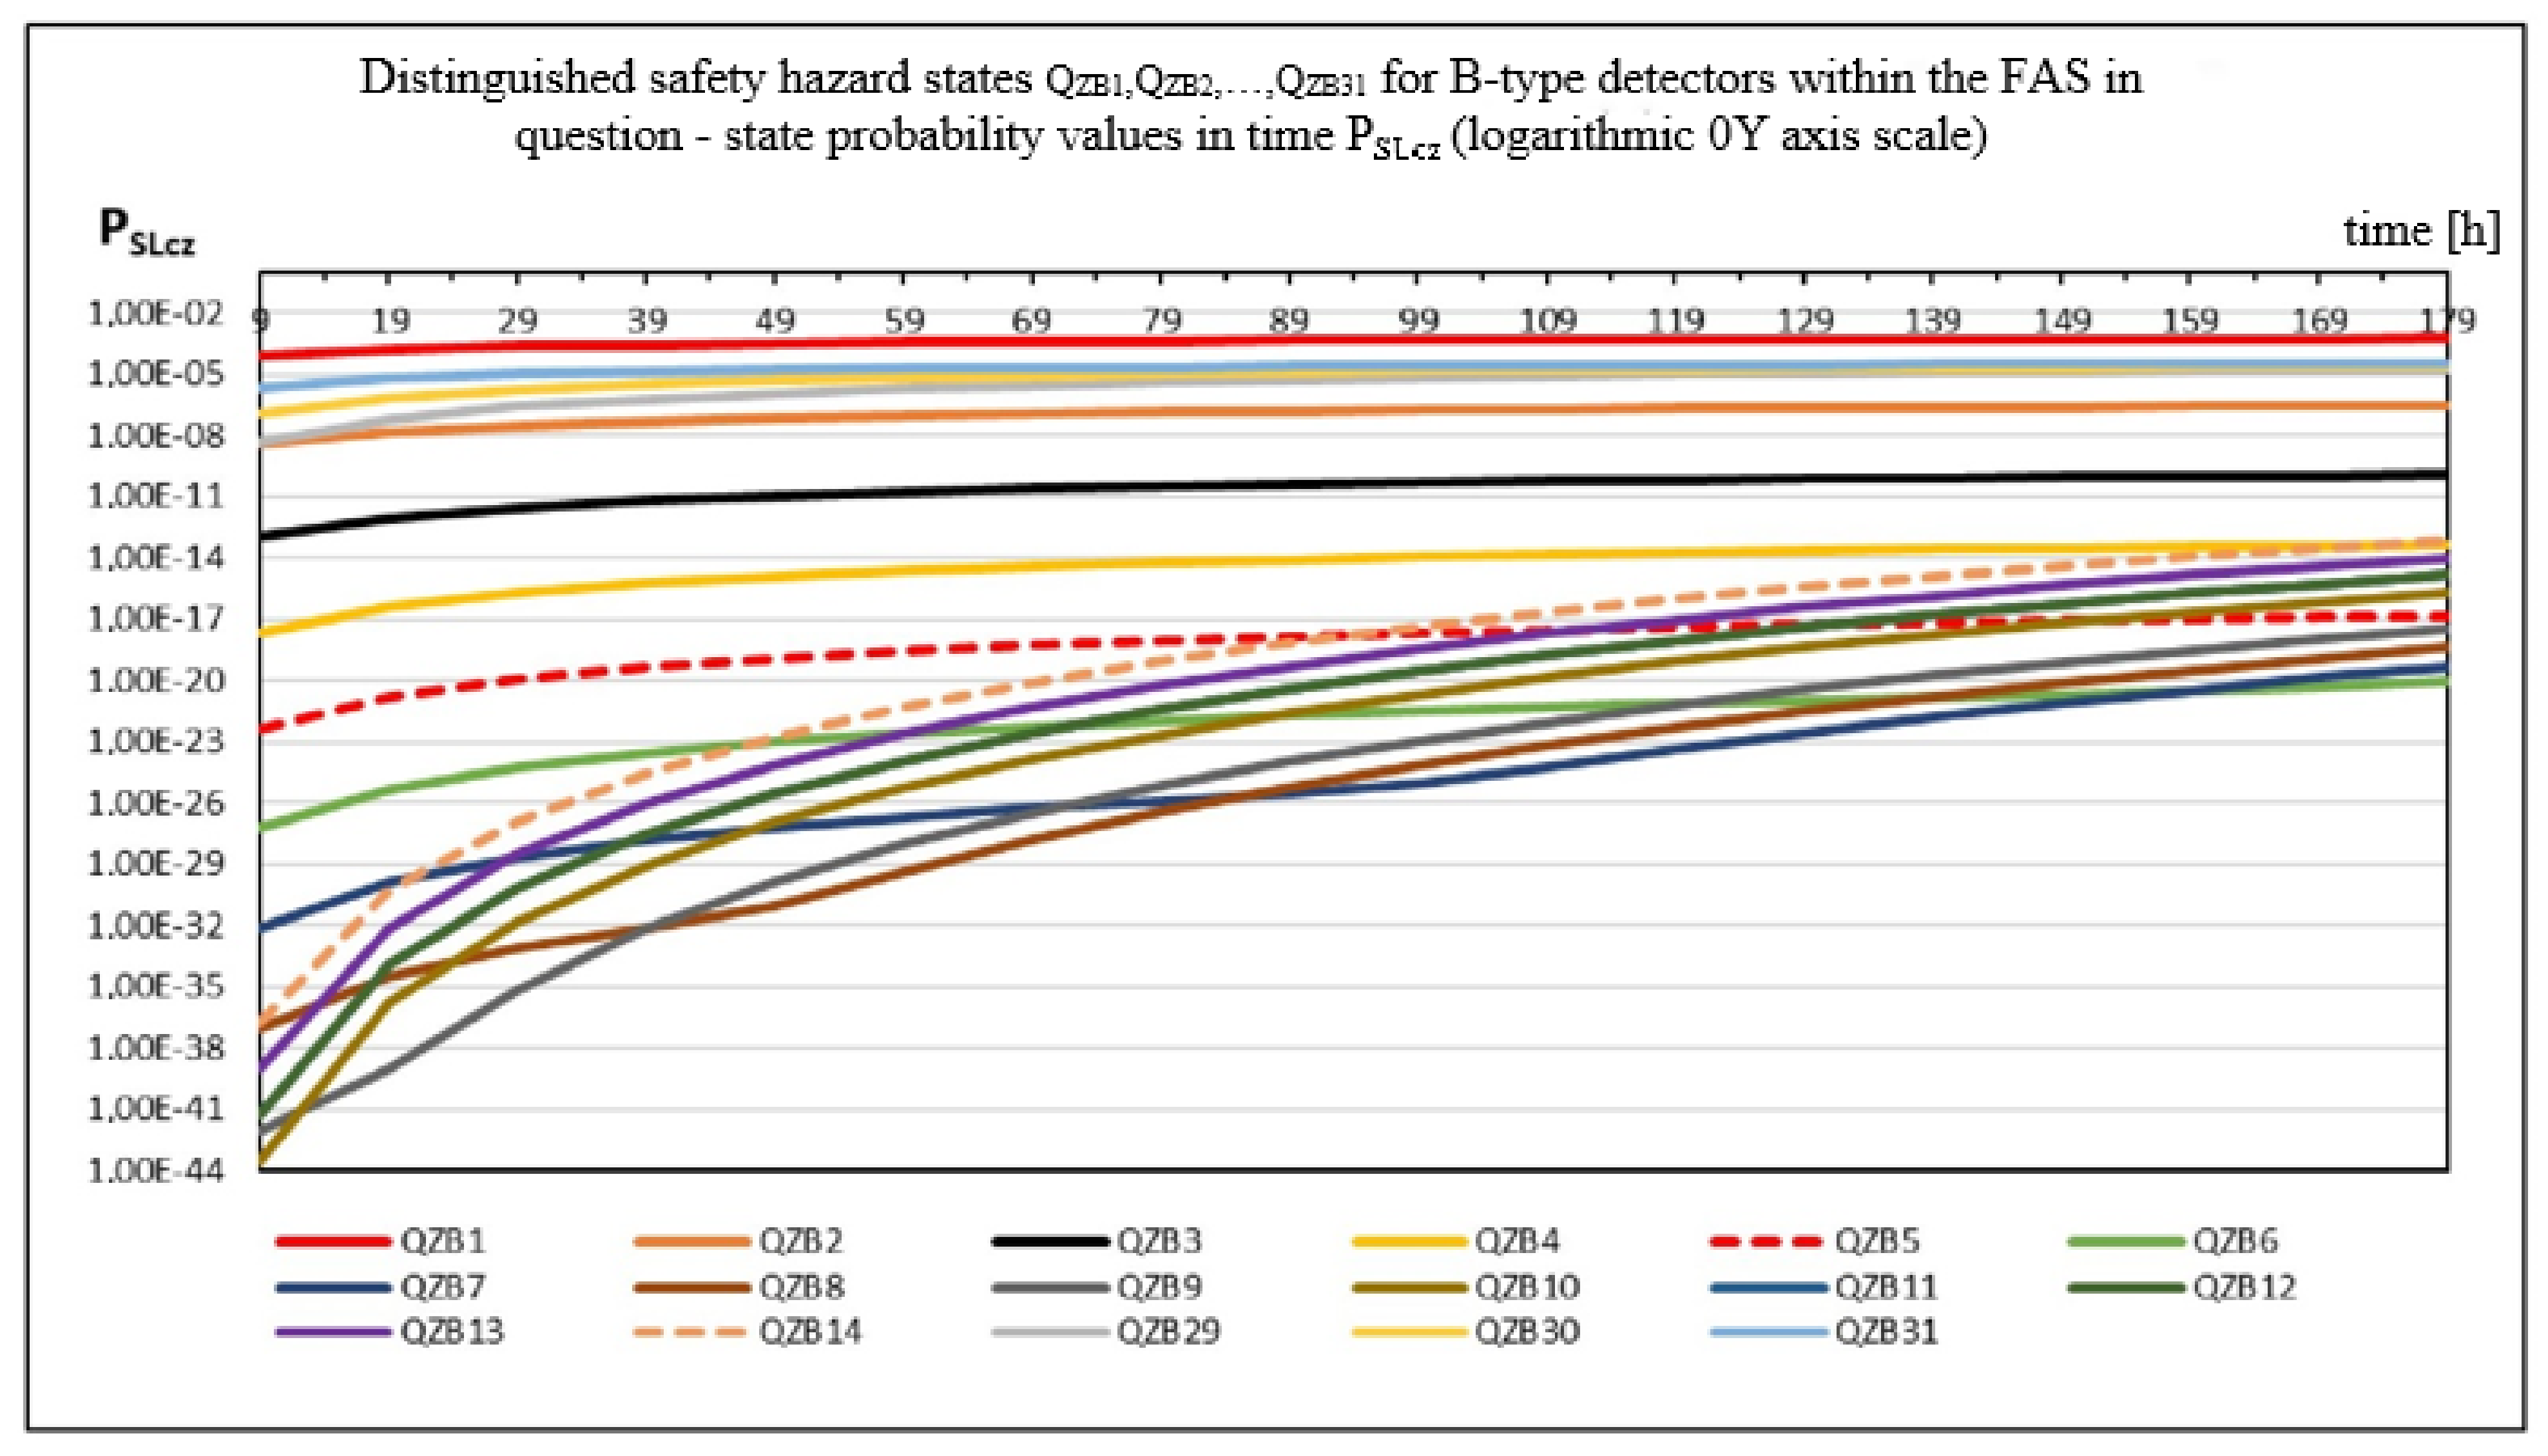
- —
- mean probability of staying in a state of safety hazard.
6. Conclusions
Author Contributions
Funding
Institutional Review Board Statement
Informed Consent Statement
Data Availability Statement
Conflicts of Interest
List of Important Abbreviations and Symbols
| AWS | Audio Warning Systems |
| CPR | Council Parliament Regulation |
| PSP | State Fire Service |
| FACU | Fire Alarm Control Unit |
| ISL | Internal Supply Line |
| FFE | Fixed Fire Equipment |
| ARC | Alarm Receiving Centre |
| GSS | Gas Suppression System |
| CCTV | Closed-Circuit TV |
| ACS | Access Control System |
| IDS | Intrusion Detection System |
| ADSTD | Alarm and Damage Signal Transmission Device |
| λ | Intensities of Damage |
| μ | Intensities of Repairs |
| A | Availability Coefficient |
| MCP | Manual Call Points |
| QZB(t) | Safety Hazard States |
| Ro(t) | State of Full Fitness |
| QB(t) | State of Safety Unreliability |
| A | Detection Circuit |
| B | Radial Line Connected to a Fire System Control Unit |
| US | Control Devices on Detection Line |
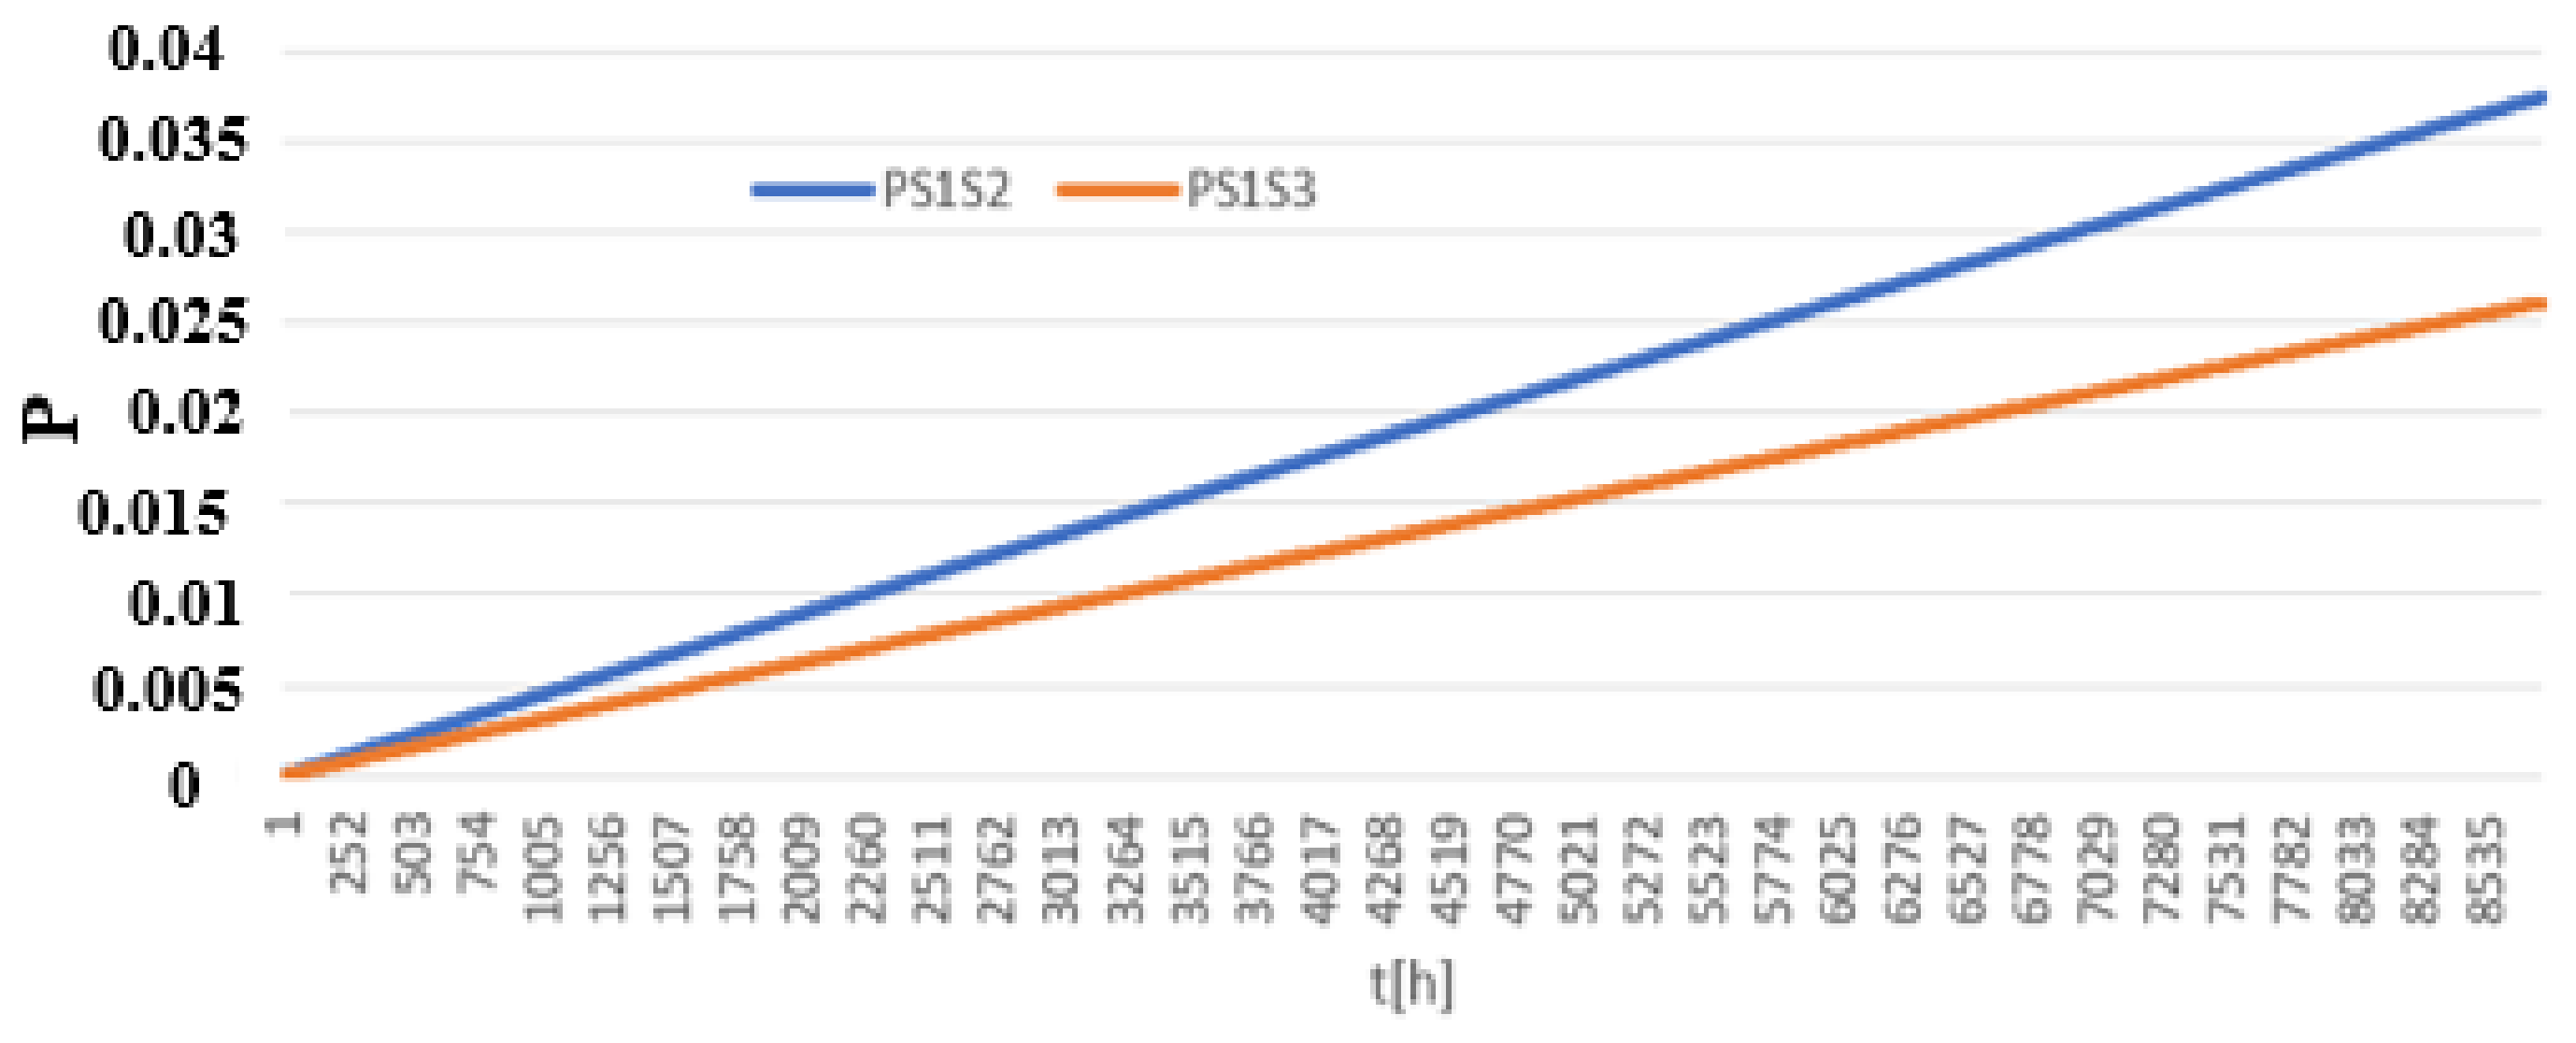
| PS1S2 | Probability of Transition Between State S1 and S2 |
| PS1 | Ps1 probability of the FAS remaining in the distinguished states S1 |
| MPZ | Mean Probability of Staying in a State of Full Fitness |
| MZB | Mean Probability of Staying in a State of Safety Unreliability |
| MZ | Mean Probability of Staying in a State of Safety Hazard |
References
- Regulation of Ministry of the Interior and Administration of Poland (MSWiA) of 7 June 2010 (Journal of Laws of the Republic of Poland No. 109, Item 719) Concerning Fire Protection of Buildings and Other Facilities and Grounds; Ministry of the Interior and Administration of Poland: Warsaw, Poland, 2021; Available online: https://sip.lex.pl/akty-prawne/dzu-dziennik-ustaw/ochrona-przeciwpozarowa-budynkow-innych-obiektow-budowlanych-i-terenow-17626053 (accessed on 17 November 2021).
- Klimczak, T.; Paś, J. Basics of Exploitation of Fire Alarm Systems in Transport Facilities; Military University of Technology: Warsaw, Poland, 2020. [Google Scholar]
- Duer, S. Artificial neural network in the control process of object’s states basis for organization of a servicing system of a technical objects. Neural Comput. Appl. 2012, 21, 153–160. [Google Scholar] [CrossRef]
- Keding, L. An Optimization of Intelligent Fire Alarm System for High-Rise Building Based on anasys. In Intelligence Computation and Evolutionary Computation. Advances in Intelligent Systems and Computing; Du, Z., Ed.; Springer: Berlin/Heidelberg, Germany, 2013. [Google Scholar] [CrossRef]
- Jafari, M.J.; Pouyakian, M.; Khanteymoori, A.; Hanifi, S.M. Reliability evaluation of fire alarm systems using dynamic Bayesian networks and fuzzy fault tree analysis. J. Loss Prev. Process. Ind. 2020, 67, 104229. [Google Scholar] [CrossRef]
- Pati, V.B.; Joshi, S.P.; Sowmianarayana, R.; Vedavathi, M.; Rana, R.K. Simulation of Intelligent Fire Detection and Alarm System for a Warship. Def. Sci. J. 1989, 39, 79–94. [Google Scholar] [CrossRef][Green Version]
- Grabski, F. Semi-Markov Processes: Applications in System Reliability and Maintenance; Elsevier: Amsterdam, The Netherlands, 2015. [Google Scholar]
- Polak, R.; Laskowski, D.; Matyszkiel, R.; Łubkowski, P.; Konieczny, Ł.; Burdzik, R. Optimizing the Data Flow in a Network Communication Between Railway Nodes. In Research Methods and Solutions to Current Transport Problems; Siergiejczyk, M., Krzykowska, K., Eds.; Springer: Cham, Switzerland, 2020; pp. 351–362. [Google Scholar] [CrossRef]
- Duer, S. Examination of the reliability of a technical object after its regeneration in a maintenance system with an artificial neural network. Neural Comput. Appl. 2011, 21, 523–534. [Google Scholar] [CrossRef]
- Cha, J.H.; Finkelstein, M. Point Processes for Reliability Analysis Shocks and Repairable Systems; Springer: Berlin/Heidelberg, Germany, 2018. [Google Scholar]
- Kubica, P.; Boroń, S.; Czarnecki, L.; Węgrzyński, W. Maximizing the retention time of inert gases used in fixed gaseous extinguishing systems. Fire Saf. J. 2016, 80, 1–8. [Google Scholar] [CrossRef]
- Zhao, H.; Schwabe, A.; Schläfli, F.; Thrash, T.; Aguilar, L.; Dubey, R.K.; Karjalainen, J.; Hölscher, C.; Cristoph, C.; Helbing, D.; et al. Fire evacuation supported by centralized and decentralized visual guidance systems. Saf. Sci. 2022, 145, 105451. [Google Scholar] [CrossRef]
- Seong, G.; Kong, D.J.; Shengzhe, L.; Hakil, K. Fast fire flame detection in surveillance video using logistic regression and temporal smoothing. Fire Saf. J. 2016, 79, 37–43. [Google Scholar]
- Morgan, A. Left Luggage, Automatic Fire Detection and the New Century. Fire Eng. J. 2000, 60, 37–39. [Google Scholar]
- Suproniuk, M.; Paś, J. Analysis of electrical energy consumption in a public utility buildings. Przegląd Elektrotechniczny 2019, 95, 97–100. [Google Scholar] [CrossRef]
- Bernardo, L.; Oliveira, R.; Tiago, R.; Pinto, P. A fire monitoring application for scattered wireless sensor networks: A peer-to-peercross-layering approach. In Proceedings of the International Conference on Wireless Networks and Systems, Barcelona, Spain, 28–31 July 2007; pp. 28–31. [Google Scholar]
- Stawowy, M.; Rosiński, A.; Paś, J.; Klimczak, T. Method of Estimating Uncertainty as a Way to Evaluate Continuity Quality of Power Supply in Hospital Devices. Energies 2021, 14, 486. [Google Scholar] [CrossRef]
- Spertino, F.; Amato, A.; Casali, G.; Ciocia, A.; Malgaroli, G. Reliability Analysis and Repair Activity for the Components of 350 kW Inverters in a Large Scale Grid-Connected Photovoltaic System. Electronics 2021, 10, 564. [Google Scholar] [CrossRef]
- Rosiński, A. Reliability analysis of the electronic protection systems with mixed—Three branches reliability structure. In Reliability, Risk and Safety: Theory and Applications; Radim, B.C., Guedes, S., Martorell, S., Eds.; CRC Press/Balkema: London, UK, 2010; pp. 1637–1641. [Google Scholar] [CrossRef]
- Dhillon, B.S. Applied Reliability and Quality, Fundamentals, Methods and Procedures; Springer: London, UK, 2006; p. 186. [Google Scholar]
- Chiodo, E.; De Falco, P.; Di Noia, L. Challenges and New Trends in Power Electronic Devices Reliability. Electronics 2021, 10, 925. [Google Scholar] [CrossRef]
- Paś, J.; Klimczak, T. Selected issues of the reliability and operational assessment of a fire alarm system. Ekspolatacja Niezawodn. Maint. Reliab. 2019, 21, 553–561. [Google Scholar] [CrossRef]
- Zajkowski, K. Settlement of reactive power compensation in the light of white certificates. In Proceedings of the E3S Web of Conferences 19, UNSP 01037, Polanica Zdroj, Poland, 13–15 September 2017. [Google Scholar] [CrossRef]
- Morgan, A. New fire detection concepts. Fire Saf. Eng. 2000, 7, 35–37. [Google Scholar]
- Roman, D.; Saxena, S.; Bruns, J.; Valentin, R.; Pecht, M.; Flynn, D. A Machine Learning Degradation Model for Electrochemical Capacitors Operated at High Temperature. IEEE Access 2021, 9, 25544–25553. [Google Scholar] [CrossRef]
- Lee, C.; Jo, S.; Kwon, D.; Pecht, M.G. Capacity-Fading Behavior Analysis for Early Detection of Unhealthy Li-Ion Batteries. IEEE Trans. Ind. Electron. 2021, 68, 2659–2666. [Google Scholar] [CrossRef]
- Boroń, S.; Węgrzyński, W.; Kubica, P.; Czarnecki, L. Numerical modelling of the fire extinguishing gas retention in small compartment. Appl. Sci. 2019, 9, 663. [Google Scholar] [CrossRef]
- Krzykowski, M.; Paś, J.; Rosiński, A. Assessment of the level of reliability of power supplies of the objects of critical infrastructure. In Proceedings of the IOP Conference Series: Earth and Environmental Science, Krakow, Poland, 14–17 November 2017; Volume 214, p. 012018. [Google Scholar] [CrossRef]
- Da Penha, O.S.; Nakamura, E.F. Fusing light and temperature data for fire detection. In Proceedings of the IEEE Symposium on Computers and Communications (ISCC), Riccione, Italy, 22–25 June 2010; pp. 107–112. [Google Scholar]
- Wang, C. Structural Reliability and Time-Dependent Reliability; Springer: Singapore, 2021. [Google Scholar]
- Pas, J.; Rosinski, A.; Chrzan, M.; Bialek, K. Reliability-Operational Analysis of the LED Lighting Module Including Electromagnetic Interference. IEEE Trans. Electromagn. Compat. 2020, 62, 2747–2758. [Google Scholar] [CrossRef]
- Serio, M.A.; Bonamno, A.S.; Knight, K.S.; Newman, J.S. Fourier Transform Infrared Diagnostics for Improved Fire Detection Systems. In Proceedings of the NIST Annual Conference on Fire Research, Gaithersburg, MD, USA, 28–31 October 1996. [Google Scholar]
- So, A.T.P.; Chan, W.L. A computer-vision-based and fuzzy-logic-aided security and fire-detection system. J. Fire Technol. 1994, 30, 341–356. [Google Scholar] [CrossRef]
- Rahardjo, H.A.; Prihanton, M. The most critical issues and challenges of fire safety for building sustainability in Jakarta. J. Build. Eng. 2020, 29, 101133. [Google Scholar] [CrossRef]
- Cadena, J.E.; Osorio, A.F.; Torero, J.L.; Reniers, G.; Lange, D. Uncertainty-based decision-making in fire safety: Analyzing the alternatives. J. Loss Prev. Process. Ind. 2020, 68, 104288. [Google Scholar] [CrossRef]
- Ding, L.; Ji, J.; Khan, F.; Li, X.; Wan, S. Quantitative fire risk assessment of cotton storage and a criticality analysis of risk control strategies. Fire Mater. 2020, 44, 165–179. [Google Scholar] [CrossRef]
- Duer, S.; Zajkowski, K.; Płocha, I.; Duer, R. Training of an artificial neural network in the diagnostic system of a technical object. Neural Comput. Appl. 2012, 22, 1581–1590. [Google Scholar] [CrossRef]
- Wu, H.; Wu, D.; Zhao, J. An intelligent fire detection approach through cameras based on computer vision methods. Process. Saf. Environ. Prot. 2019, 127, 245–256. [Google Scholar] [CrossRef]
- Si, X.-S.; Zhou, D. A Generalized Result for Degradation Model-Based Reliability Estimation. IEEE Trans. Autom. Sci. Eng. 2014, 11, 632–637. [Google Scholar] [CrossRef]
- Stawowy, M.; Perlicki, K.; Sumiła, M. Comparison of uncertainty multilevel models to ensure ITS Services. In Safety and Reliability—Theory and Applications: Proceedings of ESREL; Cepin, M., Radim, B., Eds.; CRC Press/Balkema: London, UK, 2017; pp. 2647–2652. [Google Scholar] [CrossRef]
- Sharma, A.; Singh, P.K.; Kumar, Y. An integrated fire detection system using IoT and image processing technique for smart cities. Sustain. Cities Soc. 2020, 61, 102332. [Google Scholar] [CrossRef]
- Paś, J. Shock a disposable time in electronic security systems. J. KONBiN 2016, 38, 5–31. [Google Scholar] [CrossRef]
- Shuai, X.; Hao, C.; Feng, D.; Sihang, C. Online sensorless fault diagnosis and remediation strategies selection of transistors for power converter in SRD. IET Electr. Power Appl 2019, 13, 1553–1564. [Google Scholar] [CrossRef]
- Klimczak, T.; Paś, J. Reliability and Operating Analysis of Transmission of Alarm Signals of Distributed Fire Signaling System. J. KONBiN 2019, 49, 165–174. [Google Scholar] [CrossRef]
- Milic, M.; Ljubenovic, M. Arduino-Based Non-Contact System for Thermal-Imaging of Electronic Circuits. In Proceedings of the 2018 Zooming Innovation in Consumer Technologies Conference (ZINC), Novi Sad, Serbia, 30–31 May 2018; pp. 62–67. [Google Scholar] [CrossRef]
- Paś, J. Operation of Electronic Transportation Systems; Publishing House University of Technology and Humanities: Radom, Poland, 2015. [Google Scholar]
- Østrem, L.; Sommer, M. Inherent fire safety engineering in complex road tunnels—Learning between industries in safety management. Saf. Sci. 2021, 134, 105062. [Google Scholar] [CrossRef]
- Stawowy, M. Model for information quality determination of teleinformation systems of transport. In Safety and Reliability: Methodology and Applications, Proceedings of the 25th European Safety and Reliability Conference, ESREL 2015, Zurich, Switzerland, 10 September 2015; Nowakowski, T., Młyńczak, M., Jodejko-Pietruczuk, A., Werbińska–Wojciechowska, S., Eds.; CRC Press/Balkema: London, UK, 2015; pp. 1909–1914. [Google Scholar]
- Rosiński, A. Modelling the Maintenance Process of Transport Telematics Systems; Publishing House Warsaw University of Technology: Warsaw, Poland, 2015. [Google Scholar]
- Paś, J.; Klimczak, T. Modeling of the process of selected fire signaling systems. Diagnostyka 2019, 20, 81–88. [Google Scholar] [CrossRef]
- Joglar, F. Reliability, Availability, and Maintainability. In SFPE Handbook of Fire Protection Engineering; Hurley, M., Ed.; Springer: New York, NY, USA, 2016; pp. 2875–2940. [Google Scholar]
- Tostado-Véliz, M.; Bayat, M.; Ghadimi, A.A.; Jurado, F. Home energy management in off-grid dwellings: Exploiting flexibility of thermostatically controlled appliances. J. Clean. Prod. 2021, 310, 127507. [Google Scholar] [CrossRef]
- Hulida, E.; Pasnak, I.; Koval, O.; Tryhuba, A. Determination of the Critical Time of Fire in the Building and Ensure Successful Evacuation of People. Period. Polytech. Civ. Eng. 2019, 63, 308–316. [Google Scholar] [CrossRef]
- Kaniewski, P.; Smagowski, P.; Konatowski, S. Ballistic Target Tracking with Use of Cinetheodolites. Int. J. Aerosp. Eng. 2019, 2019, 3240898. [Google Scholar] [CrossRef]
- Idris, A.M.; Rusli, R.; Burok, N.A.; Nabil, N.H.M.; Ab Hadi, N.S.; Karim, A.H.M.A.; Ramli, A.F.; Mydin, I. Human factors influencing the reliability of fire and gas detection system. Process. Saf. Prog. 2020, 39, e12116. [Google Scholar] [CrossRef]
- Menon, S.; Chen, D.Y.; Osterman, M.; Pecht, M.G. Copper Trace Fatigue Life Modeling for Rigid Electronic Assemblies. IEEE Trans. Device Mater. Reliab. 2021, 21, 79–86. [Google Scholar] [CrossRef]
- Paś, J.; Rosiński, A.; Wiśnios, M.; Majda-Zdancewicz, E.; Łukasiak, J. Electronic Security Systems. Introduction to the Laboratory; Military University of Technology: Warsaw, Poland, 2018. [Google Scholar]
- Mahdipour, E.; Dadkhah, C. Automatic fire detection based on soft computing techniques: Review from 2000 to 2010. Artif. Intell. Rev. 2012, 42, 895–934. [Google Scholar] [CrossRef]
- Kozłowski, E.; Borucka, A.; Świderski, A. Application of the logistic regression for determining transition probability matrix of operating states in the transport systems. Ekspolatacja Niezawodn. Maint. Reliab. 2020, 22, 192–200. [Google Scholar] [CrossRef]
- Duer, S. Assessment of the Operation Process of Wind Power Plant’s Equipment with the Use of an Artificial Neural Network. Energies 2020, 13, 2437. [Google Scholar] [CrossRef]
- Krepl, V.; Shaheen, H.I.; Fandi, G.; Smutka, L.; Muller, Z.; Tlustý, J.; Husein, T.; Ghanem, S. The Role of Renewable Energies in the Sustainable Development of Post-Crisis Electrical Power Sectors Reconstruction. Energies 2020, 13, 6326. [Google Scholar] [CrossRef]
- Major, S.; Frickenstein, G. Reliability Theory with Applications to Preventive Maintenance; Llya Gertsbakh Springer: Berlin/Heidelberg, Germany, 2002; pp. 1111–1113. ISBN 3-540-67275-3. [Google Scholar] [CrossRef]
- Duer, S.; Bernatowicz, D.; Wrzesień, P.; Duer, R. The diagnostic system with an artificial neural network for identifying states in multi-valued logic of a device wind power. In Communications in Computer and Information Science; Springer: Berlin, Germany, 2018; Volume 928, pp. 442–454. [Google Scholar]
- Arias, S.; La Mendola, S.; Wahlqvist, J.; Rios, O.; Nilsson, D.; Ronchi, E. Virtual Reality Evacuation Experiments on Way-Finding Systems for the Future Circular Collider. Fire Technol. 2019, 55, 2319–2340. [Google Scholar] [CrossRef]
- Rosiński, A.; Paś, J.; Łukasiak, J.; Szulim, M. Exploitation of electronic systems in building objects exposed to impact of strong electromagnetic pulses. In Proceedings of the 29th European Safety and Reliability Conference (ESREL), Hannover, Germany, 22–26 September 2019; Beer, M., Zio, E., Eds.; Research Publishing Services: Singapore, 2019; pp. 3320–3332. [Google Scholar]


Publisher’s Note: MDPI stays neutral with regard to jurisdictional claims in published maps and institutional affiliations. |
© 2021 by the authors. Licensee MDPI, Basel, Switzerland. This article is an open access article distributed under the terms and conditions of the Creative Commons Attribution (CC BY) license (https://creativecommons.org/licenses/by/4.0/).
Share and Cite
Jakubowski, K.; Paś, J.; Duer, S.; Bugaj, J. Operational Analysis of Fire Alarm Systems with a Focused, Dispersed and Mixed Structure in Critical Infrastructure Buildings. Energies 2021, 14, 7893. https://doi.org/10.3390/en14237893
Jakubowski K, Paś J, Duer S, Bugaj J. Operational Analysis of Fire Alarm Systems with a Focused, Dispersed and Mixed Structure in Critical Infrastructure Buildings. Energies. 2021; 14(23):7893. https://doi.org/10.3390/en14237893
Chicago/Turabian StyleJakubowski, Krzysztof, Jacek Paś, Stanisław Duer, and Jarosław Bugaj. 2021. "Operational Analysis of Fire Alarm Systems with a Focused, Dispersed and Mixed Structure in Critical Infrastructure Buildings" Energies 14, no. 23: 7893. https://doi.org/10.3390/en14237893
APA StyleJakubowski, K., Paś, J., Duer, S., & Bugaj, J. (2021). Operational Analysis of Fire Alarm Systems with a Focused, Dispersed and Mixed Structure in Critical Infrastructure Buildings. Energies, 14(23), 7893. https://doi.org/10.3390/en14237893