Article

Sedimentation Tanks for Treating Rainwater: CFD Simulations and PIV Experiments

1
Faculty of Mechanical Engineering, Opole University of Technology, 45-758 Opole, Poland
2
Department of Chemical Engineering and Equipment, Poznan University of Technology, 60-965 Poznan, Poland
3
Institute of Environmental Engineering and Biotechnology, University of Opole, 45-032 Opole, Poland
4
Department of Computational Mechanics Named after V. Martsynkovskyy, Sumy State University, 2, Rymskogo-Korsakova St., 40007 Sumy, Ukraine
*
Authors to whom correspondence should be addressed.
Energies 2021, 14(23), 7852; https://doi.org/10.3390/en14237852
Submission received: 28 October 2021 / Revised: 17 November 2021 / Accepted: 20 November 2021 / Published: 23 November 2021
(This article belongs to the Special Issue Liquid-Liquid, Oil-Water Energy Efficient Separations)

Abstract

:
The removal of solids is the most important step when treating rainwater. The article evaluates two designs of sedimentation tanks that can be used for the continuous separation of fine particles from water: OS—standard sedimentation tanks, and OW—swirl sedimentation tanks. The tanks were studied by conducting computational fluid dynamics (CFD) modeling and particle image velocimetry (PIV) experiments. The settling process in sedimentation tank was carried out at varying operating flow rates. A tank with a modified structure was used for the tests, where water was supplied by a nozzle placed at an angle. This solution made it possible to obtain a rotational flow that transported the suspended particles towards its wall, where downward axial velocity resulted in the settling of particles. Based on the research, it was observed that the flow patterns showed inward flow at the bottom of the tank and an upward flow and the lifting of the settled particles near the hatch at the bottom. The presented experimental measurements provided detailed insight into flow patterns, and valuable calibration and verification data for further CFD modeling. Traditional PIV techniques are useful in the case of standard design, whereas CFD is invaluable for supporting this work and for investigating the design of novel sedimentation tanks.

1. Introduction

Sedimentation tanks belong to the group of tank separators, i.e., apparatuses of simple construction that are used to purify liquids from solid particles [1]. They usually separate pollutant solid from the water that flows through them [2,3,4,5] and are used to purify pollutants in the form of suspensions contained in rainwater (e.g., sewage). Pollutant particles are deposited (gravitationally) at the bottom of tanks [2]. Sedimentation tanks can be divided into three basic types: standard (classic) sedimentation tanks, swirl sedimentation tanks, and sedimentation-retention tanks. They are all commonly used in water treatment systems, household and industrial wastewater treatment plants, post-production waste treatment, and many other industrial processes [6,7,8]. Despite the simplicity of construction and the related limitations, settling (sedimentation) tanks are still a very important, and integral, component of modern installations [8]. The possibility of using a given type of settling tank for a specific system is related primarily to its dimensions, the direction of the flow occurring in it and the mode of operation [9,10].
Gravitational separation of solids from suspension has been practiced for a very long time. In the literature on the subject, numerous works explain the principle of the process [11]. The first work mentioning this phenomenon is an article from 1889 [12]. In this document, the author analyzed, among others, factors influencing the course of the process. To this day, the topic is extremely relevant and, despite the large base of knowledge built from experimental experiences, it is still specific.
In devices that use sedimentation phenomena in continuous processes, many factors may directly affect the efficiency and course of the process, e.g., temperature, flow velocity and flow rate, suspension density, and also the size and type of the separated particles in the suspension [13,14]. The temperature difference between the surroundings and the liquid can lead to vertical movement of the water. This in turn contributes to turbulence and eddies, which alter the direction of the fluid flow through the apparatus. Variable flow, uneven reception, and supply from the apparatus result in changes in the speed of particle movement, as well as the disturbance of the sedimentation process. The optimization of the design of devices that use the sedimentation phenomenon involves the ensuring of the appropriate usable volume, while at the same time minimizing the overall dimensions. One of the main goals is to improve the overall efficiency by changing the geometric configuration [1,15,16].
Much attention is paid to the design and construction of inlet and outlet pipes [4,5]. In order to distribute the water suspension flow in sedimentation tanks, it is possible to apply simple structural modifications, e.g., in the form of partitions [13,17,18,19] or distribution devices [4,5]. The extension of the path of the movement of solid particles and the time they stay in the apparatus increases the chance of them dropping down in the sedimentation process. However, a disadvantageous phenomenon involves the rapid transport of particles straight to the outlet pipe, especially at high flow rates [4]. The quick washing of dirt particles from the apparatus causes a significant decrease in the separation efficiency of the device [5]. Properly directed movement by continuous inflow and outflow of fluid, which has an uninterrupted character, contributes to the formation of eddies. During such movement in tanks with a free liquid surface, the formation of funnels in the cores of swirls can be observed. The swirl motion is used in many technical devices, e.g., in swirl atomizers, cyclones, etc. It is also used in swirl sedimentation tanks. This movement is spatial, three-dimensional, and takes place around the aparatuses’ central axis, on which the outlet pipe’s opening is also located. As a result of differences in density, and thus in weight, of individual suspension components, different behavior of each of the phases is observed in vortex settling tanks. The vortex that forms inside the apparatus can be divided into two specific areas: a forced vortex (which is located near the orifice at the center) and a free vortex (which is formed in the outer region towards the periphery) [20]. The contamination, sediment particles, being heavier than water, due to the forces of inertia and the action of centrifugal forces, move along the paths that approach the wall of the apparatus, and then gradually sediment at the bottom. The liquid creates a swirl towards the outlet of the apparatus. As a result, a relatively clean liquid (water), which is free of solids, is drained from the outlet pipe [5]. Therefore, by analyzing the streamlines of the fluid inside such flow apparatuses, it is possible to initially assume and predict how the paths of elements in the case of solids that are affected by much greater inertia forces will be created. The description of the swirling motion occurring in a vortex settling tank is the main topic of many studies [8,21,22,23,24,25,26,27,28,29,30,31]. Denk and Dürholt [20] presented this problem in their work. The authors determined the velocity distribution and accumulation of particles in the analyzed construction. They showed that the formation of vortices significantly disturbed the course of the sedimentation process itself. Diakun [22] and Jakubowski et al. [23] studied the process of solid-liquid separation in the context of the use of a settling tank in the brewing industry. From experimental research, they found that the resulting secondary flow (produced by swirling inside the tank) caused the separated cone-shaped solids to accumulate near the center of the tank. More complex studies were carried out by Veerapen et al. [24]. They conducted a series of experiments allowing the analysis of the impact of both the construction of the vortex separator itself, its modification, and, above all, the conditions of the process. The efficiency of any settling apparatus depends on a lot of factors such as flow rates, type of tank, inlet/outlet configuration, and properties of the suspension, according to Goula et al. [13]. Individually analyzing the influence of so many variables is time consuming and troublesome. In this case, it is worth analyzing the described phenomena using CFD computer simulation methods and techniques of visualization of real PIV flows [8,13,25,26,27,28,29,30,31].
In the article [4] a vortex settling tank was analyzed using the CFD model and PIV analysis. The CFD model was initially validated on a laboratory scale using the PIV technique. The flow and behavior of particles of different sizes at varying operating flow rates and with different inlet-outlet configurations were analyzed. The simulations showed that the angular introduction of water into the settling tank resulted in a rotational flow. This resulted in the transport of the suspended particles towards the wall, where the downward axial velocity caused the particles to settle. The flow patterns showed an internal flow at the bottom which caused an accumulation of sediment near the center of the hatch. An upward flow and floating of the deposited particles downstream near the hatch were also observed. This effect was eliminated by changing the size of the inlet openings and the working flow rate.
Kuok and Chiu [32] conducted experimental studies and compared the results with the results obtained using the PIV analysis. The study used a SOLTEQ model TR 09 settler. The marker particles used for the measurements were ping-pong balls and food dye and beads to track the fluid flow. The results varied, but a standardized correction factor was introduced. The results of the study showed that PIV analysis is a suitable method for determining the velocity in settling tanks. It was observed that shorter time interval between image frames would result in a more detailed and accurate PIV analysis.
The issue of the optimization of the settling tank construction with the use of numerical calculations verified by experimental studies was presented in works [8,13,29,30,31]. Based on a detailed CFD analysis, optimal design and operational parameters were proposed. Changes in design concerned inlet-outlet configuration. Moreover, the influence of the flow rate and the solid particle size distribution on the process efficiency were correlated. The PIV technique was successfully used in the experimental research.
The tracer particles (polyamide particles with a size of 100 μm) dispersed in the tested flow form a pattern, the changes of which show the flow of this fluid. The system used allows for the description of the movement inside the tank, but it does not allow for the determination of the efficiency of the separation process. The efficiency of the separators has been presented in earlier articles [28,33]. Markowska et al. [24] present the results of computer simulations of solid-liquid separation process in classical and modified sedimentation tanks. The modification of swirl sedimentation tanks consisted in assembling the submerged inlet port and internal baffle. The k-ε model and the DPM (discrete phase model) have been used. The construction with the highest separation efficiency was characterized by baffle located in the tank’s axis and in the middle of the inlet and outlet ports. The construction of the sedimentation tank may lead to the improved efficiency of the removal of solid/liquid pollutants from liquid stream. Markowska et al. [33] showed that liquid stream viscosity and separation efficiency may be important in designing new sedimentation tanks.
The aim of this study is to analyze the movement of particles in two selected, and modeled, sedimentation tank structures. The work focuses on CFD simulation studies, and also their application for the design of flow devices that are used in environmental engineering to purify water from solid pollutants. A modern approach to research, which is based on a simulation technique, and not just an experiment, was used in this study. The paper compares the models of a standard sedimentation tank and a swirl sedimentation tank. These models were subjected to CFD modeling with the use of ANSYS Fluent software and experimental PIV analysis, which was performed with the use of MATLAB and PIVlab software. The PIV technique is a method that is used to verify the correctness of the obtained simulation results. The analysis of the results allows for the determination of velocity vector fields, the visualization of streamlines, and the visualization of the liquid flow through the apparatus.

2. Materials and Methods

2.1. CFD Simulations

The subject of the research involves two types of vertical sedimentation tanks. Their structures were selected based on classic devices that are offered by various manufacturers, which are available on the Polish market. For the purpose of the research, two sedimentation tank models were designed: a standard sedimentation tank (OS) and a swirl sedimentation tank (OW). The standard OS sedimentation tank is characterized by a simple structure. It is a cylindrical open tank, which has the dimensions shown in Figure 1a. It is equipped with two pipes located in one plane. The axis of the outlet pipe is shifted below the axis of the inlet pipe, as is usually the case in classic designs of this type. This solution is designed to prevent the backflow of dosed water suspension through the inlet pipe under standard conditions. The OW swirl sedimentation tank (Figure 1b) is a modified standard OS sedimentation tank. This modification involves the introduction of a specially designed directional deflector at the inlet of the apparatus, and also the changing of the structure of the outlet pipe. This is meant to generate and intensify the swirl motion of the liquid in the apparatus. Both apparatuses have identical overall dimensions, and inlet pipes located at the same height. The outer diameter of both pipes is identical and is equal to 25 mm, while the inner diameter is 19 mm. The length of the pipes, measured from the external walls of the apparatus, is 90 mm. In the case of the outlet pipe for the OW sedimentation tank, two pipe sections, cut at an angle of 45 degrees, were used. They were connected to each other at an angle of 90 degrees and placed in the central axis of the sedimentation tank.
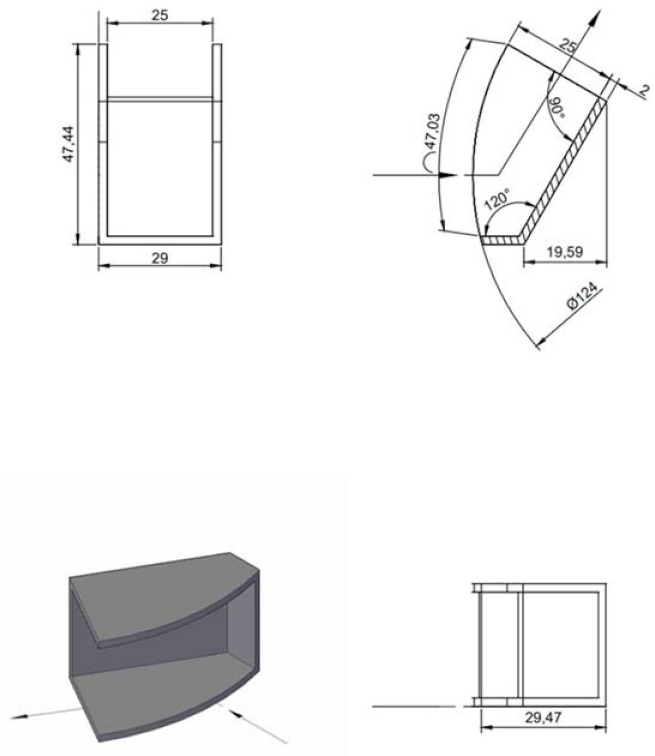
The directional deflector for the OW sedimentation tank was designed and made using 3D printing technology. It is one of the standard solutions proposed by producers of sedimentation tanks [34]. The exact dimensions and visualization of the deflector are shown in Figure 2.
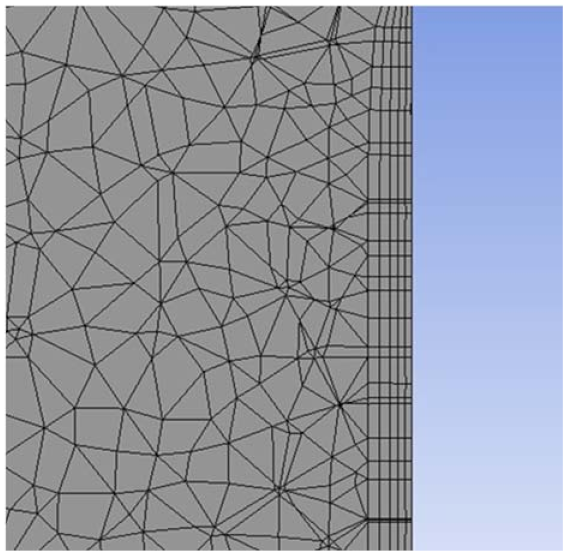
The simulations and modeling of the sedimentation tanks were performed using ANSYS Fluent software, which enables various types of flows to be modeled with the use of advanced physical models. ANSYS Fluent allows for the automatic selection of geometric solids that will optimally fill the sedimentation tank model. This option was used to create the initial mesh of objects. In the next step, the sizes of the mesh elements were selected, which is crucial for the accuracy and length of further calculations. After reducing the geometric solids of the mesh, the number of elements was 1,549,168, and their dimensions were 0.002 m. Inflation was also introduced, i.e., thin elements formed at the walls of the object, which allows for a more accurate modeling of the velocity gradient that occurs in the laminar layer by the wall of the apparatus (Figure 3).
In the next stage of the work, data was entered, and on its basis the CFD simulations were carried out. The following flow was assumed: steady, based on pressure, with velocity formulated as absolute, and under the influence of gravitational force caused by an acceleration of 9.81 m/s2. The designed sedimentation tanks contain a confusor and a diffuser, i.e., places of sudden reductions from large to small spaces, and relatively high values of the Reynolds number. Taking this into account, a model based on RANS was selected, i.e., the averaged (by Reynolds) Navier–Stokes equation. For incompressible fluid, the instantaneous velocity component ui(x,t) can be written as the sum of a mean u ¯ i (x) and a fluctuating part u’i(x,t):
u i x , t = u ¯ i x + u i x , t
where the mean velocity is defined as the time-averaged value.
u ¯ i x = lim T 1 T t t + T u i x , t d t
T is the averaging time interval. We assume that T . McCorquodale et al. [35] used a model with a combination of finite element methods and function and finite difference methods, respectively, for the stream and for the boundaries. McCorquodale and Zhou [36] studied the effect of solids and hydraulic loads on operation of the circular clarifier, whereas Zhou et al. [37] connected the energy equation and the Navier–Stokes equations for modeling the effect of neutral density and warm water into a model separator. In this study, a two-equation hybrid model of turbulence SST k-ω (SST k-omega) [38] was selected. It combines the advantages of the k-ε model, which is used for calculations in the areas of the developed flow [39], and the k-ω model, which works well when calculating the flow in the layer by the wall [8,9]. The boundary conditions were selected in such a way as to reflect the real behavior of the fluid in the sedimentation tanks as realistically as possible, and at the same time in such a way as to be able to reproduce them in laboratory conditions during PIV verification tests (Table 1). The inflow of the water was assumed to be through the inlet pipe to the modeled sedimentation tank, and its outflow through the outlet pipe.

2.2. PIV Tests

To verify the correctness of the CFD simulations performed for the OS and OW sedimentation tank models, experimental tests were carried out using the non-invasive PIV analysis method that is used in similar systems—also on a large scale [25]. Before starting the research, it was necessary to construct physical models of the OS and OW sedimentation tanks and to prepare a test stand (Figure 4). The test stand consisted of: an 80 × 30 × 40 cm glass aquarium (1) with a darkened back wall and side walls, which was placed on an aluminum frame and filled with water; a place to locate the selected model of the tested apparatus (2), to which, using a specially designed connector, it was possible to connect a jet pump; an EcoDrift 4.2 pump (3) attached to the wall of the aquarium with a magnetic holder; a flow controller (4) EcoDrift Control, which enabled the start and control of the pump and the setting of the desired liquid flow rate; a high-speed Sony FDR-x3000 camera (5), which allowed for the recording of a movie in 240 frames per second and the recording of the flow image; a Volteno VO0817 LED lamp (6) that had a light at the level of 5500 Lm and a uniform constant color (it was provided with a cover with a small light gap window directing the light and creating a light blade); the lens of the light blade (7), which is offset from the lamp by a selected distance, and which creates a focused and clear light plane of the device’s cross-section in a selected view; a PC for storing the acquired data, which had Batch Video To Image Extractor for video and photo processing, and MATLAB software with PIVlab overlay for analysis. The used PIV research technique allows for the visualization of the flow and the analysis of the movement of fluid elements by creating a velocity vector field. As a result, it is possible to easily determine the instantaneous speed of particle movement. The results of the analysis enabled the correctness of the CFD simulation results to be determined and compared, and the actual flow and movement of the fluid particles in the settling tanks to be verified. A marker was used to visualize the flow of the liquid and its elements. It was a polyamide (LaVision GmbH; Göttingen; Germany) with dimensions of 100 µm and density of 1.1 g/cm3. The tests were carried out in a temperature to = 21 °C (controlled). Demineralized water was applied in the research.

3. Results

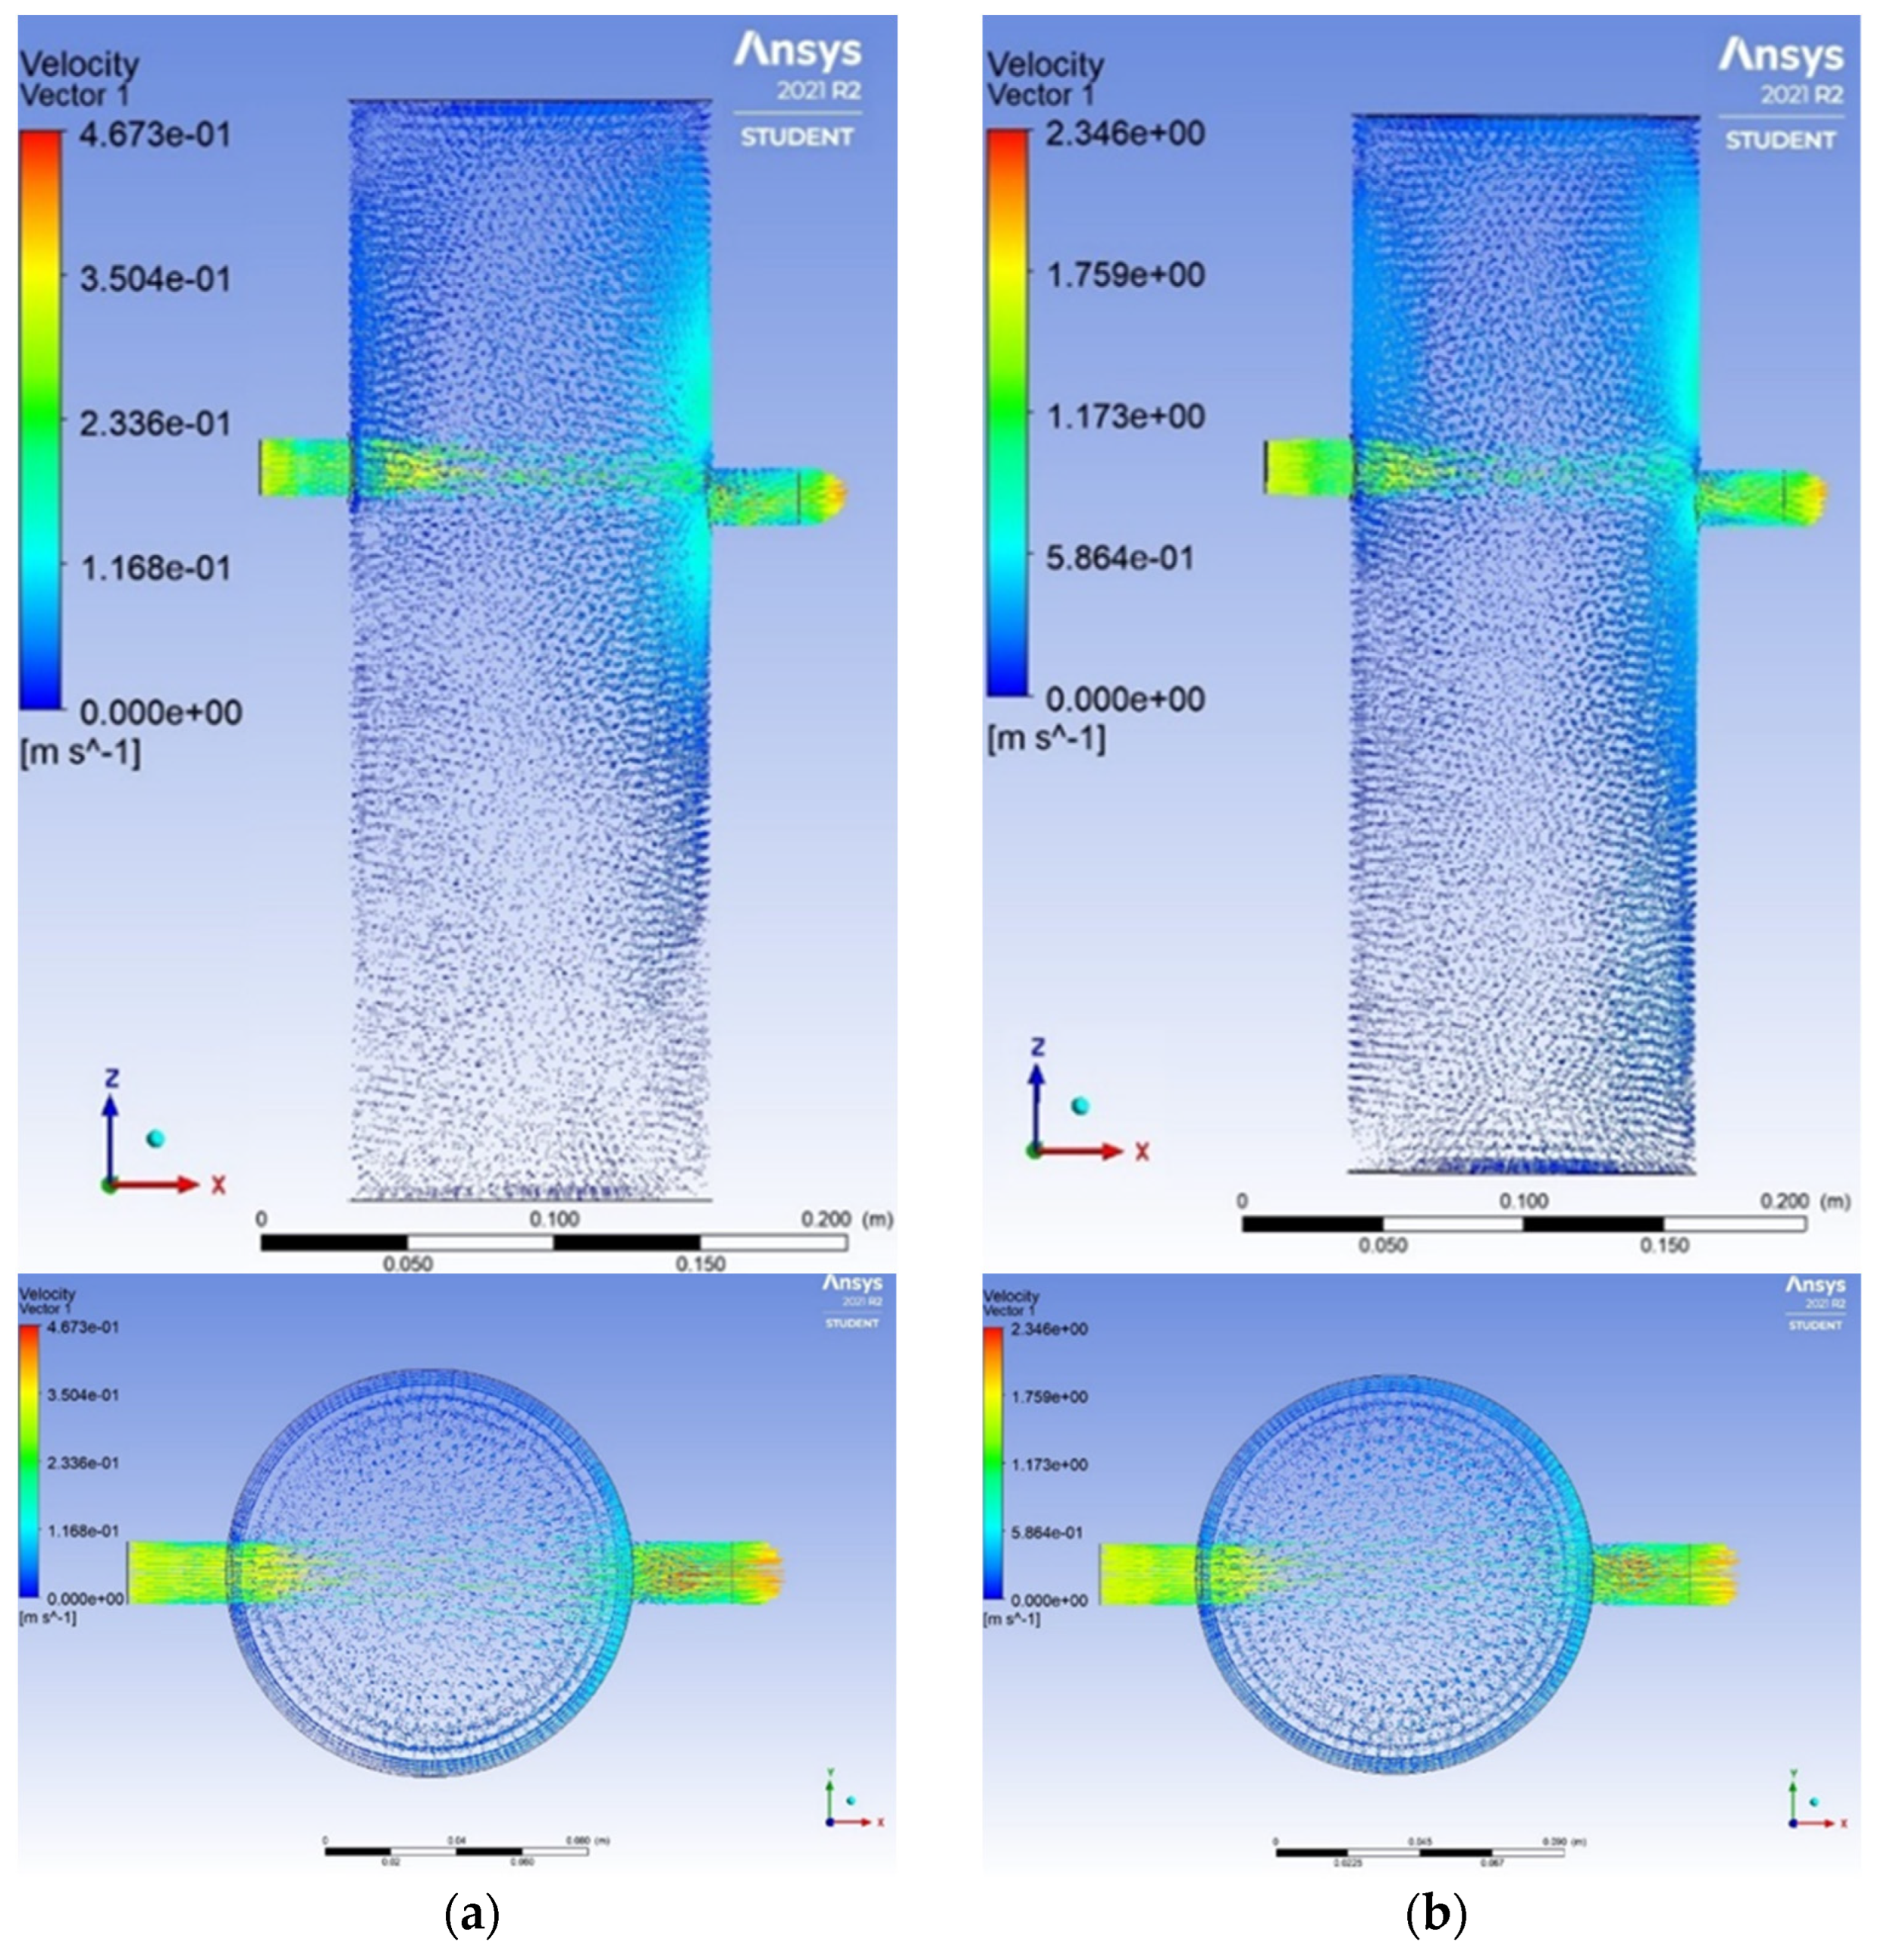
Using the ANSYS Fluent software, simulations with a variable linear velocity of water flowing through the inlet opening were performed for the standard and swirl sedimentation tank models. The calculation results show the movement of the elements of the continuous phase in the apparatuses. Examples of the obtained test results for extreme flow velocities are presented below. The images (Figure 5) represent the velocity vector fields for the inlet velocities v1 = 0.3 m/s and v5 = 1.6 m/s of the standard sedimentation tank (OS) in the front and top view. For comparison purposes, Figure 6 presents the velocity vector fields for the same inlet velocities in the case of the swirl sedimentation tank (OW).
Using the velocity vector fields obtained from the simulations in ANSYS Fluent, as well as the axial distribution of instantaneous velocity for the moving fluid’s particles in the tested apparatuses, it can be concluded that the OS model is characterized by a higher value of linear velocity for the continuous phase than is the case for the OW model. Undoubtedly, this difference is caused by the presence of the directional deflector in the OW model. The swirl motion caused by the deflector negatively affects the mean linear velocity of the particles. It can also be observed that the fluid velocity is more uniform in the case of the OS model, however, fluctuations in its value appear in the OW model. The liquid elements in the OS model at the applied high flow velocities go directly to the outlet pipe.
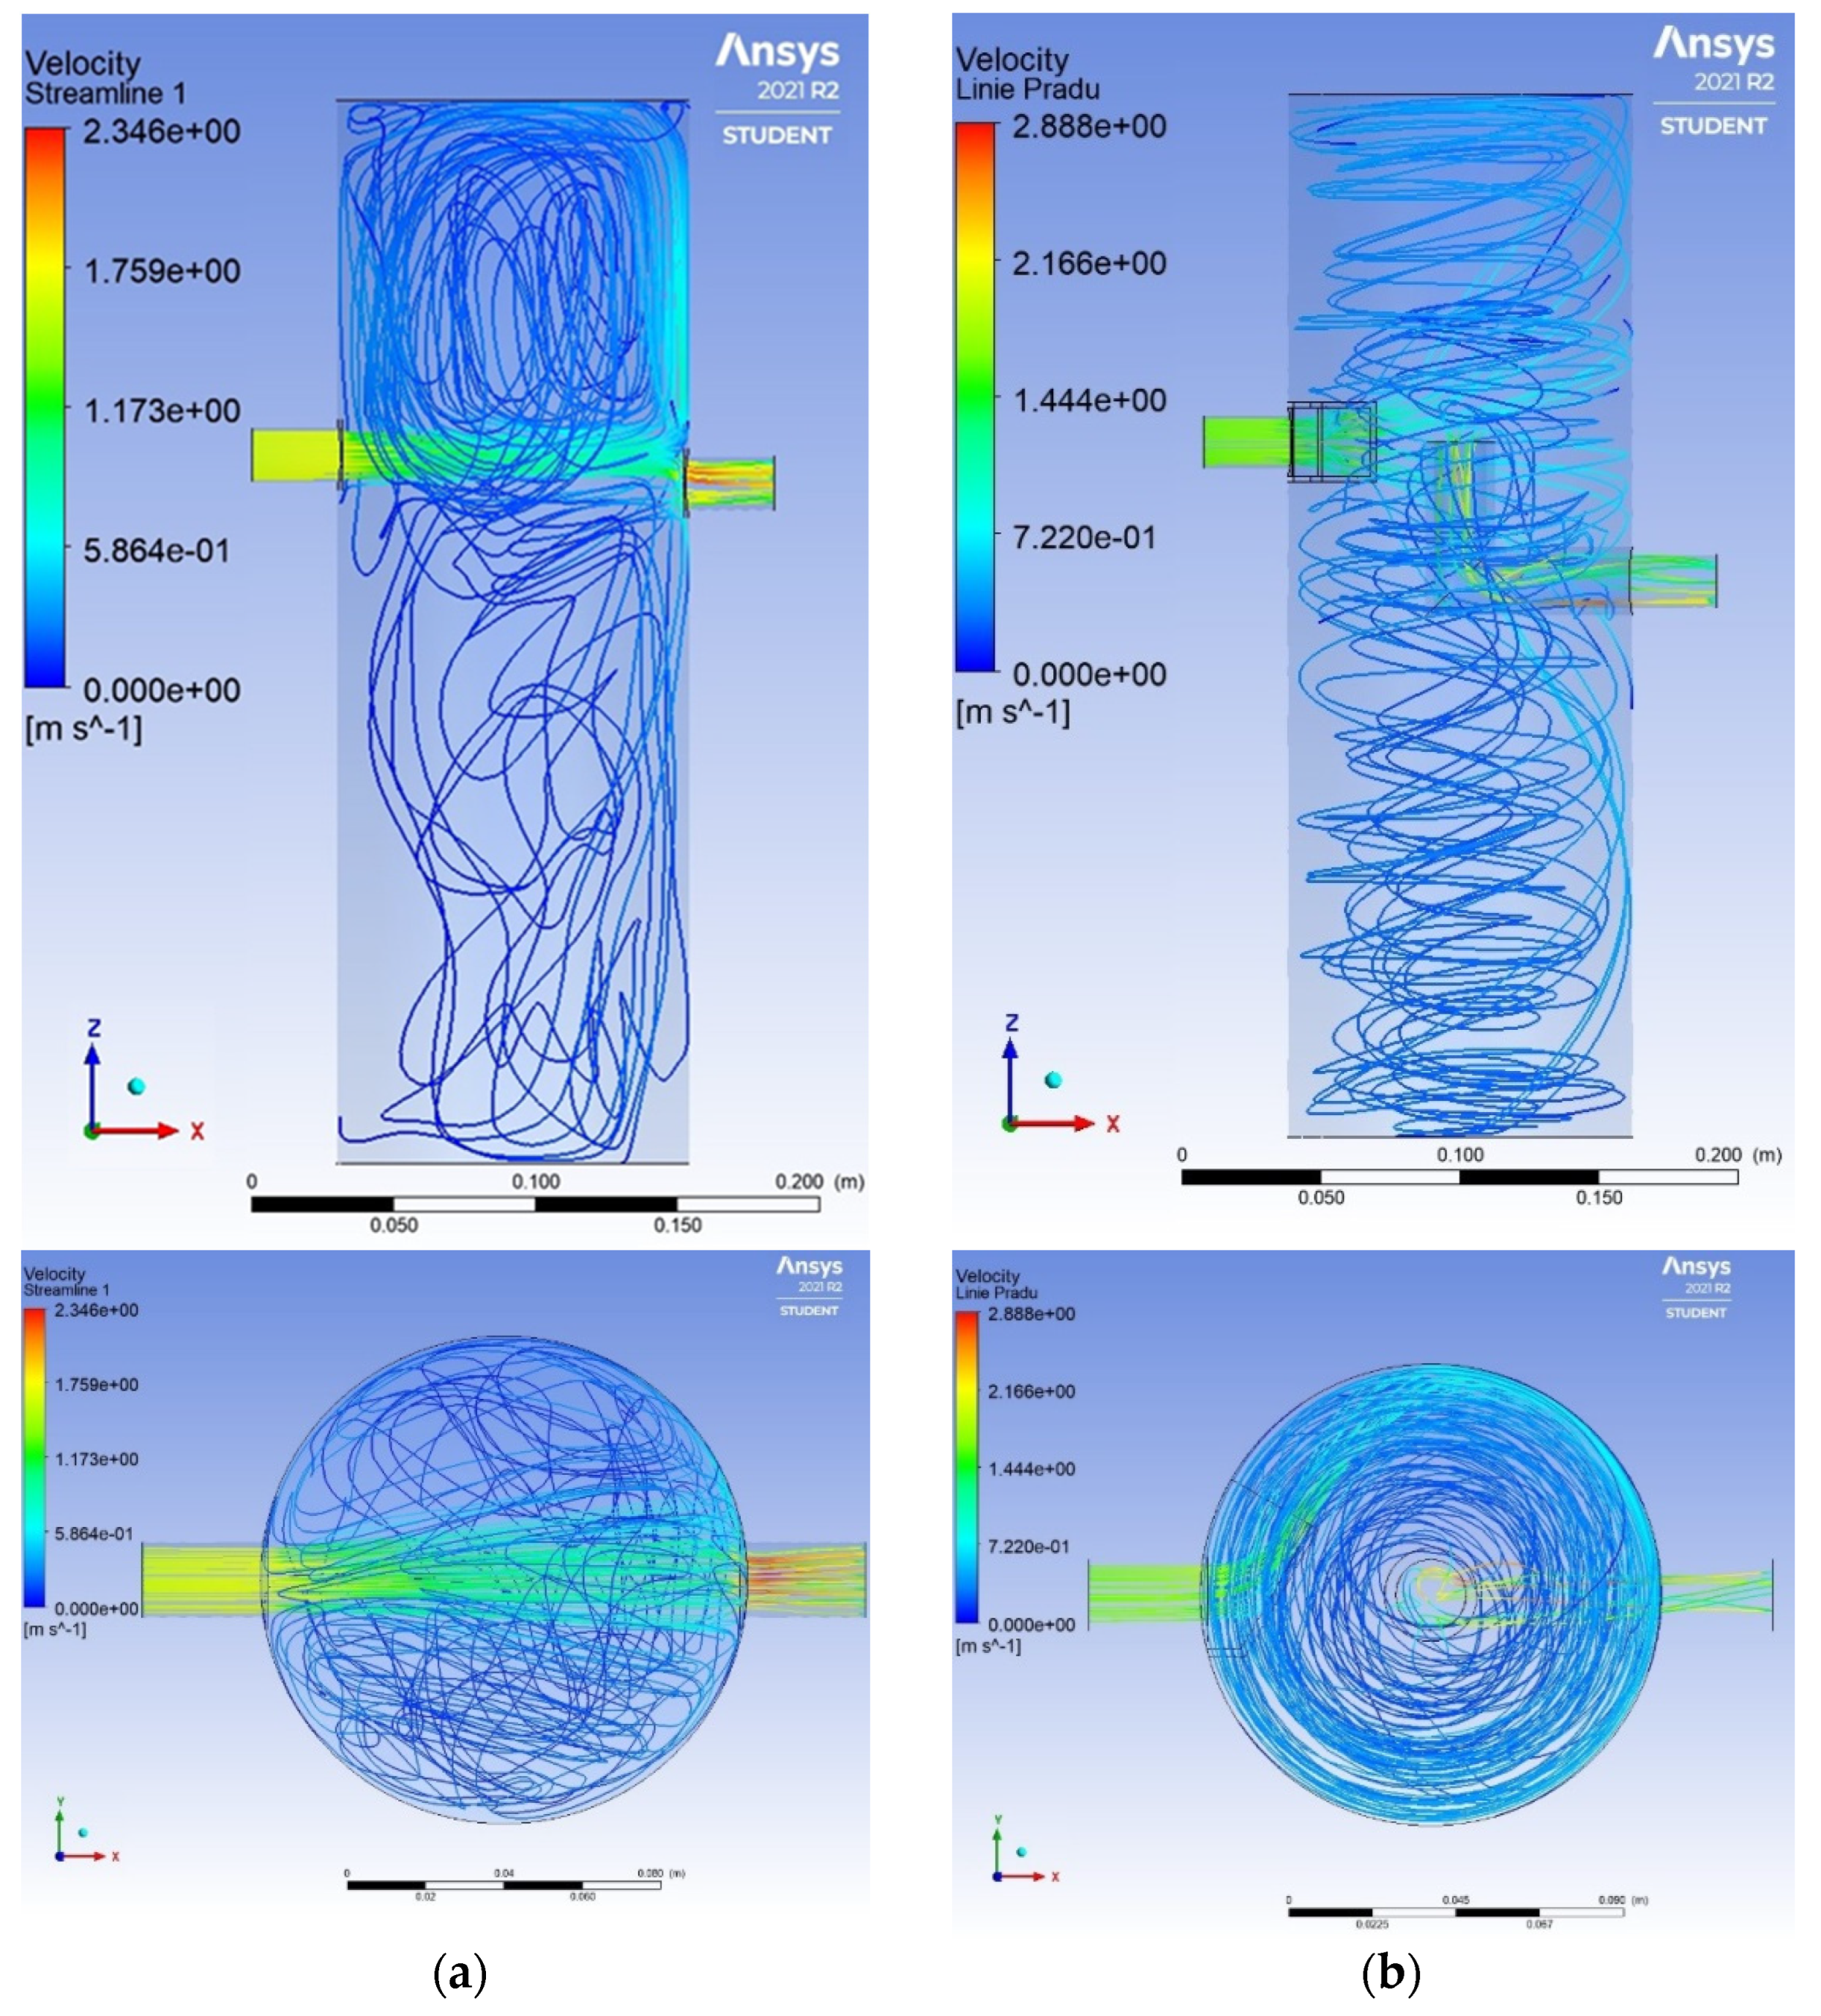
The simulation also allowed visualizations of the streamlines at the selected velocities of the liquid dispensed to the tested sedimentation tank (which are shown in Figure 7) to be obtained. When analyzing the trajectory of the flowing liquid particles on the basis of the streamlines, it can be said that, in the case of the OS model, a significant part of the liquid flows through the apparatus. Part of the continuous phase is rebounded from the wall opposite to the inlet, which then forms two swirl regions in the upper and lower parts of the sedimentation tank. The fluid particles sink to the bottom or are washed away by the inflow current. In the case of the OW model, the formation of a permanent swirl in the axis of the apparatus is its characteristic feature. The swirl even remains in the space of the outlet pipe. As the velocity of the dispensed liquid increases, the dimensions of the swirl also increase.
Figure 8 shows the velocity distribution for the fluid particles moving inside the OS and OW models at the set liquid inlet velocity v5.
The distribution of pressure in the apparatuses was also analyzed. The lowest pressure was observed at the outlet pipes, which was caused by contraction of the stream by sudden narrowing. This effect is slightly counteracted by the axial swirl in the OW model, which allows for the fluid elements to change the modulus and direction of the velocity vector more smoothly. The flow swirl apparatus also has a higher overall pressure. This is probably due to turbulence in the entire volume of the apparatus.
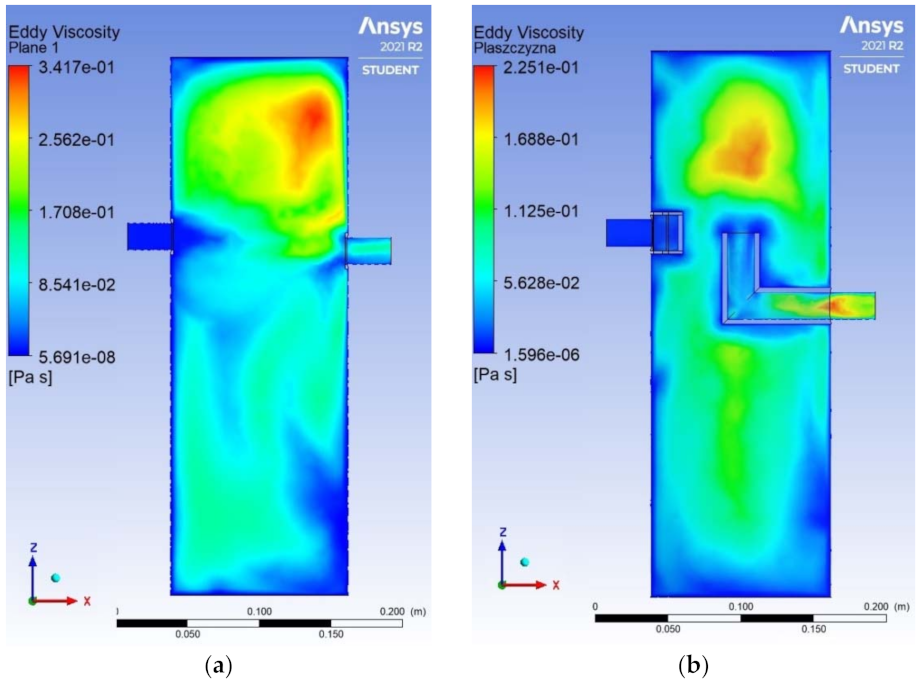
The last example of the obtained results, which are presented in Figure 9, is the multiplicity of swirls arising in the turbulent flow of the continuous phase through the sedimentation tanks. Eddy viscosity is the coefficient of proportionality that describes the transfer of turbulence energy in a moving continuous phase due to the action of swirls in the flow.
Eddy viscosity caused by the viscous swirls is more uniform in the OW model. It has lower values than in the case of the OS model. Both models show more intense mixing in the upper parts of the apparatus. The movement of elements at the bottom of the apparatus is calmer. This can be taken as a positive feature of the apparatuses, especially when considering their purpose and the fact that they usually do not operate in the case of full overfill and flooding conditions.
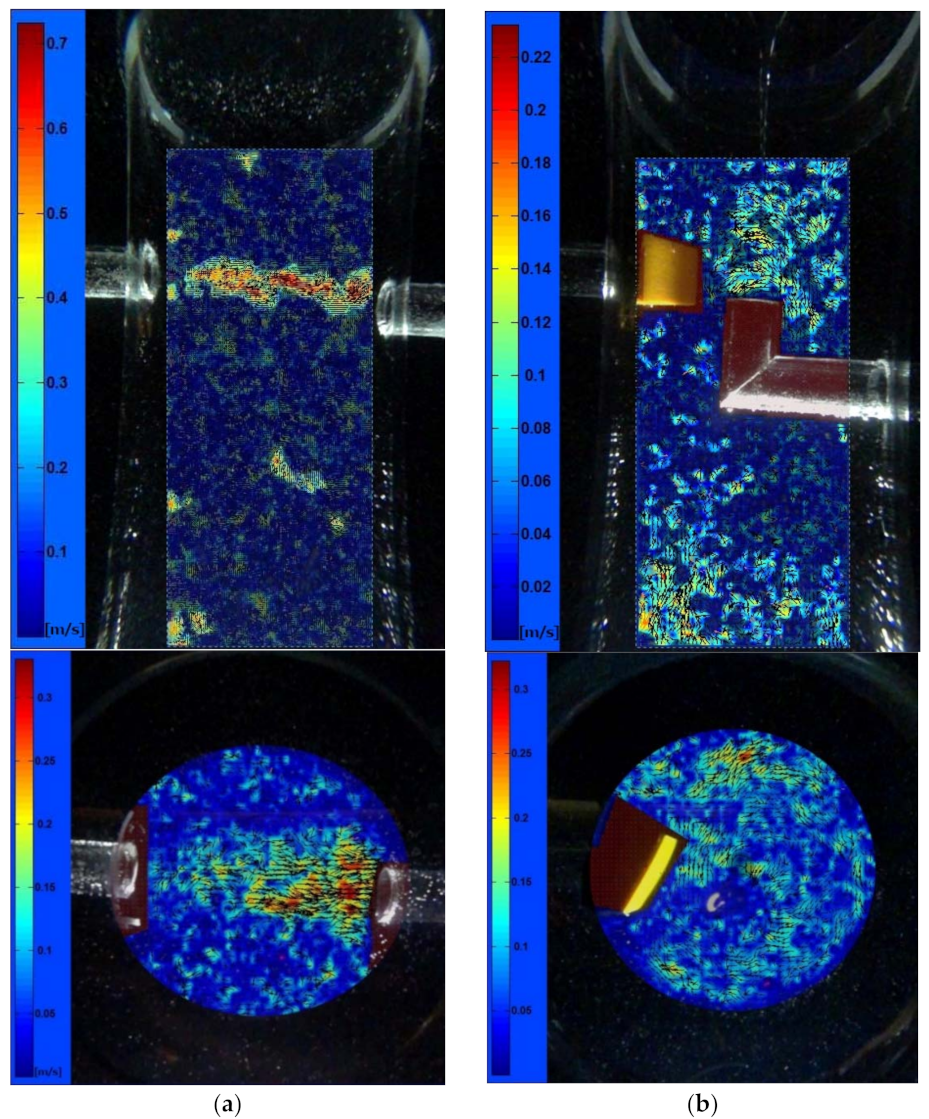
The results of the PIV analysis tests were used to verify the correctness of the performed CFD simulations. Examples of the obtained data are collected and summarized below. For the tested apparatus structures, velocity vector fields made with the use of PIVlab software were obtained, which were applied on the analyzed image of the sedimentation tank using a program for the graphic processing of photos in order to create vector maps of particle movement. Additionally, for all measurements, the velocity magnitude area mean value was determined for the path between the inlet and outlet pipes. The results are summarized in Table 2. The presented values illustrate the average velocity of the particles leaving the apparatus through the outlet pipe at the increasing velocities of the water dispensed into the apparatus. These velocities were estimated by knowing the values of the flow rate for subsequent measurements and the cross-sectional area of the inlet pipe.
Figure 10 shows the selected results obtained from the PIV analysis—vector maps of the velocity field for the tested sedimentation tank models in the front (P) and top (G) view in the case of velocity v5 = 1.568 m/s of the liquid dispensed through the inlet pipe.
By analyzing the results obtained from the experimental PIV analysis, and by comparing them to the results of CFD simulation tests, it can be seen that there are similarities in the behavior of the liquid and the movement of its elements. During the experimental tests, it was possible to obtain velocities of the dosed liquid, which are similar to the boundary conditions that were set in the CFD calculations. This allows the image of the movement of liquid particles obtained from the simulations to be compared with the images that show their behavior in reality.
The values of the instantaneous velocities of the fluid particles in the area between the pipes of the apparatus, the directions of vectors and their distribution in the tested models when using similar conditions for measurements and calculations, and the created map images that show the velocity vector fields applied on the apparatuses’ images, give the basis for stating that the flows are similar to the flows obtained during the simulations.
By analyzing the results (and their similarities), it was found that the simulation tests were correctly carried out and positively verified. The adopted mathematical models and calculation settings were selected correctly. The analysis of the movement of liquid particles can therefore be described on the basis of the obtained CFD calculations. However, it should be remembered that due to the complexity of the phenomena occurring in the process [13], it is impossible to eliminate classic experimental research, with CFD being used to support the design process.

4. Conclusions

This article deals with the simulation of the treatment of rainwater in sedimentation tanks: standard OS and swirl OW. The methodology of research is based on the CFD code Fluent software and is verified by PIV analysis.
The performed tests fully describe the behavior of the tested fluid in the selected and modeled apparatuses’ structures. The aim of the study was achieved, and the results clearly illustrate the movement of fluid particles in the OS and OW models. Based on the conducted research and the analyzed results, it was shown that:
In the tested models, greater turbulence is observed in the upper parts of the sedimentation tanks. This may have a positive effect on the sedimentation and deposition of solid particles at the bottom of the sedimentation tanks;
In the standard sedimentation tank OS, at high velocities of the dosed liquid, solid particles may wash out and get directly into the outlet pipe;
The tests were carried out for a single-phase model, and therefore further analyzes for multiphase systems are suggested in order to be able to fully visualize the operation and efficiency of the evaluated apparatus models;
The obtained simulation results were experimentally verified, and it was observed that the simulation was similar to the actual behavior of the liquid flowing through the apparatus;
Analysis with the use of the PIV technique is a good non-invasive method for verifying the correctness of CFD simulations, and also for conducting flow tests and visualization of the liquid flow through the apparatus.
The proposed selection of settings for the CFD simulations in the presented research can be used to carry out further calculations (with the use of other variables), and also for deeper analysis of the tested sedimentation tanks (or tanks with a similar structure). Of course, because of the complexity of the processes, CFD cannot completely replace experimental testing due to the partially empirical nature of the design process. Traditional techniques will continue to be used in the case of standard design, with CFD being invaluable for supporting this work and for investigating novel tank designs.

Author Contributions

Conceptualization, K.C., M.O., D.J., T.Z., L.D., S.W. (Sylwia Włodarczak), A.K.; methodology, M.O., S.W. (Stanisław Witczak), D.J., T.Z., L.D., S.W. (Sylwia Włodarczak), A.K., M.M., M.H., I.P.; formal analysis, K.C., M.O., D.J., S.W. (Stanisław Witczak), T.Z., L.D., A.K.; investigation, M.O., T.Z., L.D., M.H., I.P.; writing—original draft preparation, M.O.; writing—review and editing, K.C., M.O., S.W. (Sylwia Włodarczak); visualization, T.Z., L.D., S.W. (Sylwia Włodarczak), A.K., M.M., M.H. All authors have read and agreed to the published version of the manuscript.

Funding

This research was funded by the Ministry of Education and Science in Poland.

Institutional Review Board Statement

Not applicable.

Informed Consent Statement

Informed consent was obtained from all subjects involved in the study.

Data Availability Statement

Not applicable.

Acknowledgments

The study was supported by the Ministry of Education and Science in Poland.

Conflicts of Interest

The authors declare no conflict of interest.

References

  1. Nikou, N.S.R.; Ziaei, A.N.; Ansary, H.; McDonough, J.M. Flow field investigation in a vortex settling basin using Acoustic Doppler Velocimetry and large eddy simulation. Water Environ. J. 2020, 35, 865–883. [Google Scholar] [CrossRef]
  2. Zawilski, T.; Grajewski, M.; Gruszka, P. Research on Water Purification in a STP Separator; Poznan University of Technology: Poznan, Poland, 2020. [Google Scholar]
  3. Nixor. Horizontal Sedimentation Tank, Model NIXOR-NO. Available online: www.nixor.pl/osadniki-poziome,19,pl.html (accessed on 15 August 2021).
  4. Shah, M.T.; Parmar, H.B.; Rhyne, L.D.; Kalli, C.; Utikar, R.P.; Pareek, V.K. A novel settling tank for produced water treatment: CFD simulations and PIV experiments. J. Pet. Sci. Eng. 2019, 182, 106352. [Google Scholar] [CrossRef]
  5. Kiss, K.; Patziger, M. Novel measurements in primary settling tanks of large municipal wastewater treatment plants. Environ. Sci. 2013, 1, 6–18. [Google Scholar] [CrossRef] [Green Version]
  6. Haba, R.L. Fat Separators and Separators. Available online: https://haba.pl/node/319 (accessed on 3 February 2020).
  7. Haba, R.L. Hydrocarbon Separators. Available online: https://haba.pl/node/339 (accessed on 30 December 2020).
  8. Patziger, M.; Günthert, F.W.; Jardin, N.; Kainz, H.; Londong, J. On the design and operation of primary settling tanks in state of the art wastewater treatment and water resources recovery. Water Sci. Technol. 2016, 74, 2060–2067. [Google Scholar] [CrossRef] [PubMed]
  9. Nawrot, N.; Wojciechowska, E. Review of the quality of sediments from rainwater drainage system and methods of classification of sediments deposited in rainwater receivers in the urban catchment area, in Polish. Inżynieria Morska I Geotech. 2017, 6, 276–281. [Google Scholar]
  10. Keshavarzi, A.R.; Gheisi, A.R. Trap efficiency of vortex settling chamber for exclusion of fine suspended sediment particles in irrigation canals. Irrig. Drain 2006, 55, 419–434. [Google Scholar] [CrossRef]
  11. De, A. Developments in Settling Studies in Sedimentation Process and Design of Settling Systems; Springer: Berlin/Heidelberg, Germany, 2017; pp. 5–35. [Google Scholar] [CrossRef]
  12. Sheddon, A. Cleaning water by settlement. J. Assoc. Eng. Soc. 1889, 477. [Google Scholar]
  13. Goula, A.M.; Kostoglou, M.; Karapantsios, T.D.; Zouboulis, A.I. A CFD methodology for the design of sedimentation tanks in potable water treatment: Case study: The influence of a feed flow control baffle. Chem. Eng. J. 2008, 140, 110–121. [Google Scholar] [CrossRef]
  14. He, Z.; Zhang, Y.; Wang, H.; Qi, L.; Yin, X.; Zhang, X.; Wen, Y. A novel model for the entire settling-thickening process in a secondary settling tank. Water Environ. Res. 2016, 88, 2228–2232. [Google Scholar] [CrossRef]
  15. Li, L.; Wang, P.; Ma, Y.; Wu, Y. Reducing sediment deposition on deflector in vortex settling basins. J. Irrig. Drain Eng. 2020, 146, 1–8. [Google Scholar] [CrossRef]
  16. Saneie, M.; Asefi, M.; Smaeeli, K. Experimental studies on increasing sedimentation efficiency of the vortex settling basin by using submerged vanes. J. Watershed Eng. Manag. 2013, 5, 224–232. [Google Scholar] [CrossRef]
  17. Yaseen, D.A.; Abu-Alhail, S.; Mohhamed, R.N. An experimental sedimentation tank for enhancing the settling of solid particles. J. Water Land Dev. 2021, 49, 63–73. [Google Scholar] [CrossRef]
  18. Tamayol, A.; Firoozabadi, B.; Ashjari, M.A. Hydrodynamics of secondary settling tanks and increasing their performance using baffles. J. Environ. Eng. 2010, 136, 32–39. [Google Scholar] [CrossRef]
  19. Weipeng, H.; Lianpeng, X.; Gorczyca, B.; Nan, J.; Shi, Z. Comparative analysis on flocculation performance in unbaffled square stirred tanks with different height-to-width ratios: Experimental and CFD investigations. Chem. Eng. Res. Des. Trans. Inst. Chem. Eng. Part A 2018, 132, 518–535. [Google Scholar]
  20. Athar, M.; Kothyari, U.C.; Garde, R.J. Distribution of sediment concentration in the vortex chamber type sediment extractor. J. Hydraul. Res. 2003, 41, 427–438. [Google Scholar] [CrossRef]
  21. Denk, V.; Dürholt, A. Experimental investigations of the unsteady rotating flow field in a cylindrical vessel. Exp. Fluids 1991, 12, 97–105. [Google Scholar] [CrossRef]
  22. Diakun, J.; Jakubowski, M. Simulation investigations of the effects of whirlpool dimensional ratios on the state of secondary whirls. J. Food Eng. 2007, 83, 106–110. [Google Scholar]
  23. Jakubowski, M.; Sterczyska, M.; Matysko, R.; Poreda, A. Simulation and experimental research on the flow inside a whirlpool separator. J. Food Eng. 2014, 133, 9–15. [Google Scholar] [CrossRef]
  24. Verrapen, J.P.; Lowry, B.; Couturier, M.F. Design methodology for the swirl separator. Aquac. Eng. 2005, 33, 21–45. [Google Scholar] [CrossRef]
  25. Matias, R.I.; Gianina, L.R.; Facundo, G.; Marcelo, G.C.; Melina, D.B.; Gerardo, B.B. Combined use of LS-PIV and CFD for the characterization of turbulent flow in the contact chamber of ‘COSTA AZUL’ wastewater treatment plant, Carlos Paz. J. Hydr. 2021, 23, 1083–1097. [Google Scholar] [CrossRef]
  26. Bridgeman, J.; Jefferson, B.; Jefferson, B.; Parsons, S.A. The development and application of CFD models for water treatment flocculators. Adv. Eng. Softw. 2010, 41, 99–109. [Google Scholar] [CrossRef]
  27. Wadnerkar, D.; Utikar, R.P.; Tade, M.O.; Pareek, V. CFD simulation of solid–liquid stirred tanks. Adv. Powder Technol. 2012, 23, 445–453. [Google Scholar] [CrossRef]
  28. Markowska, M.; Ochowiak, M.; Włodarczak, S.; Matuszak, M. The modified primary swirl sedimentation: Tanks in waste liquids treatment plant: Liquid viscosity effect. Arch. Environ. Prot. 2020, 46, 42–48. [Google Scholar] [CrossRef]
  29. Dufresne, M.; Vazquez, J.; Terfous, A.; Ghenaim, A.; Poulet, J.B. Experimental investigation and CFD modelling of flow, sedimentation and solids separation in a combined sewer detention tank. Comput. Fluids 2009, 38, 1042–1049. [Google Scholar] [CrossRef]
  30. He, P.; Salcudean, M. A numerical method for 3D viscous incompressible flows using non-orthogonal grids. Int. J. Numer. Methods Fluids 1994, 18, 449–469. [Google Scholar] [CrossRef]
  31. Mohanarangam, K.; Stephens, D.W. CFD modelling of floating and settling phases in settling tanks. In Proceedings of the Seventh International Conference on CFD in the Minerals and Process Industries, CSIRO, Melbourne, Australia, 9–11 December 2009. [Google Scholar]
  32. Kuok, K.K.; Chiu, P.C. Application of particle image velocimetry (PIV) for measuring water velocity in laboratory sedimentation tank. IRA-Int. J. Eng. Technol. 2017, 9, 16–26. [Google Scholar] [CrossRef] [Green Version]
  33. Markowska, M.; Kruszelnicka, I.; Ginter-Kramarczyk, D.; Krupińska, A.; Ochowiak, M.; Fus, A.; Okupniak, K.; Woziwodzki, S.; Włodarczak, S.; Matuszak, M. Experimental verification of CFD simulation of the process of separation of suspended particles in a modified swirl setting tank. Instal 2018, 12, 63–66. [Google Scholar]
  34. Ecol-Unicon. Vortex Settling Tank, EOW-1. Available online: https://ecol-unicon.com (accessed on 15 August 2021).
  35. McCorquodale, J.A.; Yuen, E.M.; Vitasovic, Z.; Samstag, R. Numerical simulation of unsteady conditions in clarifiers. Water Poll. Res. J. Can. 1991, 26, 201–222. [Google Scholar] [CrossRef]
  36. McCorquodale, J.A.; Zhou, S. Effects of hydraulic and solids loading on clarifier performance. J. Hydr. Res. 1993, 31, 461–477. [Google Scholar] [CrossRef]
  37. Zhou, S.; McCorquodale, J.A.; Godo, A.M. Short circuiting and density interface in primary clarifiers. J. Hydr. Eng. 1994, 120, 1060–1080. [Google Scholar] [CrossRef]
  38. Zawilski, T.; Dudek, L. Analysis of Particle Motion in Standard and Vortex Settling Tanks. Master’s Thesis, Poznan University of Technology, Poznan, Poland, 2021. [Google Scholar]
  39. Shamber, D.R.; Larock, B.E. Numerical analysis of flow in sedimentation basins. J. Hydr. Div. 1981, 107, 575–591. [Google Scholar] [CrossRef]
Figure 1. The structure and dimensions of the sedimentation tanks. (a) OS standard sedimentation tank; (b) OW swirl sedimentation tank.
Energies 14 07852 g001
Figure 2. Directional deflector for the OW sedimentation tank.
Energies 14 07852 g002
Figure 3. Inflation used in the OS and OW models.
Energies 14 07852 g003
Figure 4. Scheme of the PIV test stand: 1—aquarium, 2—model of the tested apparatus, 3—submersible (jet) pump, 4—flow controller, 5—camera, 6—LED lamp, 7—light blade lens, 8—computer.
Energies 14 07852 g004
Figure 5. Velocity vector fields for the OS model in the case of velocity. (a) v1; (b) v5.
Energies 14 07852 g005
Figure 6. Velocity vector fields for the OW model in the case of velocity. (a) v1; (b) v5.
Energies 14 07852 g006aEnergies 14 07852 g006b
Figure 7. Velocity vector fields in the case of v5 velocity for model: (a) OS, (b) OW.
Energies 14 07852 g007
Figure 8. The distribution of the velocity of the fluid particles along the axis in the case of velocity v5 for: (a) OS, (b) OW.
Energies 14 07852 g008
Figure 9. Swirls occurring in the turbulent flow in the axis at the set velocity v5 for: (a) OS, (b) OW.
Energies 14 07852 g009
Figure 10. Velocity vector field maps for the tested sedimentation tank models in the case of velocity v5: (a) OS, (b) OW.
Energies 14 07852 g010
Table 1. The initial parameters for the model.
ParameterValue
Continuous phaseWater
Water density998.2 kg/m3
Water viscosity0.001003 kg/(m·s)
Flow velocityv1 = 0.3 m/s, v2 = 0.6 m/s, v3 = 1.0 m/s, v4 = 1.3 m/s, v5 = 1.6 m/s
Table 2. The average size of the vector of the instantaneous particle velocity in the selected area for the tested cross-sections in the front (P) and top (G) view of the OS and OW apparatuses.
Velocity of the Dispensed Liquid vi (m/s) v ¯ (m/s)
for OS (P)
v ¯ (m/s)
for OS (G)
v ¯ (m/s)
for OW (P)
v ¯ (m/s)
for OW (G)
0.2940.2680.1600.0470.068
0.5880.0840.1810.0580.063
0.9800.2530.1690.0600.066
1.2740.2630.0950.0670.080
1.5680.1080.1040.0620.077
Publisher’s Note: MDPI stays neutral with regard to jurisdictional claims in published maps and institutional affiliations.