Article

Capacity Market and (the Lack of) New Investments: Evidence from Poland

by
Przemysław Kaszyński
1,*,
Aleksandra Komorowska
1,
Krzysztof Zamasz
2,
Grzegorz Kinelski
2 and
Jacek Kamiński
1
1
Mineral and Energy Economy Research Institute of the Polish Academy of Sciences, 31-261 Kraków, Poland
2
Department of Management, WSB University, 41-300 Dąbrowa Górnicza, Poland
*
Author to whom correspondence should be addressed.
Energies 2021, 14(23), 7843; https://doi.org/10.3390/en14237843
Submission received: 26 October 2021 / Revised: 16 November 2021 / Accepted: 19 November 2021 / Published: 23 November 2021

Abstract

:
Capacity remuneration mechanisms operate in many European countries. In 2018, Poland implemented a centralized capacity market to ensure appropriate funding for the existing and new power generation units to improve long-term energy security. One of the declarations made while the mechanism was deployed was its beneficial influence on incentives for investments in new units. In this context, this paper aims to analyze the effects of the capacity mechanism adopted for investments in new power generation units that may be financed under the capacity market mechanism in Poland. The analysis is conducted for four types of capacity market units, the existing, refurbishing, planned, and demand-side response types, and includes the final results of capacity auctions. The results prove that the primary beneficiaries of the capacity market in Poland have been the existing units (including the refurbishing ones) responsible for more than 80% of capacity obligation volumes contracted for 2021–2025. Moreover, during the implementation of the capacity market in Poland, the planned units that signed long-term capacity contracts with a total share of 12% of the whole market were already at the advanced phases of construction, and the investment decisions were made long before the implementation of the capacity market mechanism. Therefore, they were not associated with the financial support from the capacity market. The study indicates that the capacity market did not bring incentives for investments in new power generation units in the investigated period.

1. Introduction

Capacity remuneration mechanisms (CRMs) are proposed to solve capacity adequacy problems in the power system that have arisen due to the increase in the share of renewable energy sources. These units have an impact on the merit order effect resulting in a decrease in the revenues of thermal units. Consequently, thermal units cannot cover their operational costs, investors cannot have enough incentives, and the problem of missing capacity and even brownouts or blackouts may occur.
CRMs include a broad range of instruments, such as strategic reserve [1], capacity payments, capacity obligations, reliability options, and centralized and decentralized capacity markets [2,3,4]. They are implemented in many European countries (i.e., the United Kingdom [5], Germany [1,6], Italy [7], Ireland, and others [8,9,10]), as well as in the United States [11,12,13,14], and others throughout the world [15,16]. According to the literature and policymakers, their main goal should be to ensure appropriate investment incentives for power generation units [2,13,17] to secure stable and economically efficient power generation [18,19].
The Polish power system also faced the specter of the problem of missing capacity. Similar to other European countries, the energy-only market in Poland did not provide adequate price signals to maintain the required generation capacity in the system in the long-term perspective. Market prices did not provide economic conditions for continuing market participation by existing units or making decisions about building new investments. The Polish generation system is based mainly on fossil fuels, thus is vulnerable to climate policies and increasing carbon prices. Additionally, most generating assets in Poland are outdated, with numerous units over 30 years old [20]. Therefore, they should be refurbished or decommissioned in the coming years. On the other side, it is expected that electricity consumption will increase [21,22]. The final indication of the mounting difficulties was the lack of sufficient capacity in the system to meet the peak demand in August 2015 [23]. High temperature, unfavorable hydrological conditions, maintenance breaks in some units, and increased demand caused the introduction of restriction of electricity consumption for industry and large companies.
To address these problems and avoid the brownouts and economic losses, Poland deployed the centralized capacity market in 2018, with the parameters and regulations developed on solutions implemented in the United Kingdom. To the best of the authors’ knowledge, Poland followed the British model as it had gone through the notification of the European Commission and because it was believed that it would be easier to follow the same path. Additional advantages of the British model over, for example, the US, resulted from the similarity of the British energy market to the Polish one:
  • The relatively high share of conventional, coal-fired power units in the fuel mix (at the time of considering and introduction of capacity remuneration mechanism).
  • A similar design of the energy market before implementation of capacity remuneration mechanism (one unified market, with one Transmission System Operator (TSO) in the country vs. several regional markets in the US, with several TSOs).
Before settling on the British model, numerous techno–economic analyses were carried out to compare various possible scenarios. The centralized capacity market was considered an optimal solution from the perspective of system reliability and minimization of electricity prices for consumers.

1.1. Literature Review

The influence of the capacity market for making incentives for building new power units was studied by Byers et al. (2018). However, the authors focused merely on theoretical possibilities for supporting new production units [24]. Mastropietro et al. (2017) delivered empirical evidence from the functioning of capacity remuneration mechanisms in the United Kingdom, the United States (Colombia, ISO New England, and PJM Energy Markets), and France [25]. Spees et al. (2013) analyzed the functioning of the capacity market mechanism in the United States [13]. Based on the results, they proposed recommendations for the mechanisms deployed in Europe. They noted that the capacity market does not generate market incentives that could be expected from its theoretical assumptions.
Fang et al. (2021) pointed out the current design of the capacity markets does not consider the difference in the flexibility of power units. The authors propose the new framework of capacity remuneration mechanism that would differentiate the characteristic of units and provide better incentives for peak load generation capacity [26]. Schäfer and Altvater (2021) also indicate that the capacity market does not provide the same chances for each power unit. The authors propose a new modification to the current design of CM and price markup depending on the carbon emissions of individual power plants. Consequently, the cleanest technologies could obtain the highest payments from the capacity markets [27]. McCullough et al. (2021) address the research question regarding the competitiveness in PJM. The results show that the solution is inefficient and allows one to use the market power of individual suppliers [28].
The Polish capacity market is a subject of numerous analyses. However, most studies cover techno–economic simulations of its operation in the long term. E.g., Komorowska et al. (2020) investigated the economic consequences of introducing the capacity market until 2030 [29]. Zamasz et al. (2020) compared support mechanisms for new combined heat and power plants assuming the time horizon of 2050 [30]. Komorowska (2021) presented the impact of the capacity market on the decarbonization process in Poland until 2040 [18]. Jeżyna et al. (2020) questioned 50 companies about their expectations and plans related to the participation in capacity marked compared to other DRS schemes [31].

1.2. Study Contributions

To the best of the authors’ knowledge, there are no studies about the influence of the capacity market on incentives for investments in new units. Given that the Polish capacity market is a relatively new mechanism, it lacks detailed empirical analyses of its functioning and influence on generating market incentives for building power units. Since five capacity auctions have already been held (for 2021–2025 delivery years), the question is whether and to what extent the capacity market implemented in Poland generates appropriate signals for building new power generation units. That is why this paper significantly contributes to the related discussion.
Within this context, this paper contributes to the existing literature in the following ways: First, it provides a comprehensive analysis of results of capacity auctions held to date broken down into capacity market units. Second, it extends the current studies on the consequences of the operation of capacity remuneration mechanisms in European markets. Third, the results show that the capacity market does not meet its assumptions about creating market signals for building new units. Finally, the analysis provides the conclusions that may be used by countries considering the implementation of such a mechanism to their energy markets.
The authors are aware that the study has some limitations. The results of capacity auctions include only limited information about capacity units. Each unit was identified due to the authors’ knowledge of the Polish power sector and their analyses about power companies. Although not all units were identified, their share is small enough to be neglected in this analysis without impacting the study results and conclusions.
In this context, the paper aims to analyze past capacity auctions to estimate the influence of adopted solutions on investment in new power generation units. The remainder of the paper is structured as follows: Section 2 presents the principles and functioning of the capacity market in Poland and includes a description of the method applied for the analysis. Section 3 presents the results, and Section 4 summarizes and concludes the discussion.

2. Materials and Methods

This section presents the essential principles of the capacity remuneration mechanism implemented in Poland (the centralized capacity market). Furthermore, it describes sources of information used in the analysis, general assumptions, and the methodology applied.

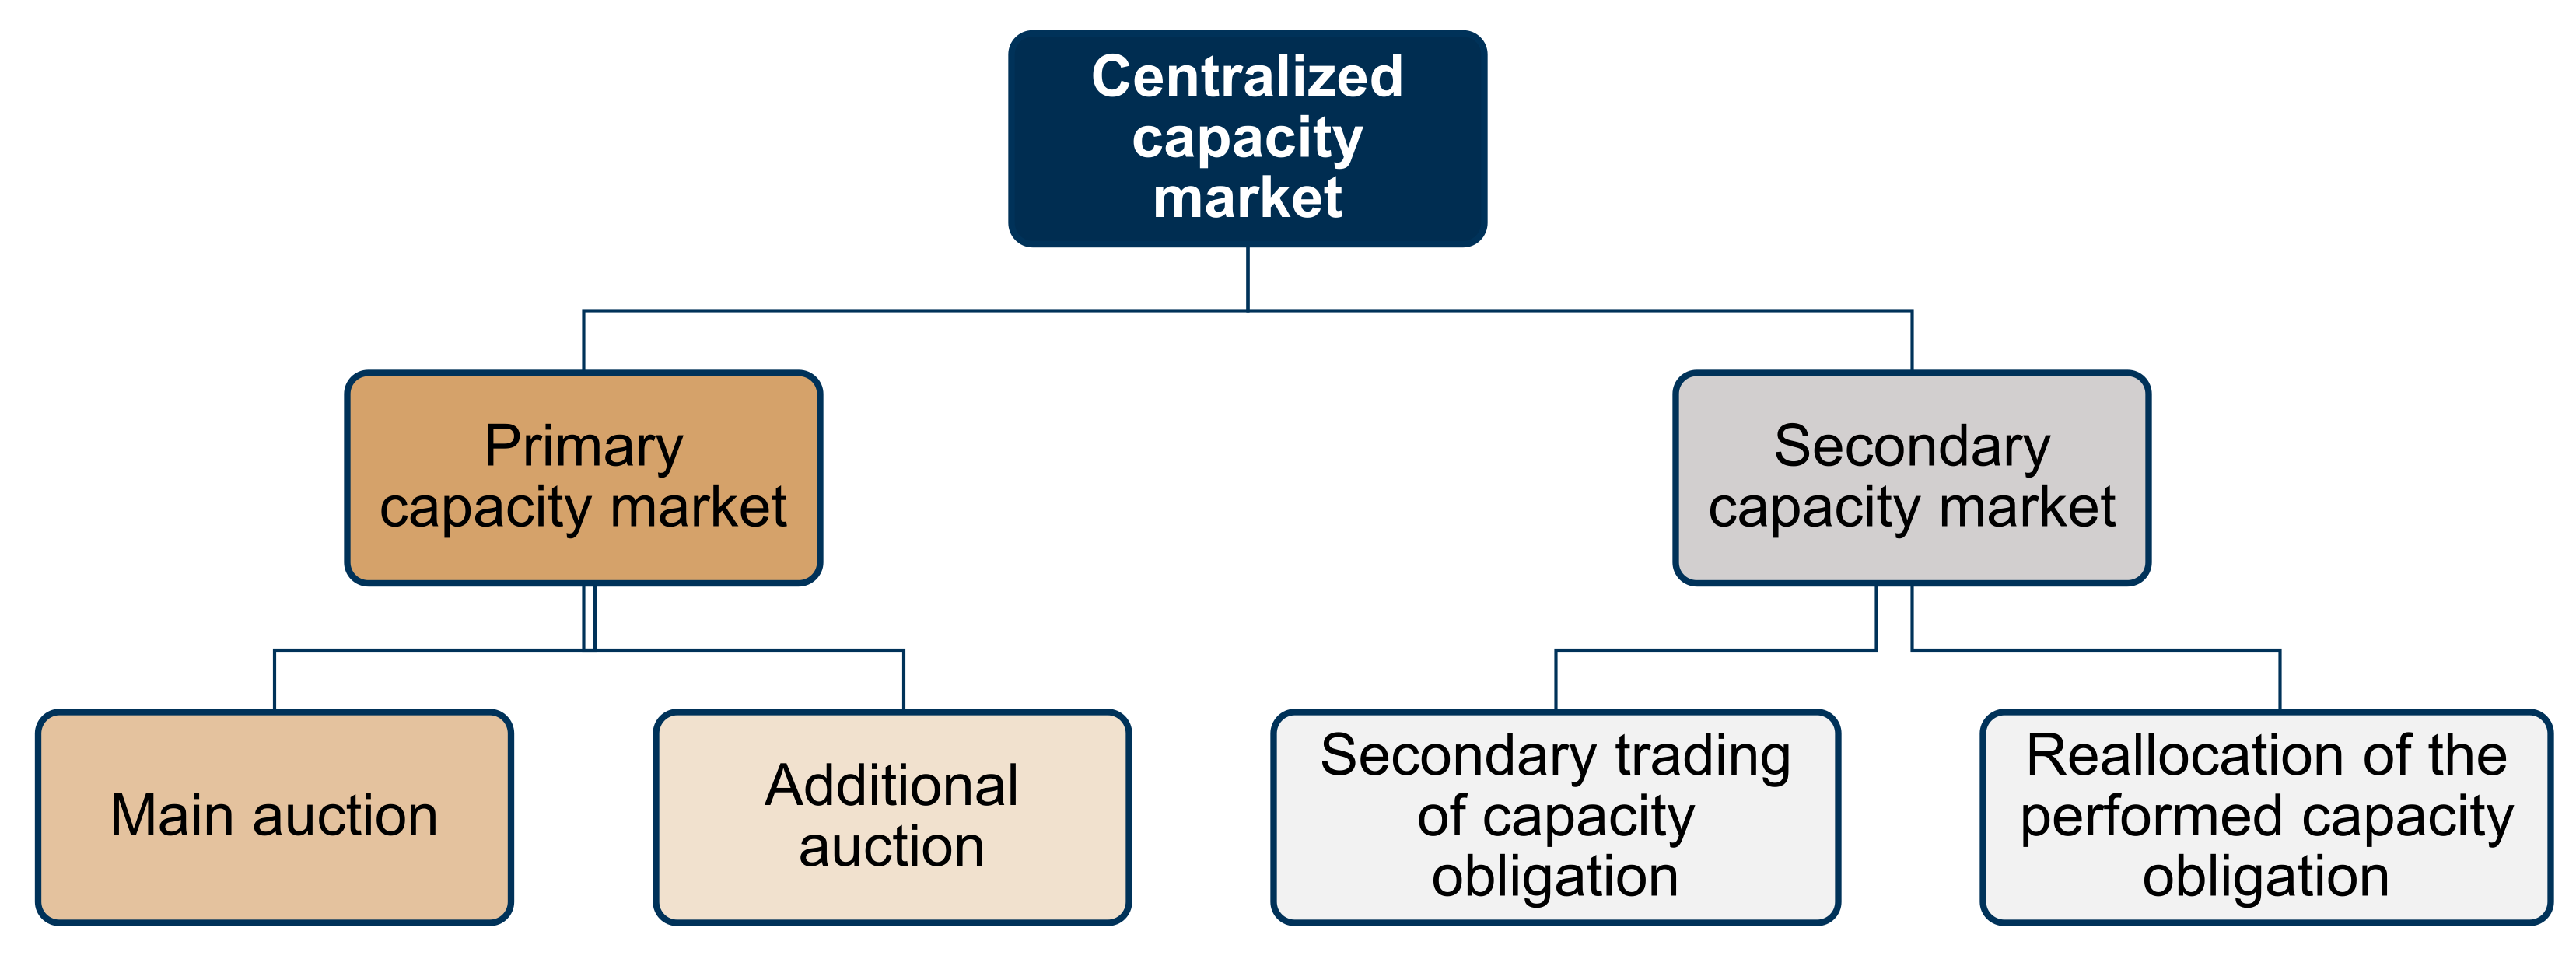
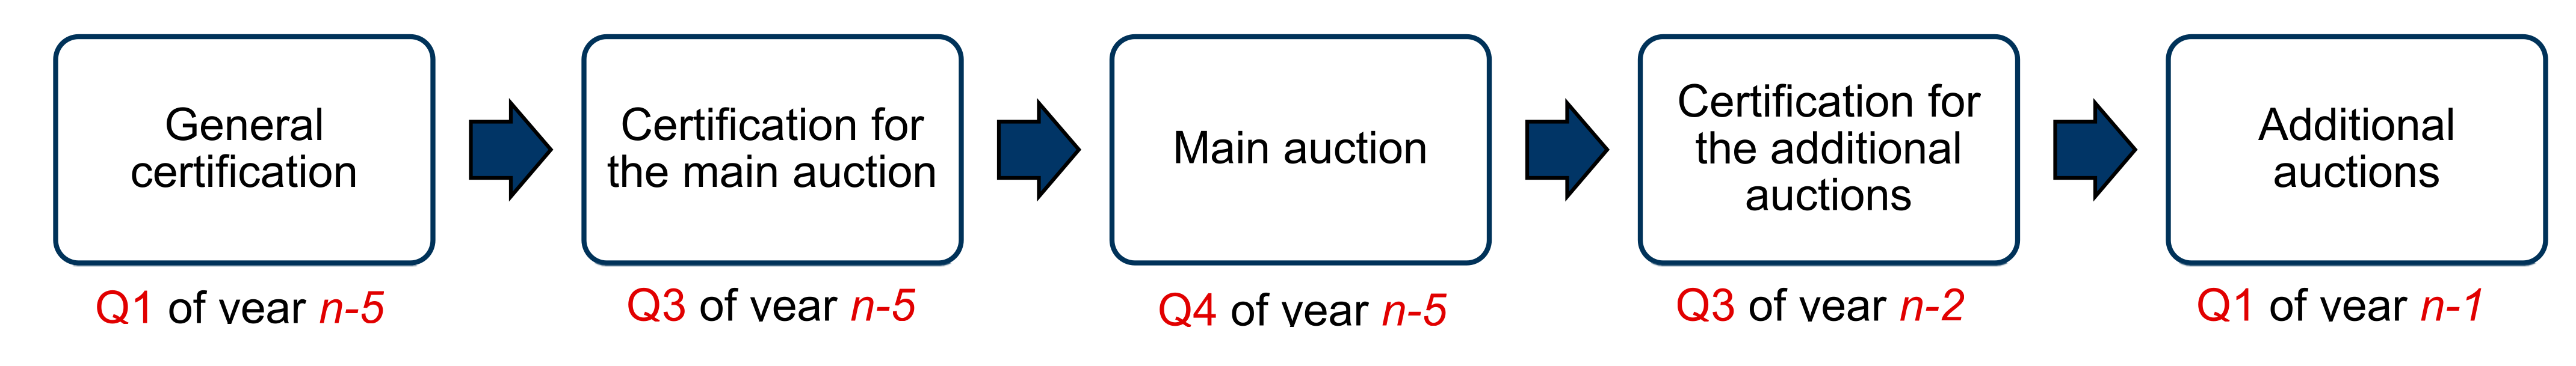
2.1. Capacity Market in Poland

Capacity remuneration mechanisms, including the capacity market, have been the subjects of numerous studies and publications [2,9,10,32,33]. Main conditions and principles regarding the centralized capacity market deployed in Poland under the act of 8 December 2017, Dz.U. 2018, item 9 [34] are presented in [18,29,30]. It needs to be highlighted that the capacity market deployment in Poland aimed to ensure middle- and long-term energy supply security that would be economically justified, nondiscriminatory, and respecting sustainable development principles.
According to the act, the capacity market deployed in Poland shall be technologically neutral and open for the existing, refurbishing, and new power generation units. Solutions stimulating the demand side’s participation are promoted. Foreign units are also allowed to participate in the capacity market.
On the Polish centralized capacity market, transactions are made at the primary and secondary capacity markets (Figure 1).
Owners of power generation assets are obliged to participate in a certification procedure. After positive verification and passing the certification procedure, they can participate in the capacity auction for a specified delivery year. Stages conducted within the national capacity market are presented in Figure 2.
In the Polish capacity mechanism, main auctions are held five years before a delivery period. An exception was 2018, when three auctions were held for the 2021, 2022, and 2023 delivery years. Additional auctions are held one year before a planned delivery period.
Capacity auctions held within the national capacity market are the descending clock auctions, that is, they consist of many rounds with decreasing prices [35]. In each round, a capacity provider offers a certified capacity obligation volume with a price equal [34] to:
  • Exit price (when during a given or previous round there was an exit bid submitted),
  • Starting price of another round (when a capacity provider did not bid an exit offer, and a given round is not the last round of the capacity auction) or
  • Minimal price 0.2 Euro cents/kW/month (when a capacity provider did not submit an exit bid and a given round is the last round of the capacity auction).
Length of capacity contracts depends on the unit type and scale of investment:
  • Existing and DSR units may sign contracts for one year,
  • Refurbishing and DSR units (after meeting a criterion of the minimal level of investment) may sign contracts for five years, or
  • New/planned units (after meeting a criterion of the minimal level of investment) may sign contracts for fifteen years.
Additionally, for high-efficiency cogeneration units, it is possible to extend the length of capacity contracts by two years (the so-called green bonus) in the case in which the units:
  • Have an individual CO2 emission factor lower than 450 kg CO2/MWh of produced energy, and
  • Sell at least half of produced heat to the heating network where hot water is a heat carrier.
A capacity auction ends in the round in which the total capacity obligation volume without exit bids is lower or equal to capacity demand, or in the case of finishing the last round. Consequently, capacity auctions are won by the capacity market units for which capacity providers offer the lowest price. An auction type is pay-as-clear that is expected to deliver lower prices than pay-as-bid auctions [36]. The costs of the capacity market are borne by the final consumers (mainly households and industry).

2.2. Method Applied

From the capacity market deployment in Poland from 2018 to October 2021, five main capacity auctions were held for delivery years 2021–2025. The analysis of the primary capacity market was conducted using the final results of the capacity auctions published by the President of the Energy Regulatory Office (ERO):
  • ERO President’s Announcement No. 99/2018 of the Final Results of the Capacity Auctions for the Delivery Year 2021.
  • ERO President’s Announcement No. 103/2018 of the Final Results of the Capacity Auctions for the Delivery Year 2022.
  • ERO President’s Announcement No. 14/2019 of the Final Results of the Capacity Auctions for the Delivery Year 2023.
  • ERO President’s Announcement No. 106/2019 of the Final Results of the Capacity Auctions for the Delivery Year 2024.
  • ERO President’s Announcement No. 2/2021 of the Final Results of the Capacity Auctions for the Delivery Year 2025.
The documents include capacity provider’s names, unit types, delivery periods, volumes of contracted capacity obligations, and the auction clearing price. Because of the lack of information directly identifying specific power generation units, technical parameters of existing, planned, and constructed power units were used.
The analysis concerns four types of capacity market units (CMUs):
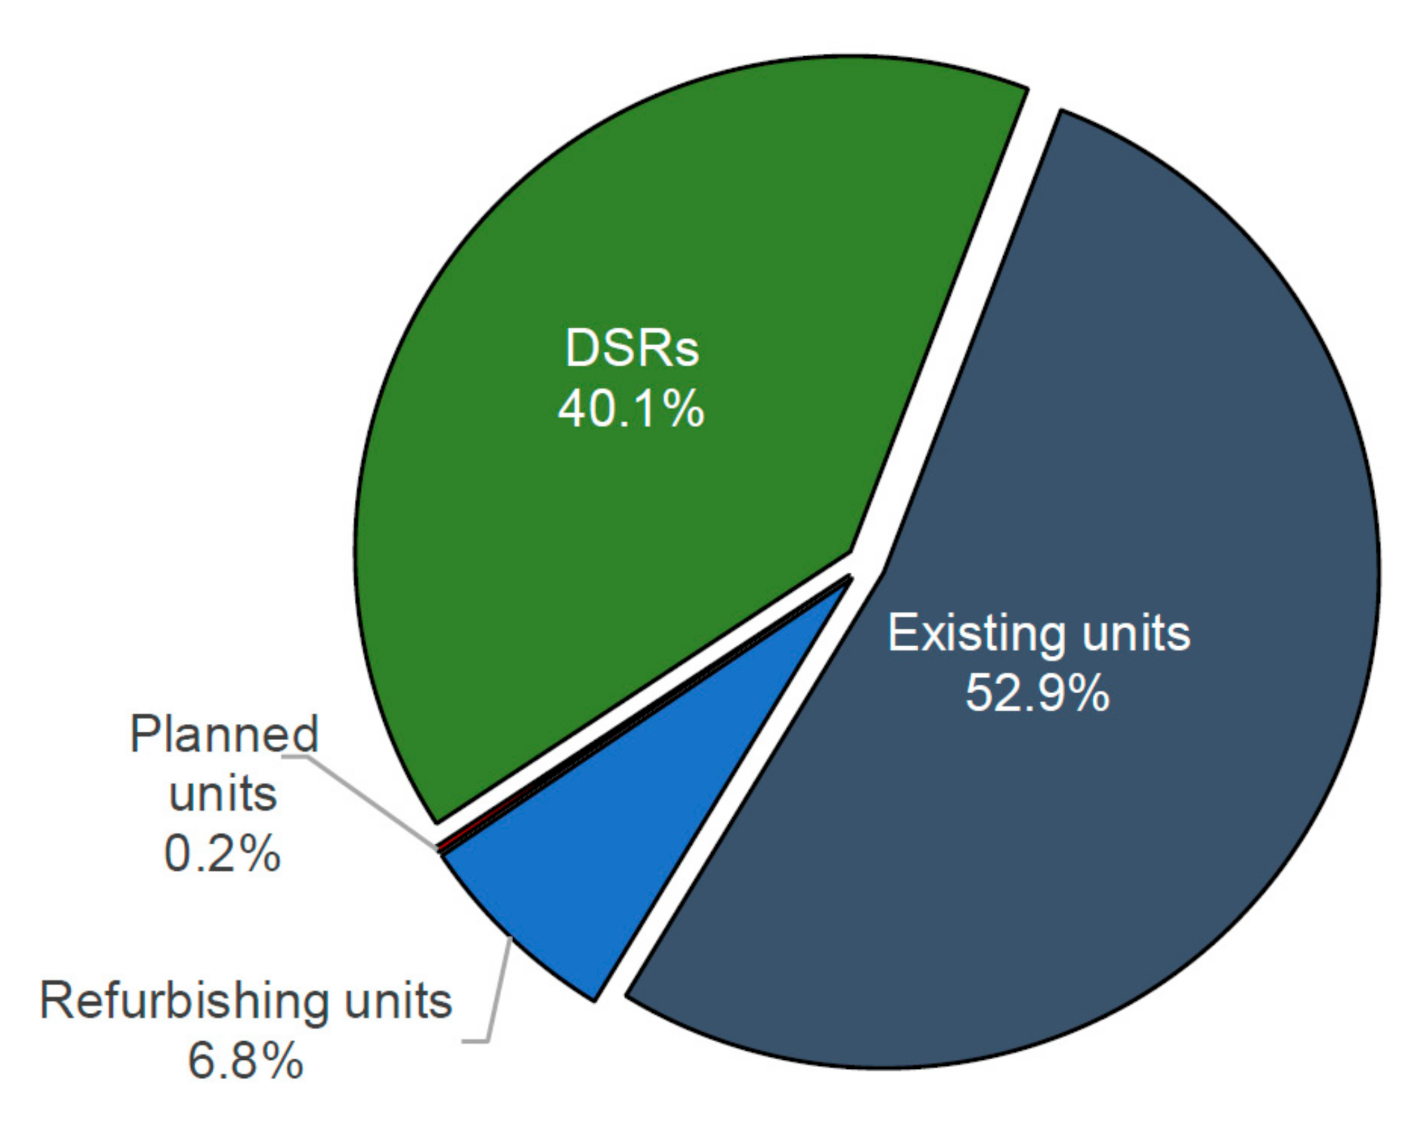
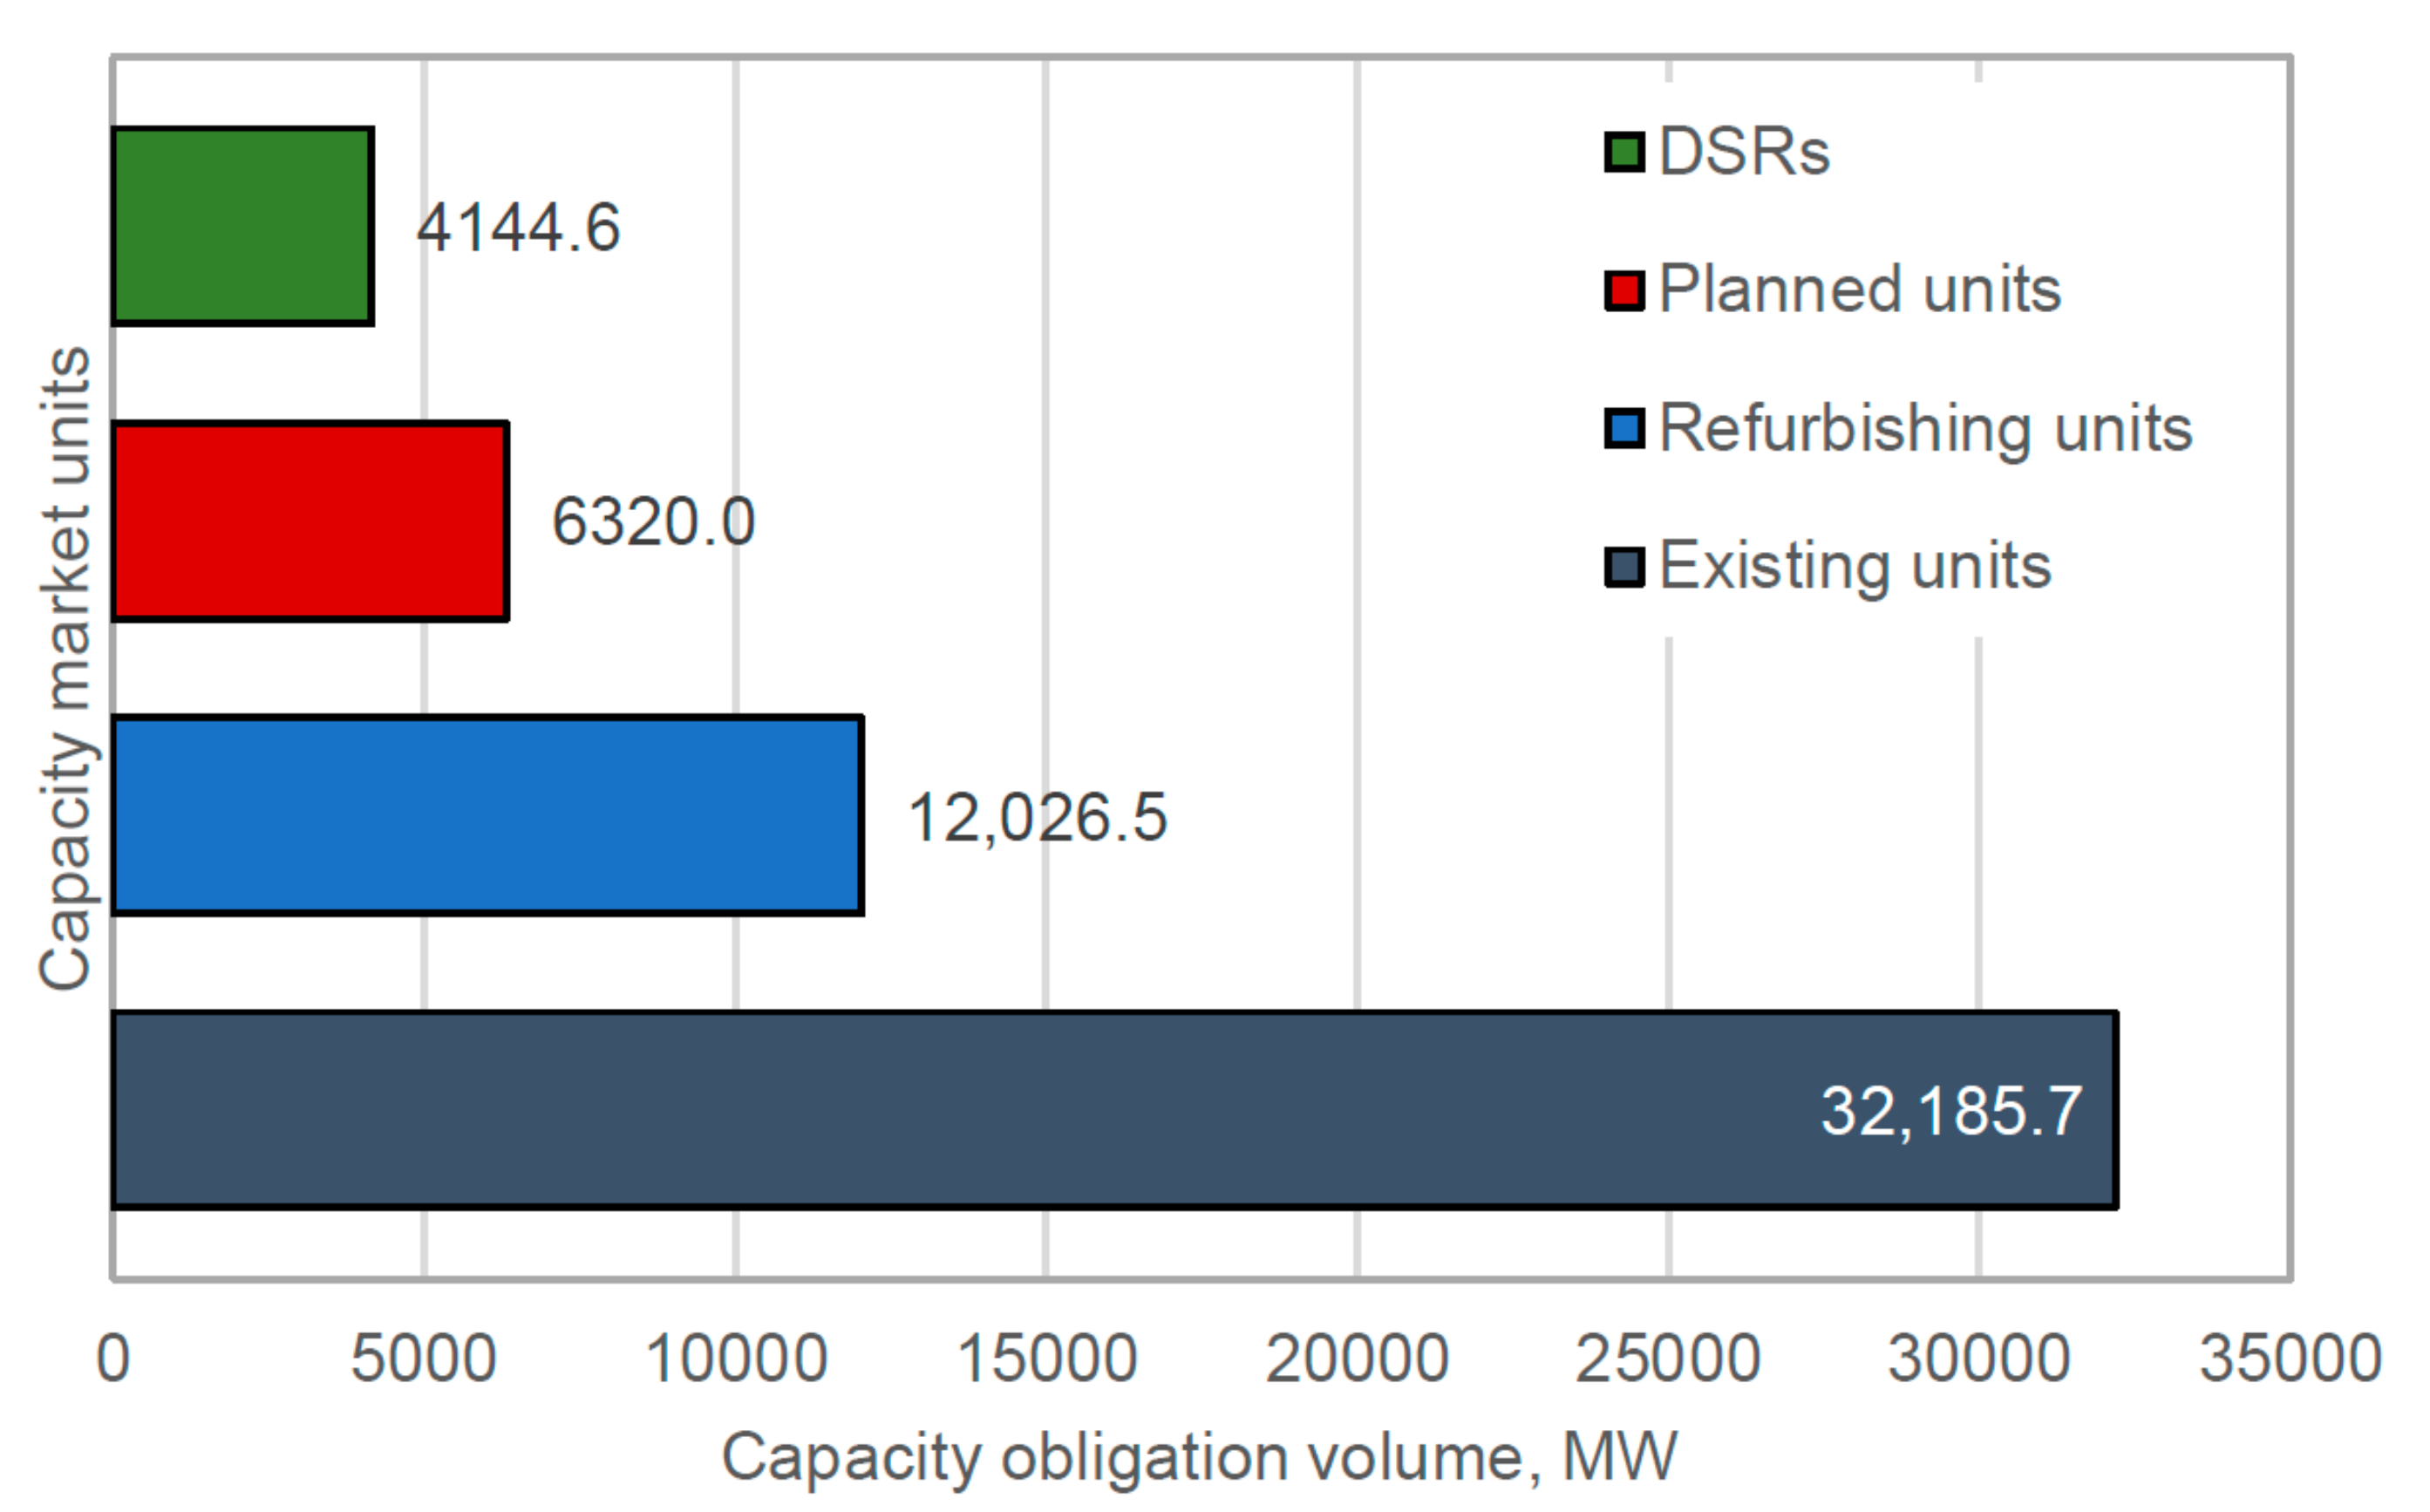
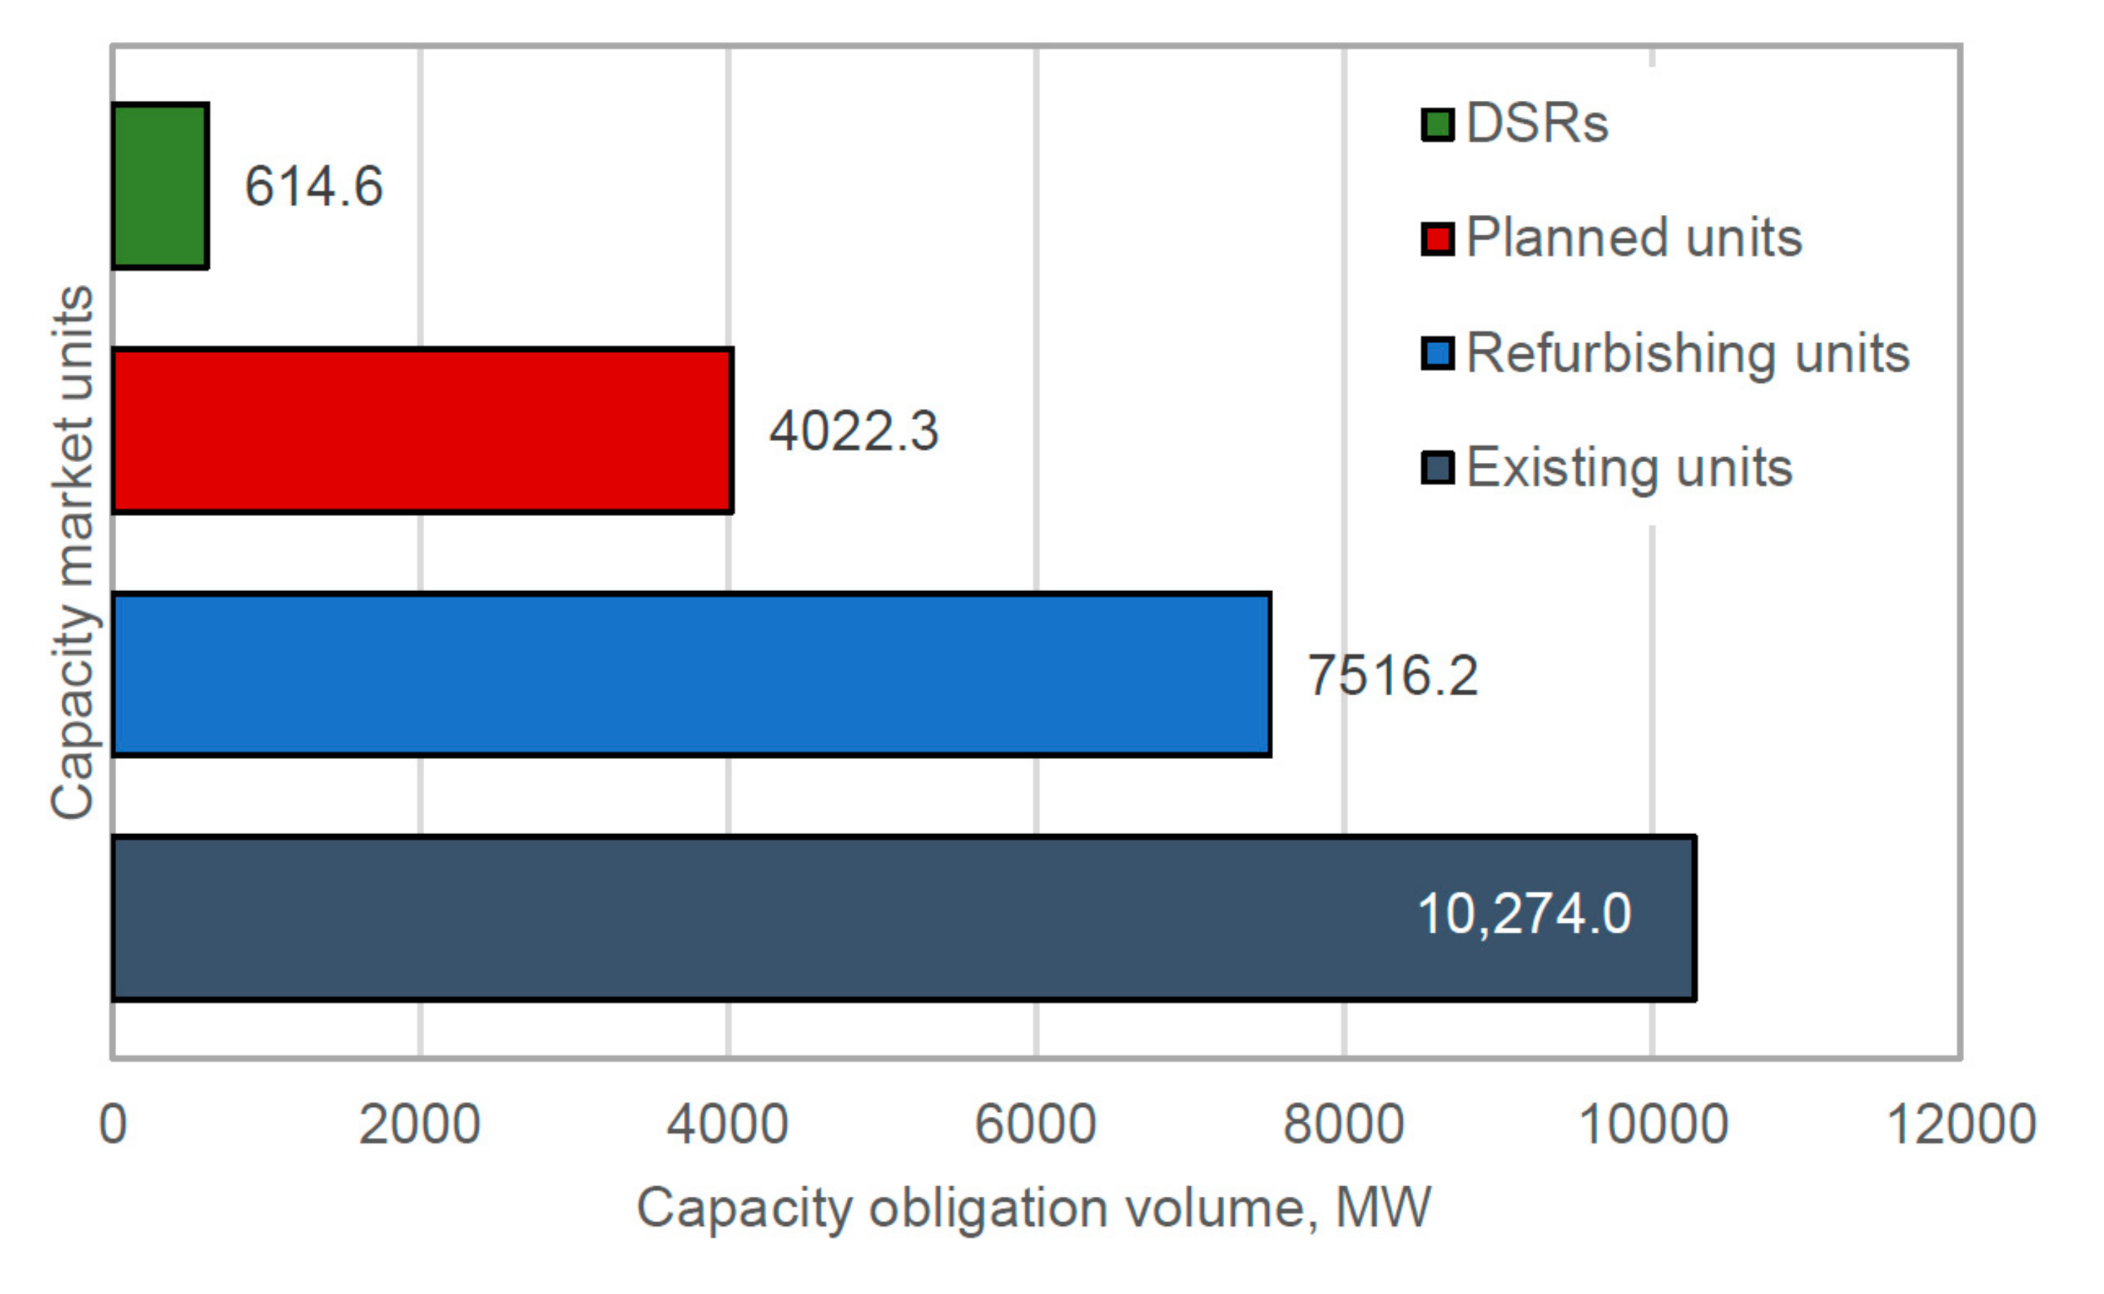
  • Existing units which include mainly conventional coal-fired, gas-fired, and hydro-pumped storage power plants.
  • Refurbishing units, which, in contrast to the existing units, need to declare minimal investments before the first delivery period given in the capacity agreement.
  • New/planned units, which include all units that had not been commissioned before the general certification to a given capacity auction and meet the minimal level of investment criterion.
  • Demand-side response units (DSRs) which consist of mainly planned demand-side response units.

3. Results

Results presented in this section are divided into a general overview and detailed discussion, the former consists of key data on the concluded capacity auctions while the latter presents results related to the types of capacity market units, separately for each auction and at the aggregated level.

3.1. General Results

Table 1 summarizes the results of the main auctions held for delivery years 2021–2025. The highest clearing price of 57.1 EUR/kW/year was noted during the main auction held for the 2024 delivery year. A high price (52.8 EUR/kW/year) was also achieved in the first capacity auction. Both are characterized by the highest volume of planned power units. Relatively low prices were noted on auctions for 2022 and 2023 delivery years. These auctions were characterized by low or close to none contracted capacity volumes for new/planned units.

3.2. Detailed Analysis of Capacity Auctions: New vs. Refurbishing vs. Existing vs. DSR Units

In this subsection, the results of each capacity auction are analyzed first, and then the aggregated results are discussed and summarized.

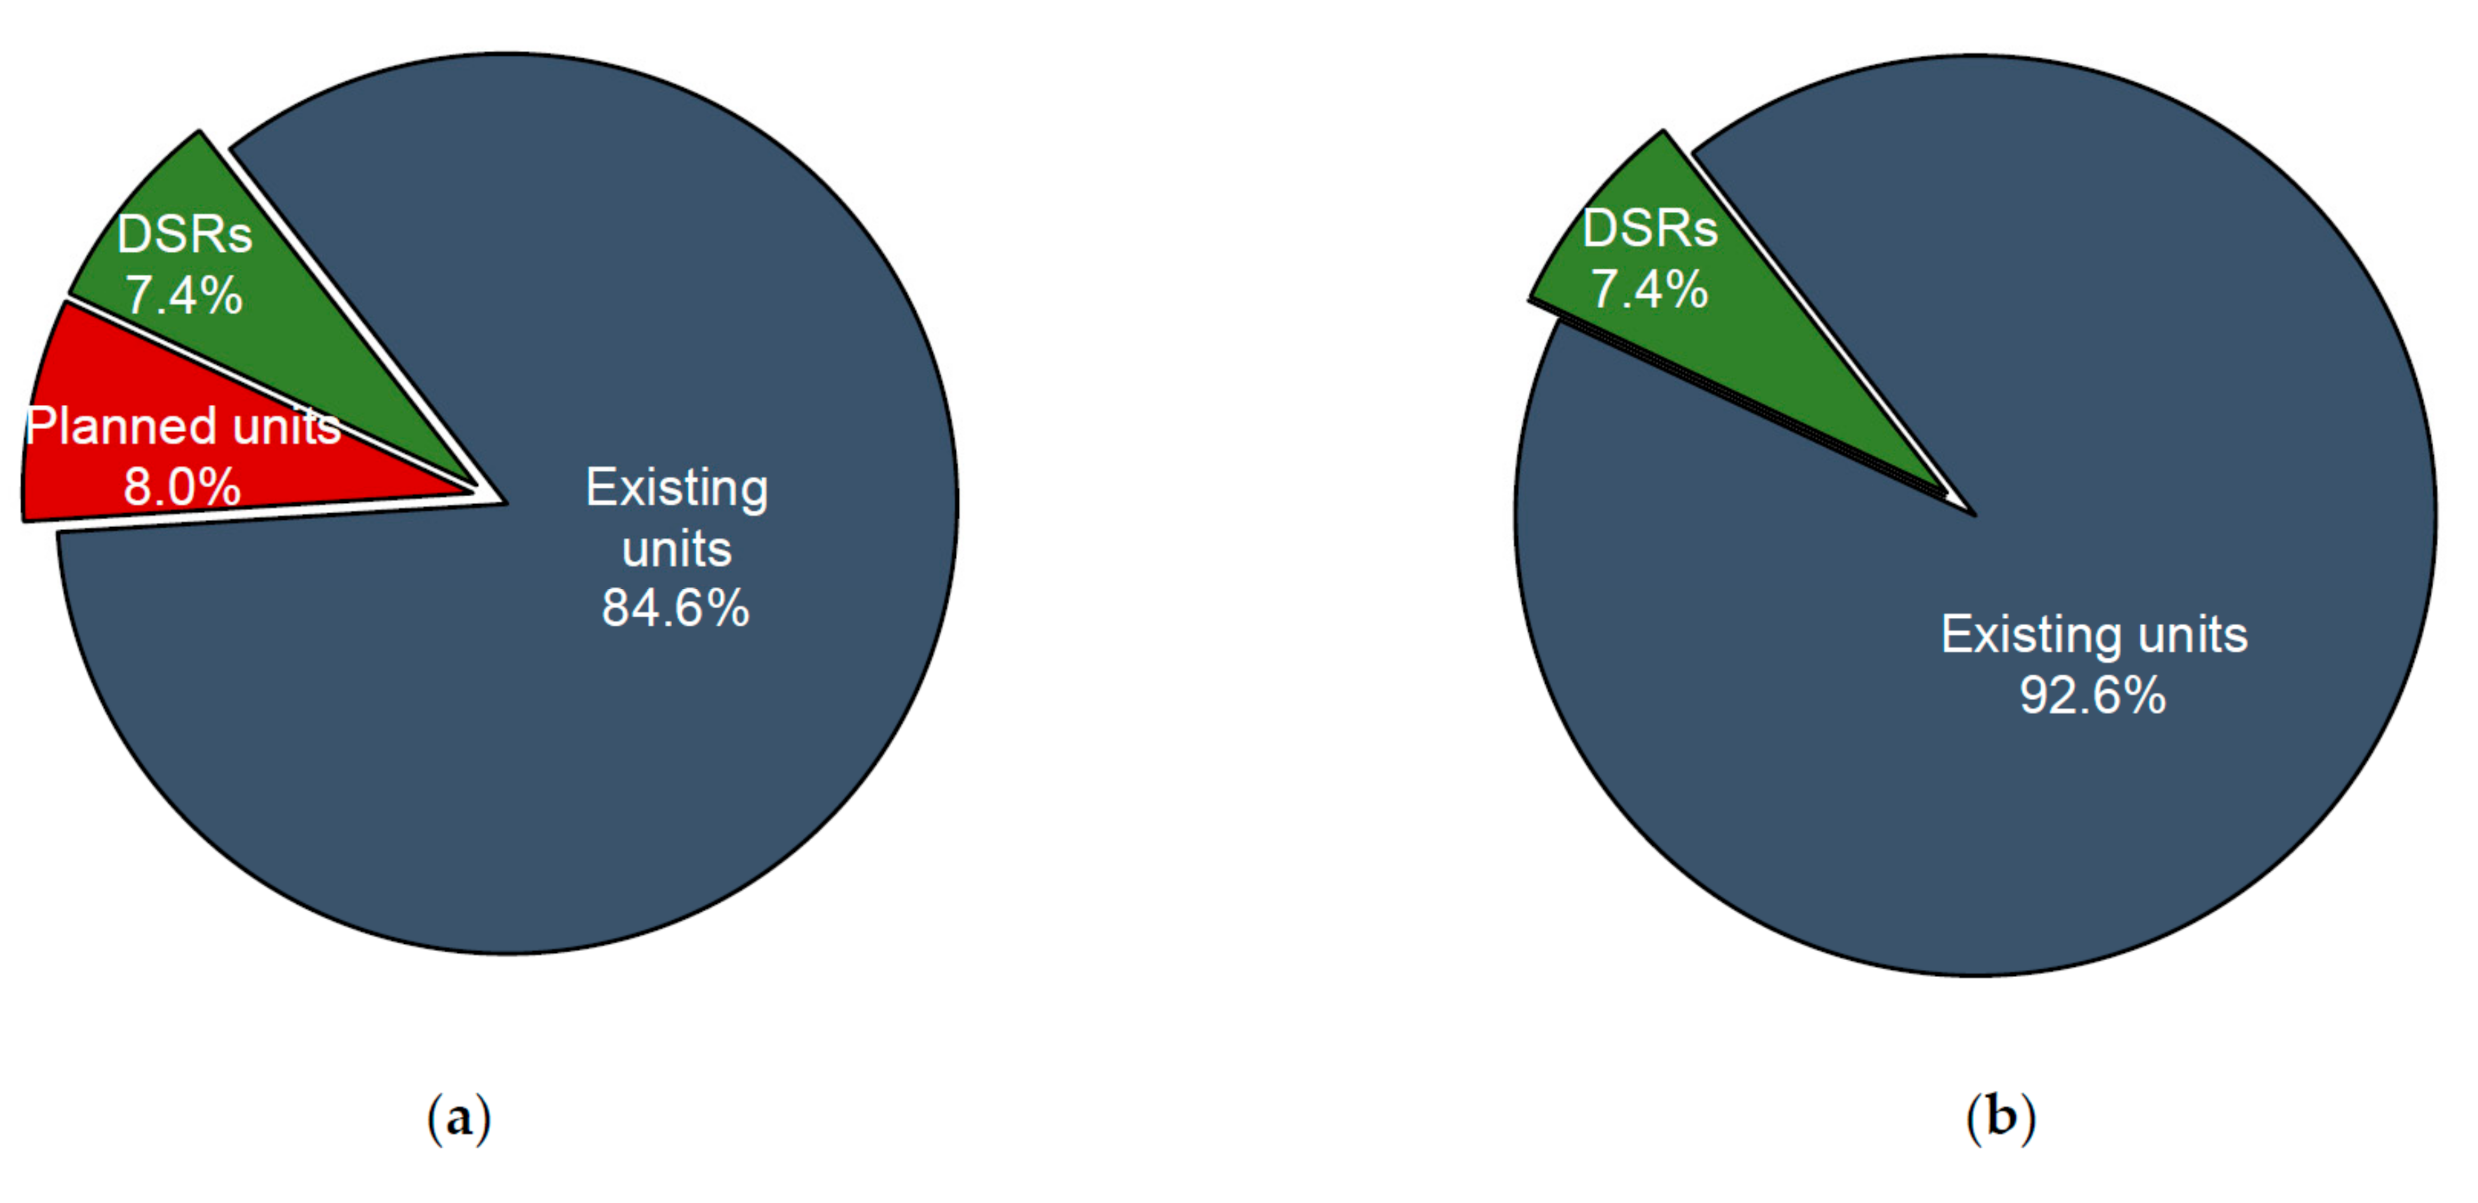
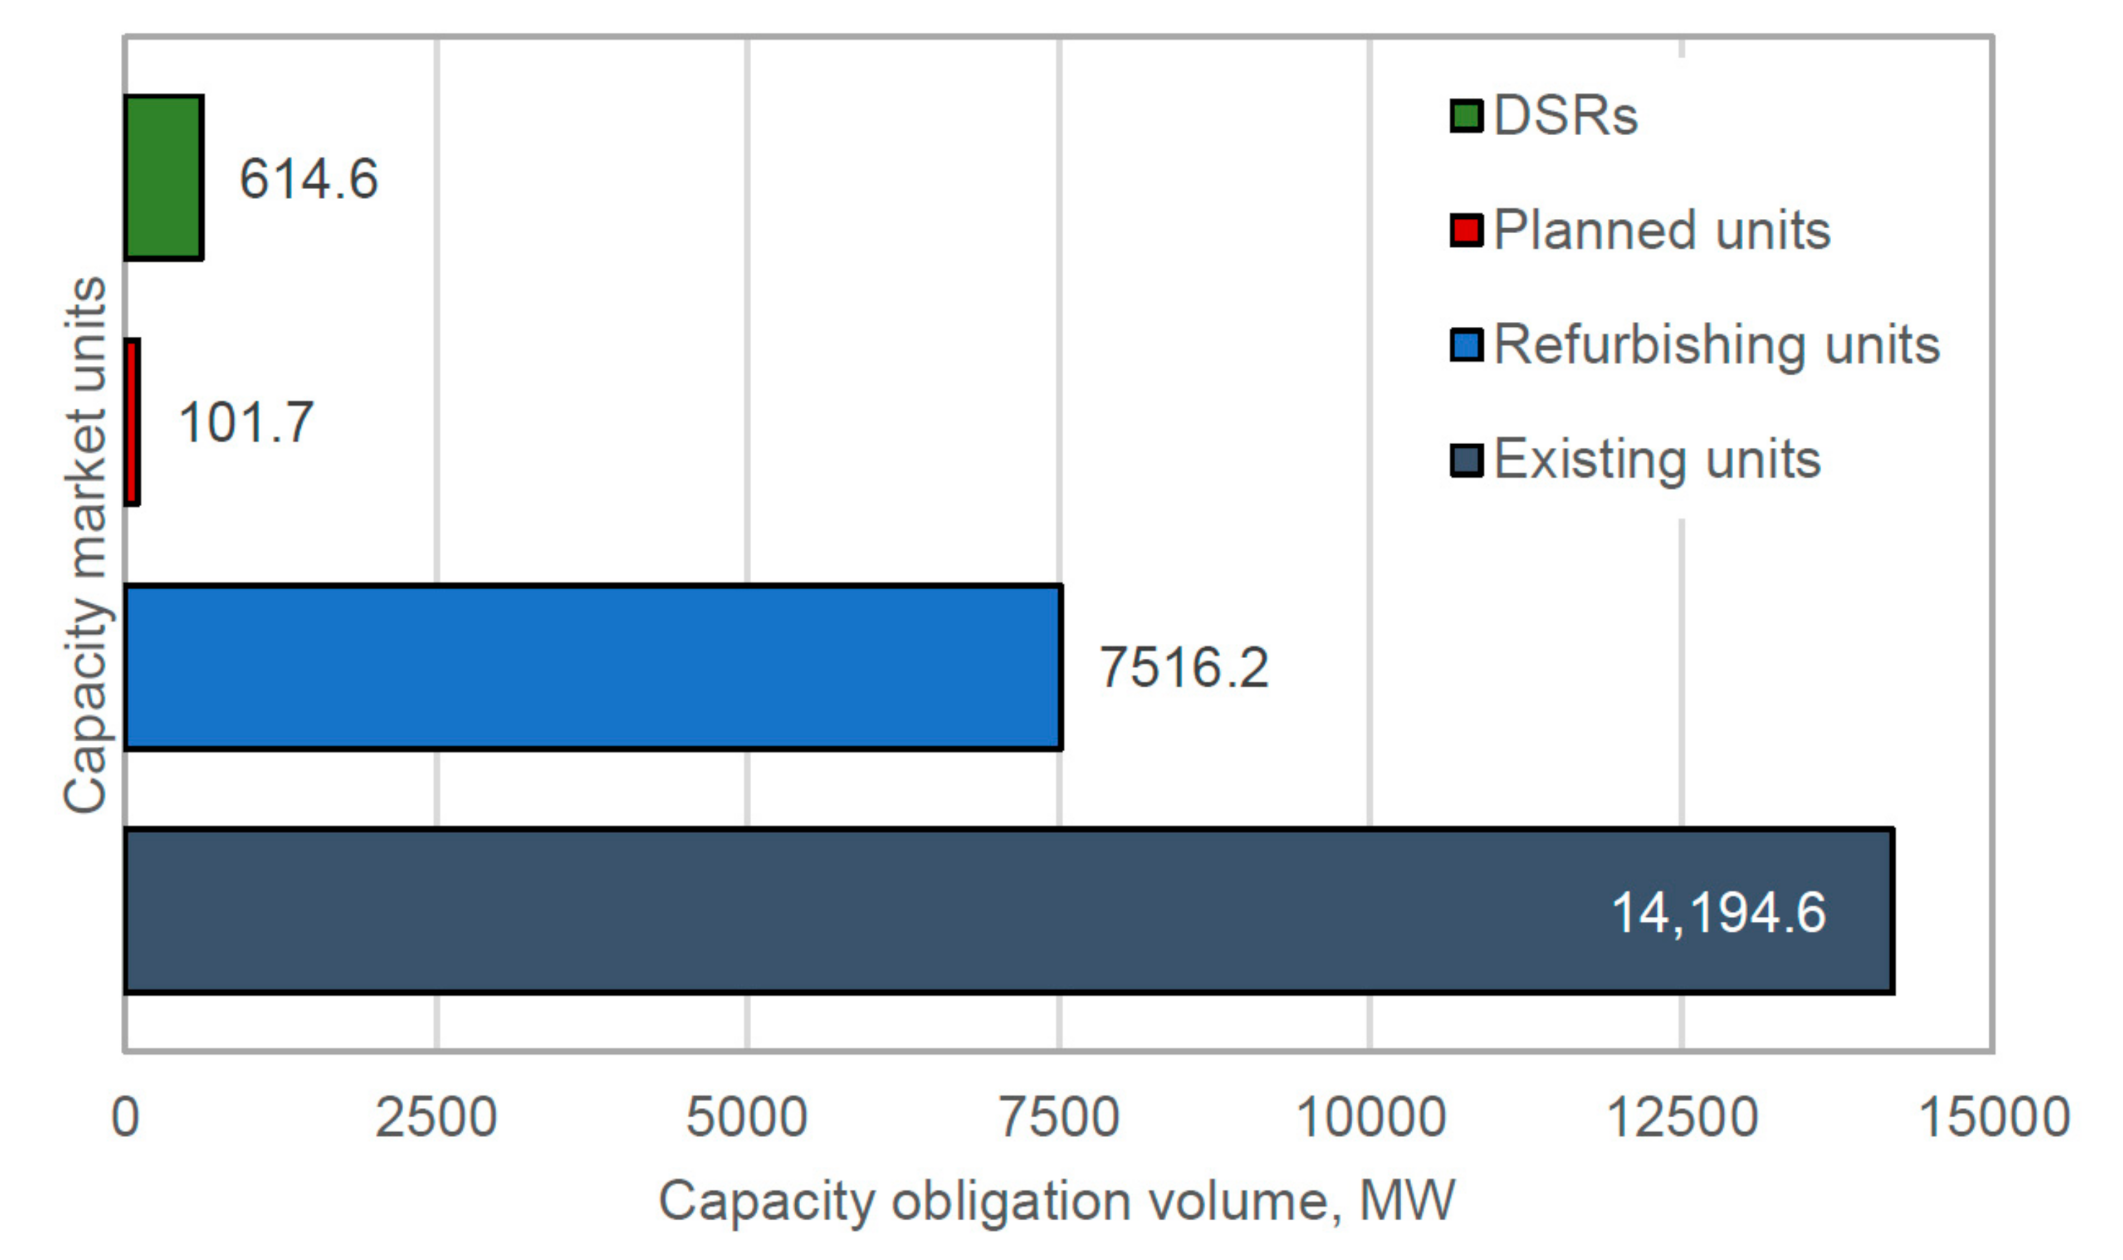
3.2.1. Main Capacity Auction for 2021 Delivery Year

Figure 3 presents the volume of capacity obligations contracted in the first capacity auction (for the 2021 delivery year). The chart shows that the capacity market supported the existing units with more than 10 thousand MW while the refurbishing ones with over 7.5 thousand MW. Units declared as planned contracted over 4 thousand MW in total. Nevertheless, the detailed analysis of the auction results offers a different conclusion. As previously indicated in the Polish capacity market principles description, the planned units include all units that passed the certification on participating in the capacity market but were not commissioned before the general certification for a given capacity auction. Given this, in the first capacity auction, power plants and combined heat and power plants (CHPs), for which investment decisions and construction itself had been initiated before adopting the Polish Act on the Capacity Market (in most cases, even several years earlier), were qualified as the planned units.
Among the largest planned units that have made capacity agreements there can be indicated new generation units in coal-fired power plants in Opole (2 units, 900 MW each), Jaworzno (910 MW), Turów (496 MW), and gas-fired power generation units in CHPs in Stalowa Wola (450 MW), Płock (630 MW), and Żerań (499 MW).
The contract for building new hard coal-fired units in the power plant in Opole was signed at the beginning of 2014, and in the third quarter of 2018, 80 % of the investment was realized. The power plant case in Jaworzno was similar; the construction contract was signed in 2014, and in October 2018 (before the first main auction), reports stated 80% of investment completion. In 2014, other contracts were signed for building new units in the power plant in Turów and in the CHP in Płock. In the first case, the construction work was finished in November 2018, and the start-up phase began, while the gas unit in Płock was put into operation in June 2018 due to the shorter investment period. The construction of a combined cycle gas turbine (CCGT) unit in Stalowa Wola began at the end of 2012. Still, due to significant perturbations in the investment process, the commissioning occurred no sooner than September 2020. A delay was a matter of concern also for the CCGT unit investment in CHP in Żerań. Although the connection conditions of this investment were given in 2015 and the construction contract was signed in the third quarter of 2017, the unit was not commissioned in the assumed deadline, i.e., before the first delivery period given in the capacity agreement (2021).
Considering the described circumstances regarding the time of making investment decisions, beginning the construction of new units, and their advancement before the first capacity auction, it should be stated that the capacity mechanism operating in Poland was not a decisive factor for the realization of the new power generation units. That is why recognizing the investments within the category “capacity market’s planned units” may be misleading. Constructions of indicated units were not initiated due to the capacity market deployment.
The capacity obligation of planned units that were already under construction during the capacity market deployment in Poland (mainly at the very advanced stage of the investment) was over 3.9 thousand MW. In Figure 4, the volume of advanced projects was transferred to the existing units, which, after the change, accounts for more than 14 thousand MW. A comparison of the auction results for the 2021 delivery year (official vs. actual assignment) is well-presented in the chart with the percentage structure of contracts signed at the auction with a distinction into the types of capacity market units (Figure 5). The initial results (a) show that the planned units were almost 18% of the total volume contracted at the auction. However, after considering the proposed changes (b), the share of these units decreases to 0.4%. Simultaneously, the share of existing units increased from almost 46% (Figure 5a) to more than 63% (Figure 5b).

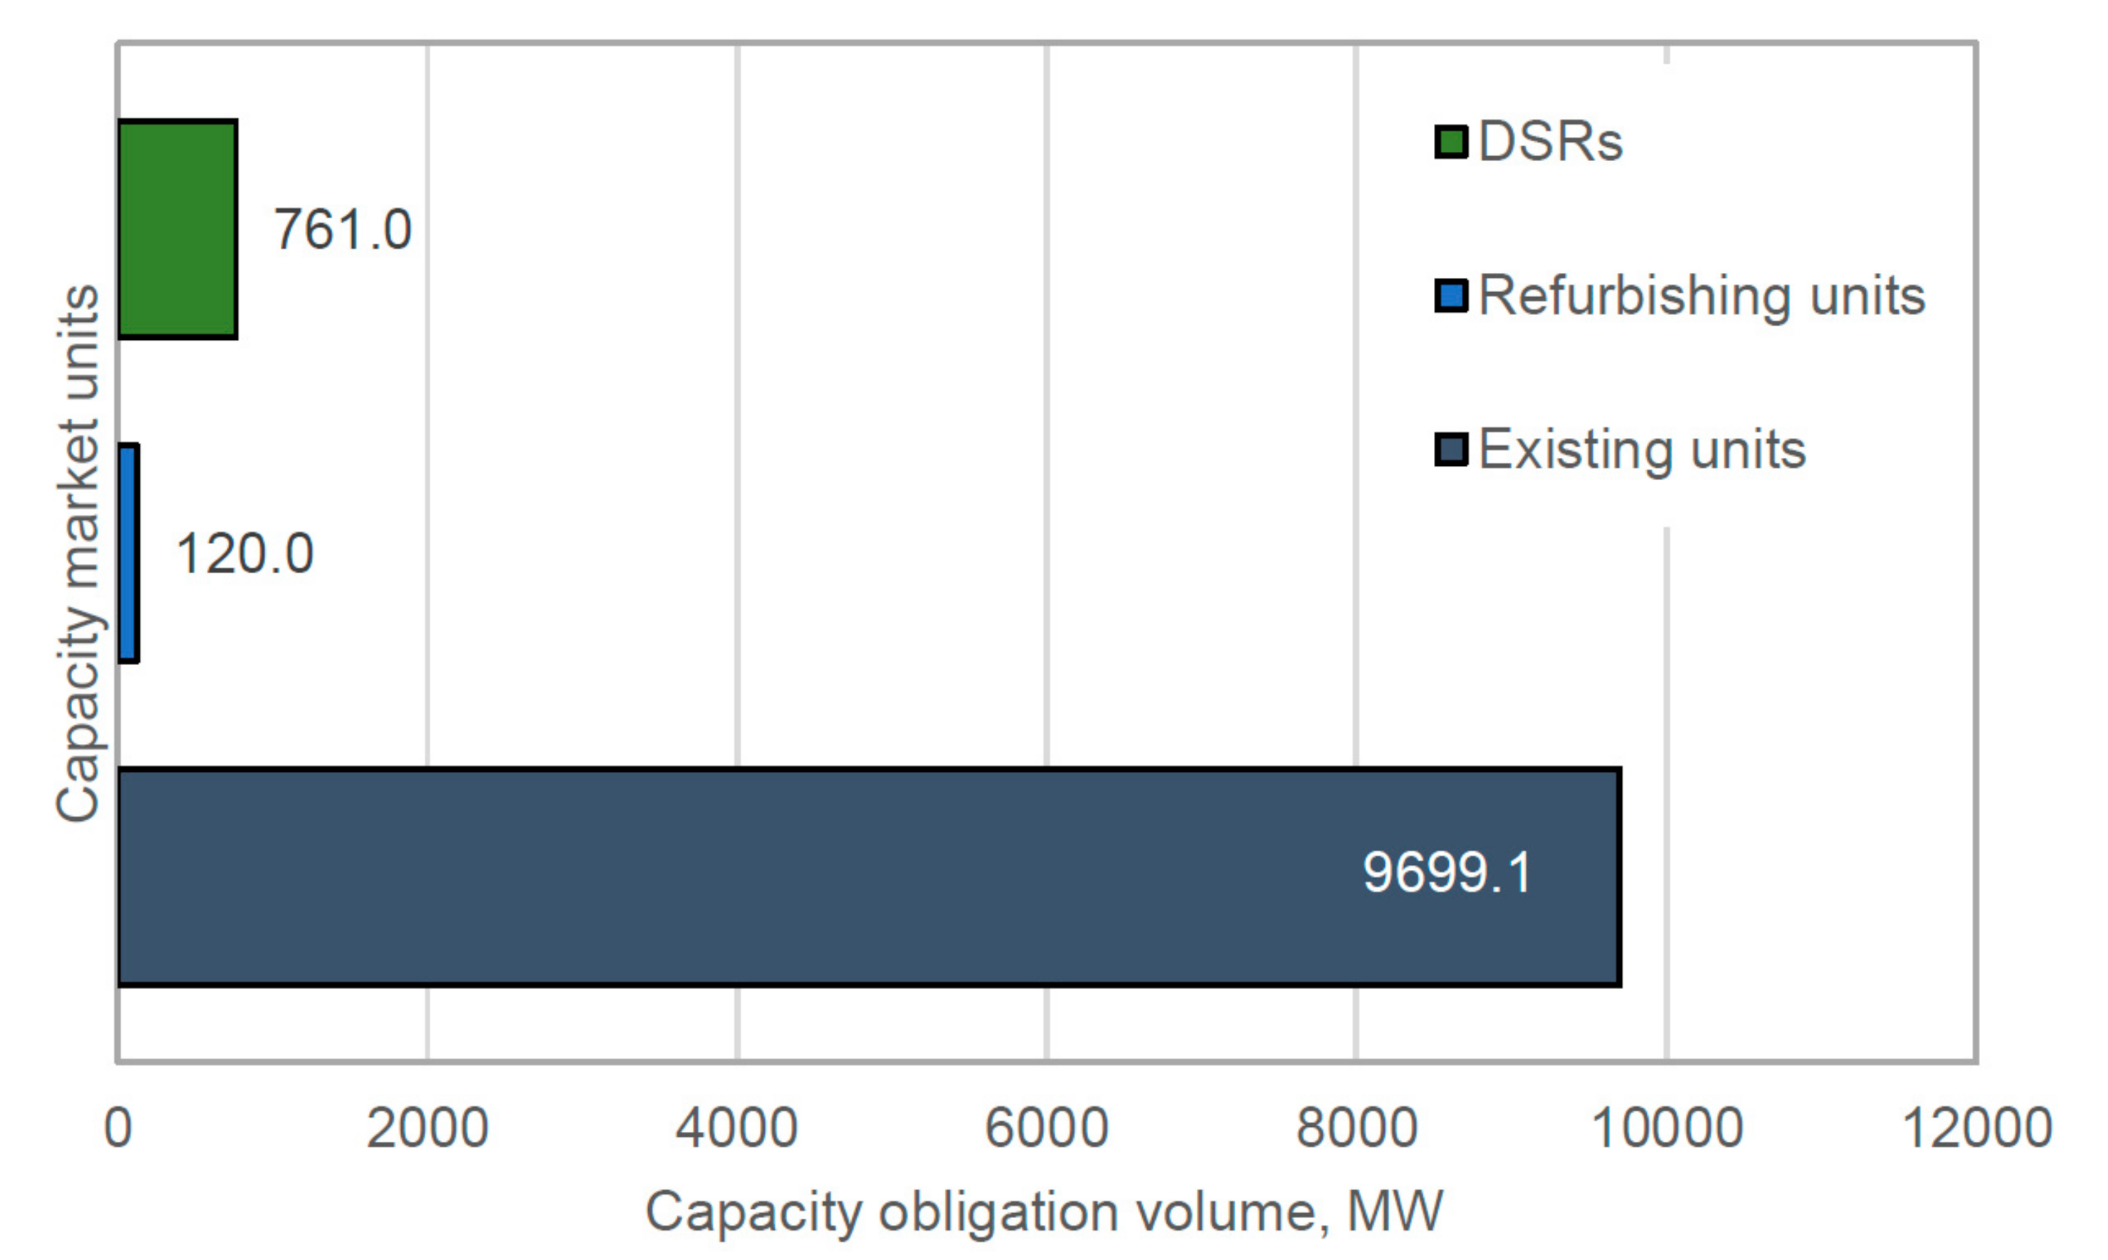
3.2.2. Main Capacity Auction for 2022 Delivery Year

In the case of the main auction for the 2022 delivery year, only the existing and refurbishing units signed capacity contracts for the total capacity obligation volume of over 9.8 thousand MW. DSR units also signed such contracts (761 MW) (Figure 6). It needs to be pointed out that the existing units were almost 92% of the total volume, DSRs were 7.2%, and the refurbishing units were slightly above 1% (Figure 7).

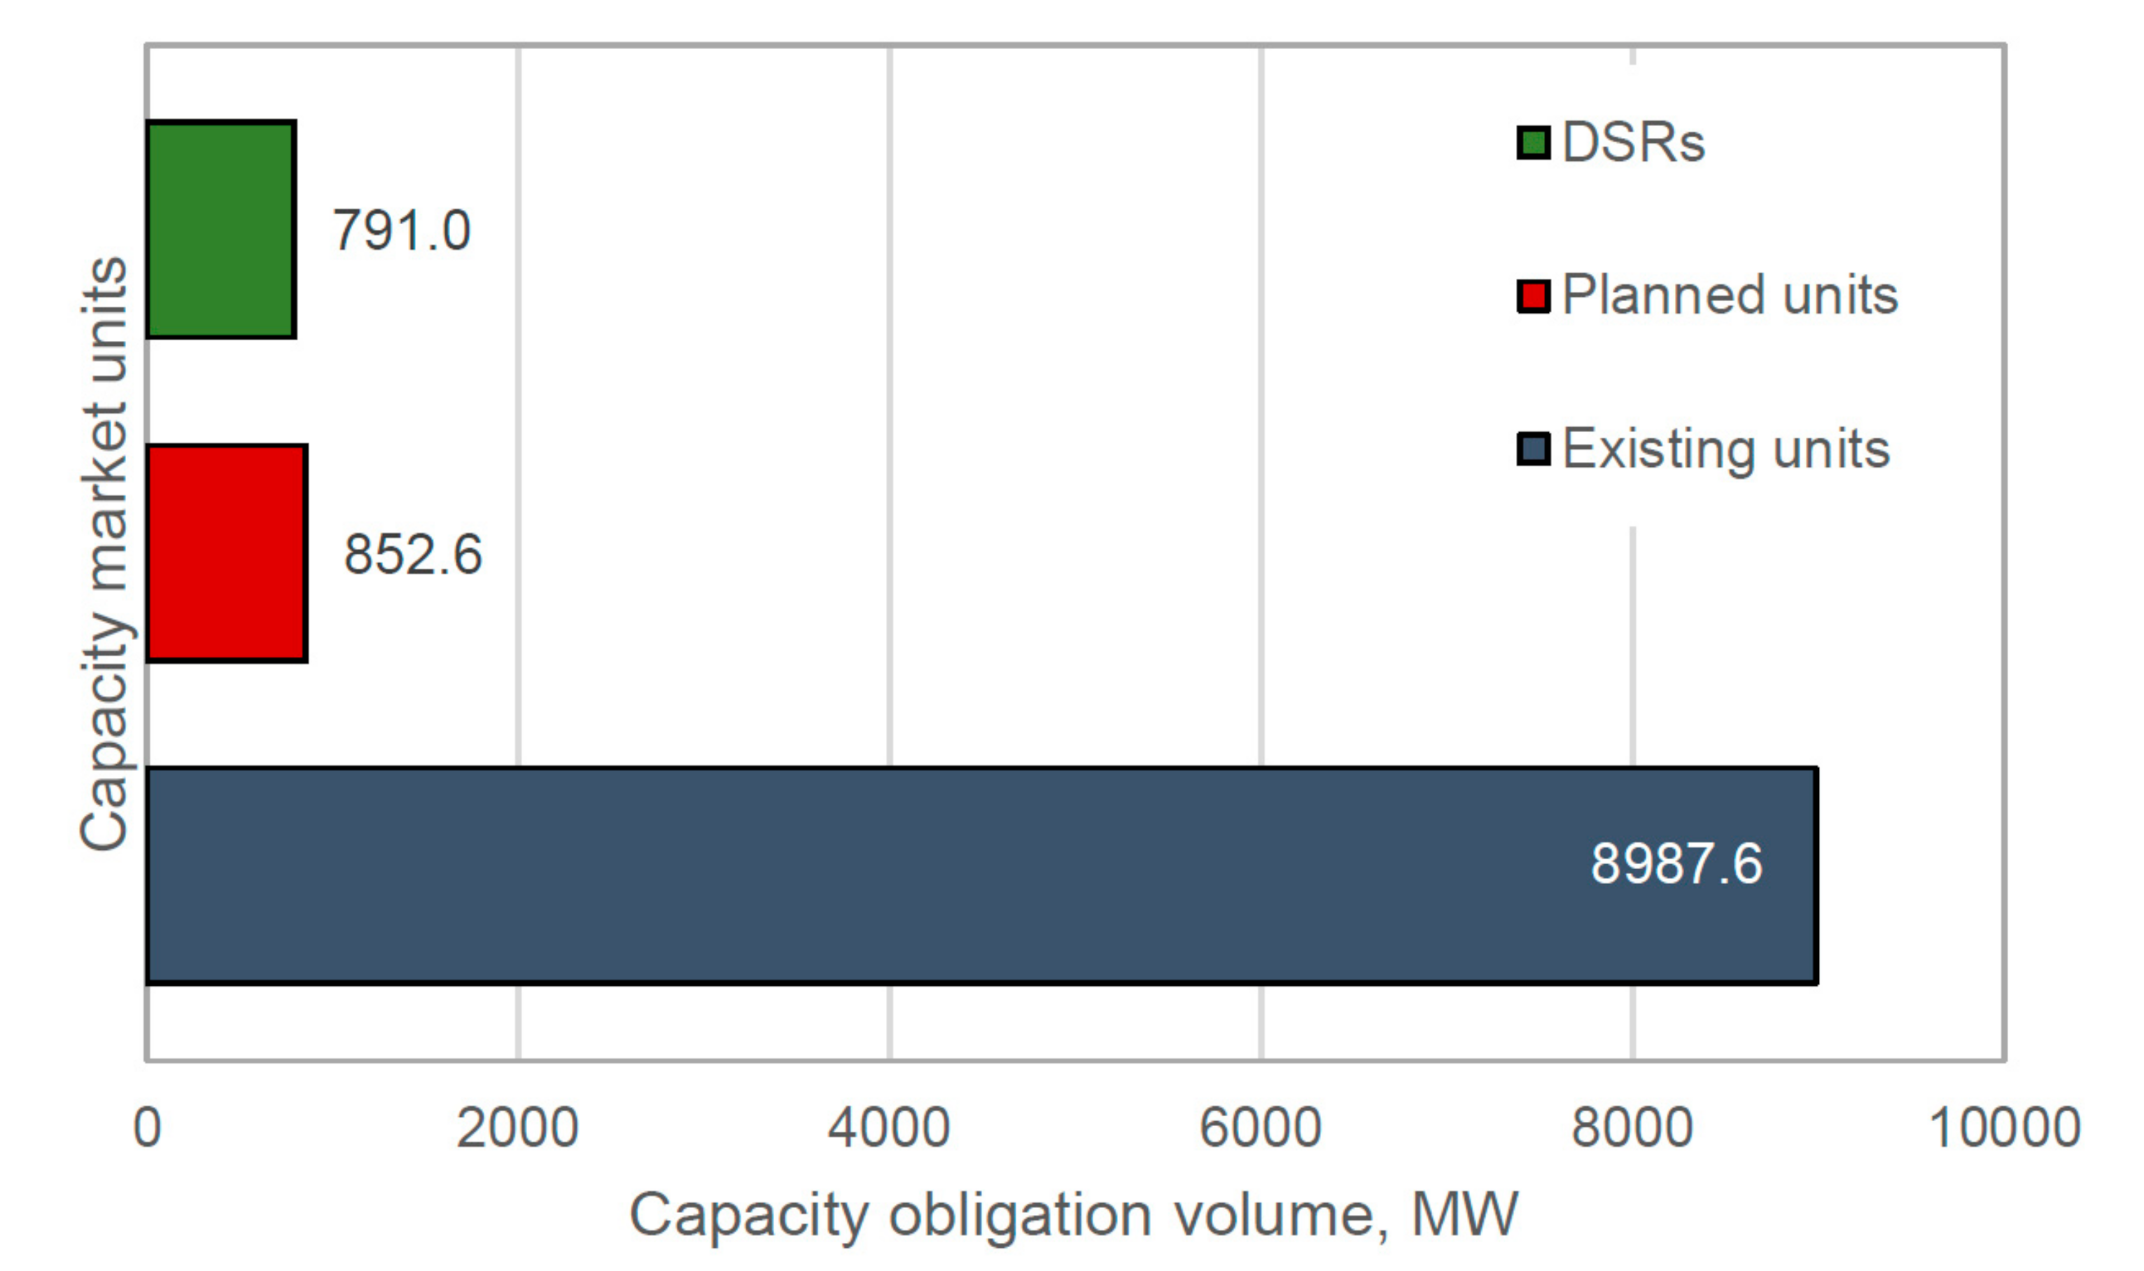
3.2.3. Main Capacity Auction for 2023 Delivery Year

The planned unit contracted the capacity obligation volume of 852.6 MW in the capacity auction for the 2023 delivery year (Figure 8). The highest volume of capacity obligations stipulated by capacity agreements were the existing units (almost 9 thousand MW). It needs to be noted that the decision to build that planned unit (a new coal-fired power generation unit in Ostrołęka with the capacity of 1000 MW) was made in 2016 (in the same year there was made another decision to sign a contract for fuel delivery). It means that also, in this case, the classification of the power unit to the new/planned category may be misleading. The structure of capacity contracts for the given types of CMUs, both the official (a) and actual assignments (b), are presented in Figure 9.
Analyzing the results, one should consider the current state of investment in the new unit in Ostrołęka. Due to high prices for CO2 emission allowances and the planned decarbonization of the Polish economy [42,43,44], the construction of this unit was withheld at the beginning of 2020. It was decided to partially dismantle already built structures and change the production technology, including the construction of the gas-fired unit. Until now (October 2021), there have been no final decisions in this matter.

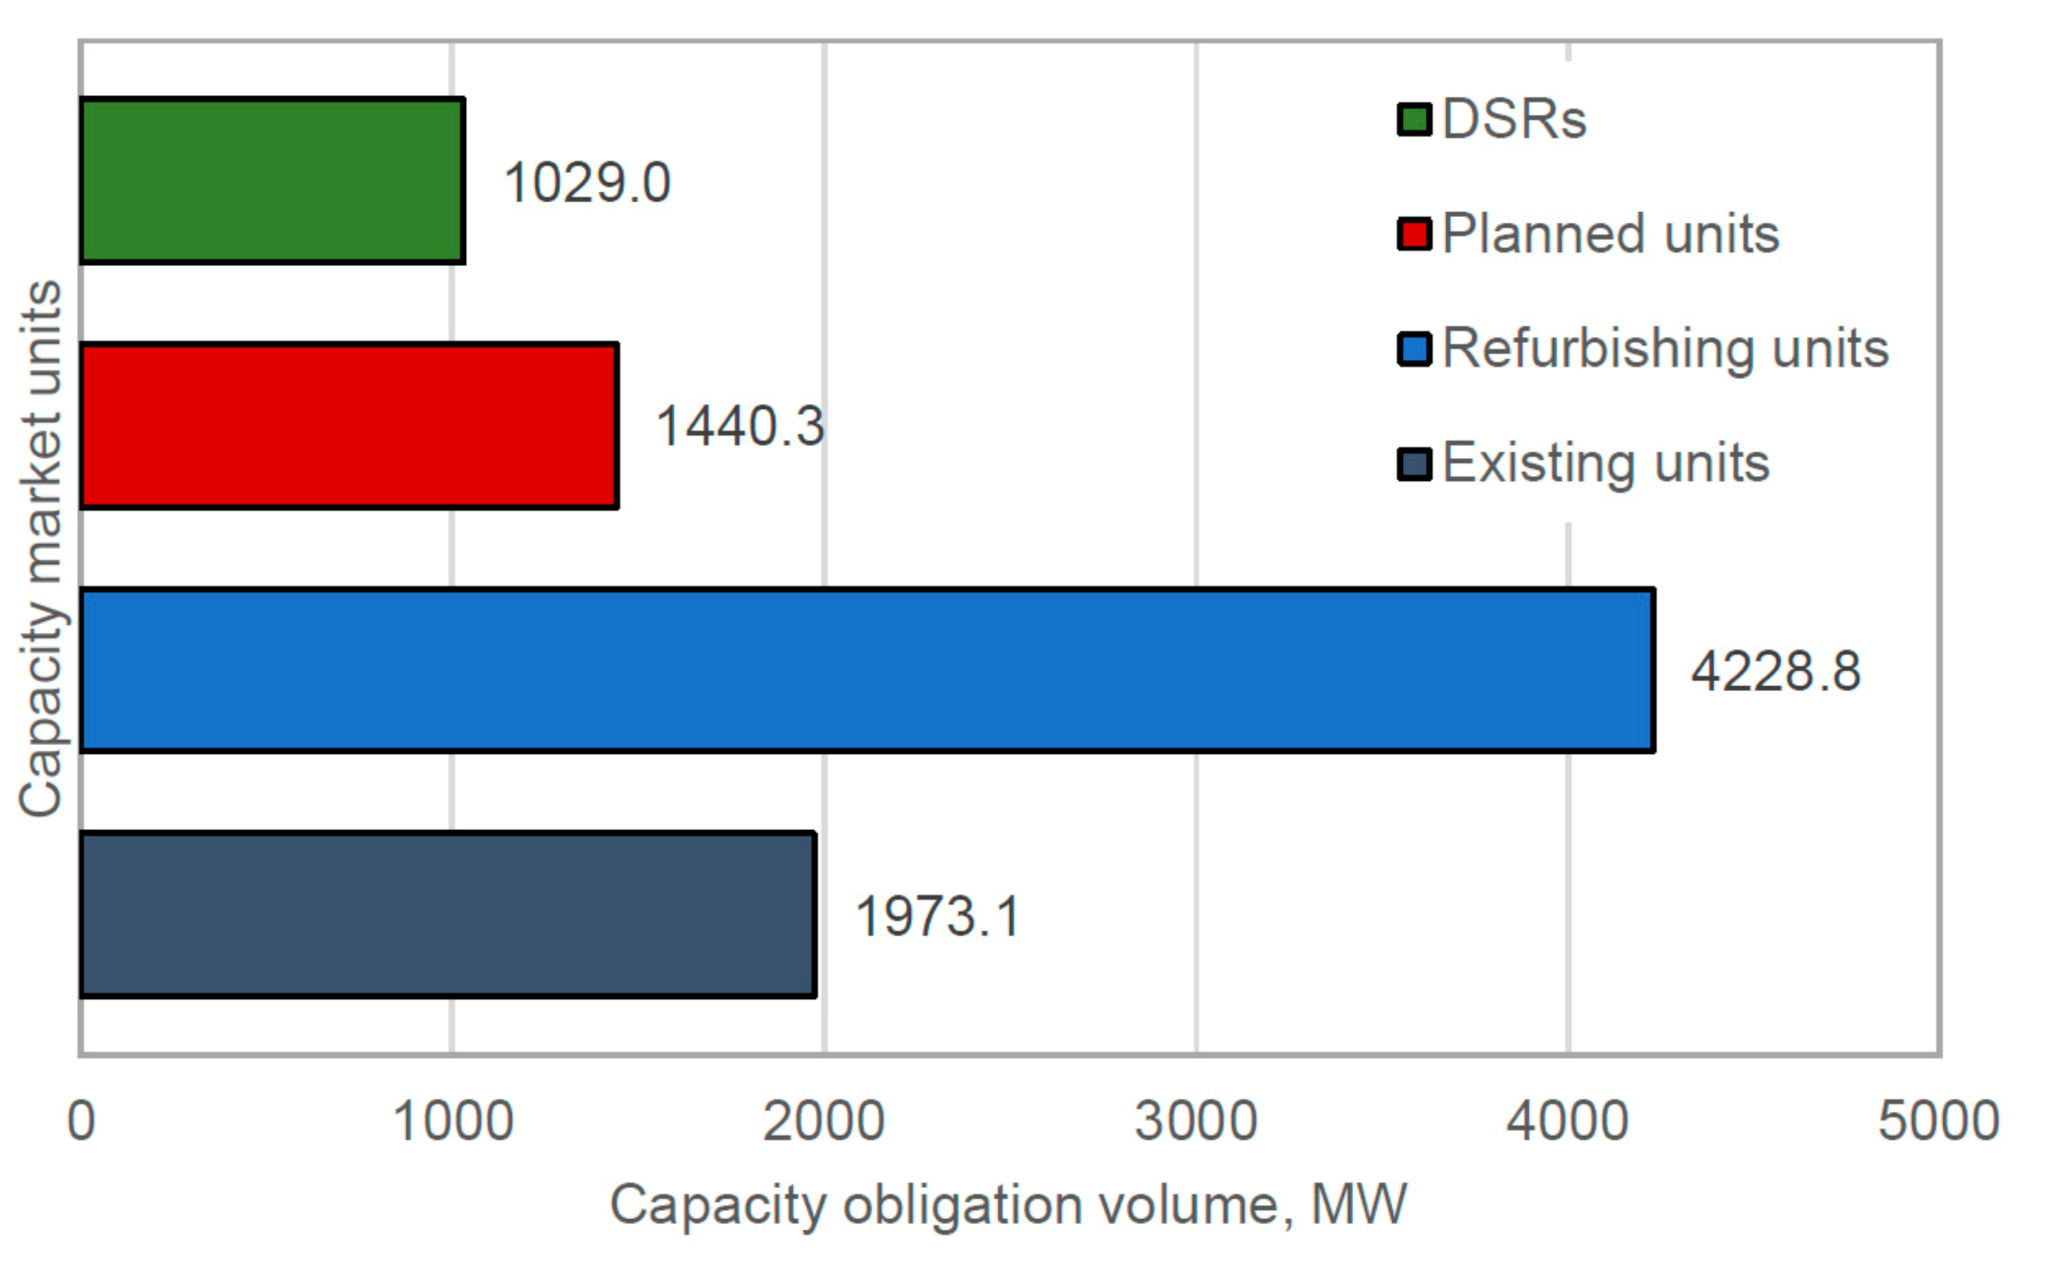
3.2.4. Main Capacity Auction for 2024 Delivery Year

The capacity market auctions for a delivery period 2021–2023 were held in the same year (2018) and preceded by the standard process of certifications for the auctions. Subsequent capacity auctions are held five years before a delivery year they concern. The auction results for the 2024 delivery year are different from the previous auctions, mainly due to regulations implemented by the Regulation (EU) 2019/943 of the European Parliament and the Council of 5 June 2019 on the Internal Market for Electricity [45]. According to the regulation, capacity remuneration mechanisms may concern only the units that meet the CO2 emission limit (550 kg CO2/MWh of produced electricity), which, in practice, eliminates coal-fired power plants and CHPs from participating in the primary capacity market. The regulations concern all new units that have begun operation after 4 July 2019 and set a deadline for supporting the existing units, i.e., put into operation before 4 July 2019, for 1 July 2025. It means that the auction for the 2024 delivery year was the last on which the existing power generation units could sign a long-term capacity contract for the refurbishing capacity market units.
Given that situation, the highest contracted capacity obligation volume was for the refurbishing units–over 4.2 thousand MW (Figure 10), almost 49% of all contracts (Figure 11). The existing units came second (22.7%) with a volume of nearly 2.0 thousand MW. Moreover, 1.4 thousand MW were contracted for the planned units (16.5%; four gas-fired power units in total) and over 1000 MW for the DSRs (11.9%).

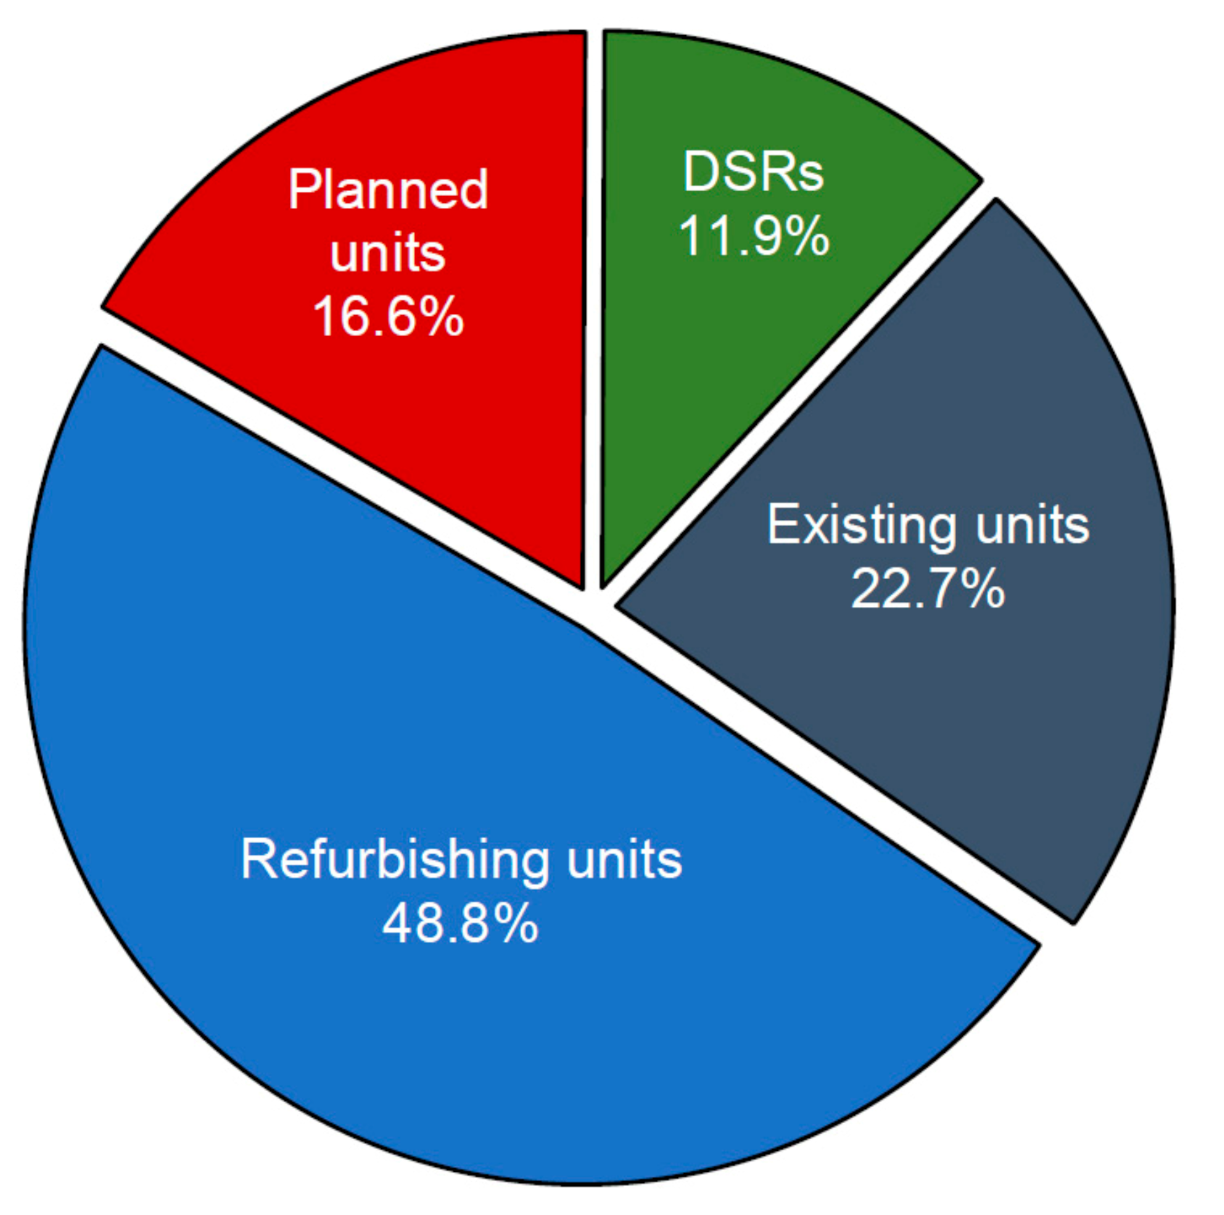
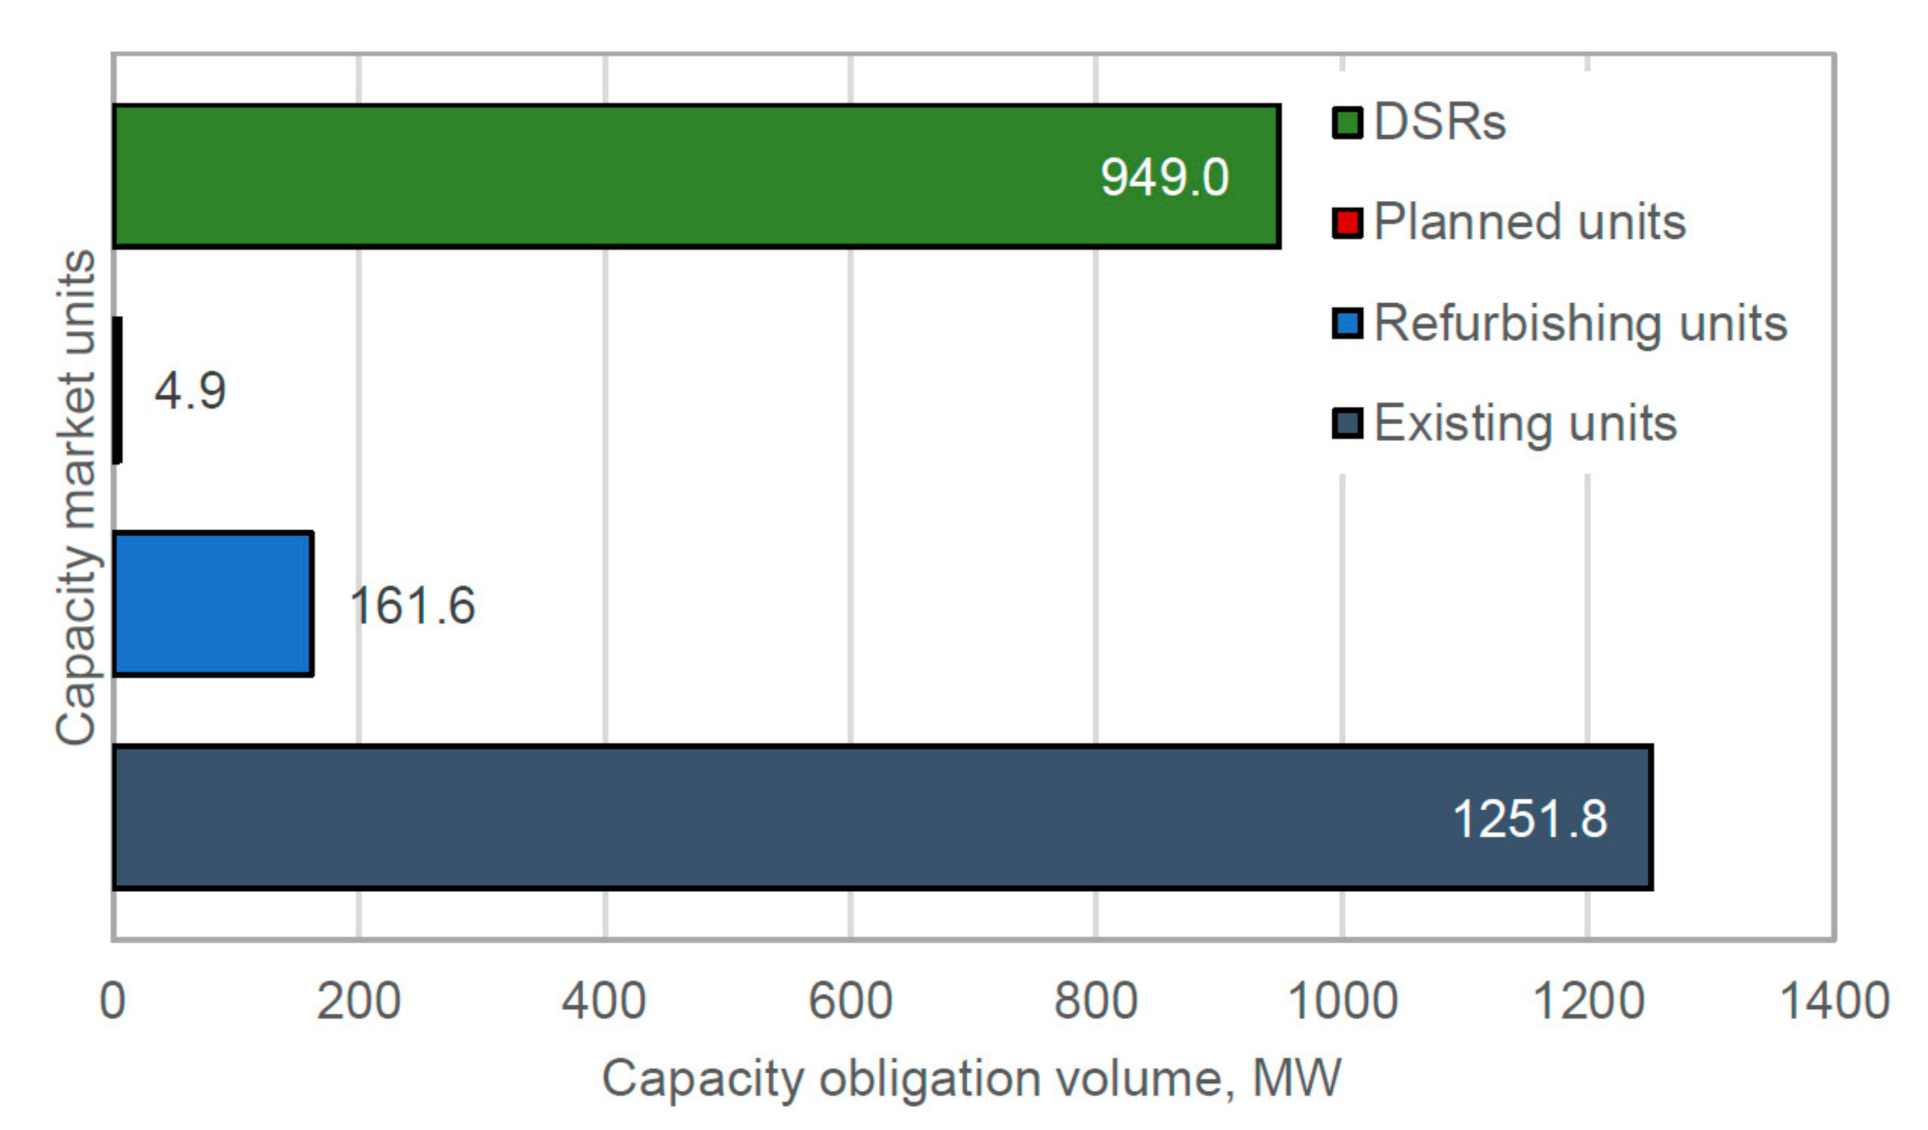
3.2.5. Main Capacity Auction for 2025 Delivery Year

The main capacity auction for the 2025 delivery year is characterized by a very small capacity demand (Table 1). Approx. 2.3 thousand MW were bought in total, of which the highest volume (1.3 thousand MW) was the existing units (Figure 12). The capacity obligations of coal units were about 300 MW; their contracts will be valid until the half of 2025. The remaining existing units are mainly gas-fired power plants and CHPs, and hydro pumped storage. Moreover, a capacity contract was signed by the refurbishing units (161.6 MW) and DSRs, for which the total volume (949.0 MW) was over 40% of the total contracted capacity (Figure 13). Low-capacity demand, fierce competition, and the lowest clearing price among all main capacity auctions (Table 1) caused that the capacity agreement was signed only by one new unit, which reported capacity obligation was 4.9 MW–about 0.2% of the total volume.

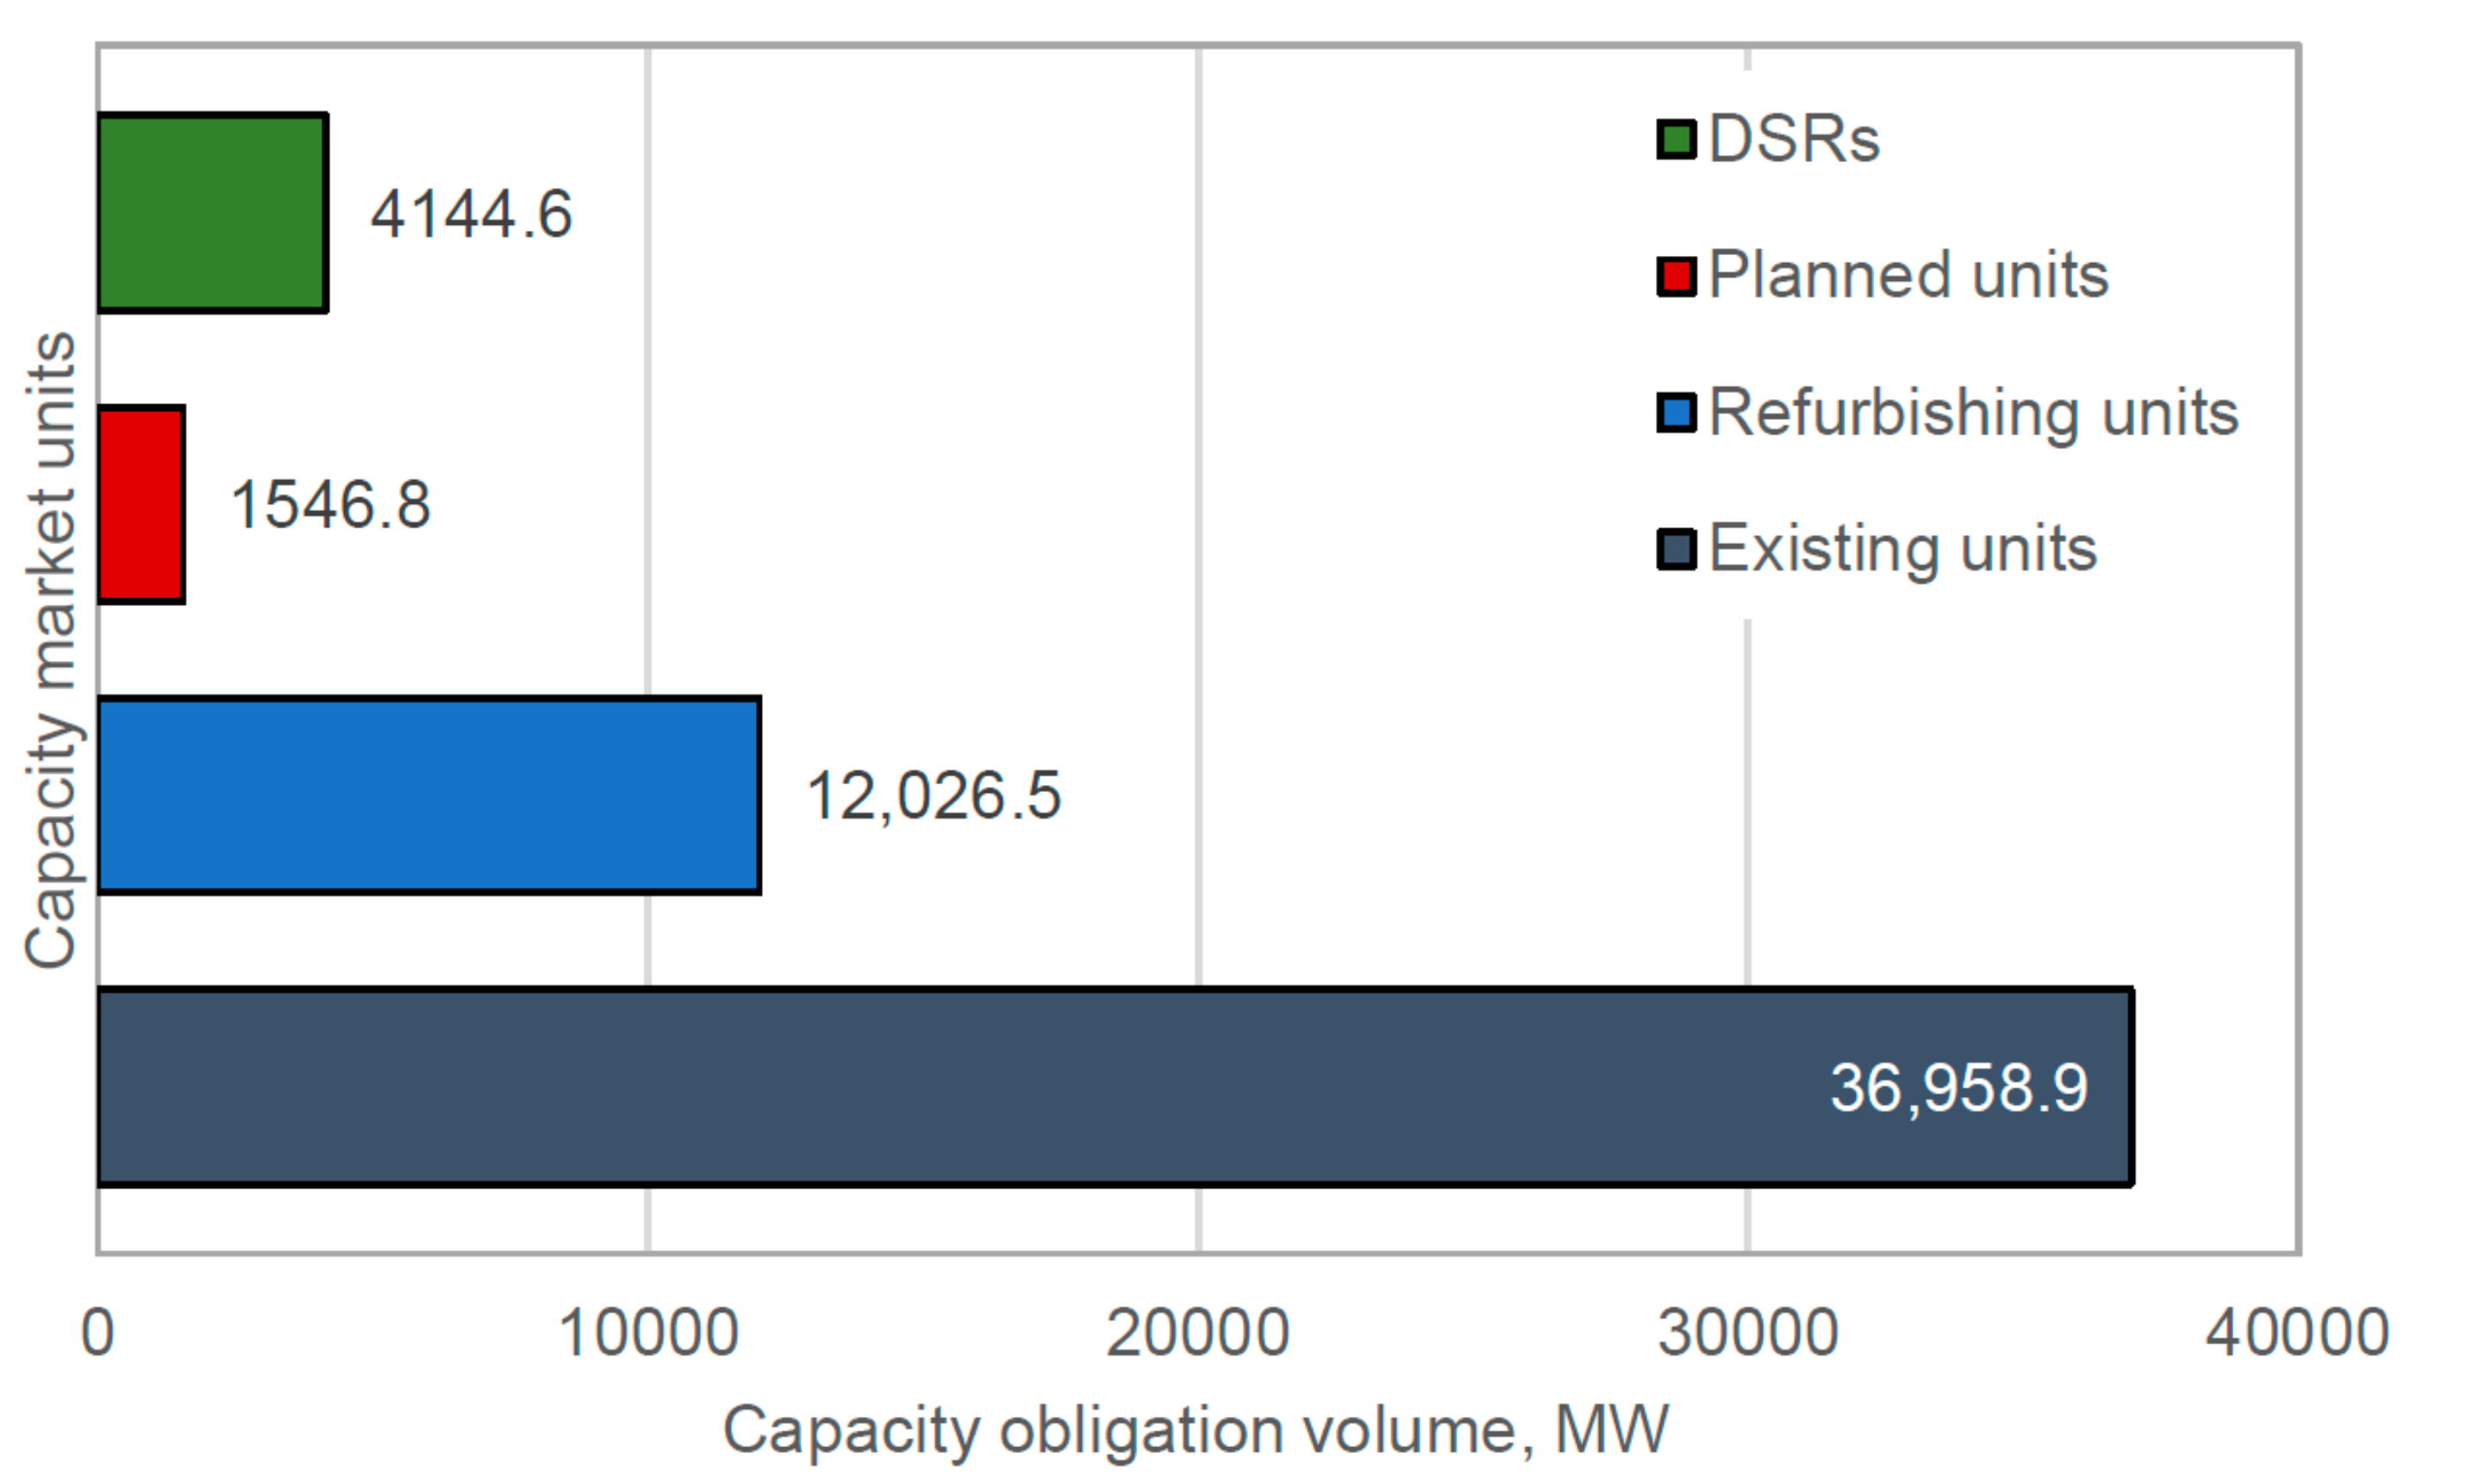
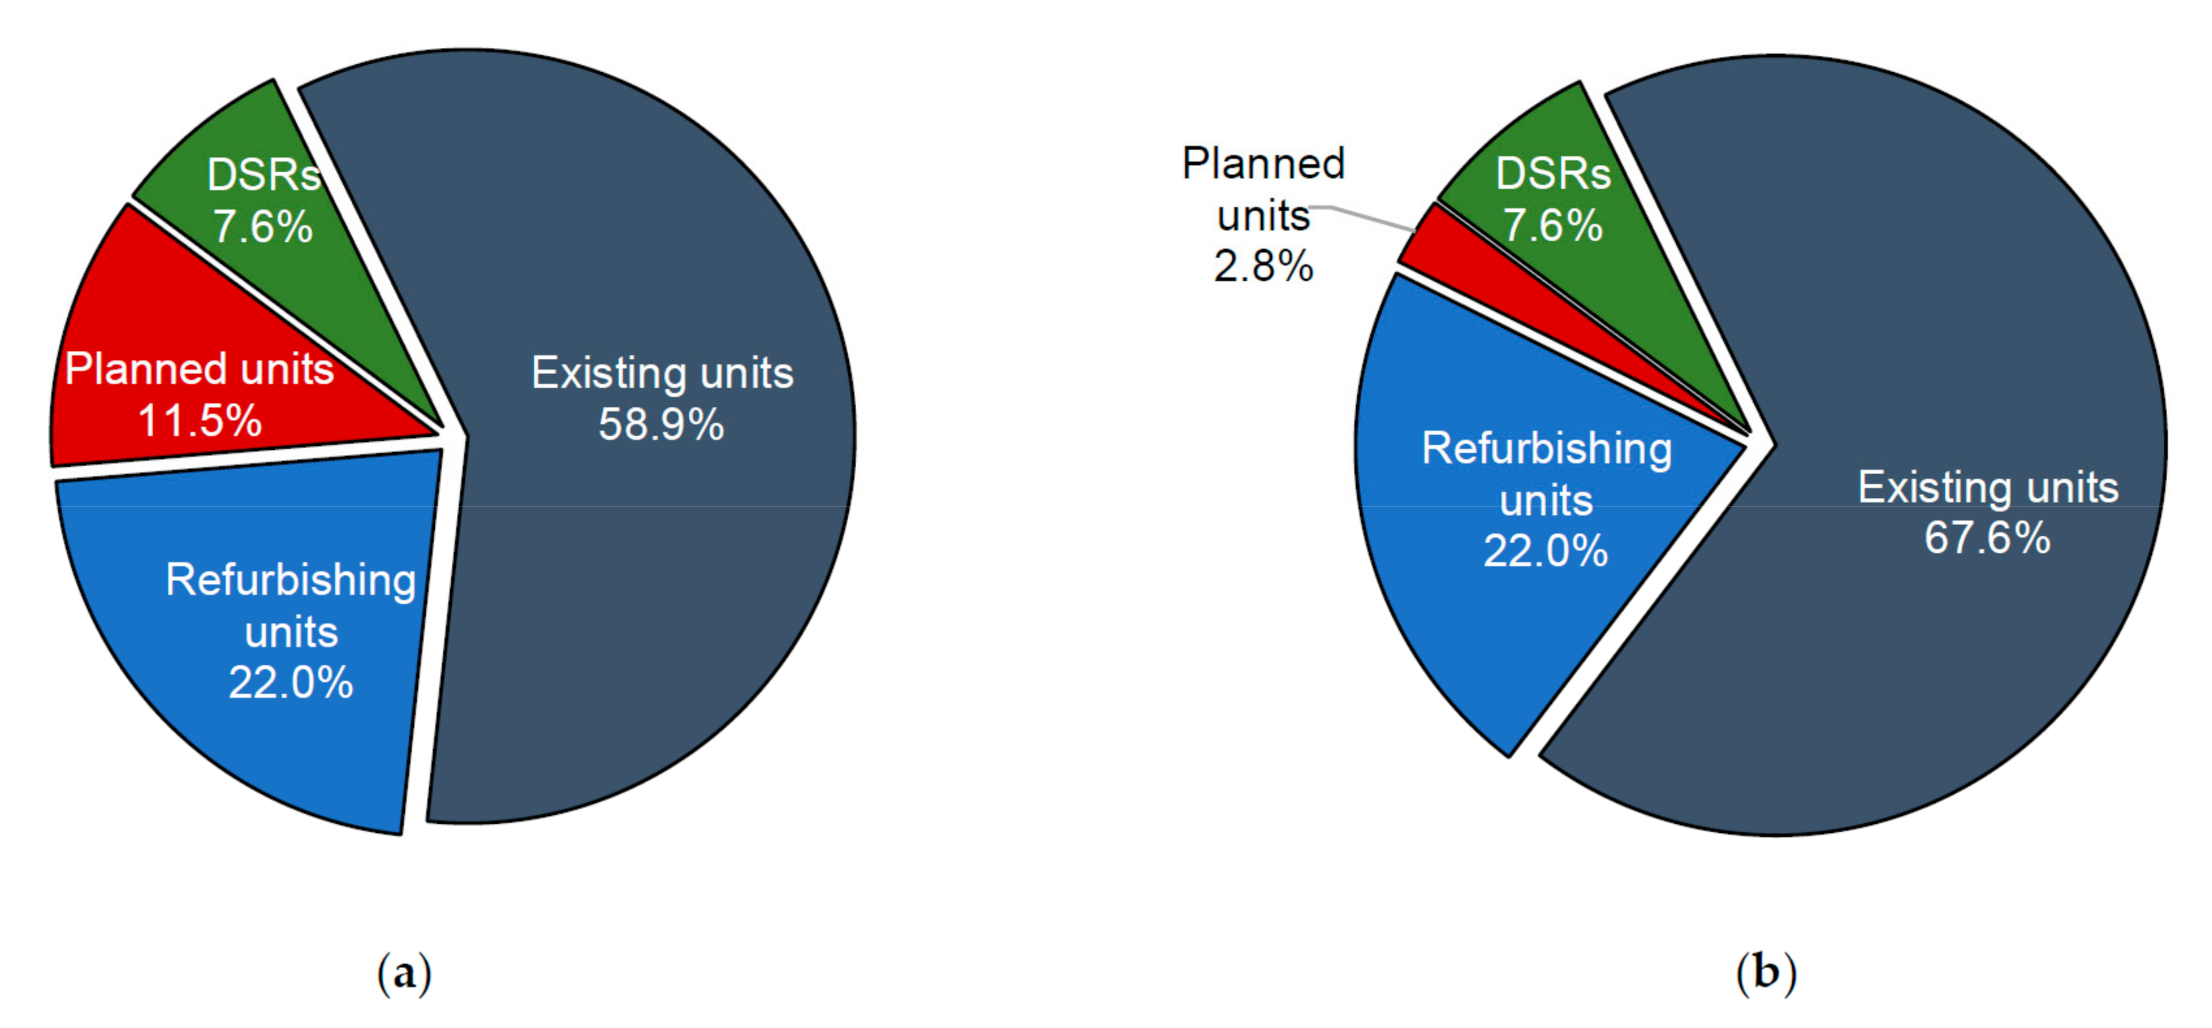
3.2.6. Aggregated Results of All Main Capacity Auctions for 2021–2025 Delivery Years

Figure 14 and Figure 15 present the aggregated results of all main capacity auctions for 2021–2025 delivery years with a distinction into the types of contracted units. The total volume of capacity obligations of the existing and refurbishing units supported by the capacity market was over 44 thousand MW (Figure 14), which is over 80% of the total contracted volume (Figure 16a). Units declared as new (planned), of which capacity obligation stipulated by the agreements was over 6.3 thousand MW, were almost 12% of the mentioned volume (it should be remembered that the planned units signed long-term agreements, mostly for 15 and 17 years).
It should also be noted that the beneficiaries of the capacity market are, to a relatively large extent, DSR units (over 4.1 thousand MW of contracted capacity obligation volume in years 2021–25). Based on the presented results (Figure 4, Figure 6, Figure 8, Figure 10 and Figure 12), an upward trend in the share of DSR units in the capacity market for the first four auctions can be observed. The volume of contracted capacity at the last capacity auction (for 2025 delivery year) decreased slightly and was related to the lowest auction clearing price (38.0 EUR/kW/year) among all past auctions. Apart from support from the capacity market, DSR units can also obtain additional revenues from the electricity balancing market, as well as take advantage of the interventional reduction of consumption scheme (a successor to the guaranteed, current, and simplified current DSR schemes available in the 2017–20 period). The Polish Transmission System Operator (TSO) implemented the latter mechanism, which takes the form of tenders, to cover capacity deficits with demand reduction services. On the other hand, there is also a strong expectation from the owners and aggregators of DSR units to introduce dynamic tariffs for electricity consumers in Poland based on real-time pricing. The results indicate that the centralized capacity market mainly supports the existing power generation units (mostly coal-fired ones and, to a much lesser extent, gas-fired units and hydro pumped storage) and does not generate sufficient incentives for investing in new power generation units.
The change of unit arrangement based on the actual state (Figure 15 and Figure 16b) only deepens our observation. In this case, almost 90% of the total contracted capacity obligation volume concerns the existing units, including the refurbishing ones and units under construction, before deploying the capacity remuneration mechanism in Poland in 2018. According to the actual results, the total volume for the planned/new units is merely 2.8% of all signed contracts (Figure 16b).

4. Conclusions

The main goal of this paper was to analyze the influence of the capacity market deployment on generating real incentives for investing in new power generation units based on the evidence from Poland. The investigation proves that the primary beneficiaries of the capacity market have been the existing and refurbishing units (mostly coal-fired ones) that together (according to the classification system) comprise more than 80% of the capacity obligation volumes contracted for 2021–2025. The detailed analysis allowed us to conclude that new/planned power generation units that signed long-term capacity agreements with a total share of 12% of all contracts were already in the advanced stage of construction when the capacity market was deployed in Poland. This means that investment decisions had been made much earlier and were not related to support that was possible to achieve from the capacity market.
In the analyses and with changing the unit types, the problem only deepened. In this case, the new and planned units were merely 2.8% of signed capacity agreements. The remaining volume of contracted capacity obligations was attributed mainly to the existing and refurbishing units (89.6%). The empirical case of the Polish power system proves that in the investigated period, the capacity market was not a sufficient incentive for building new power generation units and served mainly the financing of the existing and refurbishing, mostly coal-fired–units.
The analysis shows that although the capacity market in Poland results in the improvement of system reliability in the long term, the mechanism has not fulfilled its objectives in the context of creating market signals for new investors. However, the solution adopted allowed to address the capacity adequacy problem through supporting existing thermal units.
Introduction of changes in the principles for qualifying units for participating in the capacity market and excluding support for high-emission units at the European level (CO2 emission limit 550 kg CO2/MWh for electricity production) will have an impact on the results of the subsequent capacity auctions. Since there are many power plants and CHPs in the power system, their exclusion from the capacity auctions may cause an impulse for investing in new, low-emission power generation units. However, it is crucial to consider the current design of the Polish capacity market to avoid problems with different flexibility of power units [26].
Our results also confirm the need for modifications of the current design of existing capacity markets, as indicated by Schäfer and Altvater (2021) [27]. The concept of the introduction of emission standards from the beginning would allow cleaner technologies to compete with existing coal-fired units. Such classification could also create sufficient incentives to invest in low-emission technologies.

Author Contributions

For Conceptualization, K.Z., G.K. and J.K.; methodology, A.K., P.K. and J.K.; software, P.K.; validation, A.K., P.K. and J.K.; formal analysis, K.Z. and G.K.; investigation, A.K., P.K., K.Z., G.K. and J.K.; resources, A.K. and P.K.; data curation, A.K., P.K., K.Z., G.K. and J.K.; writing—original draft preparation, A.K., P.K., K.Z. and G.K.; writing—review and editing, A.K., P.K., K.Z., G.K. and J.K.; visualization, P.K.; supervision, J.K.; project administration, A.K. and K.Z.; funding acquisition, A.K., K.Z. and G.K. All authors have read and agreed to the published version of the manuscript.

Funding

This research was funded (a) by the National Science Centre, Poland, grant number 2019/35/N/HS4/00171 and (b) under the program of the Minister of Science and Higher Education titled “Regional Initiative of Excellence” in 2019–2022, project number 018/RID/2018/19, the amount of funding PLN 10 788 423,16.

Institutional Review Board Statement

Not applicable.

Informed Consent Statement

Not applicable.

Conflicts of Interest

The authors declare no conflict of interest.

Abbreviations

NameExplanation
CCGTCombined cycle gas turbine
CHPCombined heat and power plant
COCapacity Obligation
CRMCapacity Remuneration Mechanisms
CMUCapacity Market Unit
CO2Carbon Dioxide
DSRDemand-side response
EROEnergy Regulatory Office
EUEuropean Union
RESRenewable Energy Sources

References

  1. Neuhoff, K.; Diekmann, J.; Kunz, F.; Rüster, S.; Schill, W.P.; Schwenen, S. A coordinated strategic reserve to safeguard the European energy transition. Util. Policy 2016, 41, 252–263. [Google Scholar] [CrossRef] [Green Version]
  2. Cramton, P.; Ockenfels, A.; Stoft, S. Capacity market fundamentals. Econ. Energy Environ. Policy 2013, 2, 27–46. [Google Scholar] [CrossRef] [Green Version]
  3. Neuhoff, K.; De Vries, L. Insufficient incentives for investment in electricity generations. Util. Policy 2004, 12, 253–267. [Google Scholar] [CrossRef]
  4. Pollitt, M.G.; Haney, A.B. Dismantling a Competitive Electricity Sector: The U.K.’s Electricity Market Reform. Electr. J. 2013, 26, 8–15. [Google Scholar] [CrossRef]
  5. Bhagwat, P.C.; Marcheselli, A.; Richstein, J.C.; Chappin, E.J.L.; De Vries, L.J. An analysis of a forward capacity market with long-term contracts. Energy Policy 2017, 111, 255–267. [Google Scholar] [CrossRef]
  6. Ozdemir, O.; de Joode, J.; Koutstaal, P.; van Hout, M. Financing investment in new electricity generation capacity: The impact of a German capacity market on Northwest Europe. In Proceedings of the 2013 10th International Conference on the European Energy Market (EEM), Stockholm, Sweden, 27–31 May 2013; pp. 1–8. [Google Scholar]
  7. Mastropietro, P.; Fontini, F.; Rodilla, P.; Batlle, C. The Italian capacity remuneration mechanism: Critical review and open questions. Energy Policy 2018, 123, 659–669. [Google Scholar] [CrossRef]
  8. Hancher, L.; De Hauteclocquoe, A.; Sadowska, M. Capacity Mechanisms in EU Energy Market; Oxford University Press: Oxford, UK, 2015. [Google Scholar]
  9. Cramton, P.; Ockenfels, A. Economics and Design of Capacity Markets for the Power Sector; Springer: Berlin/Heidelberg, Germany, 2012. [Google Scholar]
  10. ACER. ACER Marker Monitoring Report 2018—Electricity Wholesale Markets Volume; ACER: Ljubljana, Slovenia, 2019. [Google Scholar]
  11. Lin, J.; Vatani, B. Impact of capacity market design on power system decarbonization. In Proceedings of the 2017 14th International Conference on the European Energy Market (EEM), Dresden, Germany, 6–9 June 2017; pp. 1–6. [Google Scholar]
  12. Bowring, J. Capacity Markets in PJM. Econ. Energy Environ. Policy 2013, 2, 47–65. [Google Scholar] [CrossRef] [Green Version]
  13. Spees, K.; Newell, S.A.; Pfeifenberger, J.P. Capacity Markets—Lessons Learned from the First Decade. Econ. Energy Environ. Policy 2013, 2, 3–26. [Google Scholar] [CrossRef]
  14. Pfeifenberger, J.P.; Spees, K.; Shumacher, A. A Comparison of PJM’s RPM with Alternative Energy and Capacity Market Designs; The Brattle Group: Boston, MA, USA, 2009. [Google Scholar]
  15. Galetovic, A.; Muñoz, C.M.; Wolak, F.A. Capacity Payments in a Cost-Based Wholesale Electricity Market: The Case of Chile. Electr. J. 2015, 28, 80–96. [Google Scholar] [CrossRef]
  16. Ashokkumar Parmar, A.; Pranav, B.; Darji, B. Capacity market functioning with renewable capacity integration and global practices. Electr. J. 2020, 33, 106708. [Google Scholar] [CrossRef]
  17. Roques, F.A. Market design for generation adequacy: Healing causes rather than symptoms. Util. Policy 2008. [CrossRef] [Green Version]
  18. Komorowska, A. Can Decarbonisation and Capacity Market Go Together? The Case Study of Poland. Energies 2021, 14, 5151. [Google Scholar] [CrossRef]
  19. Bhagwat, P.C. Security of Supply during the Energy Transition: The Role of Capacity Mechanisms. Ph.D. Thesis, Delft University of Technology, Delft, The Netherlands, 2016. [Google Scholar]
  20. ARE SA. Energy Statistics. 2020. Available online: https://www.are.waw.pl/component/phocadownload/category/28-statystyka-elektroenergetyki-polskiej?download=104:statystyka-elektroenergetyki-polskiej-2020 (accessed on 8 August 2021).
  21. Majchrzak, K.; Olczak, P.; Matuszewska, D.; Wdowin, M. Economic and environmental assessment of the use of electric cars in Poland. Polityka Energetyczna-Energy Policy J. 2021, 24, 153–168. [Google Scholar] [CrossRef]
  22. Ministry of Climate and Environment Energy Policy of Poland until 2040. 2021. Available online: http://isap.sejm.gov.pl/isap.nsf/download.xsp/WMP20210000264/O/M20210264.pdf (accessed on 8 August 2021).
  23. PSE SA. Report on the Reasons for the Introduction of Restrictions on the Supply and Consumption of Electricity in August 2015 in the Territory of the Country. 2015. Available online: https://www.pse.pl/biuro-prasowe/aktualnosci/-/asset_publisher/fwWgbbtxcZUt/content/pse-sa-opracowaly-raport-o-przyczynach-wprowadzenia-na-terenie-kraju-ograniczen-w-dostawach-i-poborze-energii-elektrycznej-w-sierpniu-2015-r-/exclusive?safeargs=696e686572 (accessed on 8 August 2021).
  24. Byers, C.; Levin, T.; Botterud, A. Capacity market design and renewable energy: Performance incentives, qualifying capacity, and demand curves. Electr. J. 2018, 31, 65–74. [Google Scholar] [CrossRef]
  25. Mastropietro, P.; Rodilla, P.; Battle, C. Performance incentives in capacity mechanisms: Conceptual considerations and empirical evidence. Econ. Energy Environ. Policy 2017, 6, 149–164. [Google Scholar] [CrossRef]
  26. Fang, X.; Hu, Q.; Bo, R.; Li, F. Redesigning capacity market to include flexibility via ramp constraints in high-renewable penetrated system. Int. J. Electr. Power Energy Syst. 2021, 128, 106677. [Google Scholar] [CrossRef]
  27. Schäfer, S.; Altvater, L. A Capacity Market for the Transition towards Renewable-Based Electricity Generation with Enhanced Political Feasibility. Energies 2021, 14, 5889. [Google Scholar] [CrossRef]
  28. McCullough, R.; Weisdorf, M.; Ende, J.C.; Absar, A. Exactly how inefficient is the PJM capacity Market? Electr. J. 2020, 33, 106819. [Google Scholar] [CrossRef]
  29. Komorowska, A.; Benalcazar, P.; Kaszyński, P.; Kamiński, J. Economic consequences of a capacity market implementation: The case of Poland. Energy Policy 2020, 144, 111683. [Google Scholar] [CrossRef]
  30. Zamasz, K.; Kapłan, R.; Kaszyński, P.; Saługa, P.W. An Analysis of Support Mechanisms for New CHPs: The Case of Poland. Energies 2020, 13, 5635. [Google Scholar] [CrossRef]
  31. Jezyna, B.; Lis, M.; Mesjasz-Lech, A. The DSR Scheme in the Capacity Market of Industrial Enterprises in Poland—Participation Determinants. Energies 2020, 13, 5462. [Google Scholar] [CrossRef]
  32. ACER. Capacity Remuneration Mechanisms and the Internal Market for Electricity; ACER: Ljubljana, Slovenia, 2013. [Google Scholar]
  33. Kirschen, D.; Strbac, G. Fundamentals of Power System Economics, 2nd ed.; John Wiley & Sons Ltd.: Hoboken, NJ, USA, 2019. [Google Scholar]
  34. Ministry of Energy. The Act of 8 December 2017 on Capacity Market (Dz.U. 2018 poz. 9); Ministry of Energy: Warsaw, Poland, 2018. [Google Scholar]
  35. Carare, O.; Rothkopf, M. Slow Dutch Auctions. Manage. Sci. 2005, 51, 365–373. [Google Scholar] [CrossRef] [Green Version]
  36. Saługa, P.; Kamiński, J. Rynek mocy w Polsce—aukcja jednocenowa vs. aukcja dyskryminacyjna. Polityka Energ.-Energy Policy J. 2017, 98, 167–176. [Google Scholar]
  37. Energy Regulatory Office. ERO President’s Announcement No. 99/2018 of the Final Results of the Capacity Auctions for the Delivery Year 2021. 2018. Available online: https://www.ure.gov.pl/pl/energia-elektryczna/rynek-mocy/informcjepure/8976,Informacja-nr-992018.html (accessed on 15 November 2021).
  38. Energy Regulatory Office. ERO President’s Announcement No. 103/2018 of the Final Results of the Capacity Auctions for the Delivery Year 2022. 2018. Available online: https://www.ure.gov.pl/pl/energia-elektryczna/rynek-mocy/informcjepure/8975,Informacja-nr-1032018.html (accessed on 15 November 2021).
  39. Energy Regulatory Office. ERO President’s Announcement No. 14/2019 of the Final Results of the Capacity Auctions for the Delivery Year 2023. 2019. Available online: https://www.ure.gov.pl/pl/energia-elektryczna/rynek-mocy/informcjepure/8973,Informacja-nr-102019.html (accessed on 15 November 2021).
  40. Energy Regulatory Office. ERO President’s Announcement No. 106/2019 of the Final Results of the Capacity Auctions for the Delivery Year 2024. 2019. Available online: https://www.ure.gov.pl/pl/energia-elektryczna/rynek-mocy/informcjepure/8971,Informacja-Nr-1062019.html (accessed on 15 November 2021).
  41. Energy Regulatory Office. ERO President’s Announcement No. 2/2021 of the Final Results of the Capacity Auctions for the Delivery Year 2025. 2021. Available online: https://www.ure.gov.pl/pl/energia-elektryczna/rynek-mocy/informcjepure?page=0 (accessed on 15 November 2021).
  42. Drożdż, W.; Kinelski, G.; Czarnecka, M.; Wójcik-Jurkiewicz, M.; Maroušková, A.; Zych, G. Determinants of Decarbonization—How to Realize Sustainable and Low Carbon Cities? Energies 2021, 14, 2640. [Google Scholar] [CrossRef]
  43. Mucha-Kuś, K.; Sołtysik, M.; Zamasz, K.; Szczepańska-Woszczyna, K. Coopetitive Nature of Energy Communities—The Energy Transition Context. Energies 2021, 14, 931. [Google Scholar] [CrossRef]
  44. Wójcik-Jurkiewicz, M.; Czarnecka, M.; Kinelski, G.; Sadowska, B.; Bilińska-Reformat, K. Determinants of Decarbonisation in the Transformation of the Energy Sector: The Case of Poland. Energies 2021, 14, 1217. [Google Scholar] [CrossRef]
  45. European Parliament and Council Regulation (EU). 2019/943 of the European Parliament and of the Council of 5 June 2019 on the Internal Market for Electricity. 2019. Available online: https://eur-lex.europa.eu/legal-content/EN/TXT/?uri=CELEX%3A32019R0943 (accessed on 8 August 2021).
Figure 1. The general framework of the centralized capacity market implemented in Poland. Source: Own analysis based on [34].
Energies 14 07843 g001
Figure 2. Main stages of the participation process in the capacity auctions for the n–delivery year. Source: Own analysis based on [34].
Energies 14 07843 g002
Figure 3. Capacity obligation volume contracted in main capacity auction for 2021 delivery year–break down by official (declared) assignments to capacity market units. Source: Own analysis based on [37].
Energies 14 07843 g003
Figure 4. Capacity obligation volume contracted in main capacity auction for 2021 delivery year–break down by real status of capacity market units. Source: Own analysis based on [37].
Energies 14 07843 g004
Figure 5. Structure of capacity obligation volumes contracted in main capacity auction for 2021 delivery year–break down by capacity market units: (a) official (declared) assignment; (b) actual status of capacity market units. Source: Own analysis based on [37].
Energies 14 07843 g005
Figure 6. Capacity obligation volume contracted in main capacity auction for 2022 delivery year–break down by official (declared) assignments to capacity market units. Source: Own analysis based on [38].
Energies 14 07843 g006
Figure 7. Structure of capacity obligation volumes contracted in main capacity auction for 2022 delivery year–break down by official (declared) assignments to capacity market units. Source: Own analysis based on [38].
Energies 14 07843 g007
Figure 8. Capacity obligation volume contracted in main capacity auction for 2023 delivery year–break down by official (declared) assignments to capacity market units. Source: Own analysis based on [39].
Energies 14 07843 g008
Figure 9. Structure of capacity obligation volumes contracted in main capacity auction for 2023 delivery year–break down by capacity market units: (a) official (declared) assignment; (b) actual status of capacity market units. Source: Own analysis based on [39].
Energies 14 07843 g009
Figure 10. Capacity obligation volume contracted in main capacity auction for 2024 delivery year–break down by official (declared) assignments to capacity market units. Source: Own analysis based on [40].
Energies 14 07843 g010
Figure 11. Structure of capacity obligation volumes contracted in main capacity auction for 2024 delivery year–break down by official (declared) assignments to capacity market units. Source: Own analysis based on [40].
Energies 14 07843 g011
Figure 12. Capacity obligation volume contracted in main capacity auction for 2025 delivery year–break down by official (declared) assignments to capacity market units. Source: Own analysis based on [41].
Energies 14 07843 g012
Figure 13. Structure of capacity obligation volumes contracted in main capacity auction for 2025 delivery year; break down by official (declared) assignments to capacity market units. Source: Own analysis based on [41].
Energies 14 07843 g013
Figure 14. Capacity obligation volume contracted in main capacity auction for 2021–2025 delivery years; break down by official (declared) assignments to capacity market units. Source: Own analysis based on [37,38,39,40,41].
Energies 14 07843 g014
Figure 15. Capacity obligation volume contracted in main capacity auction for 2021–2025 delivery years–break down by actual status of capacity market units. Source: Own analysis based on [37,38,39,40,41].
Energies 14 07843 g015
Figure 16. Structure of capacity obligation volumes contracted in main capacity auction for 2021–2025 delivery years–break down by capacity market units: (a) official (declared) assignment; (b) actual status of capacity market units. Source: Own analysis based on [37,38,39,40,41].
Energies 14 07843 g016
Table 1. Final results of the main capacity auction for 2021–2025 delivery years.
ParameterUnit20212022202320242025
Auction price capEUR/kW/year72.180.589.588.991.2
Market entry price of a new generating unit (CONE)EUR/kW65.567.068.868.470.1
Auction clearing priceEUR/kW/year52.843.544.657.138.0
Capacity obligation purchasedMW22,427.110,580.110,631.28671.22367.3
Total capacity obligationsMW22,427.123,038.923,215.022,107.621,472.8
Planned capacity volumeMW4022.30852.61440.34.9
Final round number57857
Number of winning bids1601209410355
Source: Own analysis based on [37,38,39,40,41].
Publisher’s Note: MDPI stays neutral with regard to jurisdictional claims in published maps and institutional affiliations.

