Abstract
This paper presents the results of numerical tests on the elements of an adsorption chiller that comprises a sorption chamber with a bed, a condenser, and an evaporator. The simulation is based on the data and geometry of a prototype refrigeration appliance. The simulation of this problem is unique and has not yet been performed, and so far, no simulation of the phenomena occurring in the systems on a real scale has been carried out. The presented results are part of the research covering the entire spectrum of designing an adsorption chiller. The full process of numerical modeling of thermal and flow phenomena taking place in the abovementioned components is presented. The computational mesh sensitivity analysis combined in the k-ε turbulence model was performed. To verify and validate the numerical results obtained, they were compared with the results of tests carried out on a laboratory stand at the AGH Center of Energy. The results of numerical calculations are in good agreement with the results of the experimental tests. The maximum deviation between the pressure obtained experimentally and by simulations is 1.8%, while for temperatures this deviation is no more than 0.5%. The results allow the identification of problems and their sources, which allows for future structural modifications to optimize the operation of the device.
1. Introduction
According to the report prepared by the Lawrence Livermore National Laboratory institute, humanity uses almost as much energy as it loses in all sectors of the economy [1]. Thus, many legislators and manufacturers strive to constantly increase the energy efficiency of devices and systems. One way to reduce energy losses, and thus increase the efficiency of systems, may be to use waste heat as an energy source. An example of a device that uses waste heat as an energy source is an adsorption chiller.
Adsorption chillers usually consist of one evaporator, a condenser, appropriate control valves, and a bed filled with a sorbent. The sorbent in the bed adsorbs and desorbs cyclically a working medium, called sorbate. The sorbent and sorbate together are known as a working pair, and their molecular structure and intermolecular interactions between them determine how specific adsorbent–adsorbate pairs will behave during adsorption and desorption [2]. Due to the low desorption temperature, low cost, and a lack of negative impact on the environment, the silica gel–water vapor working pair is commonly used in adsorption chillers [3]. Silica gel has a fairly large specific surface area (wide pores, 250–350 m2/g; narrow porosity, 600–850 m2/g), thanks to which it is possible to adsorb a large amount of water vapor [2,4,5].
Adsorption chillers use waste heat as an energy source. Additionally, they possess many other advantages, including lack of moving parts, low level of noise, no vibrations, and the possibility of water desalination [6]. On the other hand, intermittent operation, low coefficient of performance, big size and weight, and unequal time of desorption and adsorption processes can be accounted as the main drawbacks of adsorption chillers [7]. Hence, numerous scientific works are conducted to eliminate the abovementioned drawbacks.
The problem of intermittent operation can be eliminated by using multi-bed refrigerators with three [8] or more beds [9]. When using multiple beds, cycle lengths and their spacing can be adjusted to maximize cooling efficiency and working time of the evaporator in the cycle [8]. The other parameters influencing the performance, size, and weight of the adsorption chillers include, but are not limited to, the design of the heat exchanger in the bed [10] and the materials of which the bed is made [11], the size of sorbent particles [12], the velocity of heat transfer fluid that heats or cools the bed [13], and the type of evaporator [14,15]. As can be seen, the performance of adsorption chillers depends on numerous different factors. Additionally, the physical phenomena, i.e., evaporation, condensation, adsorption, and desorption, occurring in the main components of the adsorption chiller are intrinsically complex, as they are related to heat and mass transfer at various pressures and temperatures. Thus, fully understanding the abovementioned processes is essential to improve the performance of adsorption chillers.
As commonly known, the abovementioned processes (evaporation, condensation, adsorption, and desorption) are difficult to analyze using only experimental measurements. The measurements of temperatures, pressures, flow rates, etc., are crucial since they allow determining, e.g., the instantaneous and average efficiency of the chiller. However, these measurements are not sufficient for a comprehensive, and detailed scientific analysis of the chillers’ operation is sometimes even impossible to perform. Furthermore, conducting experimental studies is very time and cost consuming. As a result, computational fluid dynamics (CFD) analysis becomes a necessity, and numerous scientific works use CFD to investigate either the evaporation, condensation, and adsorption/desorption processes themselves or the influence of defined parameters on the operation of the entire adsorption chiller.
Modeling the condensation and evaporation phenomena is a difficult issue since the characteristics of the fluid, both in the liquid and gaseous state and the relationships between them, should be taken into account. It is necessary to apply a two-phase model with appropriate consideration of the possible turbulence and the accompanying surface forces phenomenon [16]. It is also necessary to track the liquid–gas interface, which can be achieved by using the volume of fluid method [17,18,19]. Adsorption and desorption processes are also difficult to model, and a variety of different mathematical models of the sorption phenomenon are available [20]. Nevertheless, the linear driving force (LDF) model [21,22,23] is one of the most widely used.
Mohammed et al. [24] designed and investigated numerically, using FORTRAN software, a new modular bed for adsorption chillers. The bed consisted of an array of modules filled with adsorbent and placed in a metal case with vapor channels. After parametric analysis, it was concluded that the cooling power per unit volume was higher for the proposed bed compared to the commercially available beds. Hong et al. [22] used CFD to compare the performance of the adsorption chiller equipped with plate and fin-tube heat exchangers in the adsorption bed. It was found that the chiller with plate heat exchanger had a lower, by 19.9%, coefficient of performance (COP) but a higher, by 15.7%, specific cooling power, compared to the fin-tube heat exchanger. CFD analysis was also conducted by Mohammed et al. [25], who investigated heat and mass transfer in an open-cell aluminum foam packed with silica gel, which can be used as a bed in adsorption cooling applications. It was reported that the foam with 20 pores per inch (PPI) has a larger surface area and smaller cell size than the 10 PPI foam and thus is more advisable to be used in adsorption chillers. It was also found that the average bed temperature and adsorption rate was higher for 0.35 mm silica gel than for 0.70 mm silica gel. The effect of sorbent particle size was also investigated, using CFD, by Mitra et al. [21], who concluded that using a smaller sorbent does not always lead to faster adsorption, and the optimum geometry of a heat exchanger exists for a particular sorbent size.
Apart from the construction of the heat exchanger in the bed or the size of sorbent particles, the thermal conductivity of the bed strongly influences the overall performance of the adsorption chiller [23]. Therefore, different metal- or carbon-based additives can be added to the bed to increase its thermal conductivity [4]. Furthermore, the rate of adsorption depends on the convective heat transfer coefficient between the bed and the heat transfer fluid [26]. Therefore, the desorption and adsorption time can be reduced by increasing the velocity of the heat transfer fluid [27]. Elsheniti et al. [28], who used COMSOL Multiphysics software for investigations, reported that the COP and specific cooling capacity could be improved by 68% and 42%, respectively, when the flow character of the heat transfer fluid was changed from laminar to turbulent.
The literature review presented in the above paragraphs justifies the possibility of using CFD simulations for investigating adsorption chillers.
This paper presents a CFD analysis, carried out in the Ansys Academic Research CFD 19- Ignis Research Group ANSYS, Inc. 2600 ANSYS Drive Canonsburg, PA 15317 USA of the phenomena occurring in the main elements of the adsorption chiller, i.e., evaporator, condenser, and bed. The results of the CFD analysis are validated using data from the experimental studies carried out on the adsorption chiller located at the AGH UST Center of Energy. Therefore, this study aims at:
- Numerical modeling of the processes occurring in the evaporator, condenser, and bed of the adsorption chiller to understand better these processes;
- Analyzing the fields of temperature, pressure, and velocity;
- Indicating the locations with extremes of temperatures, pressures, and velocities;
- Determining the phenomena disrupting the operation of the main elements of the adsorption chiller;
- Determining potential changes in the structure of the main elements, which may improve the operating parameters of the individual elements of the chiller and increase its efficiency and reliability.
The direct value of this research is a possibility to determine the key elements and processes that impact the operation of the adsorption chiller. Consequently, this research indicates potential modifications of the chiller, which may be applied and improve its performance. Furthermore, the adsorption chiller located at the AGH UST Center of Energy has never been investigated using CFD analysis before. Thus, this research is a novelty in the context of getting to know the specifics of the chiller operation and the possibilities of its modification to improve the chiller efficiency and reliability as well as decrease its size and weight.
2. Materials and Methods
2.1. Empirical Research
The simulations were preceded by empirical tests carried out at the research station for adsorption systems at the AGH UST Center of Energy on a unique adsorption system. The system can operate in a two- or three-bed mode, generating chilled water and purified water. The beds were built on the basis of a plate-fin exchanger filled with adsorption material. The absorbent material used consists of elements with a size of 500–1000 μm. The scheme of the installation is presented in Figure 1, and the technical specification of the investigated chiller is given in Table 1.
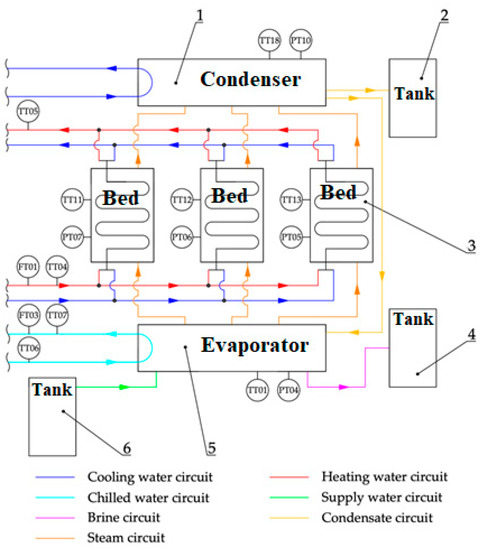
Figure 1.
Scheme of the adsorption chiller with desalination test bench at the Center of Energy AGH [6,29]. 1—condenser; 2—distillate tank; 3—adsorbent bed; 4—brine tank; 5—evaporator; 6—deaerator; TT01—temperature in the evaporator; TT04—hot water inlet temperature; TT05—hot water outlet temperature; TT06—chilled water inlet temperature; TT07—chilled water outlet temperature; TT11—temperature in Bed 1; TT12—temperature in Bed 2; TT13—temperature in Bed 3; TT18—temperature in the condenser; PT04—pressure in the evaporator; PT07—pressure in Bed 1; PT06—pressure in Bed 2; PT05—pressure in Bed 3; PT10—pressure in the condenser; FT01—hot water flow; FT03—chilled water flow.

Table 1.
Technical specification of a 3-bed adsorption chiller operating under nominal conditions. [6,29].
For the purpose of this study, the chiller operated in a two-bed mode, and a detailed description of its operating principle can be found in [6]. The parameters that were measured during the experiments, and the measuring devices are listed in Table 2. The measured values were recorded every 5 s on a personal computer using special software, and then the results were exported to CSV files.

Table 2.
The parameters that were measured during the experiments and the measuring devices.
The results of the experimental studies are shown in Figure 2 and Figure 3. Figure 2 depicts the temperature changes over time taking place in the main components of the investigated adsorption chiller. The pressure changes in the beds, evaporator, and condenser are shown in Figure 3. Some of the results shown in Figure 2 and Figure 3 were used to define the boundary conditions and the rest to validate the simulation results. The average values between red lines in Figure 2 and Figure 3 represent the values taken as the boundary conditions for the simulations. These values represent the operating parameters of the adsorption chiller after about 25 min from its start-up, as the operating conditions of the chiller stabilize after that time.
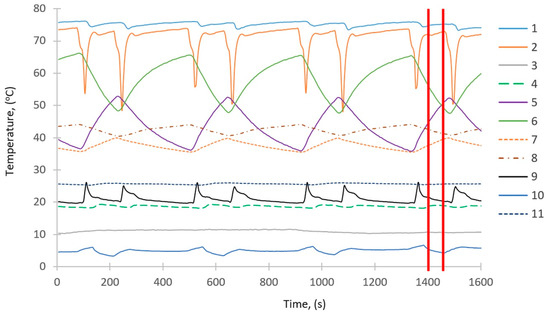
Figure 2.
Temperature changes over time. 1—heating water inlet to the beds; 2—heating water outlet from the beds; 3—chilled water outlet from the evaporator; 4—cooling water outlet from the condenser; 5—heat exchanger in the first bed; 6—heat exchanger in the second bed; 7—free space of the first bed; 8—free space of the second bed; 9—cooling water outlet from the beds; 10—free space of the evaporator; 11—free space of the condenser.
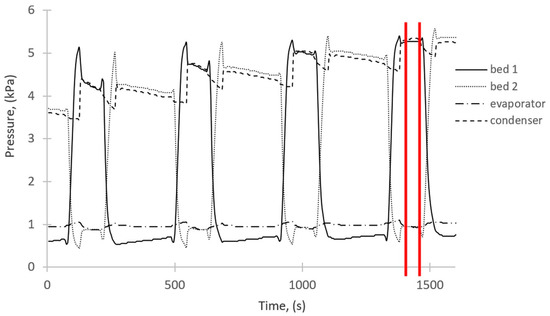
Figure 3.
Pressure changes over time.
Figure 4 presents the destructive effect of the water vapor on the bed observed during the empirical research. Therefore, numerical simulations were applied to, among others, find the reasons for this destructive effect and to better understand the phenomena occurring in the system. Knowledge about the processes will allow modifying the components of the adsorption chiller to eliminate the destructive effect visible in Figure 4 and obtain a greater cooling capacity.
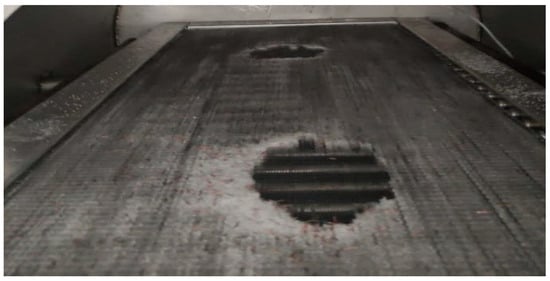
Figure 4.
Destructive effect of the cumulative factor on the deposit.
2.2. Construction of Spatial Geometry and a Computational Grid
2.2.1. Generation of a Computational Mesh
During the construction of geometric models, the following simplifications were made:
- The housing of the elements was simplified to the form of a cylinder, without sight glasses and measuring connectors.
- Irregularly shaped elements such as heating and cooling junction boxes in the evaporator and condenser were simplified to a cylinder form.
- For the sorption chamber, the structural elements supporting the bed were omitted, and the bed itself was simplified to the form of a cuboid.
Then, after creating the structural elements, they were filled with the fluid domain in order to obtain the appropriate computational domains constituting the interior of the sorption chamber, evaporator, and condenser, respectively.
After the geometric model of the studied domain was prepared, it was exported to the ANSYS Meshing module. With it, a continuous domain was discretized in order to obtain a computational mesh.
In order to assess the mesh quality, an analysis of the cell quality parameters was carried out:
- Orthogonal quality: its value is in the range <0,1>, where the value 1 means the highest possible quality.
- Skewness: its value is in the range <0,1>, with the value 0 being the highest possible quality.
It was estimated that most of the elements for the orthogonal quality are in the range of 0.7–1.0 (approx. 2/3 elements). Likewise, most of the elements for skewness are in the range of 0–0.2 (approx. 2/3 elements). The obtained values of the orthogonal quality and skewness prove the good quality of the mesh.
The calculation grid for the sorption chamber consists of 472,686 nodes and 2,529,568 elements. The calculation grid for the evaporator consists of 2,165,228 nodes and 11,296,174 elements. The calculation grid for the condenser consists of 869,789 nodes and 4,562,582 elements. This enables performing calculations in a reasonably short time without using a supercomputer.
2.2.2. Boundary Conditions
The step preceding the calculations is to define the necessary solver settings. They were established on the basis of experimental studies (Figure 2 and Figure 3) and studies in the literature described in the Introduction (Section 1).
- For the issues related to relatively low flow velocities (subsonic flow), flow solutions based on the pressure field (“pressure-based”) were used.
- It was assumed that the simulation would be carried out in the “transient” mode, which enables the observation of changes in parameters over time.
- The influence of gravity on the fluid elements was taken into account by appropriately defining the acceleration vector.
- Due to the inclusion of gravity in the model and the occurrence of mass interactions, the scheme of coupling the velocity and pressure fields (“coupled”) was applied.
- In the sorption chamber, reference conditions were defined in the entire domain as for sorption pressure of 1050 Pa and a temperature of 315.8 K, steam inlet at a temperature of 279.07 K, for desorption a pressure of 5250 Pa and a temperature of 301.98 K, and a steam outlet temperature of 312.82 K
- The sorption time was set at 100 s, and the desorption time 200 s
- Reference conditions for the evaporator was a pressure of 1050 Pa and a temperature of 279.09 K
- Evaporator water inlet temperature was 280.24 K, water outlet temperature was 280.29 K, and the steam outlet temperature was 279.09 K
- A second-order spatial discretization scheme was used for the governing equations (mass, momentum, and energy). However, for the dissipation of turbulence, a first-order scheme was used.
- Reference conditions for the condenser was a temperature of 301.98 K, and a pressure of 5250 Pa
- Steam inlet temperature to the condenser was 312.82 K, and the temperature of the cooling pipes was 292.82 K
- Condenser domain computation was set for a time equal to 500 s.
2.2.3. Computational Methods
For all phenomena, Ansys Fluent solves the equations of conservation of mass, momentum, and energy. The conservation of mass, momentum, and energy are shown in Equations (1)–(3), respectively [30].
where ρ, t, , Sm, p, , , , E, keff, hj, , , and Sh stand for the density, time, velocity, source term, static pressure, stress tensor, gravitational body force, external mass forces acting on the fluid, energy, effective thermal conductivity coefficient, enthalpy of species j, diffusive flux of species j, viscous dissipation, and heat source, respectively.
To model turbulence occurring in the flows, the k-ε realizable turbulence model was used. In order to model the multiphase flow, the “Species Transport” model was selected for the calculations.
3. Results and Discussion
3.1. Results of Numerical Calculations
Numerical simulations are a tool that can explain many phenomena, the study of which with experimental methods is problematic. The simulation studies conducted in this work consider the interactions between the various components of the chiller at given phases of the work cycle. The simulation also allows for a time-dependent analysis of the temperature, pressure, and velocity variations during the operation of the unit. However, it should be remembered that they are based on assumptions and models. In order to assess the applicability and correctness of the tested model, it should be compared with the experimental results.
The results were developed using selected methods available as components of the Ansys CFD-Post post-processor module. To show the results of the simulations and the phenomena occurring in the main components of the investigated adsorption chiller, i.e., sorption chamber, evaporator, and condenser, the appropriate cross-sections of these components were selected, and they are shown in Figure 5, Figure 6 and Figure 7.

Figure 5.
Visualization of the arrangement of cross-sections in the sorption chamber.

Figure 6.
Visualization of the arrangement of cross-sections in the evaporator.
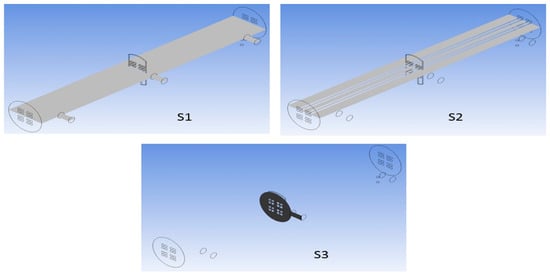
Figure 7.
Visualization of the arrangement of cross-sections in the condenser.
3.2. Simulation Results for the Sorption Chamber
3.2.1. Sorption Process
In this study, the temperature and pressure distribution, as well as velocity field, during the sorption processes were determined. The presented results concern the state of the system at the time point t = 100 s.
Figure 8a, shows the temperature distribution in the computational domain in Section K1. Uniform temperature distribution was obtained close to 311 K, which proves that the dimensions of the sorption chamber are sufficient. If the sorption chamber was too small, there could be a non-uniform temperature distribution. The lowest temperature value 279 K occurs only in the vicinity of the deposit location. It results from the modeling of the heat flux leaving the system on these planes.
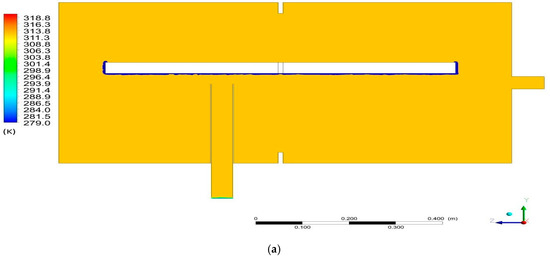
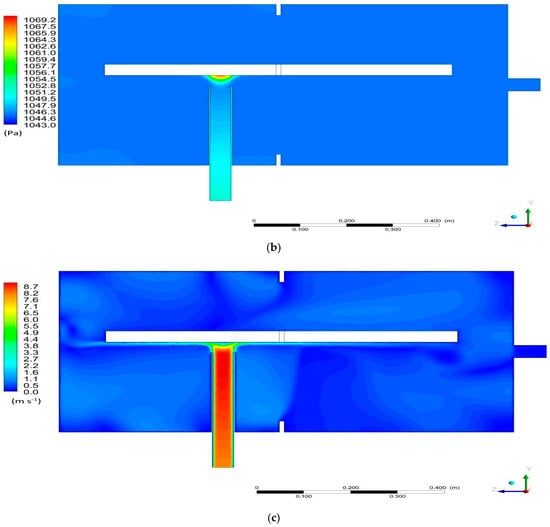
Figure 8.
Cross-Section K1 for the sorption: (a) temperature distribution; (b) pressure distribution; (c) velocity distribution.
Figure 8b shows the pressure distribution in the computational domain in Section K1. Uniform pressure distribution in the range of 1043–1045 Pa was obtained. The area of increased pressure up to 1067 Pa occurs in the vicinity of the location of the bed on the extension of the steam inlet nozzle. This may be due to the close location of the stub pipe and the direct influence of the inlet stream. Likewise, high pressure is one of the reasons for the negative impact on the viability of the bed, as shown in Figure 4.
The visualization of the velocity field distribution is shown in Figure 8c. A large variation of the vapor velocity in the space around the bed is observed. The velocity of the vapor varies from 0.1 to 8.7 m/s. The greatest velocity, 8.7 m/s, is in the area of the outflow from the inlet connection, while lower velocity values, in the range of about 0–4 m/s, are present in the remainder of the domain. This is due to the small diameter of the inlet nozzle and the continuity equation, according to which a velocity of an incompressible fluid always decreases as the fluid flows from a channel with a small diameter (small cross-sectional area) to a channel with a larger diameter (larger cross-sectional area).
3.2.2. Desorption Process
The presented results concern the state of the system at the time point t = 200 s.
Figure 9 shows the pressure distribution in the computational domain in Section K1. Uniform pressure distribution of 5247 Pa on a global scale was obtained. The lower pressure values in the range of 5170–5230 Pa can be observed in the vicinity of the steam outlet from the system.
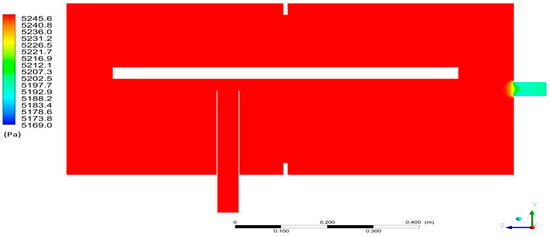
Figure 9.
Pressure distribution in Section K1 for the desorption.
The visualization of the velocity field distribution for Section K2 is presented in Figure 10. On a global scale, the velocity level inside the domain is at a similar level. The highest velocities, up to 0.137 m/s, occur near the steam outlet, which result from the geometry of the system. Taking into account the local values for individual cross-sections, an increase in speed at the points of narrowings can be noticed. In addition, the speed also increases in the lower part of the tank relative to the upper part. This may be due to the geometrical imbalance of these parts—in the lower major part, the fluid must move faster in order to maintain a continuous flow. The results of the simulation also show the formation of steam vortices and their shapes and sizes, which are related to the adopted geometry of the bed.
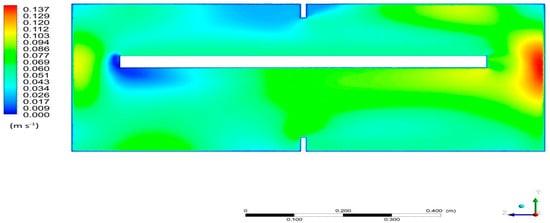
Figure 10.
Velocity field distribution in Section K2 for the desorption.
3.3. Simulation Results for the Evaporator
The presented results concern the state of the system at the time point t = 100 s. The temperature distribution in the computational domain is presented in Figure 11a,b. The highest temperature, 284 K, occurs in the lower part of the evaporator tank, near the pipes through which the chilled water flows. When the fluid elements come into contact with the surface of the tubes at the higher temperature, the temperature of the fluid element increases until vaporization occurs. P1 (Figure 11a) shows brighter spots near the water entry into the system through the spray system. This is due to the lower temperature of the entering water compared to the surrounding fluid. In Cross-Section P2 (Figure 11b), one can see the increased temperature in the lower part to 284 K. Water in the system falls under the influence of gravity. At the same time, it heats up from other fluid elements and heating surfaces.
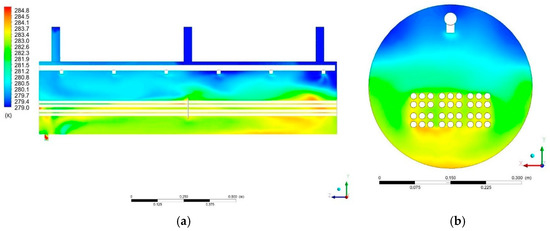
Figure 11.
Temperature distribution in: (a) Section P1; (b) Section P2.
Figure 12a,b shows the velocity field distributions in the Cross-Sections P1 and P2, respectively. The vapor velocity ranges from about 0.1 to 9.7 m/s. The highest speed of 9.7 m/s is at the steam outlet nozzles. It is caused by the fact that the steam flows from the tank to the nozzles that have a small diameter. As a result of the laws of flow continuity, speed increases.
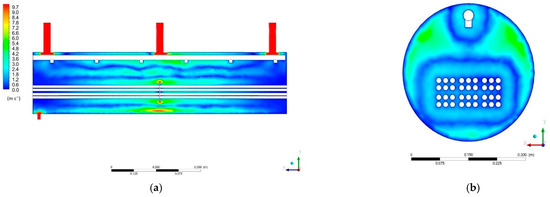
Figure 12.
Velocity field distribution: (a) Cross-Section P1; (b) Cross-Section P2.
The distribution of the velocity field on Section P1 indicates an increase in the velocity of the fluid elements in the vicinity of the obstacle constituted by the structural element inside the tank. When the fluid encounters this obstacle, there is less space available for it to move, so its velocity in this area must be increased.
The formation of closed zones with a similar value of the velocity of the fluid elements can be seen in Cross-Section P2. One of these zones was formed around the heat exchanger pipes, and the other around the pipe supplying water to the system. This may indicate that the flows between the layers of fluid in the reservoir are established.
Figure 13 shows the mass fraction of liquid water in Section P2. The greatest concentration of the liquid occurs in the lower part of the tank in accordance with the acting gravity. The greatest concentration occurs in the area of the outflow of non-evaporated water from the system and between the heat exchanger pipes. Above the area of the heat exchanger pipes, the water content is lower, which means that the water vapor content is predominant there. The distribution in this section also shows a greater liquid content on the left side compared to the right side.
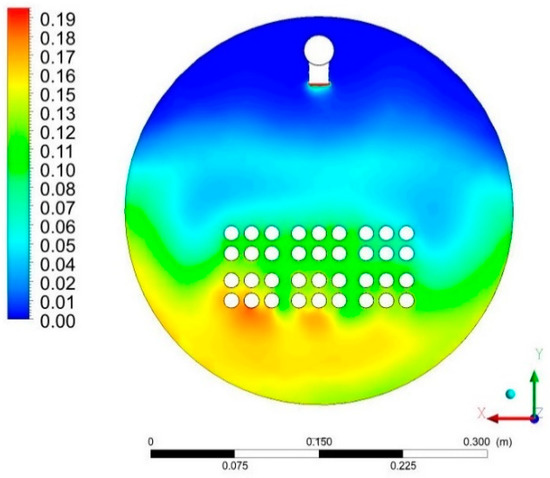
Figure 13.
Distribution of liquid water content for Cross-Section P2 on the local scale.
3.4. Simulation Results for the Condenser
The presented results concern the state of the system at the time point t = 200 s.
The temperature distribution inside the condenser computational domain is shown in Figure 14a,b. The highest temperature of 312 K is visible near the steam input to the system. As the temperature moves away from the entry point, the temperature decreases, which indicates that the incoming vapor cools down in contact with other fluid components already present in the condenser vessel. The lowest temperature of 294 K is around the pipes with the cooling liquid. Additionally, as can be seen in Cross-Section S3, the temperature of fluid decreases when the fluid passes through the vicinity of the cooling surfaces. The fluid temperature is the lowest in the space opposite the steam inlet ports. On Cross-Sections S1 and S3, one can find the shift of isotherms in the direction opposite to the Z axis. This may indicate a local fluid flow in the direction opposite to the Z axis.
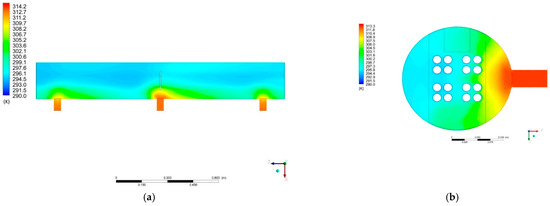
Figure 14.
Temperature distribution for: (a) Cross-Section S1; (b) Cross-Section S3.
The distribution of velocity fields is presented in Figure 15. The vapor velocity varies from about 0.1 to 3.4 m/s. The highest velocity of 3.4 m/s prevails in the area of the steam inlet nozzles. This is understandable because the fluid entering the reservoir from the pipe slows down in velocity due to the increase of the space in which it can be held.
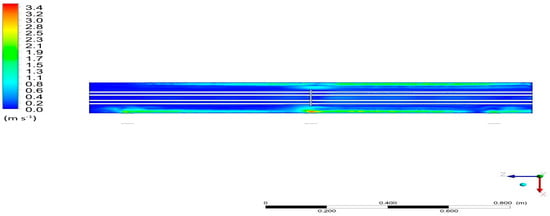
Figure 15.
Distribution of the velocity field for Cross-Section S2.
Additionally, it can be noticed that the velocity field distribution in the vicinity of the connection between the stub pipe and the tank is shifted in the direction opposite to the Z axis, similar to the temperature. There is also a greater value of velocity in the vicinity of the tank walls. This may indicate the establishment of solid current lines inside the condenser, along which the fluid elements move.
3.5. Validation of Simulation
Numerical simulations are a tool that can explain many phenomena, the study of which with experimental methods is problematic. However, it should be remembered that they are based on assumptions and models. In order to assess the applicability and correctness of the tested model, it should be compared with the experimental results. The experimental type of measurements makes it impossible to measure local values such as velocity in cross-section. Validation is done by comparing global values. The most reliable parameter is the pressure for the sorption and desorption process.
Figure 16 and Figure 17 show the pressure change over time for the sorption and desorption processes, respectively. The figures show a 2.5% error; however, the maximum discrepancy between the results of simulation and experiments is 1.5% and 1.8% for the sorption and desorption, respectively. The simulation results are within this range and can therefore be considered reliable.
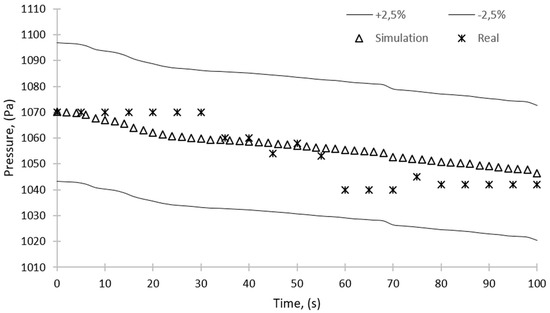
Figure 16.
Comparison of the results of simulation and experimental studies—pressure over time for the sorption process.
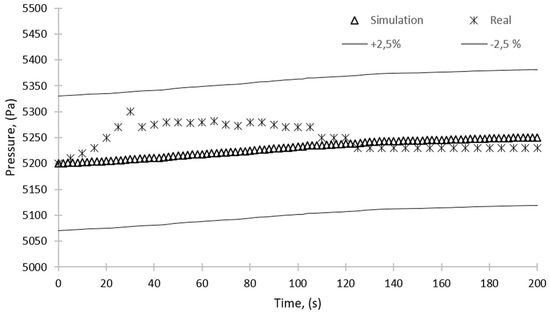
Figure 17.
Comparison of the results of simulation and experimental studies—pressure over time for the desorption process.
Figure 16 shows the mean pressure inside the domain as a function of time for the sorption process. As can be seen, the pressure decreases almost linearly from the initial value of 1070 Pa to about 1050 Pa. The pressure drop is caused by the fact that during the sorption, water vapor is adsorbed by the sorbent.
As mentioned before, the discrepancy between the results of simulation and experimental studies is no more than 2.5%. These results of simulation reflect the quality of the model and the reliability of the performed calculations. The simulation will allow for an in-depth analysis of, firstly, the phenomena taking place during the adsorption and desorption and, secondly, any local changes in the operating parameters and the efficiency of the device caused by, e.g., the structure of the individual elements of the device.
Figure 16 presents the pressure in the bed during the sorption, and both the experimental and simulation results are shown. Pressure fluctuations obtained in the experimental studies can be attributed to the opening of the valve connecting the sorption chamber with the evaporator and pressure equalization between these two components, which was not included in the simulation. Additionally, from the experimental data, a pressure drop of about 30 Pa after 60 s from the start of operation can be observed. This pressure drop is caused by the sorption of water vapor in the bed, which results in the pressure drop in the entire unit. The sorption continues until the silica gel is saturated with water. When saturation is complete, the pressure equalizes, and the process stops.
For the desorption process (Figure 17), the mean domain pressure during the simulation showed an upward trend. The increase of the pressure is a result of the desorption process, during which the water vapor is released from the silica gel. Thus, more water vapor particles are in the given space, and according to the ideal gas law, its pressure must increase. However, this increase is below 1% from 5200 to 5250 Pa. It is also observed that the pressure in the bed obtained experimentally is about 100 Pa higher than the pressure from the simulation in the initial phase of the process. This is because the temperature in the bed increases as a result of supplying the heating water to the heat exchanger and opening the valve between the condenser and the bed, which could also cause pressure fluctuations. As a consequence of bed heating, the adsorbed water vapor is released from the silica gel, and this process continues until the absorbed water is fully desorbed and the pressure between the bed and the condenser equalizes.
Figure 18 and Figure 19 show the temperature change over time for the sorption and desorption processes, respectively. The figures show a 2.5% error; however, the maximum discrepancy between the results of simulation and experiments is 0.5% and 0.4% for the sorption and desorption, respectively. The simulation results are within this range and can therefore be considered reliable.
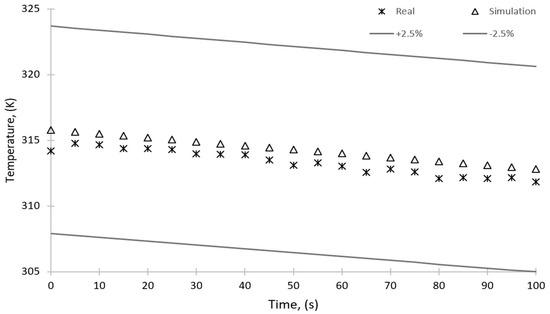
Figure 18.
Comparison of the results of simulation and experimental studies—temperature over time for the sorption process.
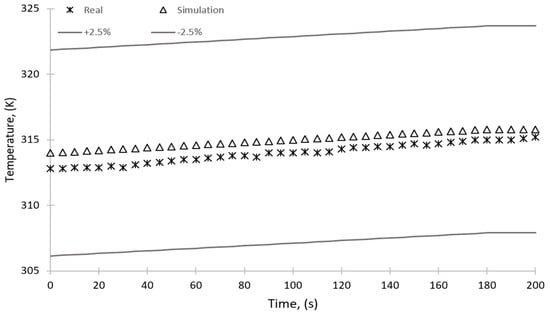
Figure 19.
Comparison of the results of simulation and experimental studies—temperature over time for the desorption process.
Although the simulation model does not contain the description of all phenomena occurring in the device, the generated results of the simulation reflect the operation of the device with high accuracy and allow reliable simulation of the phenomena occurring in the device in different conditions, which can be used to improve the performance of the device.
The results of simulations show the differences in the velocity of water vapor in the main elements of the adsorption chiller. Detecting differences in the velocity of vapor in particular zones of a given element allows protecting the device from damage, e.g., erosion.
The prepared numerical model is analyzed based on the selected variants, and the compatibility with the experimental data used for validation is achieved. The average values of velocity and pressure obtained in the simulation correspond to the values collected in the experimental research. Based on the results of the simulation, the probable reason for the destruction of the bed during experimental studies is also obtained. Taking into account all correctness criteria applied to the model, it can be concluded that the results obtained from the numerical calculations are sufficiently accurate and correct. The model created in this study can be further verified in the study of other configurations of adsorption chillers and also will be useful in the process of prototyping and testing new design solutions of individual elements of the adsorption chiller. In the next stages of the research, the model will be used to improve the design solutions of the device to improve its efficiency, optimize its operation cycle, and eliminate potential design faults that may damage the device. It should be noted that the individual components of the chiller are interdependent. Therefore, it is likely that modifying just one of them, such as the bed, without making changes to the other components may have a small impact on increasing the efficiency of the chiller.
4. Conclusions
The combination of equations used in the described simulation allows for the creation of a reliable model of a system that allows the analysis of the work cycle in time. The models used allow the results to be obtained in an acceptable time without access to a supercomputer unit. The results of the simulations are in good agreement with the results of the experiments. The maximum discrepancy between the pressure obtained experimentally and by the simulations is 1.8%, while the discrepancy between the temperatures obtained experimentally and by the simulations is no more than 0.5%. The promising results of the validation of the model make it possible to undertake further studies of this type of issue with the use of computational fluid dynamics (CFD). They can be used to test new configurations and design solutions without the need to create real test units. The results helped to identify the problem spots and formulate design recommendations to optimize the operation of the device as listed below.
- Changing the tube banks in the evaporator from an in-line arrangement to a staggered arrangement while simultaneously maintaining the same heat transfer surface area. This change can improve the cooling capacity of the evaporator and provide a more uniform temperature distribution;
- Using a turbulator inside the tubes in the evaporator, as the heat transfer rate is significantly greater for turbulent flow compared to laminar flow.
- Changing the arrangement of the tubes in the condenser, as the temperature distribution in the condenser is non-uniform. Another arrangement of the tubes could provide more uniform temperature distribution, which could result in a faster vapor condensation and thus a more efficient performance of the entire device;
- Reducing the length of the water vapor supply pipe or using a jet diffusion cone or a straight baffle at the stream outlet should be considered. The proposed solutions will lower the velocity of water vapor and improve its dispersion. As a result, the force acting on the sorbent will be reduced;
- Using a distribution manifold that distributes the vapor uniformly over the entire surface of the bed, which will accelerate the sorption. As shown in Figure 10, the water vapor diffusion in the bed is not uniform, which lengthens the adsorption time and decreases the overall efficiency of the adsorption chiller.
Author Contributions
Conceptualization, K.S. and T.S.; methodology, T.S. and K.S.; validation, K.S. and T.S.; formal analysis, T.S., K.S. and L.L.; investigation, T.S., K.S., W.K. and L.L.; resources, W.N. and L.M.; data curation, W.K., L.L., E.R. and L.M.; writing—original draft preparation, T.S., L.L. and K.S.; writing—review and editing, K.S., T.S., L.L. and L.M.; visualization, L.L., W.K. and E.R.; supervision, W.N. and L.M.; project administration, L.M., W.N. and K.S.; funding acquisition, L.M., W.N. and K.S. All authors have read and agreed to the published version of the manuscript.
Funding
This research was funded by the Ministry of Science and Higher Education, Poland, Grant AGH No. 16.16.210.476, and partly supported by the program “Excellence initiative—research university” for the AGH University of Science and Technology.
Institutional Review Board Statement
Not applicable.
Informed Consent Statement
Not applicable.
Data Availability Statement
Not applicable.
Conflicts of Interest
The authors declare no conflict of interest.
References
- Lawrence Livermore National Laboratory, Energy Flow Charts. Available online: https://flowcharts.llnl.gov (accessed on 10 July 2021).
- Kisielew, A.W.; Jaszin, J.I. Adsorpcyjna Chromatografia Gazowa; Państwowe Wydawtnictwo Naukowe: Warszawa, Poland, 1969. [Google Scholar]
- Ugale, V.D.; Pitale, A.D. A Review on Working Pair Used in Adsorption Cooling System. Int. J. Air-Cond. Refrig. 2015, 23, 1530001. [Google Scholar] [CrossRef]
- Sztekler, K.; Kalawa, W.; Mika, Ł.; Mlonka-Medrala, A.; Sowa, M.; Nowak, W. Effect of Additives on the Sorption Kinetics of a Silica Gel Bed in Adsorption Chiller. Energies 2021, 14, 1083. [Google Scholar] [CrossRef]
- Sztekler, K.; Kalawa, W.; Mlonka-Medrala, A.; Nowak, W.; Mika, Ł.; Krzywanski, J.; Grabowska, K.; Sosnowski, M.; Debniak, M. The Effect of Adhesive Additives on Silica Gel Water Sorption Properties. Entropy 2020, 22, 327. [Google Scholar] [CrossRef] [PubMed]
- Sztekler, K.; Kalawa, W.; Nowak, W.; Mika, L.; Gradziel, S.; Krzywanski, J.; Radomska, E. Experimental study of three-bed adsorption chiller with desalination function. Energies 2020, 13, 5827. [Google Scholar] [CrossRef]
- Szyc, M.; Nowak, W. Operation of an adsorption chiller in different cycle time conditions. Chem. Process Eng. Inz. Chem. Process. 2014, 35, 109–119. [Google Scholar] [CrossRef][Green Version]
- Uyun, A.S.; Miyazaki, T.; Ueda, Y.; Akisawa, A. Experimental Investigation of a Three-Bed Adsorption Refrigeration Chiller Employing an Advanced Mass Recovery. Energies 2009, 2, 531–544. [Google Scholar] [CrossRef]
- Jribi, S.; Saha, B.B.; Koyama, S.; Bentaher, H. Modeling and simulation of an activated carbon–CO2 four bed based adsorption cooling system. Energy Convers. Manag. 2014, 78, 985–991. [Google Scholar] [CrossRef]
- Hong, S.W.; Ahn, S.H.; Kwon, O.K.; Chung, J.D. Optimization of a fin-tube type adsorption chiller by design of experiment. Int. J. Refrig. 2015, 49, 49–56. [Google Scholar] [CrossRef]
- Cao, N.V.; Duong, X.Q.; Lee, W.S.; Park, M.Y.; Chung, J.D.; Hong, H. Effect of heat exchanger materials on the performance of adsorption chiller. J. Mech. Sci. Technol. 2020, 34, 2217–2223. [Google Scholar] [CrossRef]
- Vodianitskaia, P.J.; Soares, J.J.; Melo, H.; Gurgel, J.M. Experimental chiller with silica gel: Adsorption kinetics analysis and performance evaluation. Energy Convers. Manag. 2017, 132, 172–179. [Google Scholar] [CrossRef]
- Xua, S. Experiment on a New Adsorption Bed about Adsorption Refrigeration Driven by Solar Energy. Energy Procedia 2012, 14, 1542–1547. [Google Scholar] [CrossRef]
- Seiler, J.; Lanzerath, F.; Jansen, C.; Bardow, A. Only a wet tube is a good tube: Understanding capillary-assisted thin-film evaporation of water for adsorption chillers. Appl. Therm. Eng. 2019, 147, 571–578. [Google Scholar] [CrossRef]
- Thimmaiah, P.C.; Sharafian, A.; Rouhani, M.; Huttema, W.; Bahrami, M. Evaluation of low-pressure flooded evaporator performance for adsorption chillers. Energy 2017, 122, 144–158. [Google Scholar] [CrossRef]
- Kleiner, T.; Rehfeldt, S.; Klein, H. CFD model and simulation of pure substance condensation on horizontal tubes using the volume of fluid method. Int. J. Heat Mass Transf. 2019, 138, 420–431. [Google Scholar] [CrossRef]
- Zhang, L.; Zhang, G.; Tian, M.; Zhang, J.; Zhang, Y. Modeling of laminar filmwise condensation of methane with nitrogen on an isothermal vertical plate. Int. Commun. Heat Mass Transf. 2019, 105, 10–18. [Google Scholar] [CrossRef]
- Tahir, F.; Mabrouk, A.; Koç, M. Impact of surface tension and viscosity on falling film thickness in multi-effect desalination (MED) horizontal tube evaporator. Int. J. Therm. Sci. 2020, 150, 106235. [Google Scholar] [CrossRef]
- Mohammed, H.I.; Giddings, D.; Walker, G.S. CFD multiphase modelling of the acetone condensation and evaporation process in a horizontal circular tube. Int. J. Heat Mass Transf. 2019, 134, 1159–1170. [Google Scholar] [CrossRef]
- Muttakin, M.; Pal, A.; Rupa, M.J.; Ito, K.; Saha, B.B. A critical overview of adsorption kinetics for cooling and refrigeration systems. Adv. Colloid Interface Sci. 2021, 294, 102468. [Google Scholar] [CrossRef]
- Mitra, S.; Muttakin, M.; Thu, K.; Saha, B.B. Study on the influence of adsorbent particle size and heat exchanger aspect ratio on dynamic adsorption characteristics. Appl. Therm. Eng. 2018, 133, 764–773. [Google Scholar] [CrossRef]
- Hong, S.W.; Kwon, O.K.; Chung, J.D. Application of an embossed plate heat exchanger to adsorption chiller. Int. J. Refrig. 2016, 65, 142–153. [Google Scholar] [CrossRef]
- Solmuş, I.; Andrew, D.; Yamali, C.; Baker, D. A two-energy equation model for dynamic heat and mass transfer in an adsorbent bed using silica gel/water pair. Int. J. Heat Mass Transf. 2012, 55, 5275–5288. [Google Scholar] [CrossRef]
- Mohammed, R.H.; Mesalhy, O.; Elsayed, M.L.; Chow, L.C. Novel compact bed design for adsorption cooling systems: Parametric numerical study. Int. J. Refrig. 2017, 80, 238–251. [Google Scholar] [CrossRef]
- Mohammed, R.H.; Mesalhy, O.; Elsayed, M.L.; Chow, L.C. Performance enhancement of adsorption beds with silica-gel particles packed in aluminum foams. Int. J. Refrig. 2019, 104, 201–212. [Google Scholar] [CrossRef]
- Solmuş, I.; Yamali, C.; Yildirim, C.; Bilen, K. Transient behavior of a cylindrical adsorbent bed during the adsorption process. Appl. Energy 2015, 142, 115–124. [Google Scholar] [CrossRef]
- Yaïci, W.; Entchev, E. Coupled unsteady computational fluid dynamics with heat and mass transfer analysis of a solar/heat-powered adsorption cooling system for use in buildings. Int. J. Heat Mass Transf. 2019, 144, 1–17. [Google Scholar] [CrossRef]
- Elsheniti, M.B.; Hassab, M.A.; Attia, A.E. Examination of effects of operating and geometric parameters on the performance of a two-bed adsorption chiller. Appl. Therm. Eng. 2019, 146, 674–687. [Google Scholar] [CrossRef]
- Sztekler, K.; Kalawa, W.; Nowak, W.; Mika, L.; Grabowska, K.; Krzywanski, J.; Sosnowski, M.; Al-Harbi, A.A. Performance evaluation of a single-stage two-bed adsorption chiller with desalination function. J. Energy Resour. Technol. 2020, 143, 1–22. [Google Scholar] [CrossRef]
- ANSYS FLUENT Documentation. Available online: https://www.afs.enea.it/project/neptunius/docs/fluent/index.htm (accessed on 1 March 2021).
Publisher’s Note: MDPI stays neutral with regard to jurisdictional claims in published maps and institutional affiliations. |
© 2021 by the authors. Licensee MDPI, Basel, Switzerland. This article is an open access article distributed under the terms and conditions of the Creative Commons Attribution (CC BY) license (https://creativecommons.org/licenses/by/4.0/).