1. Introduction
The intensive development of the world economy and the expected population growth mean that the demand for cooling and water will continue to rise. The use of conventional technologies to meet this demand is associated with a huge expenditure of electricity, which still comes mainly from non-renewable sources [
1]. The energy demand for cooling buildings has more than tripled since 1990 [
2]. The IIR (International Institute of Refrigeration) estimates that, currently, about 20% of total electricity generation is used for refrigeration and air conditioning processes, of which about 8.5% is used to power air conditioners during space cooling [
2,
3]. It is also important to take measures to reduce peak energy demand, which can increase significantly during the summer period [
4]. The IIR also predicts that power consumption of cooling equipment may double by 2050 [
3]. In 2017, the number of new air conditioning devices was 110 million units, an increase of 8.1% over 2016 [
5].
Climate change caused, among other things, by greenhouse gas emissions from anthropogenic sources has led to an increase in the global average temperature. Its increase, in turn, intensifies the demand for cooling, which is most often generated in a way contributing indirectly to negative climate change [
6]. In most cases, the chillers used today are compressor systems driven solely by electricity and using synthetic refrigerants [
7]. Alternatives to this type of refrigeration equipment include ejector systems as well as adsorption and absorption chillers [
8]. The development of non-conventional chillers has accelerated with the emergence of more stringent requirements imposed by the Vienna Convention and the Montreal Protocol relating to limiting the production and use of CFC (chlorofluorocarbon) and HCFC (hydrochlorofluorocarbon) refrigerants as well as energy efficiency requirements for equipment [
9,
10].
The operation of adsorption chillers is based on thermal compression using the phenomena of adsorption and desorption. Thanks to the replacement of classical electrical compression by thermal compression, they do not consume as much electrical energy as compressor systems that are only driven by electricity. Adsorption chillers represent an environmentally friendly option for generating cooling and desalinated water while using low-quality heat, usually with a temperature in the range of 50–90 °C, e.g., waste heat from industrial processes, heat obtained as a result of solar energy conversion in solar collectors or heat from geothermal energy [
11,
12,
13]. Adsorption chillers are characterised by many advantages that distinguish them from other cooling technologies. A very important feature is the possibility of using environmentally neutral, non-ozone-depleting refrigerants, such as methanol, ethanol or water [
4]. An important advantage of adsorption chillers is also the possibility of their operation in tri-generation systems capable of producing electricity, heating and cooling simultaneously, thus contributing to more efficient fuel consumption [
14,
15]. In addition, the low number of moving mechanical parts means that the risk of failure of this type of installation is significantly lower [
16]. Adsorption chillers are also quiet, easy to operate and vibration-free, which makes them even more attractive [
4,
14]. Importantly, temperature fluctuations of the heating water supplying adsorption chillers do not significantly affect their operation [
17]. This makes them ideal for powering with solar energy [
18].
A unique feature of adsorption chillers is the water desalination option. Increasing water consumption and decreasing water availability are causing water scarcity in more and more places in the world. It is estimated that more than 700 million people experience it, and another 500 million are close to it. By 2025, almost 1.8 billion people might be affected by water scarcity, and as many as 5.7 billion by 2050 [
19,
20]. The WHO (World Health Organization) predicts that, by 2025, as much as half the population may live in areas with poor access to drinking water [
21]. Meeting this growing demand necessitates the use of desalination technologies. Desalination is considered particularly promising, also, because about 39% of the population lives within 100 km of saline waters, which makes this method of water treatment even more advantageous and cost-effective [
22]. Conventional desalination methods require very high energy inputs, so adsorption desalination technology, being of minimal electricity consumption, is particularly attractive and promising for improving water security worldwide [
23].
However, adsorption chillers are not currently used on a large scale. This is due to their main disadvantage, which is their set of relatively low performance parameters. The COP (coefficient of performance) of adsorption chillers is usually in the range of 0.5–0.6 while the SCP (specific cooling power) usually reaches up to 200 W/kg [
24,
25]. In this respect, therefore, this technology cannot compete with more efficient electrically driven compressor chillers, with COPs estimated at 3–5 [
24]. Adsorption chillers’ low performance coefficients are due to such factors as poor mass flow and heat transfer within the adsorbent bed and low adsorption capacity of the sorbent [
26,
27]. The consequence of the low cooling capacity of adsorption chillers is their large size and weight [
18,
26]. Reducing the size and weight of the unit is very important due to the commercialisation of the adsorption refrigeration technology.
The performance of an adsorption chiller depends on many factors. These include the design of the device including the bed’s heat exchanger and the choice of the adsorbent/adsorbate pair. The most common working pairs used in adsorption chillers are silica gel/water, zeolite/water, activated carbon with methanol, ethanol or ammonia, and carbon fibre with menthol or ammonia [
28]. Of key importance for increasing the efficiency of adsorption chillers are also the temperatures and flow rates of chilled water, heating water and cooling water [
8,
9,
29,
30]. The basic methods of increasing the operating efficiencies of adsorption chillers are briefly described further in this paper.
One way to improve the operating efficiency is by modifying the adsorption refrigeration cycle [
28]. The basic adsorption refrigeration cycle is the simplest and also the most reliable [
31]. However, it is characterised by low efficiency related to the large losses of thermal energy. For this reason, more complex cycles began to be developed; these include cycles with heat or mass recovery [
28]. By using them simultaneously, maximum COP and SCP values can be achieved [
32,
33]. Even more complex cycles include the thermal wave cycle, the forced convection thermal wave cycle and the cascade cycle [
34]. When an adsorption chiller is operating in desalination mode only, it is also possible to use advanced heat recovery where the condensation heat recovered is transferred to the working medium in the evaporator [
35].
A method often used in practice to improve performance involves designing multi-component systems. They ensure stable production of cooling and make it possible to reduce fluctuations in the temperature of the chilled water obtained, and to increase cooling capacity [
28]. Additionally, they offer the possibility of implementing various operational strategies in order to maximise efficiency [
36]. A number of studies have been carried out to this end, the results of which indicate an improvement in heat recovery efficiency of 70% when increasing the number of beds from two to four, and of 40% for six beds compared with a chiller with four beds [
37]. Further, findings presented by Saha et al. found a 35% improvement in the heat recovery efficiency of a three-bed chiller compared with a two-bed chiller [
9].
An effective method of optimising the operation of an adsorption chiller and maximising its performance parameters is the proper selection of adsorption/desorption cycle times, switching times associated with precooling or preheating, and times allocated for heat and mass recovery [
38]. First of all, it must be stressed that the length of the adsorption and desorption times directly affects the amount of adsorbate flowing from the evaporator to the bed and from the bed to the condenser. If it is too short, not enough adsorbate is evaporated, resulting in incomplete and inefficient adsorption and desorption, leading to the wrong chilled water temperature or insufficient production of distillate. Incomplete desorption, in turn, reduces the affinity of the adsorbent for adsorption of vapour in the next cycle. It should also be noted that this time must not be too long. In a situation where the adsorbate has been completely desorbed from the sorbent surface, the heat energy supplied in the heating water circuit will be unnecessarily consumed for further bed heating [
39].
It has been repeatedly proven that the cooling coefficient of performance COP increases monotonically with increasing cycle times [
4,
13]. This is due to the fact that when the cycle time increases, the heat consumption of the chiller during the desorption process decreases, and the time allocated for switching the bed also decreases [
9,
40,
41]. On the other hand, increasing cycle time is associated with a decrease in cooling power. Therefore, there are operating parameters of a chiller for which it is possible to achieve its maximum performance [
15]. In the case of the experiment conducted by Saha et al., the maximum SCP value was achieved for adsorption/desorption times in the range from 180 to 300 s [
9]. In a paper by El-Sharkawy et al., the adsorption and desorption times for which the highest value of cooling capacity were obtained were between 350 and 450 s [
42]. Studies in search of the optimum sorption cycle time have also been carried out for a three-bed adsorption chiller located at the Energy Centre of the AGH University of Science and Technology in Krakow, Poland. The experiment was performed for cycles of 100, 200, 300, 500, 600 and 900 s. The results found that the COP increased over time, while the SCP initially increased, reaching a maximum value for a time equal to 500 s before decreasing [
15].
Many research groups have also focused on the notion of allocating time to each phase of chiller operation. The results of their research have clearly indicated that the performance of the device will be higher if the time allocated to regeneration is shorter [
43]. The results of studies on the rate of adsorption and desorption processes confirmed that bed regeneration can be as short as 2.2–3.5 times shorter than the adsorption process [
43]. Aristov et al. carried out experimental studies from which their results showed that reducing the duration of desorption relative to adsorption resulted in higher device efficiency. For adsorption and desorption times of 255 and 100 s, respectively, more than double the SCP and COP values were obtained compared with a test run with adsorption and desorption times of 178 and 177 s [
44]. The experimental study also proved that the operational stability of the chiller is higher with a longer time for each cycle [
15].
A particularly important method for achieving more favourable performance parameters is to improve the heat and mass transfer within the bed. Heat transfer within the bed is hampered by the high thermal resistance of the porous adsorbent [
45]. Its improvement can be achieved in several ways, which mainly include increasing the heat transfer surface in the bed, increasing the heat transfer at the heat exchanger-adsorbent interface and increasing the heat transfer inside the bed by increasing the thermal conductivity of the material filling the bed [
5,
24,
28,
31]. The first method is related to increasing the surface area of the heat exchanger. For this purpose, different types and designs of heat exchangers are considered for use in adsorption chiller beds [
25]. The second method involves decreasing the thermal resistance by using coatings deposited on the surface of the heat exchanger or using binders to coat the heat exchanger with sorption material [
24,
46].
However, the last method is the most important from the point of view of this paper. Heat conduction through the adsorbent has a crucial impact on the overall thermal resistance of the bed [
47]. An improvement in this property without a significant deterioration of the sorption capacity will result in a much better heat exchange in the bed and, consequently, in an increase in the rate of adsorption and desorption processes as well as in an increase in the specific cooling power (SCP) [
18,
31]. This is possible e.g., by replacing the pure sorption material with a mixture of the sorbent and materials characterised by higher thermal conductivity. This additive can be in the form of powder, chips, shavings or chunks [
45,
48,
49]. A number of studies have already been carried out on this method of improving heat transfer [
48]. They checked e.g., the effect of copper powders on the thermal conductivity of a mixture with activated carbon, and an increase in thermal conductivity in the range of 2 to 25% was achieved [
31]. Improved heat transfer is also achieved by mixing a sorbent with a metal foam [
47]. In their paper, Demir et al. presented the results of a study on improving heat transfer in a bed by adding pieces of metal to silica gel. The authors decided to investigate four metals, aluminium, copper, brass and stainless steel, in two chip size ranges of 1.0–2.8 mm and 2.80–4.75 mm and at different percentages of shares of the additive, i.e., 5%, 10% or 15%. The findings indicated that of all the additives used, it was aluminium, at a percentage share of 15% in the mixture, that provided the greatest benefit in terms of heat transfer. The improvement in thermal diffusivity and heat transfer coefficient over pure silica gel was 157% and 242%, respectively. However, increasing the additive percentage in the mixture contributes to a significant reduction in the adsorption capacity of the bed. Thus, the search for the most suitable percentage should take into account the gain associated with improved heat transfer, but also the loss of sorption capacity associated with using less sorption material [
48]. In their paper, Askalany et al. focused on investigating the thermal conductivity of activated carbon with additives in the form of aluminium, copper and iron filings with a mass fraction of 10 to 30%. The highest increase in thermal conductivity in comparison with pure activated carbon was observed for 30% aluminium addition. For an aluminium addition of 20% by weight, the heat transfer coefficient increased from 1 to 20 W/(mK). As part of the study, a simulation of operation of a two-bed chiller was also carried out to check the effect of metal additives on the cycle time, SCP and COP of the device. An increase in the mass fraction of any of the additives contributes to a reduction in cycle time and an increase in the SCP [
49].
With the development of materials science, more and more modern materials are being developed. These include hybrid MOF (metal-organic frameworks) and SWS (selective water sorbents) materials [
24,
40]. The ideal sorbent should combine good thermal conductivity and high sorption capacity.
The group of innovative methods influencing the improvement of performance parameters of chillers also includes the possibility of fluidisation of the adsorbent bed and optimisation of chiller operation through the use of neural networks [
24,
50]. It is also possible to combine individual stages of thermal vapour compression to form multi-stage adsorption chillers, but this method only works under certain operating conditions [
51].
Thus, as shown, the simultaneous generation of cold and purification of water in adsorption chillers depends on many factors which are already described individually in the literature. However, so far there has been a lack of experiments in which two or more methods are used simultaneously to improve the performance of such devices. Therefore, this paper presents the results of tests carried out for a laboratory adsorption chiller operating in the two-bed mode with beds filled with silica gel with added copper at a mass fraction of 15%. The tests were carried out for four cycle times of 100, 200, 300 and 600 s in one operating configuration of the chiller. The results were compared with those obtained when the beds were only filled with silica gel, and the experiment was carried out under similar conditions.
2. Materials and Methods
In several previous publications, the authors presented the results of studies on the properties of mixtures of sorption material with additives characterised by high thermal conductivity. The experiments examined e.g., the sorption kinetics and thermal diffusivity of silica gel with copper and aluminium additives and carbon nanotube additives. Sztekler et al. published results that make it possible to determine the magnitude of the loss of sorption properties after using additives in the individual mixtures.
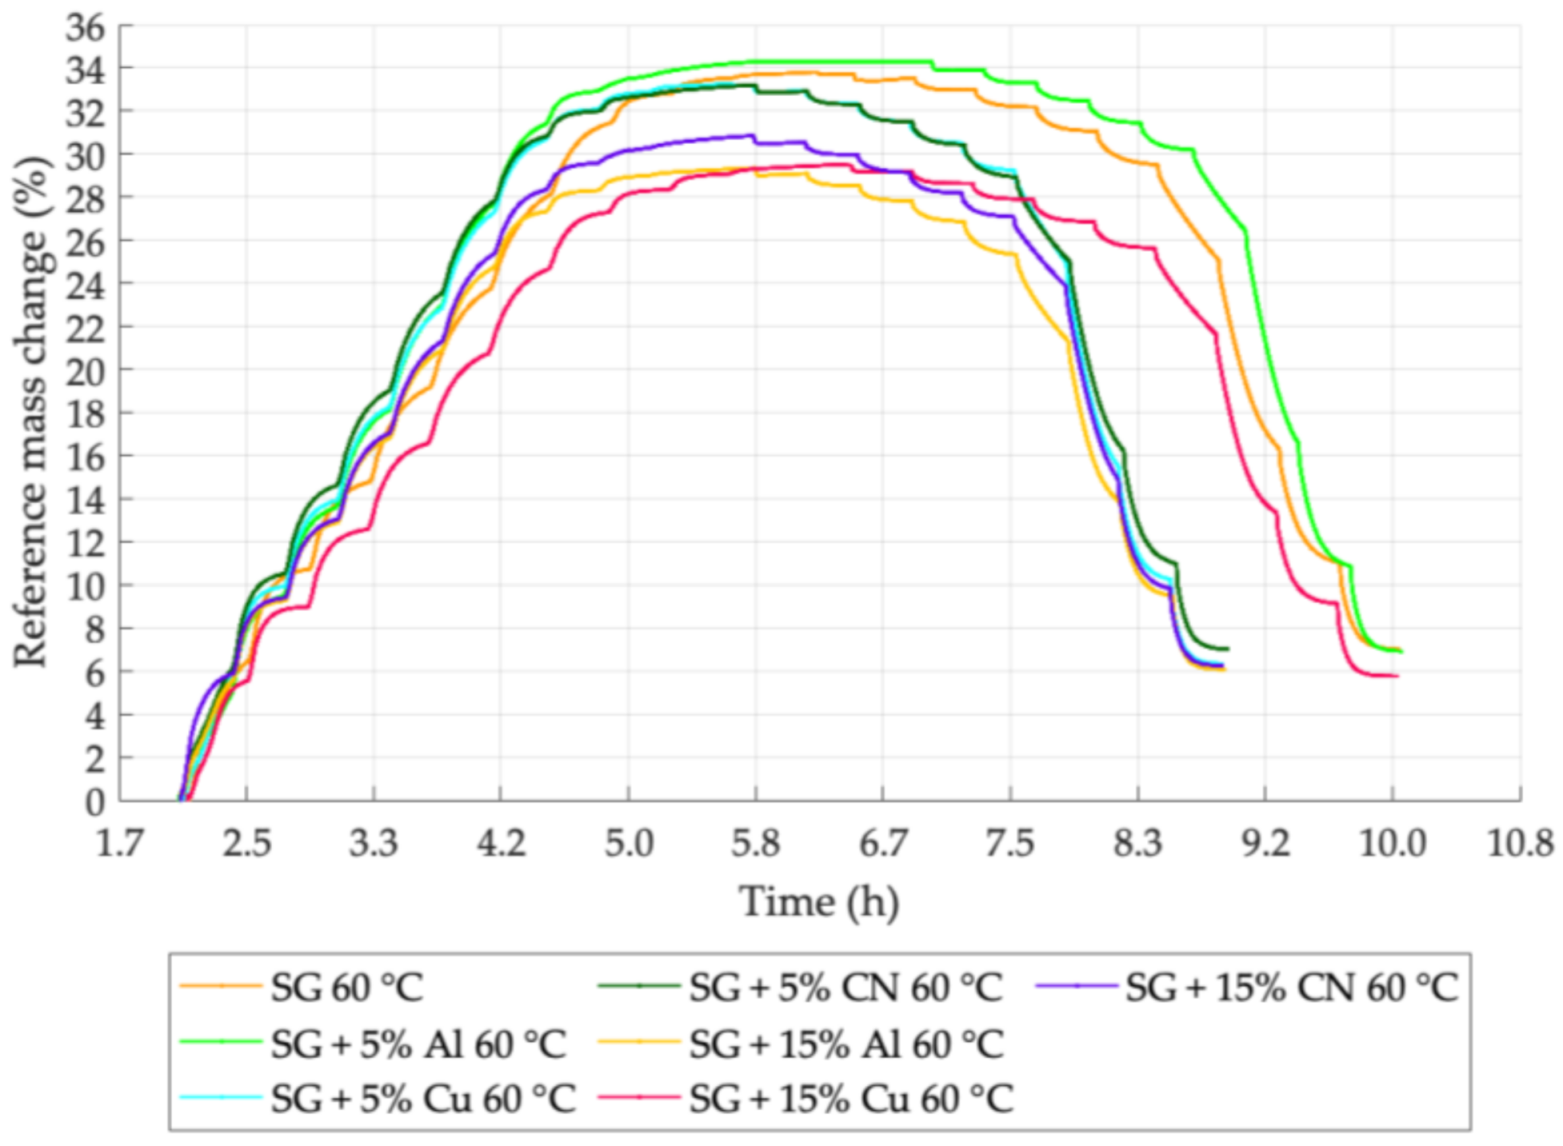
Figure 1 presents a graph of sorption kinetics for mixtures of silica gel (SG) with additives of aluminium (Al), copper (Cu) and carbon nanotubes (CN) in mass fractions equal to 5% and 15%, tested at 60 °C. Details of the experiment and a detailed analysis of the results can be found in the paper [
45].
The analysis of sorption kinetics curves clearly shows the loss of sorption properties of the samples with additives in comparison with the reference sample containing only silica gel. Naturally, for the mass fraction of the additive being 5%, this loss will be smaller, but in this case the focus was on its higher value. The sorption capacity of the material with added aluminium, copper and carbon nanotubes at a mass fraction of 15% decreases by 13.1%, 12.7% and 8.8%, respectively, compared with the mass change of the sample containing pure silica gel. Based on the sorption kinetics graph, it can also be seen that the sample with copper added at a mass fraction of 15% has the highest amount of adsorbate desorbed from its surface.
The next stage of the study was to assess the effect of the use of additives in terms of the increase of the cooling coefficient of performance and the specific cooling power of the desalinating adsorption chiller. This makes possible checking the actual effect of the additives on the operation of the adsorption chiller. The additive used was copper, at a mass fraction of 15%. The choice of this particular admixture was guided by, among other things, the conclusions from the study on additive sorption kinetics and the price and availability of the material. Particularly important for the selection of copper was its higher thermal conductivity compared to aluminium. For copper, it is 401 W/(mK), and for aluminium 237 W/(mK) [
48]. The value of the heat conductivity coefficient plays a key role in the heat transfer mechanism. Based on Fourier’s law, it can be concluded that its increase contributes to an increase in the density of the heat flux.
Of the two admixture mass fractions considered, equal to 5% and 15%, the latter was selected due to the, then, greater amount of material characterised by a high thermal conductivity coefficient in the mixture. At the cost of a greater loss of sorption capacity, it was decided to improve heat transport within the bed.
2.1. Description of the Adsorption Chiller with Desalination Functionality in the Test
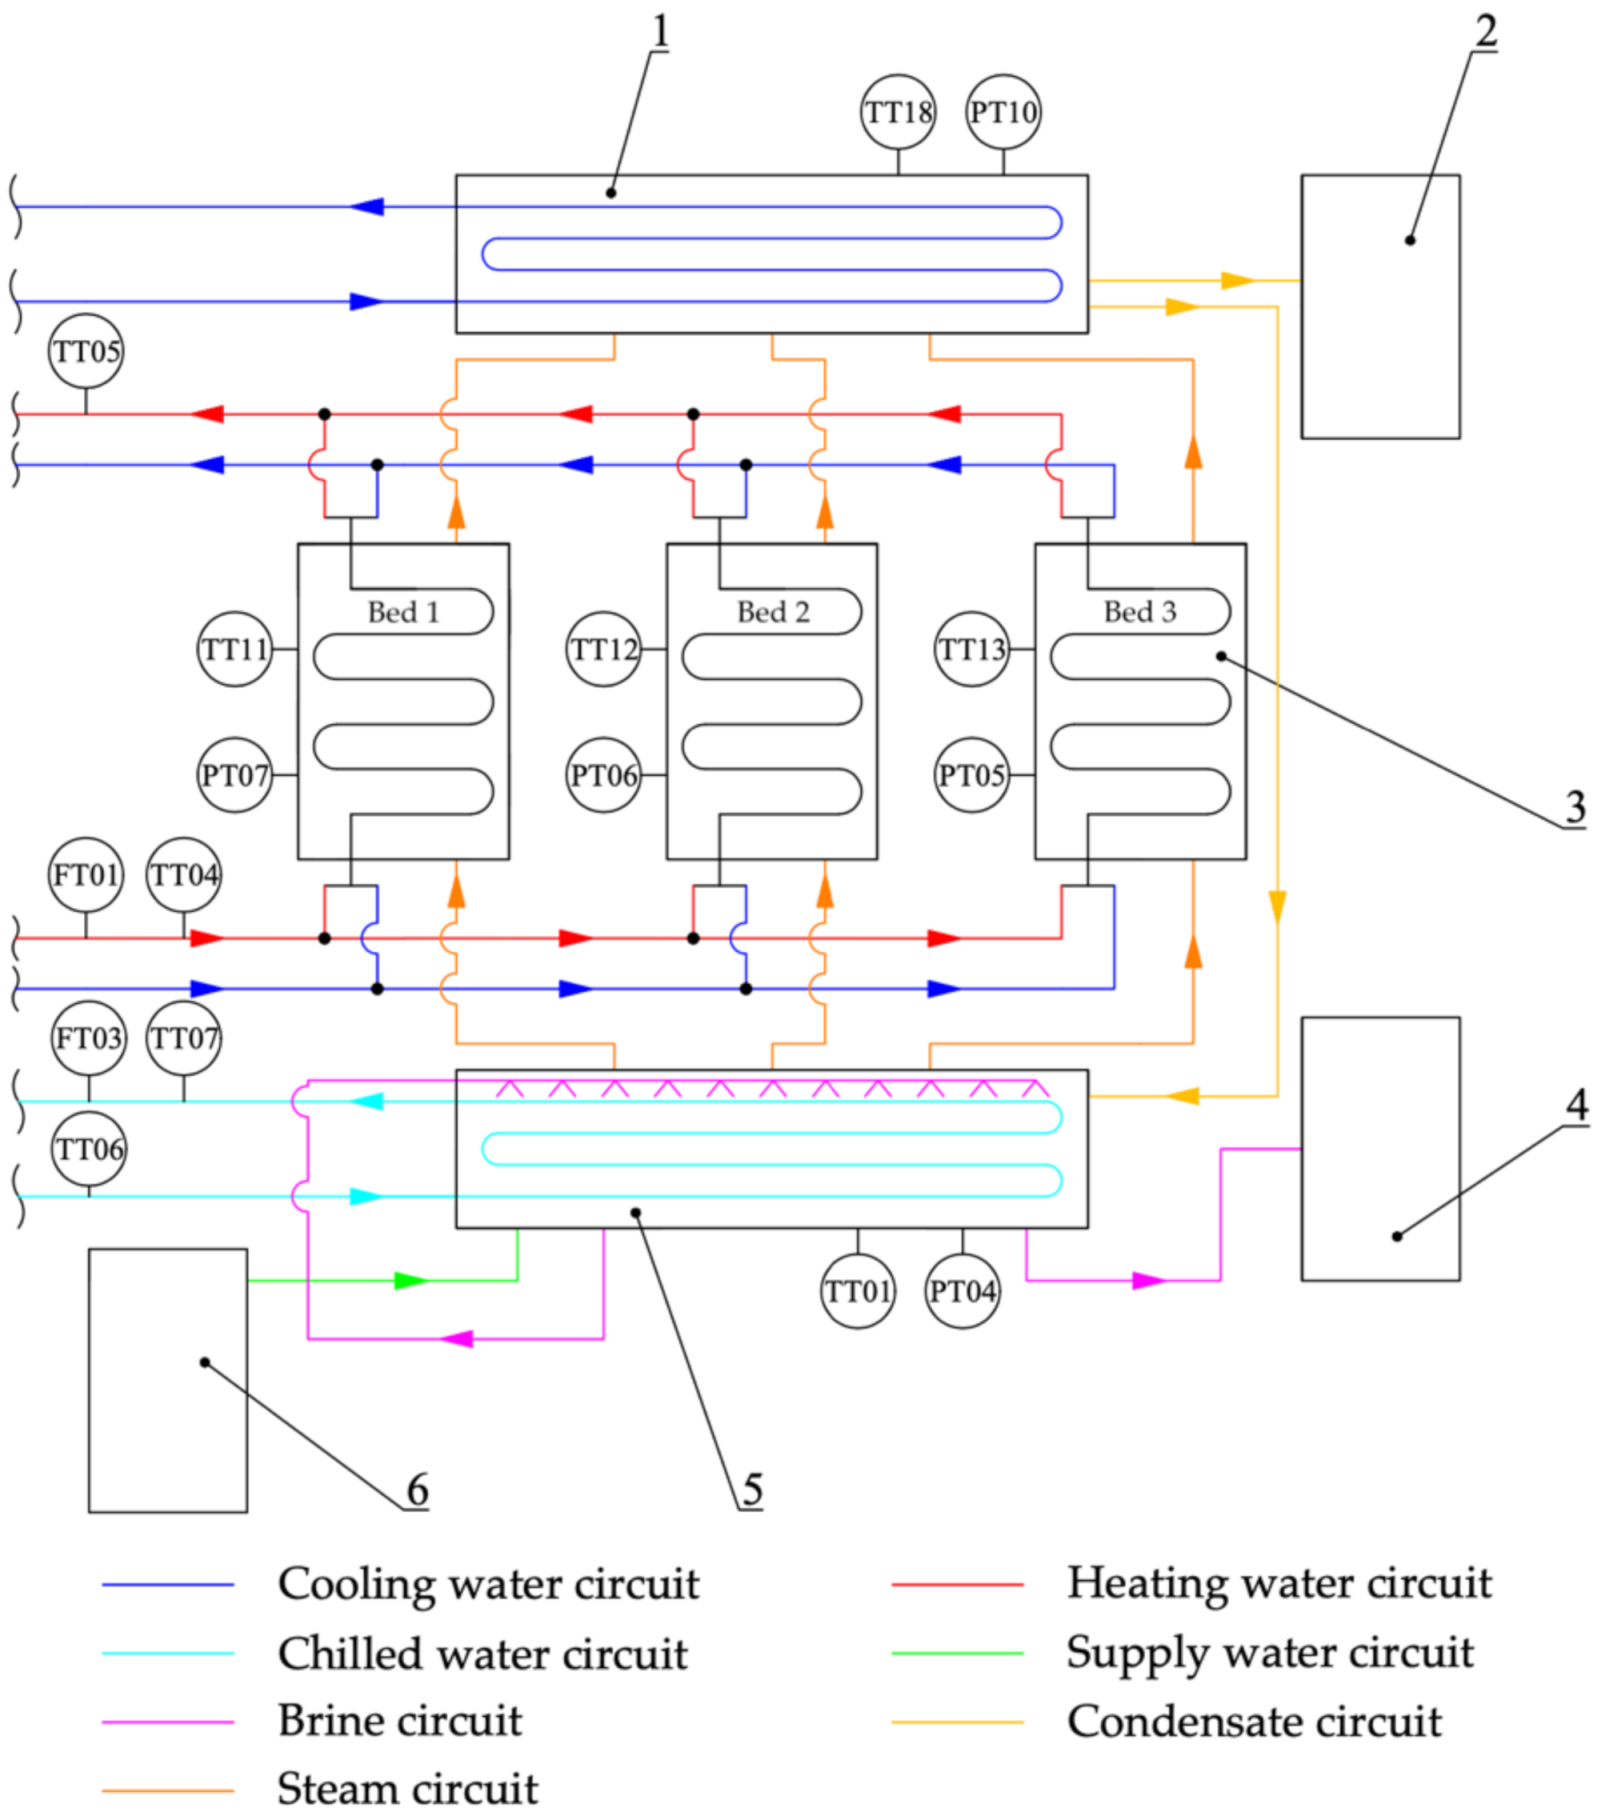
The experiment was carried out for a laboratory adsorption chiller with desalination functionality with the option of operating with two or three adsorbent beds in cooling and water-desalination modes. The device is located at the Energy Centre of the AGH University of Science and Technology in Krakow, Poland. Its simplified diagram is shown in
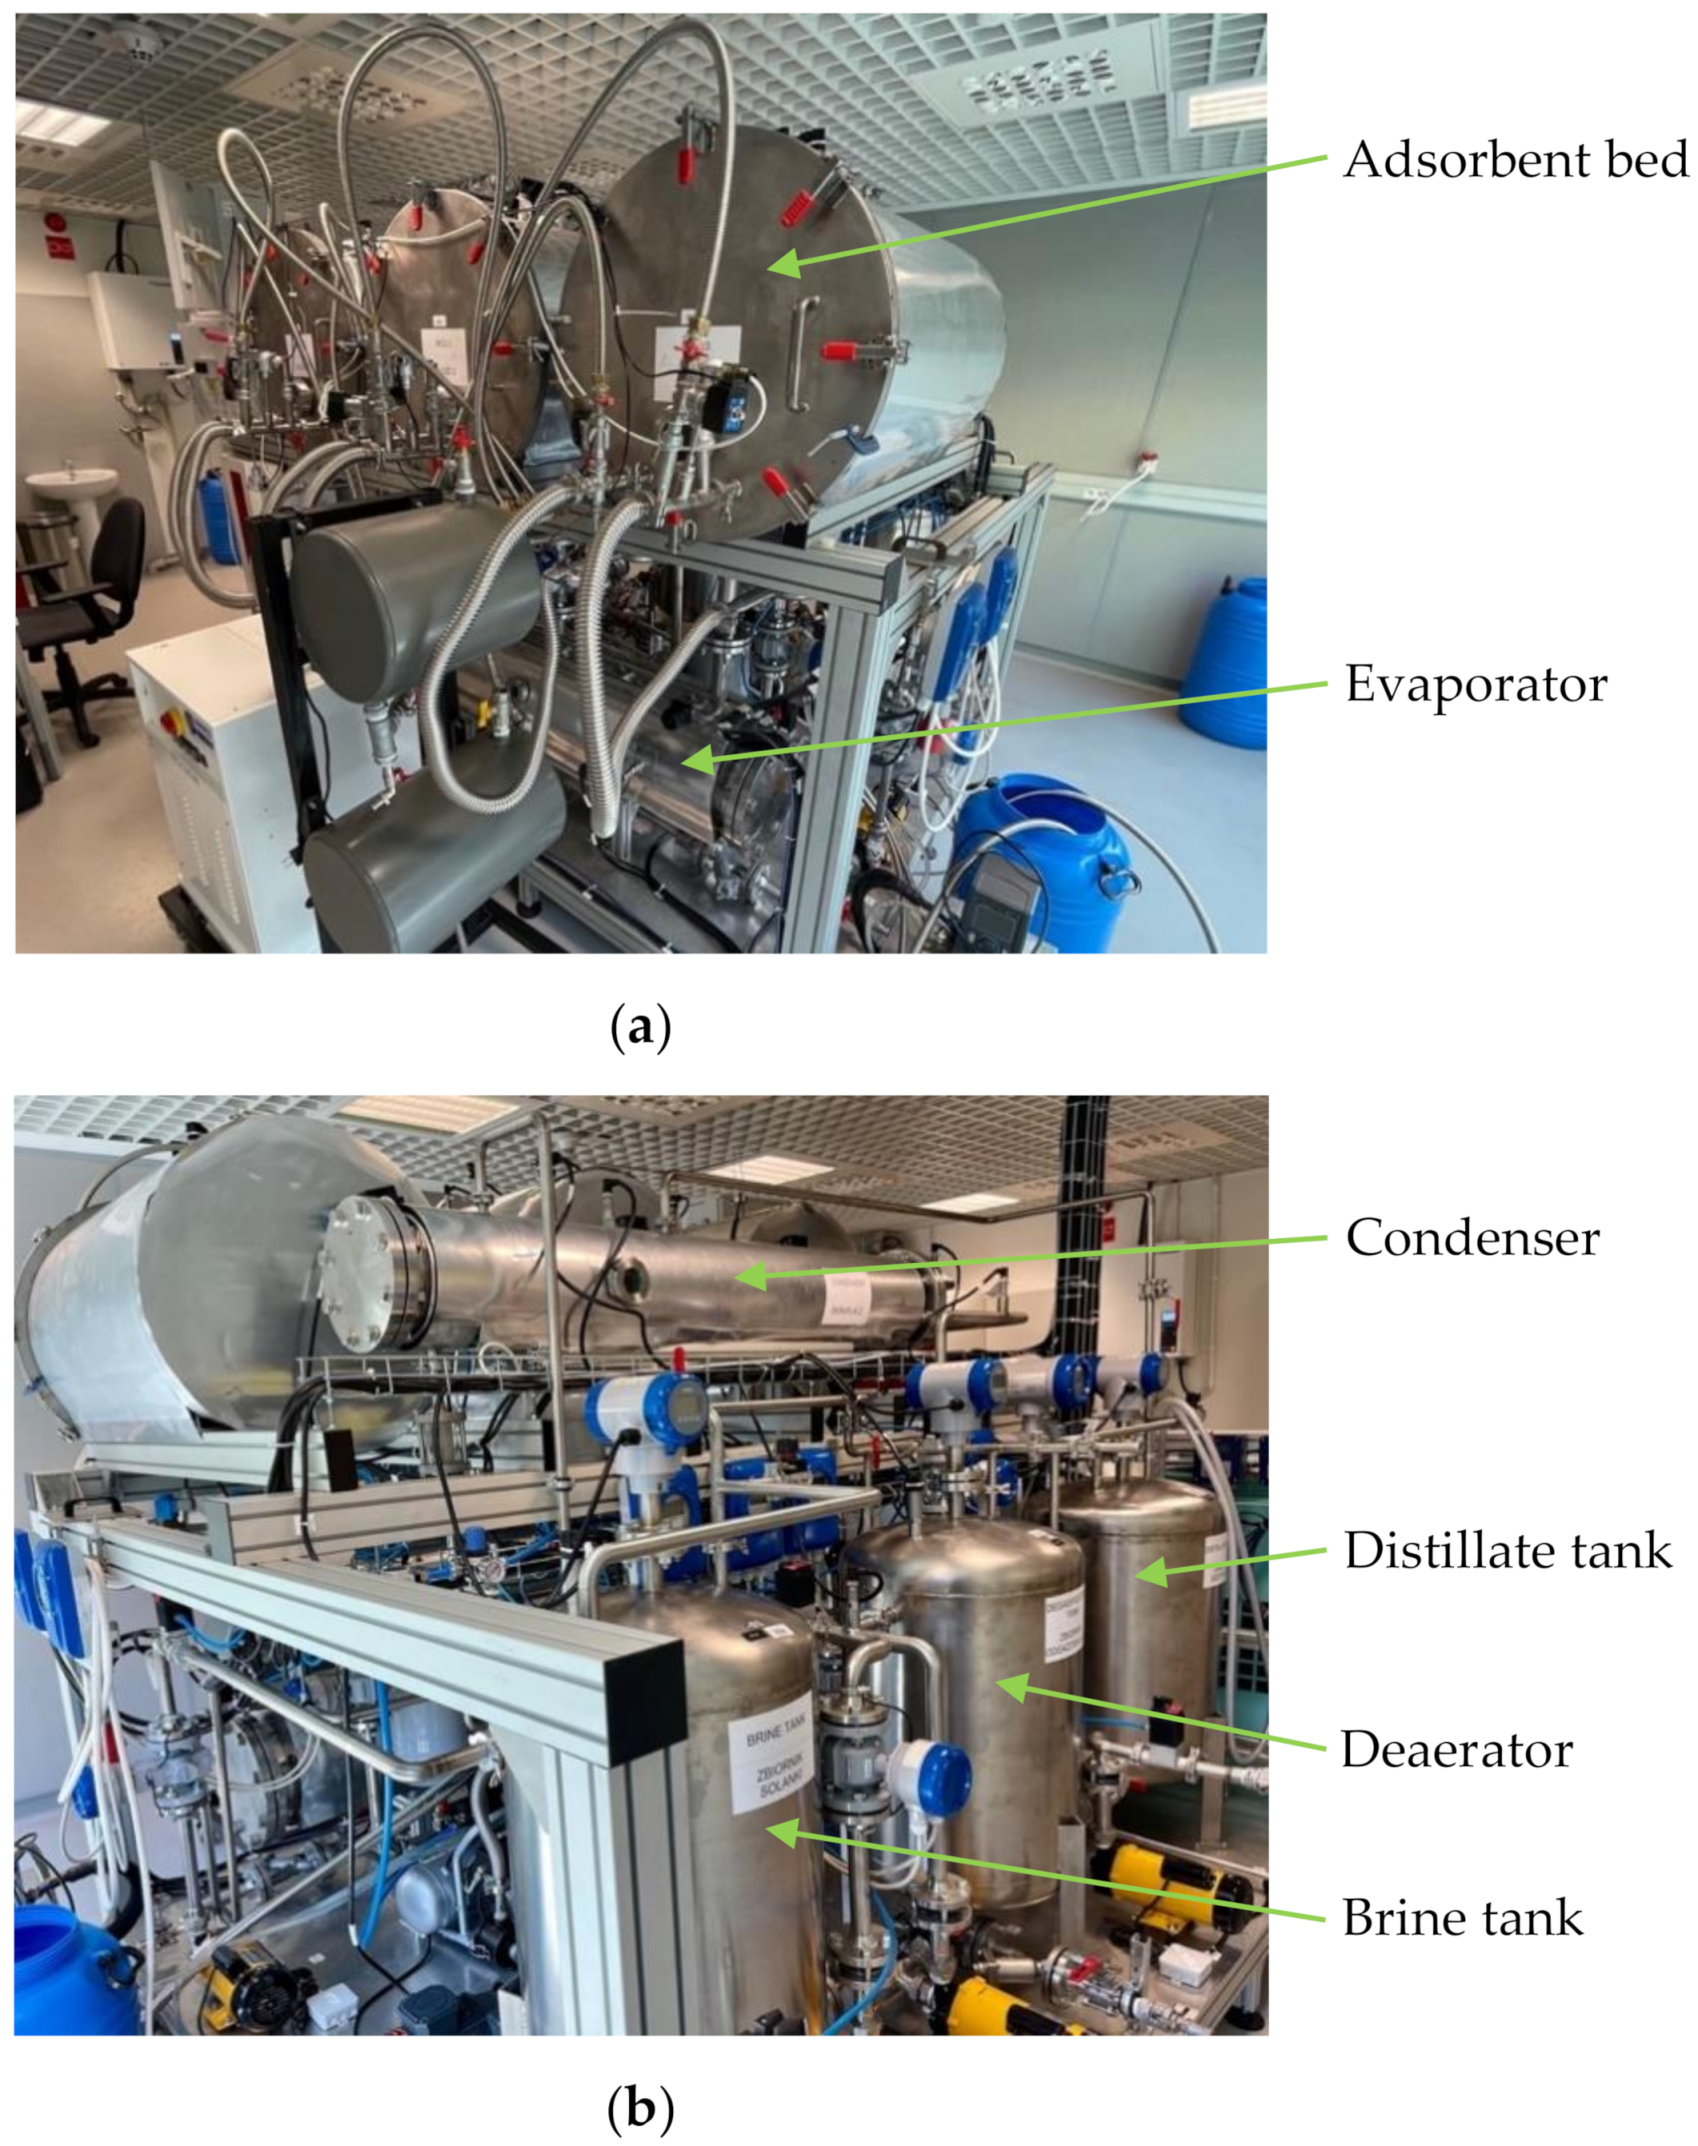
Figure 2. The main components of the adsorption chiller are the adsorbent beds (3), the evaporator (5), the condenser (1) and the expansion valve, which is responsible for maintaining the correct pressure difference between the condenser and the evaporator during the condensate flow from the condenser to the evaporator. The system under consideration is also equipped with a distillate tank (2), a brine tank (4) and a deaerator (6).
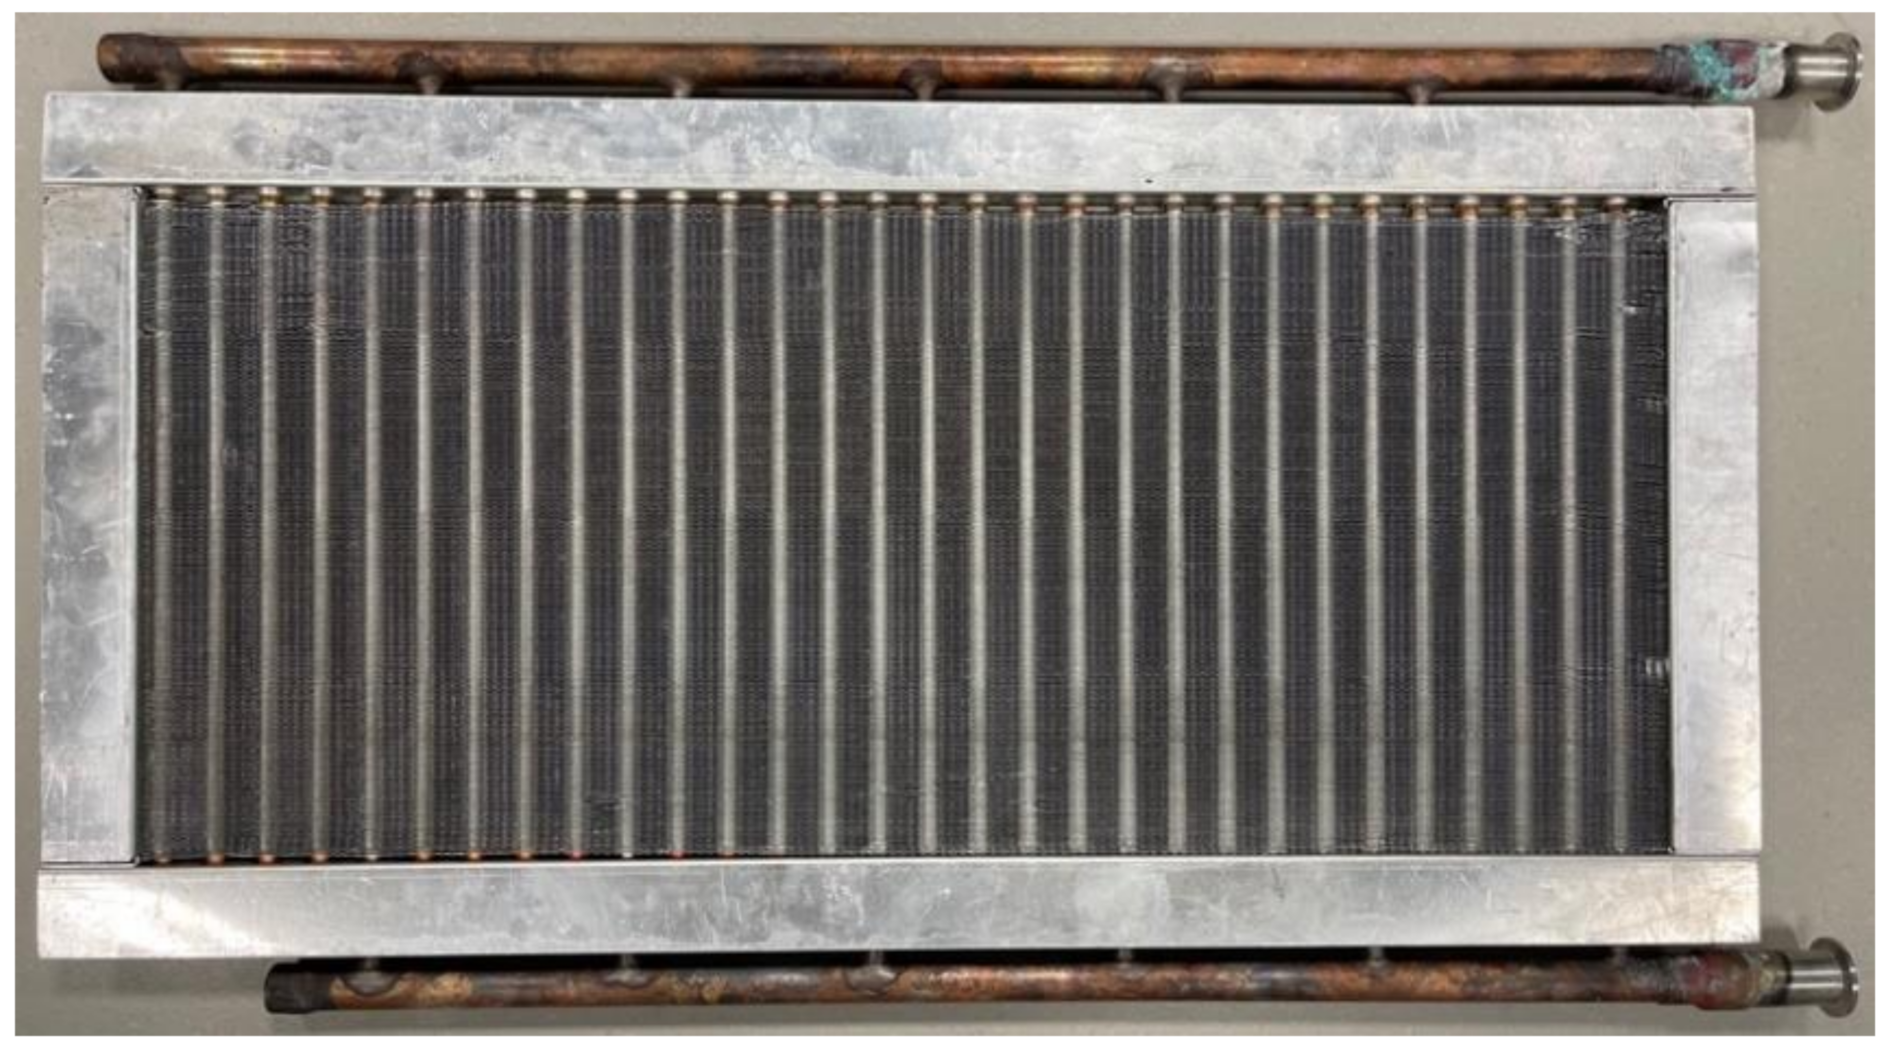
The description of the principle of operation of an adsorption chiller is presented for a laboratory three-bed adsorption chiller operating in a two-bed mode. First, saline water is supplied to the deaerator, where it is deaerated. Then it flows inside the supply water system to the evaporator where there is a system of exchanger pipes responsible for the heat exchange between the chilled water flowing in the chilled water circuit and the saline water in the evaporator. As a result of absorbing heat from the chilled water and transferring it to the saline water, this changes its state of the matter, which evaporates. In this system, the adsorbate circulates in a closed circuit and is sprayed onto the heat exchanger pipes through nozzles. Due to the low absolute pressure in the evaporator, evaporation can take place at a low temperature, thus allowing the desired cooling effect to be achieved. After reaching the appropriate level of salinity, the water that accumulates at the bottom of the evaporator flows from the evaporator to the brine tank. The next stage begins with the opening of the electromagnetic valves that separate the bed from the evaporator. The resulting water vapour then flows from the evaporator to the adsorber. At this point, the exothermic process of adsorption begins. In order for the adsorption to take place in an uninterrupted and maximally efficient way, the adsorption heat being released must be transferred into the cooling water circuit. Achieving the right temperature inside the adsorbent bed, both during adsorption and desorption, is possible due to the presence of the heat exchanger. Each bed is equipped with one finned coil heat exchanger unit configured in Tichelmann arrangement. The design of the heat exchanger consists of two main collectors, which are connected to each other by smaller diameter tubes. In order to increase the heat transfer surface area, the tubes are maximally elongated taking a meandering shape. A photograph of the heat exchanger is shown in
Figure 3.
After the adsorption is complete, the valve between the evaporator and the bed is closed, thus preventing the further flow of evaporated water. This initiates the pre-heating of the bed before the desorption process. Appropriate adjustment of the three-way valves on the inlet and outlet of the adsorber enables the flow of water from the heating circuit through the exchanger inside the bed. The correct temperature of the heating water is obtained in a cyclically operating electric boiler with a capacity of 18 kW. This device is responsible for simulating a source of low-temperature heat, which, in actual conditions man be, for example, waste heat. The high-temperature water first flows into a buffer tank and then feeds the beds, which are in the regeneration phase. Desorption starts as soon as the temperature in the bed is sufficient to evaporate water from the surface of the adsorbent. During desorption, the bed continues to be heated, such that the right desorption temperature is maintained at all times. The heat energy supplied causes an increase in pressure of the adsorbate previously adsorbed and consequently desorption from the silica gel surface. In the next stage, an electromechanical valve between the bed and the condenser is opened allowing the flow of the desorbed water vapour. The design of the condenser is similar to that of the evaporator. Inside the condenser there is a heat exchanger in which water from the cooling circuit flows. The gaseous adsorbate condenses and gives off heat on its surface. As a result, condensate accumulates in the lower part of the condenser. Depending on whether the adsorption chiller operates only in cooling mode only or whether desalinated water is to be an additional product, the distillate flows through the expansion valve back to the evaporator or is collected in a distillate tank as a product of the desalination process. Once desorption is complete, the bed is cooled before the next cycle begins. The three-way valve is set in such manner that the water supply from the heating circuit is closed and the supply from the cooling circuit is opened. With this particular device, basic recovery of heat from water is possible as the water passes through the heat exchanger in the bed and heats the bed during desorption. After opening the cooling water supply to the exchanger, heat recovery is carried out for a certain time, and the water, still stored in the bed, is fed into the heating water circuit, thus minimising energy losses. Water flow is forced into the heating, cooling and chilled water circuits by circulation pumps with a capacity of up to 500 L/h. The system provides the option to manually control the flow in selected circuits by means of ball valves with ½- or ¾-inch thread diameters.
Figure 4 shows photographs of the adsorption chiller with desalination function used to carry out the tests.
The adsorption chiller under investigation is classified in the group of low-pressure devices as the pressure ranges in the evaporator, condenser and beds are 0.5–3 kPa, 3–7 kPa and 0.5–7 kPa, respectively.
Table 1 presents the rated parameters of the tested adsorption chiller investigated.
The sorption material used in the experimental study was silica gel with a granulation of 700–800 μm manufactured in the Republic of Korea by KD Corporation. Its basic properties are presented in
Table 2. The additive responsible for improving heat transport inside the bed were pieces of copper classified as grade Cu-ETP. The length and width of the metal pieces were adapted to the size of the gap between the exchanger fins, and were approx. 5 mm and approx. 0.2 mm, respectively. The adsorbate was distilled water.
2.2. Measuring Instruments
During the experiment, the parameters of the adsorption chiller were recorded under stabilised operating conditions at an interval of 5 s. The SCADA control system was responsible for recording the measurement data on a personal computer. The data recorded were exported to CSV format in the form of a table. Analysis of the results was possible by editing them in Microsoft Excel.
The adsorption chiller control system is responsible for controlling all the parameters of the device and controlling some of the components, e.g., the pneumatic valves between the evaporator and the beds, and between the beds and the condenser. In addition, the chiller control system allows the modification of cycle times, preheating and cooling times and energy recovery times. The software can also be used to control the operation of pumps and valve settings.
Parameters such as temperature, pressure and flow rate were measured using appropriate measuring instruments. The location of the measuring instruments is shown schematically in
Figure 2. All the measuring instruments of the adsorption chiller were supplied from a specially allocated switchboard. Temperature measurements were taken using PT-1000 temperature sensors. Water and vapour flow rates were measured by an electromagnetic flow meter. Pressure values were recorded by pressure transducers. The most important parameters of the above-mentioned measuring devices are presented in
Table 3.
2.3. Conditions for the Experiment
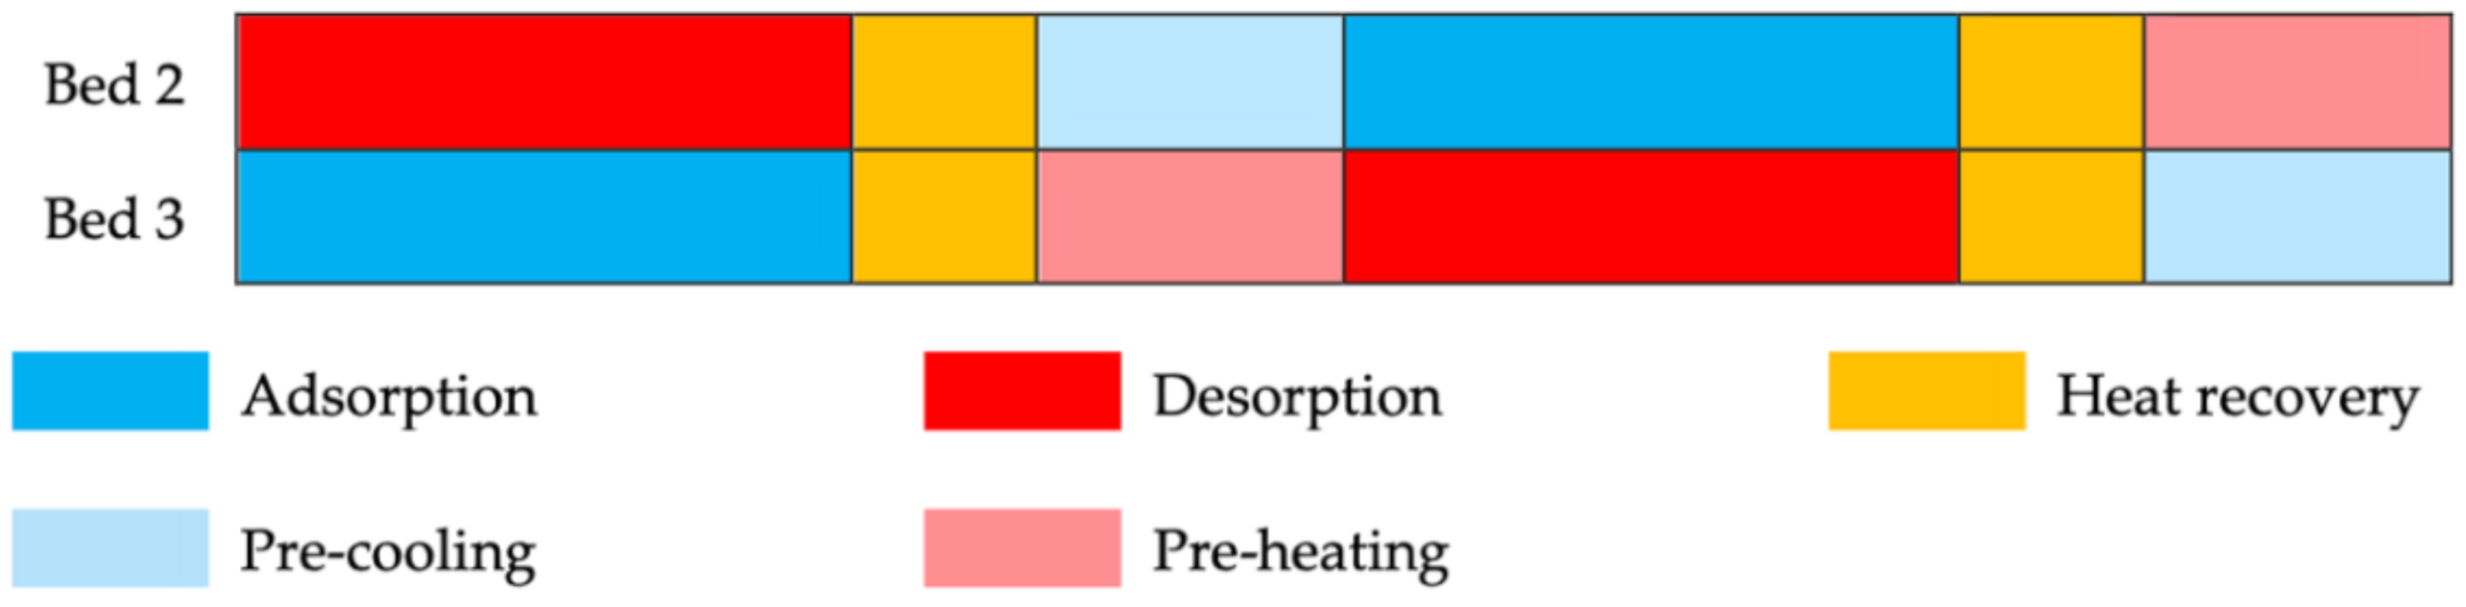
The experiment was performed using two of the three beds of the adsorption chiller (beds 2 and 3). Each bed alternately and cyclically carried out adsorption and desorption processes. The performance coefficients of the chiller were determined for fixed parameters, such as heating water temperature, cooling water temperature and the temperature of the chilled water obtained. The length of the cycle time was variable.
Table 4 summarises the most important operating parameters of the chiller under investigation for the experiment carried out.
One chiller cycle configuration was used for the testing. The full cycle consisted of pre-heating, desorption, heat recovery and adsorption.
Figure 5 shows the chiller operation configuration used during the tests.
The tests were carried out for different cycle durations, i.e., 100, 200, 300 and 600 s. The heating water temperature was approx. 80 °C. The total mass of the sorbent, together with the copper additive at a mass fraction of 15% in the two beds, was 6 kg.
2.4. Course of the Experiment
The experiment was preceded by the proper organisation of the test station. This mainly involved placing the adsorbent with added copper in a heat exchanger and proper preparation of the adsorption chiller. The heat exchanger was filled in such a manner as to create seven layers of alternating adsorbent and metal additive. The experiment was started by starting the adsorption chiller in the automatic mode, bringing the parameters to a stable state required according to the test conditions adopted and starting the measurements. The tests for a fixed temperature of heating water and all the cycle times took about 48 h including preparation of the entire system.
2.5. Performance Parameters of the Adsorption Chiller
The operation of an adsorption chiller is cyclical, which implies that its parameters are unstable. This causes difficulties in the experimental determination of the COP and the SCP. Therefore, in order to calculate the efficiency and power of the device, it is necessary to average the experimental data for the selected complete cycles. Taking into account the values obtained for the chiller under testing, the experimental cooling coefficient of performance (COP) and specific cooling power (SCP) were calculated based on the Equations (1) and (2), presented below:
where:
The cooling capacity CC and the total energy supply required to remove the water vapour adsorbed on the adsorbent surface (heating power, HP) required to determine the COP and SCP of the chiller were calculated according to Equations (3) and (4):
where:
mass flow rate;
cp—specific heat of water;
T—temperature;
FT03—chilled water flow rate;
TT06—chilled water inlet temperature at evaporator;
TT07—chilled water outlet temperature the evaporator;
FT01—hot water flow rate;
TT04—hot water inlet temperature at the beds;
TT05—hot water outlet temperature at the beds.
The following indices were used in the equations: c—chilled water; h—heating water; i—inlet; o—outlet. For all the calculations, the specific heat of the chilled and heating water was equal to .
4. Discussion
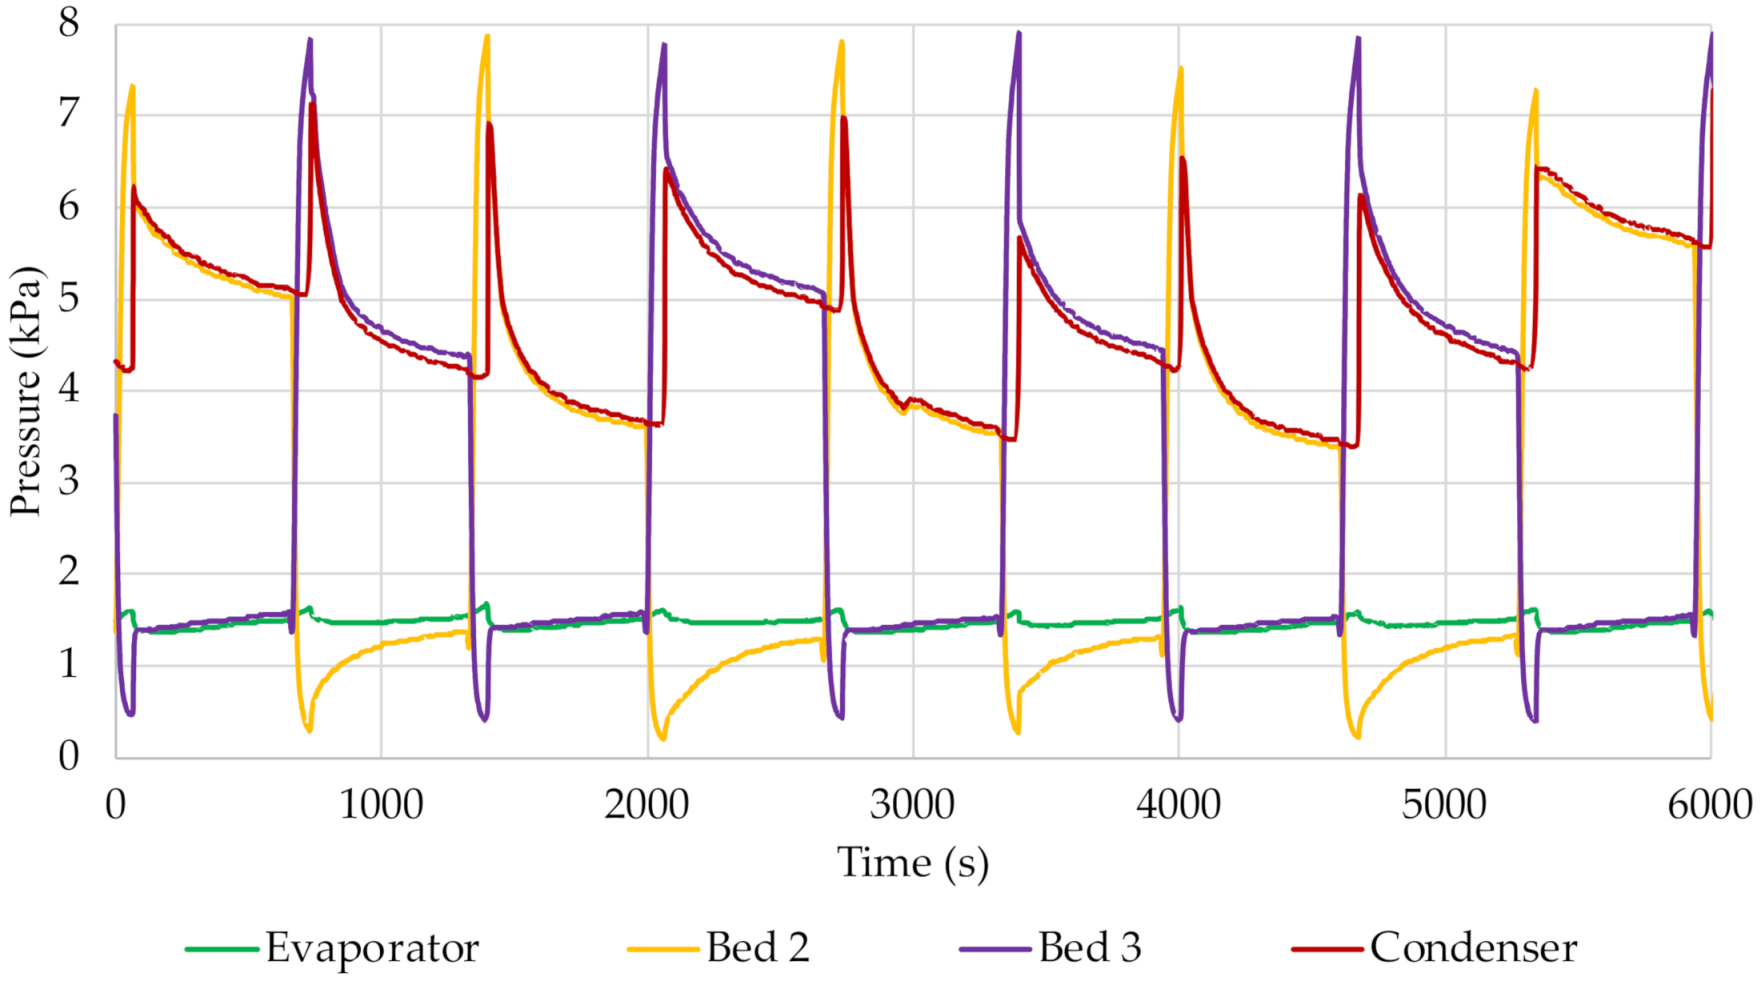
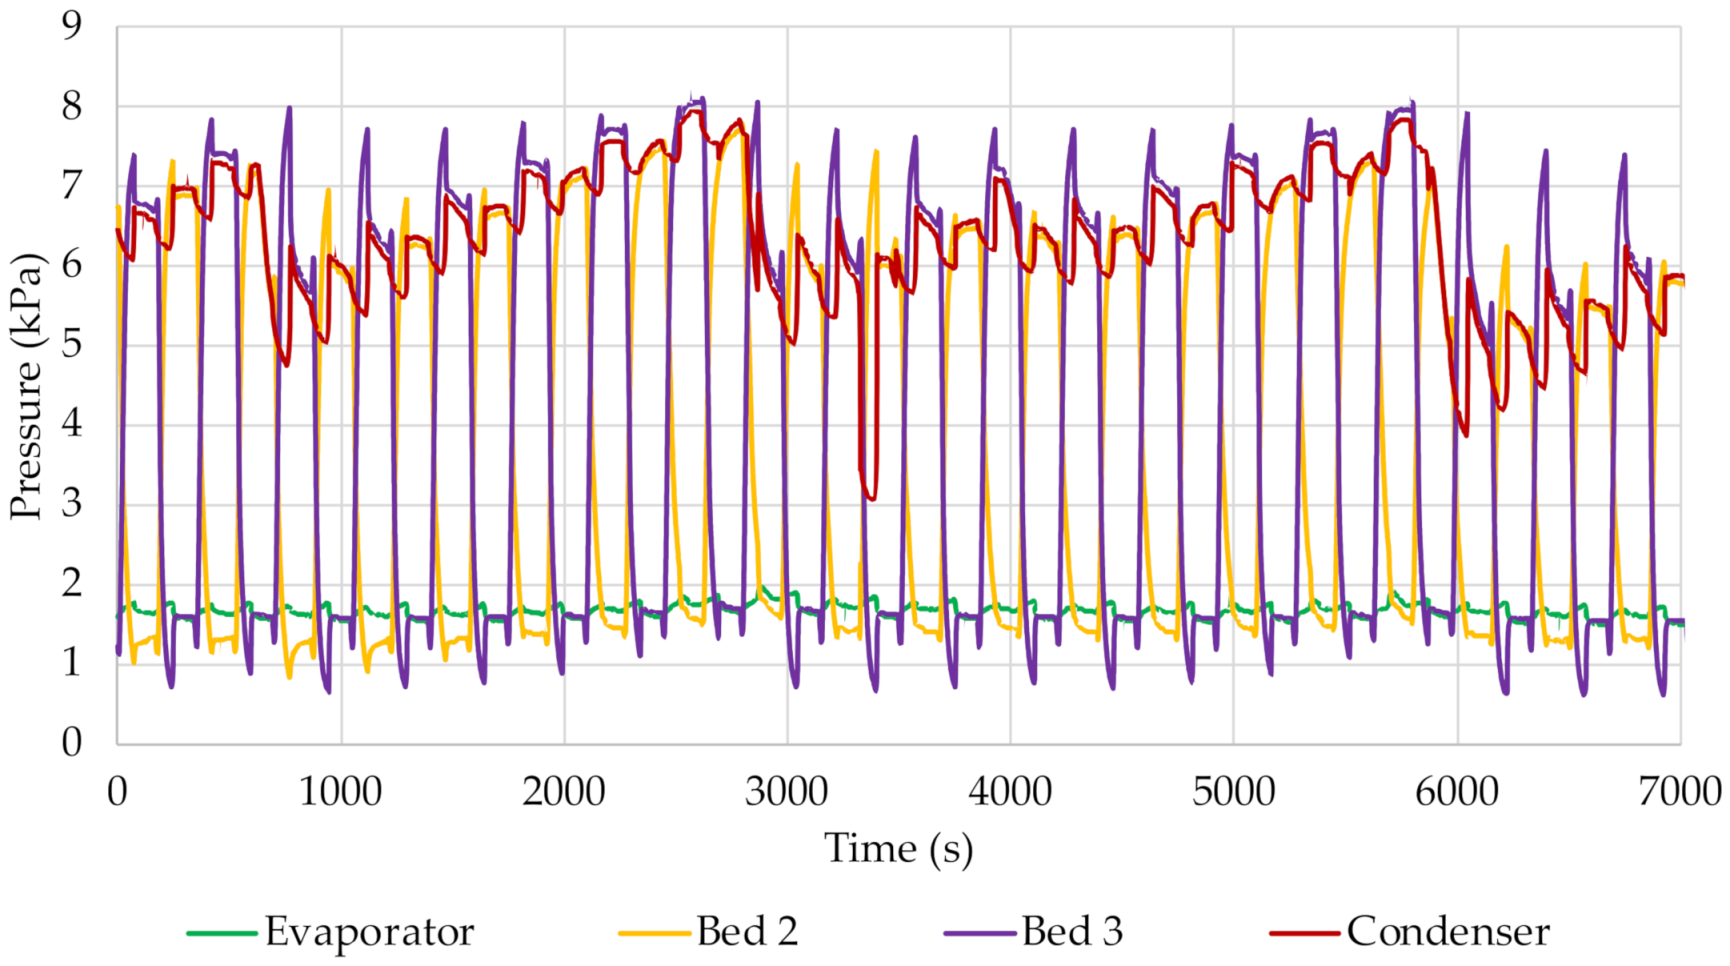
By following the pressure graphs shown in
Figure 6 and
Figure 7, a clear boundary between the successive cycles can be observed. At the point when the adsorption process starts in one of the beds, the pressure inside it increases and its value approaches the pressure in the evaporator. However, these pressures did not reach the same value for any of the times studied. It was found that, as the cycle time increased, the difference between the pressure in the evaporator and the pressure in the bed during adsorption decreased. This means that the time was too short for these values to reach the same level. On the other hand, during the desorption process, the pressure in the bed increases due to the formation of steam. For each cycle time, the pressure in the condenser was almost equal after opening the valves between the respective bed and the condenser. Its value decreased as the pressure in the bed decreased due to steam flow and condensation.
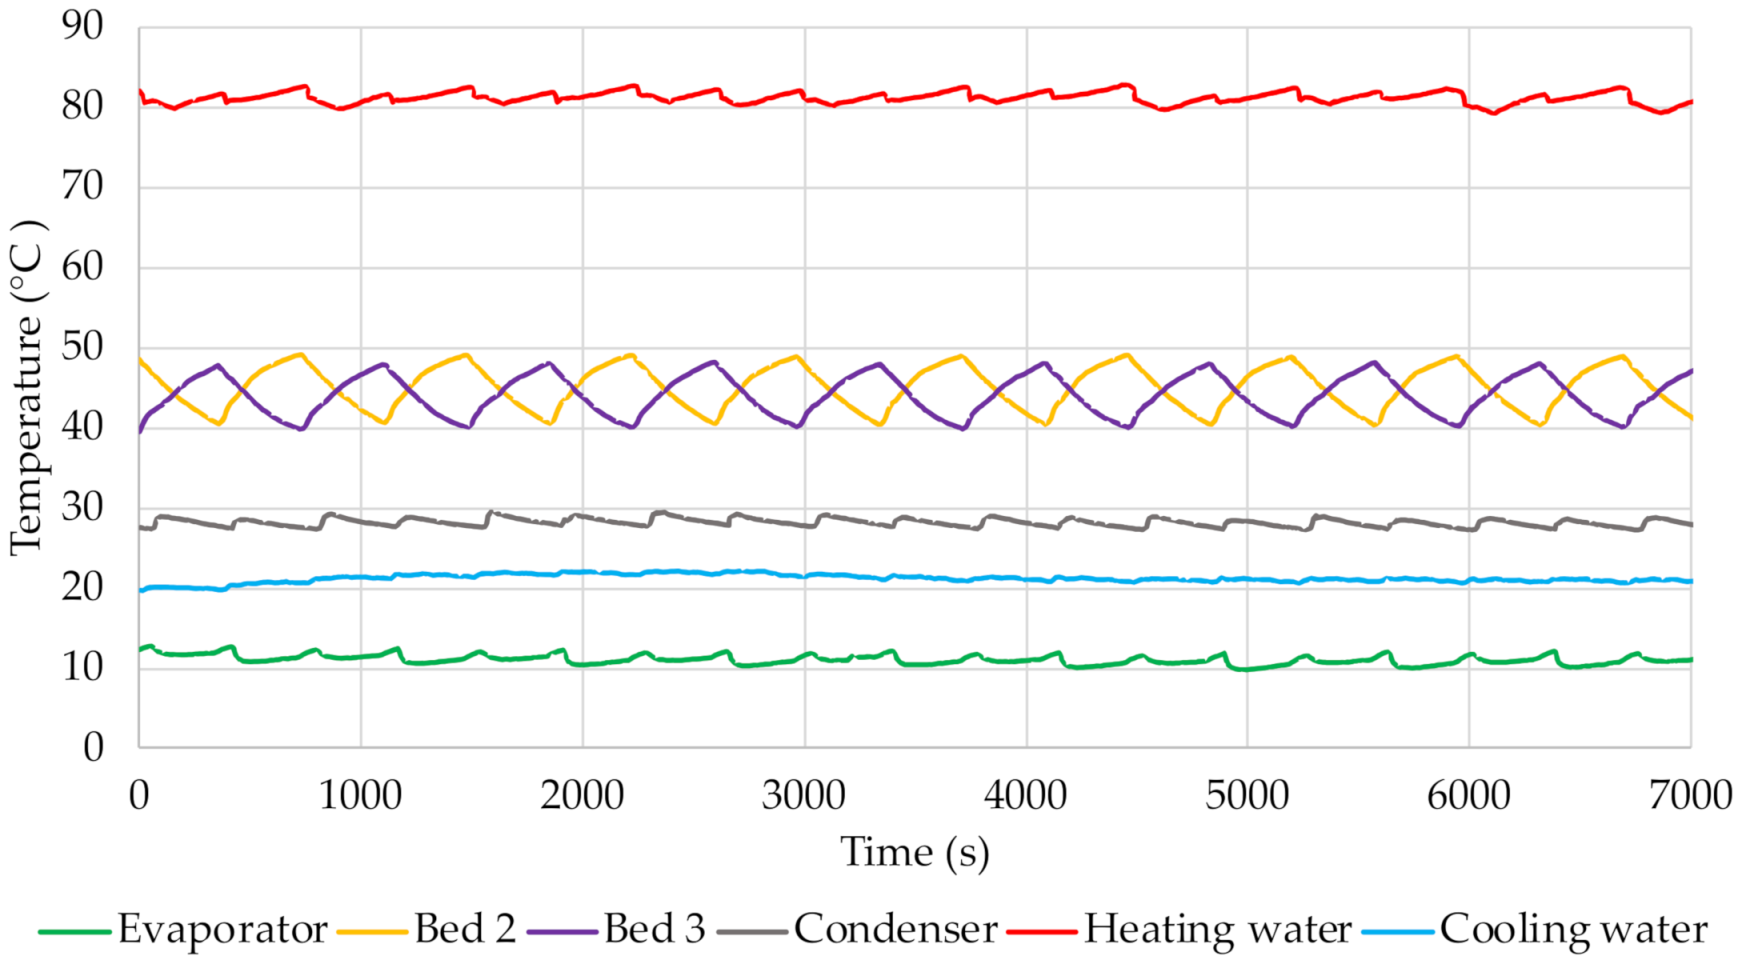
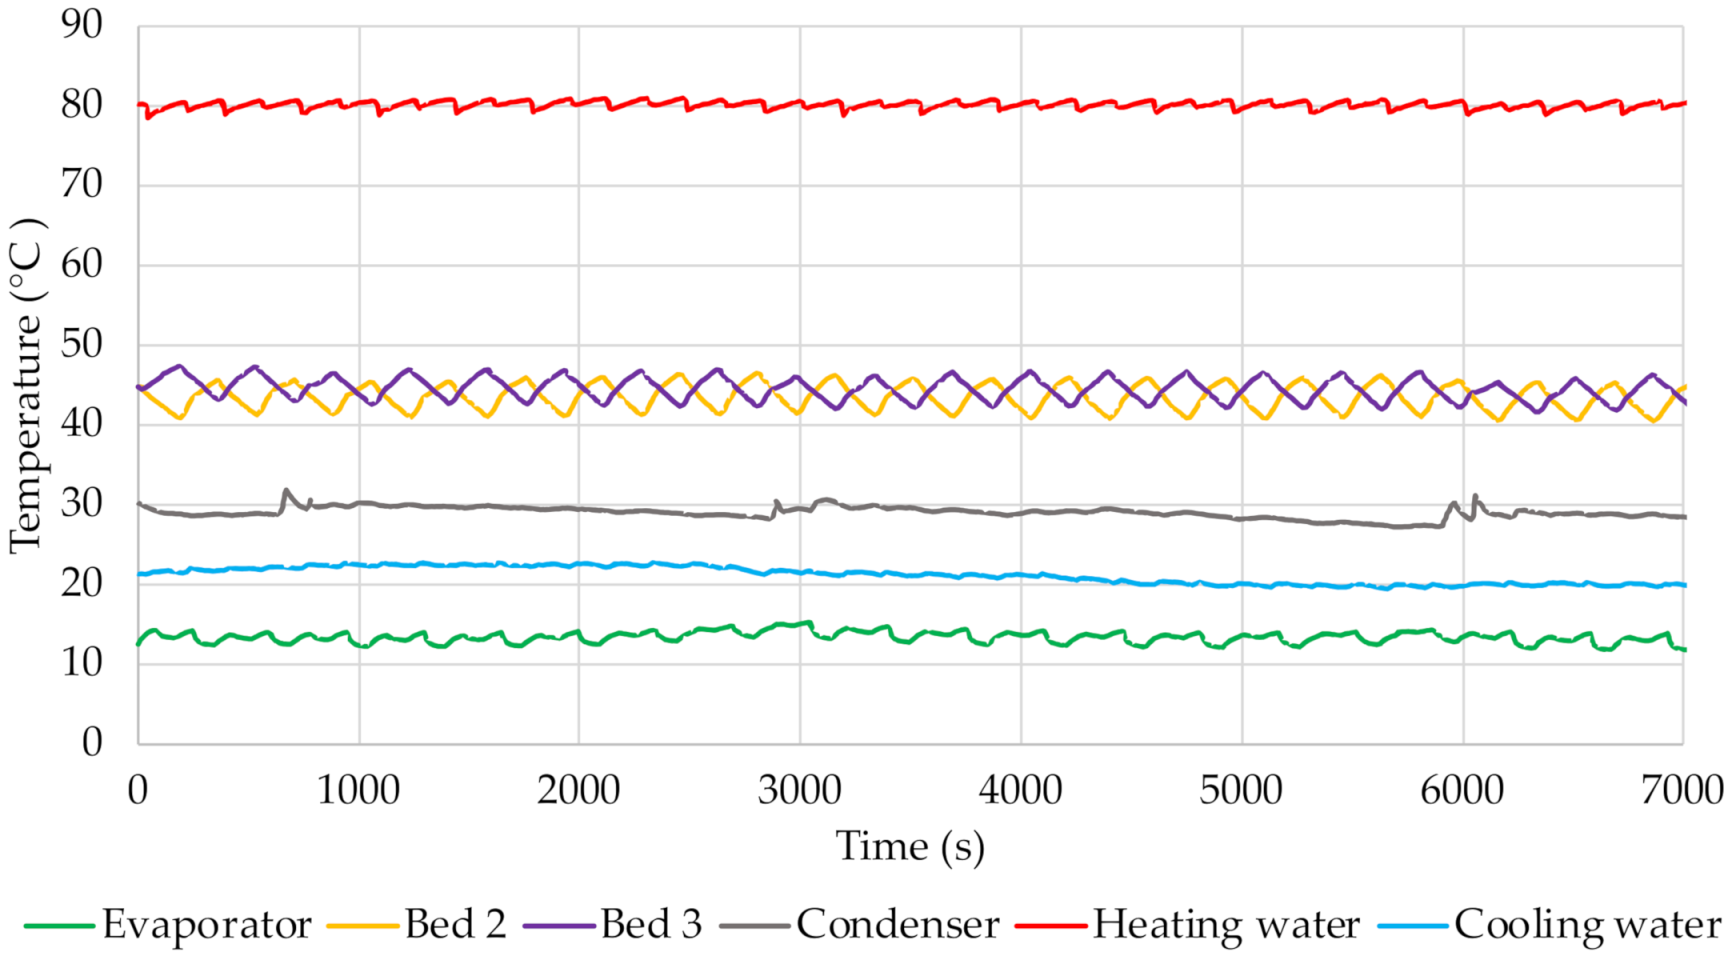
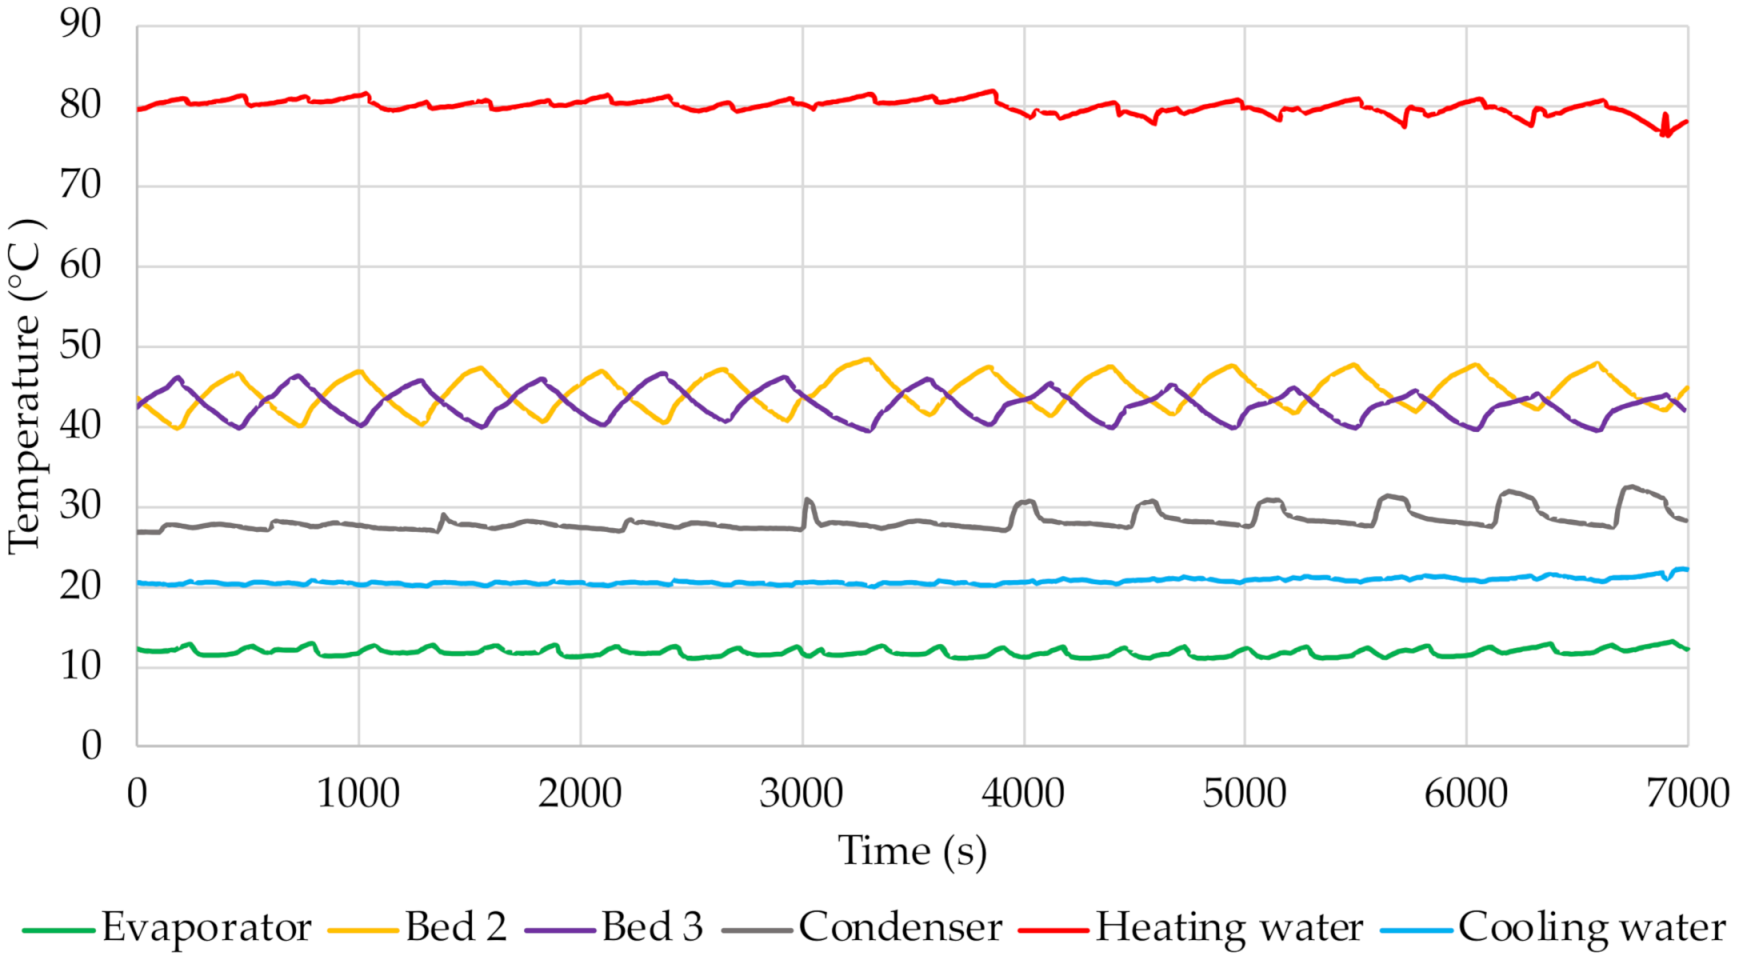
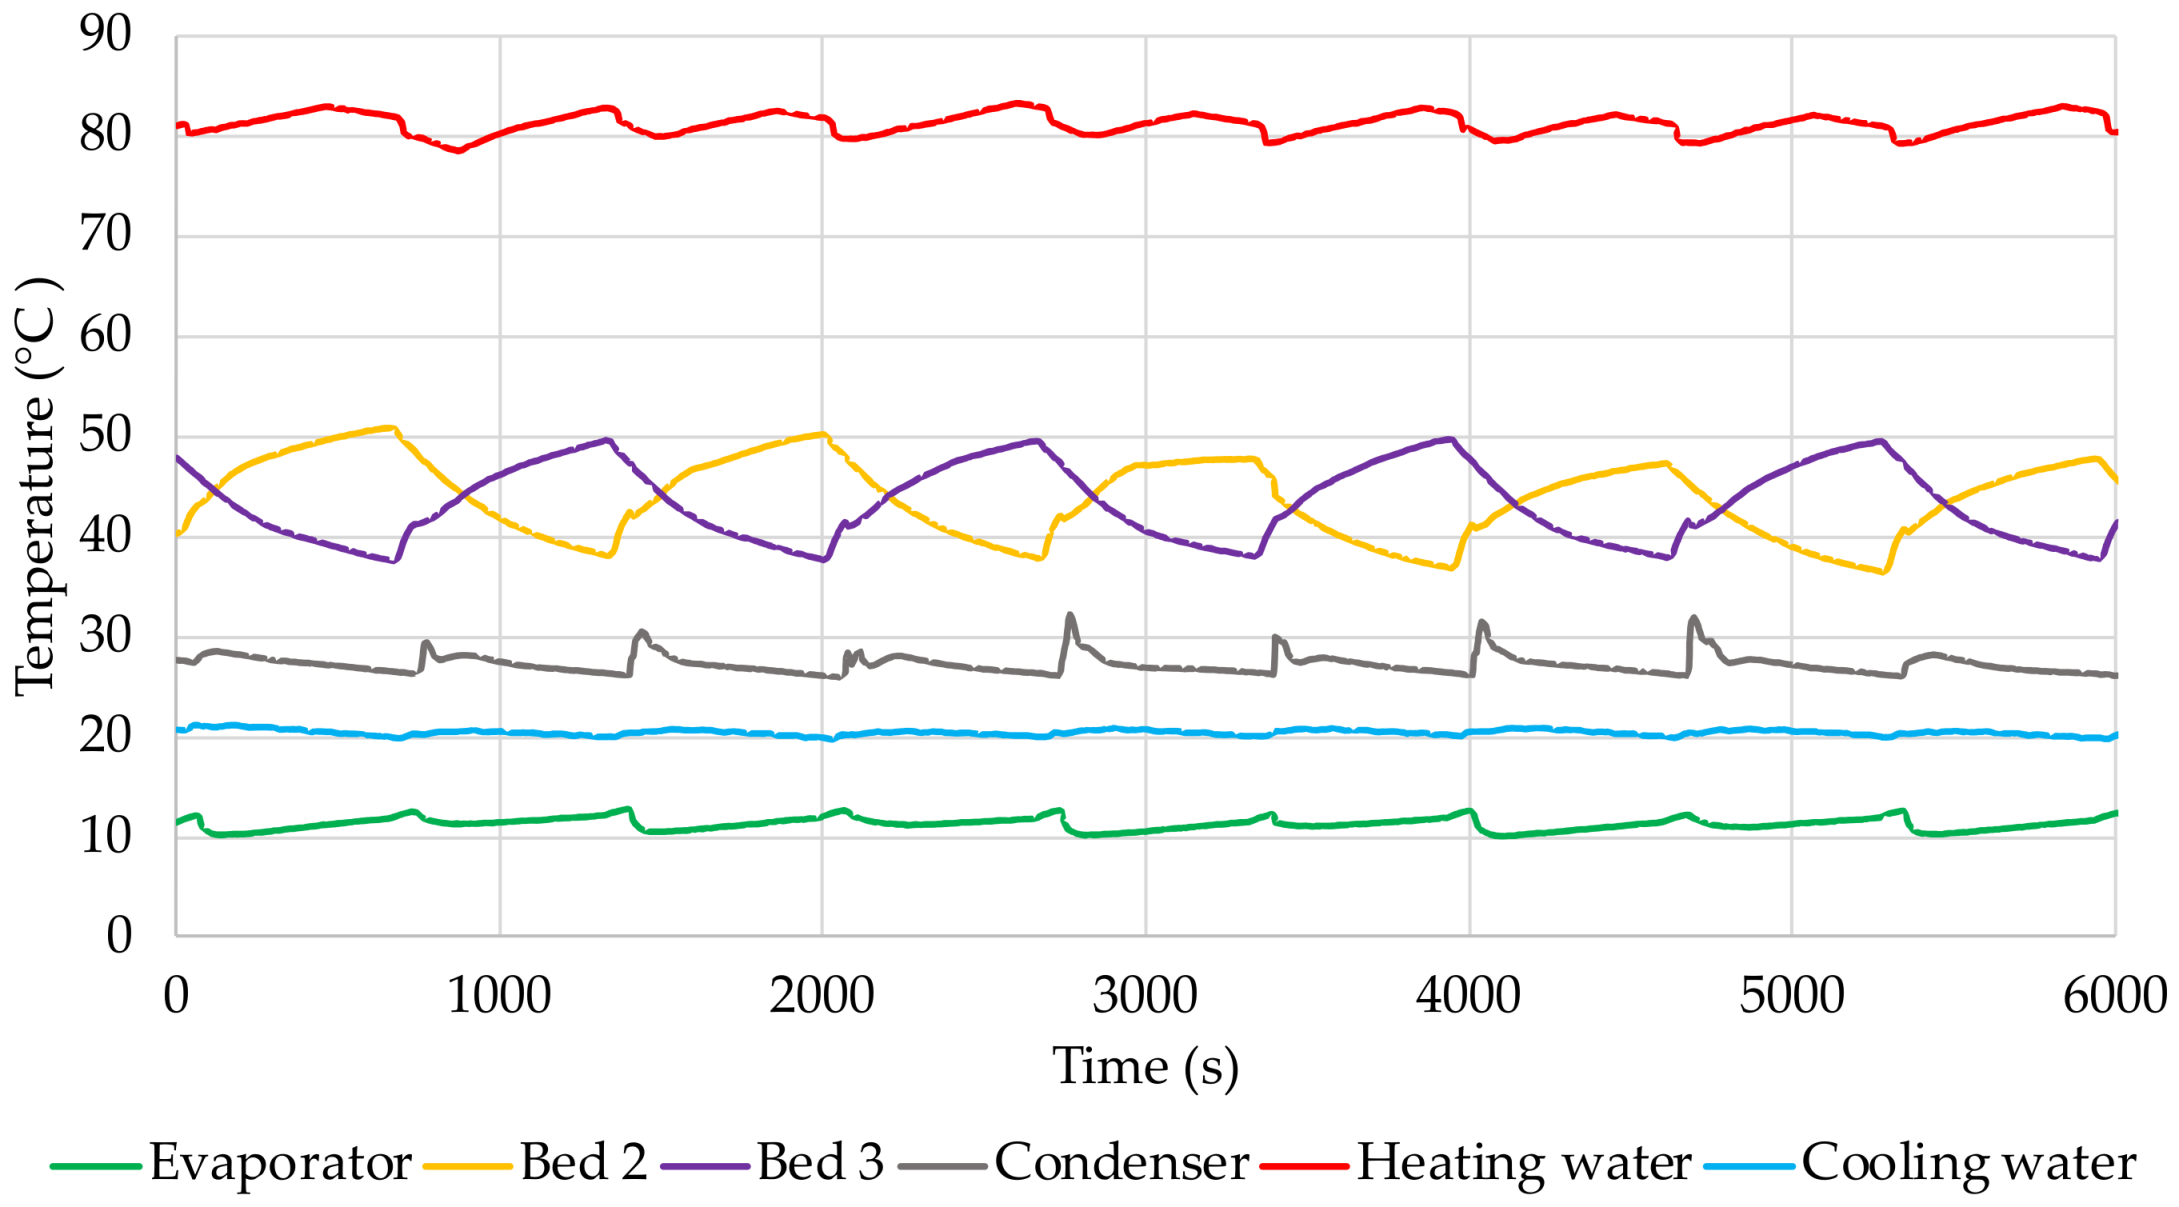
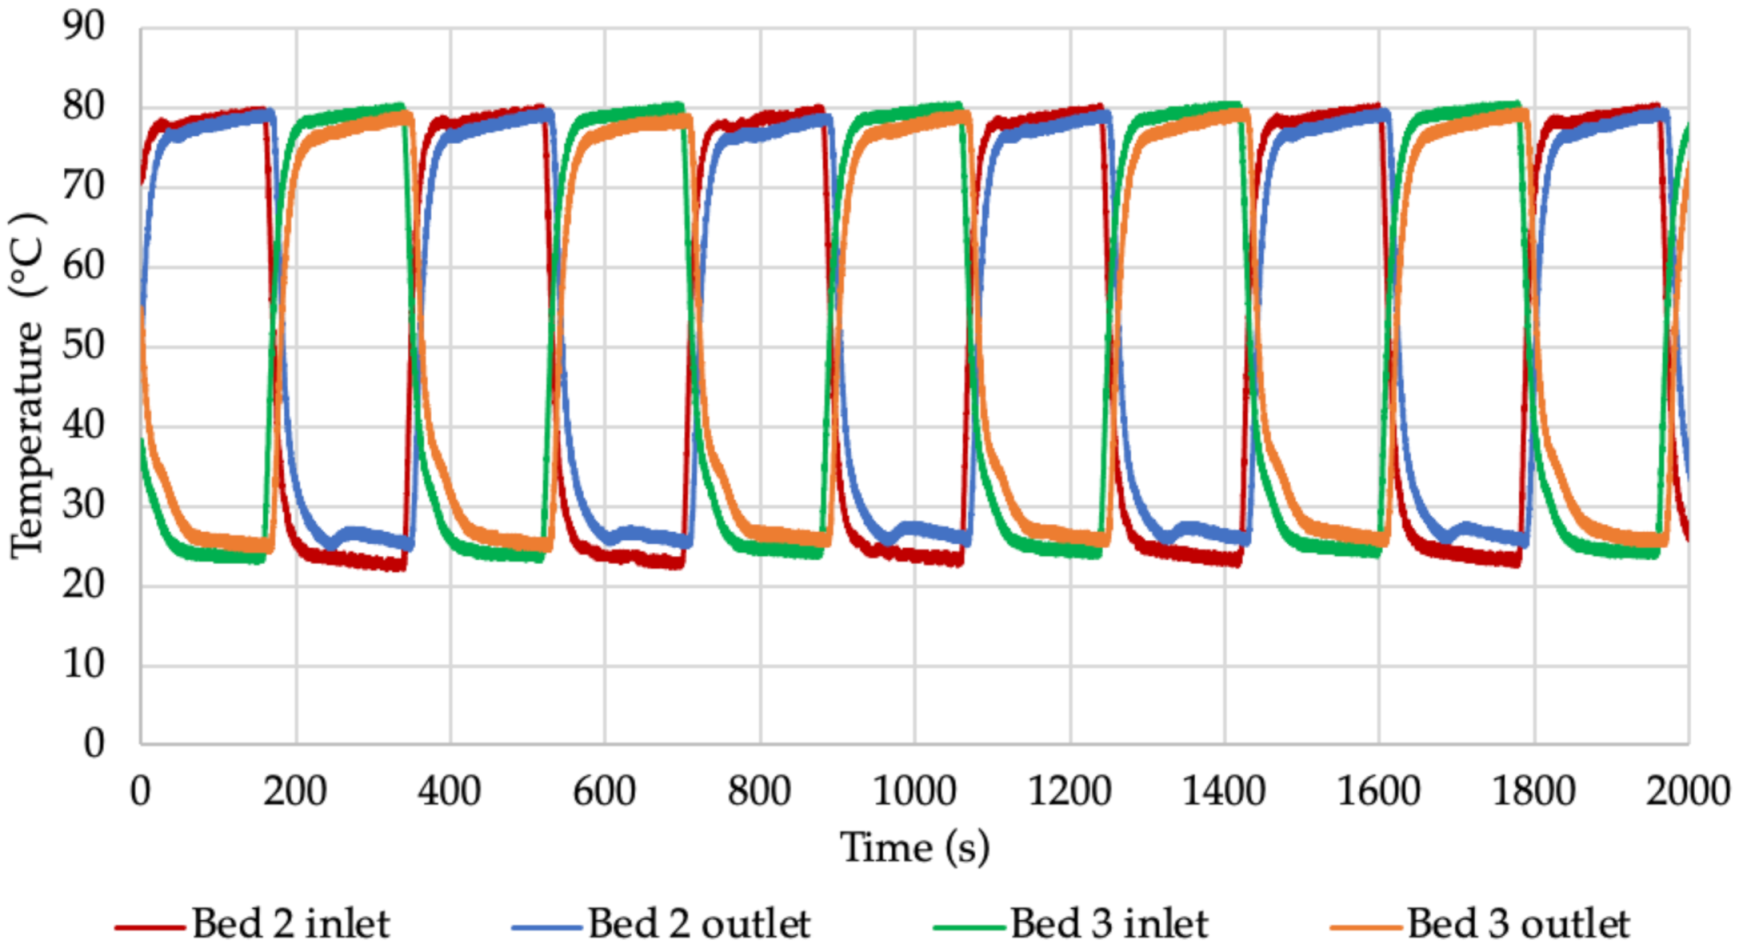
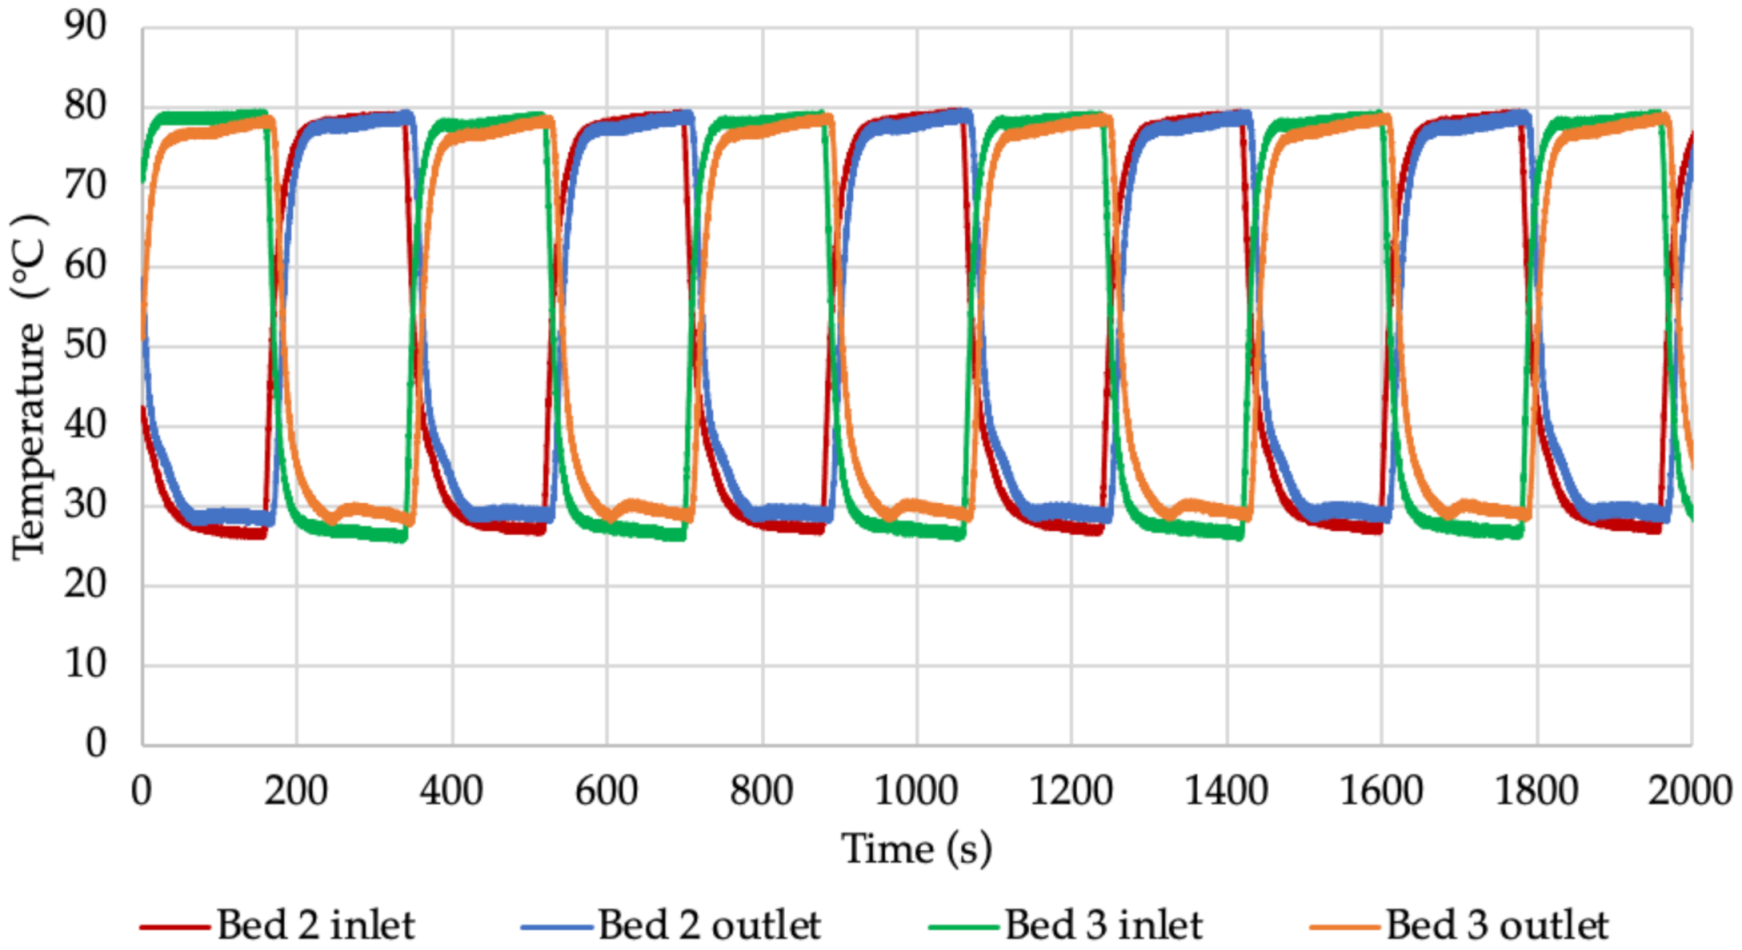
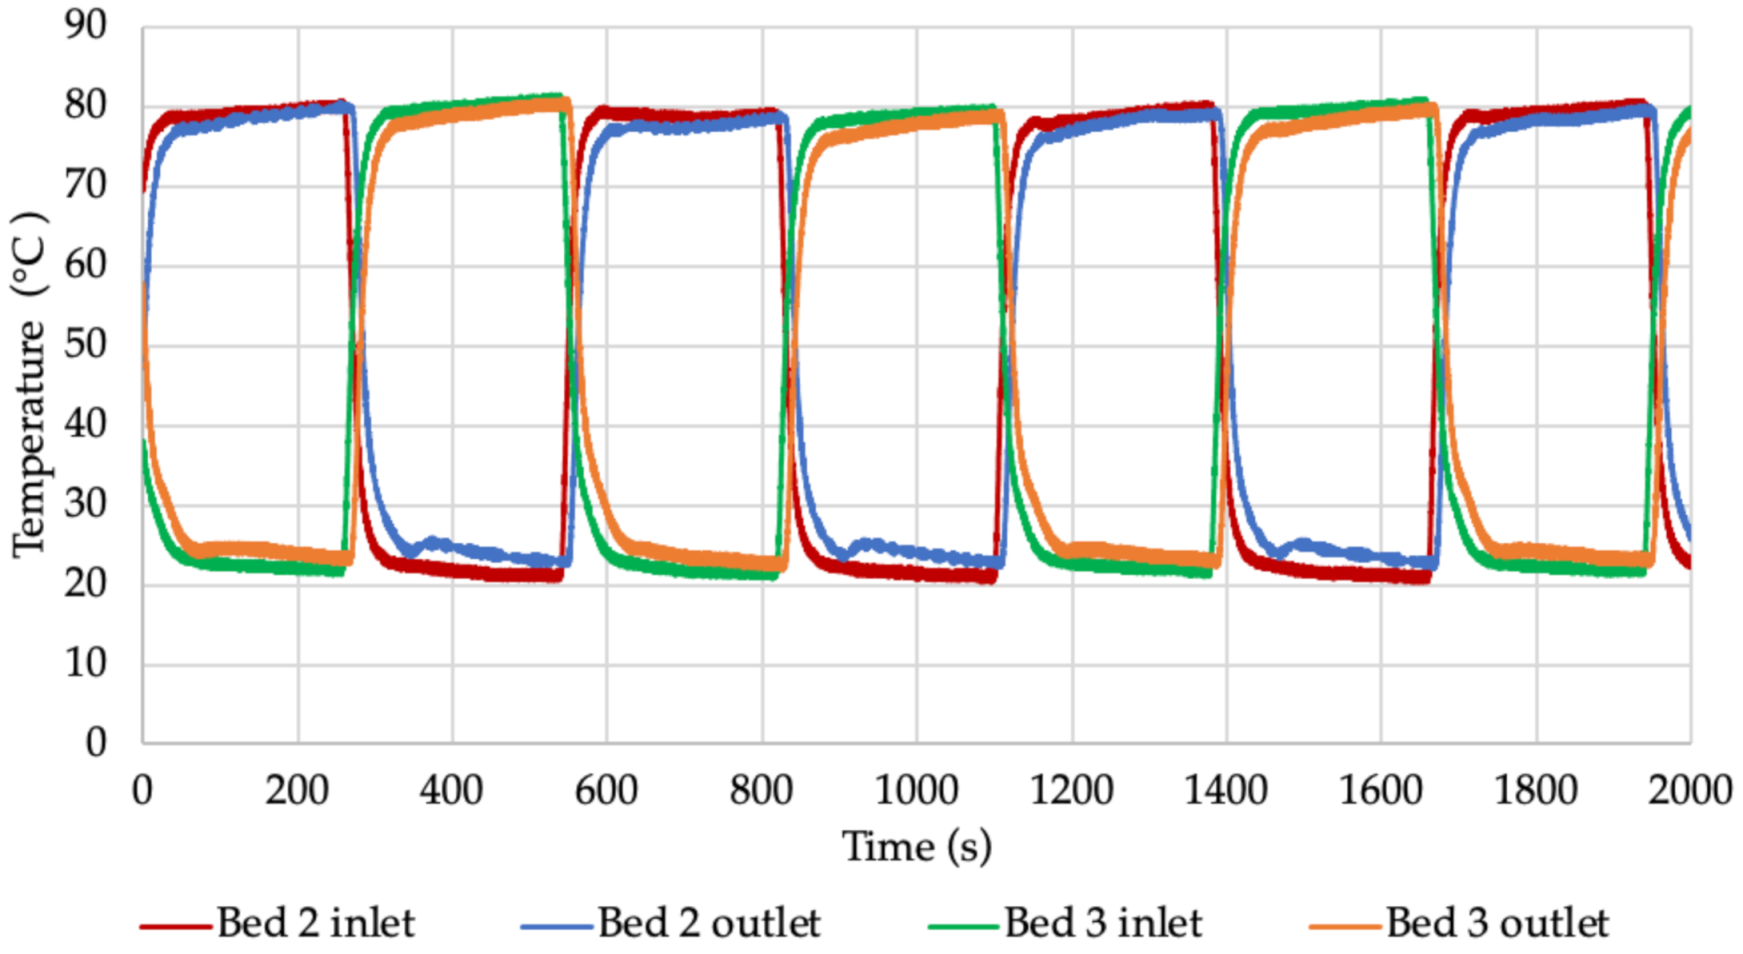
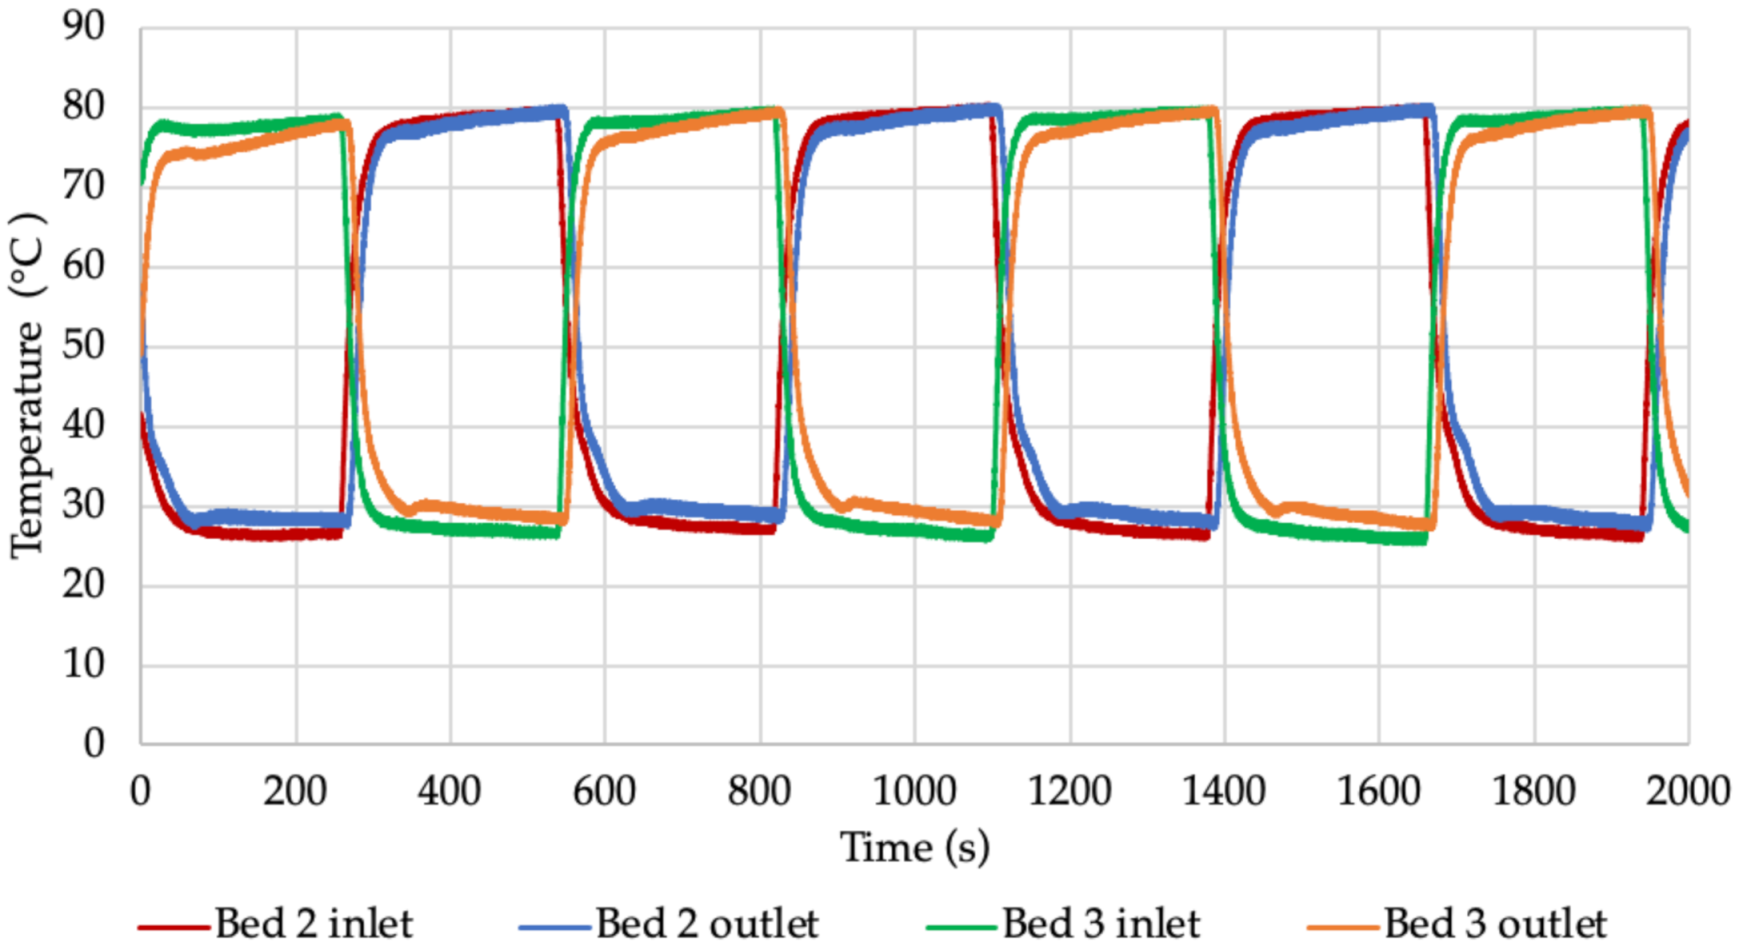
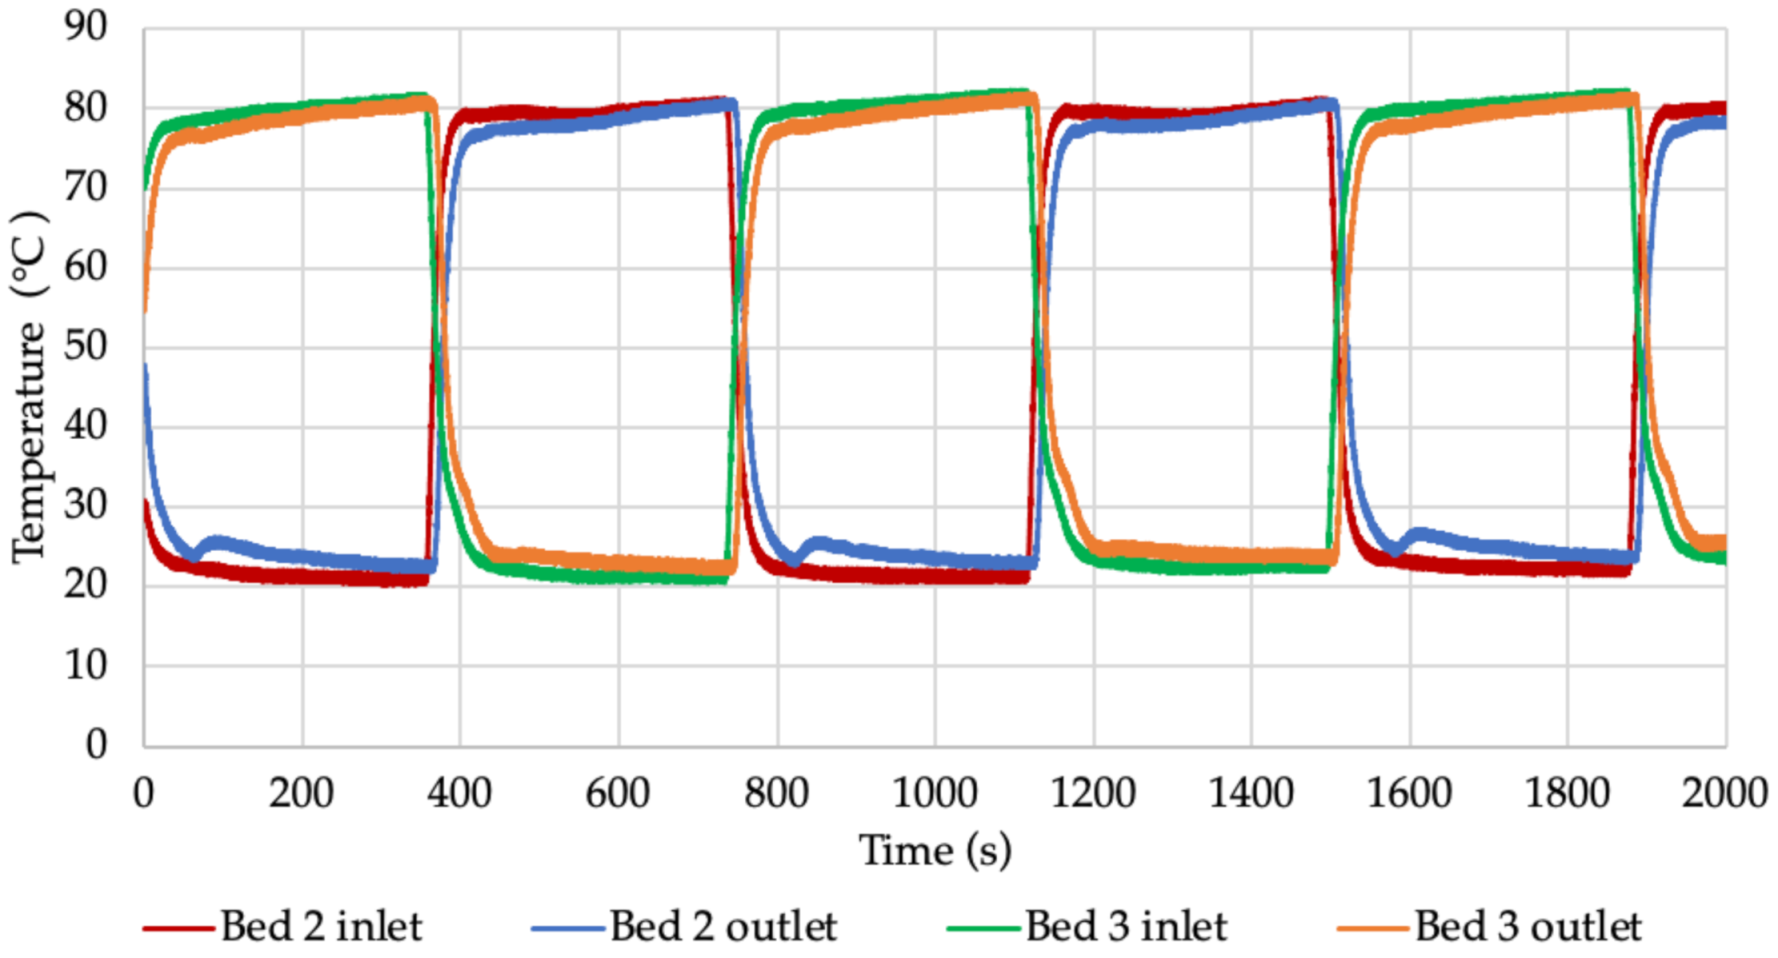
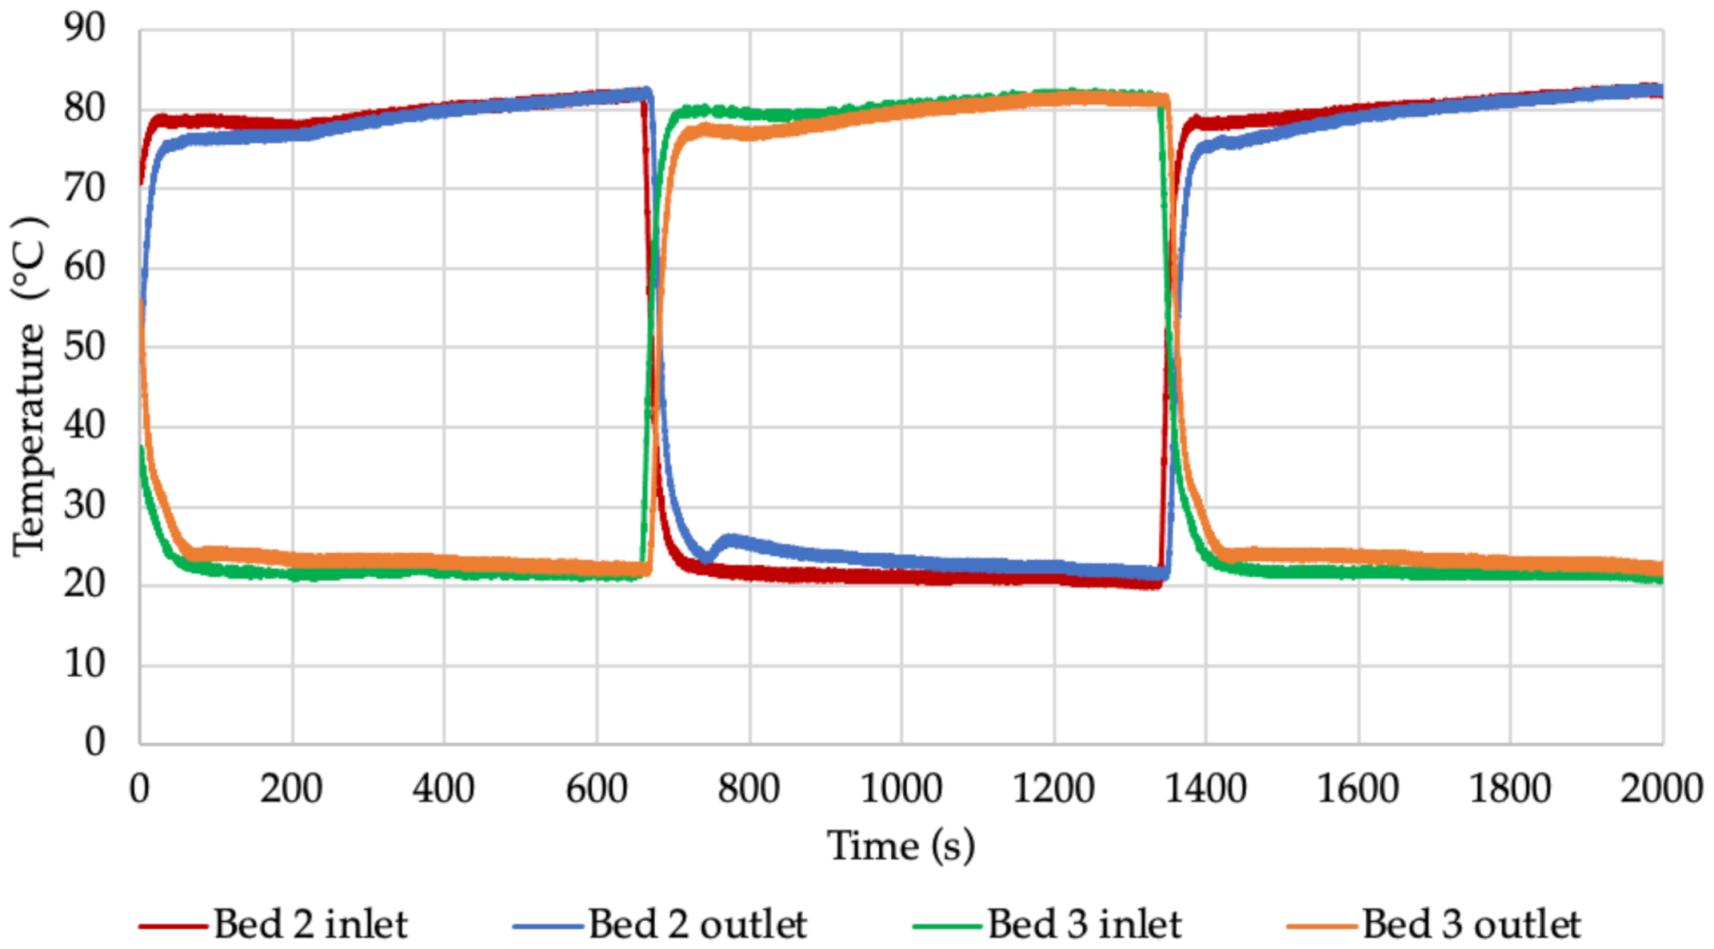
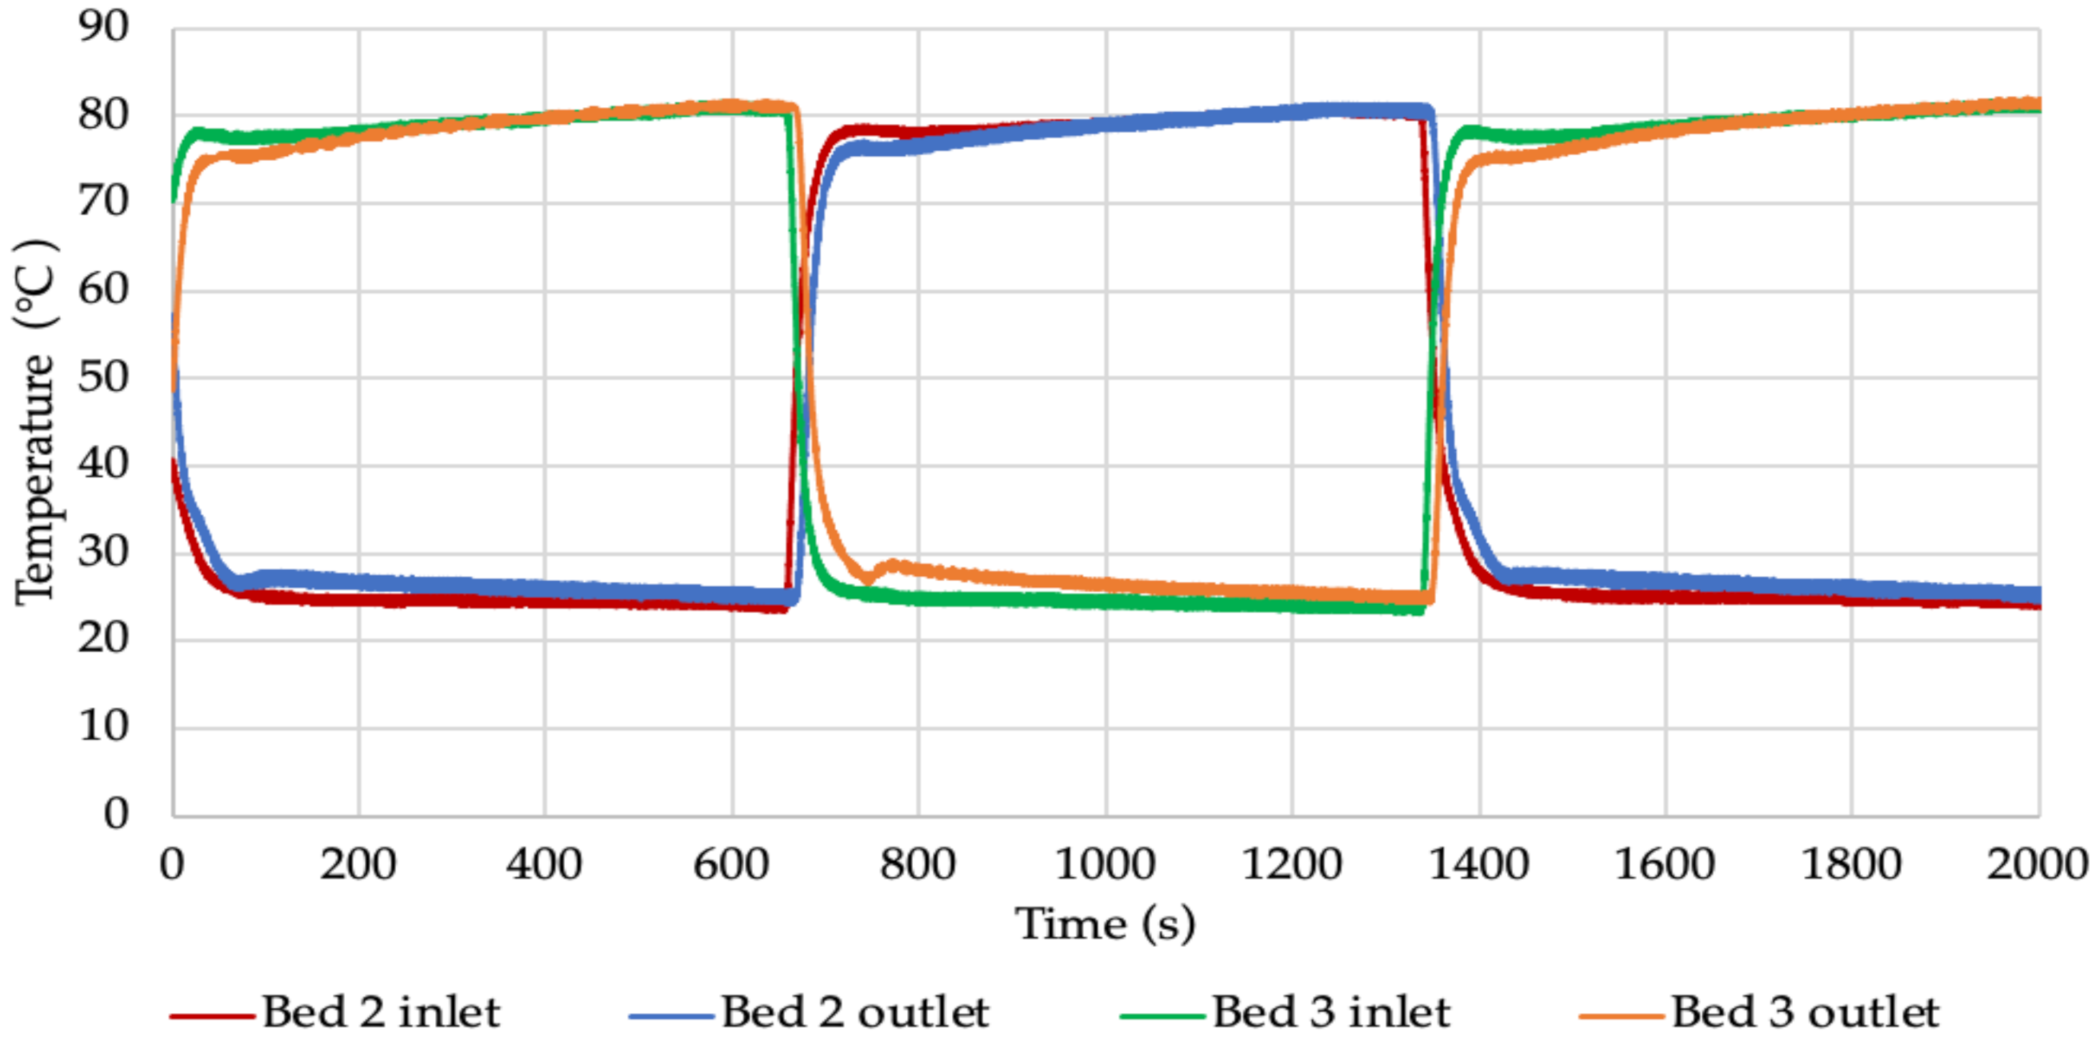
The change in temperature values in the beds shown in
Figure 8,
Figure 9,
Figure 10 and
Figure 11 indicates the points at which the adsorption and desorption processes begin and end. With the start of adsorption, the temperature decreases because the bed is cooled by water from the cooling water circuit. The pre-heating of the bed is confirmed by the temperature increase, which is associated with the start of desorption. Evaporation of the water adsorbed on the surface of the sorption material then takes place. These processes are very dynamic, as indicated by the intense and frequent fluctuations and changes in temperature. The graphs also include curves showing the temperature of the heating and cooling water. Their value was relatively constant throughout the experiment at approx. 80 °C and 20 °C, respectively.
Furthermore, the changes in temperatures inside the beds presented in
Figure 8,
Figure 9,
Figure 10 and
Figure 11 indicate that as the cycle time increases, the temperature of the bed increases during the desorption process and decreases during adsorption. For alonger cycle time, the bed pre-heating and cooling times are longer, which directly affects the temperature inside the adsorbent bed. For the shortest cycle time tested, the temperature inside the bed was approx. 41 °C and 46 °C, respectively, during adsorption and desorption. For the longest cycle time, these temperatures were approx. 36 °C for adsorption and 50 °C for desorption. The graphs also show the temperature in the evaporator, which corresponds to the evaporation temperature of the adsorbate. Its value depends on the adsorption/desorption cycle. It was observed that at the start of adsorption (which is equivalent to opening the valve between the evaporator and the bed) this temperature slightly increases. Furthermore, it was found that its value decreases with increasing cycle time. The analysis of the temperature curve in the condenser also shows that it depends on the course of the cycle. This is particularly evident for longer cycles.
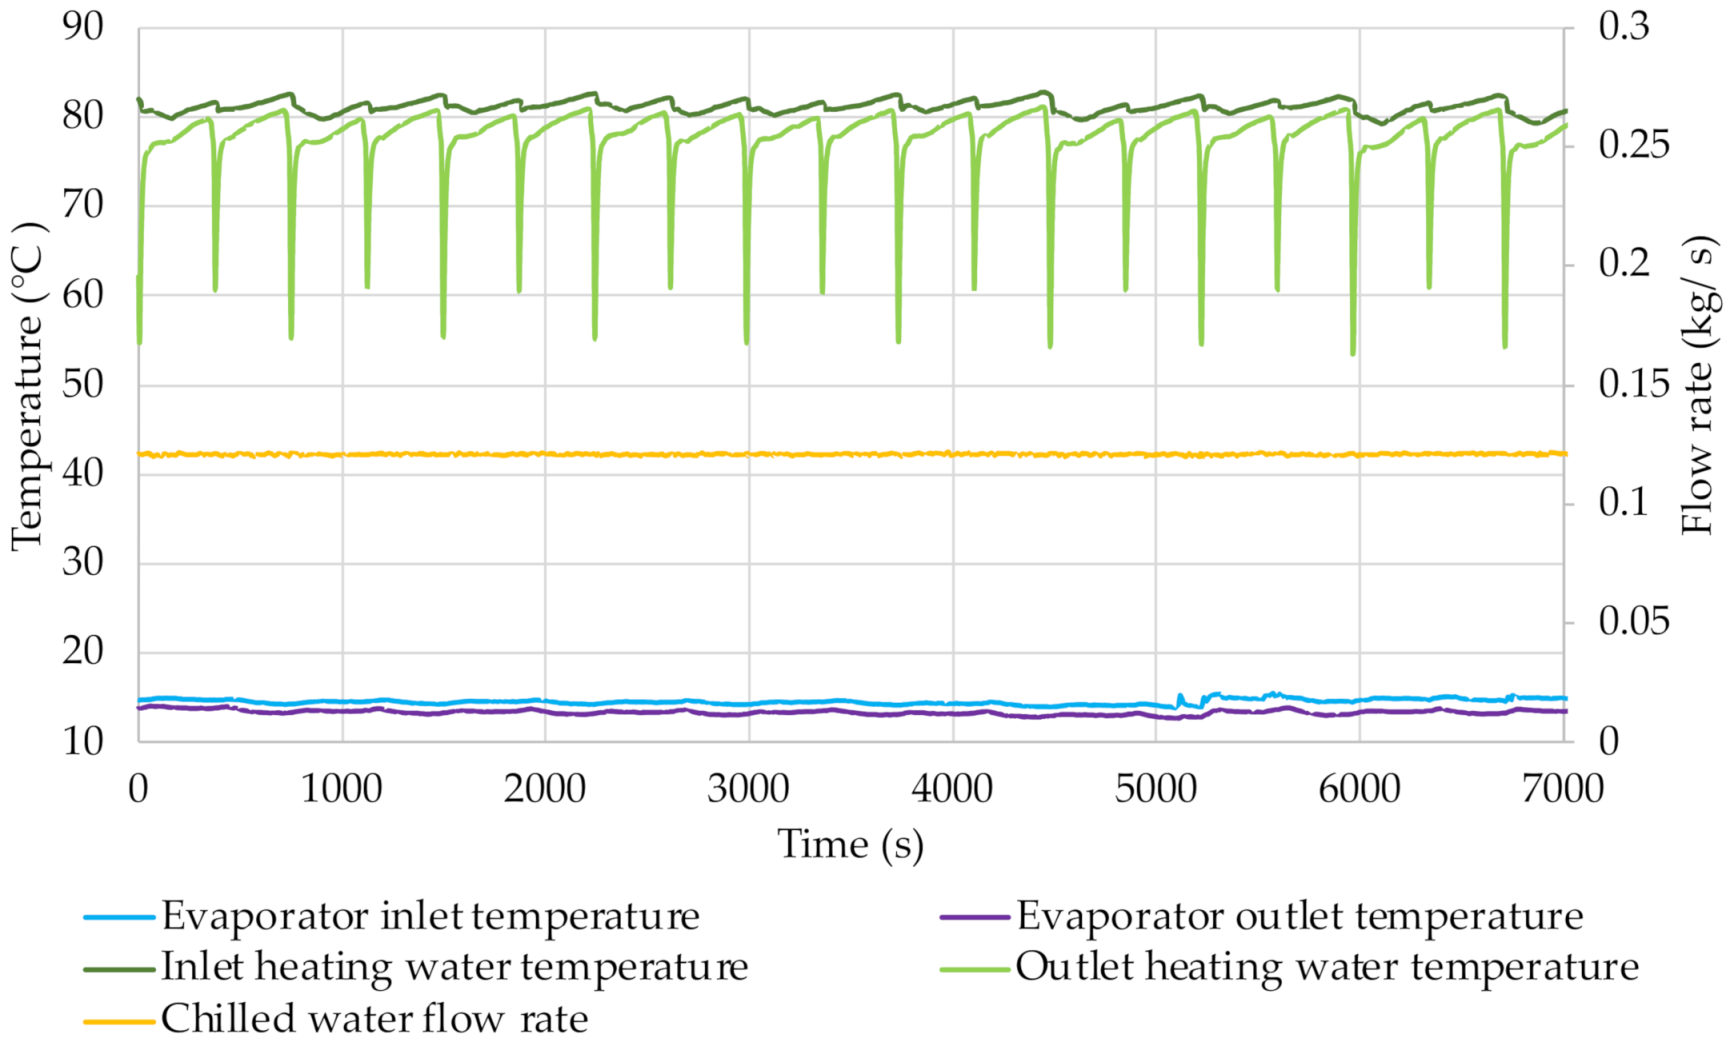
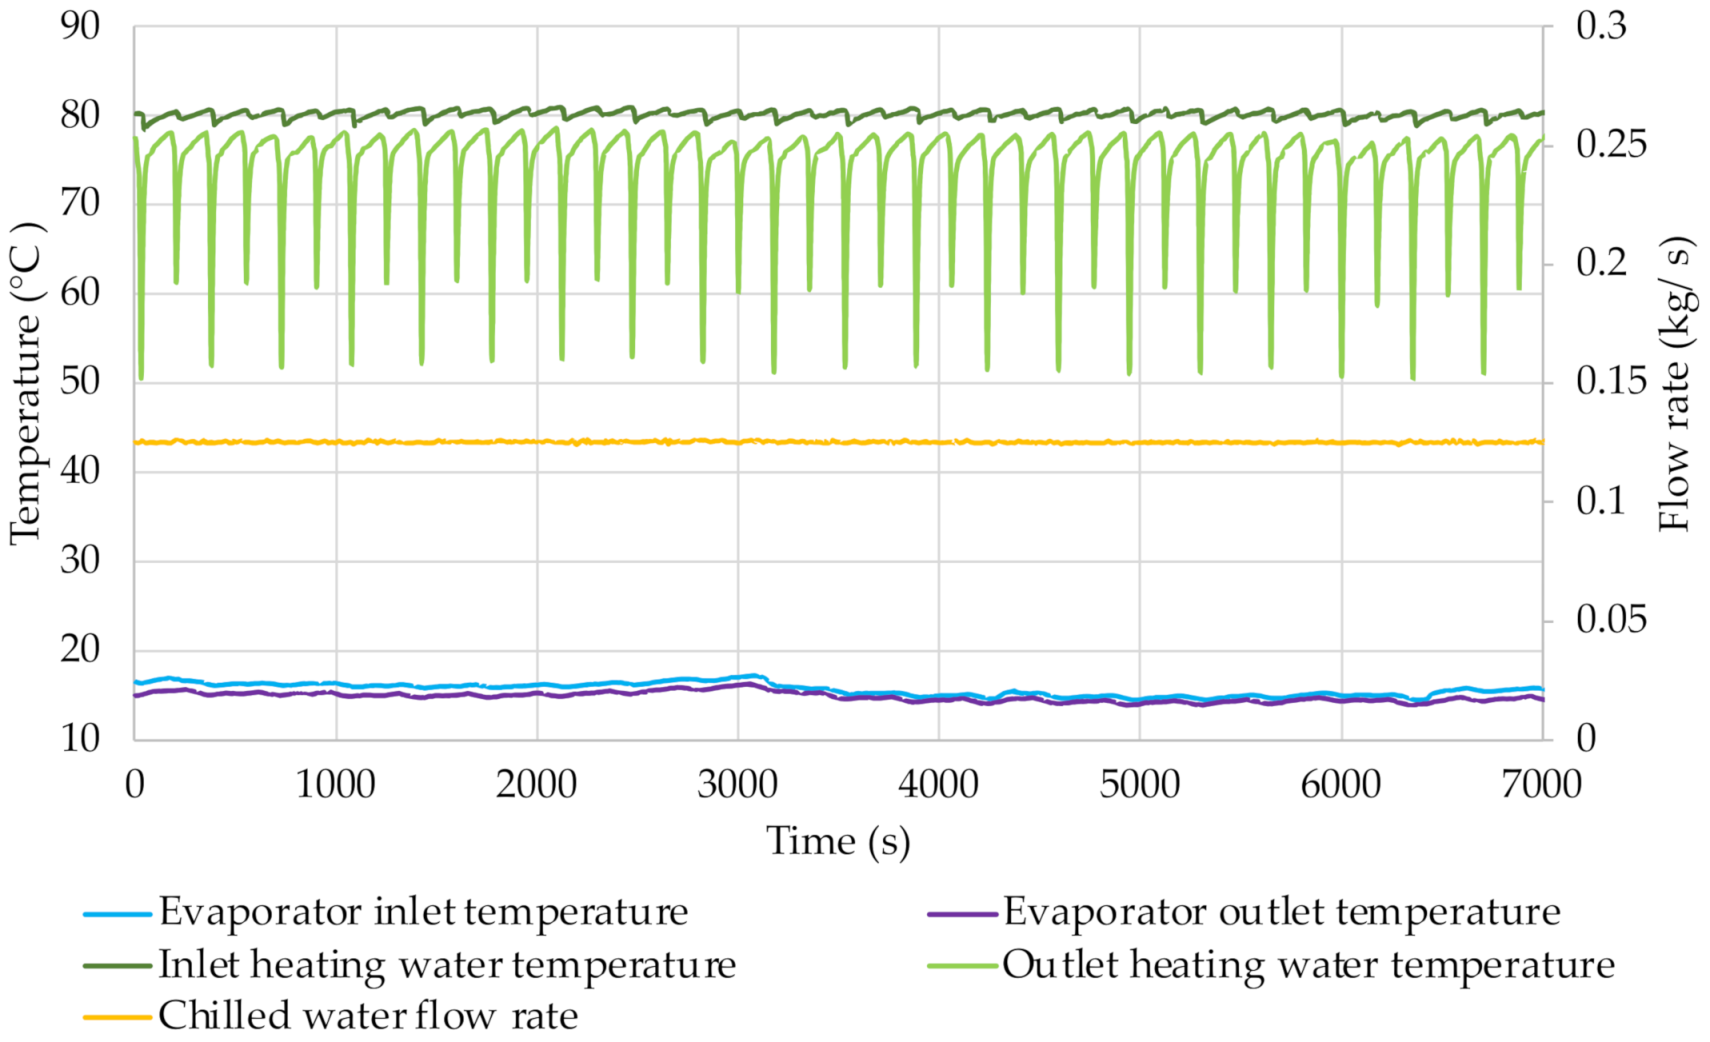
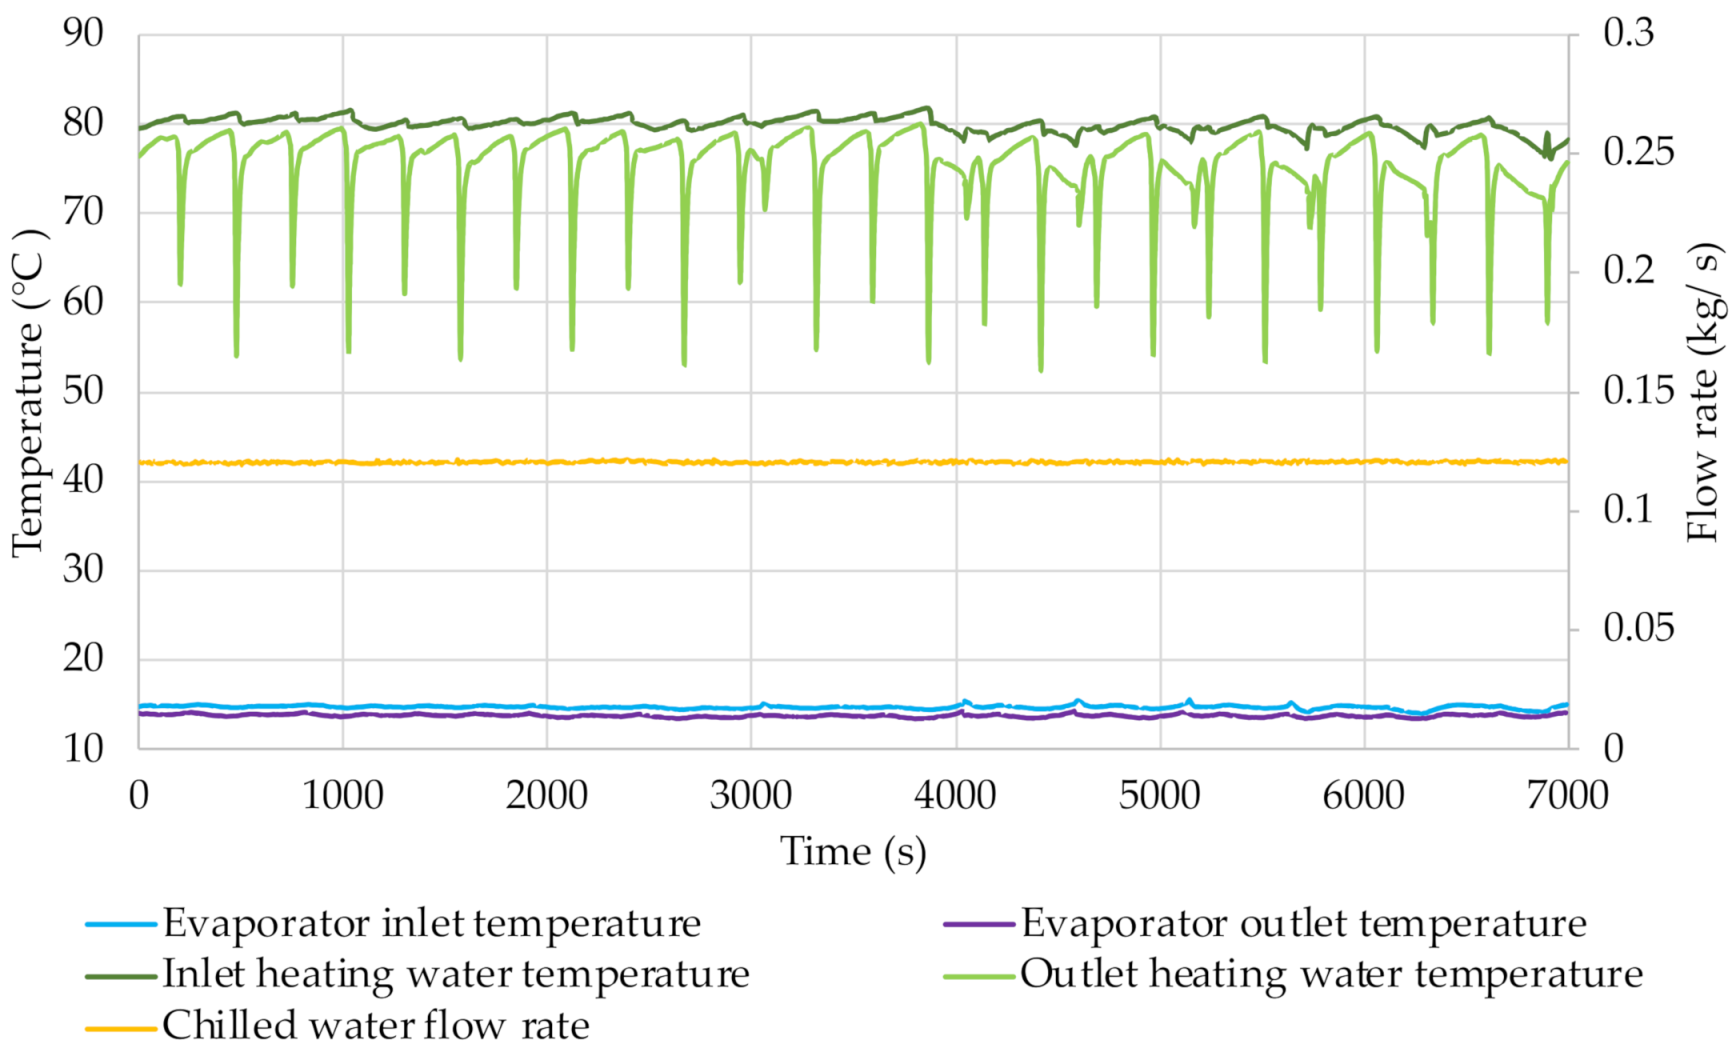
From the graphs shown in
Figure 12,
Figure 13,
Figure 14 and
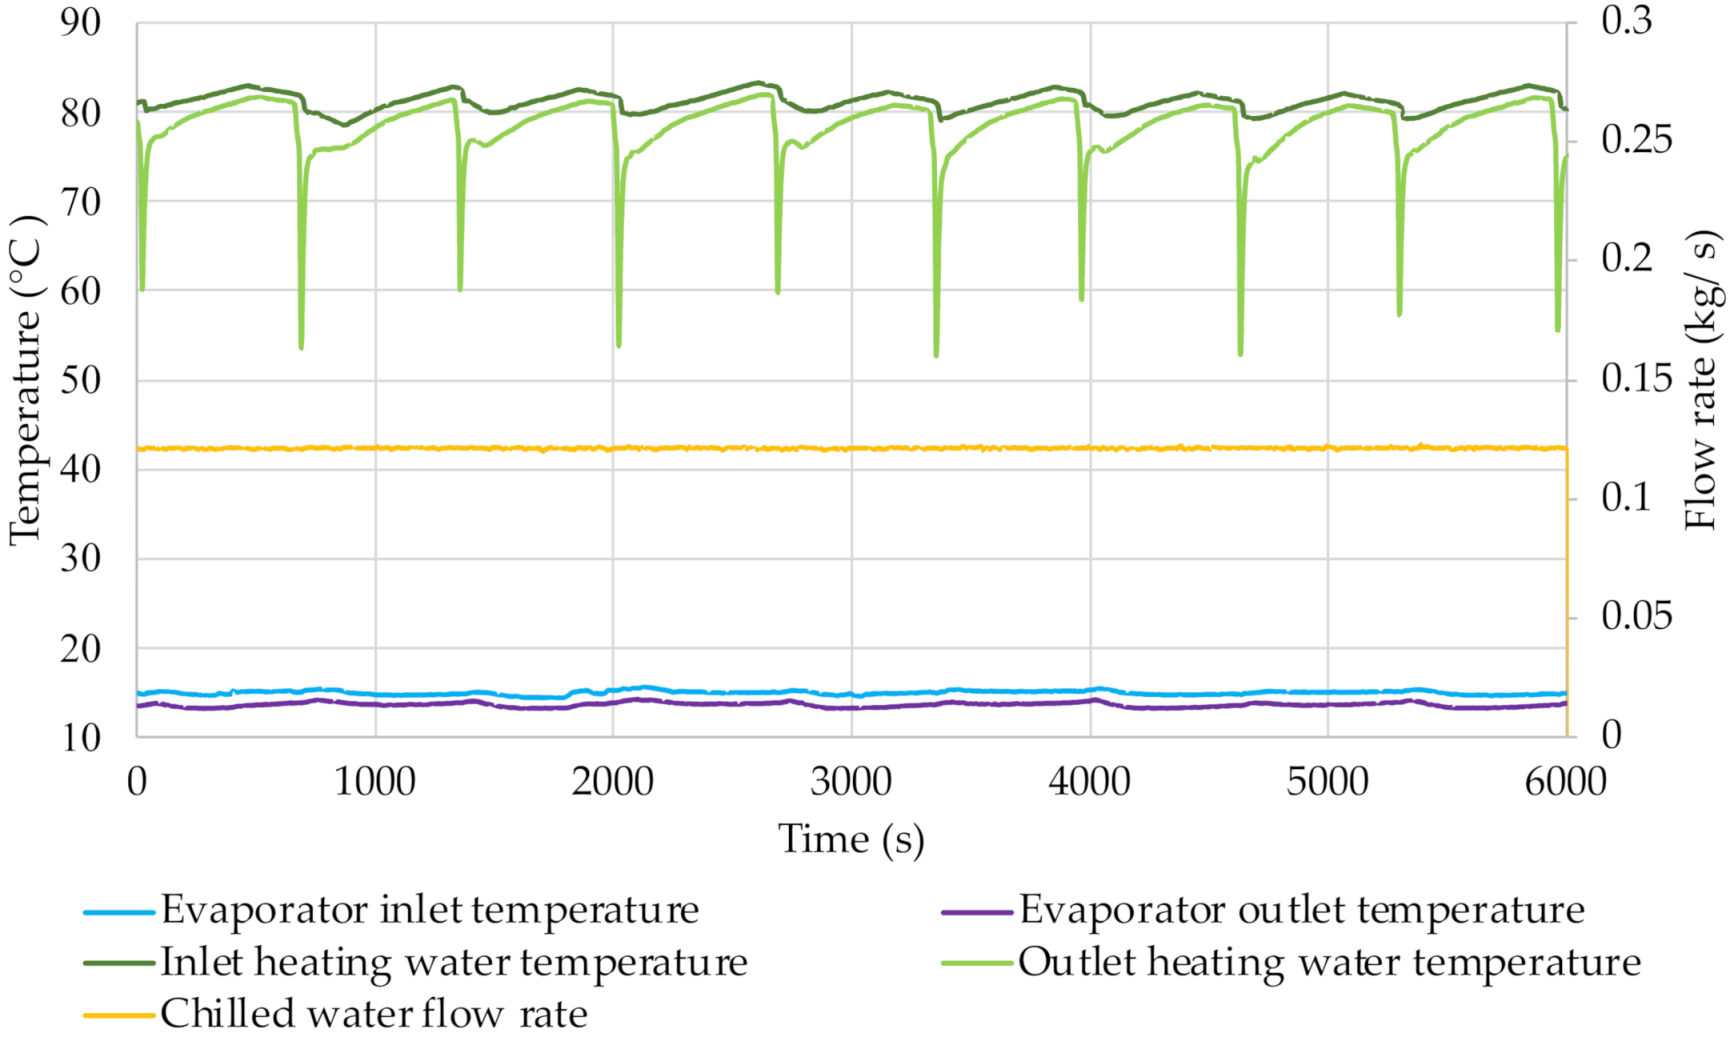
Figure 15 it is possible e.g., to determine the chilled water flow rate. It was approx. 0.12 kg/s during all the tests carried out. The temperature of the chilled water was kept at a relatively stable level. The transfer of thermal energy to the refrigerant in the evaporator causes the chilled water temperature to decrease. The difference between the evaporator inlet and outlet temperatures is approx. 1.5 °C. The small changes in its value are caused by changes in pressure in the evaporator. The chilled water temperature increases at the mode switching in the cycle because then the cooling effect is smaller.
Additionally, to show the difference between pressures and temperatures in individual systems, their average values and standard deviation were determined.
Table 6 shows the mean values and standard deviation for the measured pressures, while
Table 7 shows the mean values and standard deviation for the measured temperatures.
Based on the results obtained according to Equations (1) and (2), instantaneous values of the cooling coefficient of performance COP and specific cooling power SCP were calculated.
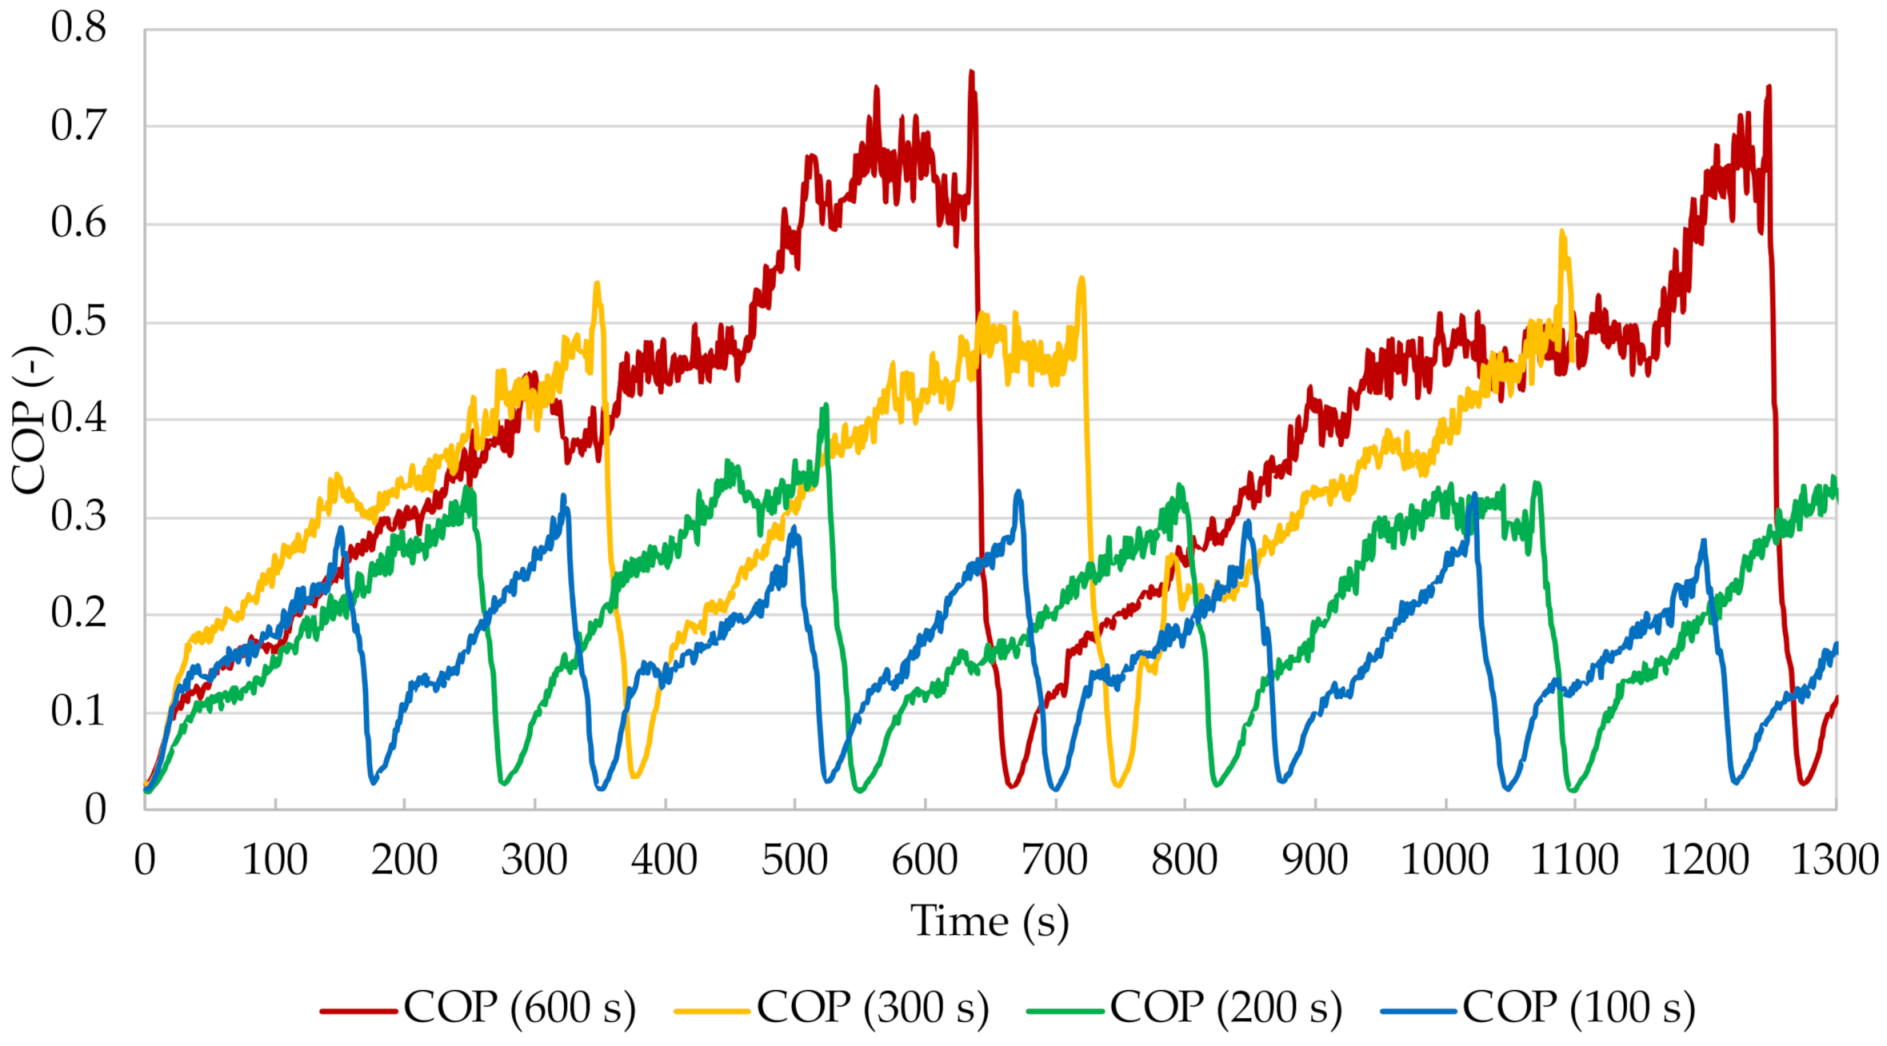
Figure 24 shows the curves of the calculated cooling coefficients of performance COP for the chiller with beds filled with silica gel with the addition of copper at a mass fraction of 15% for the individual cycle times.
When analysing the above graph, special attention should be paid to the extremes. The minimum instantaneous COP value occurs at the point when the system is about to be switched to the regeneration mode and the bed is being pre-heated. As desorption begins, the cooling coefficient of performance gradually increases. This is when the most intensive heat exchange takes place between the heat exchanger and the material the bed is filled with. The temperature difference between the heating water at the bed inlet and outlet is then the greatest and decreases over the pre-heating time. The COP reaches its maximum at the end of the desorption process. The temperature difference between the bed inlet and outlet is then the smallest, which, according to Equation (4), is associated with the minimum value of the heating power HP, and consequently, according to Equation (1), with the highest value of the cooling coefficient of performance. It can also be seen from
Figure 24 that the maximum instantaneous COP value increases with increasing cycle time. When analysing the curve for the shortest cycle time, it was noted that this time was too short for the stabilisation of the adsorption chiller parameters to occur. A cycle time of 100 s is insufficient to maintain the parameters at an appropriate level and to carry out the adsorption and desorption processes effectively and completely after the pre-heating and cooling of the bed. With longer cycle times, the COP value is clearly more stable. The cooling coefficient of performance reaches higher values and maintains them longer at the right level. This paper does not present the change in the specific cooling power achieved, but it was noted in the course of the experiments that the lowest instantaneous values are obtained during mode-switching in the cycle. The reason why these drops occur is the momentary reduction of the heat absorption in the evaporator and, consequently, of the difference between the chilled water temperature at the inlet and outlet of the evaporator when there is no steam flow to any of the beds.
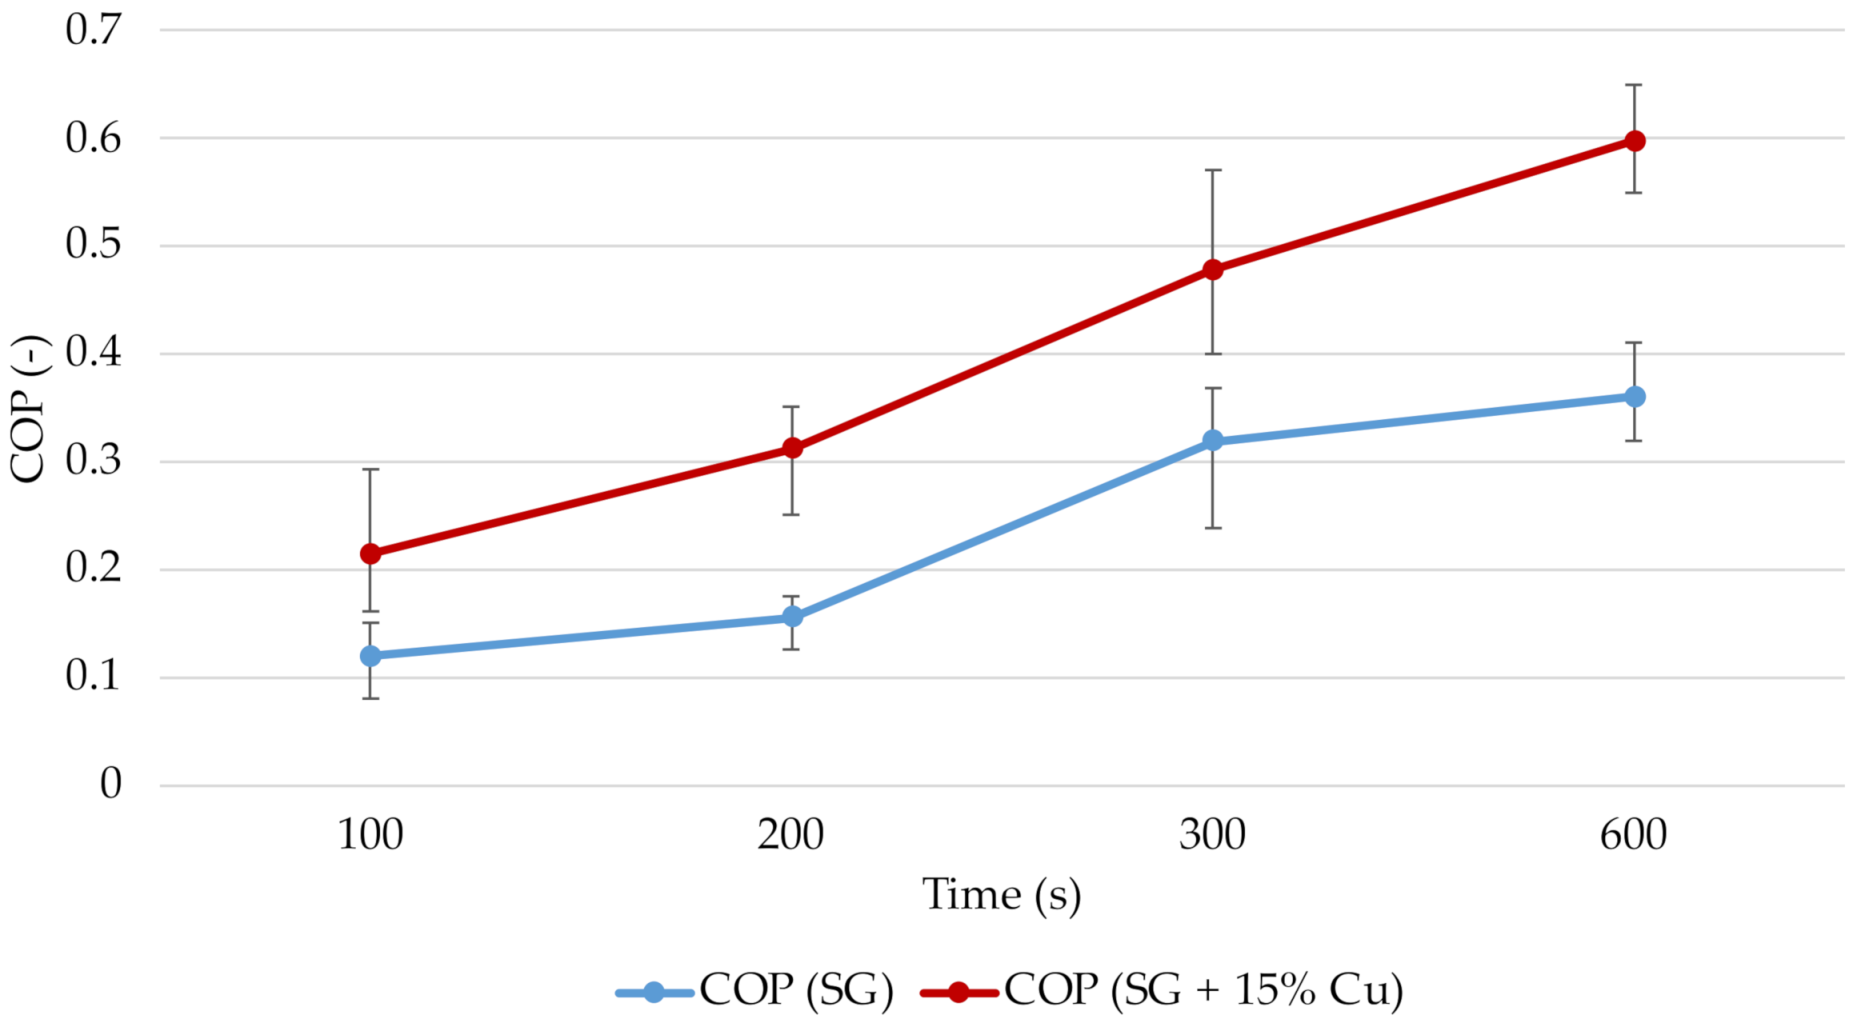
Figure 25 shows the change in the average COP of the adsorption chiller for different cycle times. The graph is a comparison of the change in the cooling coefficient of performance when the beds are filled with silica gel and silica gel with copper additive. Based on the results obtained it was found that for the times studied, the average COP increases with increasing cycle time. The lowest value was achieved for a cycle time of 100 s. In the case of beds filled with silica gel, the average COP was 0.12, while for beds filled with silica gel with copper additive it was 0.21. The highest average cooling coefficient of performance was obtained for a cycle time of 600 s. For the bed without and with the additive it was 0.36 and 0.60, respectively. Furthermore, the difference between the COP values obtained for the different cycle times increases with increasing cycle time. For 100 s the average COP value was approx. 0.09, for 200 s approx. 0.15, for 300 s 0.16, and for 600 s it is the highest at 0.24.
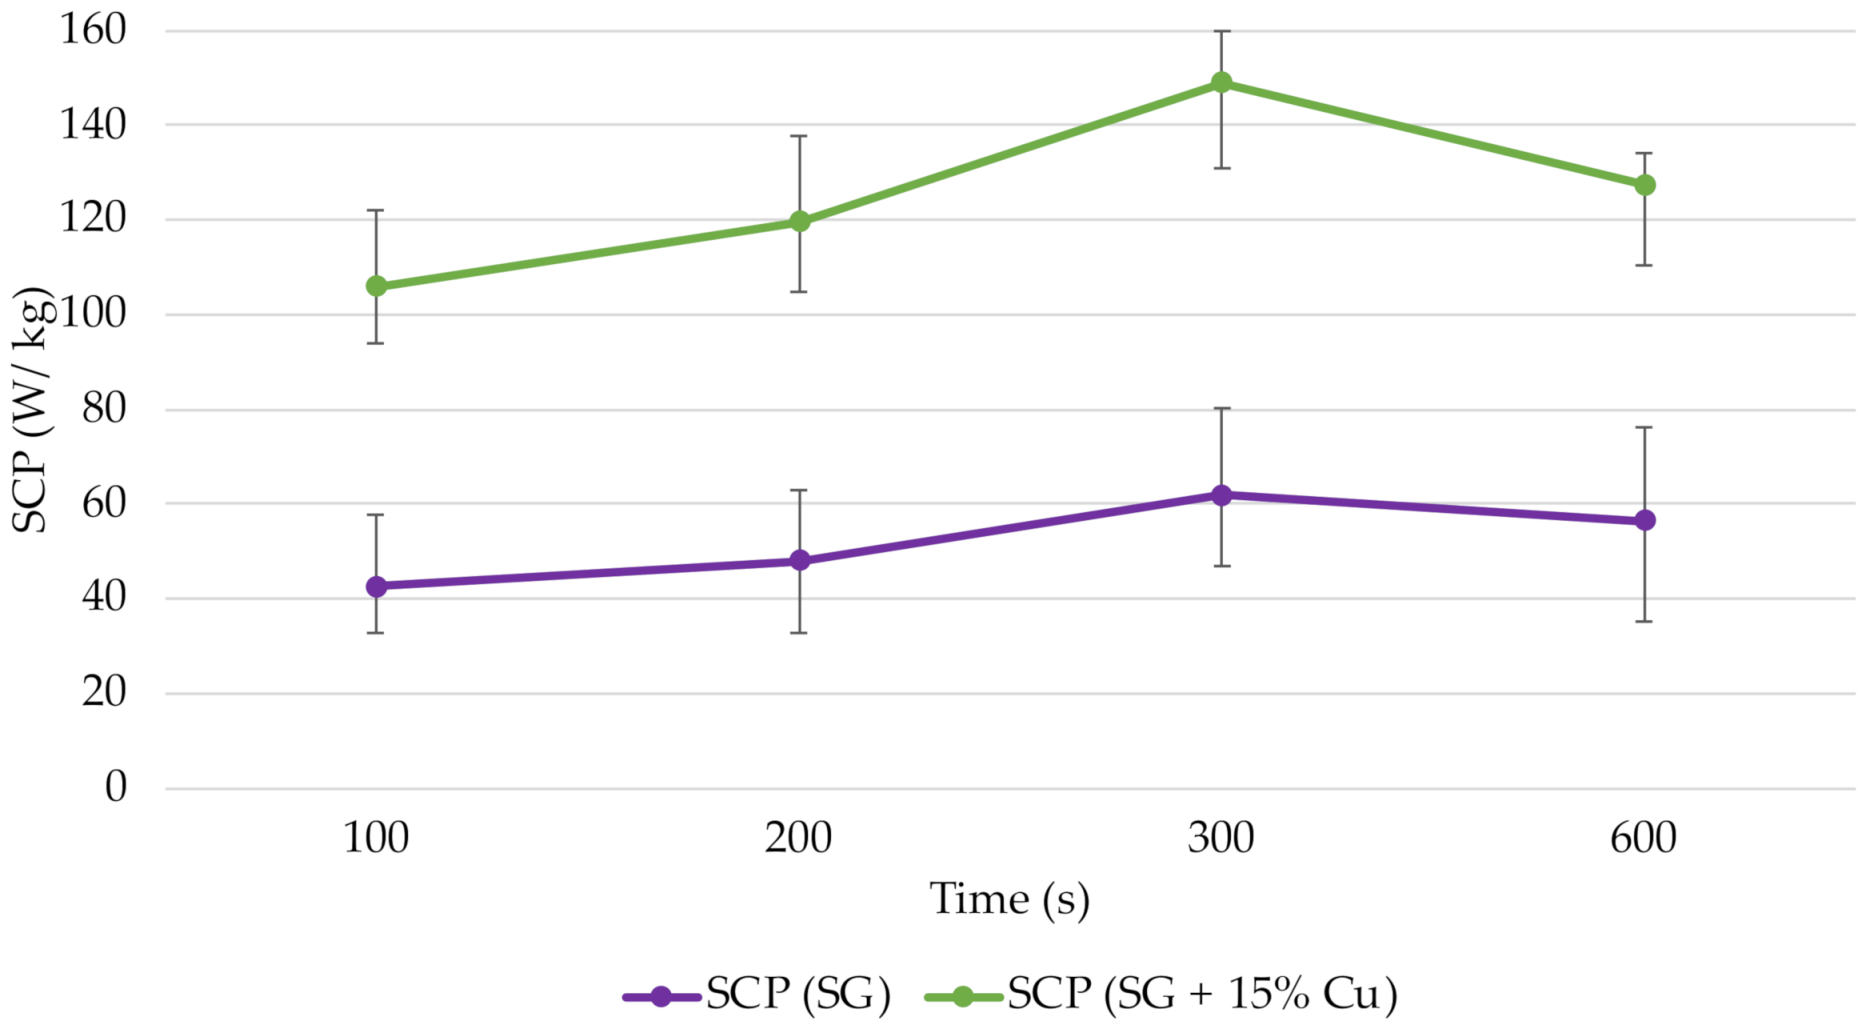
Figure 26 shows a comparison of the change in average specific cooling power SCP for different cycle times depending on whether the metal additive was used or the beds were filled with silica gel only. The lowest SCP value for both cases of bed filling was achieved for a cycle time of 100 s. It was approx. 43 W/kg for the beds filled with silica gel and 106 W/kg for the beds filled with silica gel with copper additive. The maximum specific cooling power was achieved for a cycle time of 300 s. The SCP values were then 56 W/kg and 128 W/kg for the beds filled with silica gel only and the beds with copper additive, respectively. As the SCP increases, the difference between the values obtained for silica gel and silica gel with copper increases and reaches 63 W/kg, 72 W/kg and 87 W/kg for cycle times of 100, 200 and 300 s, respectively. At the point of inflection of the specific cooling power curve for the longest cycle time, this difference is smaller and reaches the value of 71 W/kg.
Figure 27 shows the effect of cycle time on the average COP and SCP values obtained for beds filled with silica gel with copper added at a mass fraction of 15%.
Regardless of whether the additive was used with silica gel or only pure sorption material was used to fill the beds, longer adsorption and desorption times mean that more adsorbate is adsorbed and desorbed. This translates into an increase in the COP which can be observed in
Figure 25. For the longest time tested, the efficiency is the highest. Its further extension to a certain level would probably contribute to an even higher COP. This hypothesis should be verified experimentally because according to research findings published in the literature, too long a cycle time is associated with no increase or even a decrease in the value of the cooling coefficient of performance [
29]. Specific cooling power, SCP, increases up to a maximum value for a cycle time of 300 s, and then decreases with longer cycle times.
Considering the results obtained, it can be concluded that the use of long cycle times favours the achievement of relatively high COP values. On the other hand, increasing the cycle time is not advantageous due to the decreasing specific cooling power. In this situation, a workable compromise must be sought. Based on
Figure 25,
Figure 26 and
Figure 27, it was found that the most optimal cycle duration for the operating configuration of the adsorption chiller that was tested was 300 s. The highest SCP value and a satisfactory COP value were then obtained.
Table 8 and
Table 9 provide a summary of this part of the analysis, with all the average, minimum and maximum COP and SCP values obtained, depending on whether the beds were filled with silica gel (SG) or whether copper was added at a mass fraction of 15% (SG + 15% Cu).
An analysis of
Figure 16,
Figure 17,
Figure 18,
Figure 19,
Figure 20,
Figure 21,
Figure 22 and
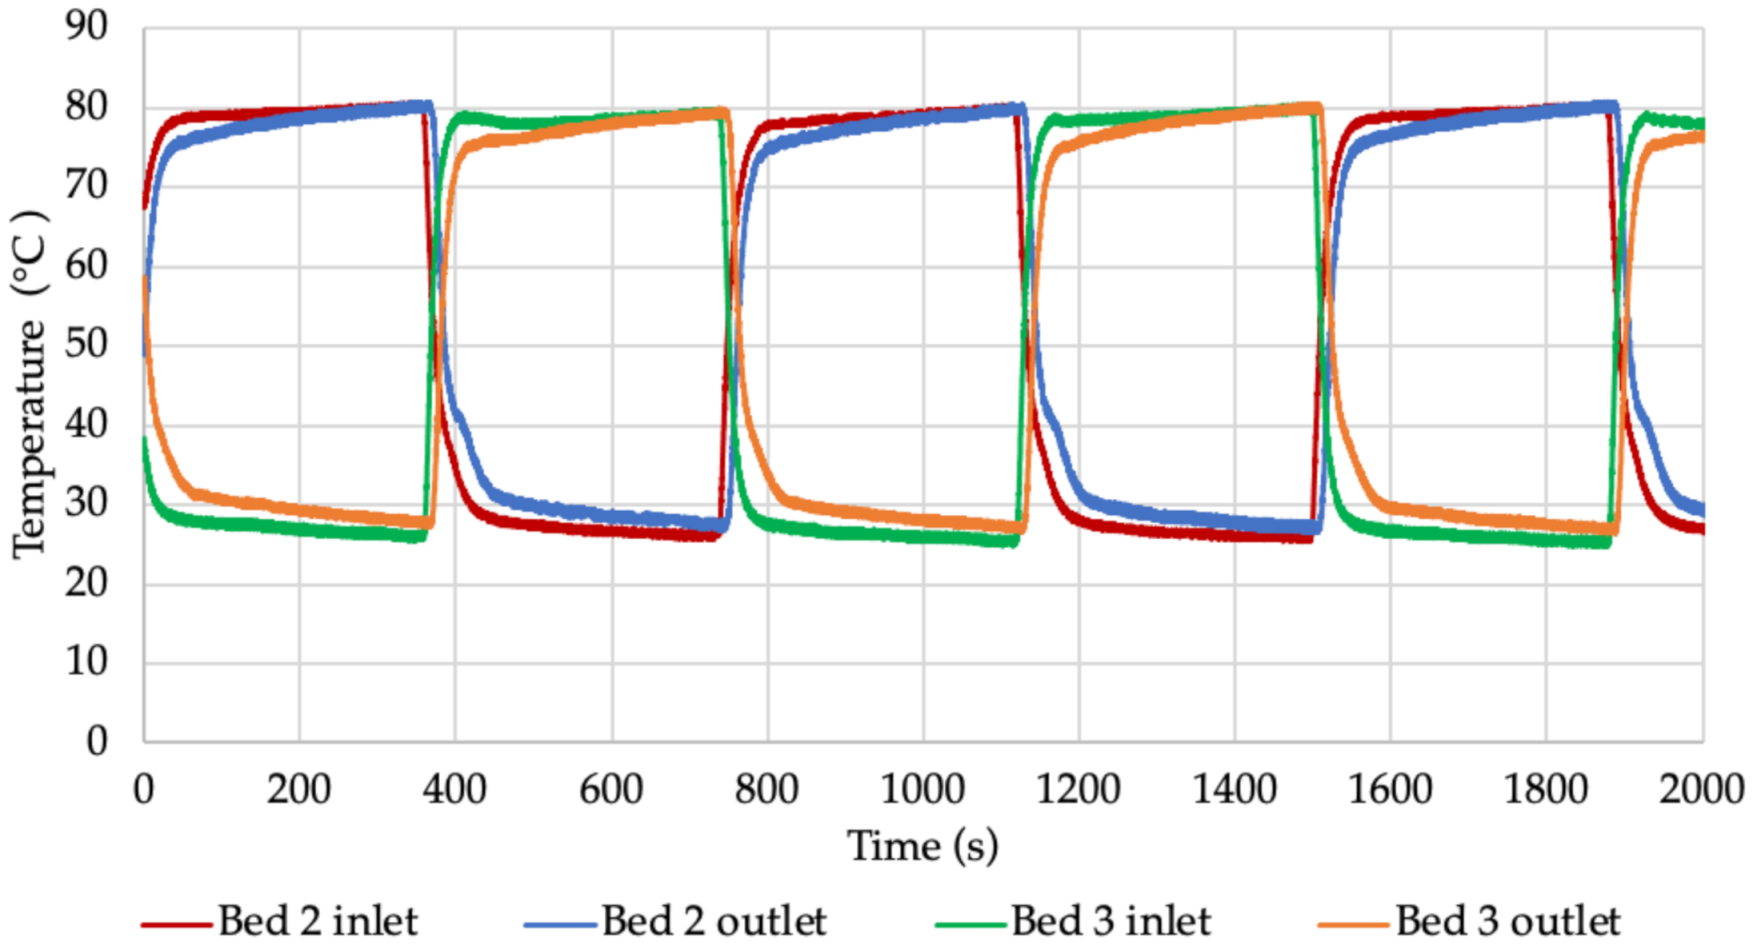
Figure 23, showing changes in temperatures at the bed inlet and outlet, clearly indicates faster stabilisation of temperature values during pre-heating and cooling of the beds in the case of using a copper additive. With increasing cycle time, an increasingly longer duration of stabilised temperatures can also be seen. Based on a comparison of the pre-heating and cooling times shown in
Table 5 for a cycle time of 600 s, it can be concluded that the addition of copper to silica gel at a mass fraction of 15% contributed to a reduction in the pre-heating and cooling times of the beds. In the case of the pre-heating and cooling of the beds, the reduction in time relative to the bed filled with silica gel only was approx. 13.1% and 17.4%, respectively.
5. Conclusions
The paper described options for improving the performance of an adsorption chiller. The main focus was on optimising the cycle time and increasing heat transfer through the bed. The aim of this study was to assess the effect of the use of a copper additive to silica gel, at a mass fraction of 15% and paired with water, on the performance of an adsorption chiller operating in a two-bed configuration, and to investigate the impact of the cycle time on the COP and SCP of the device. The tests were carried out for a laboratory adsorption chiller with desalination functionality located at the Energy Centre of the AGH University of Science and Technology in Krakow, Poland. The findings were compared with the results of tests carried out under similar conditions for a chiller with beds filled with pure silica gel.
Based on the results, it was found that the use of a copper additive, at a mass fraction of 15%, increased the COP and SCP values of the device as compared with the values obtained under similar conditions for a chiller with beds filled with silica gel. The cooling coefficients of performance calculated the chiller with beds filled with silica gel with the additive were up to twice as high as for the chiller with beds filled with silica gel. The SCP value determined for the chiller with beds filled with silica gel with added copper was maximally almost 2.5 times higher compared with the results obtained for beds filled with silica gel.
The effect of the cycle time on the performance parameters was also checked during the experiment. The cooling coefficient of performance COP increases with increasing cycle time for beds filled with silica gel only, as well as beds with added copper. The increase in the average COP for the range of cycle times from 100 to 600 s was from 0.12 to 0.36 and from 0.21 to 0.60 for the first and the second case, respectively. Specific cooling power increased, for both types of beds, with increasing cycle time, up to a maximum for a cycle time of 300 s, and then decreased with increasing cycle time.
During the research, the influence of the parallel use of two methods of improving the performance parameters of the adsorption chiller was verified. The simultaneous optimisation of the cycle time length and the improvement of heat transfer resulted in a significant increase in the COP and SCP of the device. In the case of the tests carried out for the longest cycle time of 600 s, a five-fold increase of COP was obtained for a refrigerator with beds filled with silica gel and copper addition compared to a refrigerator with beds filled only with silica gel and the shortest cycle duration. At that time, the specific cooling power increased threefold for a refrigerator with beds filled with a sorbent with the addition of copper. For the experiment carried out for the beds filled with sorbent with the additive and the cycle duration of 300 s, the COP increased 4 times and SCP 3.5 times, compared with the test, during which the cycle time was 100 s and the refrigerator beds were filled only with silica gel.
The average pre-heating and cooling times of the beds for both filling variants were also measured. The addition of copper to silica gel reduces the pre-heating and cooling time of the beds. The reductions in pre-heating and cooling time for beds 2 and 3 were 13.1% and 17.4%, respectively, compared with beds filled only with silica gel. This means that the use of the additive resulted in a faster temperature equilibration inside the bed, which could result in a shorter cycle time.
The conducted experiment, due to the characteristics of the research equipment used, had certain limitations. The scope of the measurements was limited by the temperature control system in the cooling water system, which is responsible for cooling the condenser and the beds. In this case, the difficulty was the value of the maximum achievable temperature of the cooling water, 35 °C. Moreover, the temperature in the adsorbent beds may be up to 95 °C. Another limitation is the need to keep the temperature in the evaporator higher than 4 °C. The electric boiler used as a heat source, also imposes a limitation in the form of the minimum heating water temperature, which is 45°C. The thermal compression process requires a sorption and desorption for each set parameter, which is related to a long stabilization time. This means that the entire experiment took a very long time. In addition, the system was very sensitive to changes in pressure and temperature, so similar experiments should be carefully conducted.
At present, the commercialisation of adsorption refrigeration systems is hampered by, inter alia, their low cooling coefficients of performance and low specific cooling powers, which translates into the considerable size and bulkiness of the chillers. The test results presented in this paper constitute a further step towards increasing their attractiveness and competitiveness on the market. The tests provide a basis for further experiments using other additives to sorption materials, such as aluminium, graphite or MOF materials.


