Article

Machine Learning Techniques in the Energy Consumption of Buildings: A Systematic Literature Review Using Text Mining and Bibliometric Analysis

1
Nova Information Management School, Universidade Nova de Lisboa, 1070-312 Lisboa, Portugal
2
Information System Department, Higher Technological Institute, HTI, Cairo 44629, Egypt
3
Department of Information Science and Technology, Instituto Universitário de Lisboa (ISCTE-IUL), ISTAR, 1649-026 Lisboa, Portugal
*
Author to whom correspondence should be addressed.
Energies 2021, 14(22), 7810; https://doi.org/10.3390/en14227810
Submission received: 20 October 2021 / Revised: 8 November 2021 / Accepted: 18 November 2021 / Published: 22 November 2021
(This article belongs to the Special Issue Green Network Technologies and Renewable Energy Systems)

Abstract

:
The high level of energy consumption of buildings is significantly influencing occupant behavior changes towards improved energy efficiency. This paper introduces a systematic literature review with two objectives: to understand the more relevant factors affecting energy consumption of buildings and to find the best intelligent computing (IC) methods capable of classifying and predicting energy consumption of different types of buildings. Adopting the PRISMA method, the paper analyzed 822 manuscripts from 2013 to 2020 and focused on 106, based on title and abstract screening and on manuscripts with experiments. A text mining process and a bibliometric map tool (VOS viewer) were adopted to find the most used terms and their relationships, in the energy and IC domains. Our approach shows that the terms “consumption,” “residential,” and “electricity” are the more relevant terms in the energy domain, in terms of the ratio of important terms (TITs), whereas “cluster” is the more commonly used term in the IC domain. The paper also shows that there are strong relations between “Residential Energy Consumption” and “Electricity Consumption,” “Heating” and “Climate. Finally, we checked and analyzed 41 manuscripts in detail, summarized their major contributions, and identified several research gaps that provide hints for further research.

1. Introduction

Over the past 20 years, the world’s growing energy demand has led to a growing interest in energy efficiency in the residential, services, and public building sectors. The energy consumption of buildings (ECB) is a big challenge in most European countries since buildings consume a large amount of energy, especially sustainability buildings in energy sectors (e.g., public buildings) [1]. In Europe, in 2019, the transport sector accounted for 37% of total final energy consumption in the EU Member States, followed by the households (32%), industry (42%), and services (23%) sectors. Additionally, over the past years, the efficiency of appliances and equipment has increased substantially [2]. Therefore, European countries, notably Portugal, strive to enhance the energy efficiency in buildings while maintaining sufficient levels of thermal comfort and energy consumption, aiming at sustaining their economic and social levels [3]. The energy sector seeks to control energy consumption in general by analyzing available data sources and by studying different dimensions taken from analyzing data sources, such as natural gas and electricity usage data, residential building characteristics and the energy performance of building data, cooling, and heating systems data, or climate and weather forecast data, just to name a few [4]. Public authorities also seek to guide citizen behavior to more efficient uses of energy, adopting structured approaches based on scientific grounds through legal measures, economic subsidies, or best practice dissemination initiatives [5].
Energy consumption in the building stock of different sectors, namely, residential, public services, or industrial, is a relevant research topic, as mentioned. The literature has relied on traditional statistical methods to classify and predict energy consumption, which has led to inaccurate results. The lack of control over energy consumption in many different building sectors has led to significant monetary losses for many countries. Energy stakeholders worldwide seek to find different solutions to reduce energy consumption and improve its efficiency by influencing building occupants’ behavior in those various sectors [6]. Such stakeholders are also looking to find intelligent computing solutions for classifying and forecasting energy consumption with a reasonable degree of accuracy, taking into account the critical factors that affect such consumption.
Notably, in Portugal, the energy sector is particularly interested in finding the fundamental factors that affect the ECB, being residential or service buildings, given that there is a noticeable increase in residential energy intensity in the last three years [5,6].
Current research in the field is actively struggling to find intelligent models capable of classifying energy consumption levels (e.g., low, medium, high levels) [7], based on actual factors that affect energy consumption in residential or service buildings. Such models are also able to predict energy consumption in future periods [8]. Such intelligent models could help stakeholders in the energy sector (decision makers, citizens in general) to (1) determine the actual factors that affect energy consumption [9]; (2) classify and predict energy consumption in residential or service buildings [10], (3) improve energy efficiency in such buildings [11]; (4) influence positively building occupant behavior in the same context [12], and (5) change energy suppliers in an informed way [13].
In the literature, we can find several systematic surveys published on this topic, presenting relevant research. Our literature analysis detected 11 such review manuscripts published between 2019 and 2021. Runge & Bourdeau presented manuscripts on using machine learning to predict buildings’ energy consumption [14,15]. Qolomany and Djenouri showed how smart buildings deal with machine learning methods and big data [16,17]. Vázquez-Canteli and Mason presented a new approach to improve building control by using machine learning techniques and reinforcement learning [18,19]. Guyot presented a model to improve energy applications in the different building sectors by using artificial neural networks [20]. Amasyali and Mosavi showed how machine learning techniques can be applied for predicting energy consumption in various buildings [21,22]. Perera presented review studies in energy system applications by using reinforcement learning [23]. However, those review studies only concentrated on a single specific factor that influences the energy consumption of buildings (e.g., building control, electricity, and natural gas), or on a specific application (e.g., occupant behavior, load forecasting), or were restricted to the use of a specific intelligent computing technique (e.g., artificial neural networks and reinforcement learning), to classify and predict the energy consumption of buildings. There are also many recent studies [24,25,26,27,28] that provide novel intelligent methods and can help stakeholders in the field of energy to improve energy efficiency. Most of these literature studies lack the identification of critical factors that affect the ECB. In addition, several studies rely on finding methods used in classifying and predicting energy consumption, by means of traditional statistical or manual methods.
To address these gaps, our study used a text-mining tool to find common terms to cover the largest possible number of factors that influence the ECB to address these gaps. In addition, the tool automatically and accurately found the most adopted intelligent methods. Moreover, bibliometric analysis was used to find the relationships between factors and applications related to the energy consumption of buildings and intelligent computing techniques.
This paper provides a systematic literature review on the topic of intelligent computing methods applied to the ECB. The paper adopts the PRISMA methodology [29], a simple text mining approach, and a bibliometric map analysis (with Vosviewer) [30]. This last method was used to provide an initial identification of the most used terms in the energy and intelligent computing domains, which helped the subsequent step of the manuscript analysis. The paper surveys machine learning and other methods appropriate for clustering and classification of ECB (e.g., low, medium, and high consumption). Additionally, it reviews intelligent computing methods for predicting such energy consumption. Moreover, it analyzes various literature contributions, combining more than one method, to achieve such goals. Finally, it analyzes and discusses the most promising intelligent computing models for the classification and prediction of ECB. In addition, this paper helps researchers to identify fertile areas for further research work in the area.
The main objectives of this paper are to identify the critical factors that influence the energy consumption of buildings, identify the most used intelligence computing techniques, predict, and classify energy consumption in those buildings and finally, identify the performance metrics that have been adopted in the literature in such cases.
As mentioned, our study aims to provide a state-of-the-art review of current research efforts in classifying and forecasting the energy consumption of buildings. We start by introducing the reader to specific topics concerning our research objectives and employed methods. Particularly, our survey addresses the following research questions, aiming to identify the adoption techniques that have been applied in the overall domain of energy consumption of buildings:
RQ1: What kinds of metrics, data sources, and critical factors, have been adopted in prior studies of profiling the ECB?
RQ2: Which machine learning techniques provide the best performance in clustering and classification of ECB?
RQ3: Which machine learning techniques provide the best performance in predicting the ECB?
RQ4: Which machine learning techniques provide the best performance in both classification and prediction of ECB?
RQ5: What performance metrics have been adopted in the literature in the classification or prediction of ECB?
The paper is organized as follows. Section 2 presents our adopted methodologies, including the systematic literature strategy with inclusion and exclusion criteria for manuscripts, the text mining method, and the research questions. In Section 3, we present, analyze, and discuss our results, encompassing the detailed analysis of text mining procedures, bibliometric map analysis with Vosviewer, and the analysis of representative manuscripts per topic. Section 4 presents our study limitations. Finally, in Section 5, we discuss the results, identify several research gaps, draw conclusions, and suggest lines for further work.
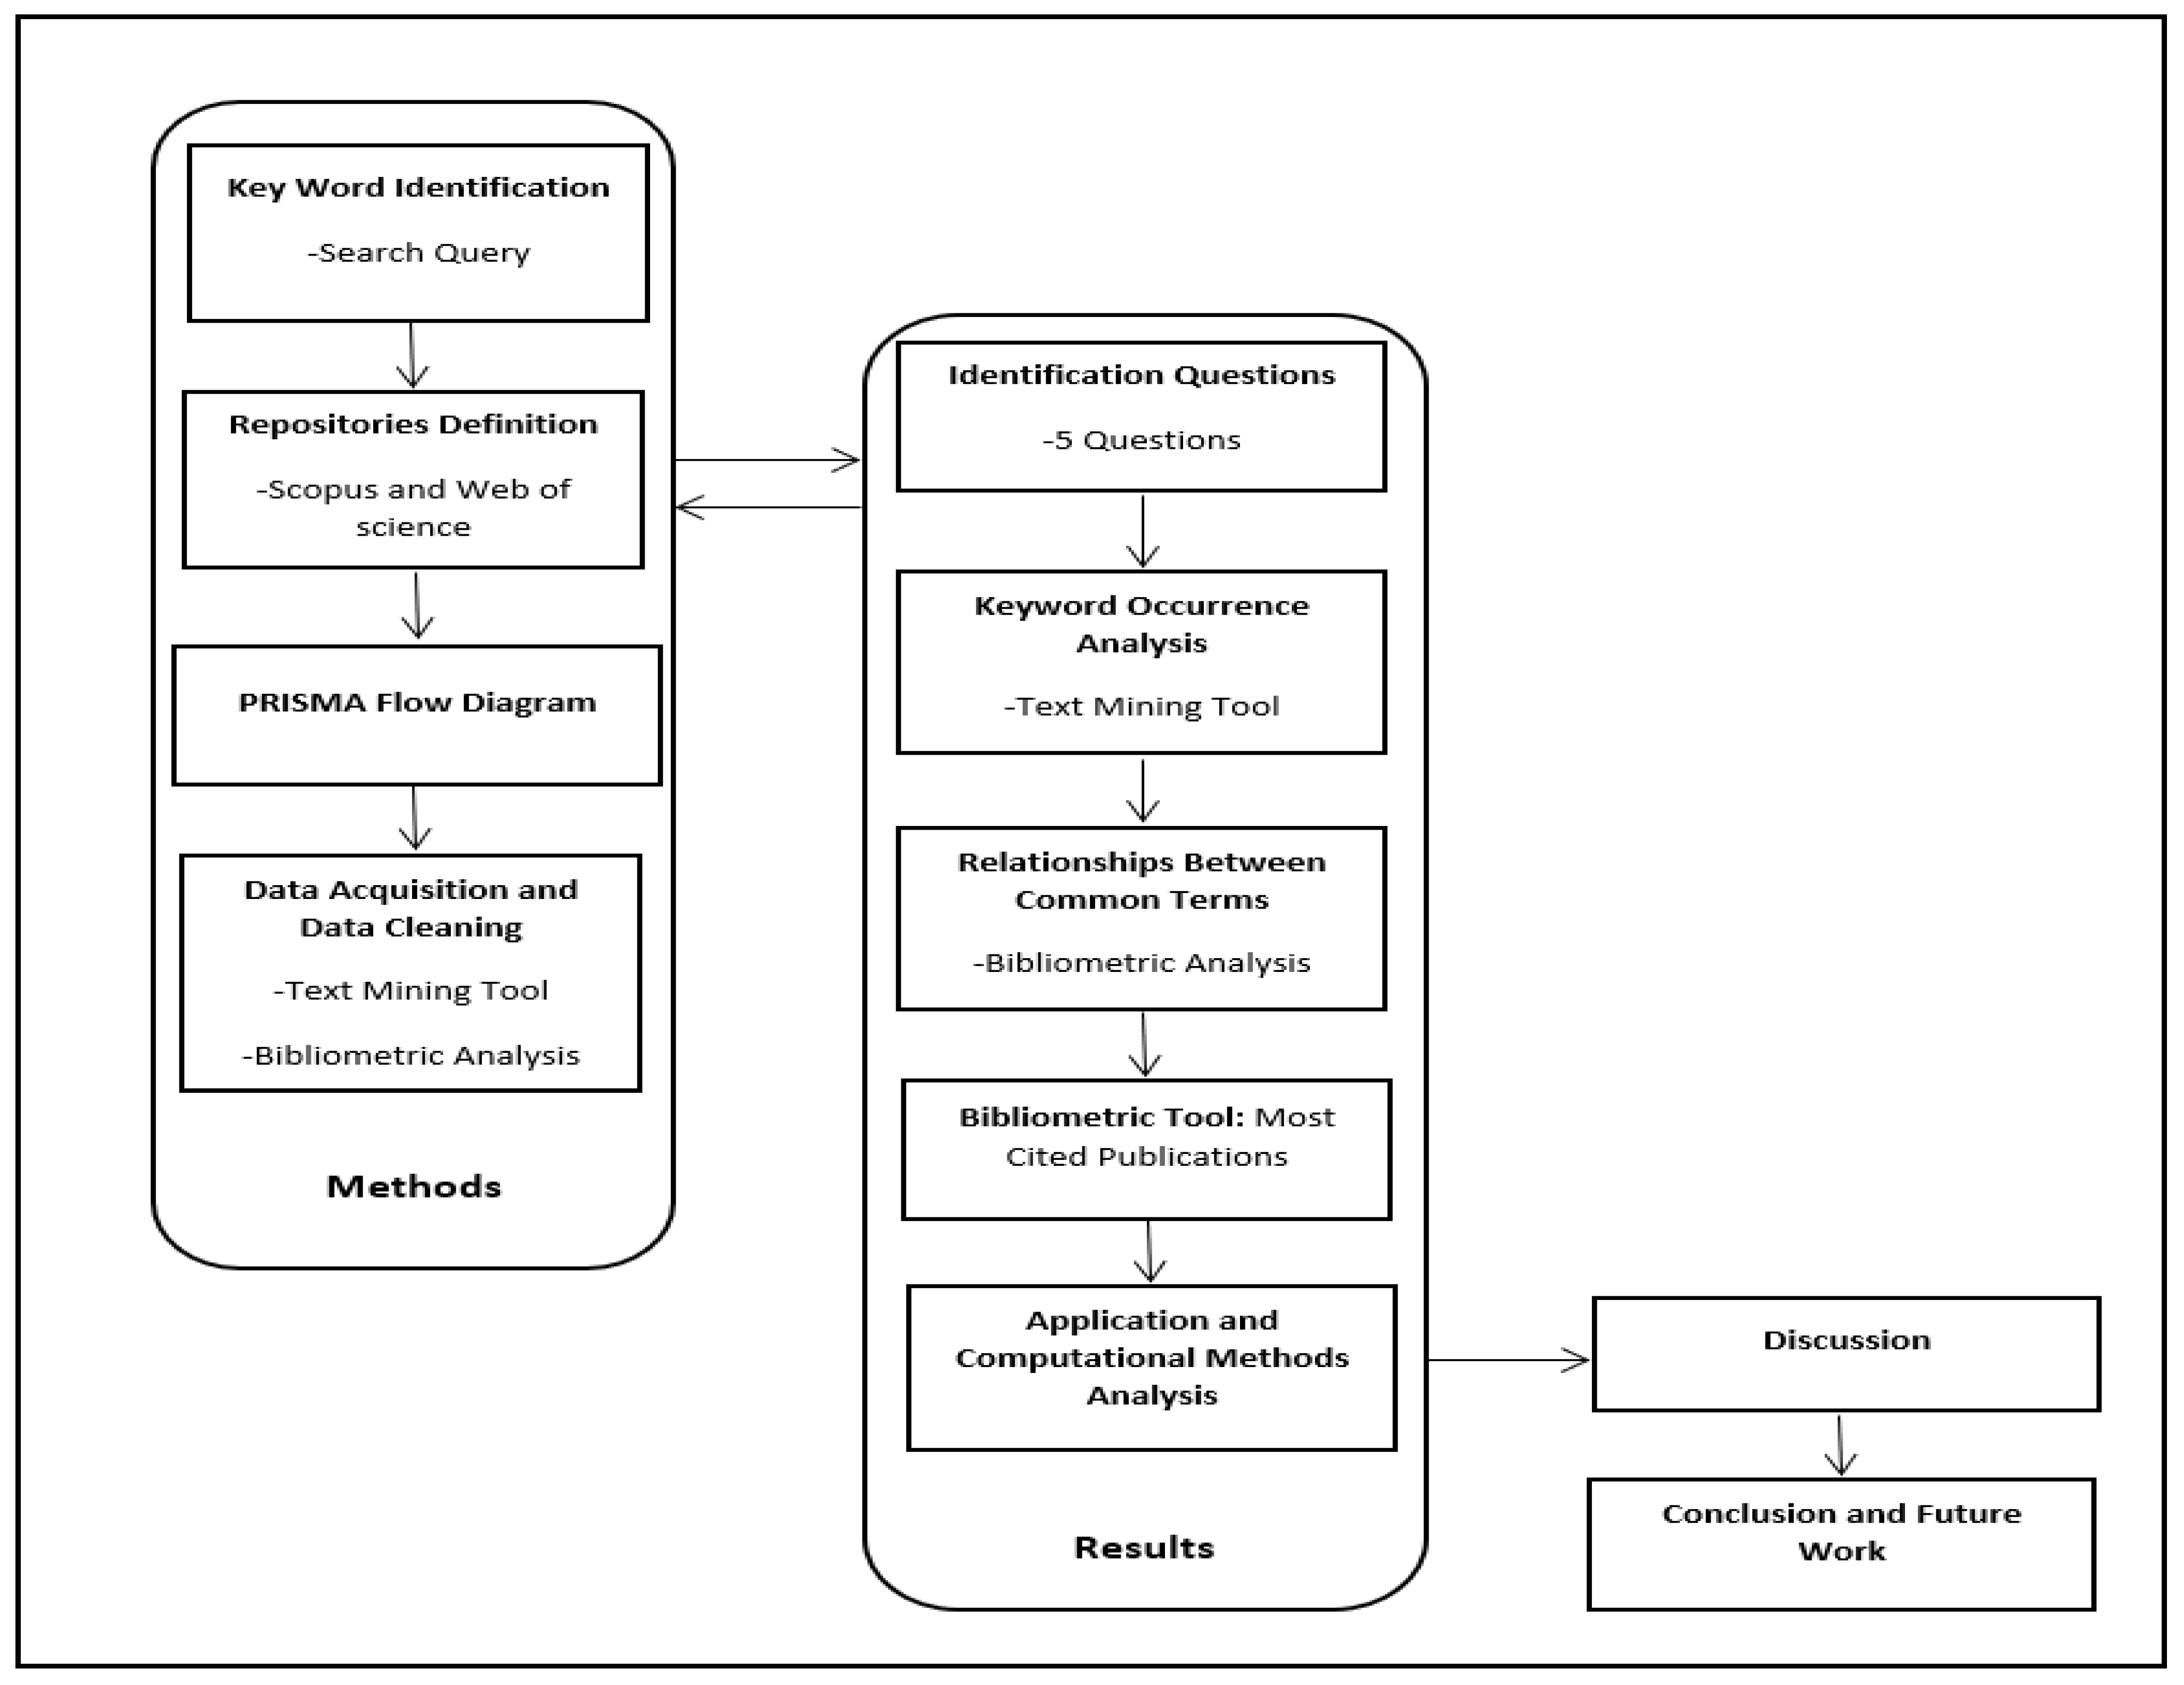
2. Methods

The methodology of this literature survey is divided into two main parts: in the first part, we present a standard method to find and select published manuscripts. In the second part, we describe our survey results through the text mining and bibliometric analysis, as shown in Figure 1.
Our systematic literature survey presents an evaluation of the scientific community contributions to the topic of energy consumption of buildings by using a rigorous and auditable methodology based on the PRISMA approach.
The PRISMA method is composed of five phases, as follows:
  • Identification of relevant manuscripts of the domain or domains.
  • Screening of titles, abstracts, papers, excluding papers without experimental evidence and position papers.
  • Eligibility analysis.
  • Full text screening.
  • Final papers to be analyzed in detail.
We also adopted a text mining method and bibliometric map analysis. The bibliometric map is used to find the relationships between common in energy and machine learning domains terms [31], and text mining is used to find the more relevant terms about the energy and machine learning domains. To this end, we followed three phases, evaluating the following quantities:
  • Overall words frequency.
  • Most common words.
  • Frequency of these common words in the final manuscripts of the study.
By following PRISMA, this section is structured in the following way: (1) paper search strategy, (2) text mining approach and bibliometric map analysis, (3) inclusion and exclusion criteria, and (4) final paper selection.

2.1. Search Strategy

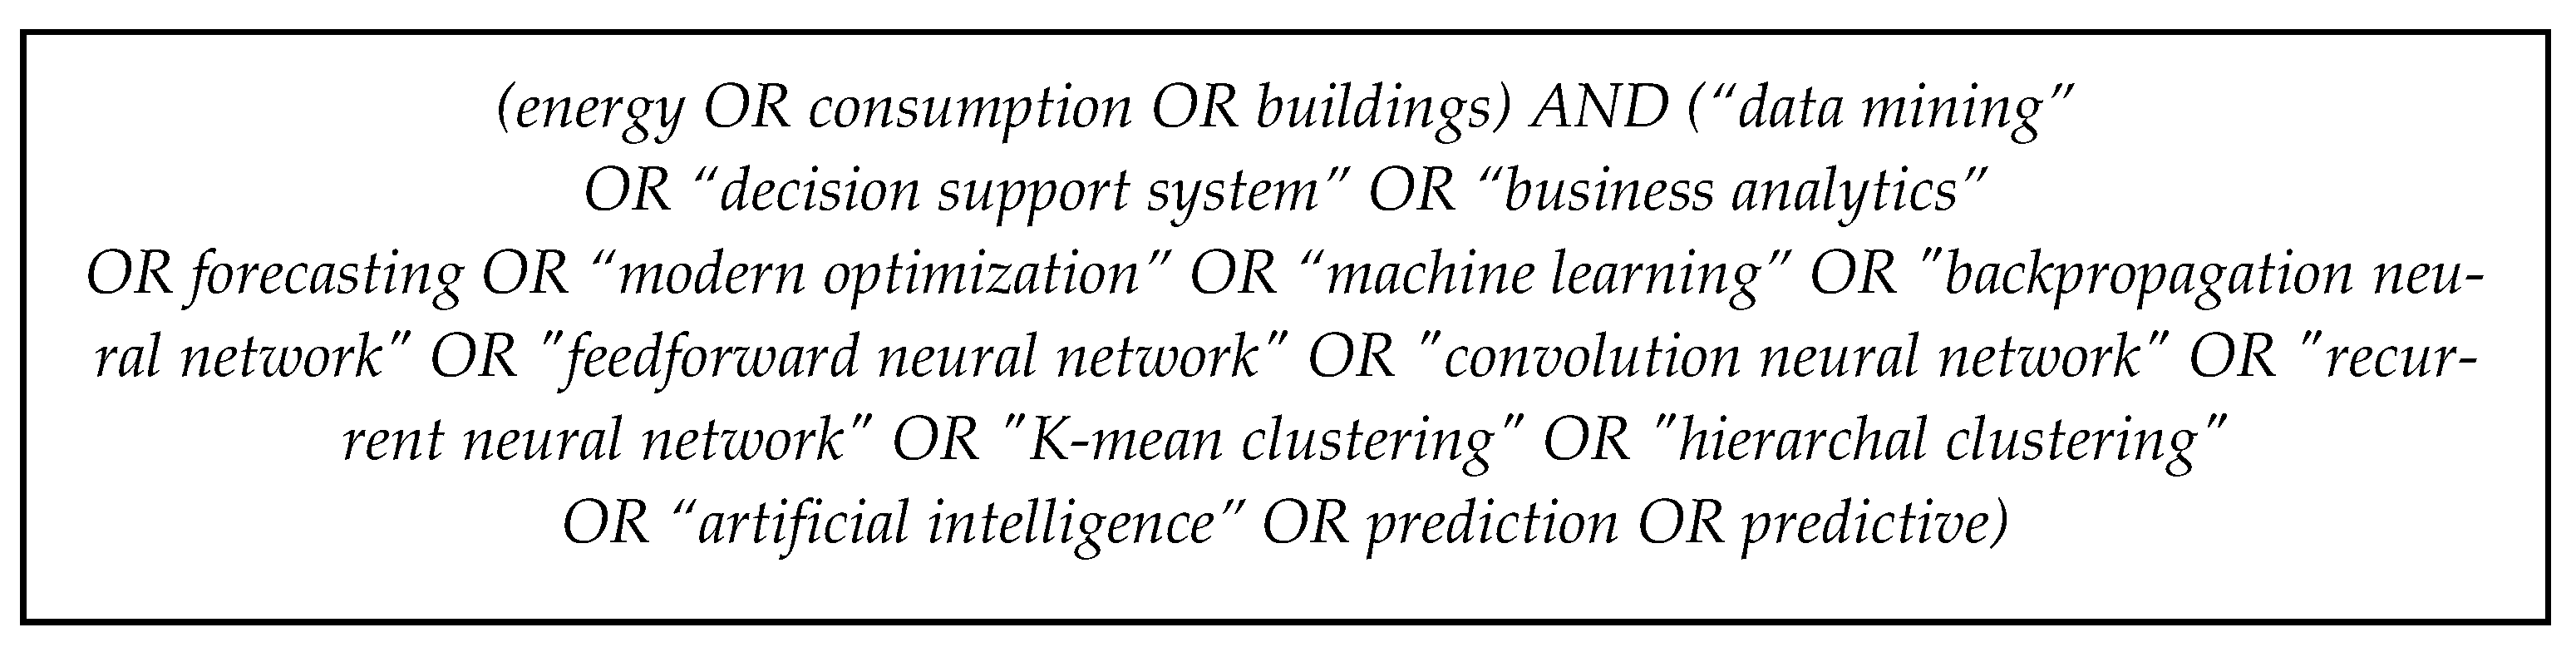
A literature survey generally recommends searching several available journal and conference paper repositories in order to determine if similar work has already been performed, aiding in locating potentially relevant studies. In this study, we searched the following electronic paper repositories: (1) IEEE Xplore, (2) Science Direct, (3) Springer, (4) Scopus, (5) Web of Science and reviewed the following types of manuscripts: technical reports, scientific conference papers, and scientific journal papers. The search query was created to match the search string only in the head of the manuscripts. We used alternative keywords, logically connected by ‘OR’ or ‘AND’ statements. The resulting search string utilized in the mentioned electronic repositories is depicted in Figure 2.
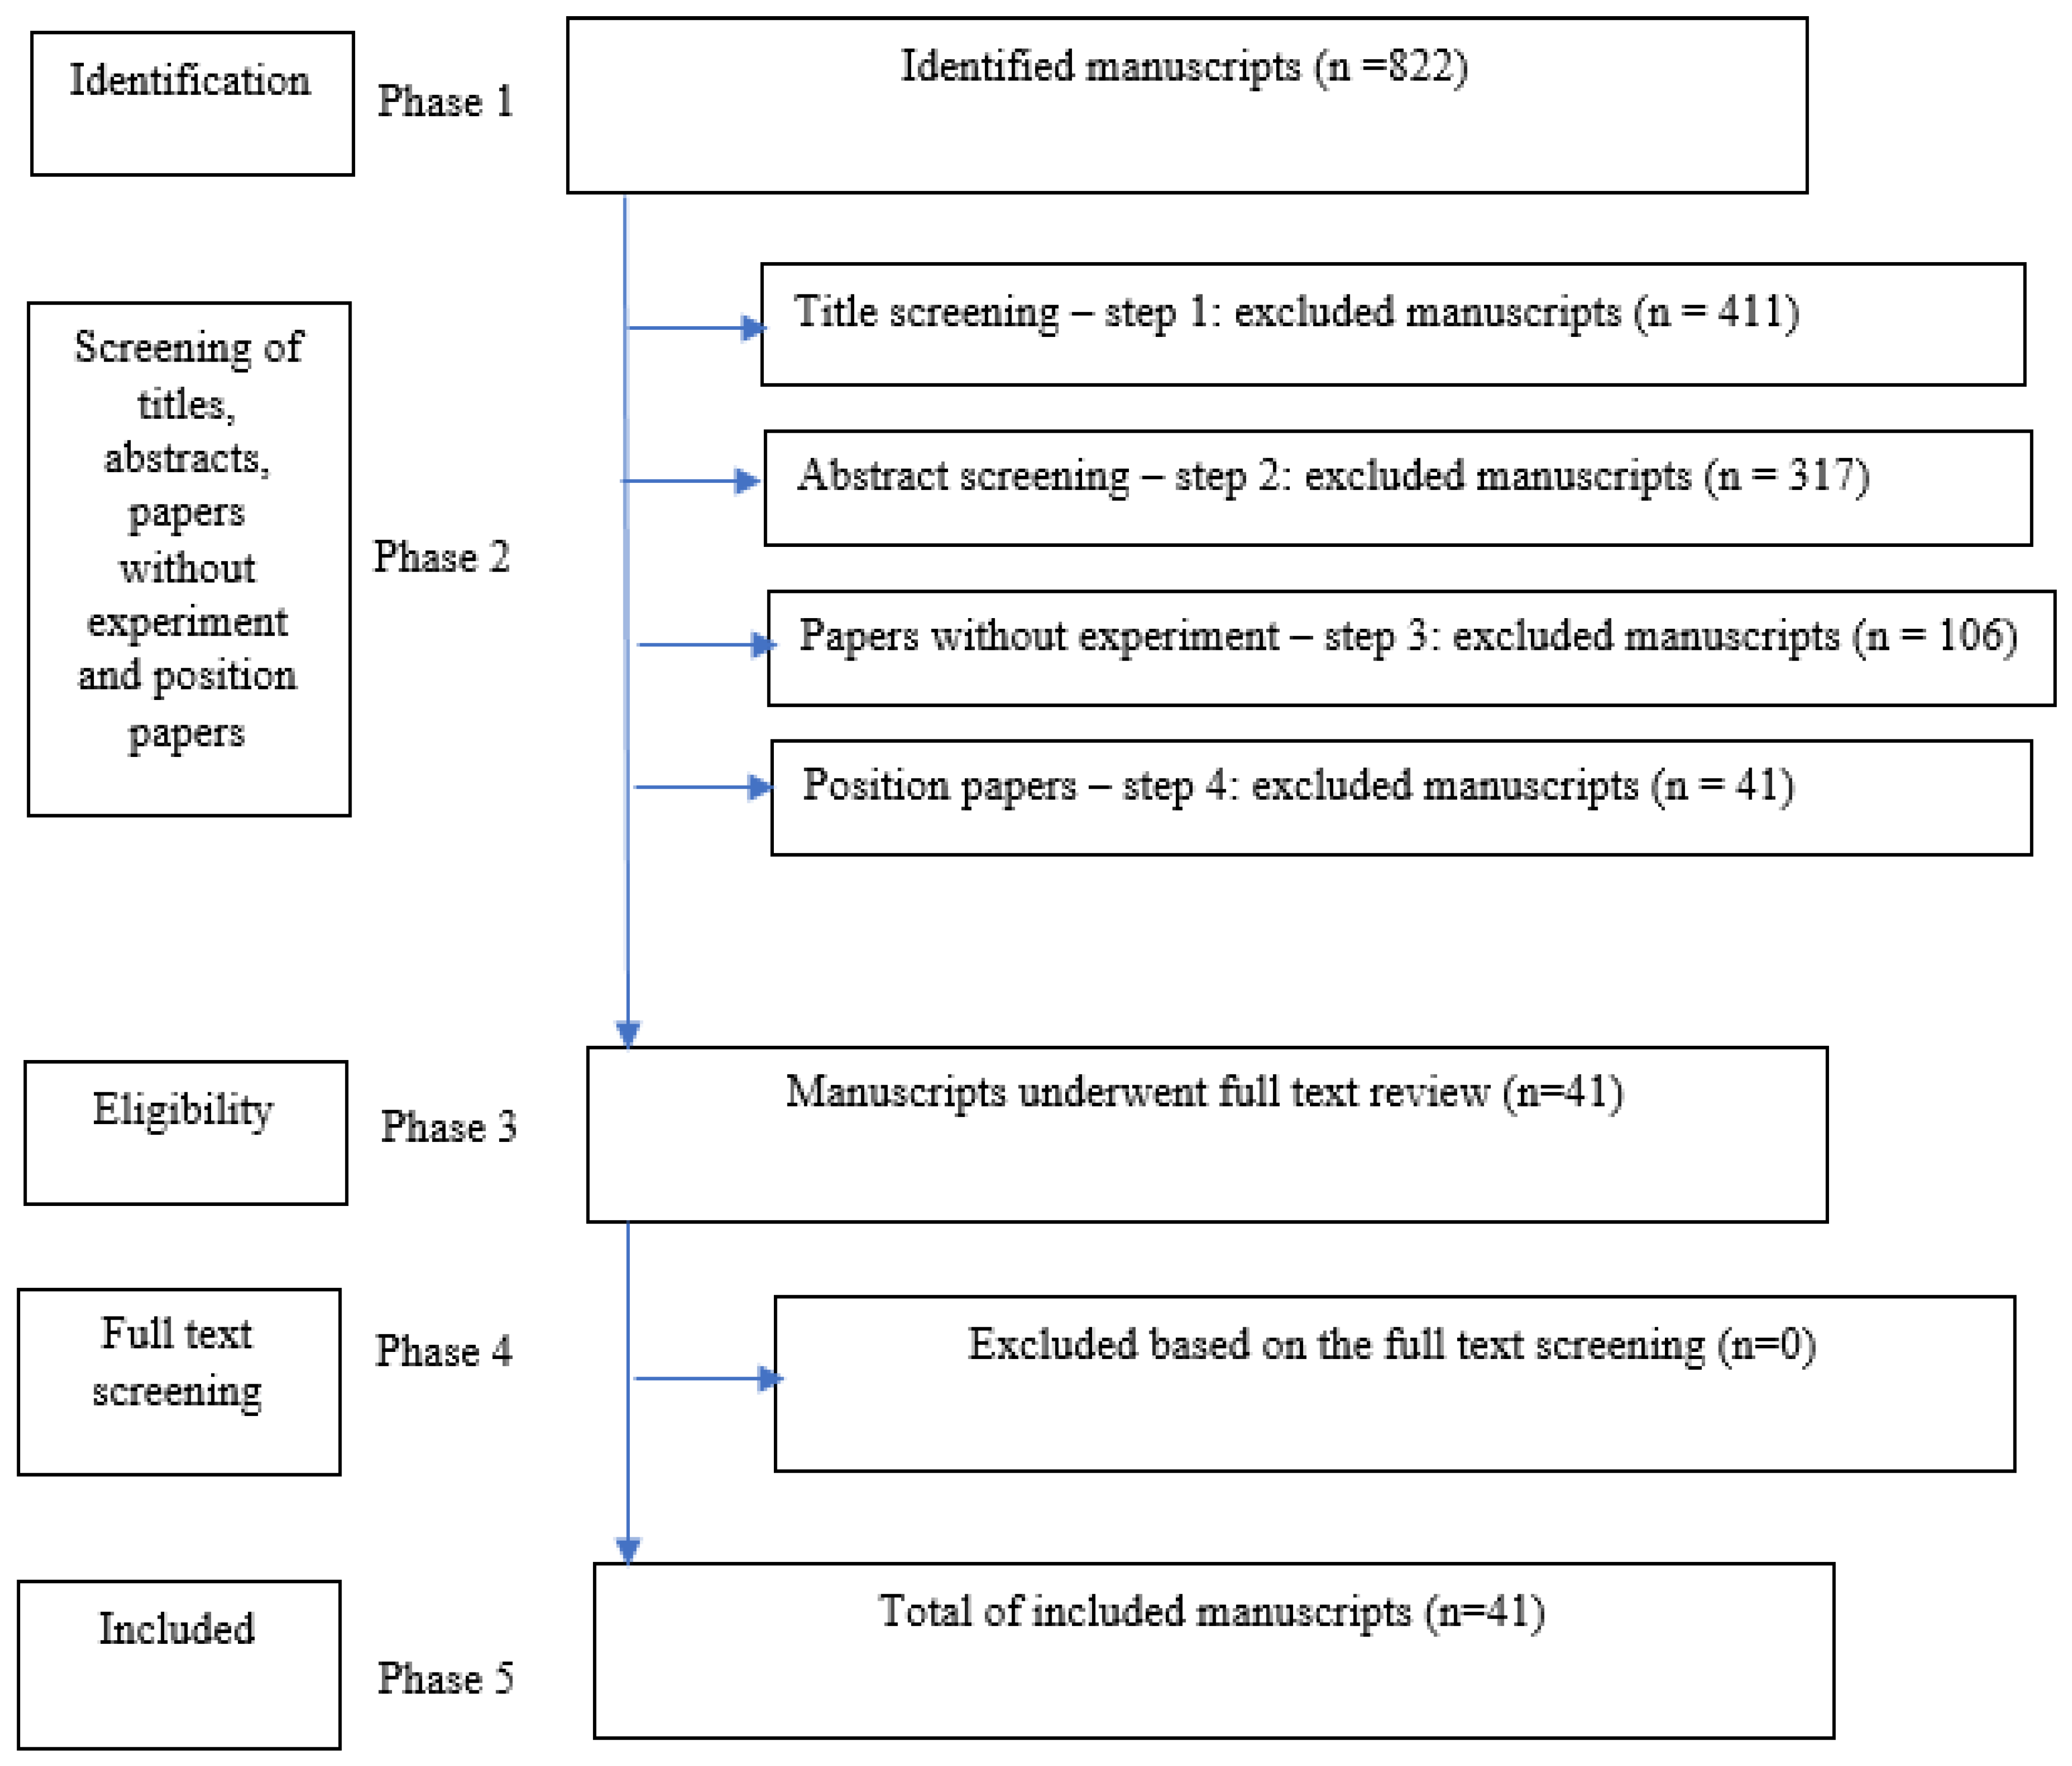
Figure 3 depicts the PRISMA flow chart, illustrating the 5 phases used when filtering the manuscript set. n is the resulting number of papers at the end of each Phase or Step.
In phase 1, we applied the search string to all electronic repositories looking for papers published between 2013 and 2019, which resulted in 822 publications. Phase 2 followed a 5-step approach. In step 1, we excluded manuscripts based on titles (e.g., energy consumption on industry buildings, transport, and services), which narrowed the set to 411 publications. In step 2, we excluded manuscripts based on abstracts screening, which resulted in 317 publications. In the following step 3, we excluded manuscripts reporting research without experiments, resulting in 106 publications. Subsequently, in step 4 of phase 2, we excluded position manuscripts which gave us the final figure of 41 publications. In phase 3, manuscripts underwent a full-text reading and review, which led to no exclusions (result of phase 4).
As a result of our paper selection approach, the final list included 41 manuscripts (phase 5), which are analyzed in detail in this paper. These were further divided into the following four categories, as shown in Table 1, Table 2, Table 3 and Table 4:
  • Energy consumption of buildings (S1–S10).
  • Classification of ECB (S11–S20).
  • Prediction of ECB (S21–S33).
  • Combination of classification and prediction of ECB (S34–S41).

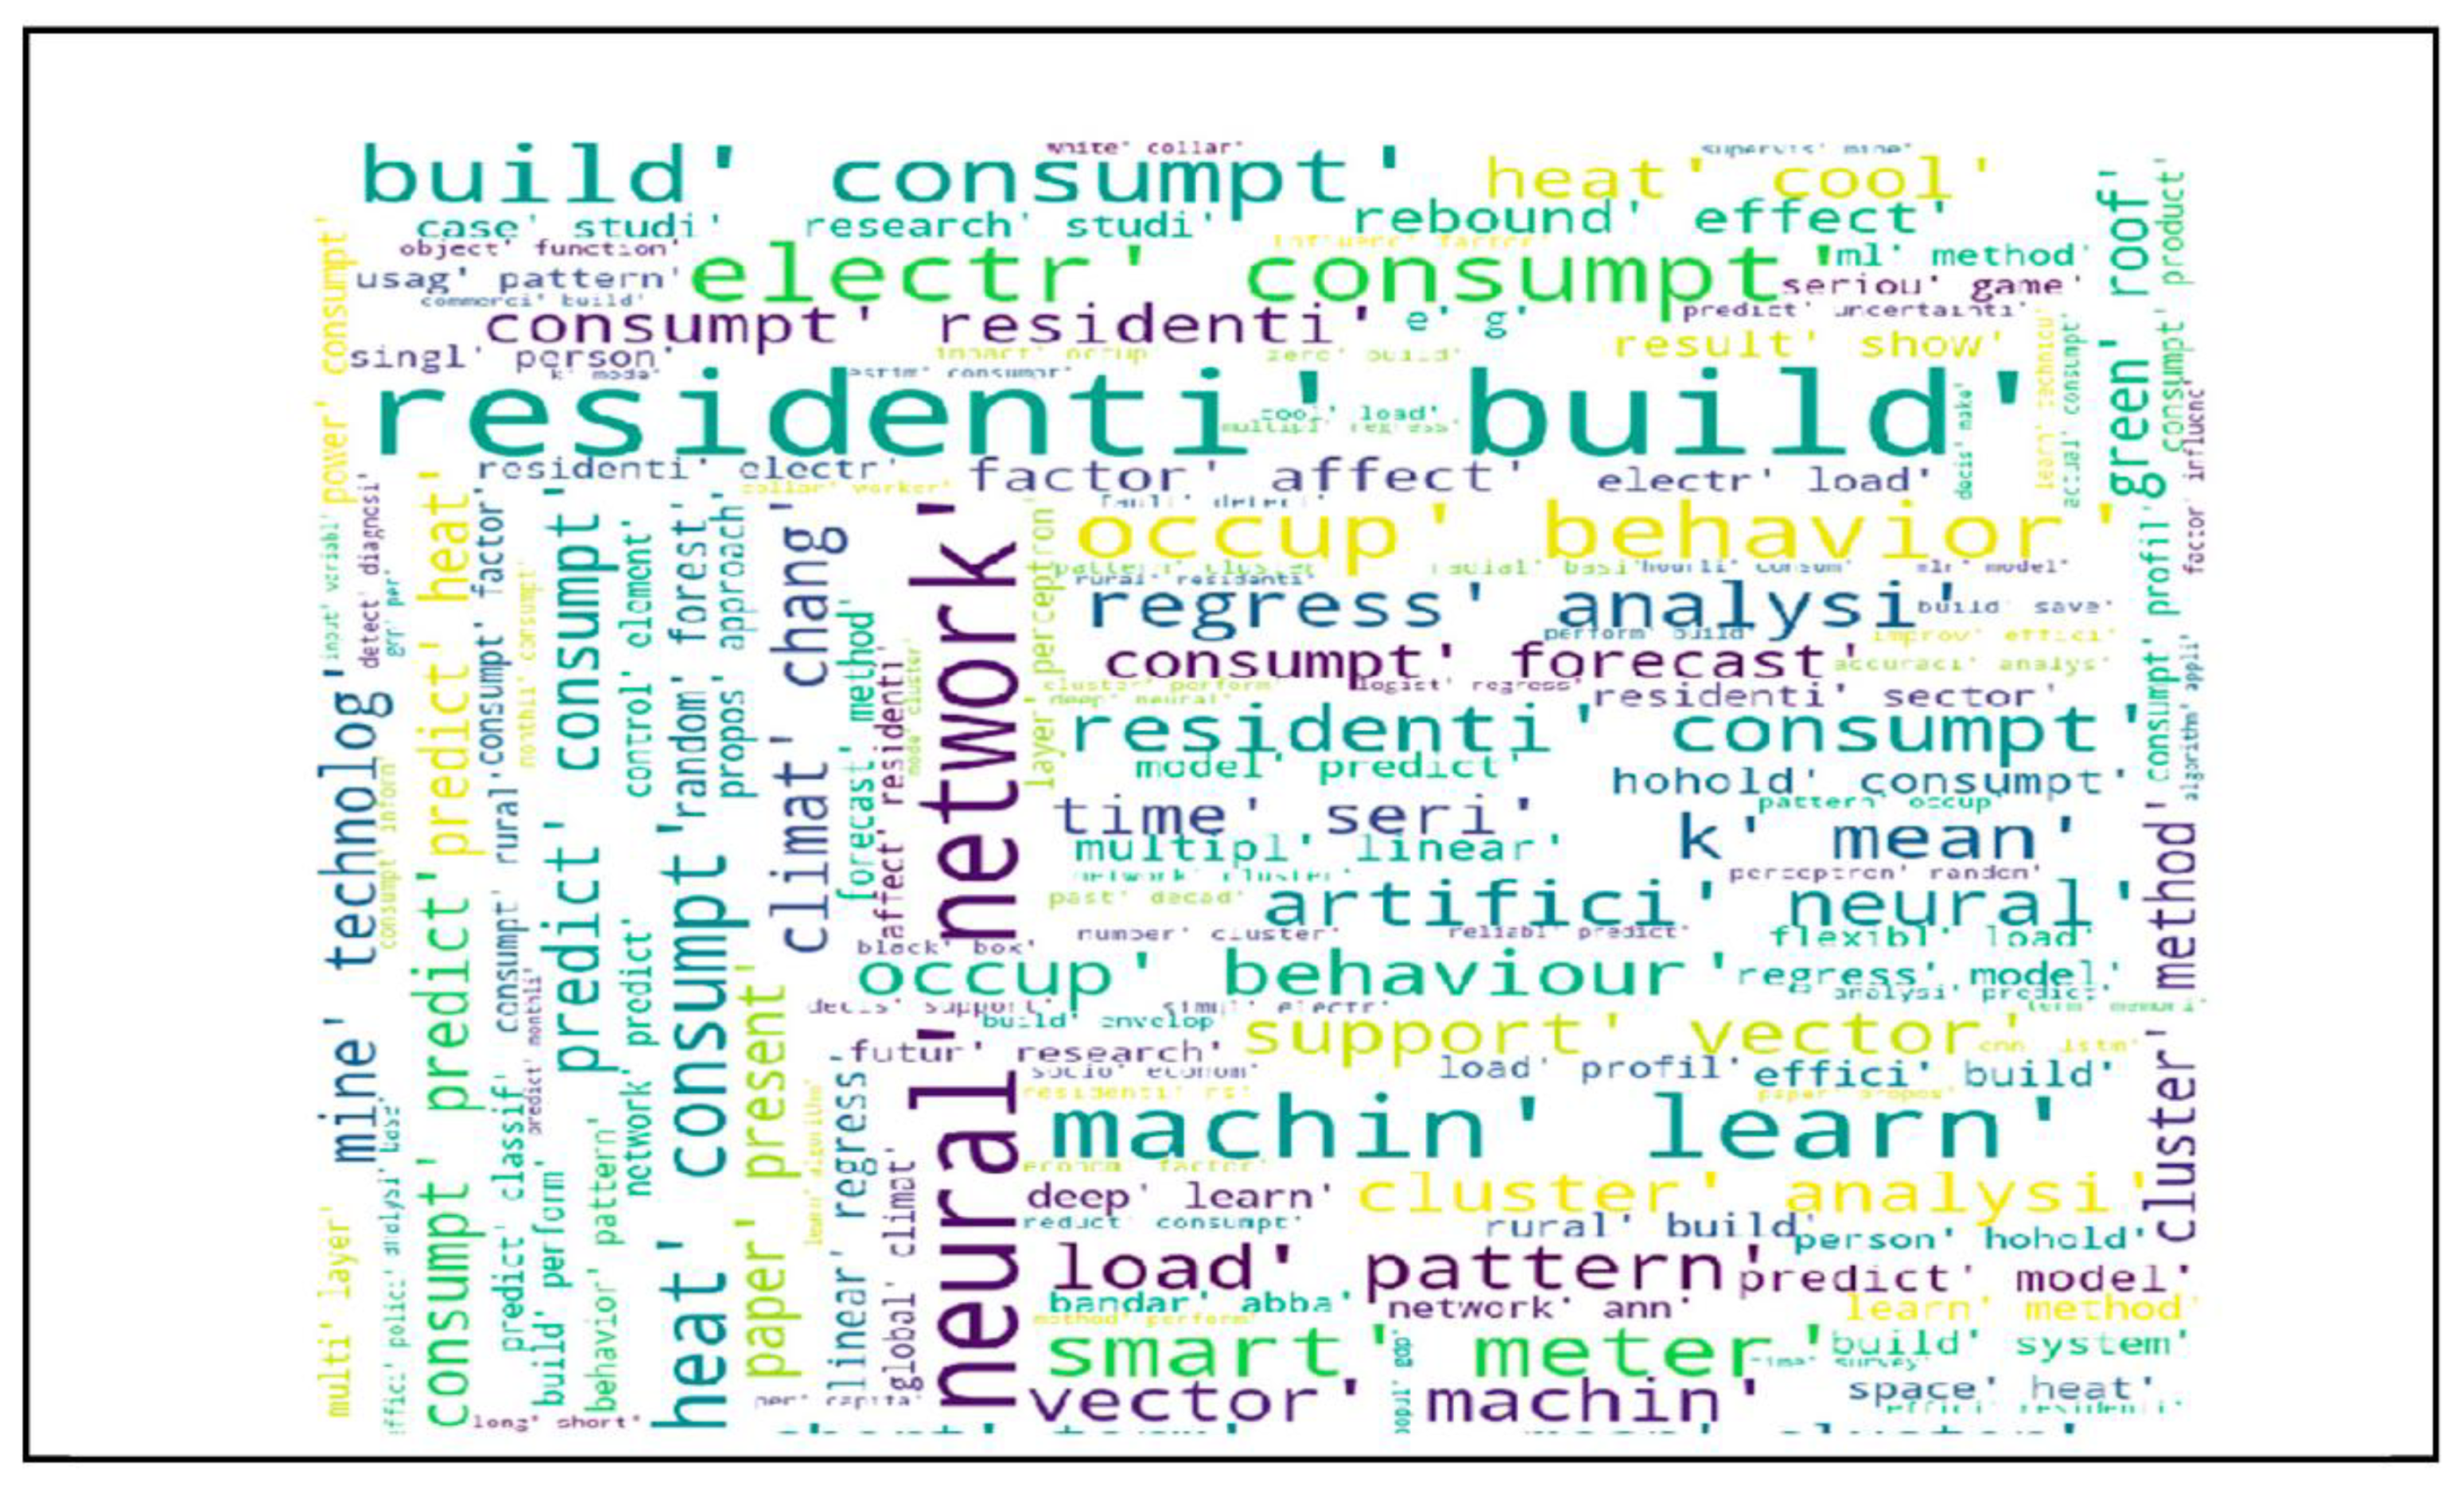
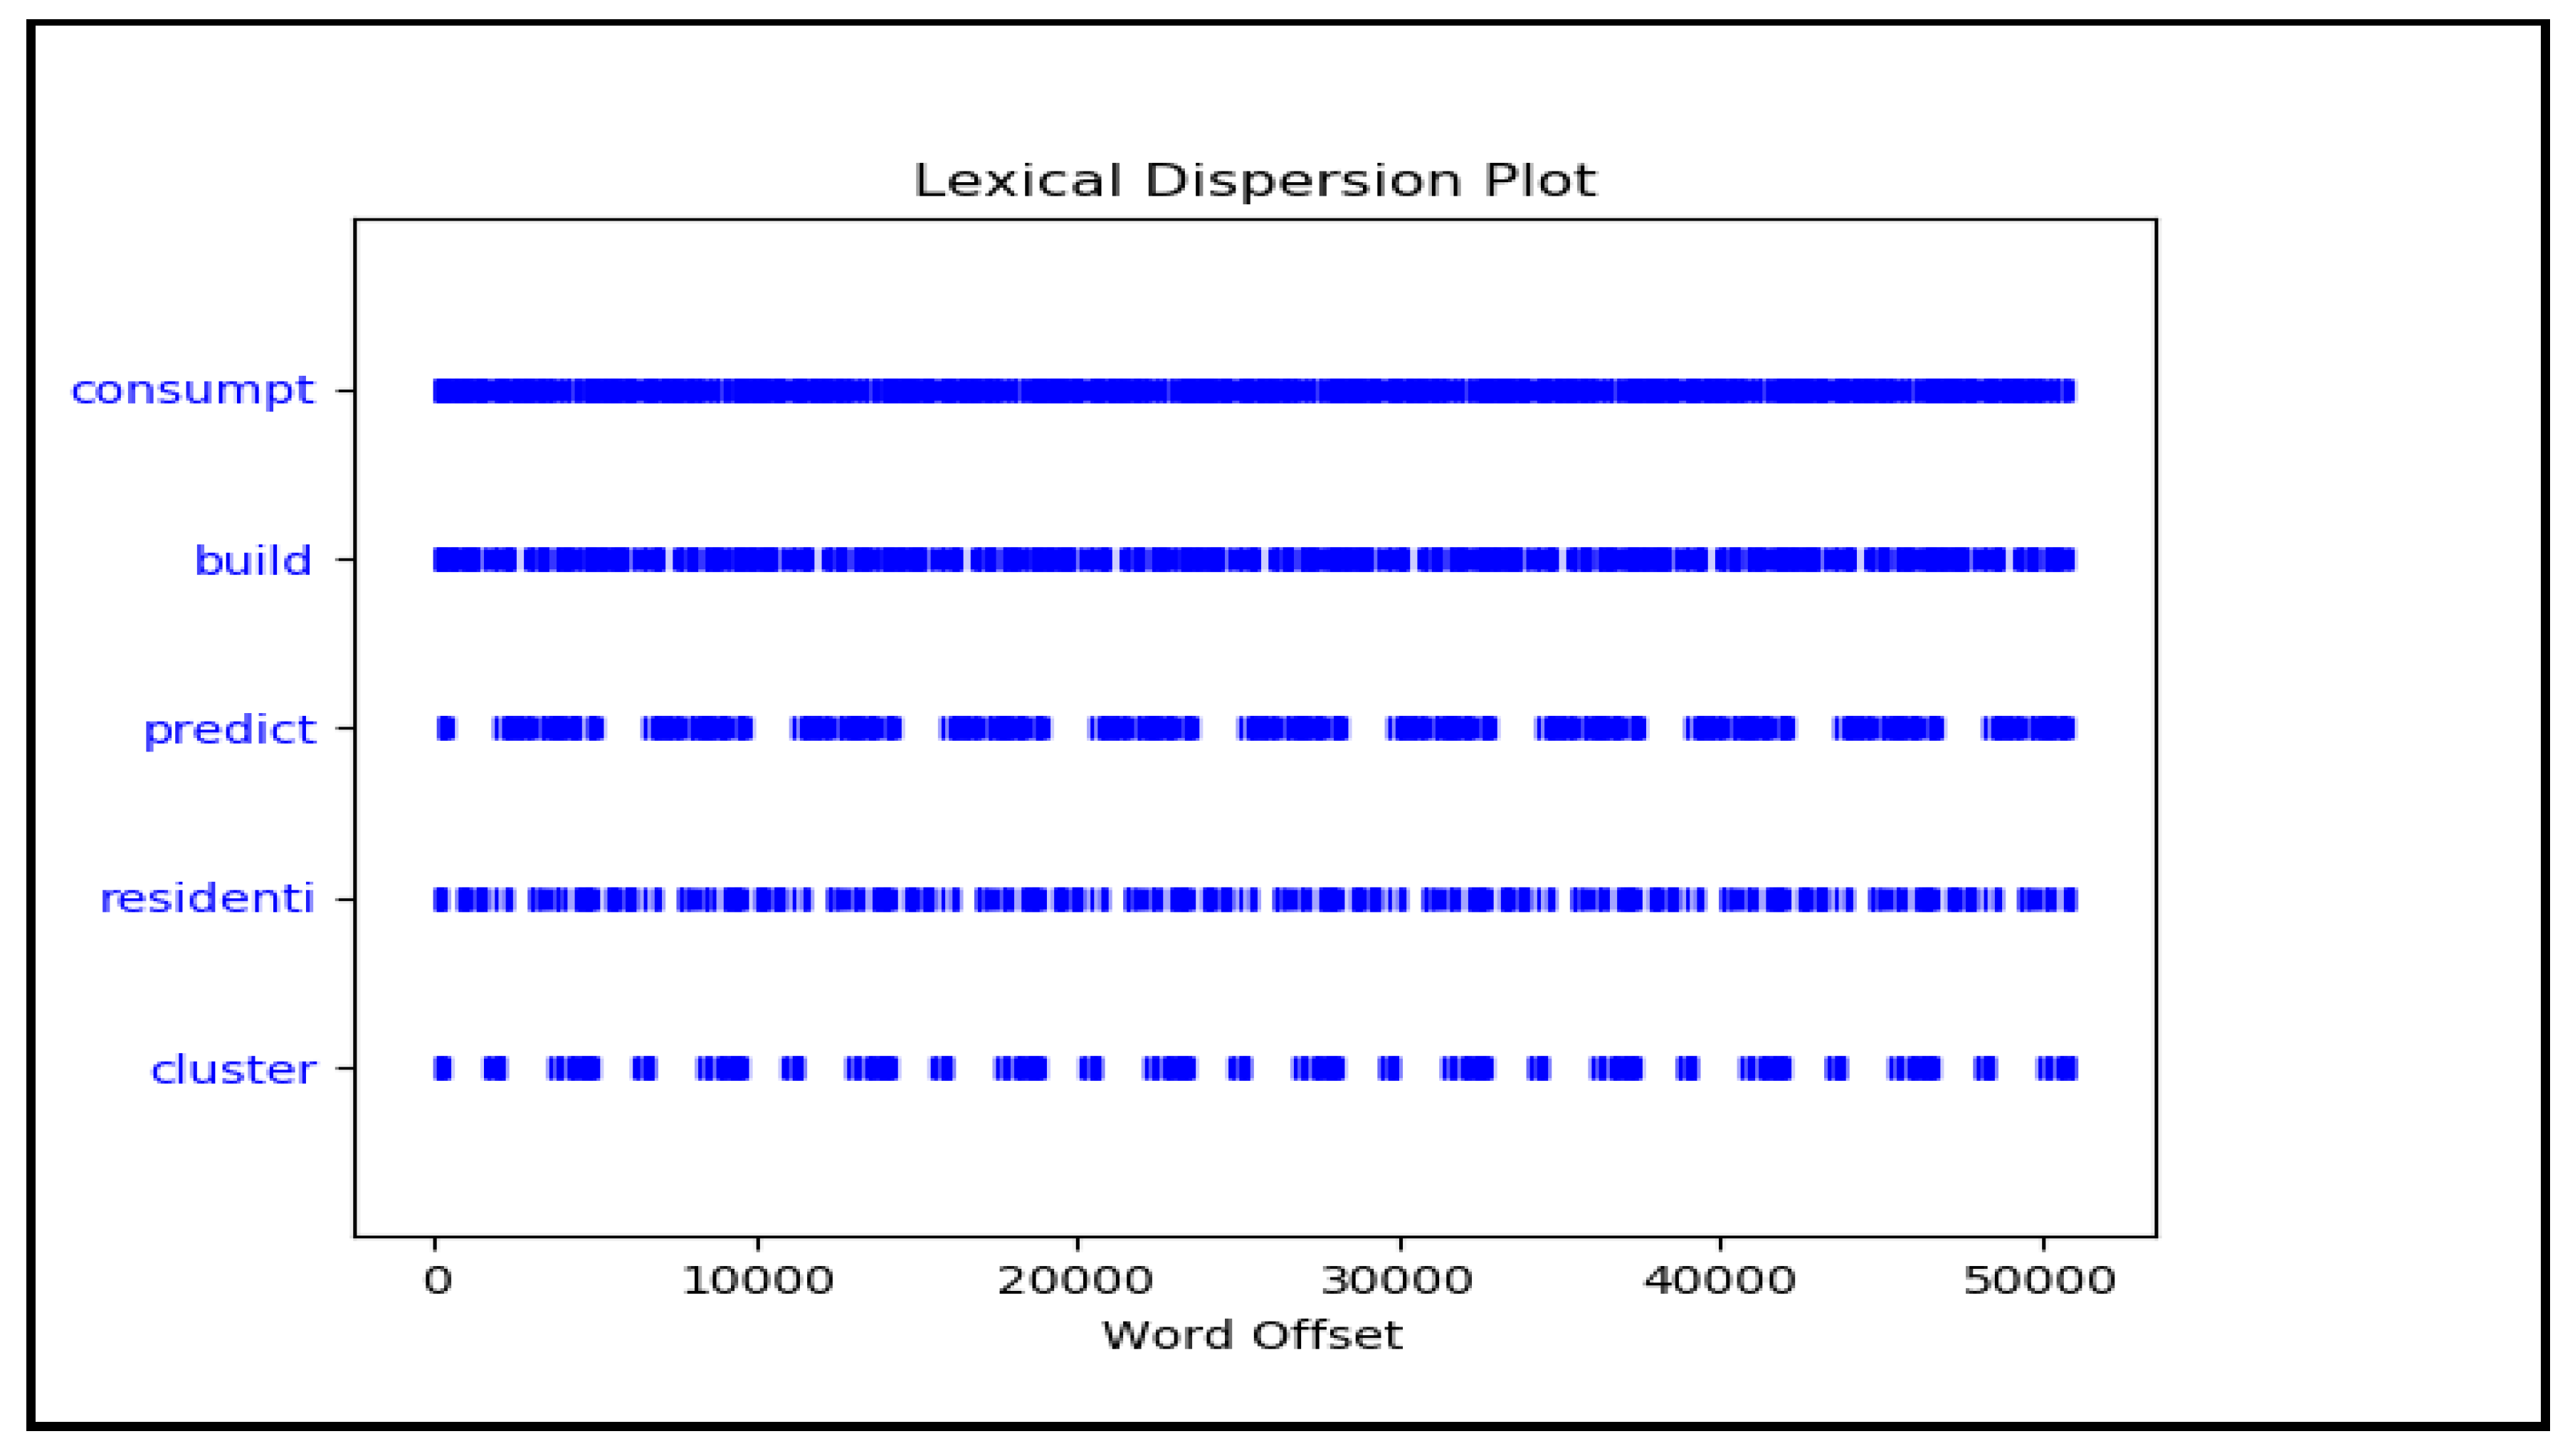
2.2. Text Mining for the Literature

As mentioned, by adopting the PRISMA method, our paper analyzed 822 manuscripts published between 2013 and 2020. These manuscripts were filtered out to 106 studies based on title, abstract, and manuscripts without experiments. Since 106 manuscripts is a large number for a manual analysis, we describe in this section a text mining approach, aiming at discovering relevant terms in both intelligent computing models and energy consumption fields, that we performed in a stage prior to the full-text review of the retained 41 papers of this survey. Text mining was therefore adopted to allow the creation of structured information to improve the subsequent analysis of such manuscripts. To be effective, this type of technique requires the prior definition of a dictionary that includes not only common terms of the domain but also terms associated with concepts related to our research topic: intelligent computing models and the energy consumption of buildings. This approach is more comprehensive if we compare it with standard text mining techniques that randomly search, group, and count words. Thus, the authors created two dictionaries, one for “intelligent computing models” and another for “energy consumption of buildings,” each of them including a preliminary list of expressions consisting of one or more words.
It should be noted that all three authors are experienced in the topics of the paper, particularly computer science and machine learning (first, second, third authors) and energy (third author). The manuscripts were analyzed in terms of title, abstract, and keywords to verify the dictionaries. Given the large number of manuscripts available for our analysis, a reasonable number of randomly selected articles were chosen to validate the dictionary. Such dictionaries are shown in Table 5 and Table 6. It should be borne in mind that the terms “energy” and “intelligence” are not mentioned in the dictionaries since they are too broad. Terms like “industrial building” are also not included in our dictionaries whenever they represent a topic outside the scope of our research, like this example.
During our analysis, we understood that it could be possible that some dictionary terms might not be available in title + abstract + keywords of our surveyed manuscripts since many terms could be expressed several times throughout an article, and these might be more relevant than the ones mentioned only in the abstract. Thus, the entire text was considered for an analysis of the collected literature, especially in the areas of intelligent computing models and energy consumption of buildings. The reference section was removed of all manuscripts during the analysis.
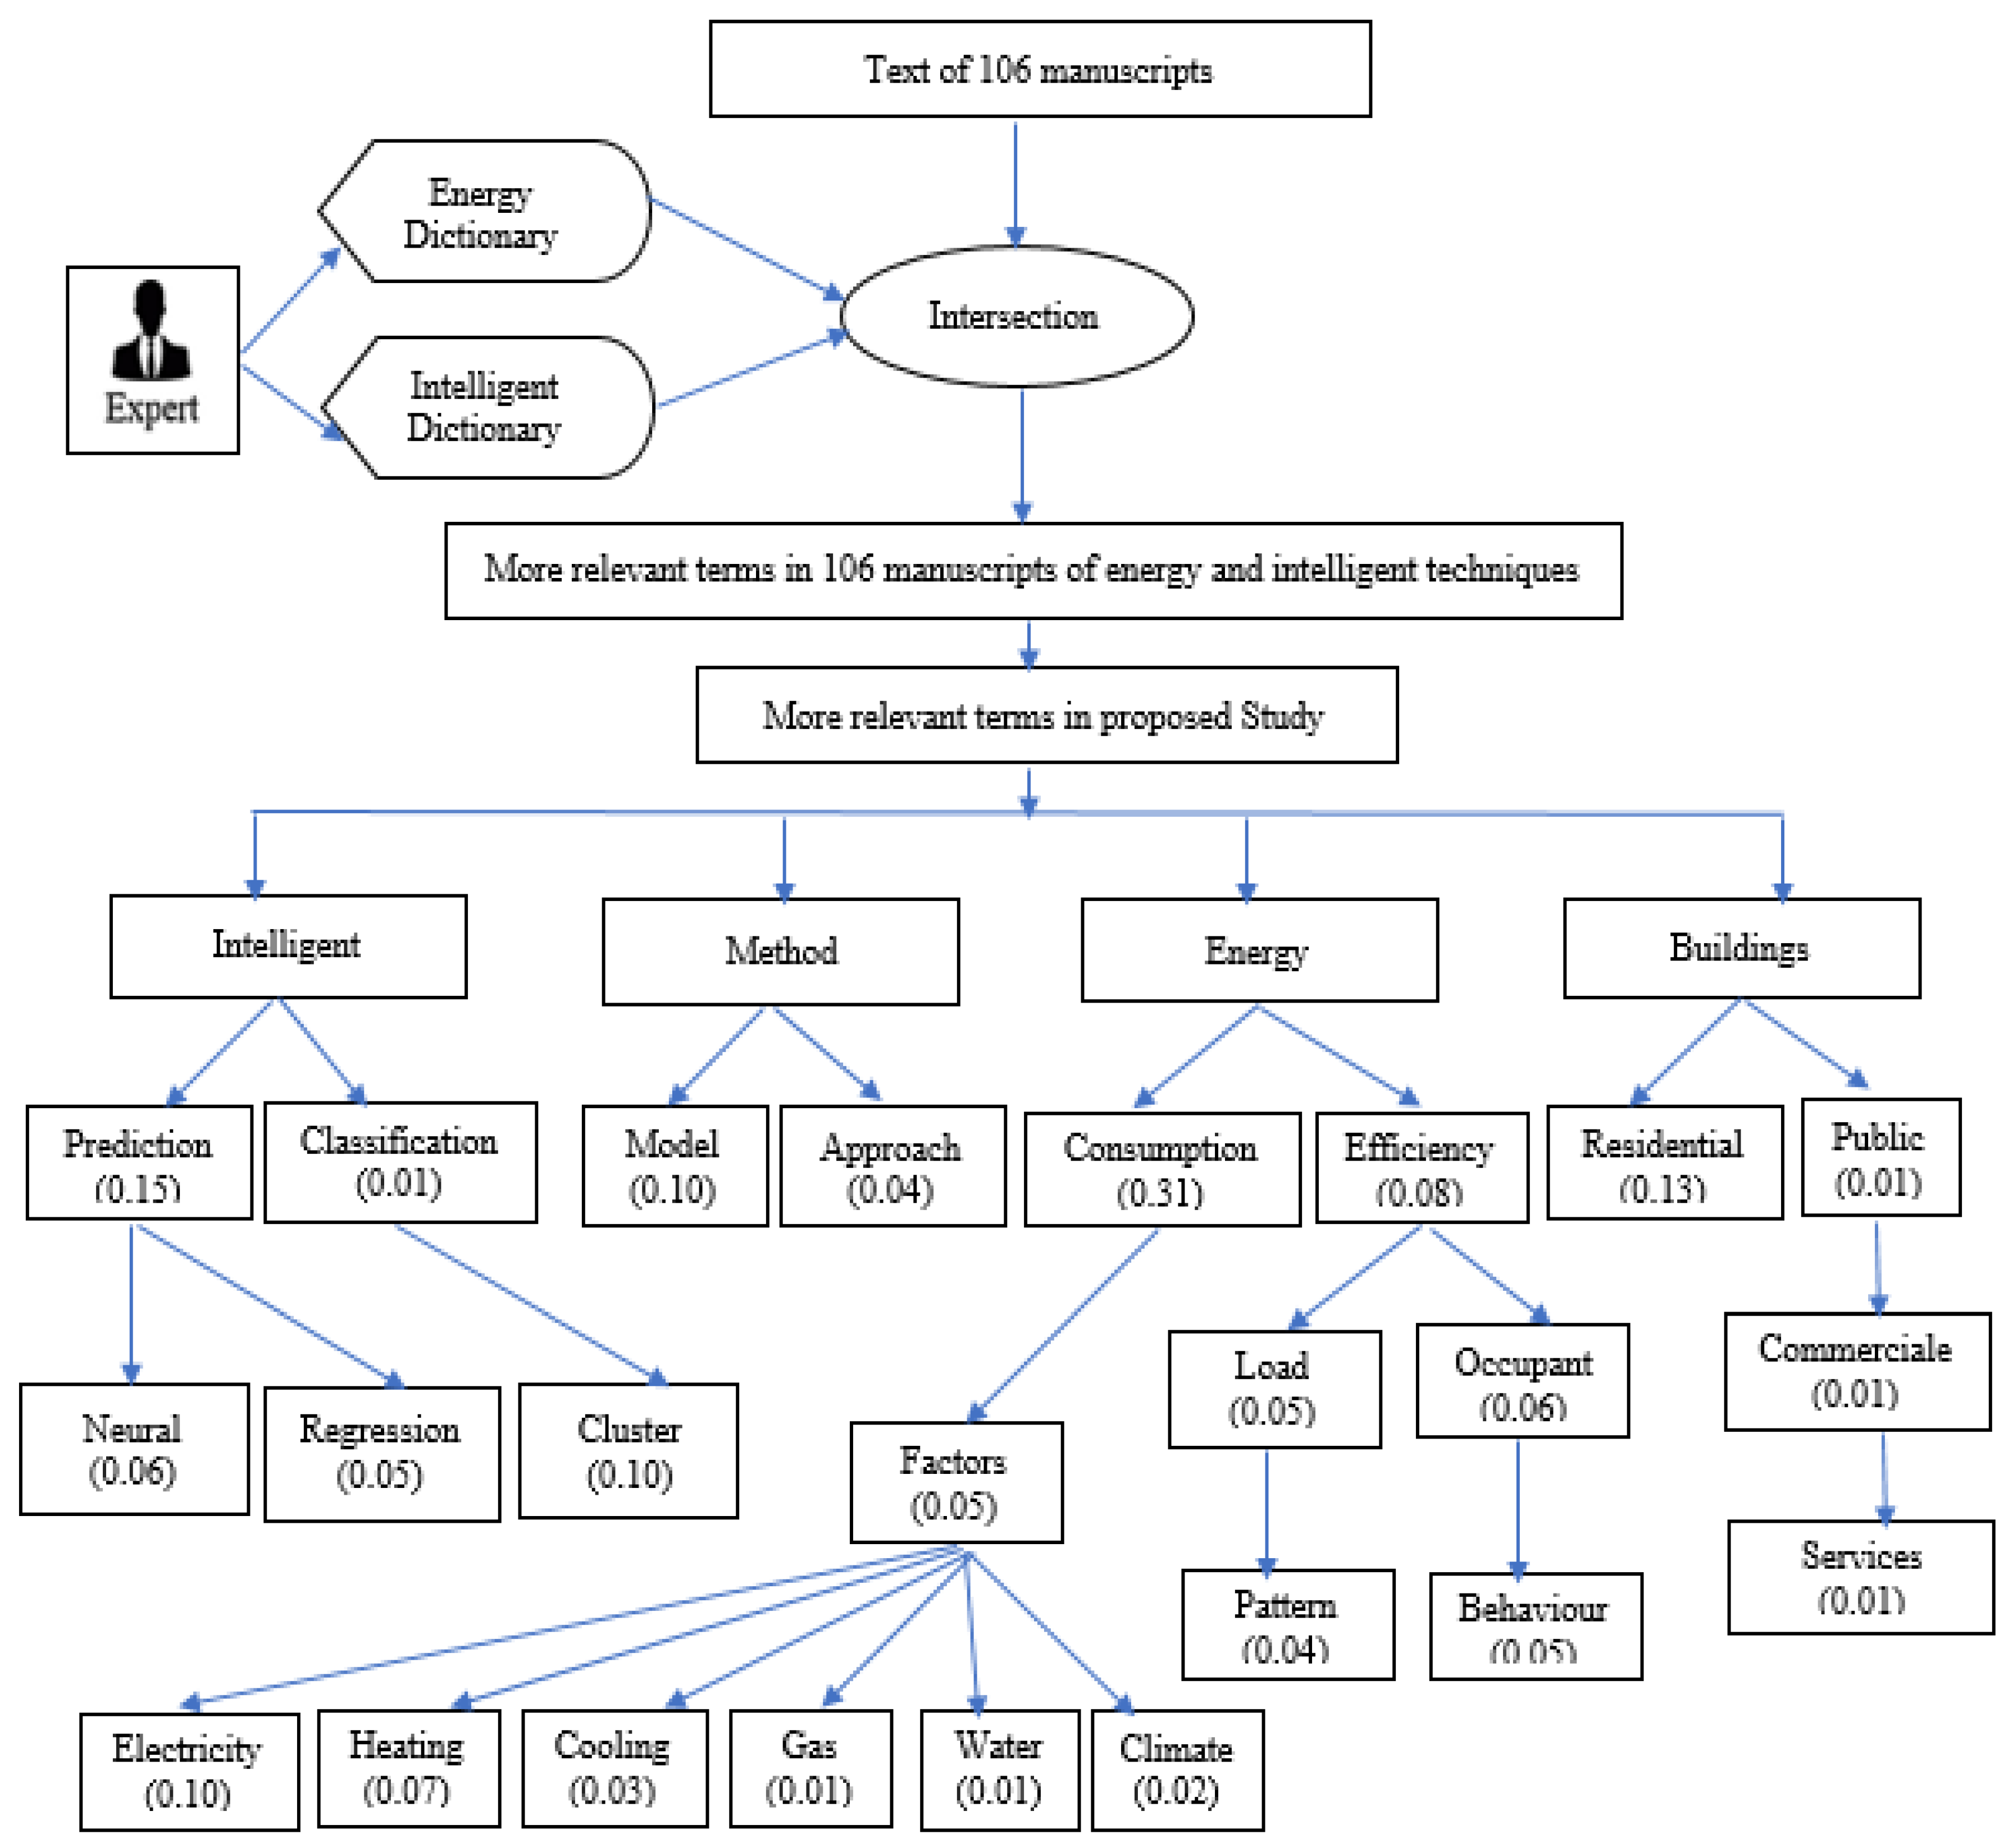
The second part of our terminology analysis adopted a bibliometric map to find critical relationships between factors and intelligent computing methods. Such a bibliometric map helps stakeholders to find the most used factors and methods and their relationships.
For these, we computed a quantity, referred to as “The Important Terms”—TITs (of a given word) Elgendy and Wu [70,71] that represents the importance of each word in the corpus, of the form:
T I T s = review . count ( £ ) len   ( review )  
where: review = words in our studied corpus; £ = a common word, such as “consumption” or “cluster”.
As an example, if we have review count (“consumption”) = 1881 words, and review = 6000 words, then TITs = 0.31. We assume that if (TITs) > 0.05, the word represents a highly relevant term in the corpus. We supposed 0.05 as a percentile to exclude less relevant values. This number is the nearest number to a high relevant term (consumption (0.31)). Thus, the terms “consumption (TITs = 0.31),” “residential (TITs = 0.13),” “prediction (TITs = 0.06),” and “cluster (TITs = 0.10)” represent the most relevant terms. By contrast, the terms “classification (TITs = 0.01),” “water (TITs = 0.01),” “commercial (TITs = 0.01),” and “services (TITs = 0.01),” represent those which are less relevant.
By looking at the results obtained from text mining, we can notice a close relationship between the most important terms found and all the manuscripts in our study. To ascertain this, we computed the following quantity PR (Paper Relationship) [72,73]:
P R = P C C T M R W 100  
where: PCCT = number of papers that contain common terms; MRW = all manuscripts in related work.

2.3. Inclusion and Exclusion Criteria

All the manuscripts analyzed in our paper were selected based on the following inclusion criteria and specific criteria excluded manuscripts from our analysis, as shown in Table 7.

2.4. Study Selection and Data Extraction

Using the above inclusion and exclusion criteria, our paper repository search returned several papers that were analyzed and read in-depth. We especially focused our attention in finding a scientific research gap. To aid the process, we created a data extraction form, which enabled us to collect relevant information from the selected primary papers in order to address our proposed research questions.

3. Results and Analysis

Our results and analysis were structured into three sections. We first show the approach and results of our text mining procedures, which included a word frequency table, a word offset plot, and a word cloud plot. In the word cloud plot, the font size represents the most frequent terms found (see Figure 4). The word offsets plot measures the word dispersion in a corpus (see Figure 5). By evaluating such quantities, we were able to show the relative importance of each word in our corpus through visualization. In the second subsection, we analyze the bibliometric map to find the critical relationships between factors and intelligent computing techniques most used in the ECB. Lastly, in the third sub-section, we analyze the retained 41 manuscripts.

3.1. Text Mining in Detail

Our text mining procedures included the following pre-processing steps over the main documents: removing all symbols, numbers, punctuations, and whitespaces, transforming all words to lowercase, reducing the dictionary terms to a single list of the terms that can be relied upon when reading and analyzing the most important articles for our research. This technique is depicted in Algorithm A1 (See Appendix A).
After applying our text mining procedure, we found 1077 common terms within two dictionaries, where a sample of these are presented in Table 5 and Table 6. From these, we found the top 30 common terms ranked by higher word frequency, depicted in Algorithm A1. Terms 1 and 2, respectively, “consumption” and “buildings,” are related to the “energy” domain, whereas the third term, 3, “predict,” is associated with the machine learning (“intelligent”) domain. By looking at Table 8, we notice that several terms are related to energy consumption and intelligent methods used by several authors to solve problems in the energy domain. This analysis provides an overview of the factors used to determine energy efficiency or consumption in various types of buildings. It also highlights some intelligent computing methods used to solve such problems. Particularly, we can understand that research efforts are directed to use recent intelligent methods, such as deep learning, to address energy problems effectively.
Figure 4 depicts the more frequently used words by using a word cloud plot. Words in the word cloud represent the frequency or the significant of each word. Figure 5 shows the top five words, ranked by frequency, by using a word offset plot. This plot depicts the position of a term in the purview from its starting position. A dispersion plot is used to show the positional information. Each stripe shows an instance of a term, and each row shows the whole text. We can notice, in both Figure 4 and Figure 5, that we computed these plots after using our stemming method, and therefore, we end up with many cropped words.
In Figure 6, we depict the steps taken to obtain highly relevant terms related to the topic of intelligent computing techniques applied to energy. We calculated the intersection between the words of all manuscripts and two dictionaries of the machine learning and energy domains to obtain the frequency of the top words relevant to the study’s research. We started by arbitrating the following keywords: “intelligent,” “method,” “energy,” and “buildings,” which for us, are the most relevant in the scope of this study. Then, from text mining, we found additional important terms, such as “prediction,” “model,” “consumption,” and “residential.”
For example, the PR ratio is high between the words “consumption of buildings” and all manuscripts (41) by 70.7%, and the remaining ratio (29.3%), regarding the words “efficiency of buildings.” Additionally, the PR ratio is maximum between the regular expression “cluster * buildings” and all manuscripts of Table 2 and Table 4 (category of prediction of the ECB), respectively, by 100%.
In addition, the PR ratio between the terms the regular expression “neural * buildings,” and all manuscripts of Table 3 (category of prediction of energy consumption of buildings), as well as of Table 4 was evaluated at 52.4%, and the remaining ratio (47.6%), to other machine learning techniques with the term “buildings.” We can conclude that the text mining results allowed us to find the most used terms in the intelligent computing techniques topic applied to energy. Moreover, it helped us find the most relevant manuscripts of the said topic.

3.2. Bibliometric Map (VOS Viewer)

We used VOS viewer (“VOS viewer,” n.d.), a visualizing bibliometric network, to find common terminology in two areas: energy consumption and machine learning techniques across the 41 manuscripts under analysis. This tool supported our study, with visual information enabling us to explore the relations between the domains of energy and intelligent techniques. It also helped us find the most common dimensions, clustering, and variety techniques to answer our research questions.
Figure 7 represents the network map visualization that displays the relations between the most popular terminology and how it is linked. The larger node represents the popular terminology in manuscripts, and the size of it represents the number of times it appeared in manuscripts. VOS viewer splits the terminology into clusters according to the relevance in relation to each other.
We performed our analysis on the title and abstract using a binary counting method of 1177 examined keywords with a minimum threshold of 3 occurrences, resulting in 33 terminologies, as shown in Figure 6. In addition, the accuracy of bibliometric analysis is 0.9069. The largest nodes representing the important nodes of each cluster in the network map are determined as “Neural Network” and “Energy Consumption Prediction” (red), “Deep Neural Network” and “Energy Use” (yellow), “Cluster” and “Electricity Consumption” (green), and finally, “Heating factor,” “Climate,” and “Residential Energy Consumption” (blue).
Looking closer at the network map in Figure 6, we can see that the 4 clusters are connected. For instance, the “Neural Network” term is connected to “Energy consumption prediction” in the same red cluster, it is connected to “Prediction Model” and “Energy Use” in the yellow cluster, it is connected to “Electricity Consumption” and “Smart Meter” in the green cluster, and finally, it also connected to “Residential Energy Consumption” in the blue cluster. In addition, the term “Cluster” in the green cluster is connected to “Prediction Model” in the yellow cluster, “Energy consumption prediction” in the red cluster, and “Residential Energy Consumption” in the blue cluster. Moreover, the terms “Heating” and “Climate” are connected to “Residential Energy Consumption” in the blue cluster, “Cluster” and “Electricity Consumption” in the green cluster, “Prediction Model” in the yellow cluster, and “Neural Network” and “Energy consumption prediction” in the red cluster.
Finally, by analyzing the network map in Figure 6, we can identify the important terms in each cluster, as follows:
  • In the red cluster: “Neural Network,” “Energy consumption prediction,” and “Support Vector Machine.”
  • In the yellow cluster: “Prediction Model,” “Energy Use,” and “Deep Neural Network.”
  • In the green cluster: “Cluster” and “Electricity Consumption.”
  • In the blue cluster: “Heating,” “Climate,” and “Residential Energy Consumption.”

3.3. Analysis of Representative Manuscripts per Topic

By tackling the posed research questions with our analysis of prior literature, firstly, we should rely on factors that may affect the energy consumption of buildings, such as the energy bills of the occupants of these buildings. Secondly, we should be specifically interested in intelligent computing models able to classify or predict the energy consumption in these buildings accurately. For example, paper S10 focuses solely on finding electricity consumption patterns in buildings, with an accuracy of 89% when predicting the level of consumption, by using K-means clustering. We believe it is necessary to rely on a model that classifies energy consumption with better accuracy and considers other factors that affect this phenomenon. Thirdly, we should seek to build an intelligent model to predict energy consumption efficiently. Papers S11 and S12 used multiple linear regression and multilayer perceptron, respectively, to address this prediction problem, for the case of electricity and natural gas consumption in buildings, also taking into account climate conditions, with an accuracy of 95%. Our conviction is that it is necessary to rely on a model that predicts energy consumption with even better accuracy.
As mentioned, our paper analyzes and discusses selected literature contributions following our research questions.

3.3.1. Analysis of Metrics, Data Sources, and Critical Factors

Our RQ1 drove us to look for metrics, data sources, and critical factors able to influence the energy consumption of buildings. Our review of papers S1 to S41 allowed us to extract such critical factors. In fact, terms such as “electricity,” “space heating,” and “climate” seem to be highly considered when studying the energy consumption in residential and public buildings, as shown in Figure 8. The major factors of energy consumption in different buildings are shown in Table A1 (see Appendix B). The electricity factor was used by 23% of papers, climate factor by 28%, space heating by 23%, space cooling by 13%, and finally, occupant behavior, by another 13%. By analyzing the factors that are used as inputs in research, we observed four points.
Firstly, the studies (S18, S28, S32, and S41) used the electricity factor as the only factor in the study, where S18 presented a study to classify consumer behavior depending on the electrical factor in public buildings. Additionally, S28 presented a framework for forecasting hourly energy consumption in residential buildings. In addition, S32 presented a model for forecasting energy consumption in residential buildings based on electricity billing data for the occupants of these buildings. Finally, S41 presented a method for classifying and predicting electricity consumption in residential buildings.
Secondly, S8 presented a study to reduce energy consumption in residential buildings. This study addresses the climate factor only and its impact on energy consumption. It also uses a statistical method to analyze data to help decision-makers in saving energy.
Thirdly, the studies S2, S14, and S22 relied on the consumer behavior in residential buildings as the only factor in the study.
Fourthly, S35 relied on the space heating factor for predicting ECB. Finally, the rest of the research relied on a hybrid of factors such as electricity, climate, space heating, space cooling, gas, and others to classify and predict energy consumption, whether in public or residential buildings.

3.3.2. Analysis of Clustering and Classification Techniques

When tackling RQ2, our analysis focused on the clustering and classification techniques of the energy consumption of buildings. To this end, we analyzed papers S11 to S20 and S34 to S41. We observed that K-means clustering seems to be the most popular technique when studying energy consumption in residential and public buildings, as shown in Figure 9. The major clustering and classification techniques in different buildings are shown in Table A2 (see Appendix B). K-means clustering was used by 76% of the papers, and hierarchical clustering by 24%. By analyzing the clustering techniques used in the various research, we observed four points, namely: firstly, the studies S11 and S13 relied on Ward’s method of hierarchical clustering to classify energy consumption data in households, where S11 presented a study to analyze the reduction of electricity consumption and improve the energy efficiency of households in the city of Evora, in southern Portugal. This analysis identified 10 clusters of energy consumption. Additionally, S13 presented a study to find the rationale of thermal comfort behaviors in Portuguese households by means of cooling and heating. This study aimed to define daily electricity consumption behavior profiles in households. It also classified families into two basic clusters (active and non-active). In addition, S12 presented a study that implemented data mining in smart meters to define users who are more responsible for the peak system by using consumption variability and a responsibility factor. This study also applied hierarchical clustering and a self-organizing map to find the more responsible consumers in the peak system.
Secondly, the studies S14, S15, S34, S37, and S40 relied on K-means clustering using “KMeans ++” to classify the energy consumption of buildings, where S14 presented a study to discover residential electricity consumption behaviors over time. It classified electricity consumption into four clusters. S15 presented a study to address electricity consumption factors, such as human activities and air conditioning use. Individual electricity consumption patterns were divided into six clusters, with an accuracy of 89.3%. S34 presented an approach to classify the cooling and heating energy efficiency of residential buildings. The cooling and heating energy were divided into five clusters with an accuracy of 87.8%. S37 presented an approach to classify energy consumption in residential buildings. It classified this into four levels (low, medium, high, and very high) with an accuracy of 85.9%. S40 presented a study to classify electricity consumption data into five levels (very low, low, medium, high, and very high) with an accuracy of 90.4%.
Thirdly, the studies S18 and S41 relied on optimization algorithms with K-mean clustering to classify electricity consumption data in residential buildings. Optimization algorithms were used to determine the initial centroid of K-means clustering, where S18 presented a framework of quadratic programming with K-means clustering to classify occupant behavior-based electricity load patterns in buildings. The results confirmed that there are 10 different clusters in electricity consumption with an accuracy of 83.8%. S41 presented an approach to classify occupant behaviors electricity consumption in buildings. Occupant behaviors were characterized into nine different clusters found in the data. Their study found an accuracy of the genetic algorithm with K-means clustering when classifying occupant behaviors in buildings of 89.7%.
Fourthly, the studies S16, S17, S19, and S20 relied on K-means clustering and other intelligent techniques, where S16 compared two AI techniques (K-means clustering and hierarchal clustering) in the classification of energy consumption in residential buildings. This study relied on smart meter data to show the energy consumption behaviors of occupants. This study suggests that hierarchal clustering outperforms K-means clustering in terms of accuracy, with a figure of 92.8% versus 90.3%, respectively. S17 presented an approach to classify patterns of occupant behaviors in residential buildings. This study relied on two main variables (window opening and indoor temperature) and used two intelligent techniques, namely, time series and K-means clustering. The study confirmed that K-means clustering is better than time series in terms of accuracy, with a figure of 90.20% versus 87.70%, respectively. S19 presented an approach to classify occupant behaviors consumption in residential buildings to determine their energy consumption. This study relied on several factors, such as space heating, refrigeration, and air-conditioning, to reveal the envisaged energy consumption classification. Their approach combined K-means clustering and demographic-based probability neural networks and found 10 different behavior consumption patterns of occupants of residential buildings. The Mean Square Error, MSE, achieved with K-means clustering was 0.09. S20 presented a technique to classify and analyze the ECB based on smart meter electricity data. This study showed how to improve the performance of K-means clustering via time series analysis and wavelets. The proposed approach found 12 different clusters of electricity consumption and achieved MSE in K-means clustering of 0.18.

3.3.3. Analysis of Prediction Techniques

While addressing RQ3, we looked for techniques applicable in predicting the energy consumption of buildings. With this aim, we analyzed papers S21 to S41. We observed that techniques such as neural networks, regression models, and support vector machines are the most adopted, as shown in Figure 10. The major prediction techniques in different buildings are shown in Table A3 (See Appendix B). Neural networks were adopted by 35% of the analyzed papers, whereas support vector machine and regression models were chosen in 22% of papers. Deep neural networks accounted for 17% of the reviewed papers, and the remaining 4% corresponded to the random forest technique. By analyzing the intelligent prediction techniques used in the research, we observed five points, namely: firstly, the studies (S34 and 37) relied on the neural network technique to predict energy consumption in residential buildings, where S34 presented an approach (backpropagation neural network) to predict energy efficiency based on space heating and space cooling with an accuracy of 85.4%. Additionally, S37 presented an approach (feedforward neural network) to predict total energy consumption with an accuracy of 89.2%.
Secondly, the studies S23, S28, and S41 relied on neural networks and other intelligent techniques, where S23 presented a model to predict energy consumption in different types of buildings such as residential, commercial, government, or educational. Their model relied on two machine learning techniques, particularly artificial neural networks and support vector machines. The accuracy in neural networks and support vector machines was 90.1% and 85.4%, respectively. Thus, the authors claim that neural networks are better than support vector machines in terms of accuracy. Additionally, S28 presented a framework to predict the hourly electrical consumption in residential buildings. This study relied on sensor data collected from three residential homes. Machine learning techniques, such as regression models, feed forward neural networks, and support vector regressions, were used. The authors found that feed forward neural networks outperformed the other techniques in terms of Mean Absolute Percentage of Error (MAPE). In fact, achieved MAPE figures were 13.41%, 9.14%, and 9.63%, respectively, in regression, feed forward neural networks, and support vector regression. Finally, S41 presented an approach to predict occupant behaviors of electricity consumption by using a backpropagation neural network and support vector regression. The accuracy of forecasting electricity load patterns of occupant behaviors in those techniques reached 47.02% and 57.14, respectively, highlighting the superiority of support vector regression compared to backpropagation neural networks for this kind of problem.
Thirdly, the studies S21, S26, S29, and S30 relied on regression models to predict energy consumption in different buildings, where S21 presented an approach to predict the future energy consumption of a supermarket in the UK by using multiple linear regression. The regression equation can interpret about 95.00% of the electricity demand and 86% of the gas use. Additionally, S26 presented a model to predict energy consumption in manufacturing companies. Their study relied on different parameters such as mean outdoor temperature and electricity data. Their approach used multiple linear regression for predicting energy consumption in different temperatures. Their results show that the Adjusted R Square is 0.96. In addition, S29 introduced a statistical approach to forecast total energy consumption in industrial, commercial, domestic, and public buildings. Their study included various factors, such as gross domestic production (GDP), population figures, and GDP per capita. The authors tried a simple regression model and multiple linear regression. By computing an Adjusted R Square, their results show that multiple linear regression (0.991) is better than simple regression model (0.844) in terms of Adjusted R Square. Finally, S30 presented a statistical analysis to evaluate the heating energy consumption of rural buildings. This study addressed many factors, such as basic family information. They approach the problem with multiple linear regression and logistic regression. The results of Adjusted R Square in logistic regression (0.458) and multiple linear regression (0.471) show that multiple linear regression outperforms logistic regression.
Fourthly, the studies S32 and S40 relied on support vector machines to predict electricity consumption in residential buildings, where the accuracy of the proposed model in S32 and S40 is 95% and 97.4%, respectively.
Fifthly, the studies S24 and S27 relied on deep neural networks to predict energy consumption in different buildings, where S24 presented a new model to predict energy consumption in residential buildings by using a convolutional neural network (CNN) and long short-term memory (LSTM). The MSE in linear regression, LSTM, and CNN-LSTM, were 0.40, 0.74, and 0.37, respectively. Thus, CNN-LSTM is better than linear regression and LSTM in terms of MSE. Finally, S27 estimated the ECB as a factor of space heating and cooling, class of the energy consumer, and the average of customer consumption. Their CNN reached an absolute error and a relative error, in their estimates, of 31.83 kWh and 17.29%, respectively.

3.3.4. Analysis of Techniques Combining Classification and Prediction

While answering our RQ4, we searched for combination techniques applicable in predicting and classifying the energy consumption of buildings. With this goal, we analyzed papers S34 to S41 and observed that neural networks with K-means clustering seem to be the most prominent combination, as shown in Figure 11. The major combinations of prediction and classification techniques in different buildings are shown in Table A4 (see Appendix B). By analyzing the combination of intelligent prediction and classification techniques used in the research, we observed three points, namely: firstly, the studies S35 and S38 relied on a hybrid model of K-means clustering with neural networks to estimate energy consumption in different buildings, where S35 presented an approach to predict heating energy consumption. This approach combines radial basis neural networks and K-means clustering to estimate the energy efficiency of buildings. K-means clustering is used to establish subsets to train individual radial basis function neural networks to improve prediction accuracy. S38 presented an approach to improve energy efficiency in Croatian public buildings. Much like S37, this paper also proposes K-means clustering and a backpropagation neural network to tackle this topic. It also tried to investigate whether K-means clustering enhances the accuracy of a backpropagation neural network prediction. However, their results suggest that K-means clustering, when mixed with backpropagation, has not increased the prediction accuracy of this approach since the backpropagation technique alone achieved 90.1% of accuracy, which compares to 90.4% when combining the two techniques.
Secondly, paper S39 presented an intelligent technique to predict residential load patterns of energy based on socio-economic factors. Moreover, this study used K-means clustering to analyze load patterns and used an entropy-based feature selection method to identify the socio-economic characteristics that impact consumers’ energy load patterns. The paper also used a deep neural network to predict the residential load pattern. The proposed technique of this study achieved an MSE of 0.12.
Thirdly, paper S36 presented a hybrid approach to classify and predict energy consumption in residential buildings. This approach consists of two AI techniques, namely, backpropagation neural networks and decision trees. A decision tree is used to classify energy consumption levels, whereas a backpropagation neural network predicts energy consumption in residential buildings. The accuracy in the decision tree and backpropagation neural network is 83.6% and 91.2%, respectively. Finally, the studies S34, S37, S40, and S41 were covered in response to the second and third questions.

3.3.5. Analysis of Performance Evaluation Metrics

Our literature study also analyzed a variety of performance evaluation metrics in the scope of our RQ5. Results are depicted in Figure 12. In total, 12% of the selected papers (papers S34, 35, 36, 37, and 38) adopted accuracy and precision and recall (ACC&PRE&REC). A total of 22% of them (S15, 16, 17, 18, S21, 22, S32 and S40, 41), selected only ACC. MSE was used by 15% of the analyzed papers (S19, 20, S24, 25, S28, and S39). Only 2% used ACC&MSE (just paper S7). Finally, 10% of the papers adopted the Adjusted R Square measure (papers S26, 29, 30, 33). We also realized that 39% (16 papers: S1 to S14, S23, and S31) did not use any defined evaluation metric.

4. Discussion

This section discusses two important topics: our research questions and some research gaps that we could identify.

4.1. Research Question Discussion

Our systematic review aimed to answer five basic questions targeting the application of intelligent techniques in the field of energy consumption in different building sectors.
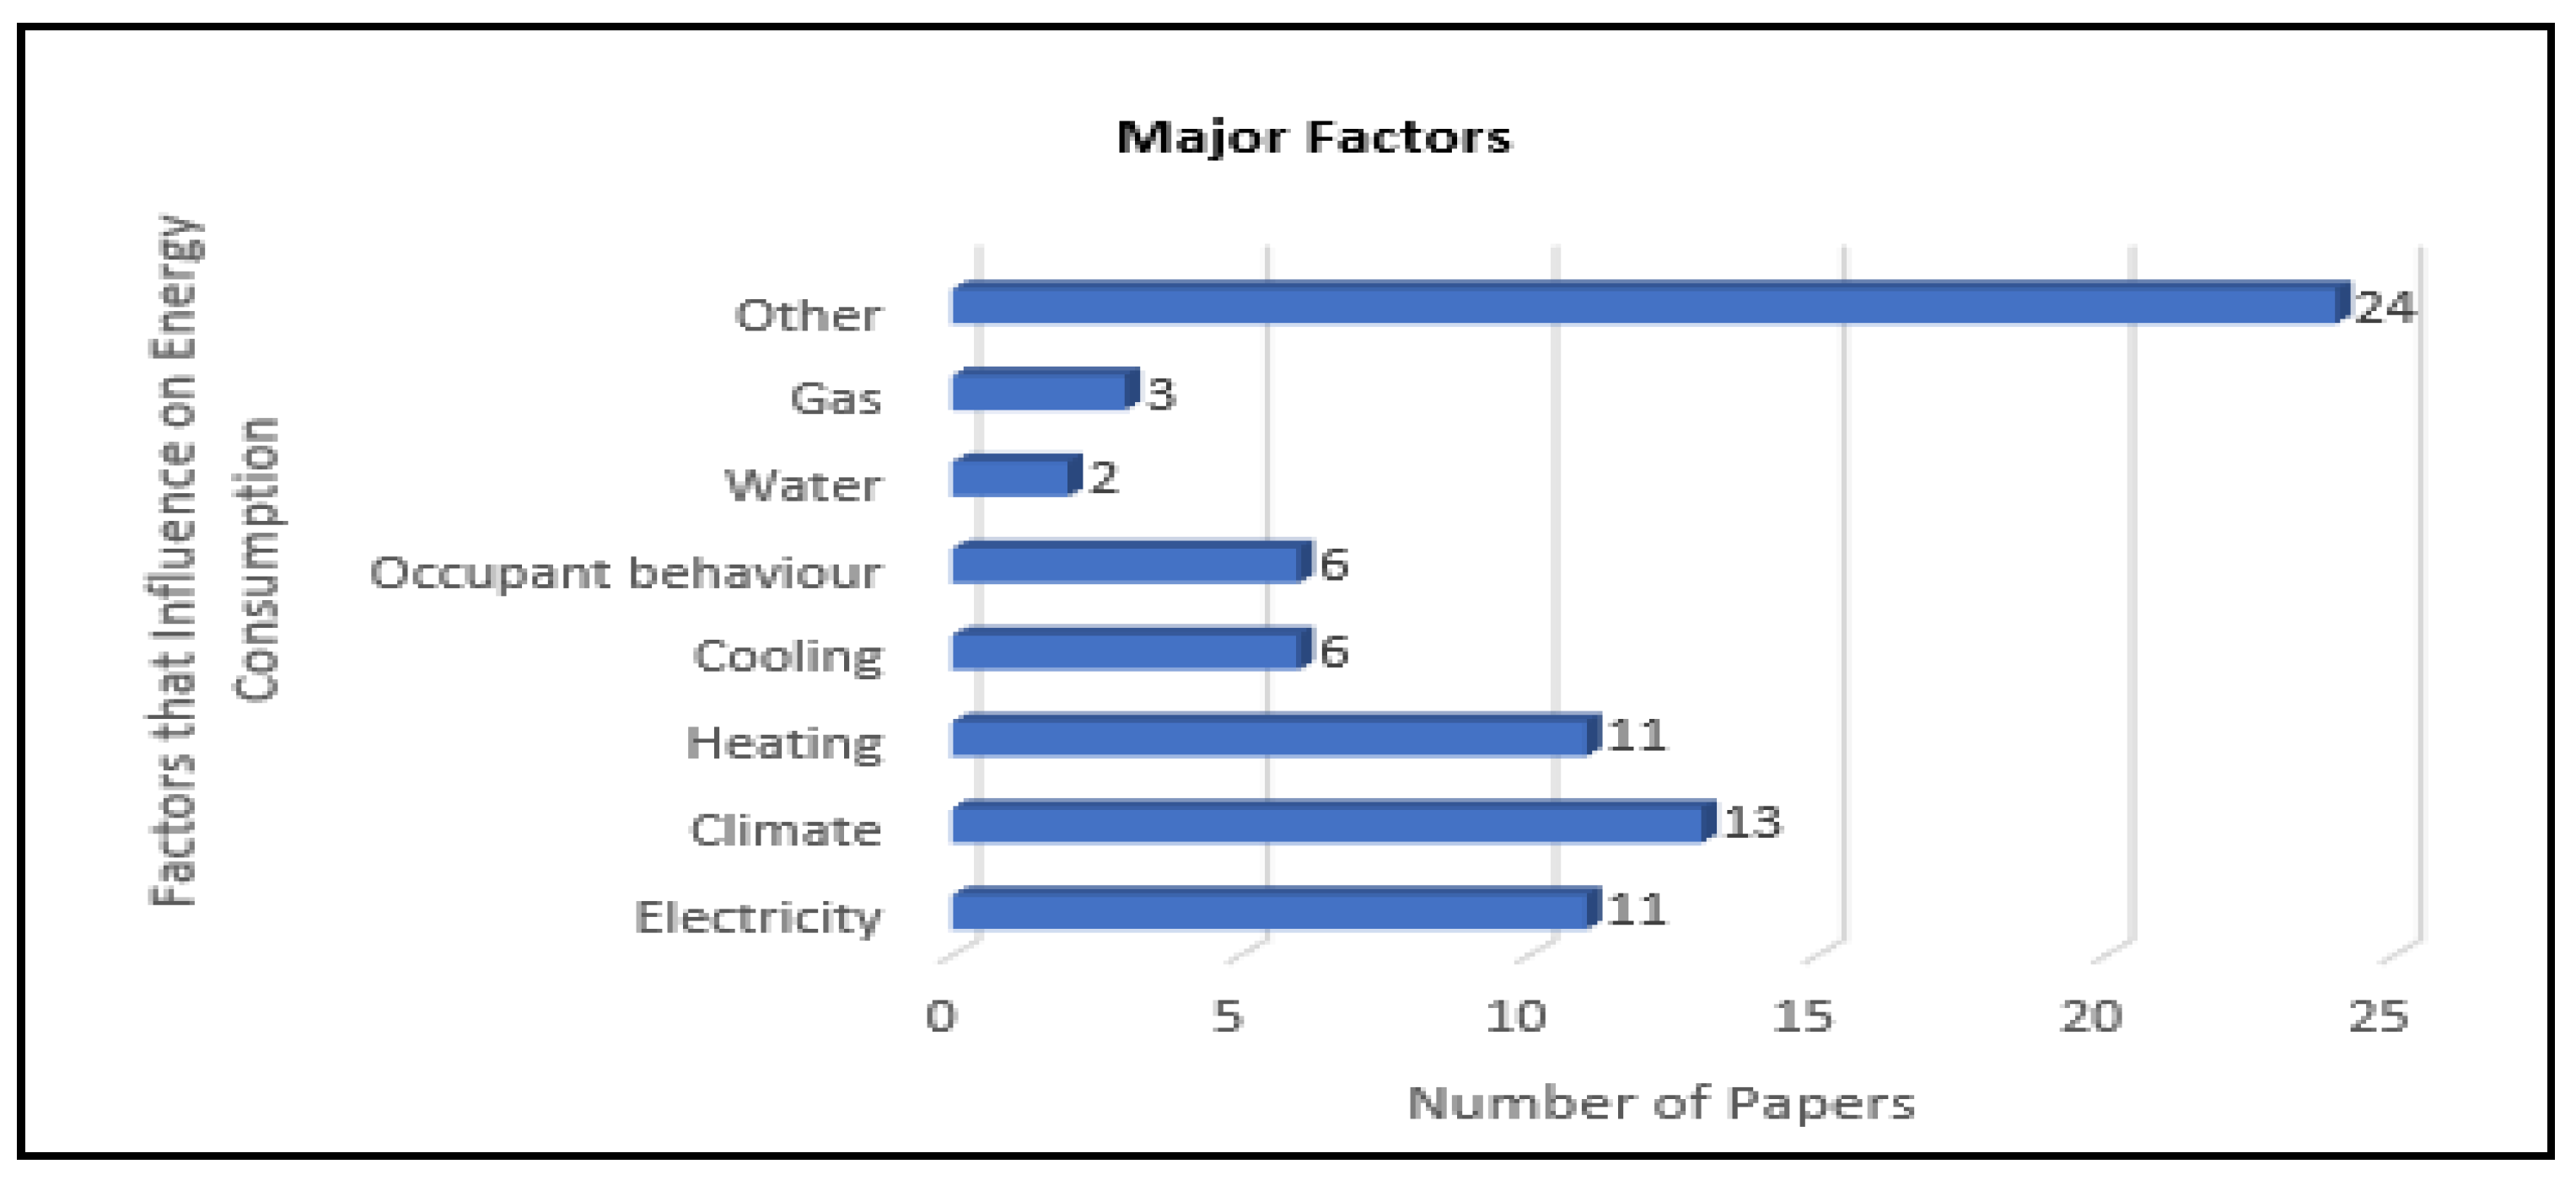
Focusing on our RQ1, we can highlight the main results obtained with our detailed analysis. In fact, the terms “electricity,” “heating,” and “climate” seem to be the most relevant when studying the energy consumption of buildings. We also observed a similarity between such results, based on a 41-paper analysis, and the text mining results, which took into consideration 106 papers. In our text mining approach, we calculated TITs for the terms “electricity” and “heating,” giving 0.1 and 0.07, respectively, thus showing their high relevancy. Nonetheless, there is a noticeable difference regarding the analysis of the term “climate.” From our detailed analysis of 41 papers, we found “climate” to be relevant. However, from our text mining results, the TITs value for “climate,” was 0.02, thus, showing that the “climate factor” has a lower relevance. Finally, we observed that “other factors” (“others” in Figure 12), including “socio-economic,” “geospatial,” and “building characteristics,” along with “electricity,” “heating,” “cooling,” “occupant behavior,” “gas,” and “climate” are relevant when tackling energy consumption of buildings, as shown in 
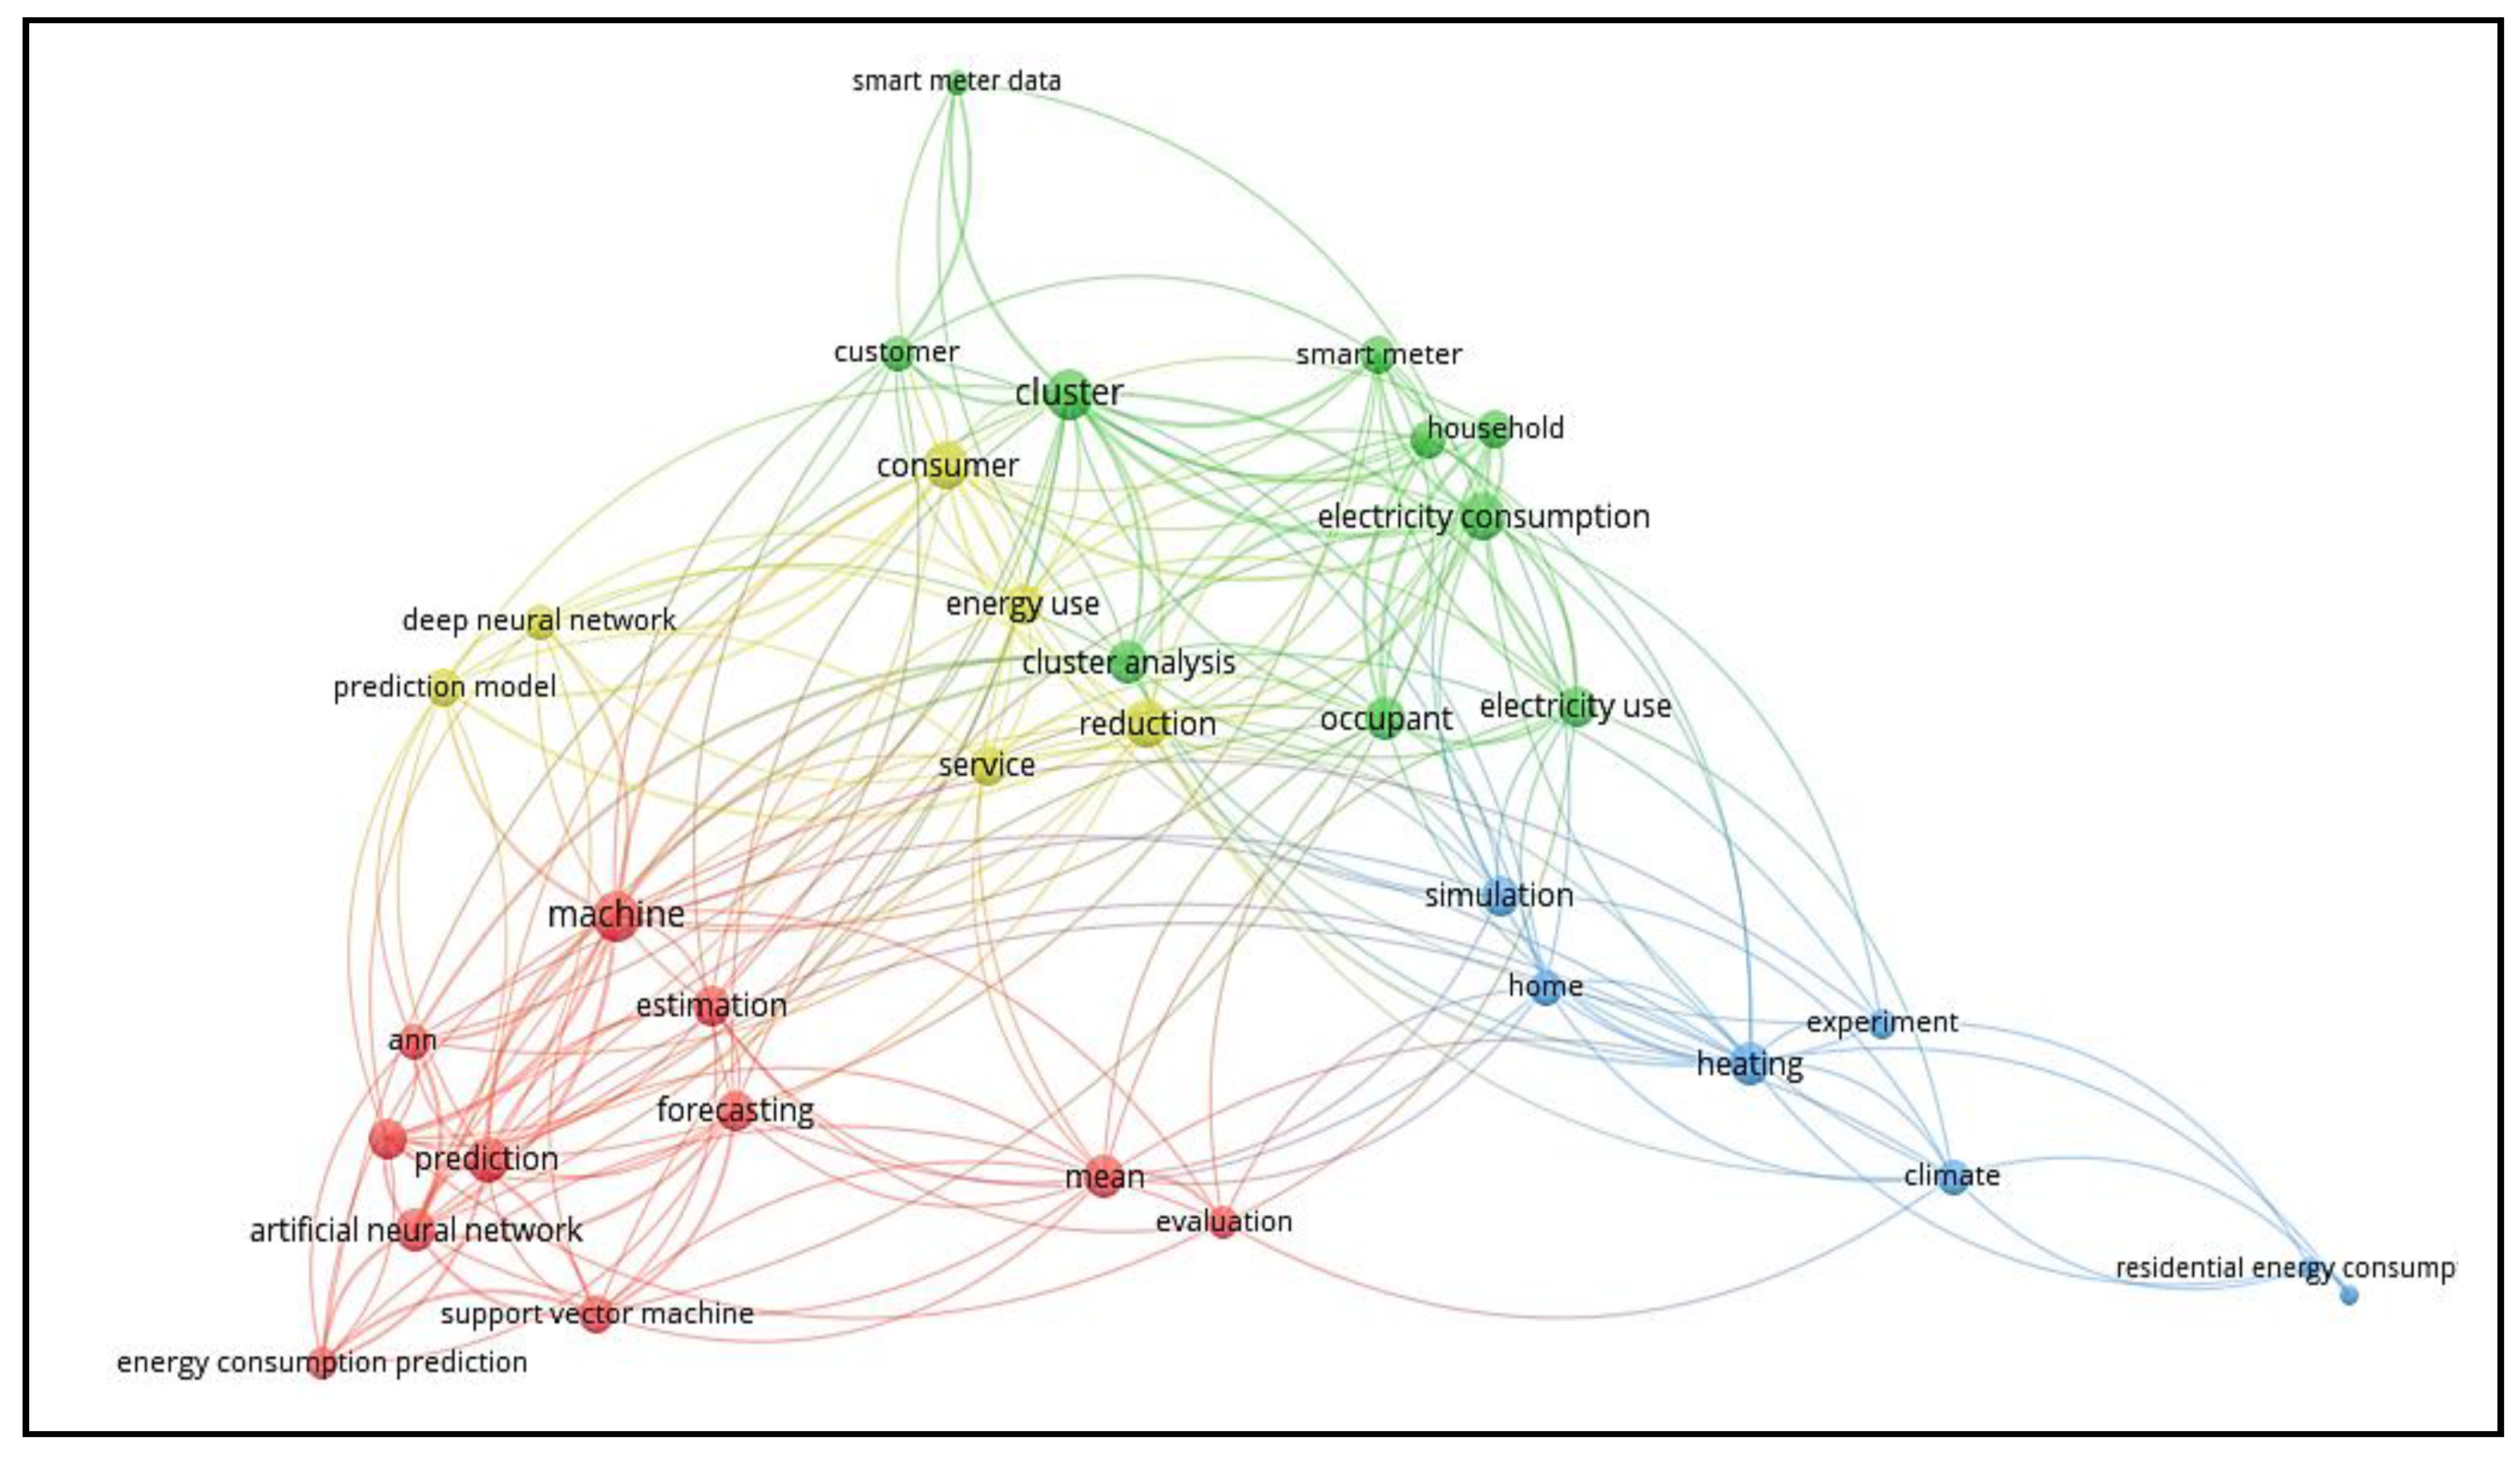
Figure 13. In the bibliometric map, we observed that there is a great relationship between “Residential Energy Consumption” with “Electricity Consumption,” “Heating,” and “Climate” (see in Figure 7).
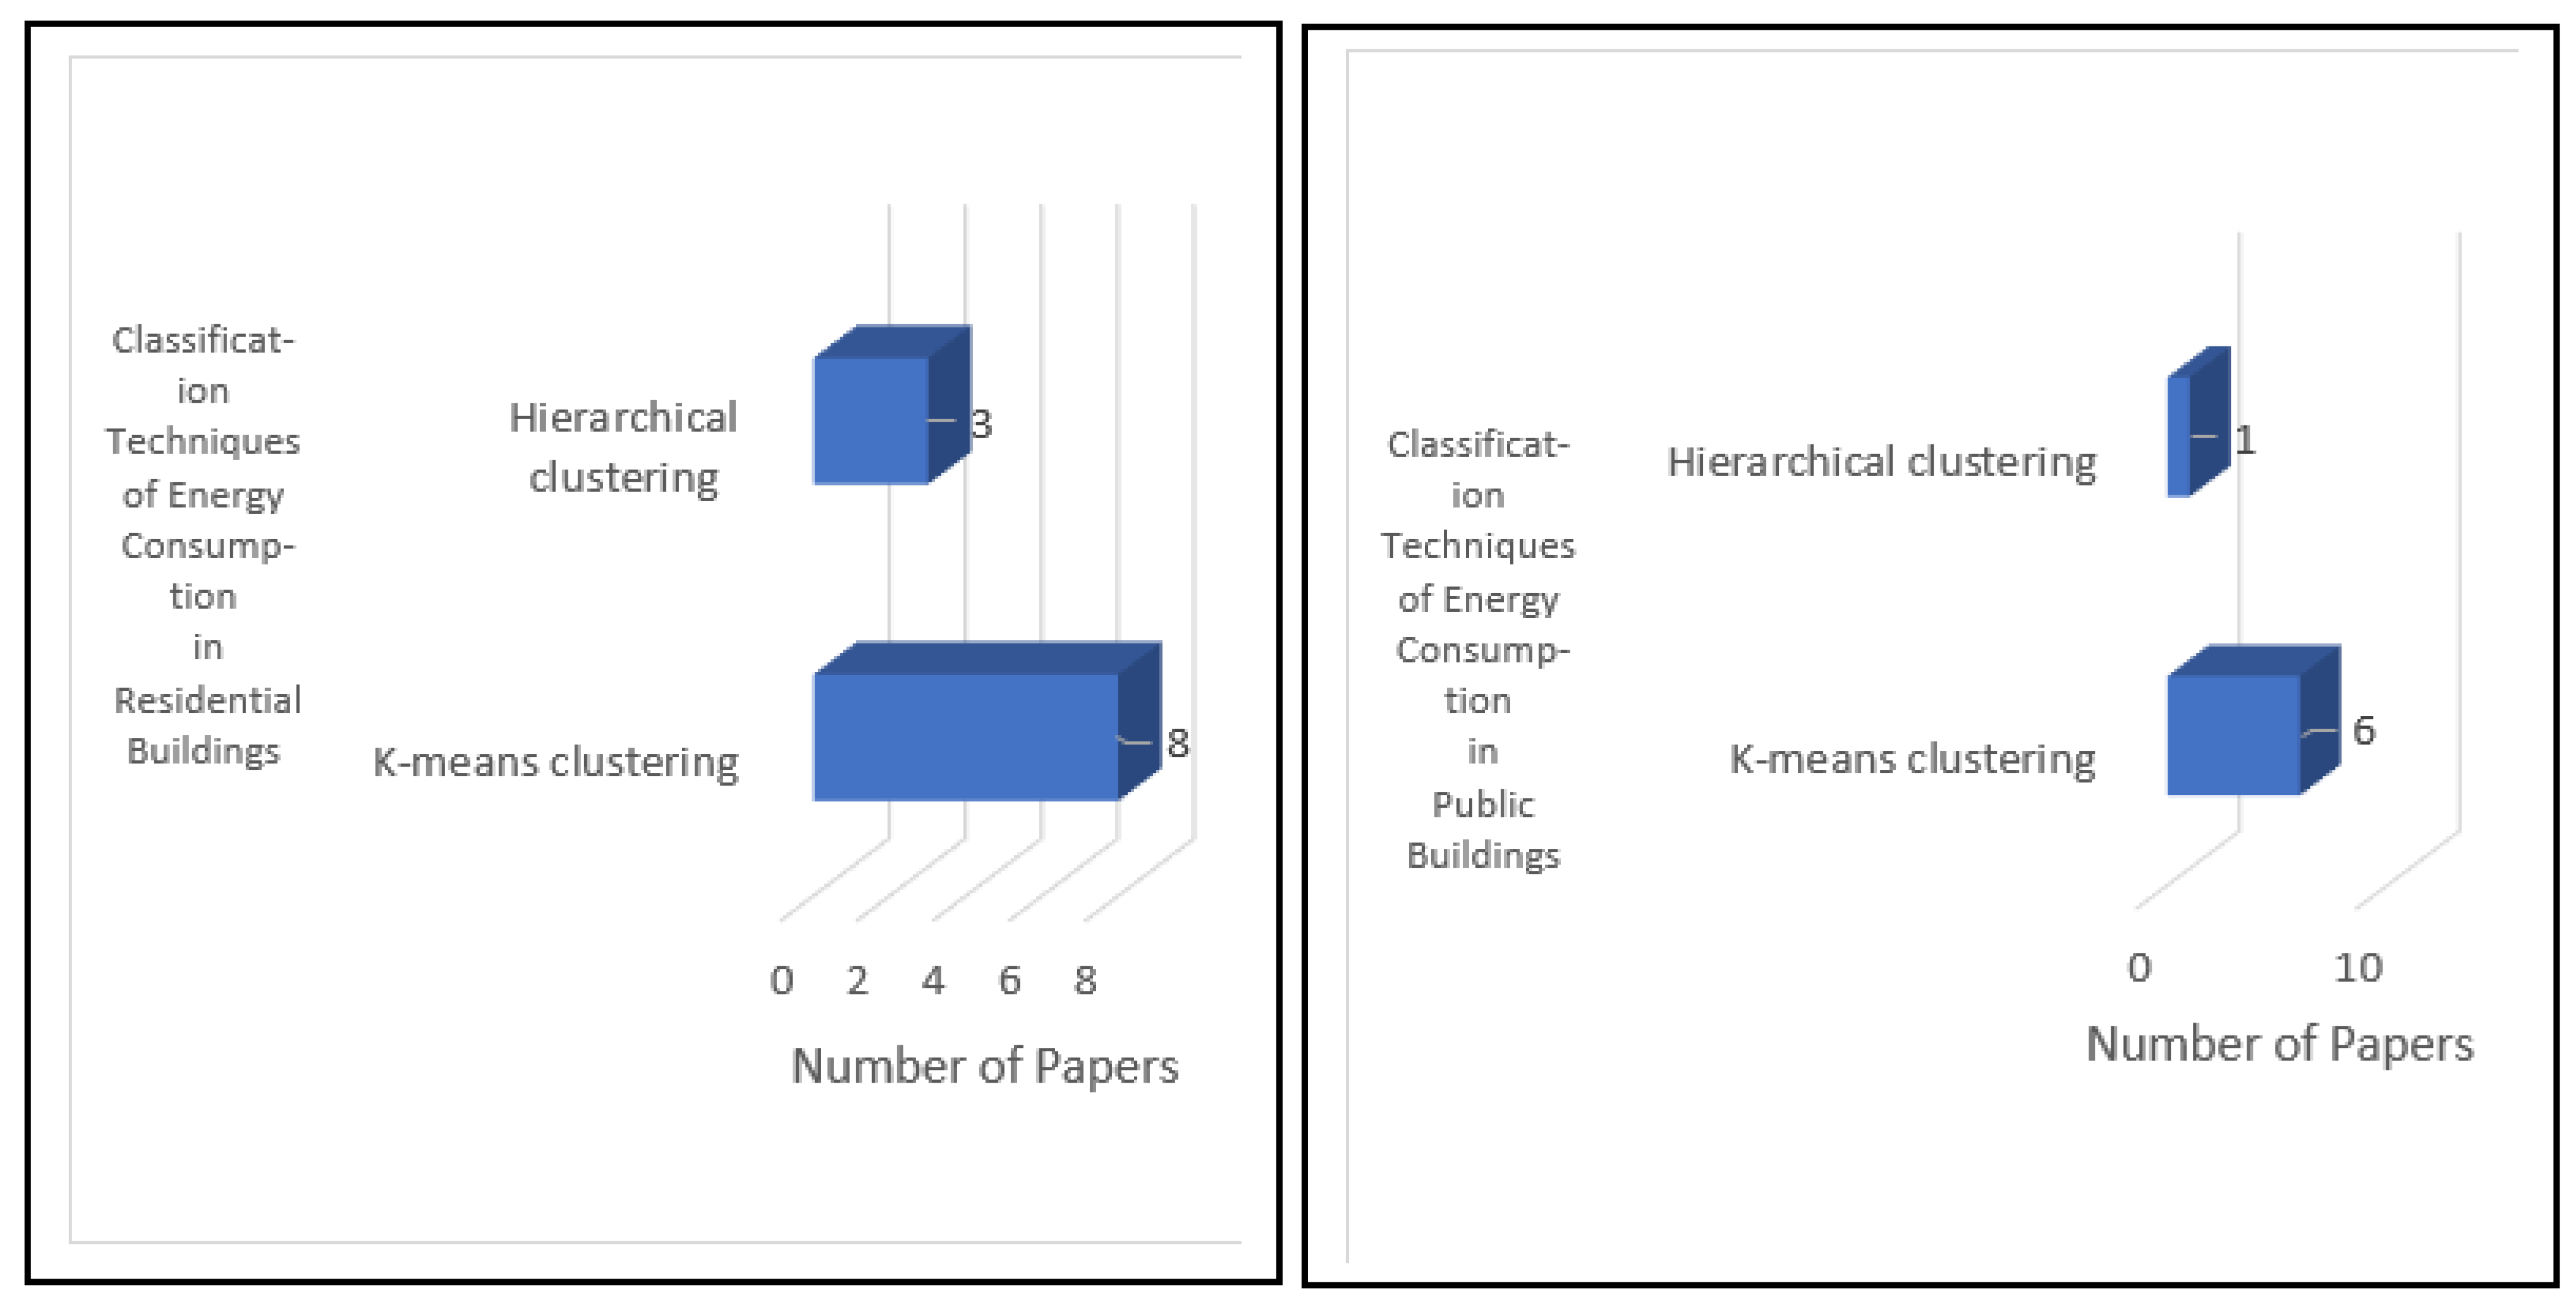
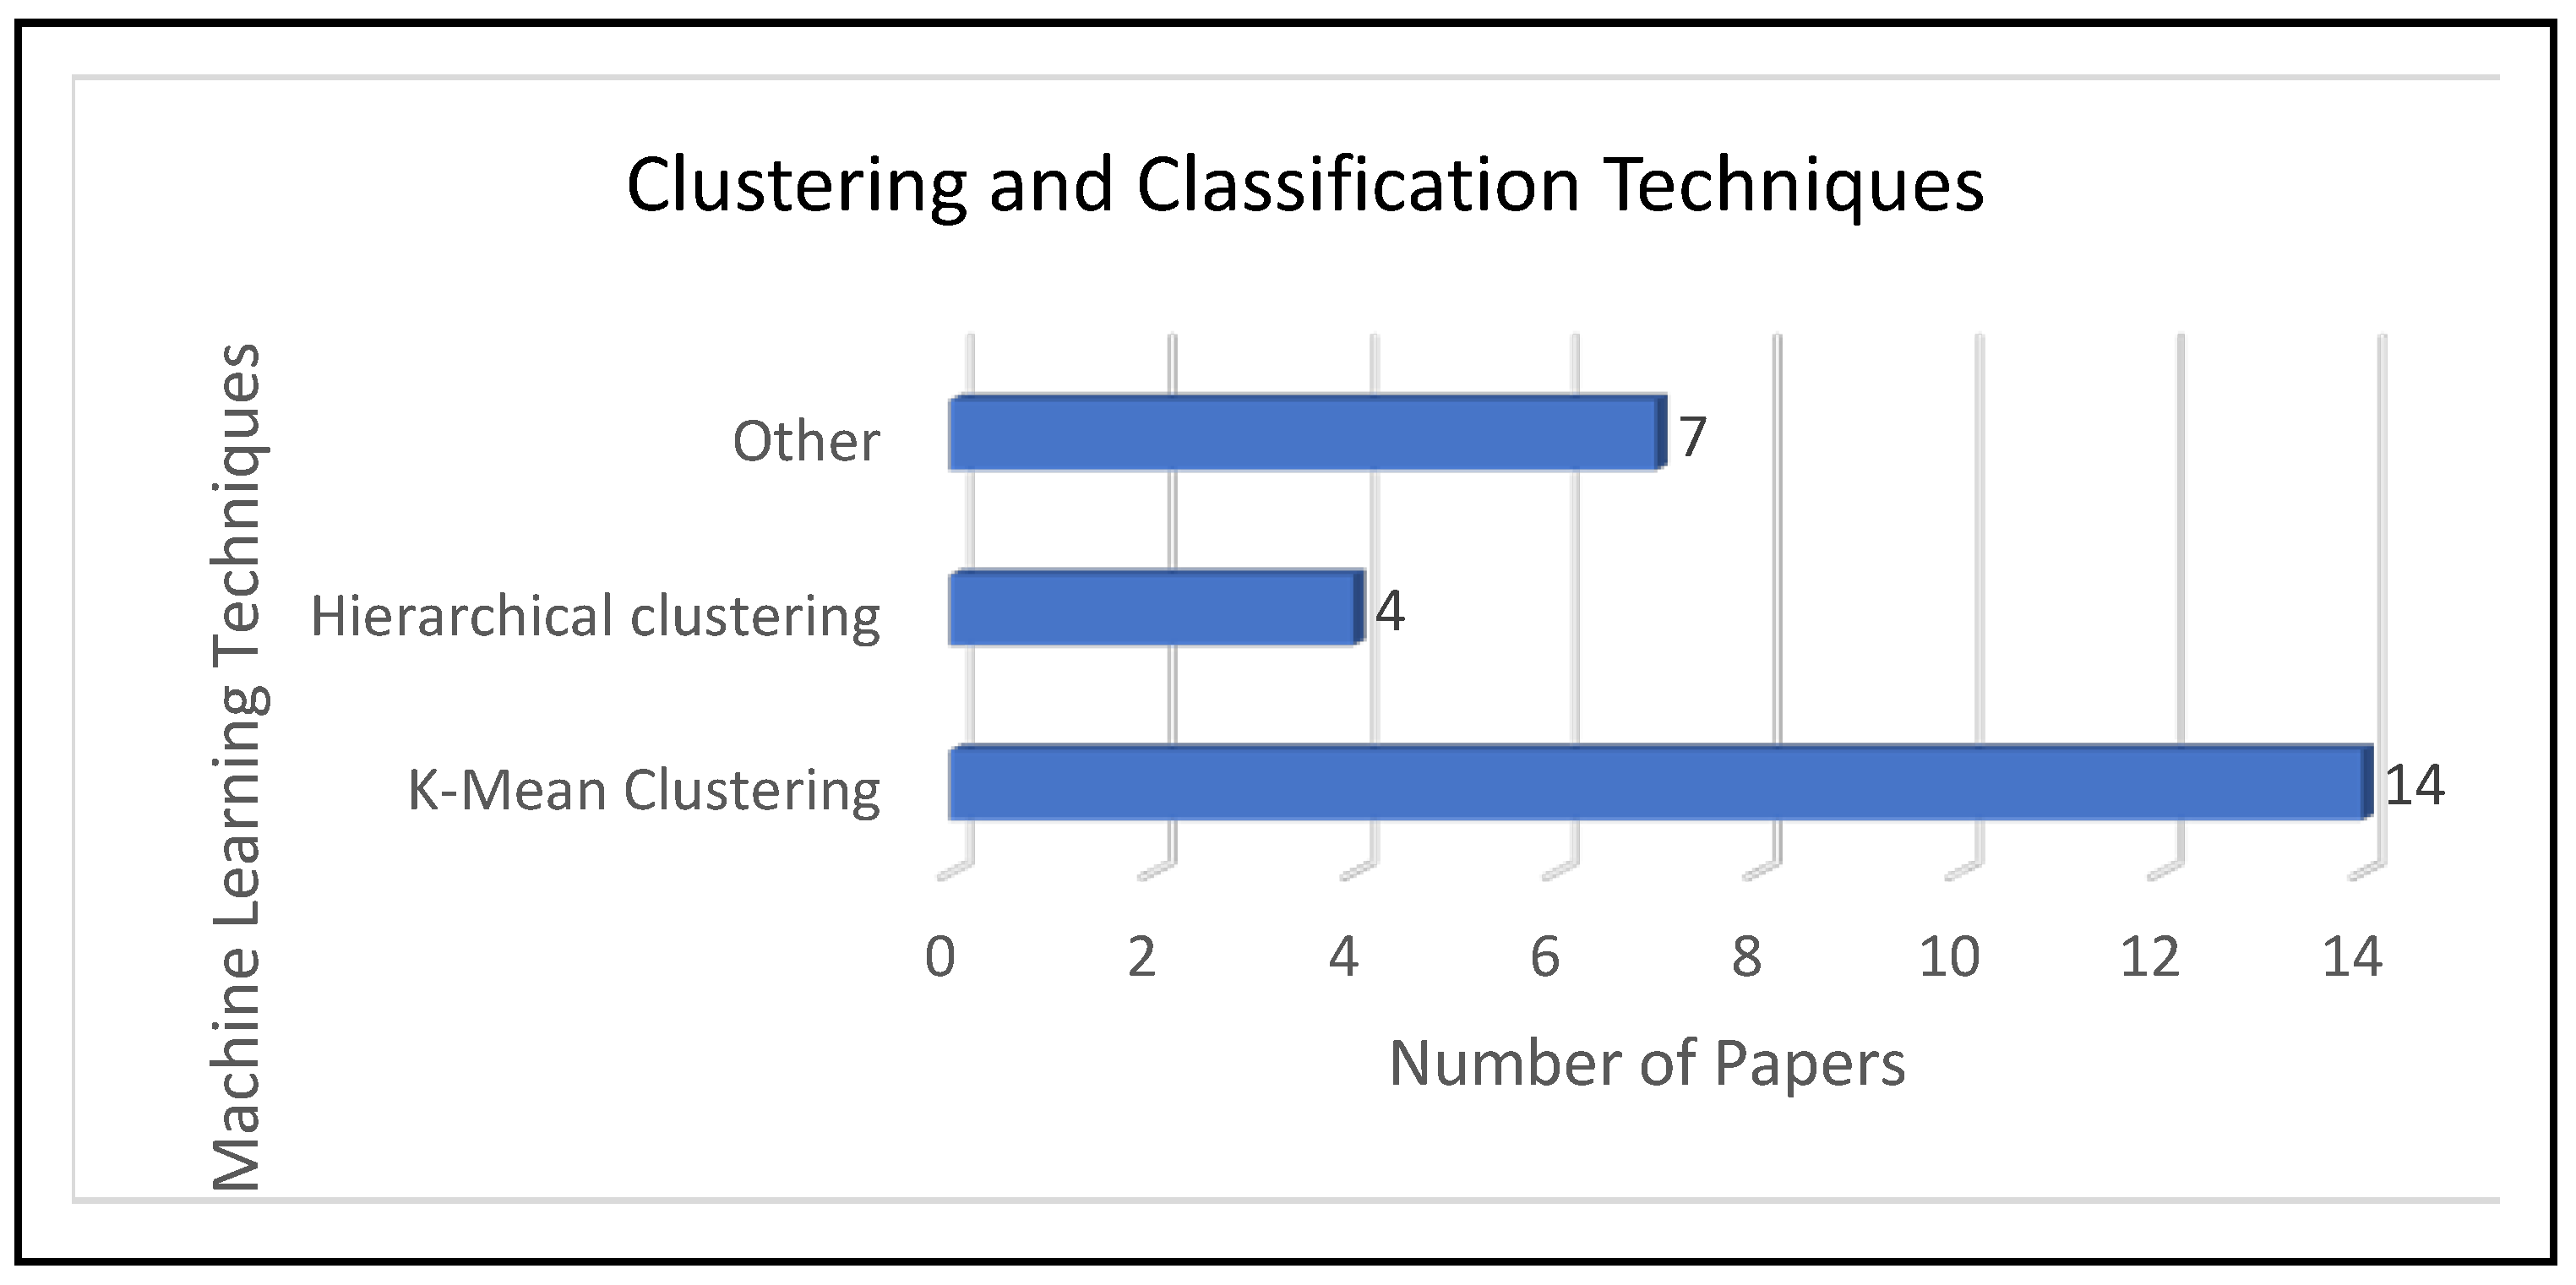
Regarding RQ2, and by examining papers S11 to S20 and S34 to S41, we can conclude that the term “cluster” is important when applying machine learning techniques to the ECB. We observed a relationship between this result and the conclusions drawn from text mining. In fact, TITs for the “cluster” term was 0.1, which shows that this term is highly relevant. However, in our graph of Figure 14, the “cluster” term is further divided into two terms, which are “K-means clustering” and “hierarchical clustering.” By analyzing the mentioned papers, “K-means clustering” was used 3.5 times more than “hierarchical clustering,” as shown in Figure 13. In the bibliometric map, we observed that there is a significant relationship between “Cluster” with “Electricity Consumption,” “Energy consumption prediction,” and “Residential Energy Consumption” (see in Figure 7).
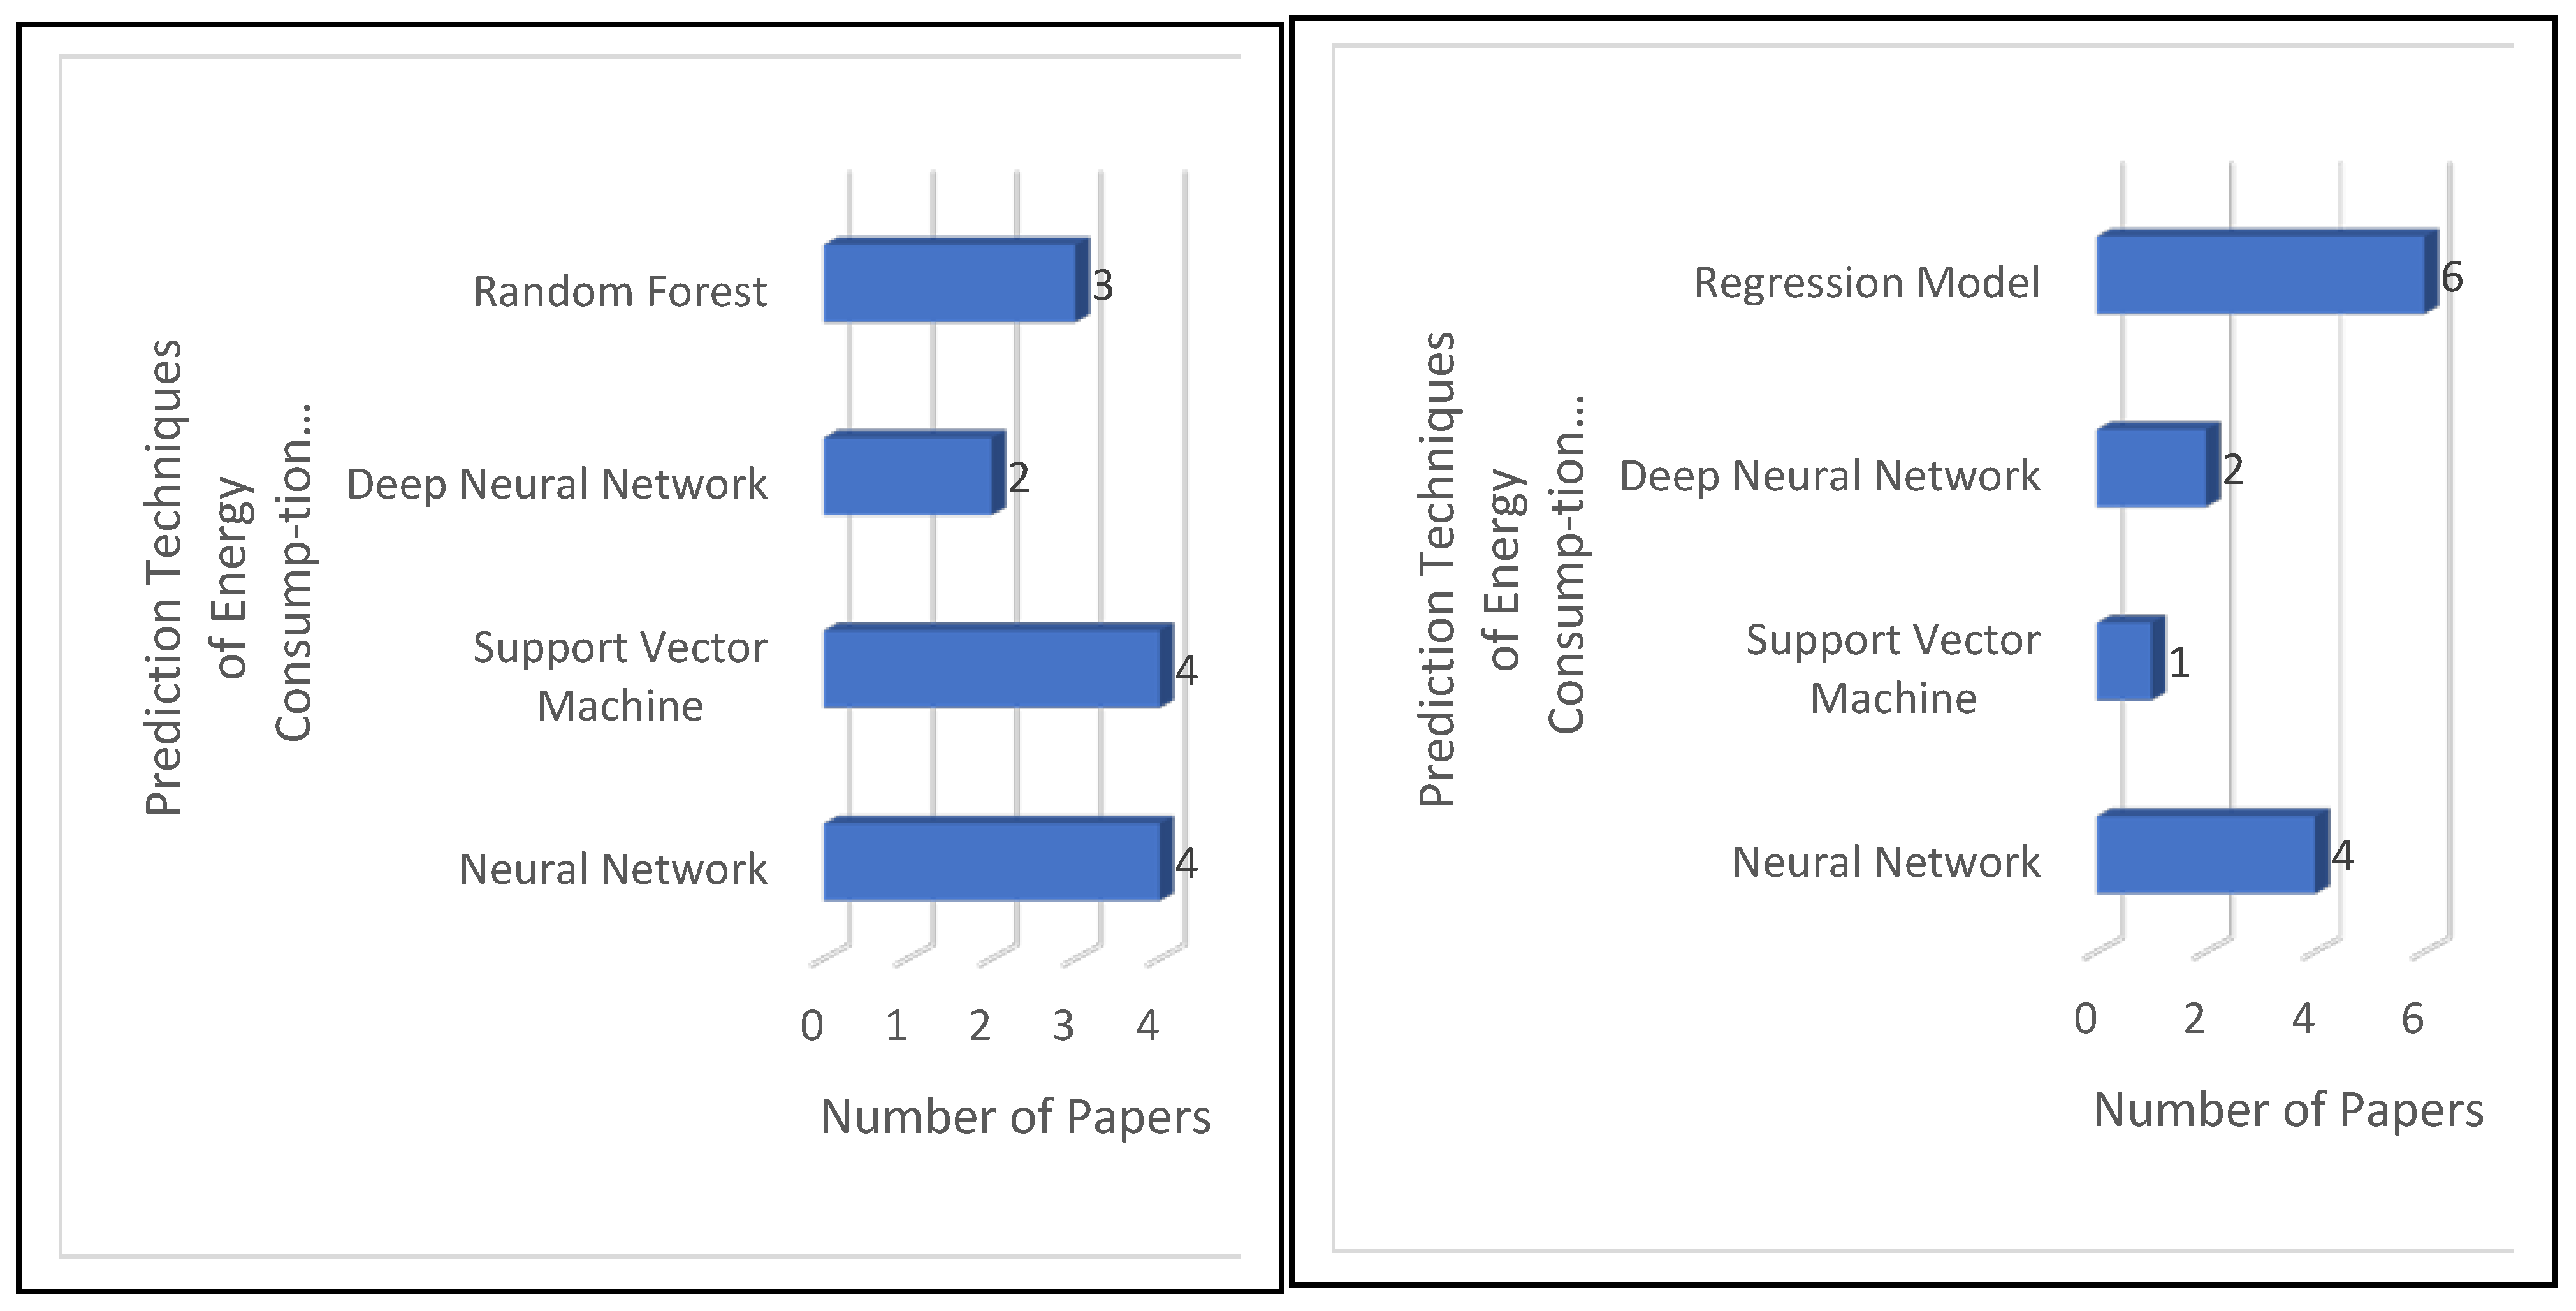
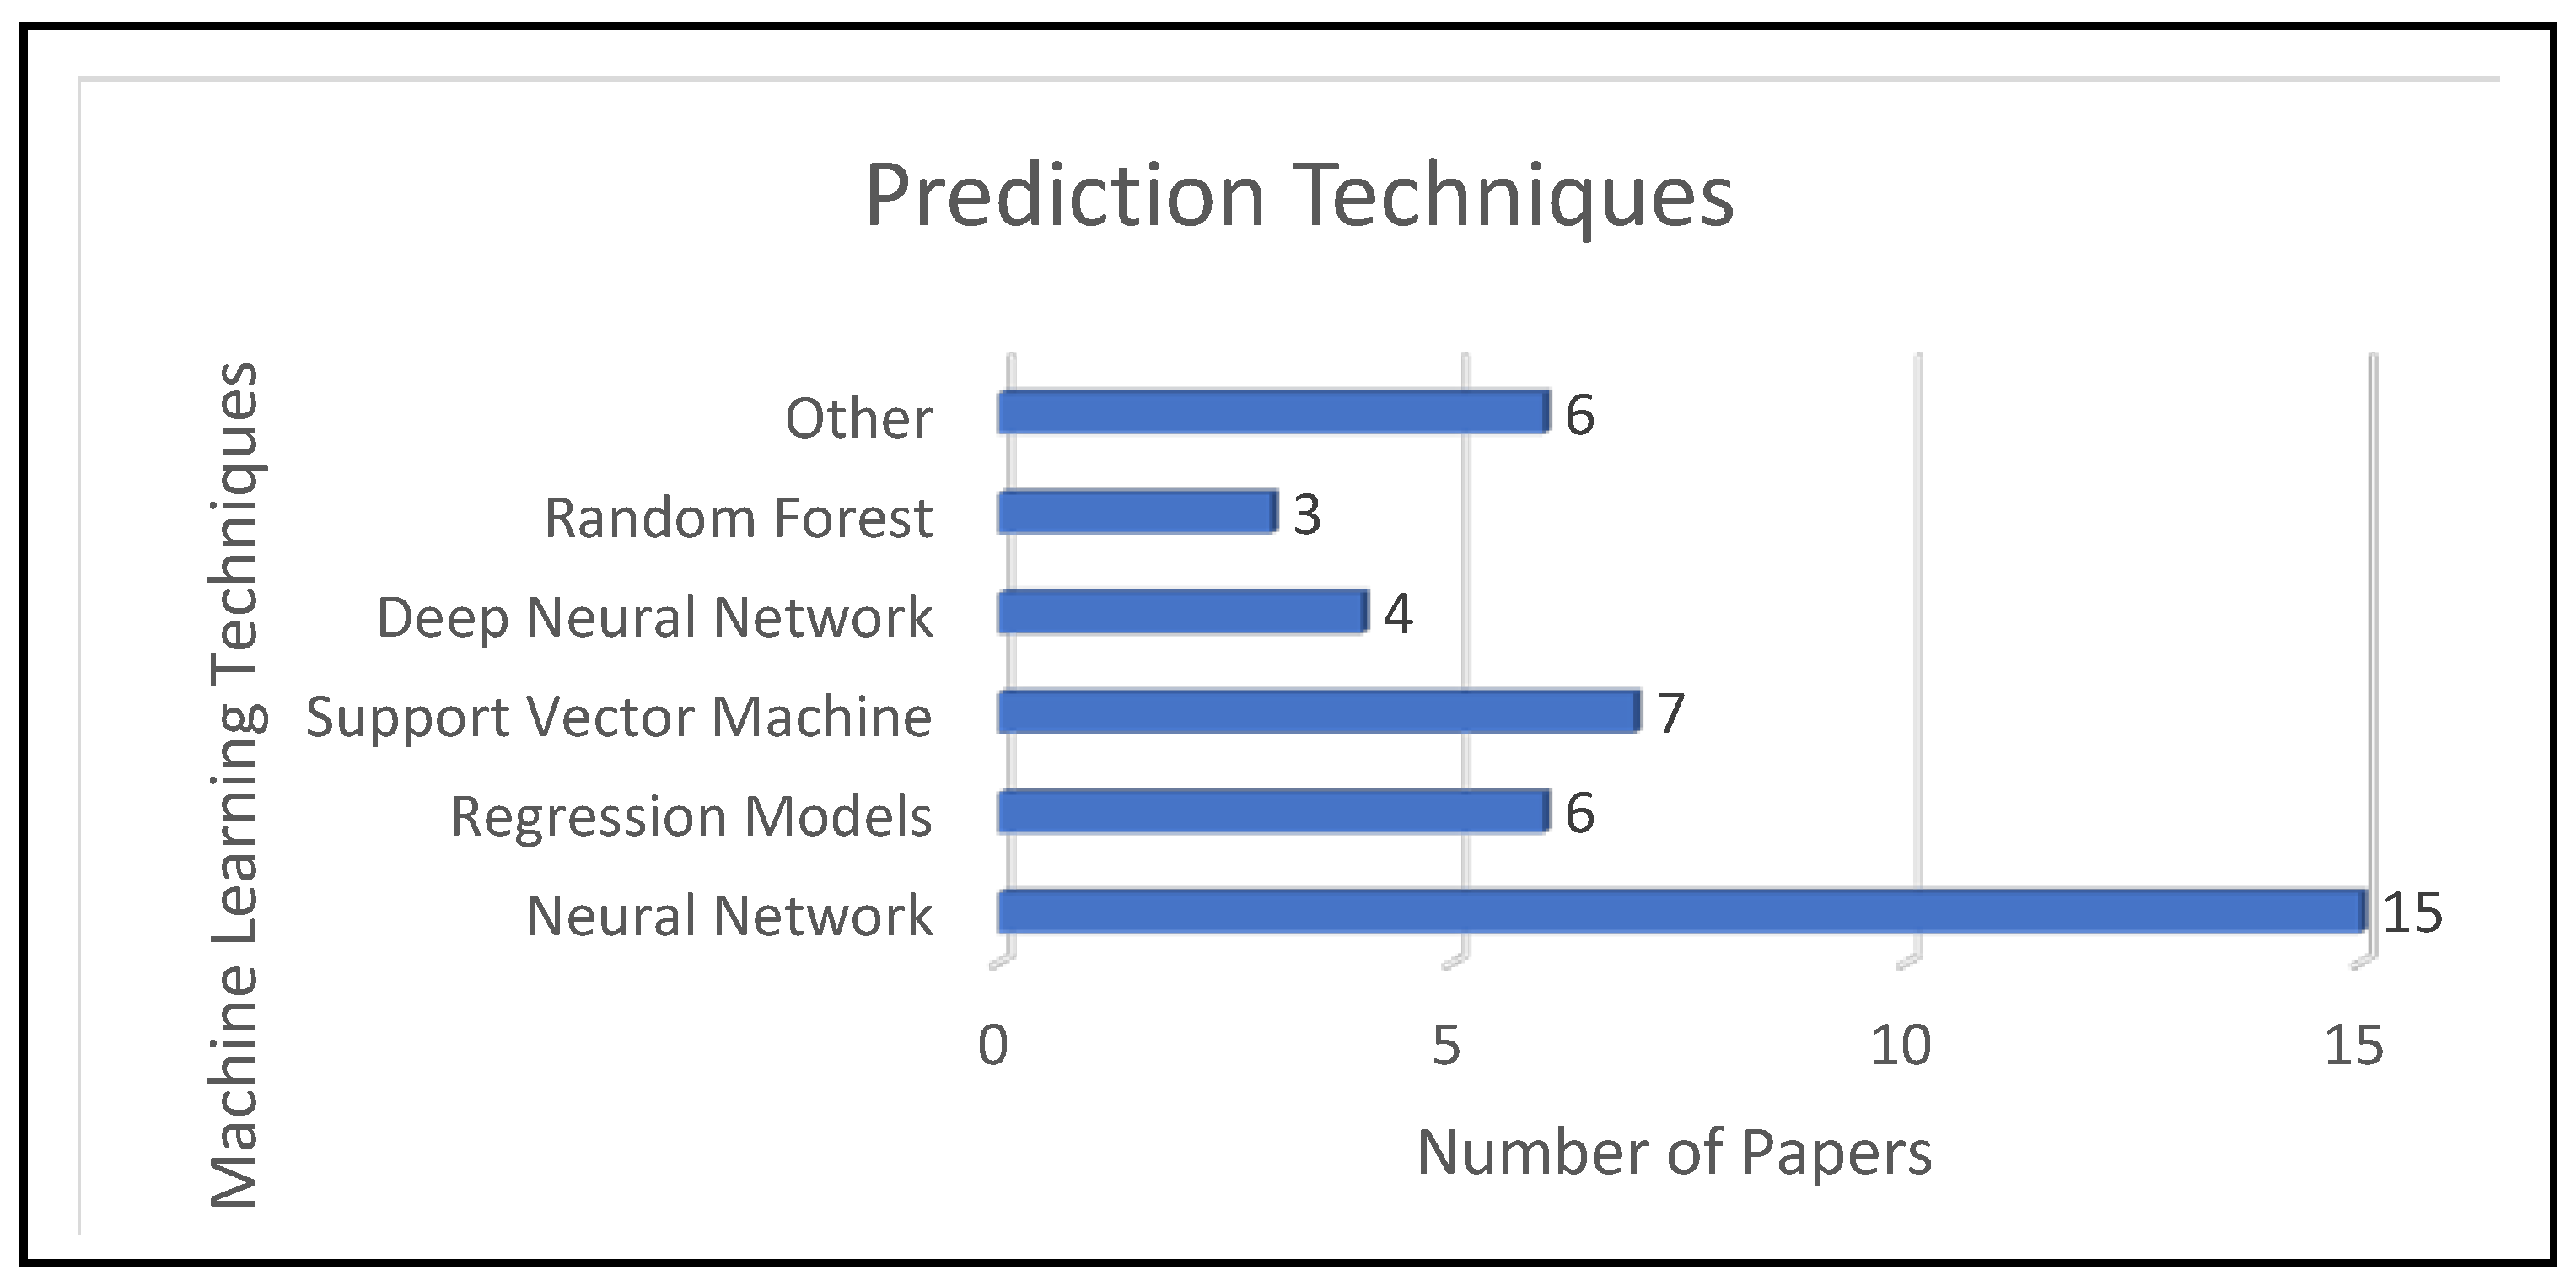
For RQ3, our analysis of papers S21 to S41 showed that the terms “backpropagation,” “feedforward neural network,” and regression models such as “multiple linear regression” and “support vector machine” are the more relevant. Much like our analysis of RQ2, we observed a similarity between such results and the conclusions of text mining. The TITs for terms “neural” and “regression” were 0.06 and 0.05, respectively. Thus, the terms “neural” and “regression” are relevant too. In papers S21 to S41, the neural network technique was used 2.5 times more than regression techniques and 2.143 more times than support vector machines, as shown in Figure 15. In the bibliometric map, we observed that there is a significant relationship between “Neural Network” and “Deep Neural Network” with “Energy use,” “Energy consumption prediction,” and “Prediction Model.” In addition, there is a relationship between “Support Vector Machine” with “Energy consumption prediction” (see in Figure 7).
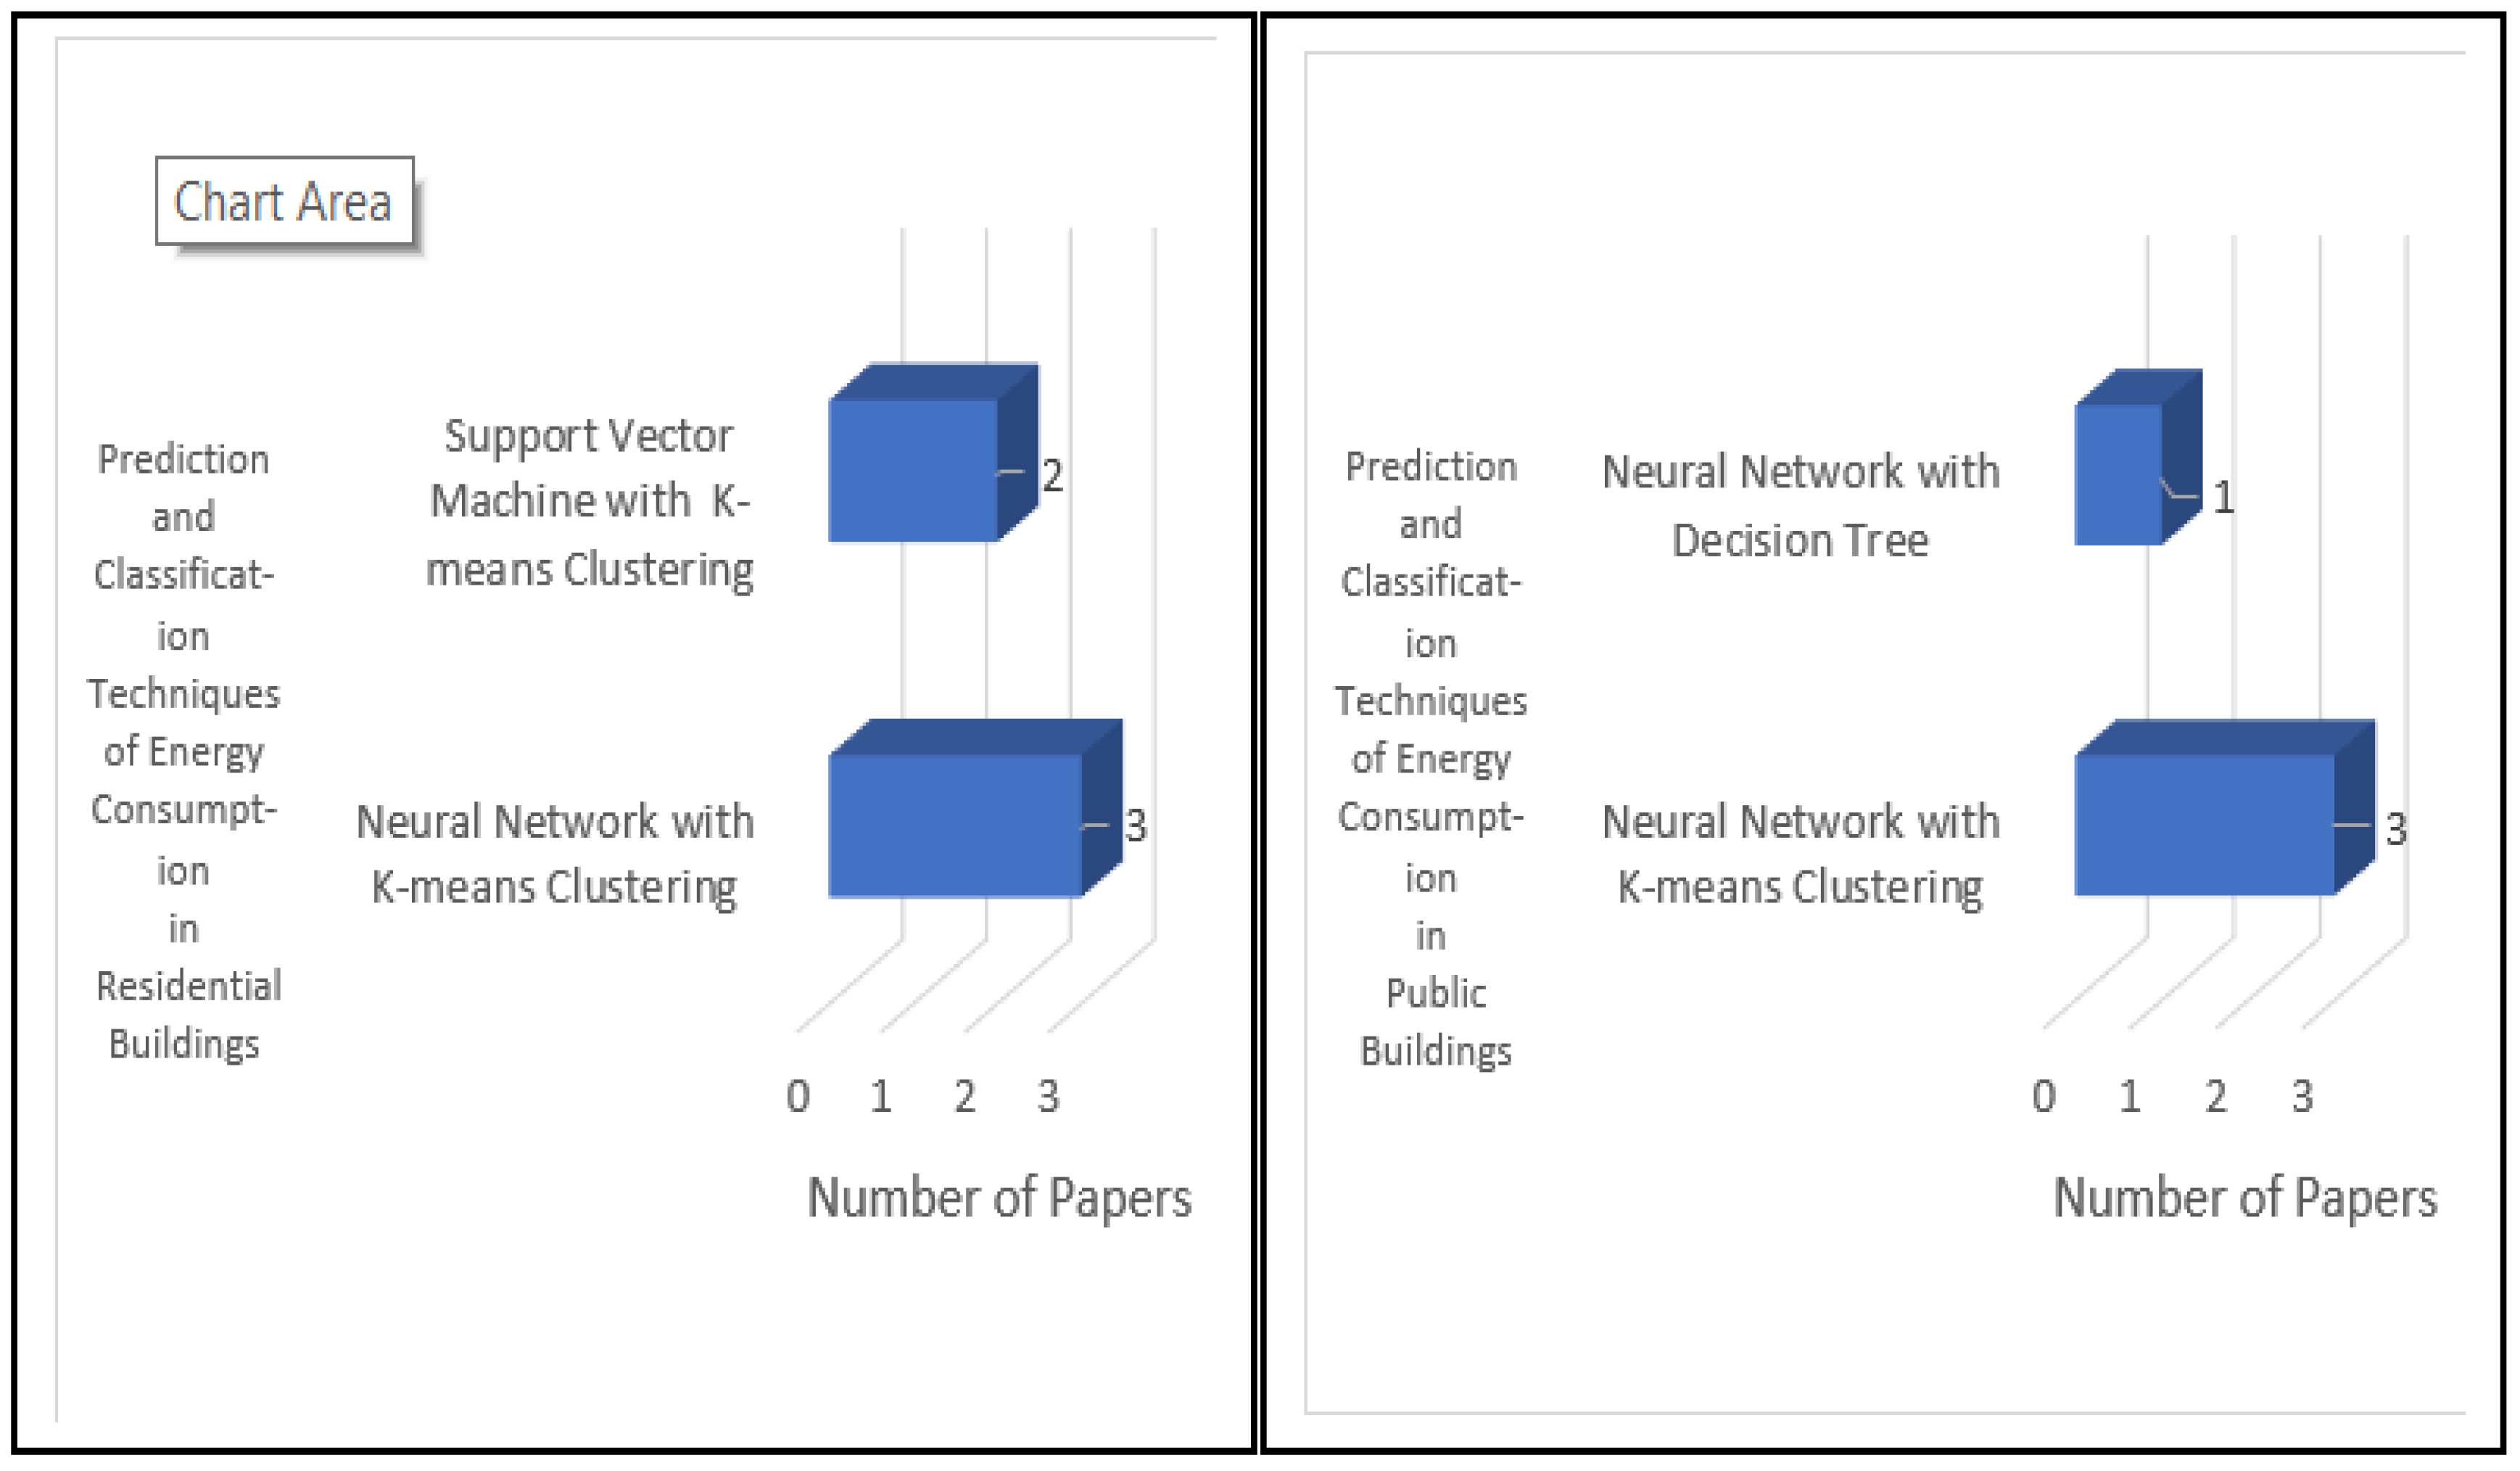
Regarding our RQ4, our analysis of papers S34 to S41 showed that K-means clustering was combined with backpropagation and feedforward neural networks in 75% of such papers (namely, in papers S34, S35, S37, S38, S39, and S41).
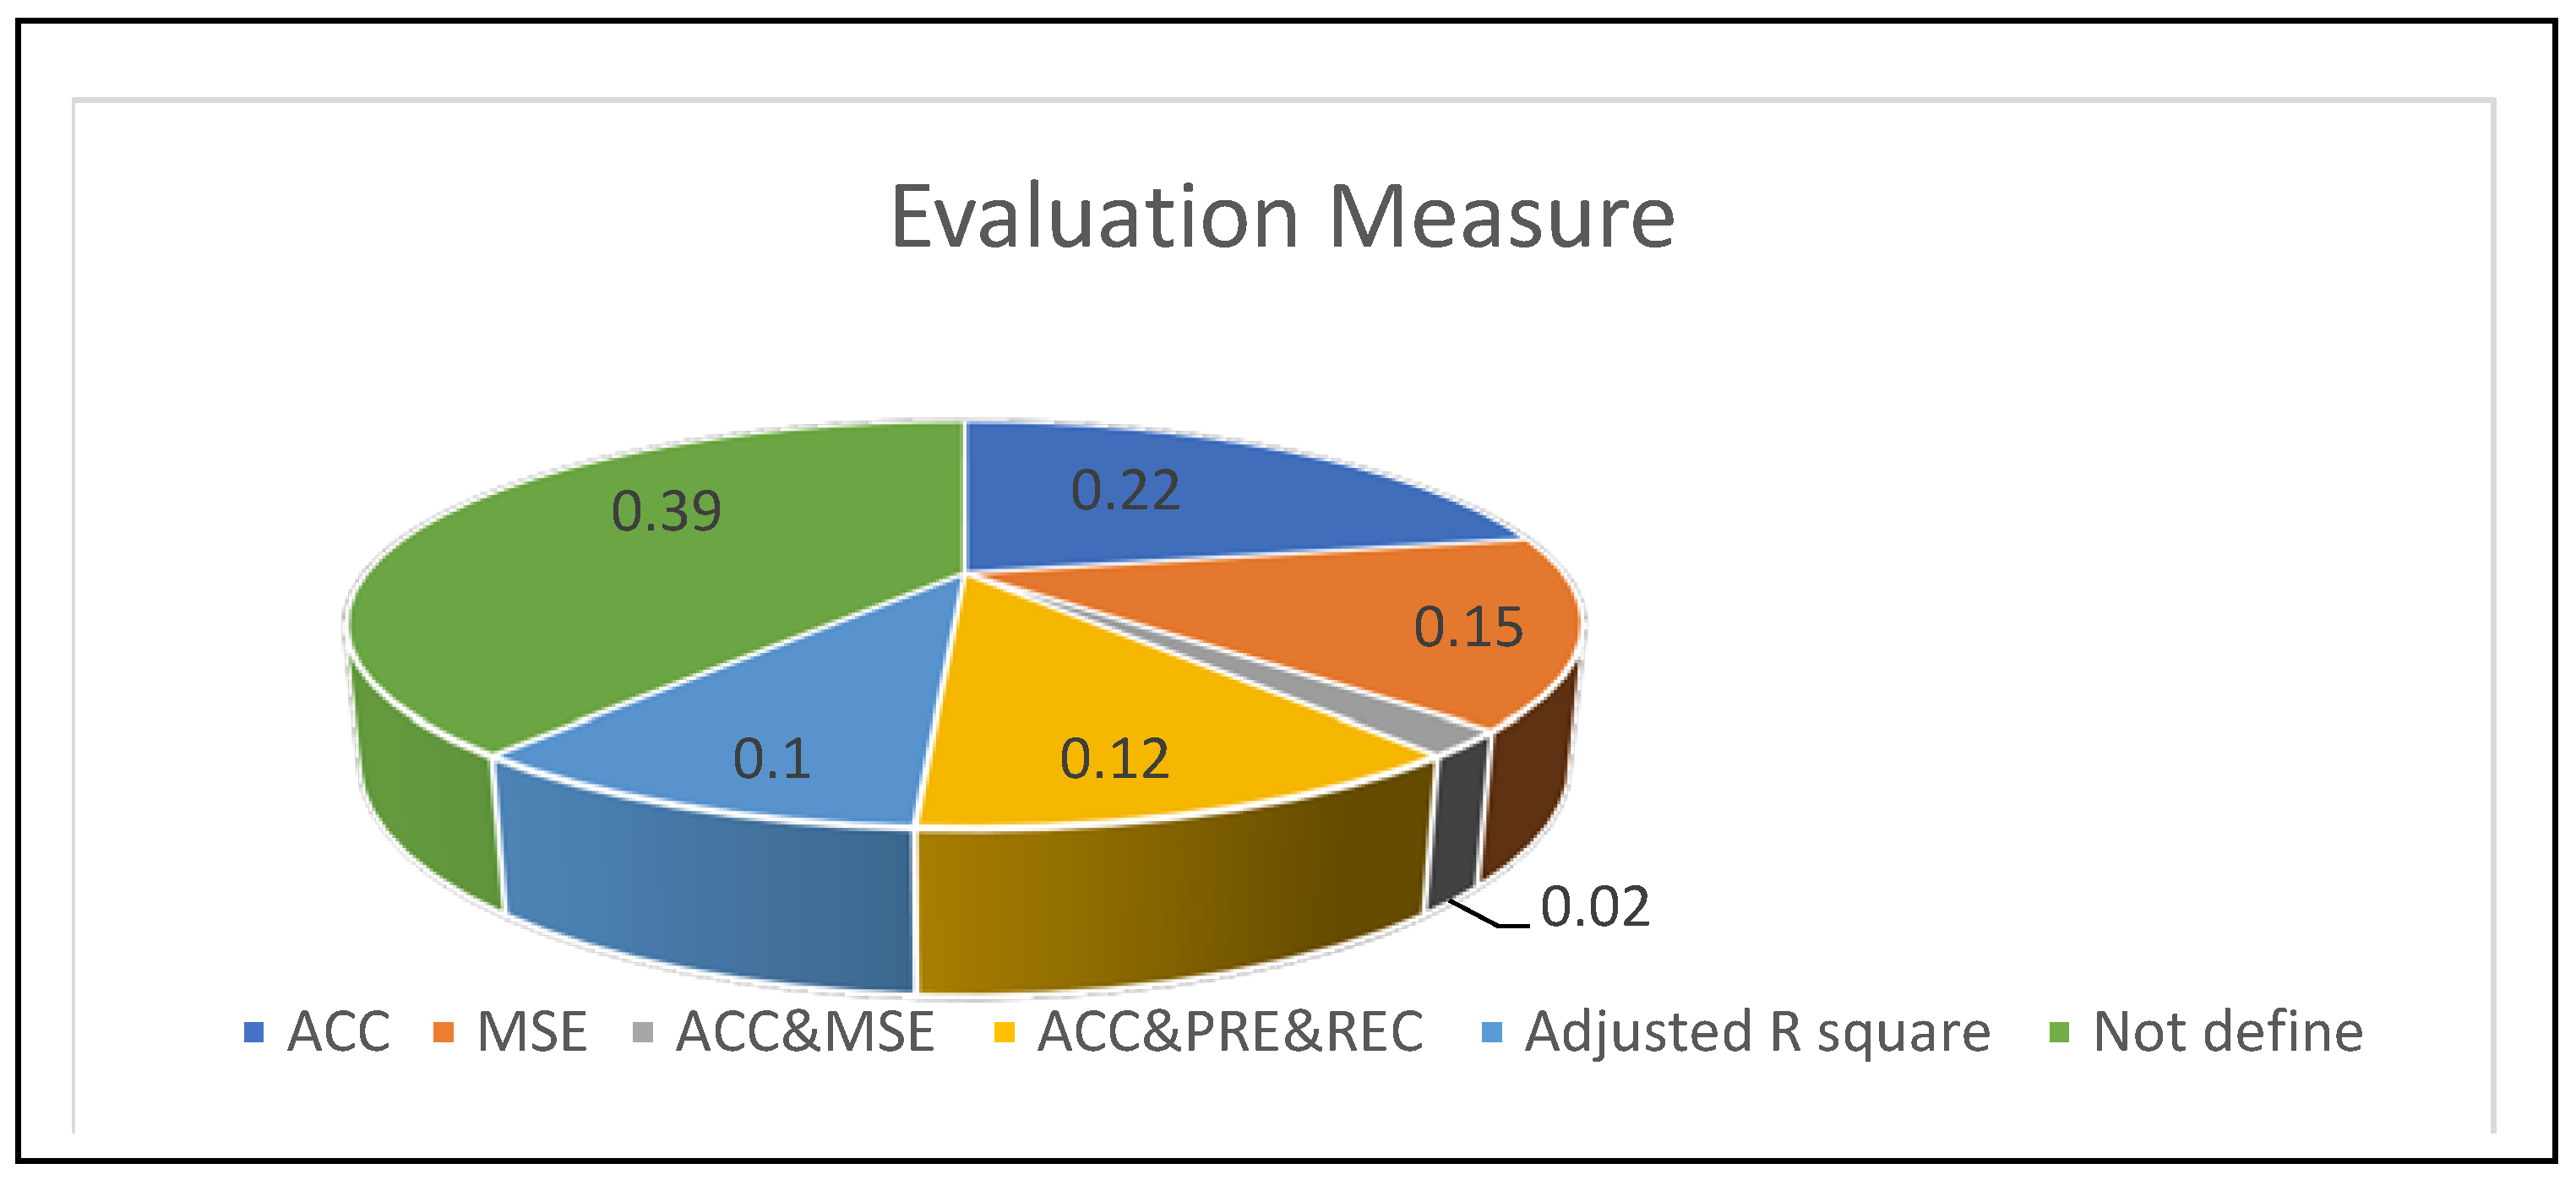
Finally, regarding our RQ5, accuracy scale is one of the most important metrics used to measure the accuracy of the intelligent model used in the field of energy consumption of different buildings (see Figure 12).

4.2. Research Gap Discussion

By reviewing the studies that were mentioned previously, three main problems were covered in our survey.
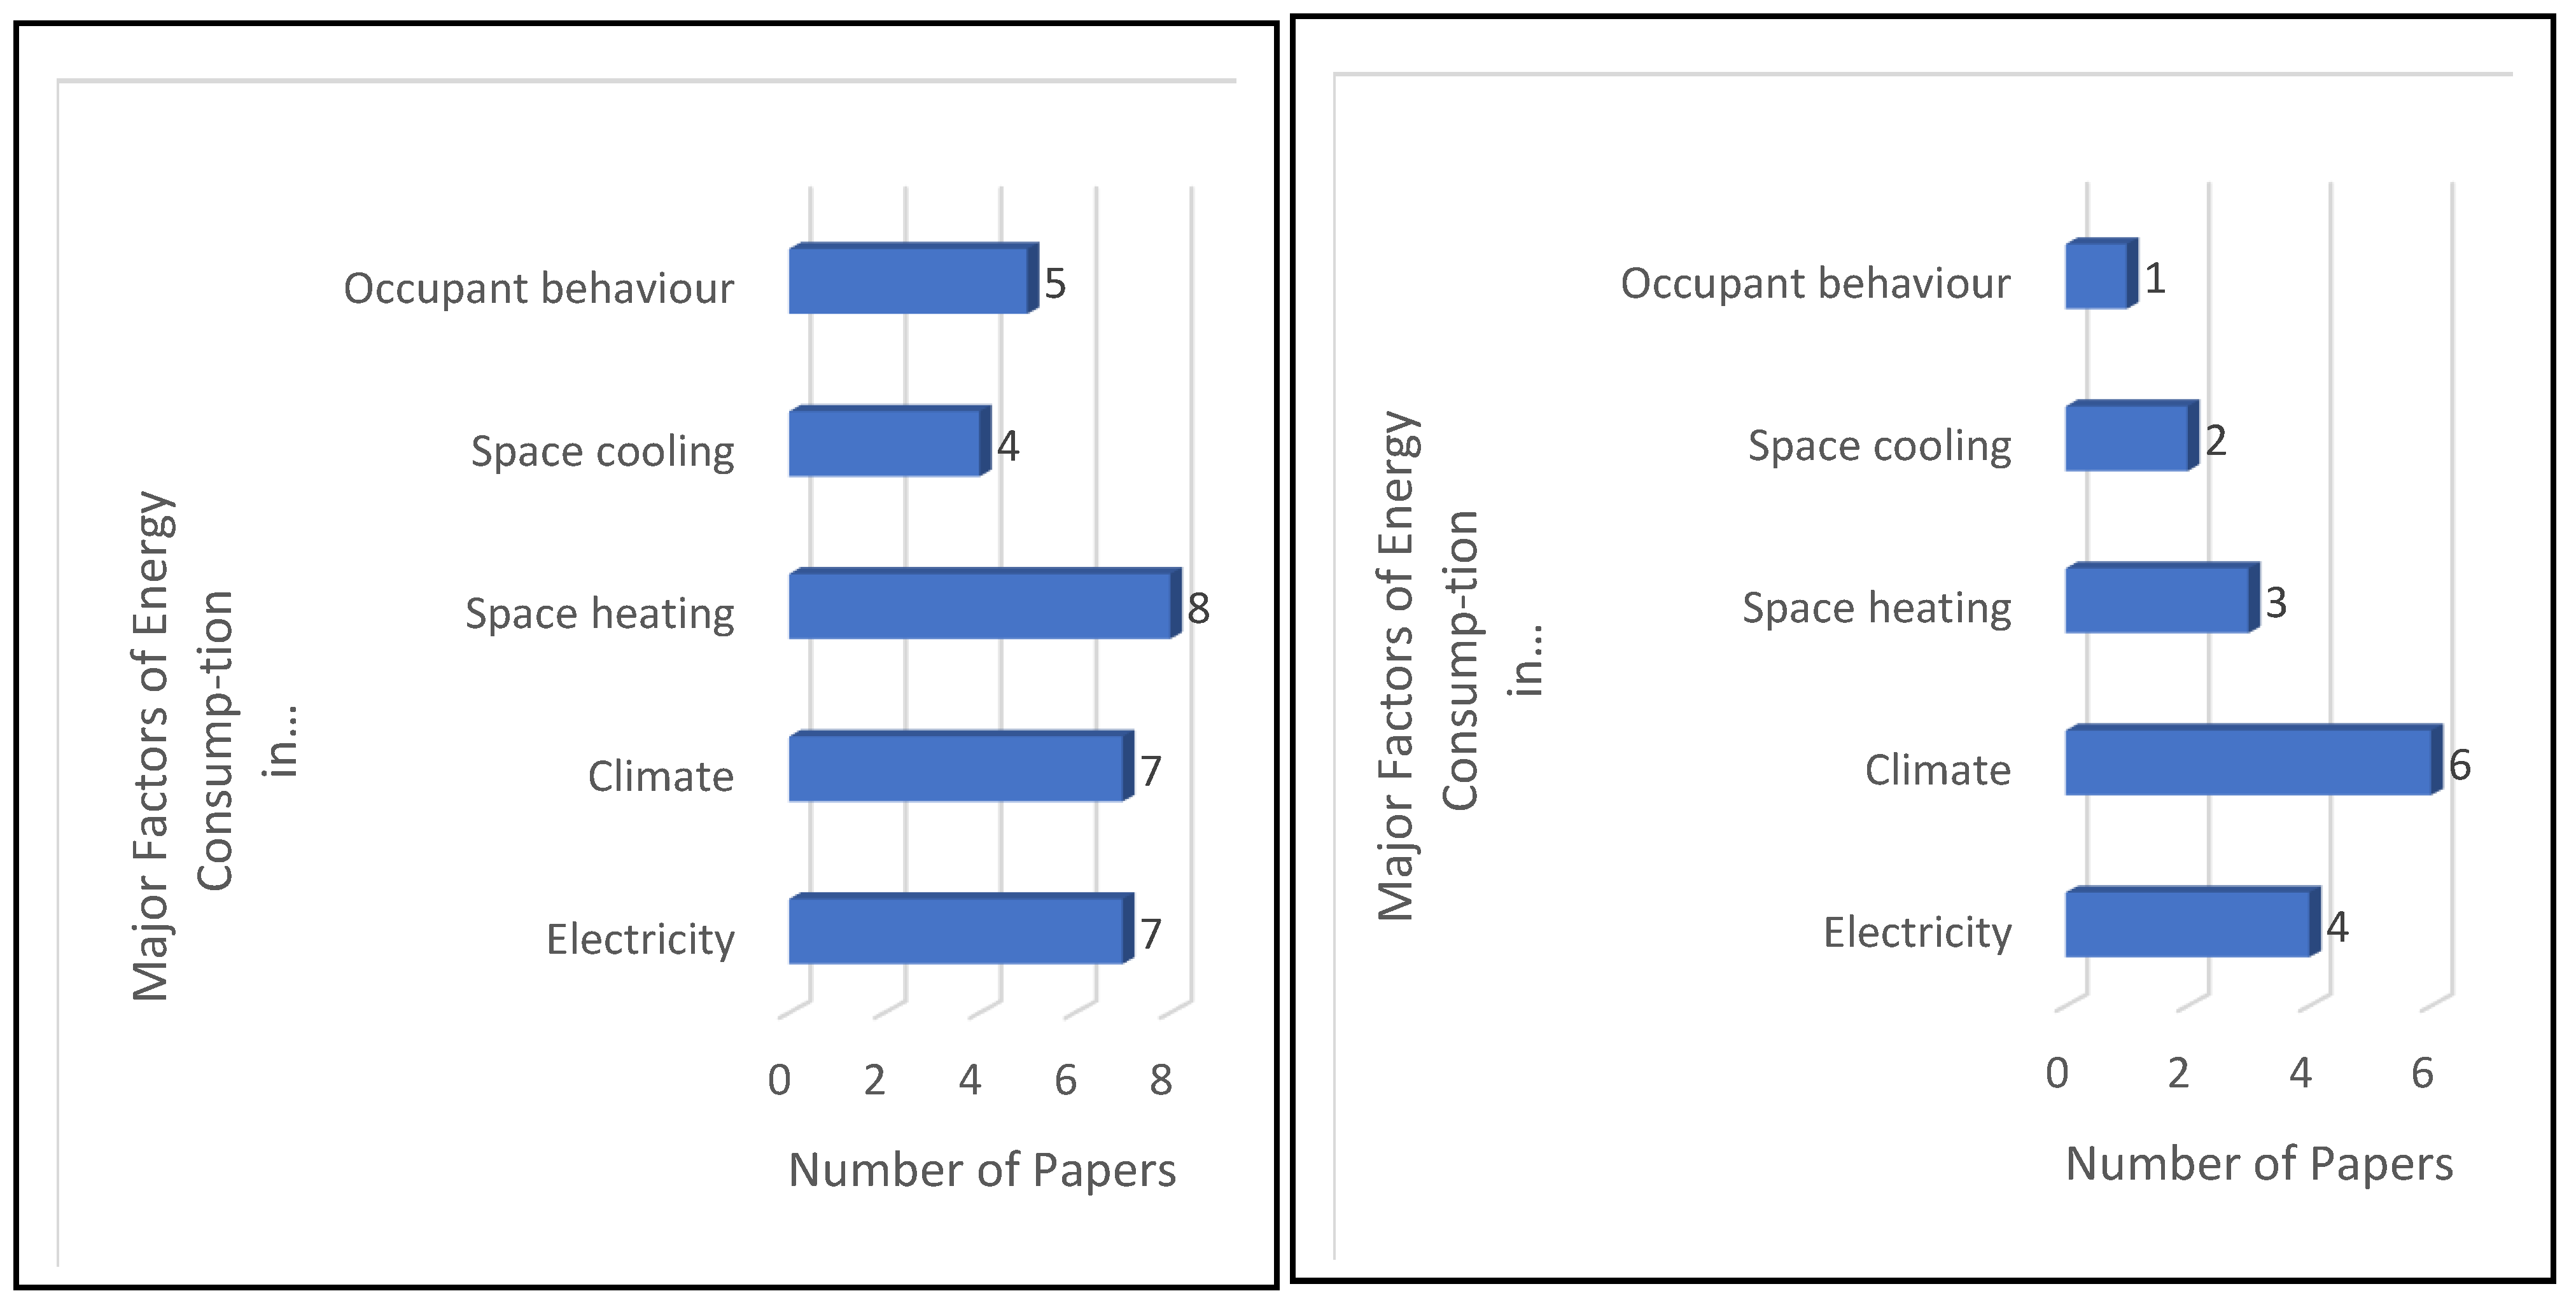
Firstly, the lack of an official study to find the main factors used in the field of energy consumption in the different building sectors. Moreover, it is unclear how these factors relate to the different applications in the field of energy. For example, studies S18, S28, S32, and S41 used the electricity factor in the ECB as the only factor in the study. In addition, manuscripts S2, S14, and S22 relied on consumer behavior in residential buildings as the only factor in the study. Our study shows that heating and climate factors directly influence the energy consumption of residential buildings, while electricity and climate factors directly influence energy consumption for public buildings.
Secondly, most of the previous studies (S11, S13, S14, S15, S34, S37, and S40) used K-means clustering and hierarchical clustering to classify the ECB. Our study shows that two main aspects were not covered in previous research: a) there is a direct relationship between “K-means clustering” and “electricity consumption” in public and residential buildings, b) our paper proposes other classification methods such as a self-organizing map, for comparison with other classification models found in our survey, in terms of accuracy.
Thirdly, most of the previous studies used four basic intelligent computing models to predict the ECB: neural networks (S23, S28, S34, S37, and S41), regression (S21, S26, S29, and S30), support vector machines (S32 and S40), and deep learning (S24 and S27). Our study shows that there is a direct relationship between “neural networks,” “support vector machines,” and “prediction of energy consumption in residential buildings.” Additionally, there is a direct relation between “deep learning” and “prediction of energy consumption in public buildings.” Our study proposes the use of recent literature techniques, such as recurrent neural networks, for comparison with the prediction models found in our survey.
Additionally, our research allowed us to identify several research gaps. We found that only a small number of papers (S1 and S6) address specific factors influencing the energy consumption of buildings. For example, some studies (S5, S11, S18, S21, S26, S28, S32, and S41) focused on the electricity factor in general, with no mention of the number of building occupants or the activities carried out by them. Only a few studies (S31, S33, and S38) related to the energy consumption in public buildings. However, stakeholders in public buildings, particularly in Portugal, find this topic relevant and are not only willing to improve the energy efficiency in those buildings but also interested in switching energy suppliers whenever the market conditions favor such change [13]. The results of this systematic review also displayed a wide gap in the domain of intelligent computing models, particularly regarding the automatic classification and prediction of the ECB, since the number of available machine learning techniques in the state-of-the-art is vast, and we saw from our survey, that some of the most promising techniques are not yet being used to their full potential. In fact, only a few studies (S24, S27, S31, and S39) address the application of the deep neural network model, which is a promising technique for predicting the ECB.

5. Study Limitations and Threats

Our survey has several limitations. Notably, it was limited by the search keywords chosen and the time interval of the publications (last seven years). In addition, it used a finite number of electronic database sources. Furthermore, this paper only analyzed English manuscripts, and we cannot guarantee to have selected all the obtainable and valuable material for our review.

6. Conclusions and Future Work

This paper introduced a systematic literature review on the topic of classifying and predicting the ECB, focusing on finding answers to our five research questions. Text mining procedures were used to find the most used terms in the energy and intelligent computing model domains, and a bibliometric map was used to find the relationships between the most common terms in those domains prior to a more detailed manuscript analysis. By following a PRISMA approach in our survey, we started by identifying 822 manuscripts and ended up analyzing 41. Our survey highlighted the most used intelligent computing models, notably machine learning methods, adopted by the community to classify and forecast the ECB. This study provides contributions in three aspects. The first one considers factors that influence the ECB. The second one provides a systematic survey of classification and prediction techniques used in that context. The last aspect tackles the evaluation criteria used by those techniques.
As mentioned, the study has not covered all manuscripts in 2021, which may contain new intelligent models. The emergence of new intelligent methods may help improve the accuracy of classification models and predict energy consumption for different building sectors.
Thus, there are still opportunities for improvements regarding our topic of research. As a recommendation for future work, there are some other factors that affect energy consumption in buildings (e.g., green roof, building envelope, internal and external factors). These factors may be used in the future for the classification and prediction of energy consumption. Our survey suggests tackling the classification of the ECB by combining clustering and optimization techniques aiming to classify the ECB to levels (low–medium–high). As for predicting the ECB, this study suggests adopting machine learning approaches from the family of deep learning techniques, such as long short-term memory, convolutional neural networks, and deep forest, which are some of the recent trends found in research.

Author Contributions

Conceptualization, A.A., V.S. and M.S.D.; methodology, A.A.; software, A.A; validation, V.S, M.S.D.; formal analysis, A.A., V.S. and M.S.D.; investigation, A.A., V.S. and M.S.D.; resources, V.S. and M.S.D.; data curation, A.A., V.S. and M.S.D.; writing—original draft preparation, A.A., V.S. and M.S.D.; writing—review and editing, A.A., V.S. and M.S.D.; visualization, A.A., V.S. and M.S.D.; supervision, V.S. and M.S.D.; project administration, V.S. and M.S.D.; funding acquisition, V.S. and M.S.D. All authors have read and agreed to the published version of the manuscript.

Funding

This work has been supported by a NOVA IMS PhD Scholarship and its scope lies in the context of Simplex #109 “Consumo SMART” https://www.simplex.gov.pt/medidas.

Institutional Review Board Statement

Not applicable.

Informed Consent Statement

Not applicable.

Data Availability Statement

The data accessed upon request from any of the author.

Acknowledgments

We would like to thank Maria Anastasiadou for their help in reviewing the structure and content of the paper. The authors would like also to thank the editorial team and the reviewers who provided constructive and helpful comments to improve the quality of the article.

Conflicts of Interest

The authors declare no conflict of interest.

Appendix A

This section shows the steps required to build a corpus tool that finds the word frequency in manuscripts. In this algorithm, we first included all manuscripts in a single “Documents” file as well as two “Dictionaries” (line 1). Then, from line 3 to line 10, we imported a few programming libraries and executed the following procedures in order to build our corpus:
  • Line 3 (import re): we imported a library for regular expression operations.
  • Line 4 (import nltk): we imported a toolkit for natural language processing.
  • Line 5: we computed SW = Stop Words.
  • Line 6: we computed £ = the word frequency for all words in α (“Documents”).
  • Line 7 (from nltk. corpus import SW): we computed corpus = a large and structured set of texts and SWs.
  • Lines 8 and 9: we removed the morphological affixes of words from the corpus leaving only the word stem.
  • Line 10: we recorded the frequency of each word in α (“Documents”).
We continued by implementing a cleaning process by deleting from α symbols, numbers, and extra spaces (line 11) and transforming all words to lowercase (line 12). Line 13 converted sentences to separate words. Line 14 removed stop words such as “the” and “is” and those that use stemming. That is, we reduced variations of the form of a given word by deleting inflection forms through the removal of unnecessary characters, such as in the following example:
{ R e d u c e s   e n e r g y R e d u c e d   e n e r g y R e d u c i n g   e n e r g y R e d u c e   e n e r g y
Lines 15 and 16 found common words between the main document file and the two dictionaries. Line 17 computed the word frequency in the main document file. Line 18 created a mapping between word frequency and the intersection words (that are common across “Document” and “Dictionary”) to find optimal keywords that were used in selecting significant research papers for our survey. Finally, in lines 19 and 20, we determined the importance of each word, found optimal keywords, and visualized a word cloud (Figure 3) and a word offset (Figure 4). In this last one, we depicted the location of a word in a sequence of text sentences.
Algorithm A1: Build a corpus module to find word frequency in manuscripts.
  • Input: α = (Documents number of manuscripts)
    ¥ = (Dictionary two dictionaries of intelligent model and energy consumption of buildings)
  • Output: β (Results: words frequency, importance of each word and word offsets and word cloud visualization)
  • Import re
  • Import nltk
  • SW = stopwords
  • £ = common word
  • from nltk. corpus import SW
  • PS = PorterStemmer ()
  • from nltk. stem. porter import PS
  • from nltk. probability import FreqDist
  • review = re. sub (‘[^a-z A-Z]’, ‘ ‘, α)
  • review = review. Lower ()
  • review = review. Split ()
  • review = [PS. stem(word) For word in review if not word in set (stopwords. words (‘english’))
  • def Intersection (review, ¥):
  • return set(review). intersection (¥)
  • fdist = FreqDist(review)
  • Mapping between fdist and intersection
  • Implement dispersion plot
  • Determine the importance of each word:
  • Return β
The final list of word frequencies allowed us to find the common terms in the “energy” and “intelligent computing models” domains. Additionally, word offsets and word cloud plots were created to enable a visual interpretation of the obtained result. The standard error in text mining approach is 0.18. In addition, the accuracy of this approach is 0.8504.

Appendix B

Table A1. Major factors of energy consumption of buildings.
Previous WorkElectricityClimateOccupant BehaviorSpace HeatingSpace CoolingGasWaterOther
S1------
S2-------
S3----
S4------
S5-----
S6-----
S7-----
S8-------
S9- ----
S10-------
S11------
S12-------
S13----
S14-------
S15-------
S16-------
S17------
S18-------
S19------
S20-------
S21-----
S22-- -----
S23------
S24------
S25------
S26------
S27-----
S28-------
S29-------
S30------
S31-----
S32-------
S33-----
S34------
S35-------
S36-------
S37------
S38-------
S39-------
S40------
S41-------
Table A2. Major factors of clustering and classification techniques of energy consumption of buildings.
Previous WorkK-Means ClusteringHierarchical ClusteringOther
S11-
S12-
S13-
S14--
S15--
S16-
S17-
S18--
S19-
S20-
S34--
S35--
S36--
S37--
S38--
S39--
S40--
S41--
Table A3. Major factors of prediction techniques of energy consumption of buildings.
Previous WorkNeural NetworkRegression ModelSupport Vector MachineDeep Neural NetworkRandom ForestOther
S21-----
S22----
S23----
S24-----
S25-----
S26-----
S27-----
S28---
S29-----
S30-----
S31---
S32-----
S33---
S34-----
S35-----
S36-----
S37-----
S38-----
S39-----
S40-----
S41----
Table A4. Major combination prediction and classification techniques of energy consumption of buildings.
Previous WorkNeural Network with K-Means ClusteringSupport Vector Machine with K-Means ClusteringNeural Network with Decision TreeOther
S34---
S35---
S36---
S37---
S38---
S39--
S40---
S41--

References

  1. Nguyen, T.A.; Aiello, M. Energy intelligent buildings based on user activity: A survey. Energy Build. 2013, 56, 244–257. [Google Scholar] [CrossRef] [Green Version]
  2. Wong, V.W.S.; Member, S.; Jatskevich, J.; Member, S.; Schober, R.; Leon-Garcia, A. Autonomous Demand-Side Management Based on Game-Theoretic Energy Consumption Scheduling for the Future Smart Grid. IEEE Trans. Smart Grid 2010, 1, 320–331. [Google Scholar]
  3. Swan, L.G.; Ugursal, V.I. Modeling of end-use energy consumption in the residential sector: A review of modeling techniques. Renew. Sustain. Energy Rev. 2009, 13, 1819–1835. [Google Scholar] [CrossRef]
  4. Zhang, M.; Bai, C. Exploring the influencing factors and decoupling state of residential energy consumption in Shandong. J. Clean. Prod. 2018, 194, 253–262. [Google Scholar] [CrossRef]
  5. Javaid, N.; Ullah, I.; Akbar, M.; Iqbal, Z.; Khan, F.A.; Alrajeh, N.; Alabed, M.S. An Intelligent Load Management System with Renewable Energy Integration for Smart Homes. IEEE Access 2017, 5, 13587–13600. [Google Scholar] [CrossRef]
  6. Jozi, A.; Pinto, T.; Praça, I.; Vale, Z. Decision Support Application for Energy Consumption Forecasting. Appl. Sci. 2019, 9, 699. [Google Scholar] [CrossRef] [Green Version]
  7. Li, W.-T.; Yuen, C.; Hassan, N.U.; Tushar, W.; Wen, C.-K.; Wood, K.L.; Hu, K.; Liu, X. Demand Response Management for Residential Smart Grid: From Theory to Practice. IEEE Access 2015, 3, 2431–2440. [Google Scholar] [CrossRef]
  8. Chitsaz, H.; Shaker, H.; Zareipour, H.; Wood, D.; Amjady, N. Short-term electricity load forecasting of buildings in microgrids. Energy Build. 2015, 99, 50–60. [Google Scholar] [CrossRef]
  9. Li, K.; Hu, C.; Liu, G.; Xue, W. Building’s electricity consumption prediction using optimized artificial neural networks and principal component analysis. Energy Build. 2015, 108, 106–113. [Google Scholar] [CrossRef]
  10. Naji, S.; Keivani, A.; Shamshirband, S.; Alengaram, U.J.; Jumaat, M.Z.; Mansor, Z.; Lee, M. Estimating building energy consumption using extreme learning machine method. Energy 2016, 97, 506–516. [Google Scholar] [CrossRef]
  11. Chae, Y.T.; Horesh, R.; Hwang, Y.; Lee, Y.M. Artificial neural network model for forecasting sub-hourly electricity usage in commercial buildings. Energy Build. 2016, 111, 184–194. [Google Scholar] [CrossRef]
  12. Massana, J.; Pous, C.; Burgas, L.; Melendez, J.; Colomer, J. Short-term load forecasting for non-residential buildings contrasting artificial occupancy attributes. Energy Build. 2016, 130, 519–531. [Google Scholar] [CrossRef] [Green Version]
  13. Raza, M.Q.; Khosravi, A. A review on artificial intelligence based load demand forecasting techniques for smart grid and buildings. Renew. Sustain. Energy Rev. 2015, 50, 1352–1372. [Google Scholar] [CrossRef]
  14. Runge, J.; Zmeureanu, R. Forecasting Energy Use in Buildings Using Artificial Neural Networks: A Review. Energies 2019, 12, 3254. [Google Scholar] [CrossRef] [Green Version]
  15. Bourdeau, M.; Zhai, X.Q.; Nefzaoui, E.; Guo, X.; Chatellier, P. Modeling and forecasting building energy consumption: A review of data-driven techniques. Sustain. Cities Soc. 2019, 48, 101533. [Google Scholar] [CrossRef]
  16. Qolomany, B.; Al-Fuqaha, A.; Gupta, A.; Benhaddou, D.; Alwajidi, S.; Qadir, J.; Fong, A.C. Leveraging Machine Learning and Big Data for Smart Buildings: A Comprehensive Survey. IEEE Access 2019, 7, 90316–90356. [Google Scholar] [CrossRef]
  17. Djenouri, D.; Laidi, R.; Djenouri, Y.; Balasingham, I. Machine Learning for Smart Building Applications. ACM Comput. Surv. 2019, 52, 1–36. [Google Scholar] [CrossRef]
  18. Vázquez-Canteli, J.R.; Nagy, Z. Reinforcement learning for demand response: A review of algorithms and modeling techniques. Appl. Energy 2019, 235, 1072–1089. [Google Scholar] [CrossRef]
  19. Mason, K.; Grijalva, S. A review of reinforcement learning for autonomous building energy management. Comput. Electr. Eng. 2019, 78, 300–312. [Google Scholar] [CrossRef] [Green Version]
  20. Guyot, D.; Giraud, F.; Simon, F.; Corgier, D.; Marvillet, C.; Tremeac, B. Overview of the use of artificial neural networks for energy-related applications in the building sector. Int. J. Energy Res. 2019, 43, 6680–6720. [Google Scholar] [CrossRef]
  21. Amasyali, K.; El-Gohary, N.M. A review of data-driven building energy consumption prediction studies. Renew. Sustain. Energy Rev. 2018, 81, 1192–1205. [Google Scholar] [CrossRef]
  22. Mosavi, A.; Bahmani, A. Energy consumption prediction using m[1] A. Mosavi and A. Bahmani, "Energy consumption prediction using machine learning: A review. Energies 2019, 1–63. [Google Scholar] [CrossRef]
  23. Perera, A.; Kamalaruban, P. Applications of reinforcement learning in energy systems. Renew. Sustain. Energy Rev. 2021, 137, 110618. [Google Scholar] [CrossRef]
  24. Bilous, I.; Deshko, V.; Sukhodub, I. Parametric analysis of external and internal factors influence on building energy performance using non-linear multivariate regression models. J. Build. Eng. 2018, 20, 327–336. [Google Scholar] [CrossRef]
  25. Qian, X.; Lee, S.W. The design and analysis of energy efficient building envelopes for the commercial buildings by mixed-level factorial design and statistical methods. In Proceedings of the ASEE Middle Atlantic American Society of Engineering Education, Swarthmore, PA, USA, 14–15 November 2014; pp. 14–15. [Google Scholar]
  26. Abualigah, L.; Diabat, A.; Mirjalili, S.; Elaziz, M.A.; Gandomi, A.H. The Arithmetic Optimization Algorithm. Comput. Methods Appl. Mech. Eng. 2021, 376, 113609. [Google Scholar] [CrossRef]
  27. Abualigah, L.; Gandomi, A.H.; Elaziz, M.A.; Al Hamad, H.; Omari, M.; Alshinwan, M.; Khasawneh, A.M. Advances in Meta-Heuristic Optimization Algorithms in Big Data Text Clustering. Electronics 2021, 10, 101. [Google Scholar] [CrossRef]
  28. Abualigah, L.; Gandomi, A.H.; Elaziz, M.A.; Hussien, A.G.; Khasawneh, A.M.; Alshinwan, M.; Houssein, E.H. Nature-Inspired Optimization Algorithms for Text Document Clustering—A Comprehensive Analysis. Algorithms 2020, 13, 345. [Google Scholar] [CrossRef]
  29. Moher, D.; Liberati, A.; Tetzlaff, J.; Altman, D.G.; Group, T.P. Preferred Reporting Items for Systematic Reviews and Meta-Analyses: The PRISMA Statement. PLoS Med. 2009, 6, e1000097. [Google Scholar] [CrossRef] [Green Version]
  30. Trianni, A.; Merigó, J.M.; Bertoldi, P. Ten years of Energy Efficiency: A bibliometric analysis. Energy Effic. 2018, 11, 1–23. [Google Scholar] [CrossRef]
  31. Ma, X.; Wang, M.; Li, C. A Summary on Research of Household Energy Consumption: A Bibliometric Analysis. Sustainability 2019, 12, 316. [Google Scholar] [CrossRef] [Green Version]
  32. Santin, O.G. Occupant behaviour in energy efficient dwellings: Evidence of a rebound effect. Neth. J. Hous. Environ. Res. 2013, 28, 311–327. [Google Scholar] [CrossRef] [Green Version]
  33. Aqlan, F.; Ahmed, A.; Srihari, K.; Khasawneh, M.T. Integrating artificial neural networks and cluster analysis to assess energy efficiency of buildings. In Proceedings of the IIE Annual Conference and Expo 2014, Montreal, QC, Canada, 31 May–3 June 2014; pp. 3936–3943. [Google Scholar]
  34. Berardi, U. Building Energy Consumption in US, EU, and BRIC Countries. Procedia Eng. 2015, 118, 128–136. [Google Scholar] [CrossRef] [Green Version]
  35. Mancini, F.; Basso, G.L.; De Santoli, L. Energy Use in Residential Buildings: Characterisation for Identifying Flexible Loads by Means of a Questionnaire Survey. Energies 2019, 12, 2055. [Google Scholar] [CrossRef] [Green Version]
  36. Csoknyai, T.; Legardeur, J.; Akle, A.A.; Horváth, M. Analysis of energy consumption profiles in residential buildings and impact assessment of a serious game on occupants’ behavior. Energy Build. 2019, 196, 1–20. [Google Scholar] [CrossRef]
  37. Mardookhy, M.; Sawhney, R.; Ji, S.; Zhu, X.; Zhou, W. A study of energy efficiency in residential buildings in Knoxville, Tennessee. J. Clean. Prod. 2014, 85, 241–249. [Google Scholar] [CrossRef]
  38. Cao, X.; Dai, X.; Liu, J. Building energy-consumption status worldwide and the state-of-the-art technologies for zero-energy buildings during the past decade. Energy Build. 2016, 128, 198–213. [Google Scholar] [CrossRef]
  39. Chang, C.; Zhu, N.; Yang, K.; Yang, F. Data and analytics for heating energy consumption of residential buildings: The case of a severe cold climate region of China. Energy Build. 2018, 172, 104–115. [Google Scholar] [CrossRef]
  40. Hannan, M.A.; Faisal, M.; Ker, P.J.; Mun, L.H.; Parvin, K.; Mahlia, T.M.I.; Blaabjerg, F. A Review of Internet of Energy Based Building Energy Management Systems: Issues and Recommendations. IEEE Access 2018, 6, 38997–39014. [Google Scholar] [CrossRef]
  41. Bhattacharjee, S.; Reichard, G. Socio-Economic Factors Affecting Individual Household Energy Consumption: A Systematic Review. In Proceedings of the ASME 2011 5th International Conference on Energy Sustainability, Parts A, B, and C, Washington, DC, USA, 7–10 August 2011; pp. 891–901. [Google Scholar]
  42. Gouveia, J.P.; Seixas, J. Unraveling electricity consumption profiles in households through clusters: Combining smart meters and door-to-door surveys. Energy Build. 2016, 116, 666–676. [Google Scholar] [CrossRef]
  43. Azaza, M.; Wallin, F. Smart meter data clustering using consumption indicators: Responsibility factor and consumption variability. Energy Procedia 2017, 142, 2236–2242. [Google Scholar] [CrossRef]
  44. Gouveia, J.P.; Seixas, J.; Mestre, A. Daily electricity consumption profiles from smart meters—Proxies of behavior for space heating and cooling. Energy 2017, 141, 108–122. [Google Scholar] [CrossRef]
  45. Diao, L.; Sun, Y.; Chen, Z.; Chen, J. Modeling energy consumption in residential buildings: A bottom-up analysis based on occupant behavior pattern clustering and stochastic simulation. Energy Build. 2017, 147, 47–66. [Google Scholar] [CrossRef]
  46. Nepal, B.; Yamaha, M.; Sahashi, H.; Yokoe, A. Analysis of Building Electricity Use Pattern Using K-Means Clustering Algorithm by Determination of Better Initial Centroids and Number of Clusters. Energies 2019, 12, 2451. [Google Scholar] [CrossRef] [Green Version]
  47. Jin, L.; Lee, D.; Sim, A.; Borgeson, S.; Wu, K.; Spurlock, C.A.; Todd, A. Comparison of clustering techniques for residential energy behavior using smart meter data. In Proceedings of the Workshops at the Thirty-First AAAI Conference on Artificial Intelligence, San Francisco, CA, USA, 4–9 February 2017. [Google Scholar]
  48. Carbonare, N.; Pflug, T.; Wagner, A. Clustering the occupant behavior in residential buildings: A method comparison. Bauphysik 2018, 40, 427–433. [Google Scholar] [CrossRef]
  49. Pan, S.; Wang, X.; Wei, Y.; Zhang, X.; Gál, C.; Ren, G.; Yan, D.; Shi, Y.; Wu, J.; Xia, L.; et al. Cluster analysis for occupant-behavior based electricity load patterns in buildings: A case study in Shanghai residences. Build. Simul. 2017, 10, 889–898. [Google Scholar] [CrossRef]
  50. Tureczek, A.; Nielsen, P.S.; Madsen, H. Electricity Consumption Clustering Using Smart Meter Data. Energies 2018, 11, 859. [Google Scholar] [CrossRef] [Green Version]
  51. Braun, M.; Altan, H.; Beck, S. Using regression analysis to predict the future energy consumption of a supermarket in the UK. Appl. Energy 2014, 130, 305–313. [Google Scholar] [CrossRef] [Green Version]
  52. Wahid, F.; Ghazali, R.; Shah, A.S.; Fayaz, M. Prediction of Energy Consumption in the Buildings Using Multi-Layer Perceptron and Random Forest. Int. J. Adv. Sci. Technol. 2017, 101, 13–22. [Google Scholar] [CrossRef]
  53. Liu, Z.; Wu, D.; Liu, Y.; Han, Z.; Lun, L.; Gao, J.; Jin, G.; Cao, G. Accuracy analyses and model comparison of machine learning adopted in building energy consumption prediction. Energy Explor. Exploit. 2019, 37, 1426–1451. [Google Scholar] [CrossRef] [Green Version]
  54. Kim, T.-Y.; Cho, S.-B. Predicting residential energy consumption using CNN-LSTM neural networks. Energy 2019, 182, 72–81. [Google Scholar] [CrossRef]
  55. Moretti, E.; Nassuato, L.; Bordoni, G. Development of Regression Models to Predict Energy Consumption in Industrial Sites: The Case Study of a Manufacturing Company in the Central Italy. Tec. Ital. J. Eng. Sci. 2019, 63, 343–348. [Google Scholar] [CrossRef]
  56. Berriel, R.F.; Lopes, A.T.; Rodrigues, A.; Varejao, F.M.; Oliveira-Santos, T. Monthly energy consumption forecast: A deep learning approach. In Proceedings of the 2017 International Joint Conference on Neural Networks (IJCNN), Anchorage, AK, USA, 14–19 May 2017; pp. 4283–4290. [Google Scholar]
  57. Edwards, R.E.; New, J.; Parker, L.E. Predicting future hourly residential electrical consumption: A machine learning case study. Energy Build. 2012, 49, 591–603. [Google Scholar] [CrossRef]
  58. Rahman, H.; Selvarasan, I.; Begum, A.J. Short-Term Forecasting of Total Energy Consumption for India-A Black Box Based Approach. Energies 2018, 11, 3442. [Google Scholar] [CrossRef] [Green Version]
  59. Wang, Y.; Wang, F.; Wang, H. Influencing factors regression analysis of heating energy consumption of rural buildings in China. Procedia Eng. 2017, 205, 3585–3592. [Google Scholar] [CrossRef]
  60. Zekić-Sušac, M.; Mitrović, S.; Has, A. Machine learning based system for managing energy efficiency of public sector as an approach towards smart cities. Int. J. Inf. Manag. 2021, 58, 102074. [Google Scholar] [CrossRef]
  61. Kim, S.; Jung, S.; Baek, S.-M. A Model for Predicting Energy Usage Pattern Types with Energy Consumption Information According to the Behaviors of Single-Person Households in South Korea. Sustainability 2019, 11, 245. [Google Scholar] [CrossRef] [Green Version]
  62. Bogner, K.; Pappenberger, F.; Zappa, M. Machine Learning Techniques for Predicting the Energy Consumption/Production and Its Uncertainties Driven by Meteorological Observations and Forecasts. Sustainability 2019, 11, 3328. [Google Scholar] [CrossRef] [Green Version]
  63. Jovanović, R.Ž.; Sretenović, A.A. Ensemble of radial basis neural networks with k-means clustering for heating energy consumption prediction. FME Trans. 2017, 45, 51–57. [Google Scholar] [CrossRef] [Green Version]
  64. Banihashemi, S.; Ding, G.; Wang, J. Developing a Hybrid Model of Prediction and Classification Algorithms for Building Energy Consumption. Energy Procedia 2017, 110, 371–376. [Google Scholar] [CrossRef]
  65. Seyedzadeh, S.; Rahimian, F.; Glesk, I.; Roper, M. Machine learning for estimation of building energy consumption and performance: A review. Vis. Eng. 2018, 6, 5. [Google Scholar] [CrossRef]
  66. Zekić-Sušac, M.; Scitovski, R.; Has, A. Cluster analysis and artificial neural networks in predicting energy efficiency of public buildings as a cost-saving approach. Croat. Rev. Econ. Bus. Soc. Stat. 2018, 4, 57–66. [Google Scholar] [CrossRef] [Green Version]
  67. Tang, W.-J.; Lee, X.-L.; Wang, H.; Yang, H.-T. Leveraging Socioeconomic Information and Deep Learning for Residential Load Pattern Prediction. In Proceedings of the 2019 IEEE PES Innovative Smart Grid Technologies Europe (ISGT-Europe), Bucharest, Romania, 29 September–2 October 2019; pp. 1–5. [Google Scholar]
  68. Cai, H.; Shen, S.; Lin, Q.; Li, X.; Xiao, H. Predicting the Energy Consumption of Residential Buildings for Regional Electricity Supply-Side and Demand-Side Management. IEEE Access 2019, 7, 30386–30397. [Google Scholar] [CrossRef]
  69. Gajowniczek, K.; Zabkowski, T. Simulation Study on Clustering Approaches for Short-Term Electricity Forecasting. Complexity 2018, 2018, 1–21. [Google Scholar] [CrossRef] [Green Version]
  70. Elgendy, I.A.; Zhang, W.-Z.; He, H.; Gupta, B.B.; El-Latif, A.A.A. Joint computation offloading and task caching for multi-user and multi-task MEC systems: Reinforcement learning-based algorithms. Wirel. Netw. 2021, 27, 2023–2038. [Google Scholar] [CrossRef]
  71. Wu, Y.; Liu, Y.; Ahmed, S.H.; Peng, J.; El-Latif, A.A.A. Dominant Data Set Selection Algorithms for Electricity Consumption Time-Series Data Analysis Based on Affine Transformation. IEEE Internet Things J. 2020, 7, 4347–4360. [Google Scholar] [CrossRef] [Green Version]
  72. Zhang, W.-Z.; Elgendy, I.A.; Hammad, M.; Iliyasu, A.M.; Du, X.; Guizani, M.; El-Latif, A.A.A. Secure and Optimized Load Balancing for Multitier IoT and Edge-Cloud Computing Systems. IEEE Internet Things J. 2021, 8, 8119–8132. [Google Scholar] [CrossRef]
  73. El-Latif, A.A.A.; Abd-El-Atty, B.; Mehmood, I.; Muhammad, K.; Venegas-Andraca, S.E.; Peng, J. Quantum-Inspired Blockchain-Based Cybersecurity: Securing Smart Edge Utilities in IoT-Based Smart Cities. Inf. Process. Manag. 2021, 58, 102549. [Google Scholar] [CrossRef]
Figure 1. Methodology steps.
Energies 14 07810 g001
Figure 2. Search query.
Energies 14 07810 g002
Figure 3. PRISMA flow chart.
Energies 14 07810 g003
Figure 4. Word cloud for intelligent techniques applied to energy.
Energies 14 07810 g004
Figure 5. Word offset plot for the top 5 words ranked by frequency.
Energies 14 07810 g005
Figure 6. General steps for obtaining highly relevant terms in our corpus. The numbers represent the computed TITs of the terms. Note: if (TITs) > 0.05, the term is relevant.
Energies 14 07810 g006
Figure 7. The relationships between the common terms using the bibliometric map.
Energies 14 07810 g007
Figure 8. Major factors of energy consumption in residential and public buildings.
Energies 14 07810 g008
Figure 9. Classification techniques that used energy consumption in residential and public buildings.
Energies 14 07810 g009
Figure 10. Prediction techniques that used energy consumption in residential and public buildings.
Energies 14 07810 g010
Figure 11. Prediction and classification techniques that used energy consumption in residential and public buildings.
Energies 14 07810 g011
Figure 12. Evaluation measure of intelligent computing models.
Energies 14 07810 g012
Figure 13. The most relevant factors that influence the energy consumption of buildings, from our survey.
Energies 14 07810 g013
Figure 14. Top classification techniques identified in our survey.
Energies 14 07810 g014
Figure 15. Top prediction techniques identified in our survey.
Energies 14 07810 g015
Table 1. Summary of papers in the category of energy consumption of buildings.
PaperReferenceApplicationData DimensionsMethod and TechniquesNo. of Citations
S1(Guerra Santin, 2013 [32])Occupant behavior in energy-efficient dwellingsBuilding characteristics and occupant behaviorStatistical analysis80
S2(Delzendeh, Wu, Lee, & Zhou, 2017 [33])The impact of occupants’ behaviors on building energy analysisOccupant behaviorSystematic review195
S3(Berardi, 2015 [34])Comparative study between the energy consumption of residential buildings in US, EU, and BRIC countriesClimate, space heating, space cooling, and hot waterStatistical analysis72
S4(Mancini, Basso, & De Santoli, 2019 [35])Energy use in residential buildings: characterization via identifying flexible loads by means of a survey questionnaire Building location, number of occupants in the dwelling, building services system, kitchenQuestionnaires12
S5(Csoknyai, Legardeur, Akle, & Horváth, 2019 [36])Analysis of energy consumption profiles in residential buildingsElectric consumption, heating and hot waterQuestionnaires and serious game14
S6(Mardookhy, Sawhney, Ji, Zhu, & Zhou, 2014 [37])A study of energy efficiency in residential buildings HVAC, electricity, natural gas, and lighting system Statistical analysis and questionnaires66
S7(Cao, Dai, & Liu, 2016 [38])Building energy-consumption status worldwide and
state-of-the-art technologies for near zero-energy buildings
Climate change, space heating, and space coolingQuestionnaires358
S8(Chang, Zhu, Yang, & Yang, 2018 [39])Reduction of energy consumption in residential buildings Climate informationStatistical analysis23
S9(Hannan et al., 2018 [40])Identification of elements to control and regulate residential energy consumptionDemographics, consumer attitude, economy, and climate Correlation coefficients 60
S10(Bhattacharjee & Reichard, 2011 [41])Socio-economic factors affecting individual household energy consumptionSocio-economic factorsSystematic review33
Table 2. Summary of papers in the category of classification of energy consumption of buildings.
PaperReferenceApplicationData DimensionsMethod and TechniquesNo. of Citations
S11(Gouveia & Seixas, 2016 [42])Unravelling electricity consumption profiles in households through clusters: combining smart meters and door-to-door surveysElectricity consumption and weather informationHierarchical clustering and door to door surveys83
S12(Azaza & Wallin, 2017 [43])Smart meters data clustering to find the most responsible consumers in the peak systemResponsibility factor andconsumption variabilityHierarchicalclustering and self-organizing map15
S13(Gouveia, Seixas, & Mestre, 2017 [44])Daily electricity consumption profiles from smart meters Climate, space heating, space cooling, andelectricity consumptionHierarchicalclustering and door to door surveys28
S14(Diao, Sun, Chen, & Chen, 2017 [45])Discovering electricity consumption over time for residential consumersOccupant behaviorK-means clustering72
S15(Nepal, Yamaha, Sahashi, & Yokoe, 2019 [46])Analysis of buildingelectricity use patternHuman activities and air conditioningK-means clustering14
S16(Jin et al., 2017 [47]) Comparison of clustering techniques for residential energy behavior using smart meter data Smart meter dataHierarchal clustering and K-means clustering25
S17(Carbonare, Pflug, & Wagner, 2018 [48]) Clustering the occupant behavior in residential buildingsWindow opening and indoor temperatureK-means clustering and time series 39
S18(Pan et al., 2017 [49]) Cluster analysis for occupant behavior-based electricity load patterns in buildingsElectricity profilesK-means clustering 17
S19(Diao et al., 2017 [7]) Modeling energy consumption in residential buildings Space heating, refrigeration, and air-conditioning K-means clustering and demographic-based probability neural networks72
S20(Tureczek, Nielsen, & Madsen, 2018 [50]) Electricity consumption clustering using smart
meter data
Smart meter dataK-means clustering with time series analysis23
Table 3. Summary of papers in the category of prediction of energy consumption of buildings.
PaperReferenceApplicationData DimensionsMethod and TechniquesNo. of Citations
S21(Braun, Altan, & Beck, 2014 [51])Predicting the future energy consumption of a supermarket in the UKClimate information, electricity consumption, natural gas consumptionMultiple linear regression172
S22(Wahid, Ghazali, Shah, & Fayaz, 2017 [52])Prediction of energy consumption in the residential buildingsOccupant behaviorMultilayerperceptron andrandom forest16
S23(Liu et al., 2019 [53])Machine learning model for forecasting energy consumption of buildingsWeather condition and building envelopeArtificial neuralnetwork and supportvector machine18
S24(T. Y. Kim & Cho, 2019 [54])Predicting residential energy consumptionIndividualhousehold power consumptionDeep neural network 67
S25(Jozi et al., 2019 [6])Decision support application for energy consumption forecastingTotal energy consumption and environmental temperatureNeuro-fuzzy algorithm15
S26(Moretti, Nassuato, & Bordoni, 2019 [55])Development of regression models to predict energy consumption in
manufacturing companies
Mean outdoor temperature and electricity dataMultiple linear regression12
S27(Berriel, Lopes, Rodrigues, Varejao, & Oliveira-Santos, 2017 [56]) Monthly energy consumption forecast: a deep learning approach Space heating and cooling, class of the customer, and average of the customer consumptionDeep neural network 41
S28(Edwards, New, & Parker, 2012 [57]) Predicting future hourly residential electrical consumption Billing electricity dataRegression model, feed forward neural network, and support vector regression262
S29(Rahman, Selvarasan, & Jahitha Begum, 2018 [58])Short-term forecasting of total energy consumption GDP, population, and GDP per capitaMultiple linear regression and simple regression model 15
S30(Wang, Wang, & Wang, 2017 [59])Influencing factors regression analysis of heating energy
consumption of rural buildings
Family basic information, rural residential building features, building envelope information, indoor air quality in winter, and building heating energy consumptionMultiple linear regression and logistic regression13
S31(Zekić-Sušac, Mitrović, & Has, 2021 [60])Machine learning based system for managing energy efficiency of public sector, as an approach towards smart citiesGeospatial attributes, construction attributes, heating attributes, and temperature attributesConvolution neural network with coefficient correlation, decision tree, and random forest 18
S32(S. Kim, Jung, & Baek, 2019 [61])Predicting energy consumption of buildings Electricity billing data of occupants Support vector machine13
S33(Bogner, Pappenberger, & Zappa, 2019 [62])Predicting energy consumption in public buildingsSpace heating and cooling and weather informationMultivariate adaptive regression splines, quantile regression, quantile random forest, gradient boosting machines, and nonhomogeneous gaussian regression 17
Table 4. Summary of papers in the category of combination of classification and prediction of energy consumption of buildings.
PaperReferenceApplicationData DimensionsMethod and TechniquesNo. of Citations
S34(Aqlan, Ahmed, Srihari, & Khasawneh, 2014 [33])A hybrid approach to assess energy efficiency of residential buildingsSpace heating and space coolingK-means clustering and artificial neural network14
S35(Jovanović & Sretenović, 2017 [63])A hybrid approach to predict heating energy consumptionIndividual heatingenergy consumptionRadial basis neural networks and K-means clustering12
S36(Banihashemi, Ding, & Wang, 2017 [64])Developing a hybrid approach of prediction and classification algorithms for building energy consumptionBuilding envelopes, building design layout Artificial neuralnetwork anddecision tree23
S37(Seyedzadeh, Rahimian, Glesk, & Roper, 2018 [65])Propose machine learning approach for estimation of building energy consumptionAmount of gas emission and CO2 emissionArtificial neural network and K-means clustering53
S38(Zekić-Sušac, Scitovski, & Has, 2018 [66])Prediction of energy efficiency of public buildings Geospatial, construction geometryArtificial neural network and K-means clustering16
S39(Tang, Lee, Wang, & Yang, 2019 [67])Leveraging socio-economic information and deep
learning for residential load pattern prediction
Socio-economic factors Deep neural network and K-means clustering16
S40(Cai, Shen, Lin, Li, & Xiao, 2019 [68])Presented a novel approach to predict electricity consumption in residential buildings Building characteristics and weather informationK-means clustering and support vector machine 20
S41(Gajowniczek & Zabkowski, 2018 [69])Simulation study on clustering approaches for
short-term electricity forecasting
Electricity profilesK-means clustering, neural network, and support vector regression 14
Table 5. Dictionary for the “energy” domain.
NrReduced TermSimilar Term
1consumptionreduce, minimize
2buildingsconstructing, structure
3occupantresident, inhabitant, habitant, consumer
4behaviorbehavior, conduct, attitude, action
5electricityelectro
6residentialdomestic, household, home
7publicgeneral, generic, common
8commercialmercantile
9patternssample, type, modality
10heatingwarming, hot, heat
11coolingrefrigeration, cool
12waterhot water, cool water
13climateweather
14gasnatural gas
Table 6. Dictionary for the “intelligent computing models” domain.
NrReduced TermSimilar Term
1artificial intelligencemachine learning, intelligent
2predict prediction, predictive, predicting, forecasting, forecast
3classification classifier, classifiers
4cluster clusters, clustering, K-means cluster, hierarchal
5model paradigm, sample
6method process, procedure
7analysis analytics, data sciences, data science
8efficiency performance, quality
9neural networkneural networks, feedforward, backpropagation, convolution, recurrent
10regression time series, linear, logistic
11decision treedecision trees, random forests, random forest
12optimizationoptimize
13approachapproaches
14studysurvey, experiment
Table 7. Inclusion and exclusion criteria.
Inclusion CriteriaExclusion Criteria
  • Responding directly to one or more of our research questions.
  • Published between 2013 and 2020.
  • Papers without experimental analysis.
  • Viewpoints, books, workshops, tutorials.
  • Position papers.
Table 8. Top 30 common terms ranked by higher word count, on the topic of “intelligent computing techniques” applied to energy.
RankTermCountRankTermCount
1consumption188116heat363
2buildings163917machine341
3predict95718paper341
4residential82519result330
5cluster67120network319
6model60521load308
7electricity55022behavior308
8method49523different308
9analysis48424neural308
10base45125perform297
11efficiency44026factor286
12occupant41827pattern286
13forecast40728regression286
14study39629learning286
15research38530approach264
Publisher’s Note: MDPI stays neutral with regard to jurisdictional claims in published maps and institutional affiliations.

