Article

Unintended Effects of Energy Efficiency Policy: Lessons Learned in the Residential Sector

1
Institute of Energy Systems and Environment, Riga Technical University, LV-1048 Riga, Latvia
2
Advanced Social and Political Research Institute, University of Latvia, LV-1019 Riga, Latvia
*
Author to whom correspondence should be addressed.
Energies 2021, 14(22), 7792; https://doi.org/10.3390/en14227792
Submission received: 13 October 2021 / Revised: 5 November 2021 / Accepted: 15 November 2021 / Published: 21 November 2021
(This article belongs to the Section G: Energy and Buildings)

Abstract

:
The European Union has set an ambitious goal to tackle climate change, and energy efficiency in the residential sector is among the measures required to close the gap between targeted and actual greenhouse gas emissions. While different policy tools have been applied, the diffusion rate of these measures remains low. A system dynamics simulation model of the residential sector was developed to assess the advantages and drawbacks of energy efficiency policy in the multi-family building sector based on experience accumulated over the last twelve years in Latvia. The model was validated in expert group model building sessions and with historical trends. Simulating the model, a hypothesis was tested that supported the idea that seemingly positive policy tools set the stage for a series of unintended adverse effects due to the complex interactions between different system components. The common assumption that information and financial support should result in significant energy efficiency diffusion proved to be wrong. It instead results in unintended long-term consequences that hamper national energy efficiency goals. The model carried out an analysis and brought insights for improving the effectiveness of government energy efficiency policy. It is concluded that models that broadly describe complex systems are needed to identify effective policies and foresee unintended side effects.

1. Introduction

The European Union set ambitious goals to tackle climate change in the European Green Deal [1]. One of the energy demand side sectors is the residential sector, accounting for 27% of the total final energy consumption [2], with space heating accounting for 62% of that.
Although energy efficiency can benefit the economy, society, and environment, the diffusion rate in the residential sector remains low [3]. The weighted annual building renovation rate in the EU is only 1% and it will take centuries to decarbonize the sector [4]. Various barriers deter energy users from the implementation of energy efficiency [4]. Research shows that the most critical factors during decision making are attitude and behavior [5,6,7,8,9]. Attitude does not always result in behavior, especially when external barriers influence the actual behavior of an energy consumer [6,10]. Studies [11,12,13] show that the more expensive an energy efficiency measure is, the lower the correlation between attitudes and values and actual behavior.
Policy tools have to address all barriers to reduce the efforts of decision making [14,15,16]. Although most of the barriers studied relate to market failures, economic and regulatory instruments alone cannot reduce the barriers related to individual behavior [3]. Other policy tools can be applied, such as regulatory, information, technical, financial, cooperative, voluntary, and obligation schemes [8,17,18,19,20]. An adequate targeting of policy is challenging because the accurate identification of the target audience and action to reach it is essential. The policy development process is context-dependent and complex as it involves the interests of various stakeholders [21]. For policymakers, justification of financial investments in policy has to be based on both short-term and long-term budget planning. Thus, policymakers view different policy instruments from a cost–benefit perspective [22].
The implementation of a single policy tool cannot achieve the desired result [23,24]. However, most current research mainly focuses on analyzing individual policy instruments, with less emphasis on the evaluation of policy instrument combinations [25]. It is essential to identify and assess the factors reinforcing or hindering the effectiveness of the interaction between various policy tools [7,26,27]. Wiese et al. [7] have summarized research on the interaction of different energy efficiency policy tools. They have found reinforcing effects between energy tax and energy efficiency obligation schemes/white certificates, financial incentives, regulatory environment, voluntary agreements, energy efficiency labeling schemes, information measures, and other policy tools. Those that simultaneously reinforce and mitigate include energy efficiency obligation schemes/white certificates and financial incentives, energy tax, and subsidies. An energy tax weakens energy efficiency standards while energy efficiency obligation schemes/white certificates mitigate voluntary agreements, financial incentives counteract energy efficiency standards, and subsidies weaken access to capital.
The EU Directive on Energy Performance of Buildings 2010/31/EU has helped to share experience among EU member states, increase cross-border investments in buildings, stimulate innovation, and increase competitiveness. However, the renovation rate remains very low, the existing legislative framework is insufficient to reach the goals of the Green Deal, and the renovation rate of buildings needs to be increased [4]. Therefore, the Green Deal is translated into the European Renovation Wave and contains an action plan with concrete regulatory, financing, and enabling measures to double the annual energy renovation rate of buildings by 2030. The Energy Performance of Buildings Directive will be improved accordingly [28].
Multi-family buildings are a significant consumer in the residential sector in many EU countries [1]. If individual owners own apartments, it can lead to a specific problem—the collective decision-making process required when building envelope and common space need to be improved. In countries wherein single owners own apartments in multi-family buildings, the decision on implementing collective energy efficiency measures, such as the thermal renovation of the building envelope, should be taken collectively by the majority (51%) of apartment owners. Therefore, the multi-family building sector is complex, deeply embedded in societal structures, and involves many stakeholders interacting in different feedback structures with nonlinear relations. Stakeholders include apartment owners, municipalities, housing maintenance companies, construction companies, municipal authorities, materials suppliers, energy service companies, etc. The problems observed in this kind of societal structure are challenging to manage and require addressing systemic failures [29]. An understanding of the underlying structures that drive the behavior of transitions is needed [30].
Social systems are multi-loop, nonlinear feedback systems. Many policy programs cause the reverse effect of desired results because people make the wrong decisions when faced with complex and highly interactive systems. This is due to how the human mind is not adapted to interpreting how social systems behave. In this case, policies only solve problems in the short-term because a self-regulating system is at work. Often, people blame outside forces for creating problems; however, a dynamic analysis shows that problems are caused by internal policies [31]. The impact of reinforcing feedback loops, such as the accumulation of knowledge [32], network effects [33], economies of scale [34], and adaptive expectations [35], has been observed prior to societal lock-ins of unsustainable behaviors [36]. The undesirable effects of policies can increase the frustration of society against actors that attempt to manage societal systems. However, there are no modes of behavior that are free of pressures and stresses. Many modes of behavior are possible, some more desirable than others, and a good understanding of the dynamic behavior of systems is crucial to finding sustainable behaviors in social systems [31,37,38]
The national energy efficiency goal for multi-family buildings in Latvia from 2008 to 2020 was set in cumulative savings and had to reach 2950 GWh by 2020 (Figure 1). It sums upwards from the national goal of 2008–2016 (2701 GWh) [39,40] and the goal of 2016–2020 (250 GWh) [41]. Since 2008, Latvia’s government has only relied on two energy efficiency policy tools in the sector, these being the financial support of 50% from EU funds and information activities (mainly grassroots activities via seminars in different municipalities). The data from energy efficiency authorities show that actual cumulative energy savings are much lower than expected and have reached only 15% of the goal (see Figure 1) [42].
Our study hypothesized that seemingly positive policy tools set the stage for a series of unintended adverse effects due to complex interactions between different system components, and that the common assumption that information and financial support should result in significant energy efficiency diffusion results hampers national energy efficiency goals.
The main goal of this study was to assess energy efficiency policy carried out in the multi-family building sector during twelve years of policy implementation, identify how different variables interact and respond to each other, and generate feedback mechanisms that ultimately give rise to unpredictable behavior, and, finally, to provide suggestions for further policies.
In the scope of the study, energy efficiency projects in multi-family buildings were defined as the renovation of collectively owned building elements by increasing the thermal resistance of the building envelope according to national energy performance standards, including insulation of external walls, roofs, basements, and main pipes, and changing windows.
The paper begins with an introduction, followed by a description of the methodology, a presentation of results, and our conclusions.

2. Methodology

The system under study is highly complex, and its different cause-and-effect relations, feedback mechanisms, and nonlinear relations control individual parameters. Therefore, system dynamics modelling was applied. System dynamics is a mathematical modelling approach pioneered by Jay Forrester [43] that accepts the multiple-feedback-loop and nonlinear nature of real systems. These models are not obtained statistically from time-series data but expose underlying system structures and the policies that guide decisions. System dynamics models do not depend on a shortage of information and data, which is one of the major drawbacks of other approaches, because available information about system structure and decision-making policies is sufficient [31].
The methodology presented in Figure 2 was applied. First, the previously developed dynamic multi-family building sector model was improved and supplemented [44,45] with a behavior sub-module by surveying multi-family building apartment owners and carrying out expert group model building sessions. In the second step, the model was validated using historical data and a group model building session. In the third step, the main factors impacting the success and failure of previous energy efficiency policies were evaluated. In the fourth step, the policies for assessing various scenarios for additional policies were developed. Parallel to that, an Internet-based interface for policymakers was developed.

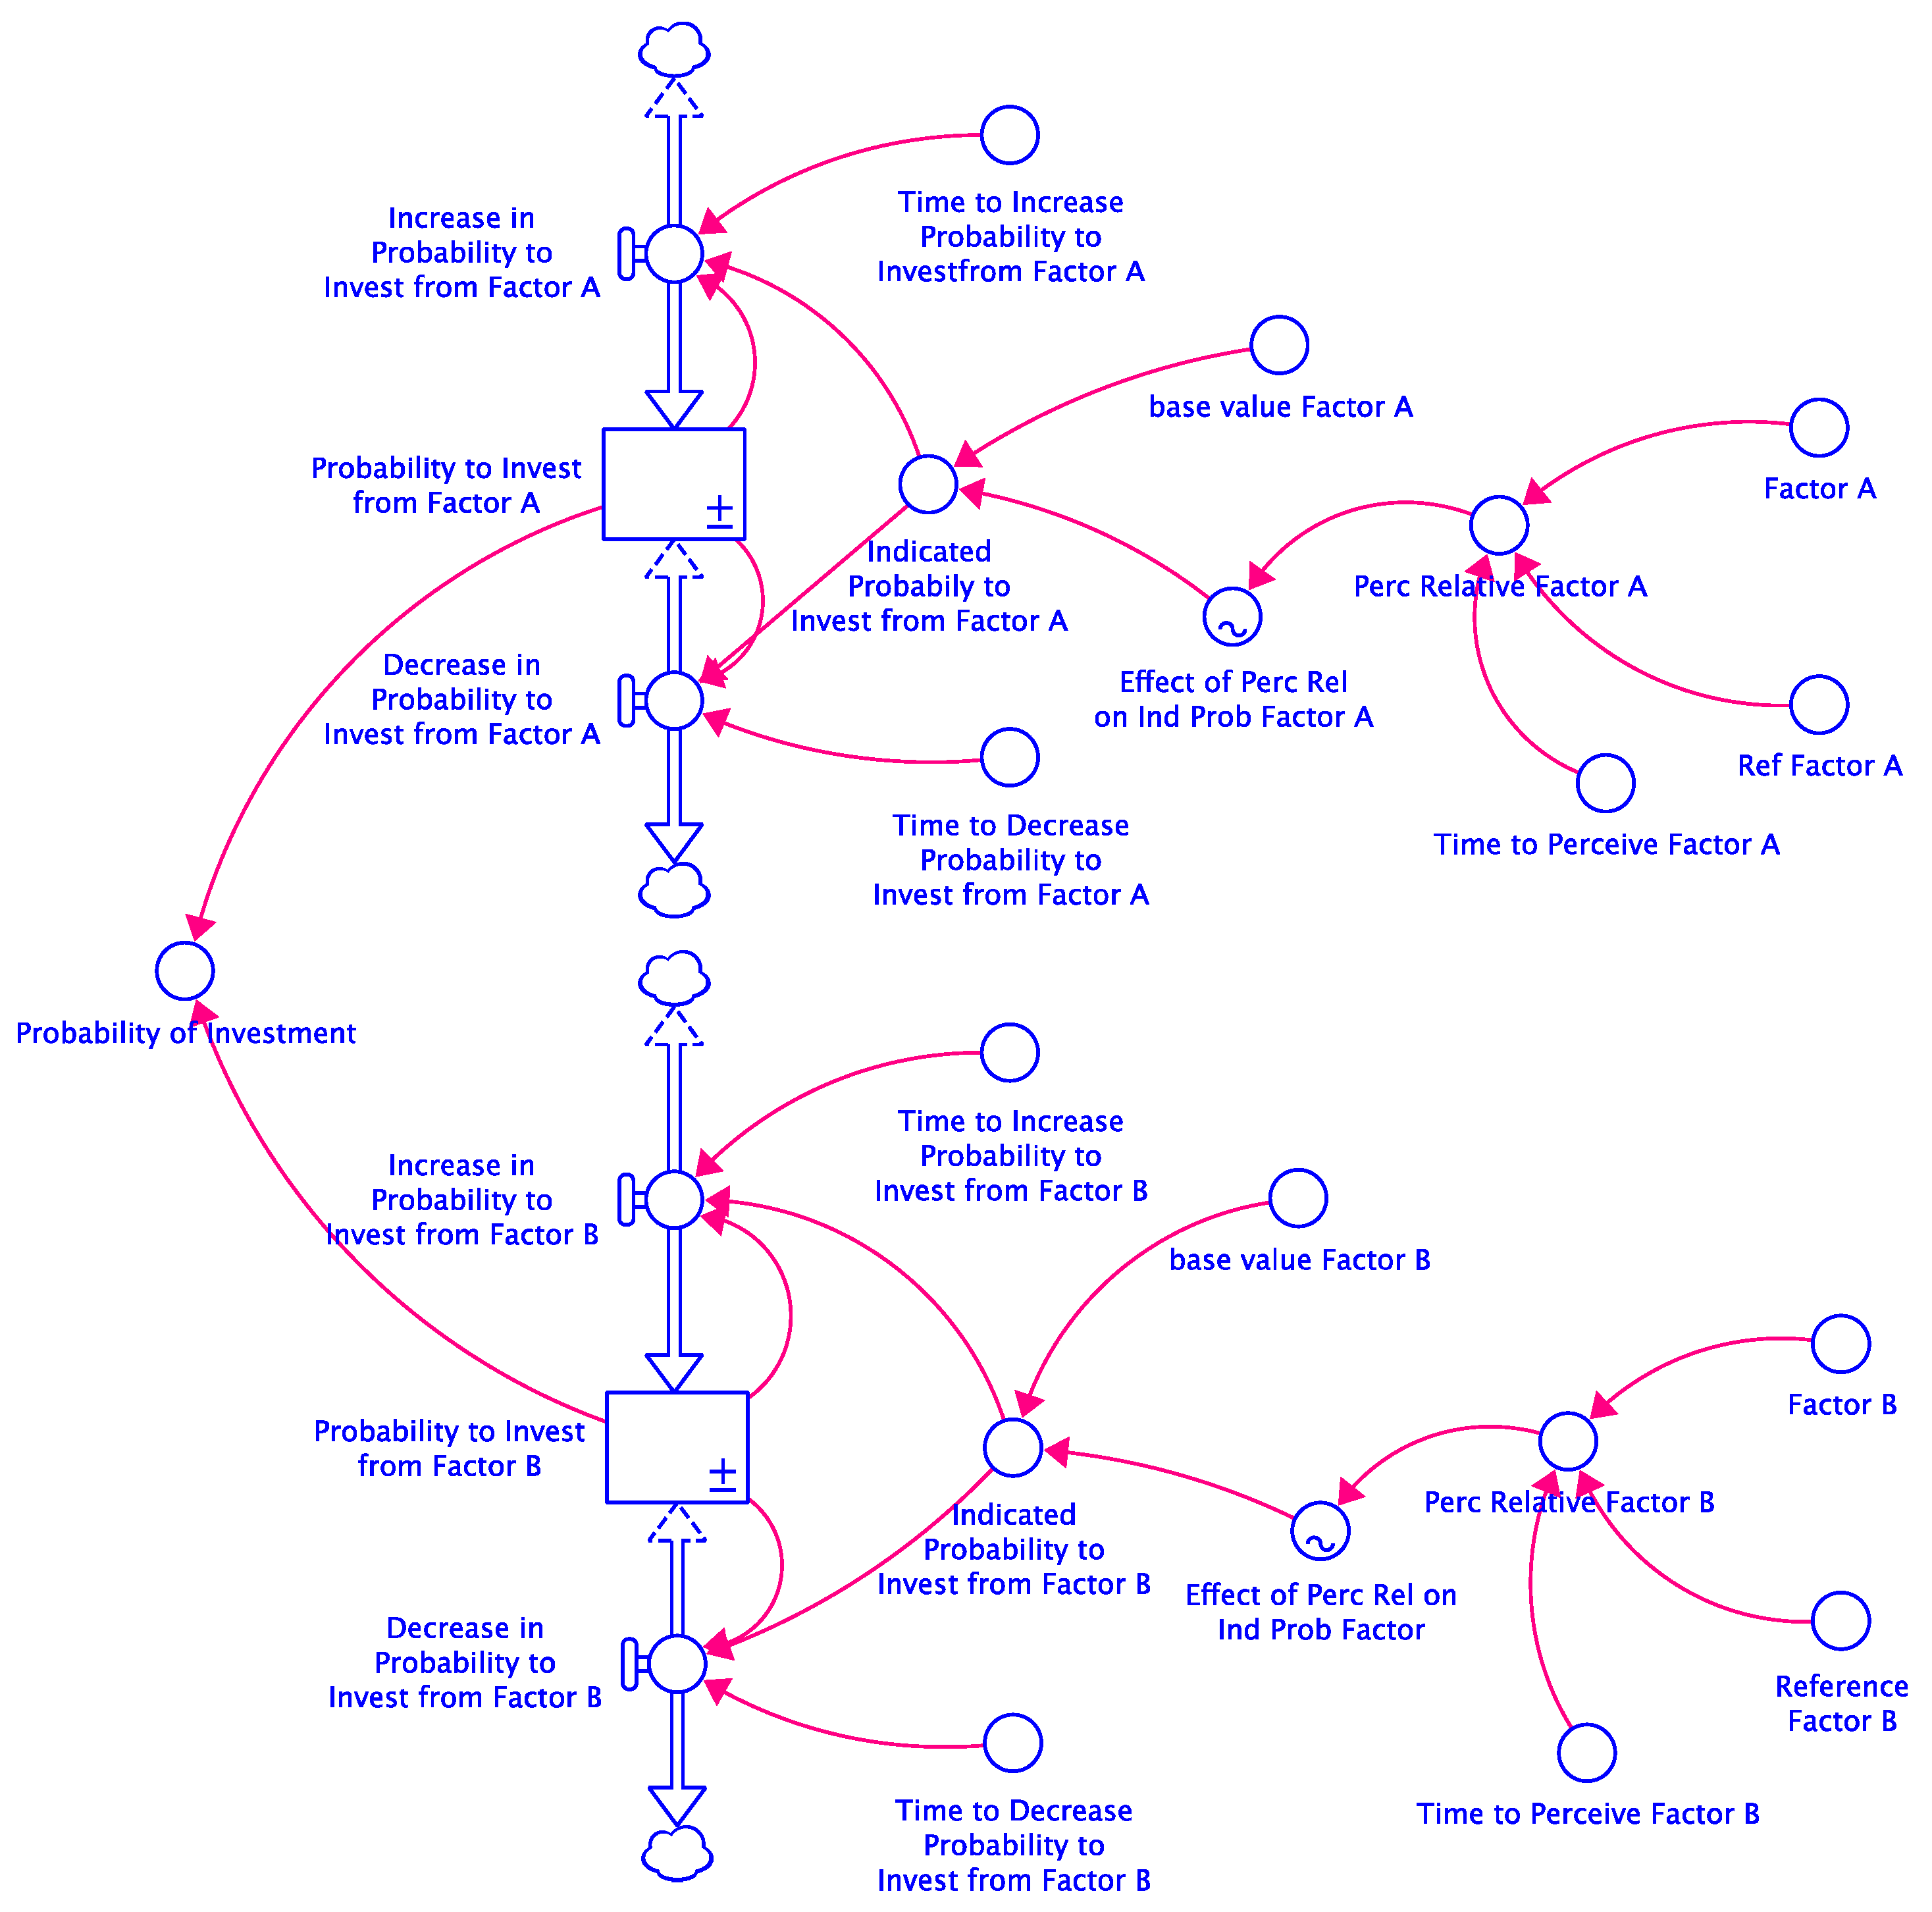
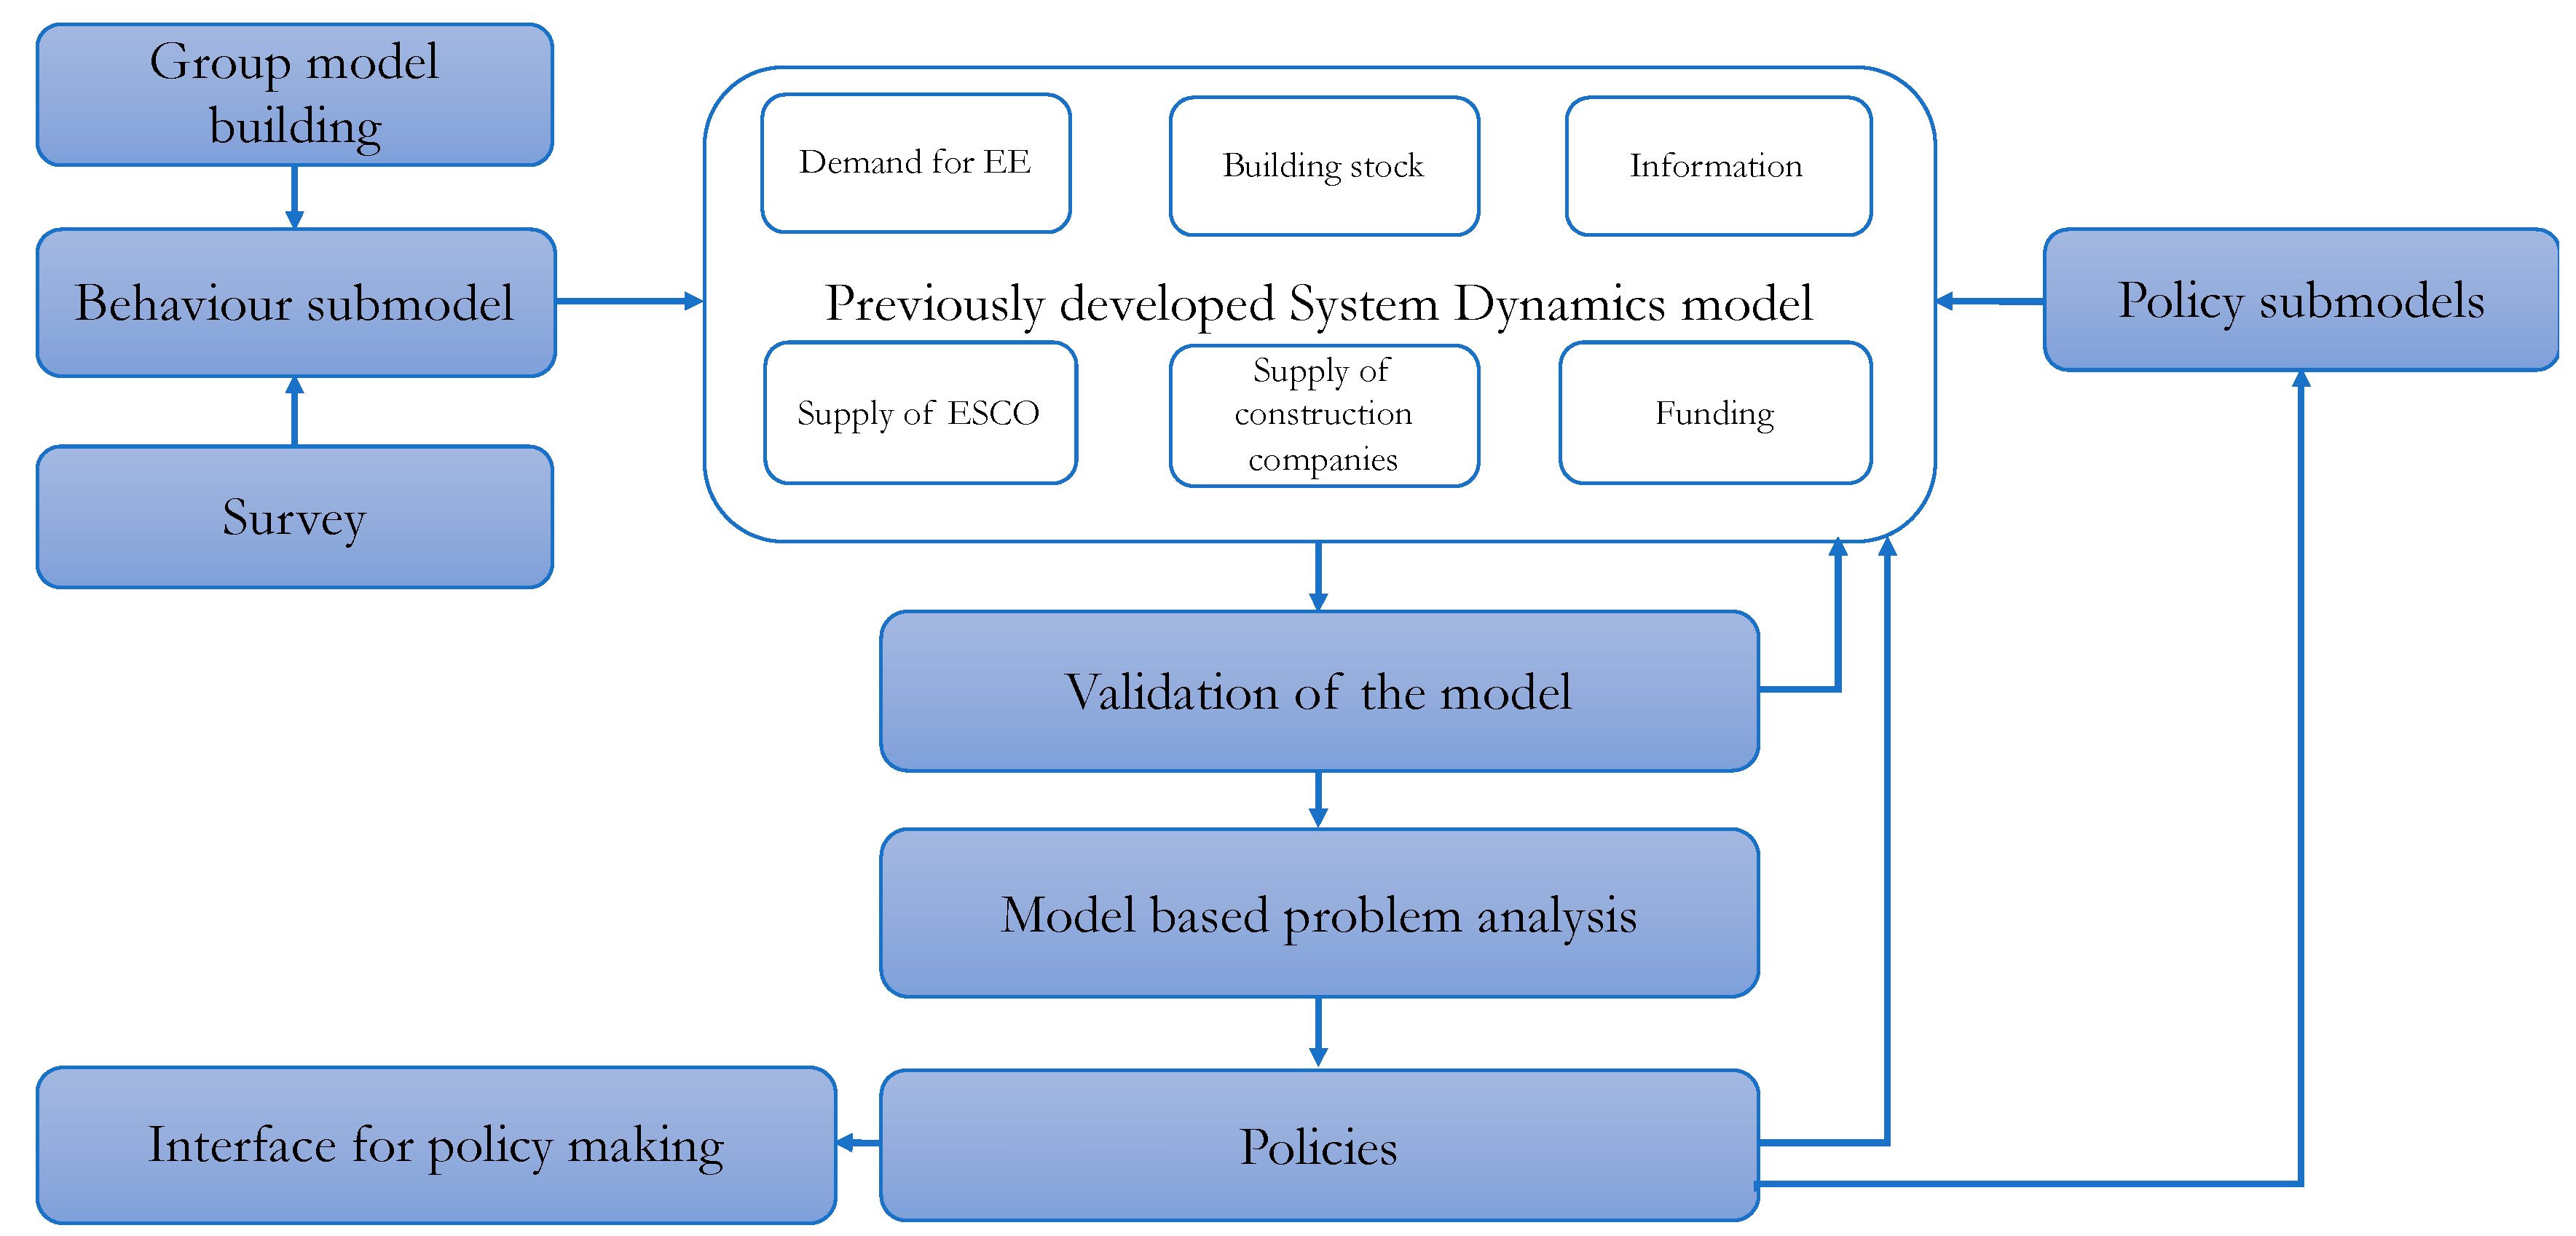
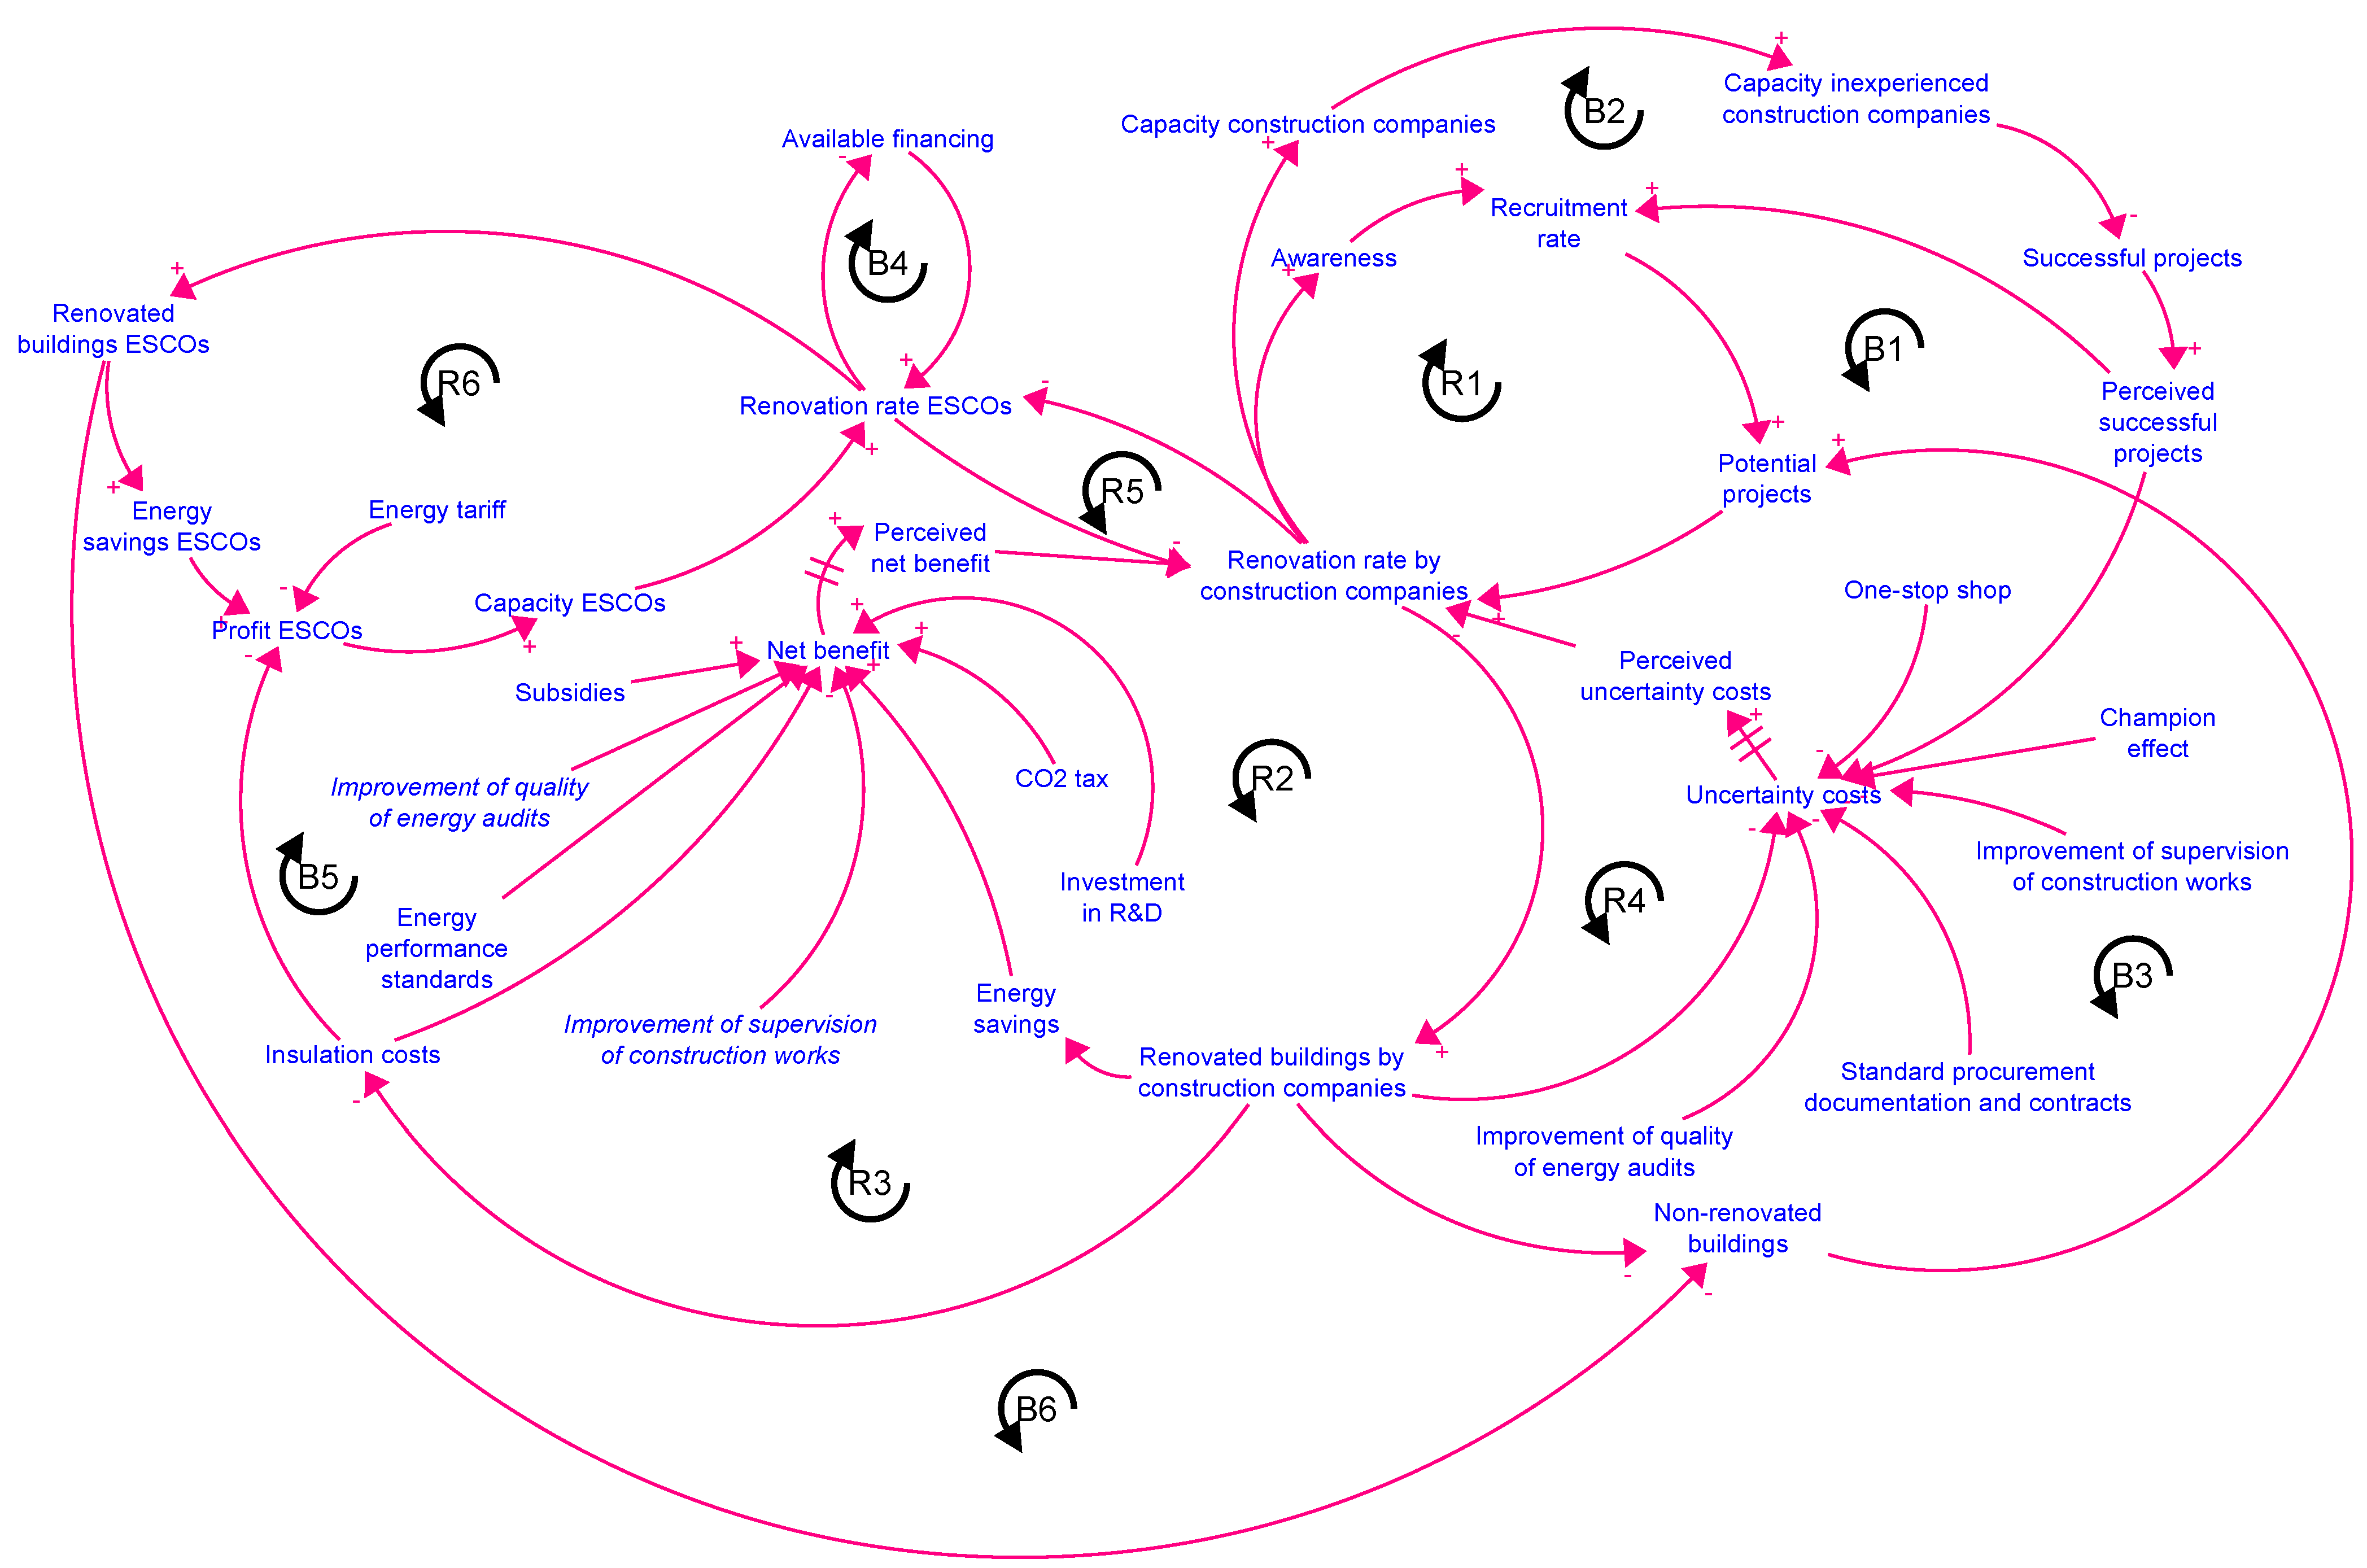
2.1. Model Structure

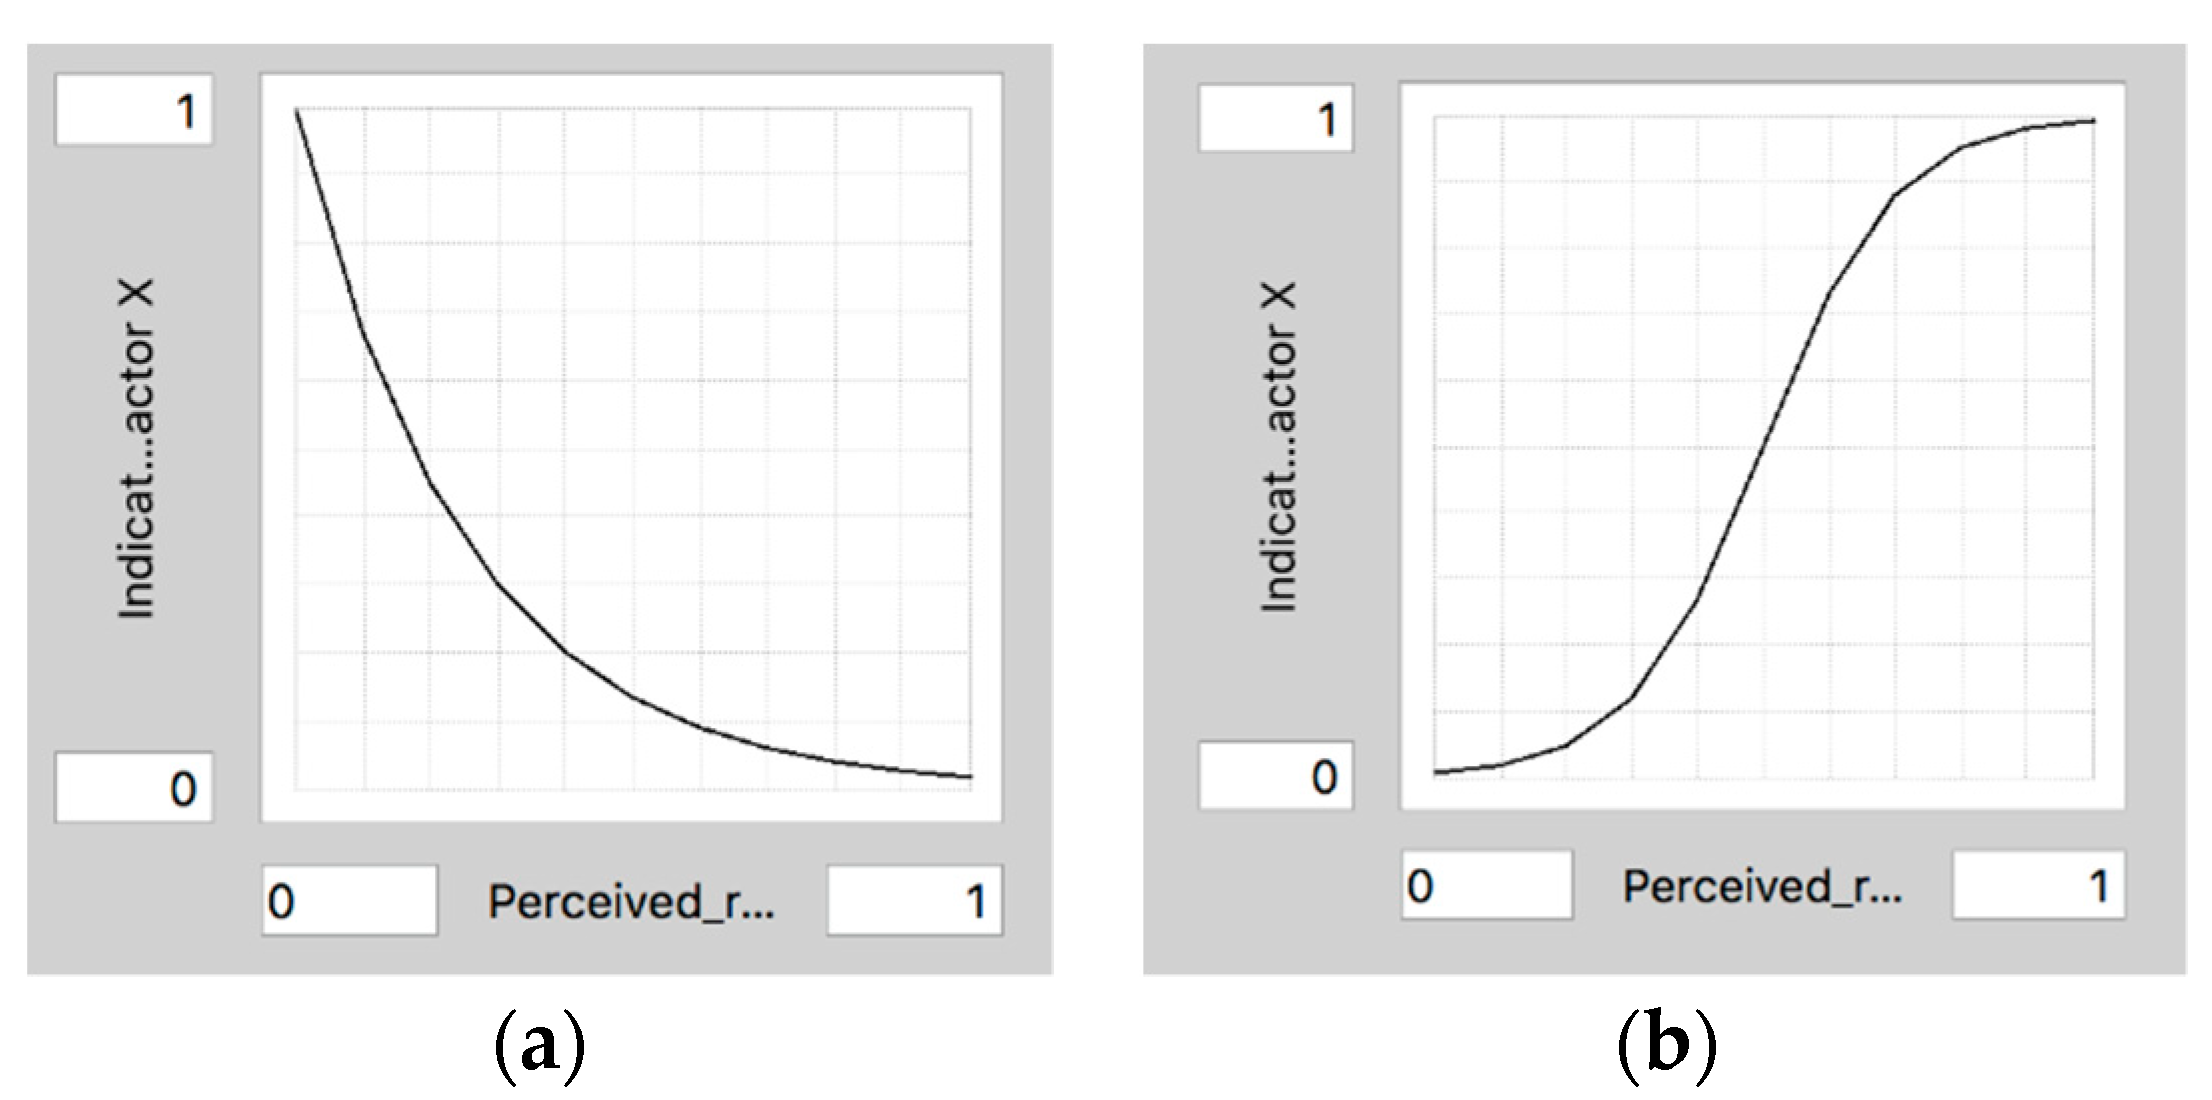
2.1.1. Underpinning Theory of the Model

The main driver of the energy efficiency diffusion process in multi-family buildings is the individual decisions of apartment owners to implement collective energy efficiency projects. Traditionally, behavior studies related to energy efficiency have been grounded in rational choice models, which assume that humans are rational agents and decide based on costs and benefits. However, rational choice models often cannot fully explain behavior, and other theories and models have been applied to describe wider dimensions, such as attitudes, beliefs, morals, habits, lifestyles, and social context. The data analyzed for Latvia’s multi-family building renovation projects support these findings and show that important factors other than wealth influence the progress of energy efficiency projects. The territory development level index and the number of renovation projects have been used to study whether wealth determines the renovation rate. The territory development level index [46] describes an area’s development level (region, city, district) in a given year relative to the national average. In order to make the indicators comparable, the standard values of eight different indicators with their weight in the calculation are used. These indicators for regions are as follows: Gross Domestic Product per capita (at current prices) (weight—0.3); unemployment rate (number of registered unemployed per working-age population) (weight—0.15); per capita income tax (weight 0.1); non-financial investment per capita (weight 0.1); demographic load level (0.1 weight); number of individual merchants and commercial companies per 1000 inhabitants (weight—0.1); density of population (weight—0.05); and changes in the population over the last five years (weight—0.1). Figure 3 illustrates that the territory development level index of the region/city did not correlate with the number of building renovation projects for the period 2008–2013. The region with the lowest score (Latgale) had as few projects as the richest city (capital city, Riga). On the other hand, three other regions (Kurzeme, Vidzeme, and Zemgale) had almost the same territory development level index, but the number of implemented projects differed 2.5 times between the highest (Kurzeme) and the lowest (Zemgale) numbers. The Riga region had a lower number of projects than Kurzeme but had a 1.5 times higher index. The same tendency for 2014–2020 was observed.
This study was based on the attitude–behavior–context model developed by Stern and Oskamp [47], accounting for motivations, attitudes and values, contextual or situational factors, social influences, personal capabilities, and habits. It is capable of describing and predicting pro-environmental consumer behavior and is rooted in Kurt Lewin’s “field theory” [48], which examines patterns of interaction between an individual and the total field or environment. Lewin’s “field theory” states that behavior is a function of a person and the environment. This approach suggests that a sophisticated policy approach is needed and should include different incentive structures; facilitation of conditions and situational factors; institutional, social, and cultural context; business practices and their impact; helping communities to help themselves; and its own environmental and social performance.
Energy efficiency projects are based on making decisions on various measures. The individual decision-maker must be able to move from attitude to action. The more barriers exist in a person’s path to action, the less likely it is that attitudes will turn into action. There are many different internal and external barriers to the implementation of energy efficiency measures. The causal model of behavior for energy efficiency measures in the residential sector [47] shows (see Figure 4) seven levels of causality that represent different groups of barriers: internal barriers (inner five circles) and external barriers ( outer two circles). The influence of levels changes from the external to the internal. The central circle contains resource-consuming or energy-saving behavior influenced by a long chain of causal relationships that run through the outer circles. Any outer circle affects the circles inside of it. For example, whether a person owns or rents a building (external incentives and restrictions) influences his or her attitude towards energy efficiency measures (attitude and confidence)—the building owner not only reduces the heating costs by insulating the building envelope, but also takes care of the visual appearance of the building. This could be why building owners know much more about energy efficiency technologies and materials than building tenants (knowledge) and are more interested in improving the building (attention and commitment). A circle rupture can create a situation wherein a person, convinced that building renovation will benefit the environment (attitude and confidence) does not implement energy efficiency measures (action) because of a lack of knowledge (knowledge) or commitment (attention and commitment). The barriers are low when a simple and inexpensive solution is available. If the barriers are high, education in the short term offers little to nothing except for overcoming the internal barriers (especially indifference and lack of information). The assumption that one can tell motivated people what to do and this will turn into action is wrong because there are many other significant barriers.

2.1.2. Previously Developed System Dynamics Model

In system dynamics, a stock and flow structure is used to simulate the behavior of the studied system and causal mapping is employed to study the causes of dynamics of a complex system with feedbacks and nonlinearities. In this study, the previously built structure of the multi-family building energy efficiency model was adopted [44,45]. Originally, this was developed based on mental models of experts, knowledge gained from literature reviews, and experience from projects implemented in the previous decade. Simulations of the model were used to assess the impact of different energy efficiency policy tools. The stock and flow structure of the model contained 173 variables and was transformed into a causal loop diagram. Figure 5 illustrates the system’s main feedback structure and helps capture the causes of dynamics, including the main variables and 12 causal loops (6 reinforcing and 6 balancing), dictating the dynamics of the residential building energy efficiency improvement process.
The main sectors included in this model are the demand and supply sides of the building renovation market. Non-renovated building stock represents the demand side, while the capacity and supply abilities of traditional construction companies and the energy service companies (ESCOs) represent the supply side. A balance between demand and supply is very significant for the overall system because it dictates the building renovation rate. Non-renovated buildings with high energy consumption and renovated buildings with reduced energy consumption are the main stocks. The renovation flow increases the number of renovated buildings at a certain rate, which depends on awareness, net benefits, and uncertainty costs. The net benefits are calculated as the financial benefit from renovation, i.e., saved energy costs minus investment costs. However, the renovation is slow even if the financial benefits are obvious. This is due to the barriers that discourage energy efficiency measures; for example, agreement with neighbors, efforts to overcome administrative barriers, attract funding, etc. Uncertainty costs represent these barriers in monetary terms. People are made aware of the importance of renovation in the recruitment process (reinforcing loop R1). This process can be encouraged with information campaigns such as for non-renovated buildings where uninformed people live and successfully renovated buildings govern. The latter gives rise to a word-of-mouth effect. When people are “recruited for renovation”, this increases potential projects and further increases demand. Increased demand leads to increased capacity, stimulating the conversion of buildings from non-renovated to renovated and further recruitment for renovation. The potential projects create demand and have an impact on perceived net benefits. The more renovated buildings, the higher the net benefits due to increased energy savings from the renovation process (reinforcing loop R2) and renovation costs (reinforcing loop R3). The costs are lowered due to the economies of scale, accumulation of experience, and the entrance of new companies into the market if other factors remain the same. A distortion of market forces, e.g., high entry barriers for new suppliers, may increase renovation costs. The model also considers the time required for construction services and materials suppliers to build up capacity, and spiking demand increases costs in the short term due to lack of supply. If the renovation costs are high due to external factors, market distortion, or insufficient supply, the net benefits decrease, and thus the rate of renovation decreases. When the renovation costs decrease, demand for renovation projects increases, reducing renovation costs further. Since the time between the event and the moment when it is perceived is often relatively long, an information delay is included in the link between the actual and the perceived net benefits. This delay can last for many years. Some people can completely ignore this information, and therefore the renovation process might progress very slowly. Demand for energy efficiency projects determines the supply of ESCOs and construction companies. Their capacity limits the supply of construction companies, and demand for their services depends on what is known about them, the net benefits, and uncertainty costs. The supply of ESCOs depends on company capacity, profitability, and available financing, but demand is related to the construction companies’ market share.
The introduction of a CO2 tax, the funding of research and development, the strengthening of standards, subsidies, and EU funding can increase net benefits (reinforcing loop R2). Balancing loop B1 shows the impact of the success of renovated projects. Information about unsuccessful and successful projects is received in the market by non-renovated buildings. This information impacts the value of the uncertainty costs; the more unsuccessful projects, the higher the uncertainty costs. The success rate of projects is perceived with a delay. The uncertainty costs decrease with the increased number of renovated buildings (reinforcing loop R4), which is perceived with a delay. The uncertainty costs can be reduced by the “champion effect” (a trustworthy apartment owner in a building who can lead the renovation project), introducing a “one-stop-shop” and the availability of the standard procurement documentation. Information on unsuccessful projects ends up with quality control bodies, which in turn act to improve the operations of construction companies, thereby indirectly increasing the net benefits and reducing the uncertainty costs. Reinforcing loop R6 illustrates that the supply of ESCOs is reinforced by profit, which depends on the energy savings achieved by the ESCO and the renovation costs. Growth generated by the R6 loop is balanced by loops B4 (the available financing), B5 (renovation costs), B6 (the depletion of the project source), and loop R5 (the market share of the construction companies). The ESCO reinvestment fund managed by the public agency can increase available financing. Demand for the services of construction companies is driven by reinforcing loops R1 to R4 that are balanced by three negative feedback loops, B1, B2, and B3. The B1 loop kicks in early because capacity grows at a very high rate. The number of inexperienced companies grows fast following the growth rate of demand, thus leading to an increasing number of unsuccessful projects. The fraction of successful projects of ESCOs is related to the learning effect on the completed projects. In the case of construction companies, the success fraction also depends on the ratio between the experienced and inexperienced companies. The reinforcing process of an awareness-raising campaign is balanced out by the B2 loop created by the impact of the unsuccessful projects generated by inexperienced companies. The B3 loop balances the diffusion process by depleting the stock of potential projects. Construction capacity adapts to demand with a delay, and a notable gap occurs between demand and supply; this has an impact on the renovation costs. As a result, a negative feedback loop weakens the demand.

2.1.3. Supplementary Sub-Model

In the original model, the decision of apartment owners was expressed with a single parameter named “uncertainty costs”. The higher the value, the higher the barriers to energy efficiency actions. Our study replaced this parameter with the stock and flow structure built on the attitude–behavior–context model [47]:
  • A group model building session for experts was carried out.
  • A survey was developed and carried out to establish motivations, attitudes and values, contextual or situational factors, social influences, personal capabilities, and habits that can describe and predict energy-efficient behavior.
  • A stock and flow structure was built.

Group Model Building Session

The system dynamics modeling process can take place in two ways—modeling projects and group model building. In modeling projects, one or more modelers develop the model by themselves and obtain the knowledge and necessary data from various sources, often from experts in the modeled system. In the second type of approach, system experts are not the only source of information because the process involves both experts in system dynamics and stakeholders whose knowledge of the system is essential for model development. This approach increases the relevance and usefulness of the model [49]. In addition, group model building sessions help develop a comprehensive understanding of the system’s scope and guide the actions taken while providing benefits at the individual and collective levels. At the individual level, it improves the mental patterns of the participants. At the collective level, it makes it possible to harmonize mental models, reach a consensus on decisions, and involve the group in those decisions. [50].
Two group model building sessions were carried out with experts to elicit knowledge from the stakeholders and experts. The first session with ten energy efficiency experts was held on 20 March 2019 to list the barriers to implementing energy efficiency measures and the policy instruments to overcome these identified barriers. This working group aimed to prepare for the second model building working group, and experts were asked to freely name barriers to energy efficiency without prior preparation. On 3 April 2019, the second group model building session took place. Twelve participants were asked to define a dynamic problem in the housing energy efficiency sector, identify factors affecting this system, and define causal relationships, feedback links, and delays.

Survey

A survey was carried out to establish the statistical relationship between different factors and the readiness to invest in energy efficiency in multi-family buildings. In order to be representative, the survey was conducted as part of an omnibus survey of all Latvian inhabitants. One thousand and fourteen respondents were interviewed by the pollster SKDS in February 2020. Only respondents’ responses from the target group (people who or whose family members own an apartment in a non-renovated pre-1991 multi-family building) were collected. The other respondents were not interviewed further, e.g., people who lived in single-family homes or apartment buildings built after 1991 that are much more energy-efficient or people who rented their flats, presuming that they would have much less interest in energy efficiency or renovation of their homes. Finally, 379 target group respondents were interviewed in more depth.
The survey included a wide range of factors that could affect the readiness of individuals to engage in improving the energy efficiency of their homes. The main goal was to identify factors that could significantly impact a person’s readiness to improve the energy efficiency of his/her property. The first group included demographic factors such as age, sex, profession, or education. The second group focused on economic factors such as income level and willingness to pay for the renovation expressed as a possible increase in the currently paid energy bills by a certain sum dependent on the apartment size. The third group included attitudinal and value factors, as well as factors of social capital. These included questions on whether the respondent was satisfied with the housing maintenance services (since the housing maintenance company is often assigned to be responsible for organizing the renovation works); whether the person considered his/her flat as a long-term investment; and his/her awareness of climate change. An important issue here was the ability of owners to co-operate among themselves because, due to the fragmented house ownership structures, its absence is often an obstacle to renovation. The survey also asked questions about the trust among flat owners of the respondent’s house, the assessment of the readiness of others to participate in the renovation, the presence or absence of a natural “champion”, i.e., a person with leadership qualities among the flat owners who might be endowed with organizational responsibilities.
The obtained data were analyzed with linear regression analysis. Different demographic indicators (sex, income, regional affiliation), different scales (Likert scale, monetary values), and ranges were used; the beta coefficients for each particular question were calculated. The question on owners’ readiness to support the initiative of implementing energy efficiency measures (in the interviews, this was termed as “insulation”, which means a reduction in heat transfer through the building envelope) of the apartment building expressed as an agreement with the statement “I am ready to support the initiative of my neighbours, not to initiate it myself” was used as a dependent variable. On the scale from 1 to 10, with 1 meaning “totally agree” and 10 meaning “totally disagree”, the values were distributed relatively evenly (see Figure 6). This means that, on average, there was still no consensus among Latvia’s inhabitants on whether it was worth participating in the insulation of their homes.
After performing linear regressions of this question to other factors, beta coefficients were calculated. This was performed by evaluating, one-by-one, the influence of different factors on the dependent variable. These regressions show to what extent the readiness to participate in home insulation increases with a change in a particular value—in this case, demographic indicators, the willingness to pay, values and attitudes, and social capital. According to the regression results, the highest and statistically most significant beta coefficients were associated with the factors presented in Table 1.
The factors with the highest beta coefficients were divided into four groups. First, there was a group of factors (1, 2, and 5) that indicated the respondents’ awareness of the benefits of insulation, its necessity from the point of view of energy efficiency, the fact that people can benefit from it, as well as how it is a reasonable investment in the long term. These factors suggest a positive cognitive attitude towards house insulation and awareness of its benefits.
The second group of factors (4, 8) dealt with the relationship with the housing management company, which, at least in the Latvian context, is often seen as an institution “in authority” and responsible for all improvements in the house. If the housing management company supports the insulation project, the respondent is more inclined to support it. This means that strengthening the role of the housing management company could also improve the insulation rates. According to Question 8, the willingness to delegate the management of insulation works to the housing management company was positively related to the willingness to support it.
The third group of factors (6, 7, and 9) related to “horizontal” factors of interpersonal relations among flat owners: social capital, peer pressure, and mutual trust. As indicated in previous research [44], a natural “champion” among the inhabitants strongly motivates the insulation support. If the majority opinion supports insulation, the respondent is more likely to support it, and the confidence in the capacity to act together is a significant factor.
The fourth group of factors (10, 11, 12, 13) was related to the willingness to pay for the building’s insulation and organizational expenses.

System Dynamics Model

In the previously developed model, apartment owners’ decision making was based on taking energy efficiency measures on net benefits and inconvenience costs. In our study, a decision-making module replaced the costs of inconvenience. This module models the impact of various factors influencing the decision-making process unrelated to costs in more detail. The module’s structure was based on the survey and the results of the group model building sessions. Figure 7 illustrates the generic stock and flow structure of this sub-module. The structure was filled in with the factors obtained from the survey.
The actual value of any factor is the value of each factor that is currently in the real system; it can be determined by either experts or surveys. The reference value of any factor is the value at which the probability of investing in energy efficiency is 1. It takes time to perceive information, and this is presented in the model as the time to perceive changes in a factor. The perceived relative value of a factor is calculated as delay function to exponentially smoothen the input over an averaging time (SMTH function):
PR = SMTH ( F R F ;   t perc )
where
PR—perceived relative value of a factor;
F—actual value of a factor;
RF—reference value of a factor;
tperc—time to perceive changes in a factor (years).
The effect of perceived relative change in a factor on the indicated probability of investing in energy efficiency is nonlinear. It can have different shapes depending on the relationship found in the real system (see Figure 8). Figure 8 illustrates the effect of the indicated probability of investing in energy efficiency on (a) additional payment for energy efficiency measures added to the monthly housing management fee, (b) other factors.
The shapes of the effects (see Figure 8) are assumptions regarding what a response to the factors or actual behavior could be. To our knowledge, there are no data available for a more detailed quantitative characterization of the shapes, and this remains as future work to be performed. The indicated probability of investing depends on the effect of perceived relative change in a factor on the indicated probability and the base value of a factor. Base value (from 0 to 1) shows the probability that an investment will be made in energy efficiency measures even if the relative change perceived by the factor is minimal, i.e., there will always be individuals who will take action, even if the probability is very low. Indicated probability to invest is calculated as:
IP   =   E   ×   BV ,
where
IP—indicated probability to invest in energy efficiency measures;
E—effect of perceived relative change in a factor on the indicated probability of investing in energy efficiency;
BV—the base value of a factor.
An increase in probability to invest is an inflow and is determined as:
  InP = if   IP > P   then   IP P t   else   0
where
InP—increase in probability to invest in energy efficiency measures;
t—time to increase probability (years);
IP—indicated probability to invest in energy efficiency measures;
P—the probability of investing from a factor.
A decrease in probability to invest in energy efficiency measures is determined as:
DeP = if   IP < P   then   IP P t   else   0
where
DeP—decrease in probability to invest in energy efficiency measures;
t—time to decrease probability (years);
IP—indicated probability to invest in energy efficiency measures;
P—probability to invest from a factor.
The probability of investing from a factor is the calculated accumulation at every time step (t) determined by the initial value of the stock at a time (to) and the inflow of an increase in probability and the outflow of a decrease in probability. For example, if the value of a factor remains constant over time (e.g., housing maintenance company support does not change and remains as low as at the beginning of the simulation), the probability of investing also does not change and increases as soon as the inflow kicks in:
  P = t 0 t InP ( t ) dt DeP ( t ) dt + P ( t 0 )
Total probability (Ptot) of investment is a multiplication of all probabilities from different factors:
P tot = P 1   × P 2 × × P n
The generic stock and flow structure module was applied to all factors determined during the survey, including seeing long-term benefits, support from the housing management company, the presence of “a champion” in the house, positive attitudes towards energy efficiency, knowing someone who lives in a renovated building, additional payment for energy efficiency to the monthly housing maintenance fee, assurance of benefits, and trust in neighbors.
The structure of the previously built system dynamics model calculated the additional payment for energy efficiency to the monthly housing maintenance fee where supply and demand determine costs of energy efficiency measures. The reference value for this factor changed in the range from 0 to 2 EUR/m2/year. For other factors, the reference value changed from 1 to 10. The actual values of other factors were determined by experts during group model building sessions or from the survey, except for the actual value of the factor “knowing someone who lives in renovated building”, which was determined by a feedback link from the share of renovated buildings from the previously built model structure. The time to perceive and change probability was three years.

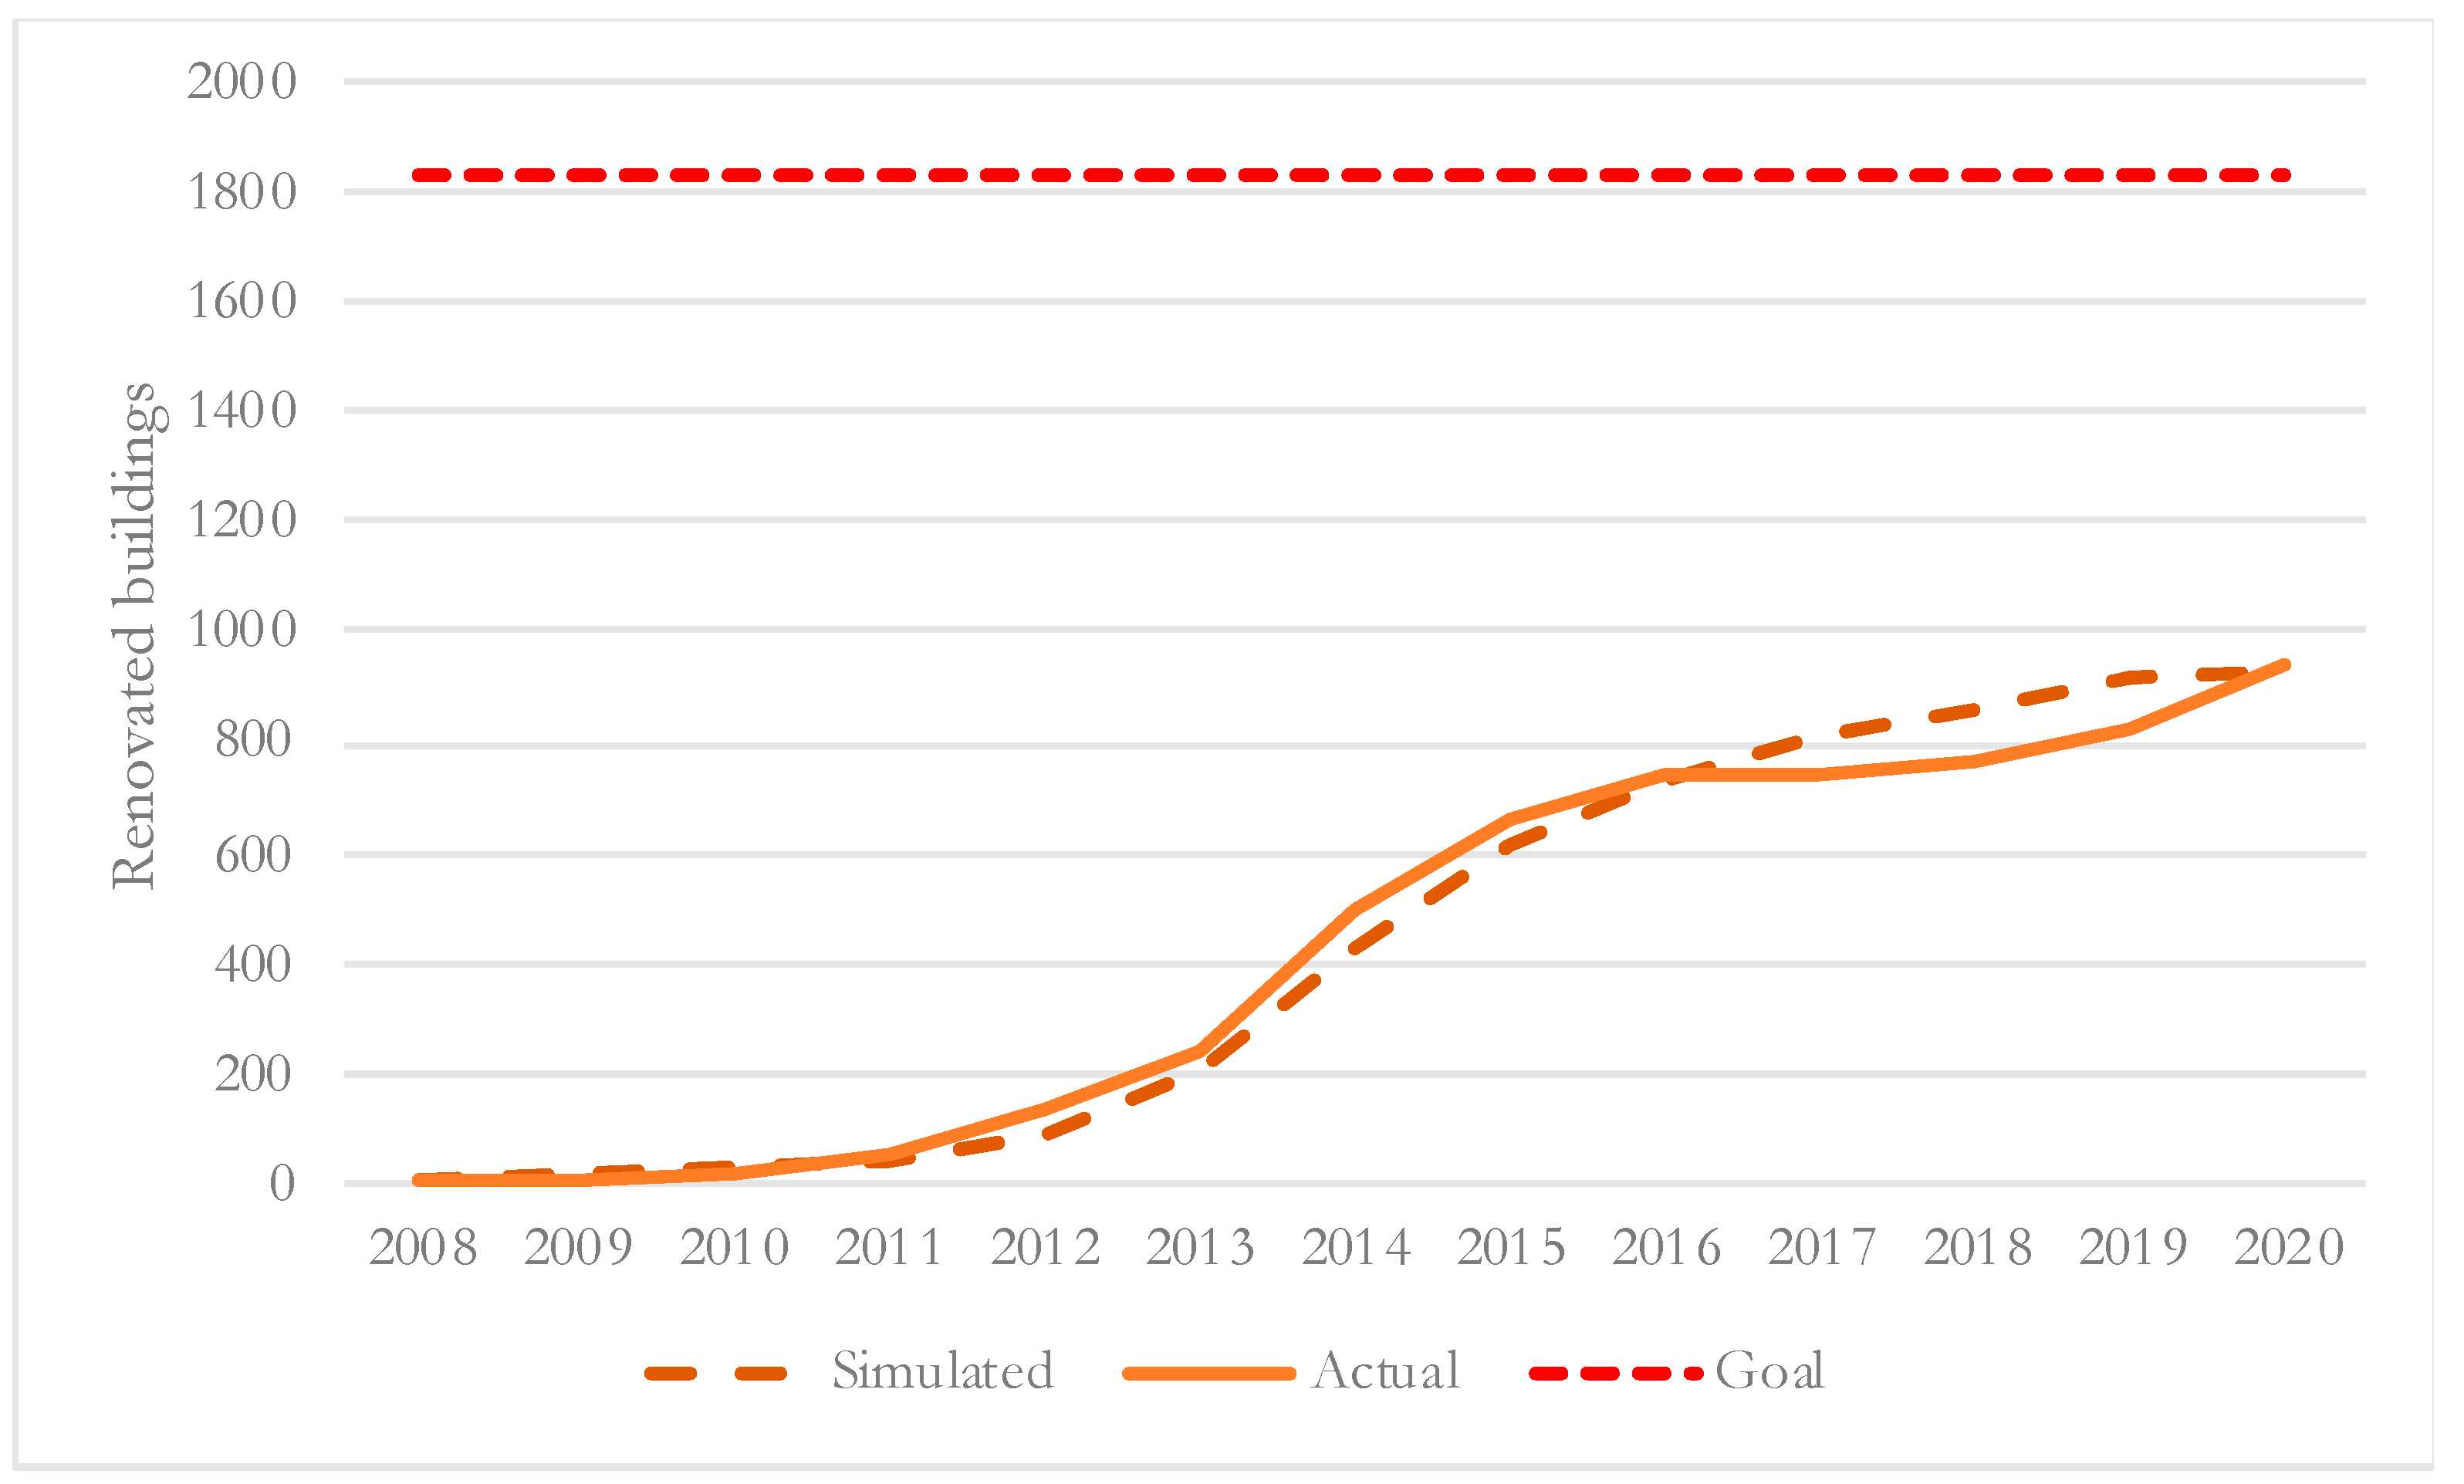
2.2. Validation of the Model

System dynamics models are causal-descriptive or theory-like models (“white-box”) for which causality in a structure matters. These differ from correlational or data-driven models (“black-box”), for which an aggregate output behavior of the model matters. For the white-box model, the validity of the internal structure of the model is crucial, while accurate output behavior is not sufficient for the validity. Furthermore, the validation of the structure of a system is the central issue if causes of behavior have to be explained and changes in behavior are needed. The main goal of validation is to build confidence that the model can generate the “right output behavior for the right reasons” [51]. Validation tests are based on comparing models with empirical reality [43].
First, structural and behavior tests were carried out to validate the model according to [51]. After that, the new sub-model of decision making was validated by an expert group model building session with 15 participants performed online on 7 December 2020. Participants were asked to provide feedback on the structure of the model (parameters, feedback links, delays, effect of perceived relative change in a factor on the indicated probability of investing in energy efficiency (Figure 8)). Participants were asked to run simulation rounds of the model interface available on the Internet and created for the needs of the group model building session, and provide feedback on the system’s behavior and how it coincides with their perception of the real system. Then, participants were asked to provide feedback on whether the structure of the model corresponded to reality and if behavior corresponded to reality, whether all energy efficiency barriers were addressed by the model, whether feedback corresponded to reality, the time needed to perceive changes in any factor, and the time delay between perceiving information about changes in factors and real action. The experts were positive about the model’s structure and behavior and confirmed that it performed as they expected. Finally, all comments provided by the experts were carefully analyzed in order to make improvements to the model.
Finally, validation of the model was performed with the historic data for a cumulative number of renovated multi-family buildings [42] compared with simulation results. Figure 9 shows that the model generated similar behavior to real observed behavior.
The national goal set for 2008–2020 (see Figure 9) regarding the cumulative number of renovation projects was 1830 buildings. By the end of 2020, 51% of the national goal was reached. However, due to a delay in the project finishing, additional projects are being implemented between 2020 and 2023, thus reaching 71% of the goal. The cause of the difference observed between cumulative savings (Figure 1) and the cumulative number of projects (Figure 9) may have been caused by overestimating savings per building when the policy was planned.

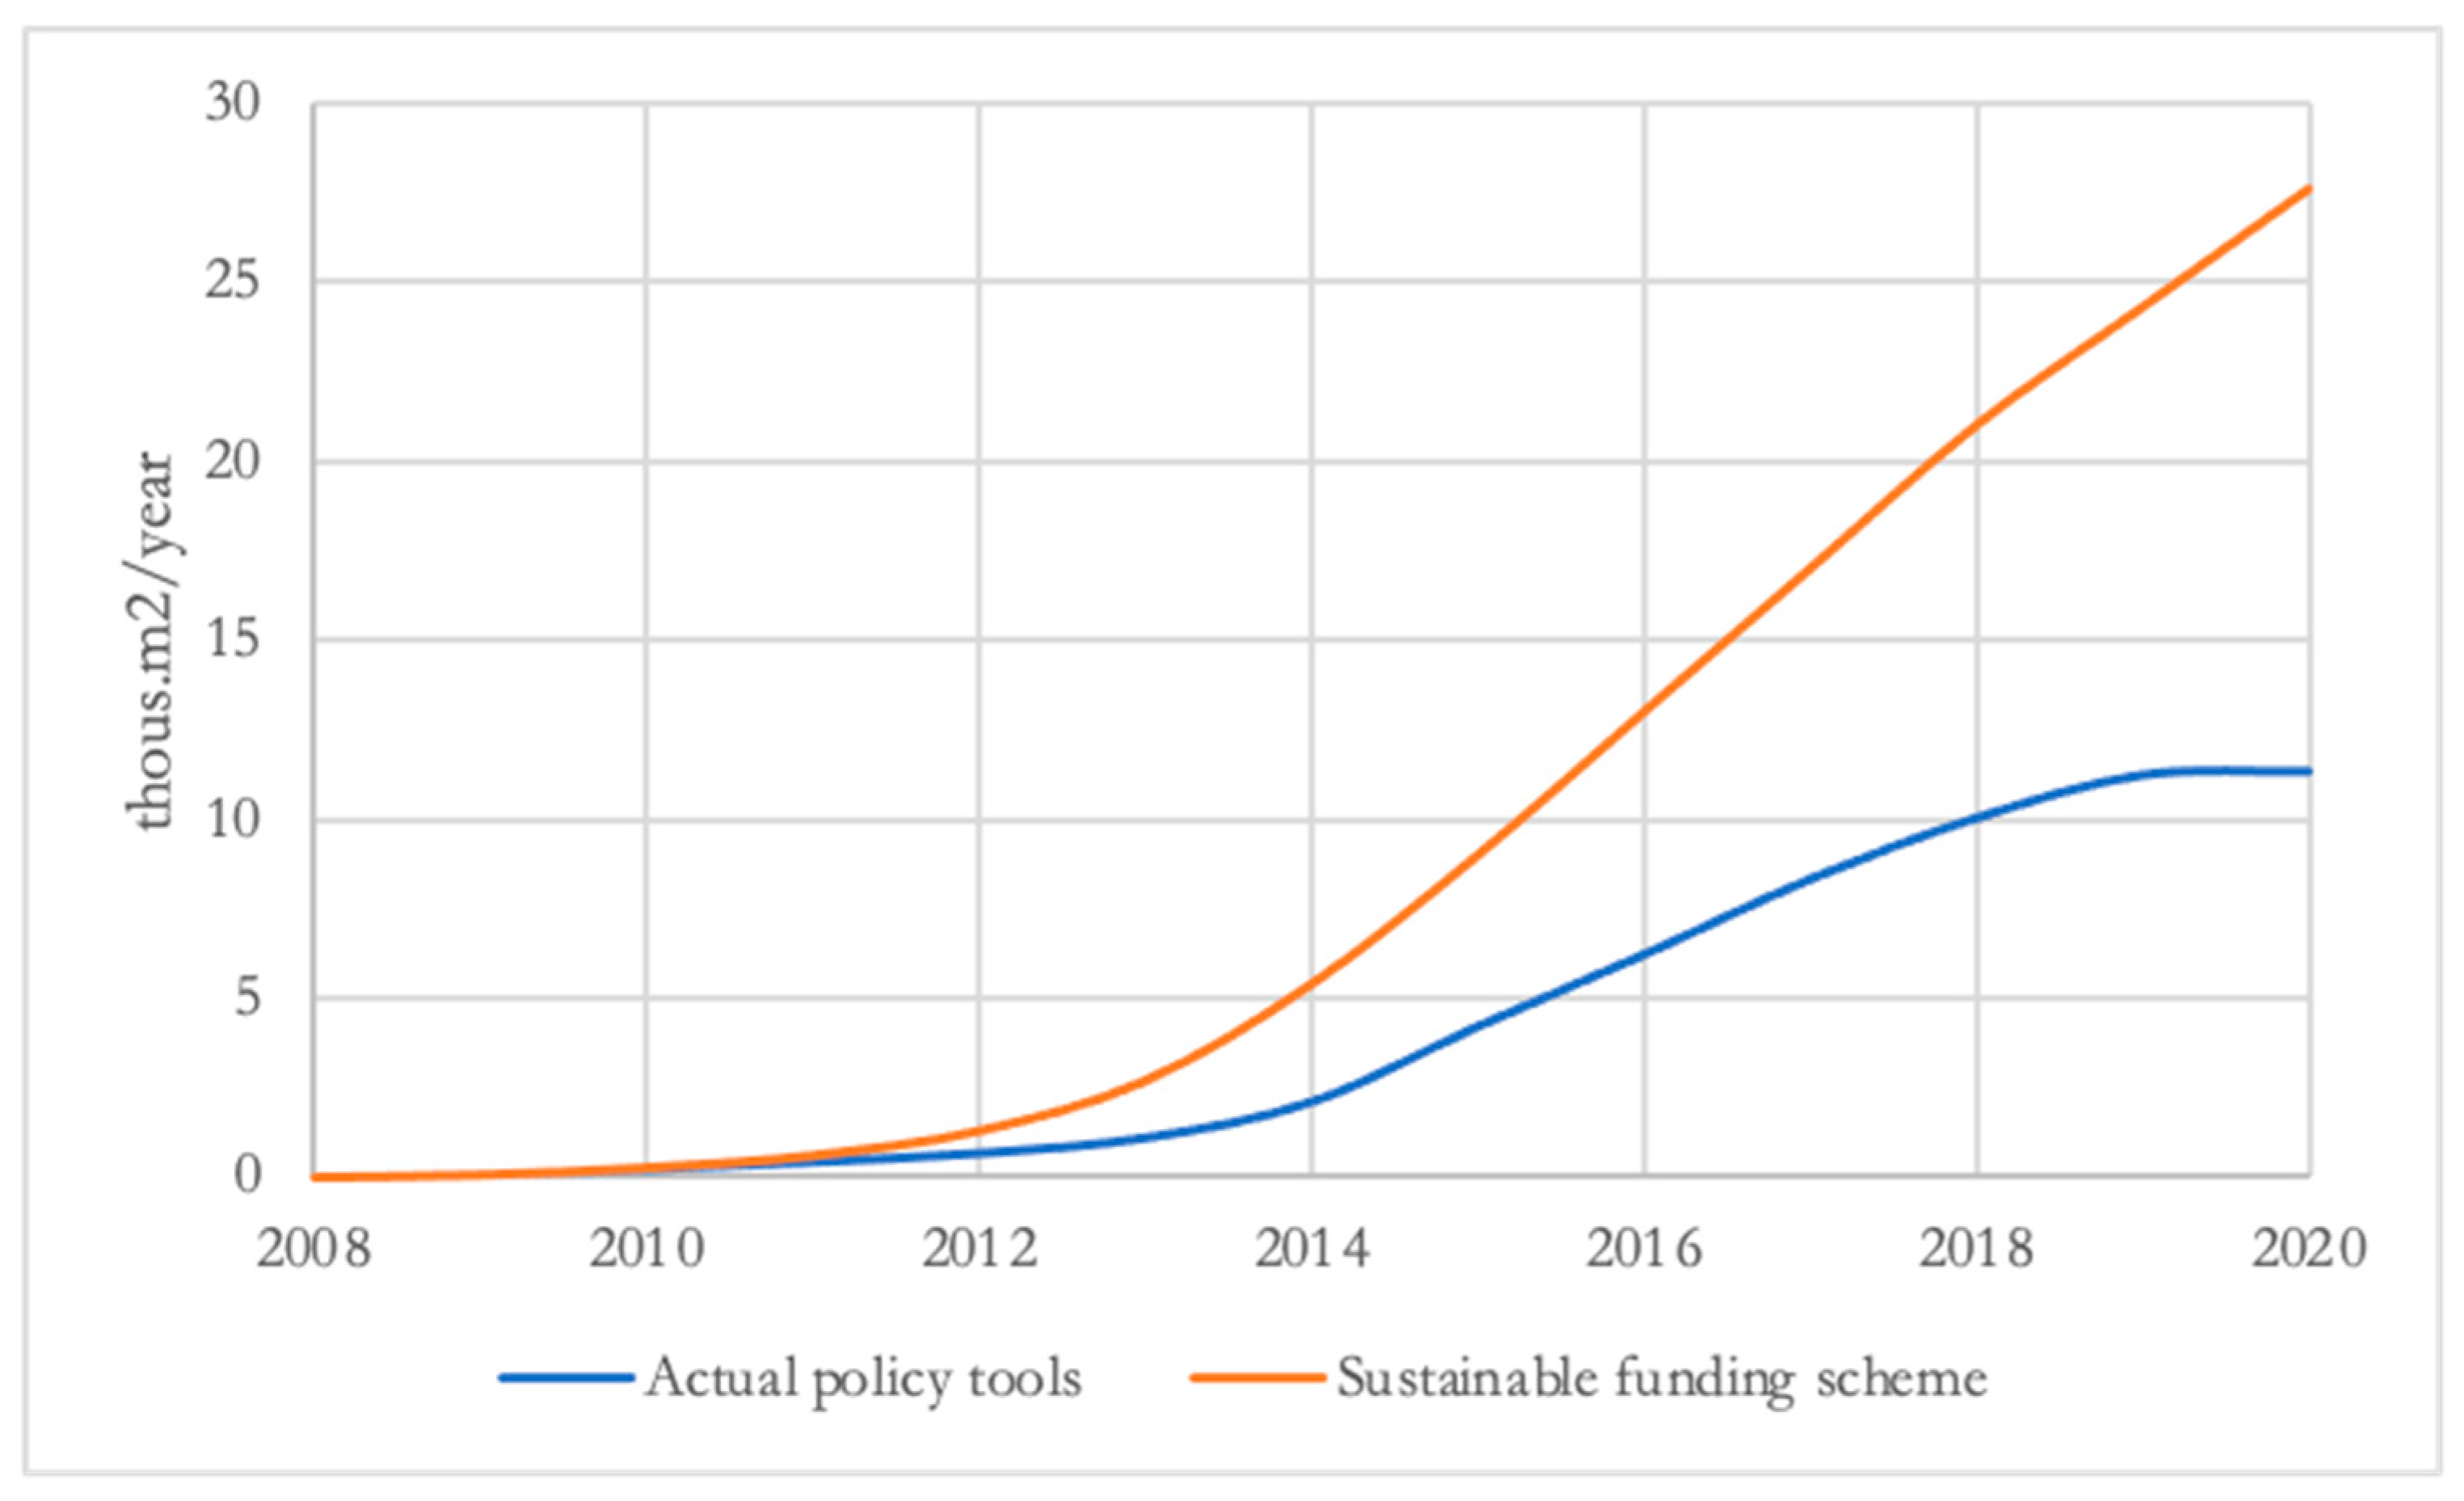
2.3. Policy Interventions

The government only applied two policy interventions between 2008 and 2020: the co-financing from EU funds and the information distribution through a grassroots approach. Both policy tools were included in the original system dynamics model structure. A stock of EU funding increases with an inflow from EU funds and decreases with the number of financed projects. Information measures change the flow between uninformed building owners and informed building owners, and further reduce uncertainty costs. The original model included other policy tools (described in the section, Previously Developed System Dynamics Model).
In this study, policy tools were adjusted to the new structure. Changes in the values of factors increase the probability of investments in energy efficiency measures: well-targeted information measures increase the value of seeing long-term benefits, assurance of benefits, support from the housing management company, and trust in neighbors. A support program for “the champions” increases the presence of “a champion” in the house. Financial support reduces the additional payment for energy efficiency to the monthly housing maintenance fee. Feedback from the stock of insulated buildings increases the value of the factor “knowing someone who lives in a renovated building,” and feedback from the share of successful insulated buildings increases the value of the factor “positive attitudes towards energy efficiency”.
Two new policy tools were added to the structure. First, a reinvestment fund for energy service companies was added to support the diffusion of this business sector in multi-family building energy efficiency projects. The stock of reinvestment funding was increased from the ESCO savings and spent on energy efficiency projects. Second, a penalty–reward scheme supplemented the currently used EU funding scheme. A penalty–reward scheme as a sustainable support scheme was added to reduce the negative impact of oscillating EU funding schemes. It was based on real estate tax and the ratio of the actual energy consumption of a building to the value based on the current building standards (see Figure 10). The applicable real estate tax rate was estimated using willingness to pay values obtained by the housing management companies. Apartment owners were ready to pay more for energy efficiency projects on average up to 1 EUR/m2/month. The first year tax is lower and increases every year. If the ratio between the current building standards and the actual energy consumption is one, then the tax rate is zero and increases as the ratio falls below one. The apartment owners can decide whether to pay more significant taxes or implement an energy efficiency project.

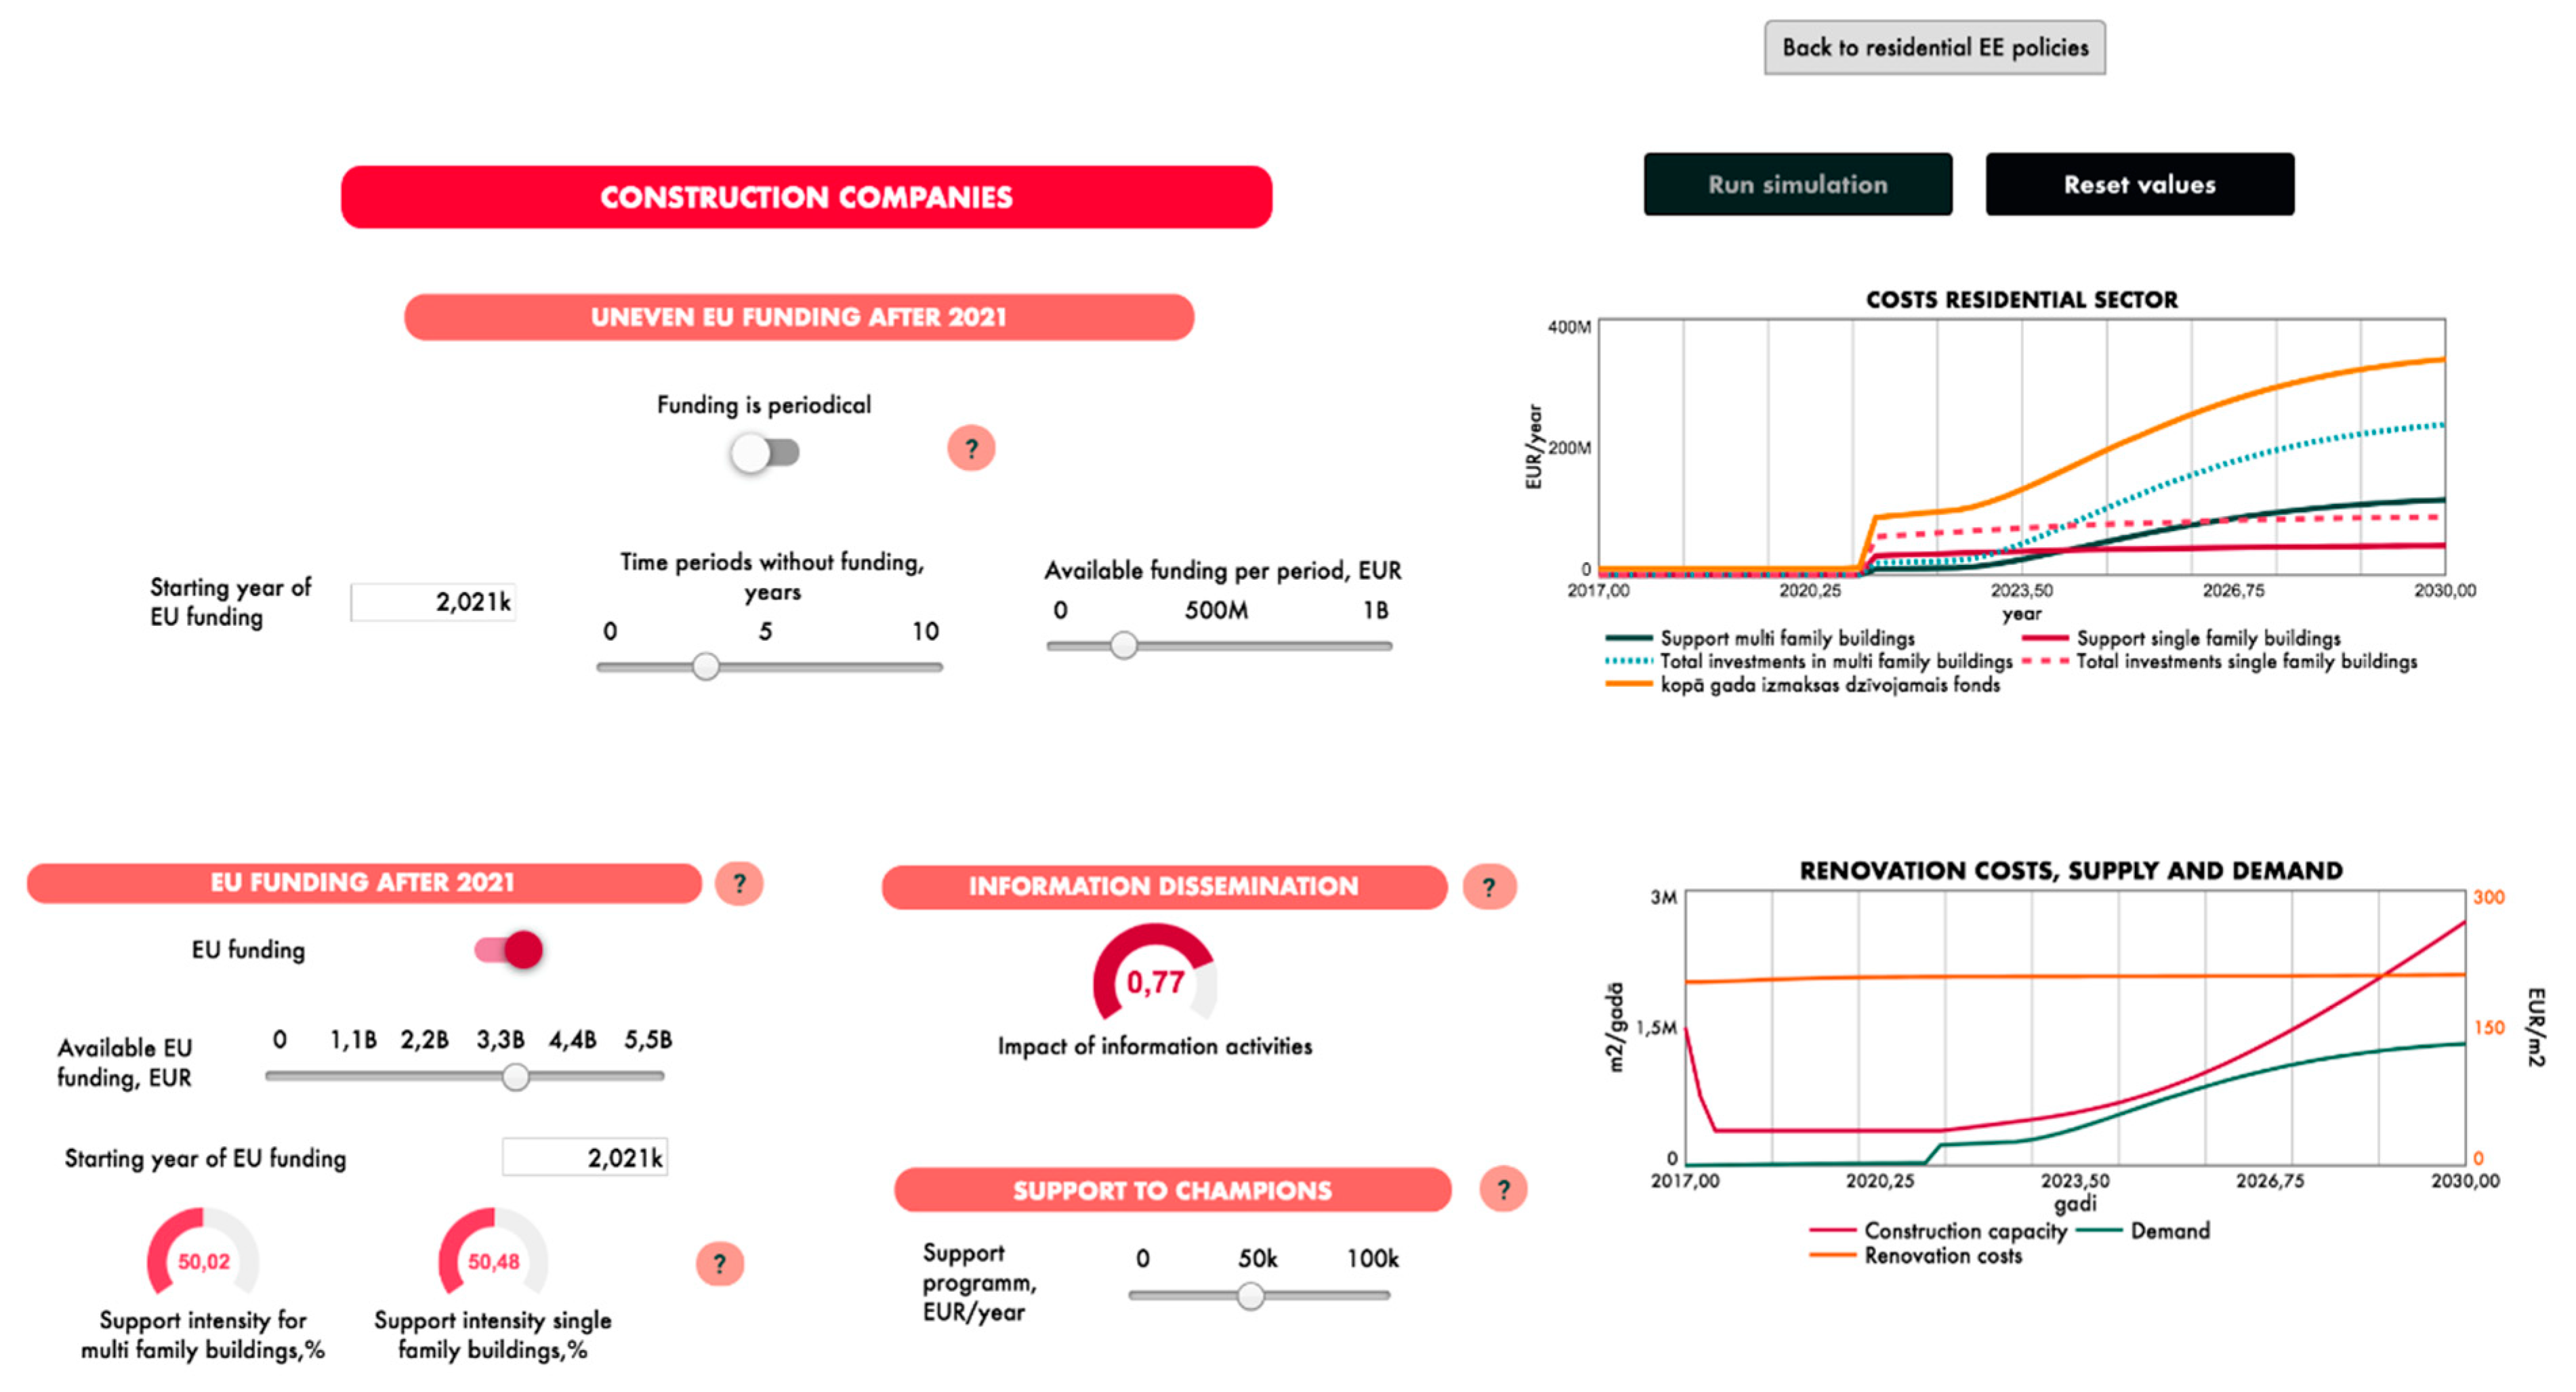
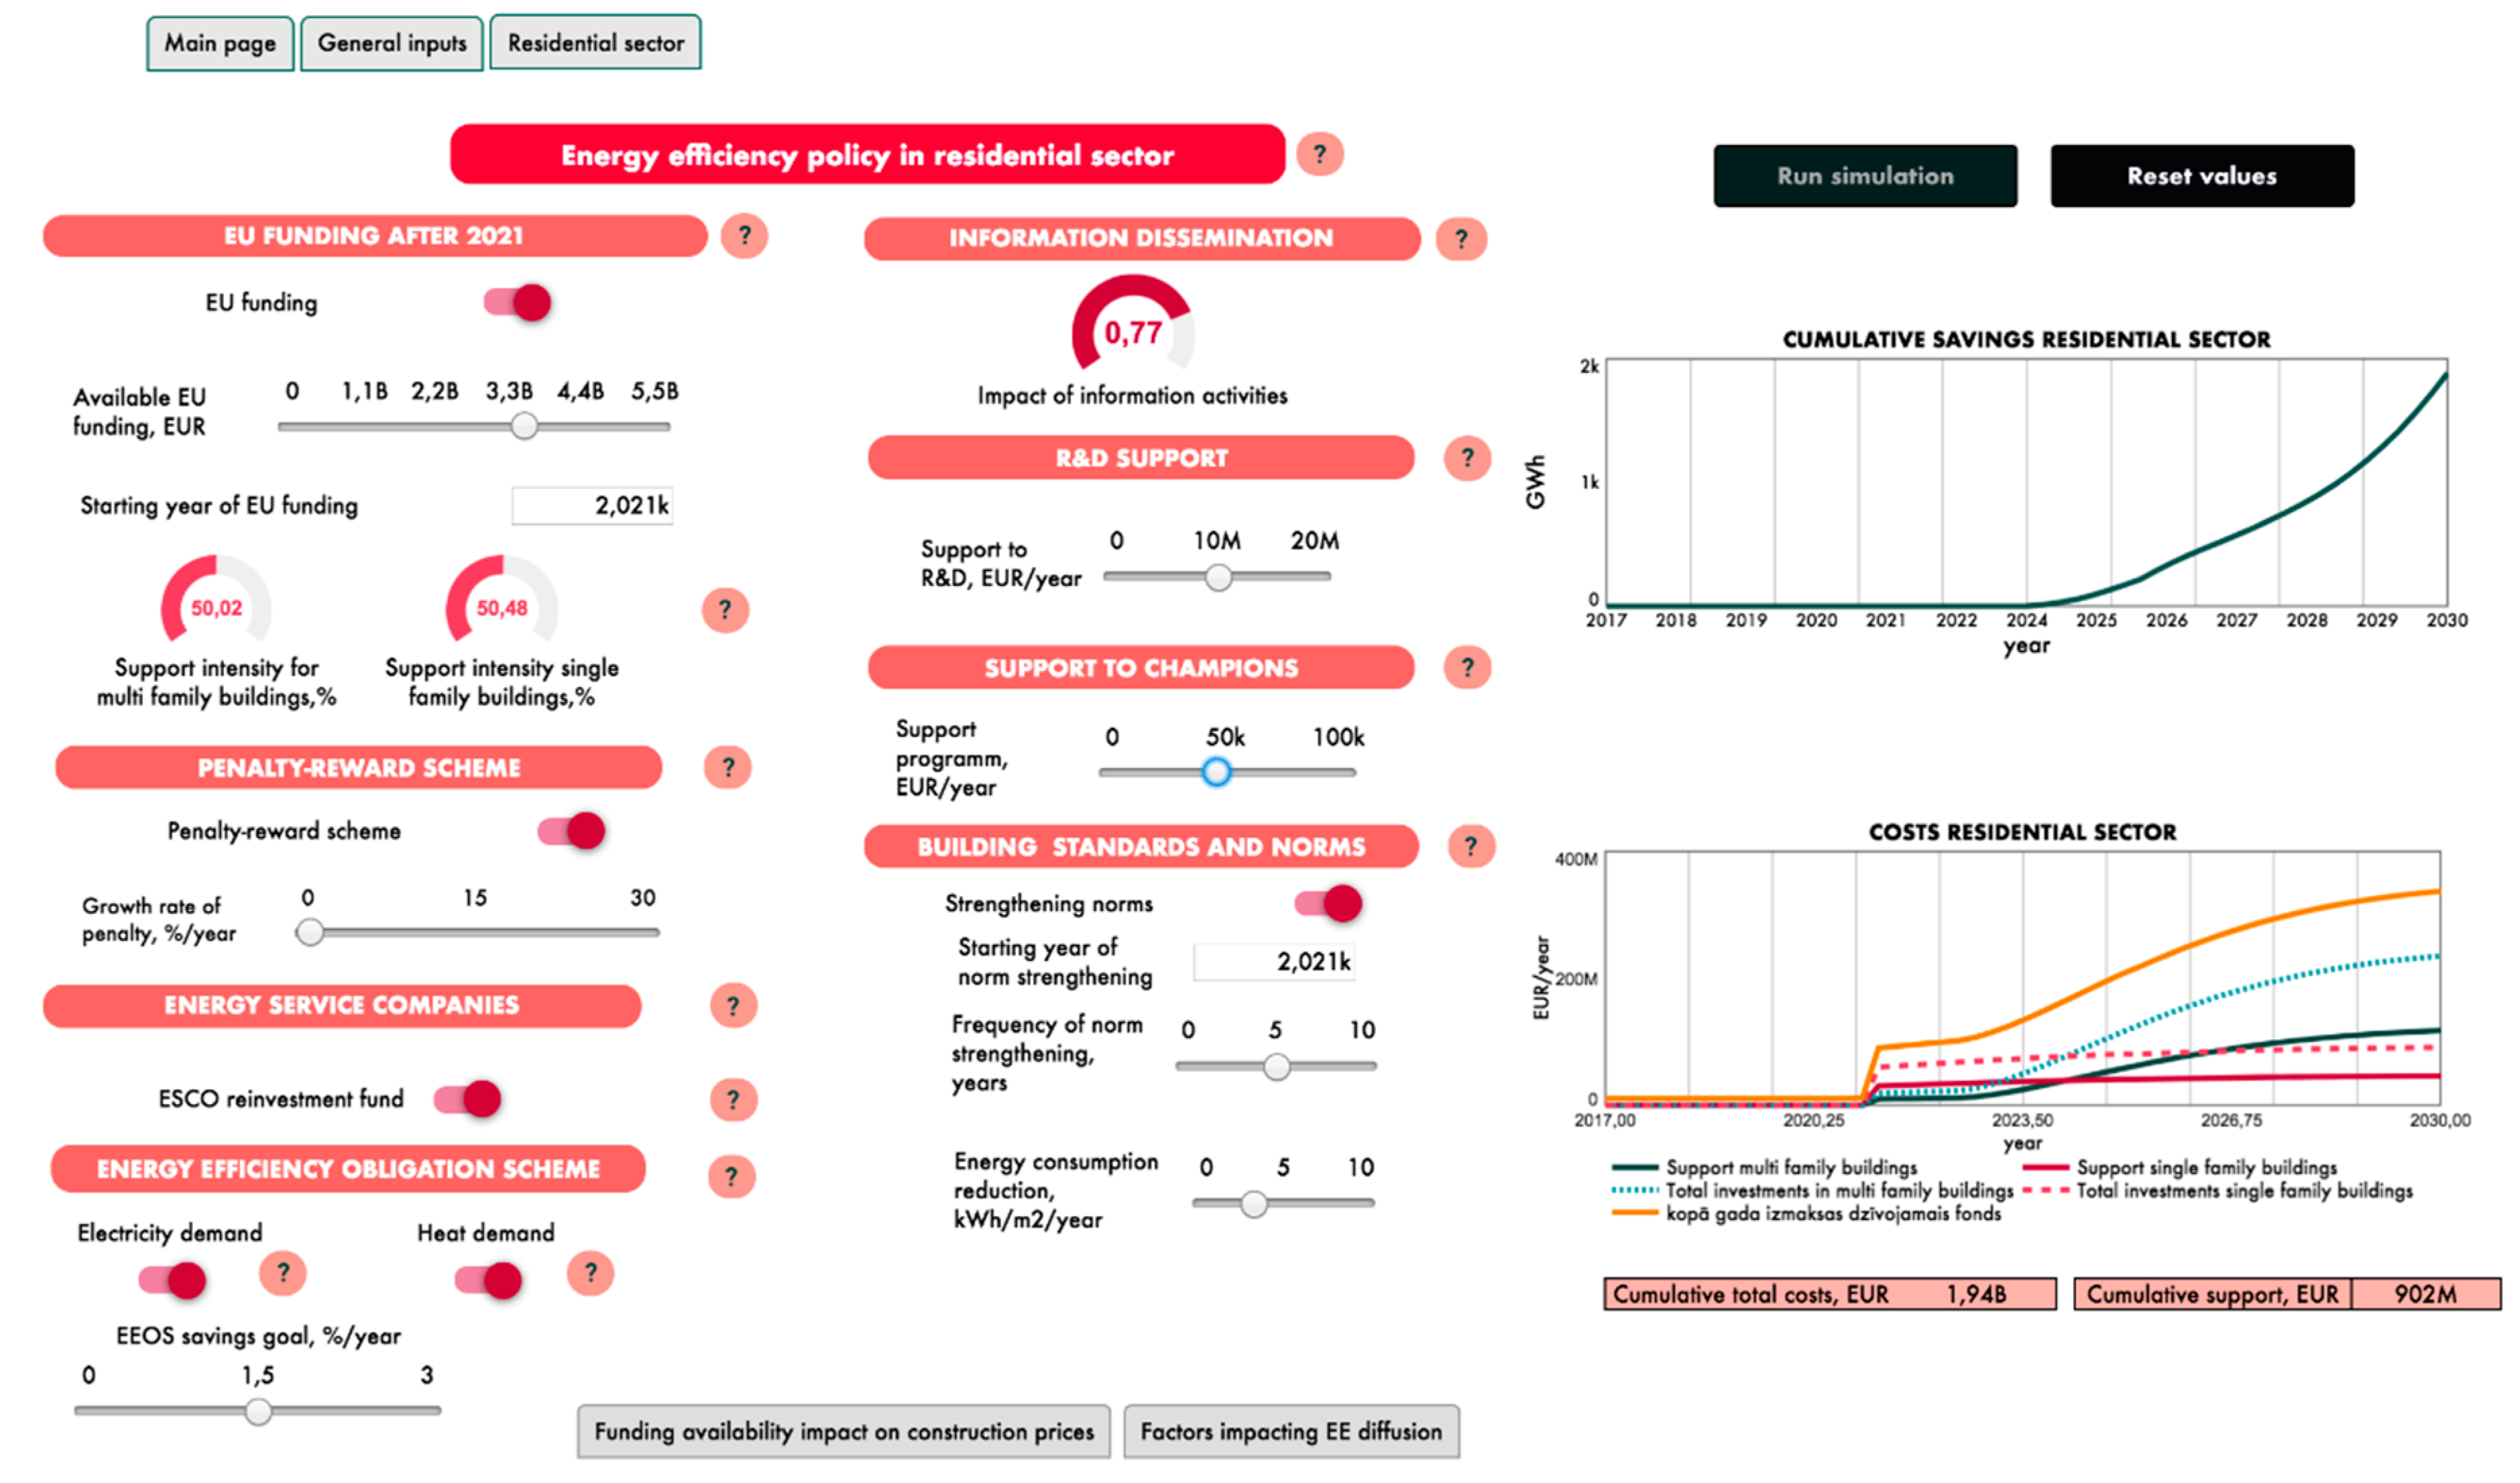
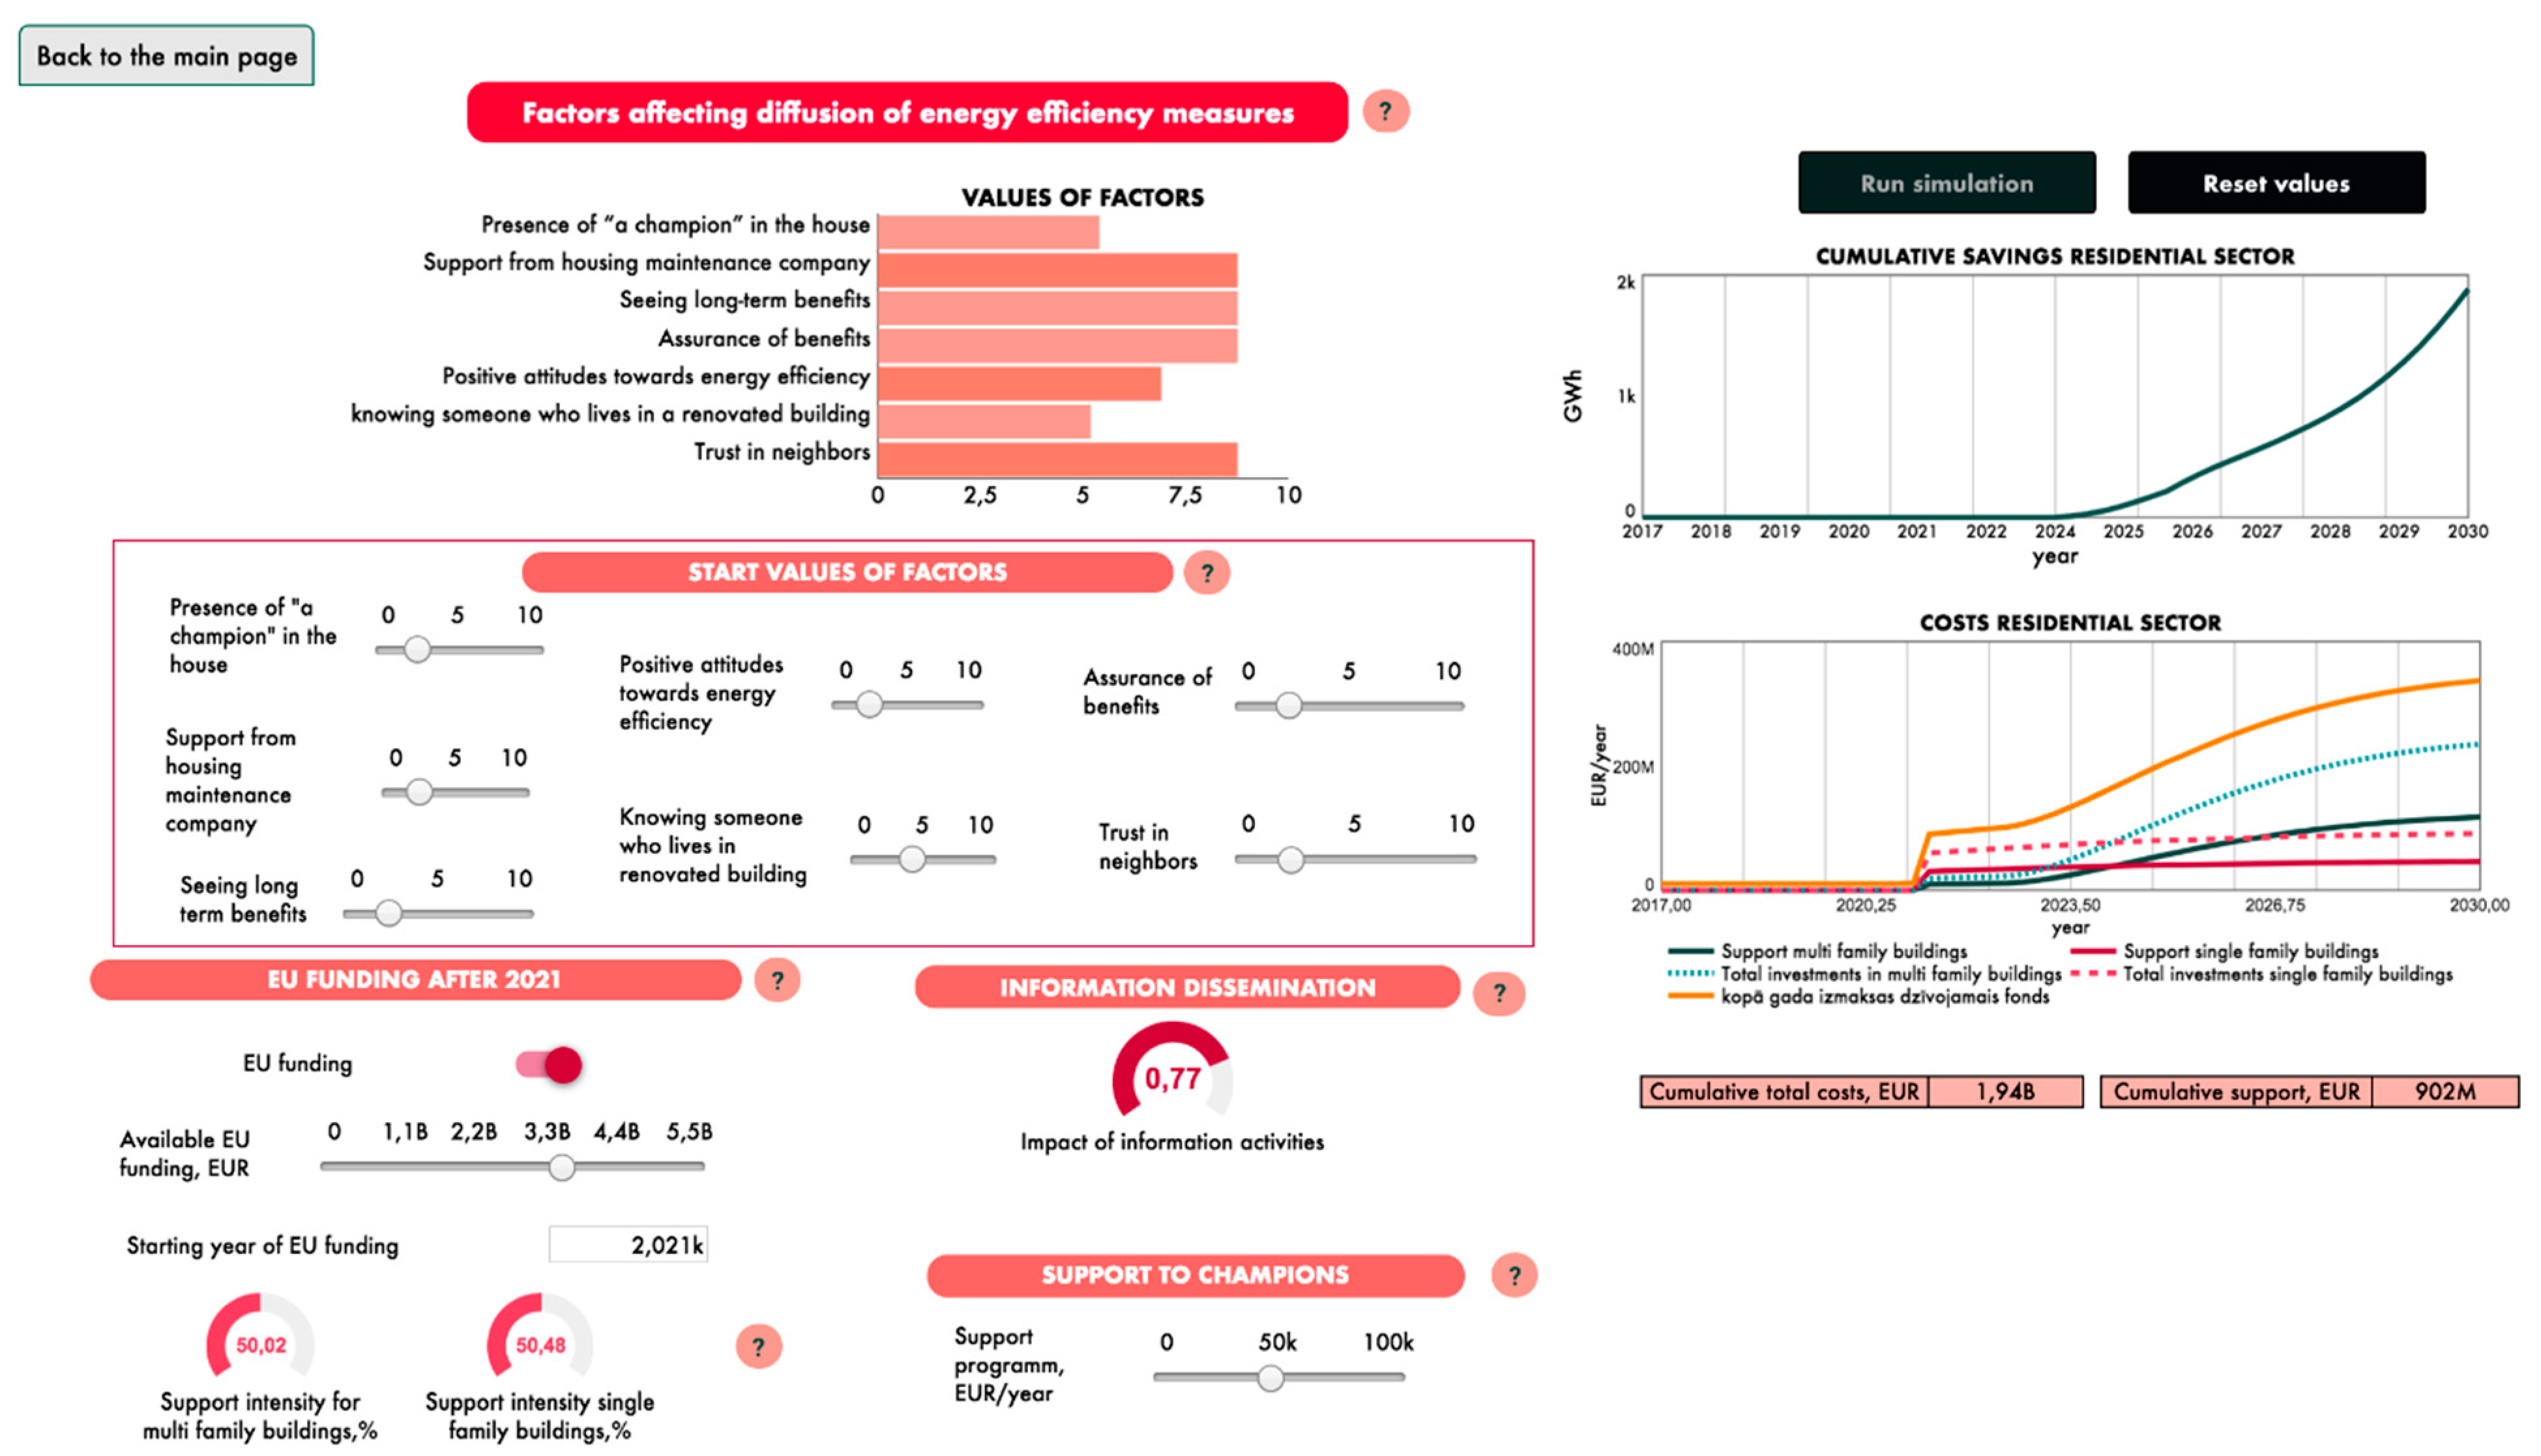
2.4. Interface for Policy Makers

After validation, a user-friendly, Internet-based interface for policymakers and any other interested stakeholders was developed. The model stock and flow structure and the interface were solely developed and created by the research team of this study with Stella Architect software. This software enables the creation and web-based deployment of system dynamics model interfaces. The interface development process differs from the stock and flow structure development process as it emphasizes packaging rather than developing model-based insights. On the other hand, there is an overlap with many of the same components, such as graphs and tables, shared between model and interface development. Our study developed an interface for the final version of the model, including an animated data visualization. The interface provides three layers to carry out an analysis of the system. All layers include different policy tools that can be applied to change the system’s behavior illustrated in graphs on the right-hand side of the page. The first layer, illustrated in Figure 11, provides eight groups of policy tools, including EU funding, a penalty–reward scheme, ESCO, information, support to “champions”, and support to the research, development, and improvement in energy efficiency standards. Each policy tool has several parameters that can be adjusted to reach the national cumulative savings goal displayed in the graph. The second graph shows the annual and cumulative costs of any combination of the policy tools.
The second page of the model interface (see Figure 12) provides more details on the supply and demand of construction companies and their impact on the total diffusion process of energy efficiency measures in the multi-family building sector. The user can apply different start time and periods of funding and see their impact on the system’s behavior.
Figure 13 illustrates the third layer of the model interface that provides insights into apartment owner decision-making dynamics. First, the user can set the start values of all the factors influencing decision making. Then, the user can apply different policy tools and determine their impact on the values of these factors.

3. Results

The model was simulated to gain insights into the causes of system behavior for previous policies (2008–2020) and provide analysis-based suggestions to improve these policies for 2021–2030. The different aspects were analyzed using the model and compared to the findings from the real system.

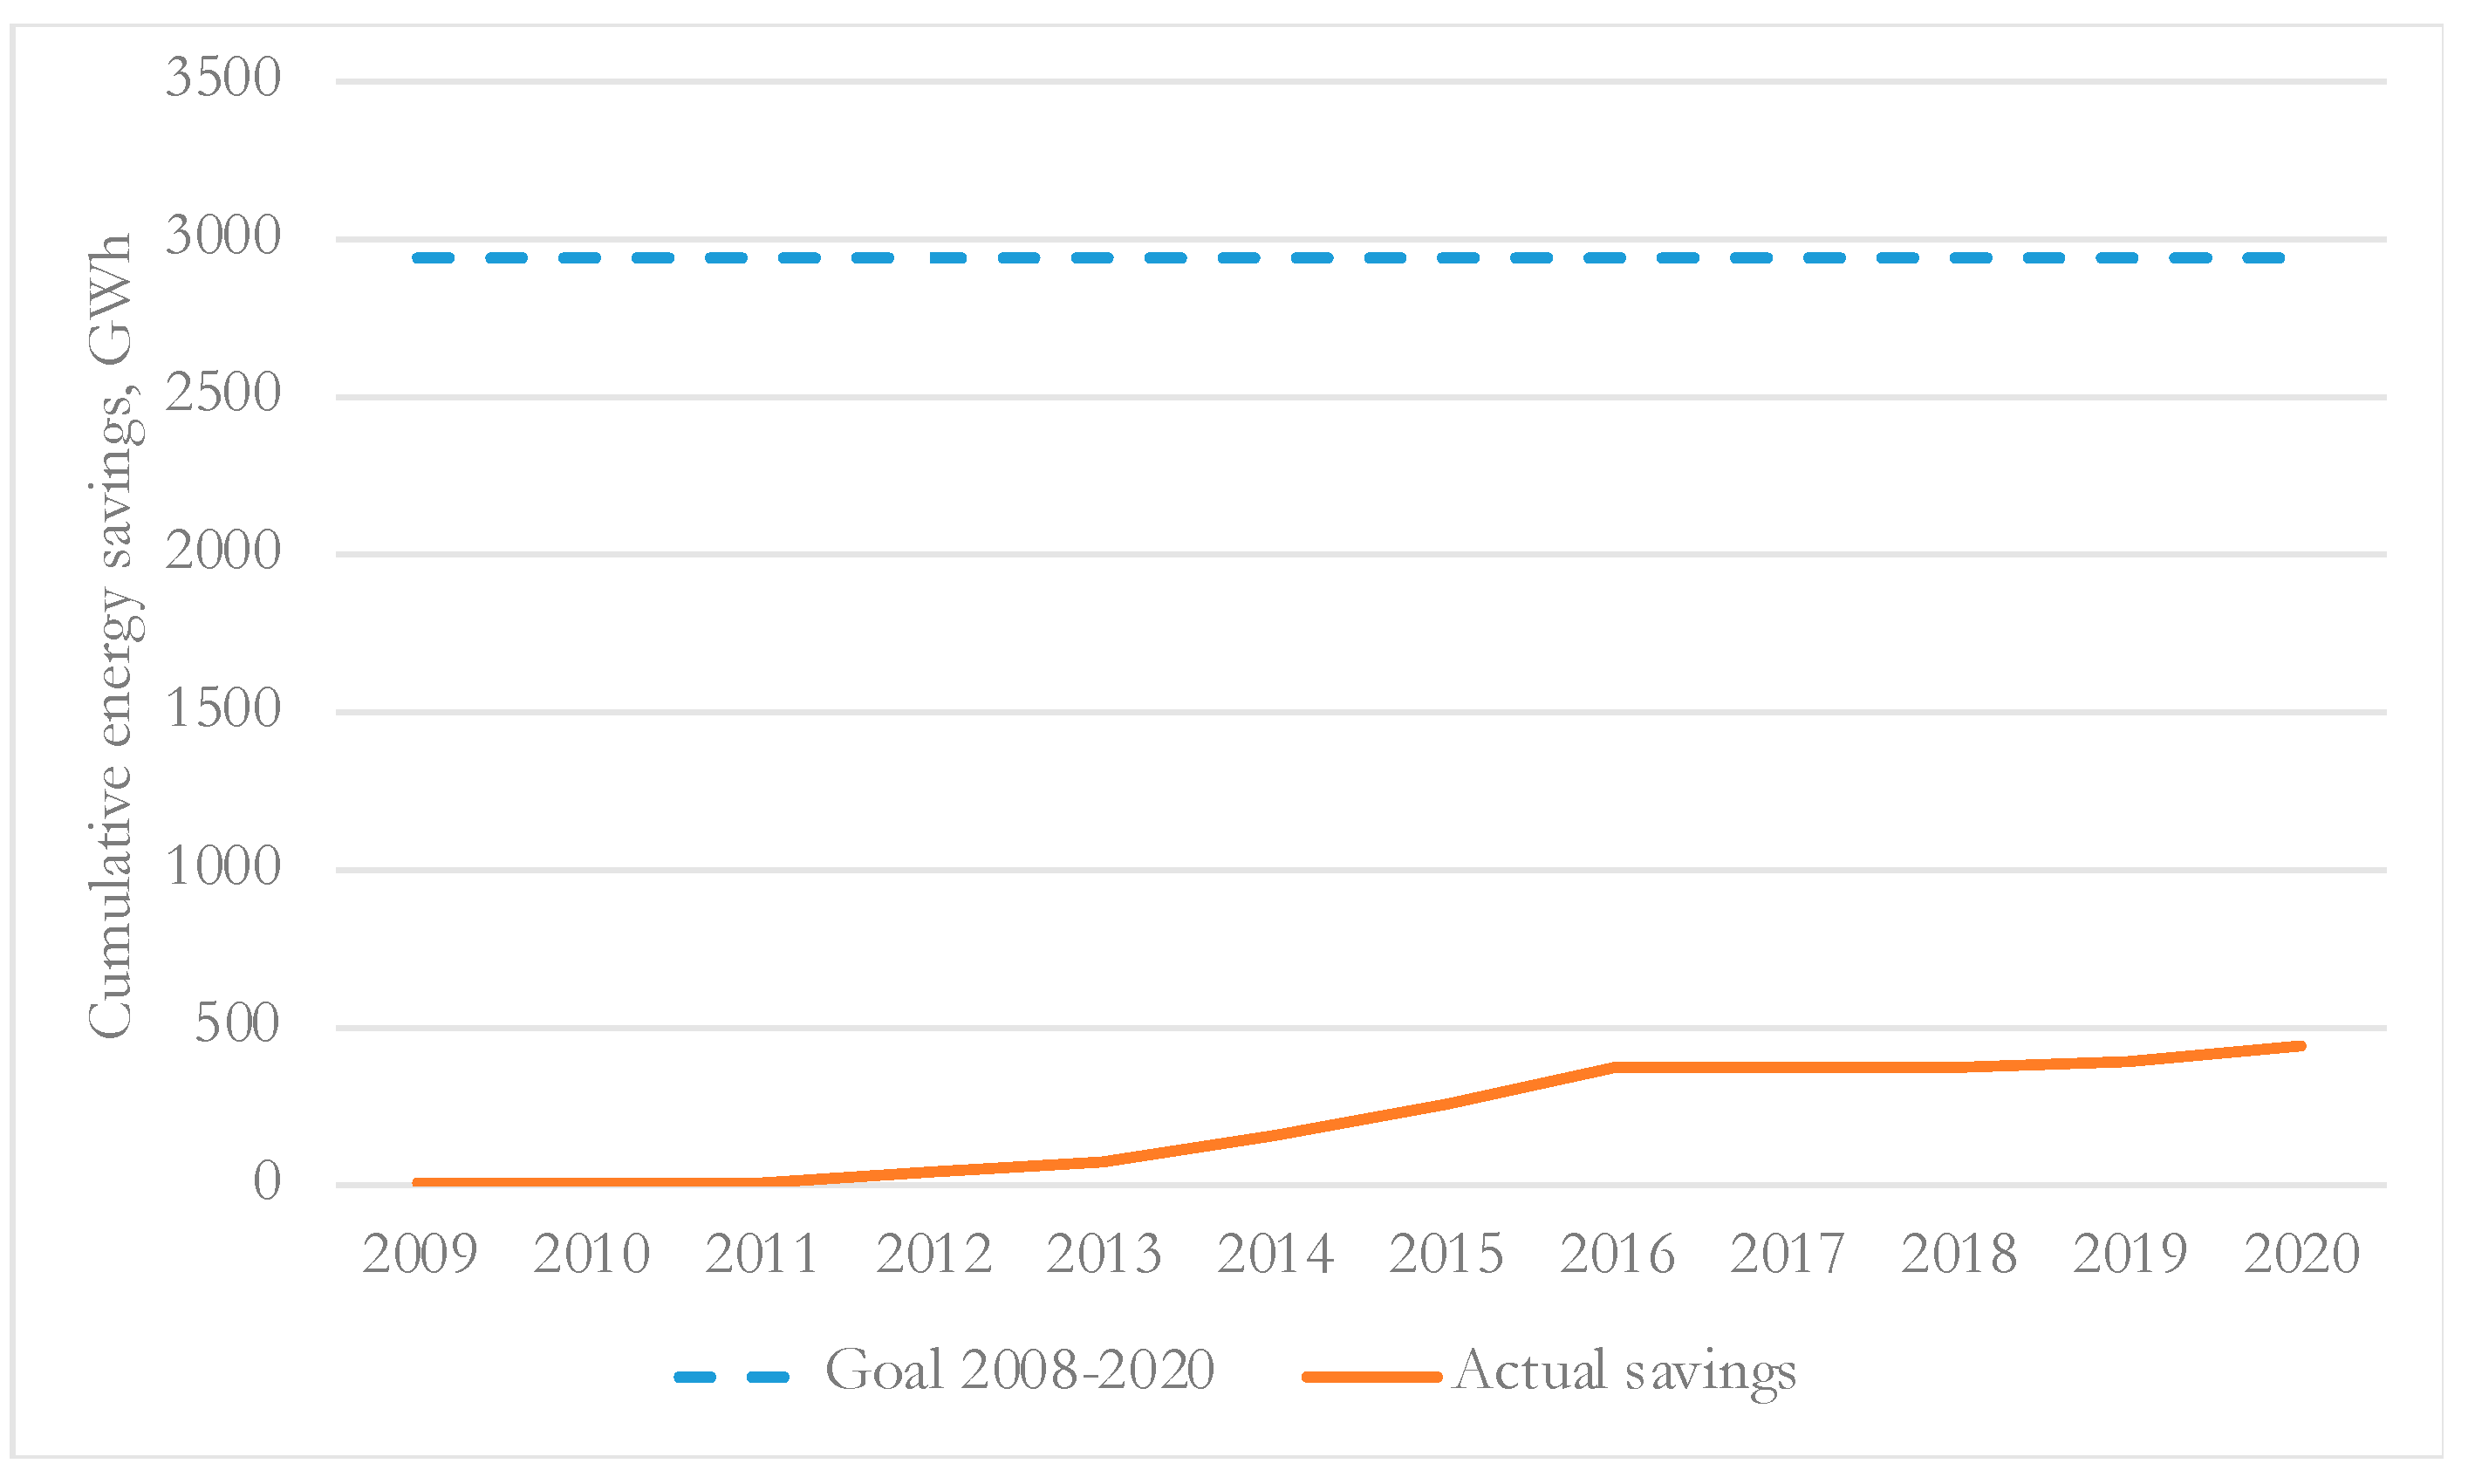
3.1. Model-Based Policy Analysis 2008–2020

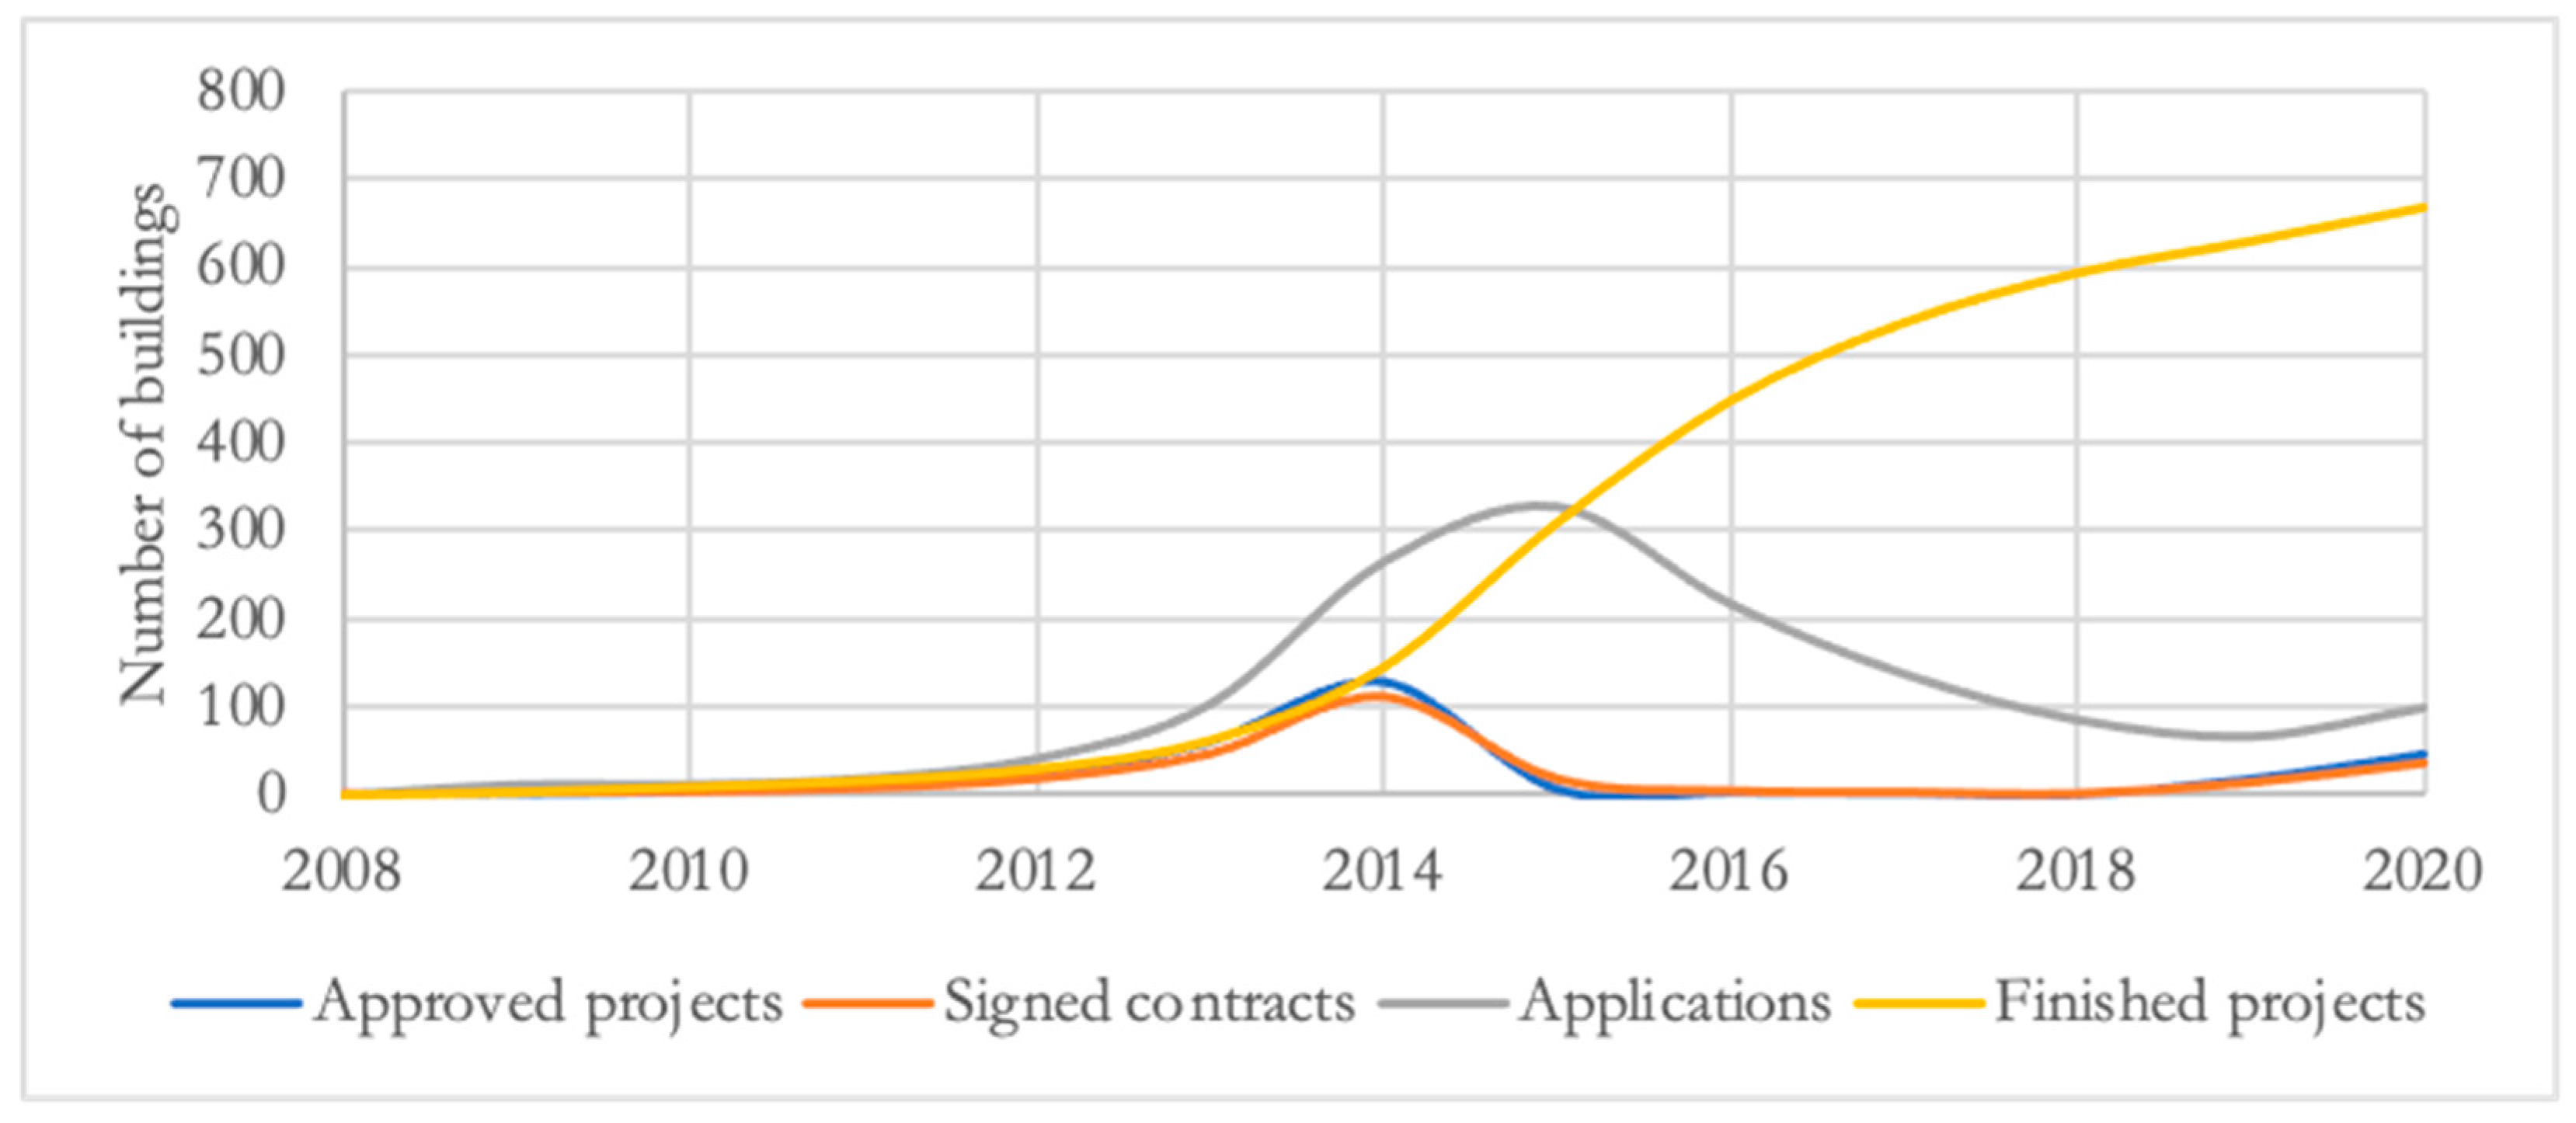
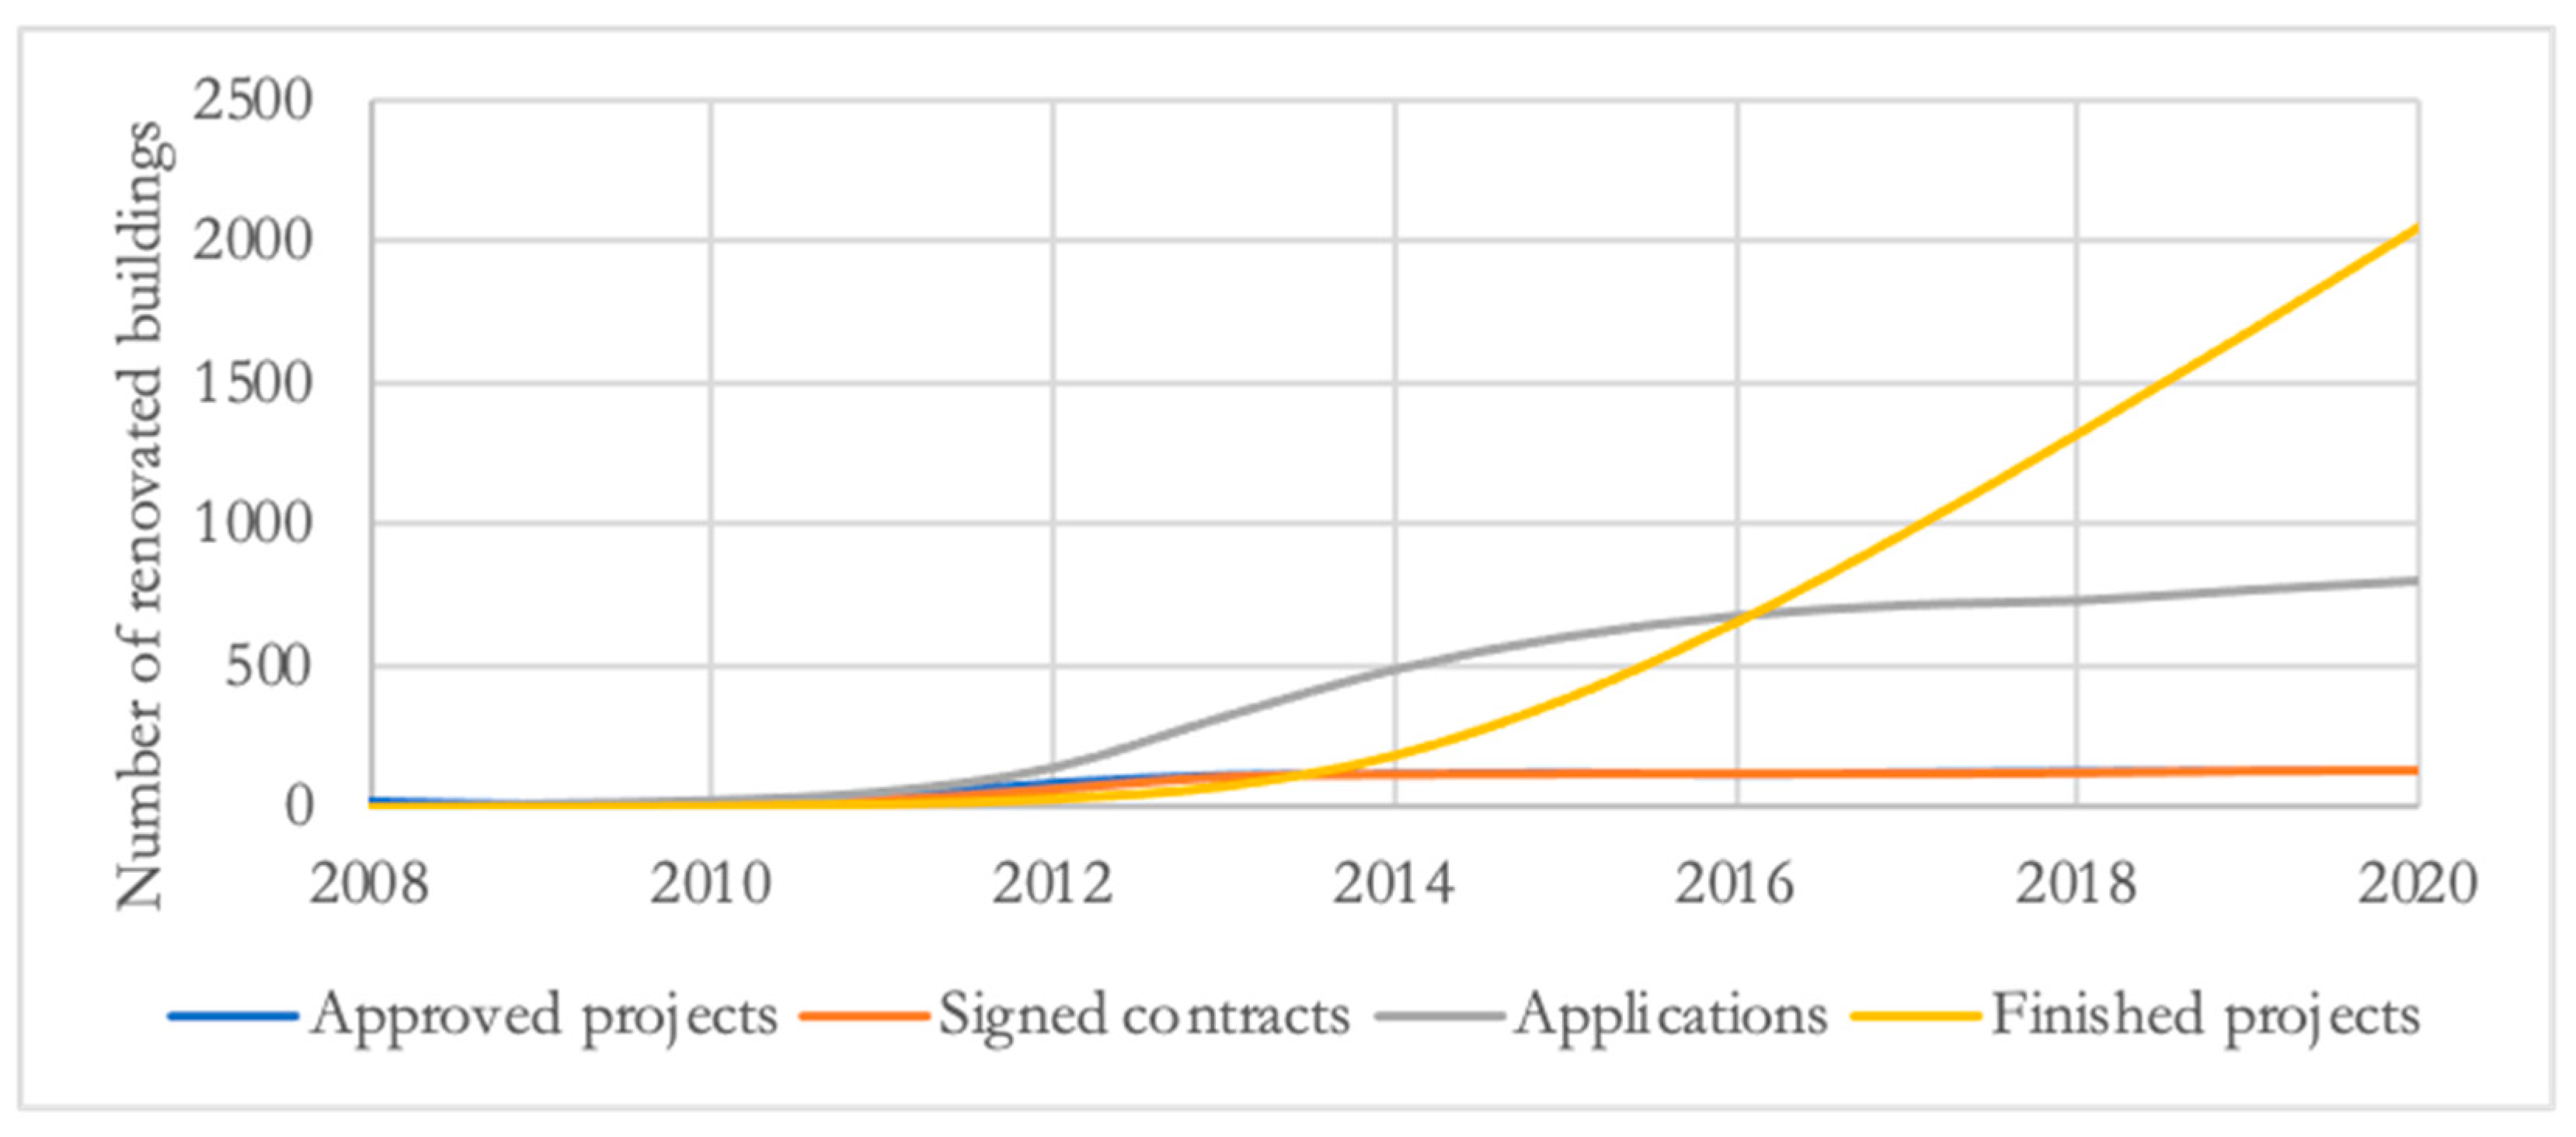
3.1.1. Funding Discontinuity

The funding available from the EU was 86 million EUR during 2009–2013 and 156 million EUR during 2016–2020. It was used as 50% support towards to multi-family building energy efficiency projects. The first funding period was finished at the end of 2013, and the subsequent funding only started in 2016. Thus, no EU funds were available in 2014 or 2015. This oscillating funding caused undesired side effects, i.e., misbalance of demand and construction capacity consequently leading to changes in construction price and quality. The demand for energy efficiency projects increased at a higher rate than the capacity build-up of construction companies, leading to price increase and a reduction in quality. The volatility of available funding caused problems for the construction sector as such. When the first funding period was over, demand fell to zero and the construction companies were left with high construction capacity and no demand. For the two years without funding, most construction companies lost their employees (they emigrated to other countries or moved to other sectors). When the second funding period started in 2016, the market faced the same problems as faced during the first funding period. However, it was even more misbalanced as the government opened a funding program for public building energy efficiency projects at the same time. That program had much more attractive conditions for construction companies, so the multi-family buildings sector was left with a high demand, a low capacity of construction companies, increased prices, and low quality construction. The data from funding agencies show that the average total renovation costs for the projects were 35 EUR/m2 in 2010, 65 EUR/m2 for 2008–2013, and 170 EUR/m2 for 2018–2020. The escalating price has made the payback time much longer and [42] thus less attractive to building owners. A discussion of stakeholders arranged by the funding agency in 2017 highlighted that the implementation costs of projects increased due to: (1) long-term downturn in the availability of EU funds that has led to an avalanche-like process of application of projects; (2) reduction in construction quality; (3) increased costs of architects, which are explained by increased requirements from the financing institution. [52].
Dependency on a single funding source is the central problem for the energy efficiency program. Although international financial institutions have offered various support towards energy efficiency, Latvia has not used them to the fullest extent. International banks support large-scale projects, and the government should foster the acquisition of these programs. Latvia has cooperated with the European Investment Bank (EIB); however, funds from the European Bank for Reconstruction and Development and the Sustainable Energy Initiative of Nordic Investment Bank remain untapped. Latvia needs to consider the use of other financial instruments such as JESSICA, which has been used in Lithuanian [53]. In addition, both government and apartment owners have gotten used to the familiar short-term solution of EU funding and have become addicted to this policy measure. As a result, they are not searching for other less comfortable and less familiar long-term solutions. Figure 14 shows the simulation results of the system dynamics model of supply, demand, and prices of construction works for multi-family buildings and public sectors when the existing policy tools are in place. The simulation shows how demand increases after EU funds are introduced in 2008, and the supply of the construction companies follows with a lower rate as the initial capacity is not sufficient and can only be built up with a delay. The price increases while demand is higher than supply and falls when supply takes over demand. The same behavior of this system can be seen during the second funding period from 2016. The price increases at a higher rate when the government opens an EU funding program for energy efficiency projects in public buildings in 2017. The real system encountered multi-family buildings queuing for the construction companies and ready to pay for overpriced services of low quality.
To improve the system’s behavior, the supply, demand, and construction costs for multi-family buildings and public sectors with a combined penalty–reward scheme and EU funding were simulated. Figure 15 illustrates the results. The penalty–reward scheme provides sustainable funding, which evens out the oscillations caused by the waves of EU funding. The price increases during the beginning of the first funding period while construction companies build up their capacity, after that, the price evens out and stabilizes. The peak in 2017 is caused by a funding program for public building energy efficiency.

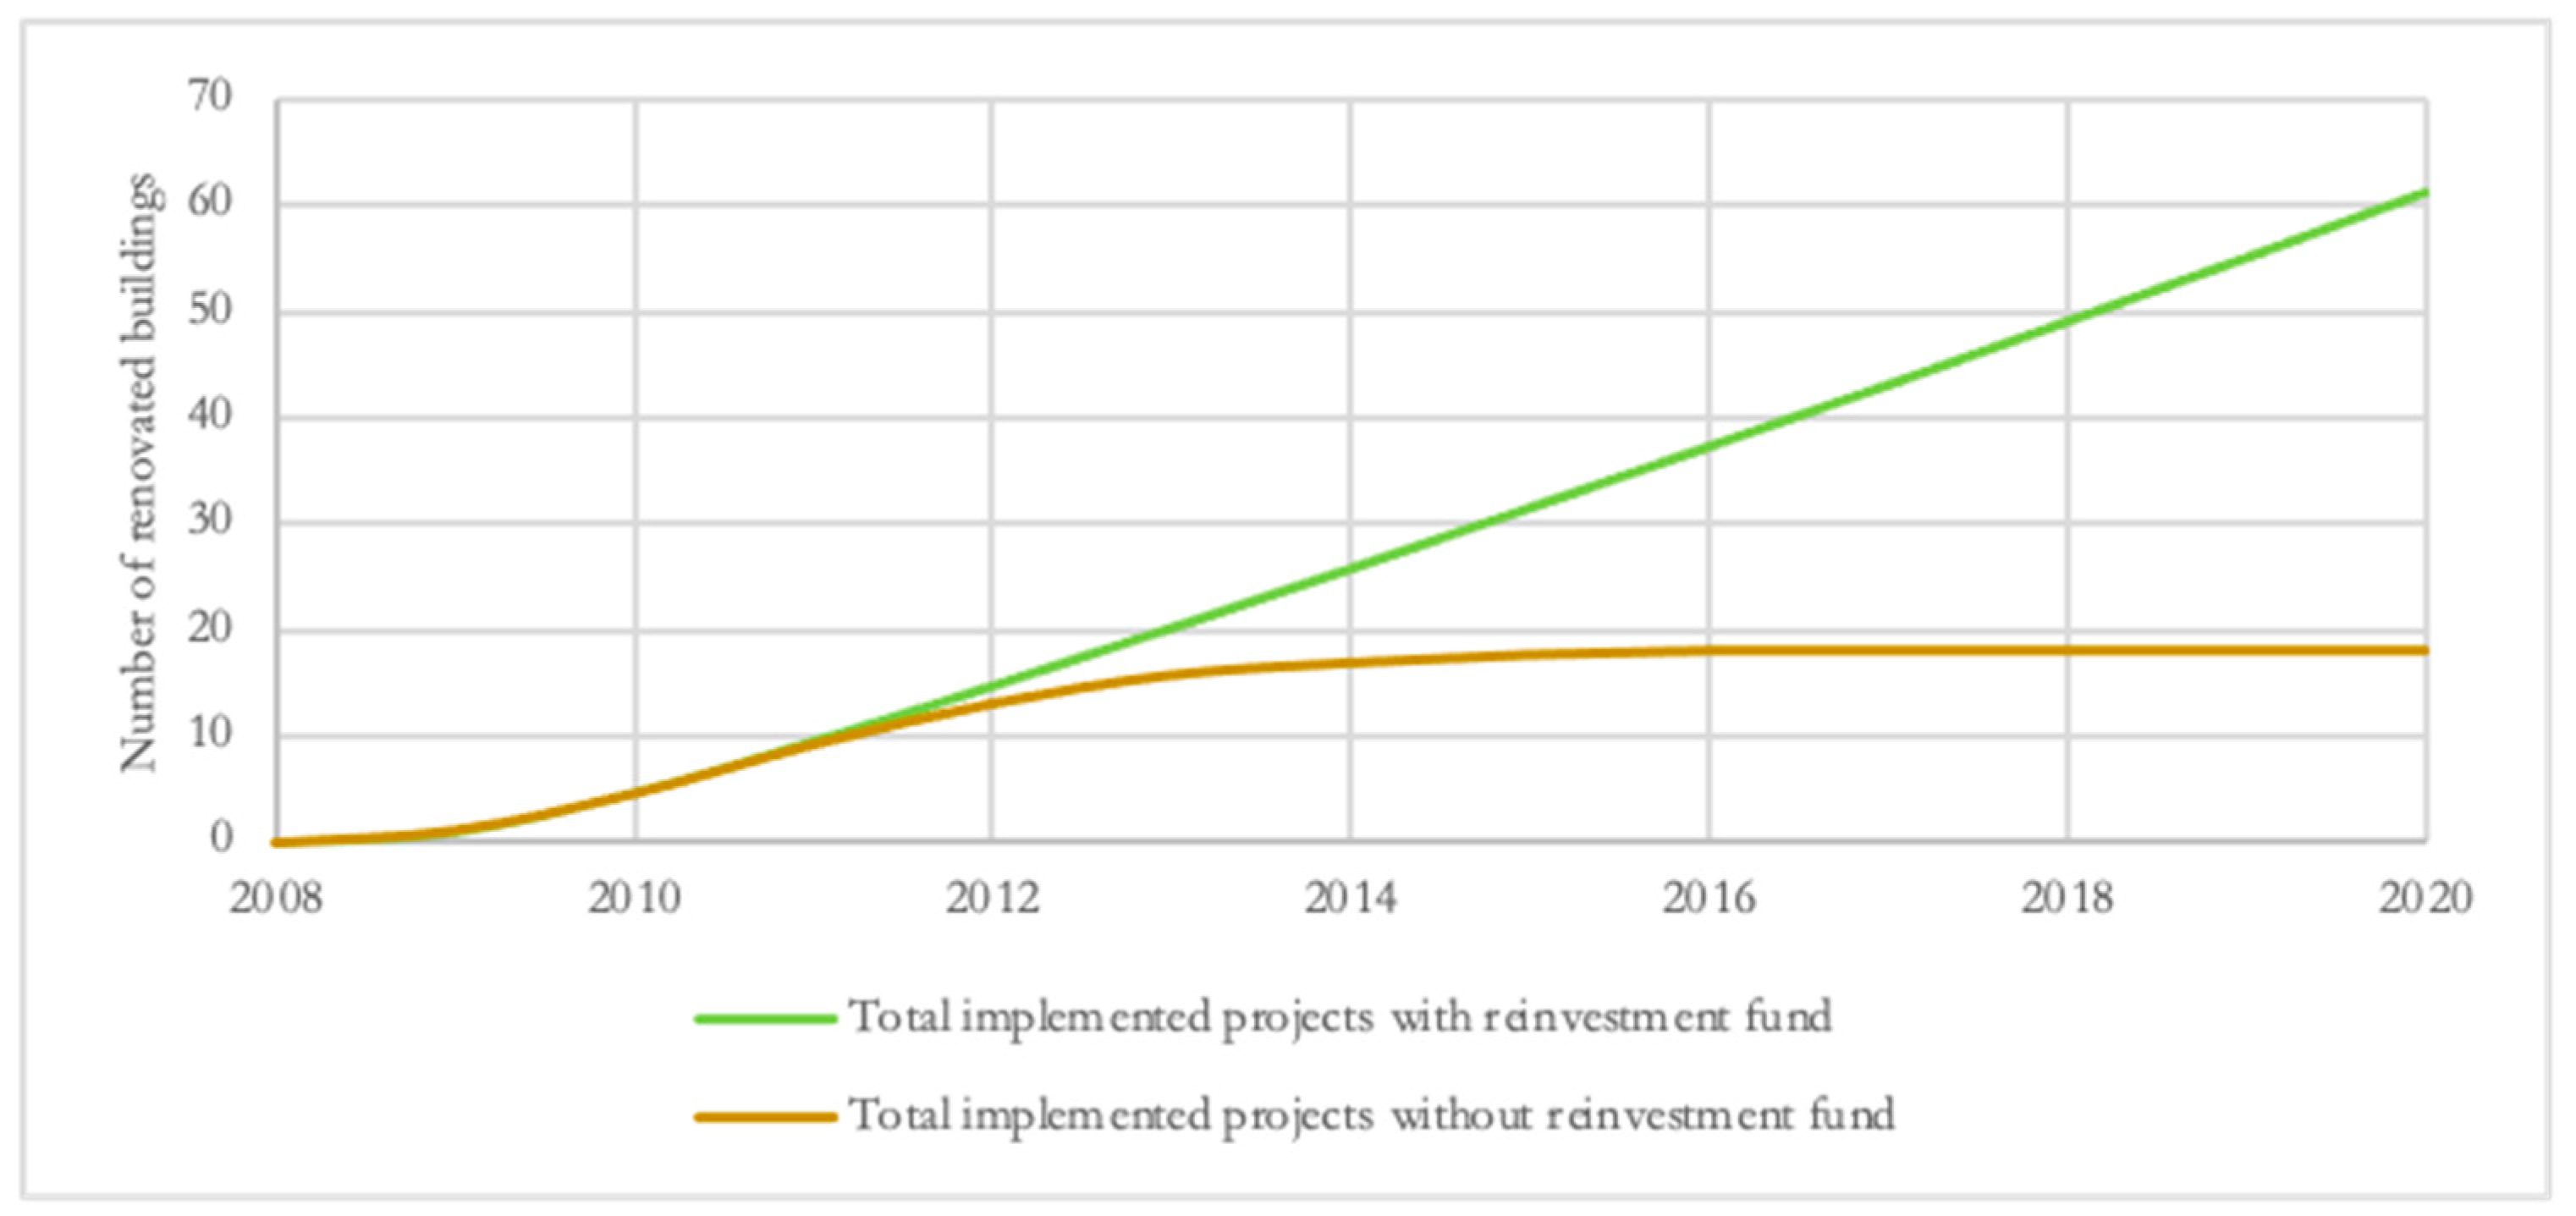
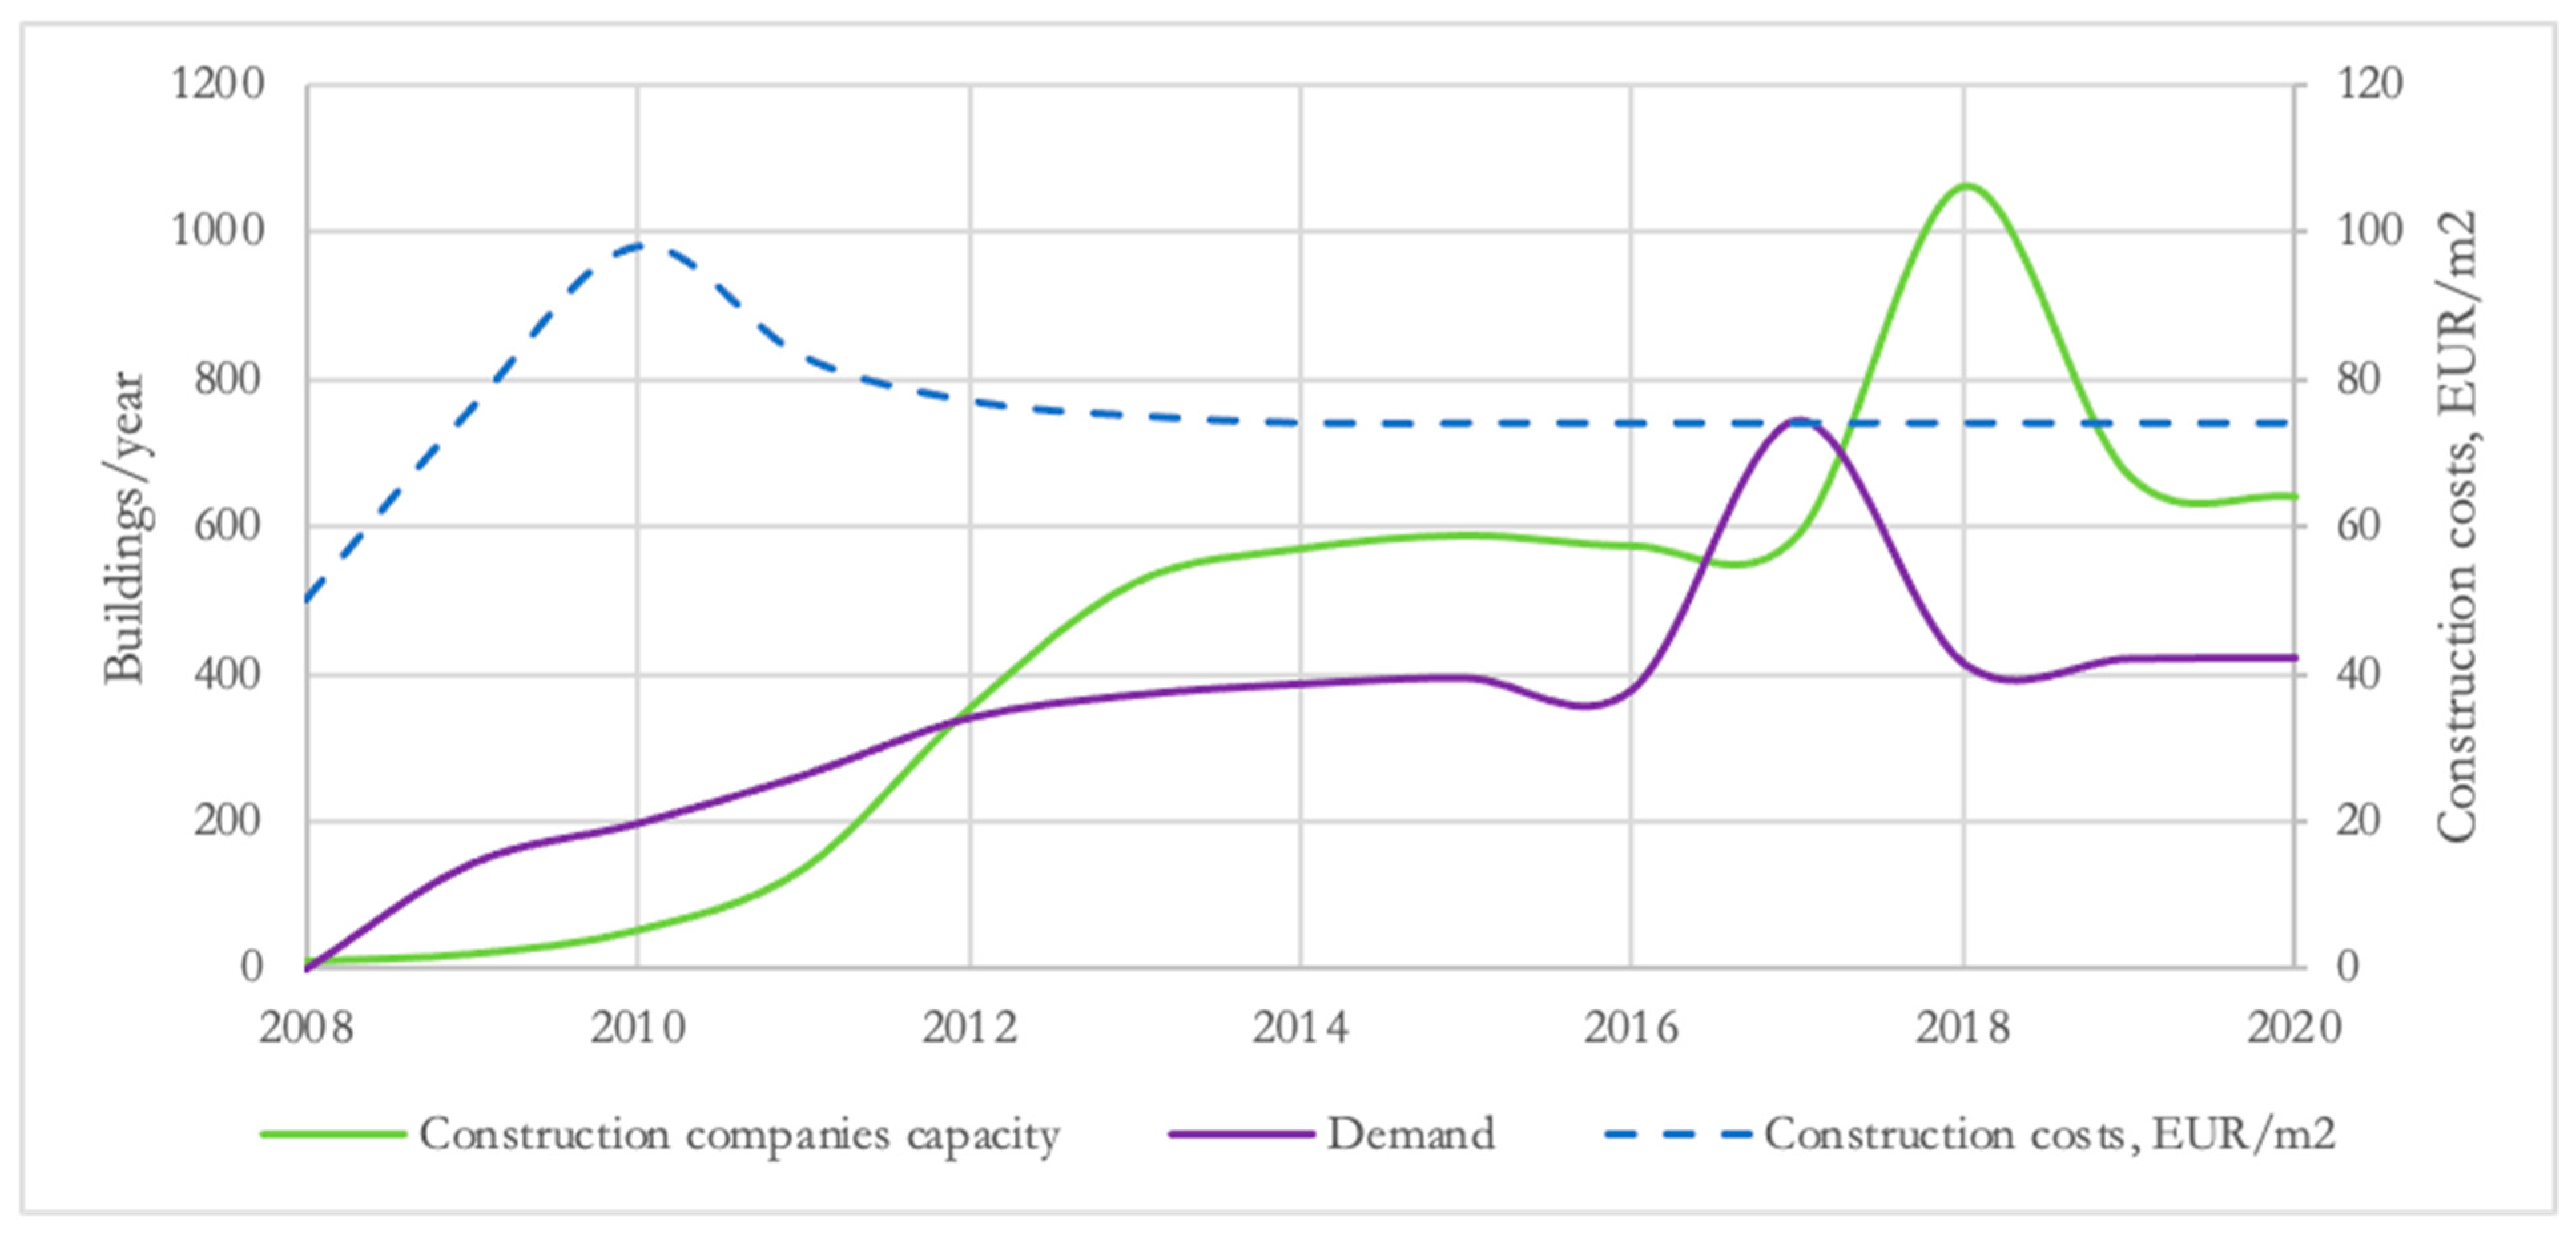
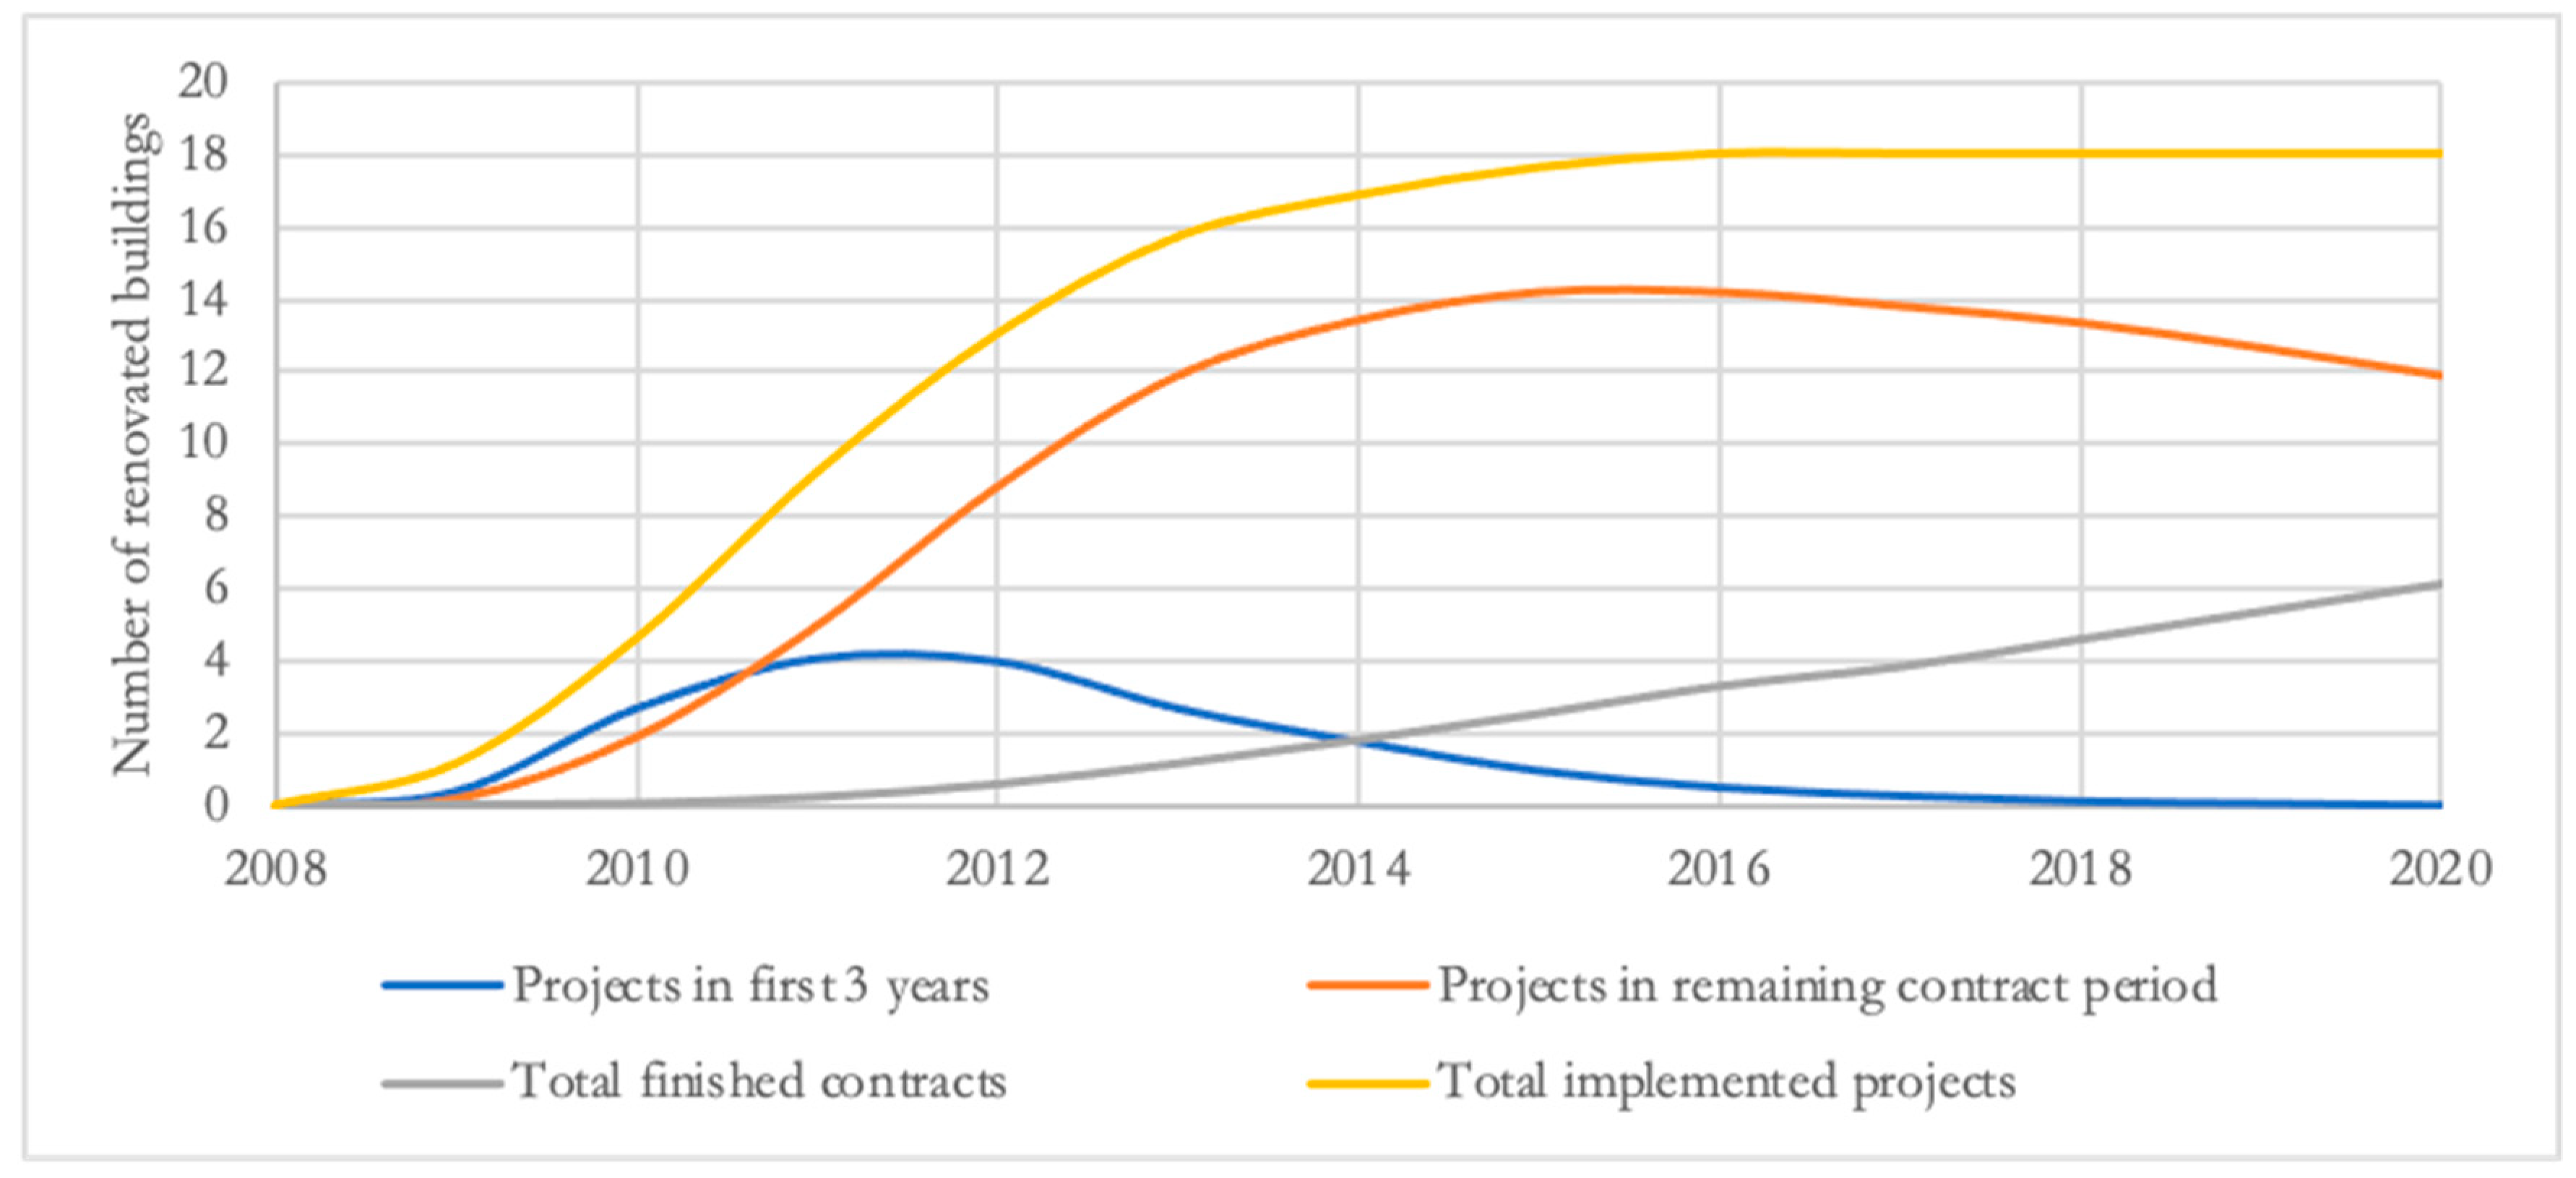
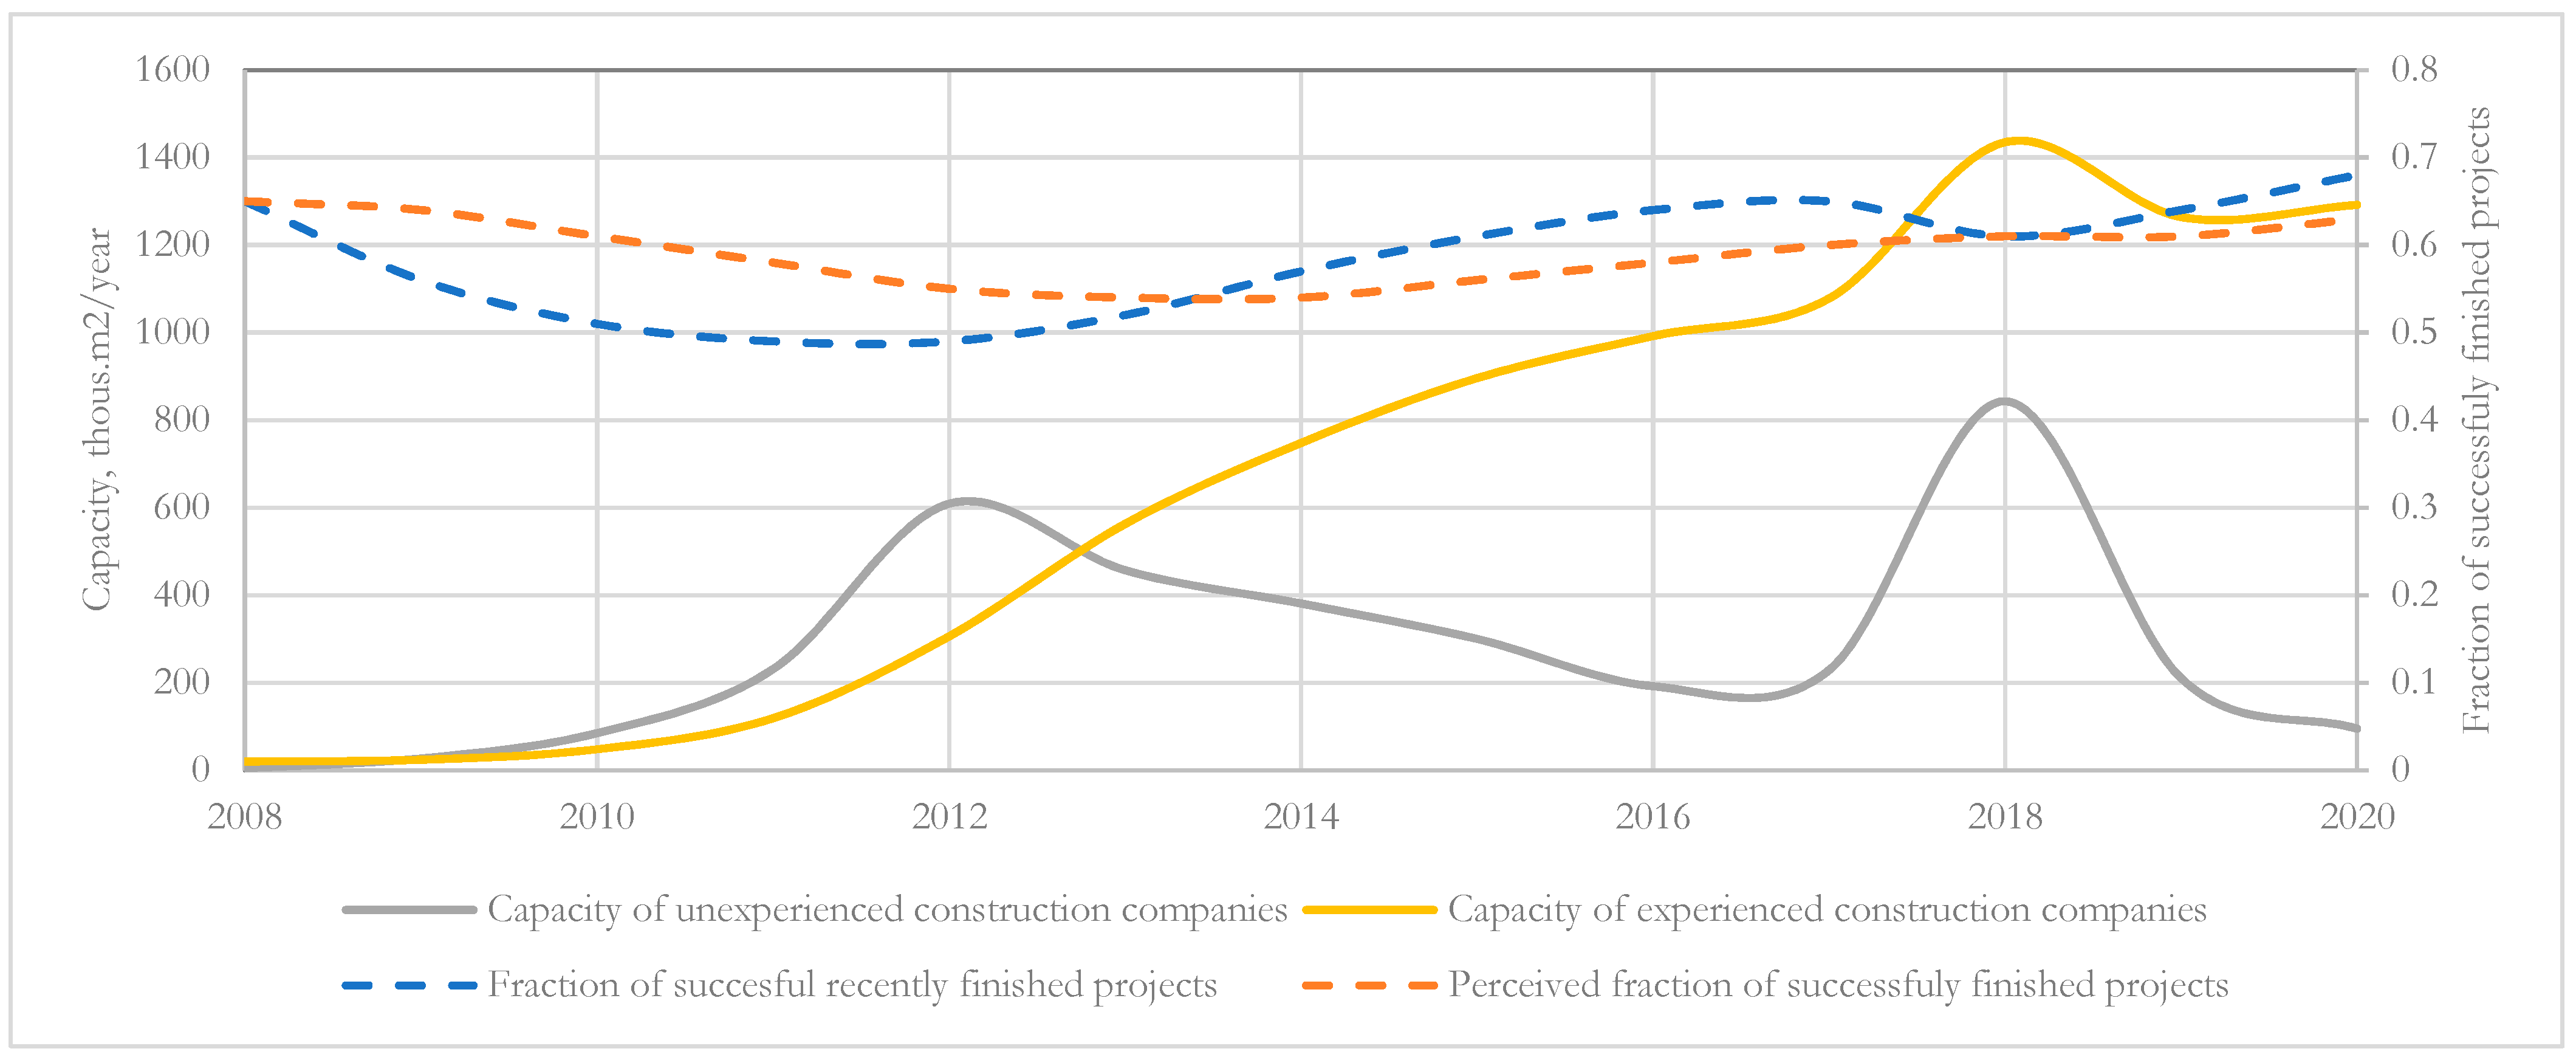
3.1.2. Energy Service Companies

ESCOs are an alternative to construction companies and provide a long-term contract with guaranteed energy savings. Actual data from the market on ESCO development rates correspond to the simulation results [54,55]. The number of ESCO projects increases until 2016 (see Figure 16), and then reaches an equilibrium because the limit of ESCOs’ financial capacity is reached and a lack of financial resources limits further growth.
To increase the ESCO project implementation rate, a reinvestment fund available for ESCOs is needed [55]. However, the Ministry of Economy has been reluctant to set this up so far. If a reinvestment fund was used, ESCOs’ capacity, expressed as the number of renovated buildings, would continue to increase beyond 2016 (see Figure 17).

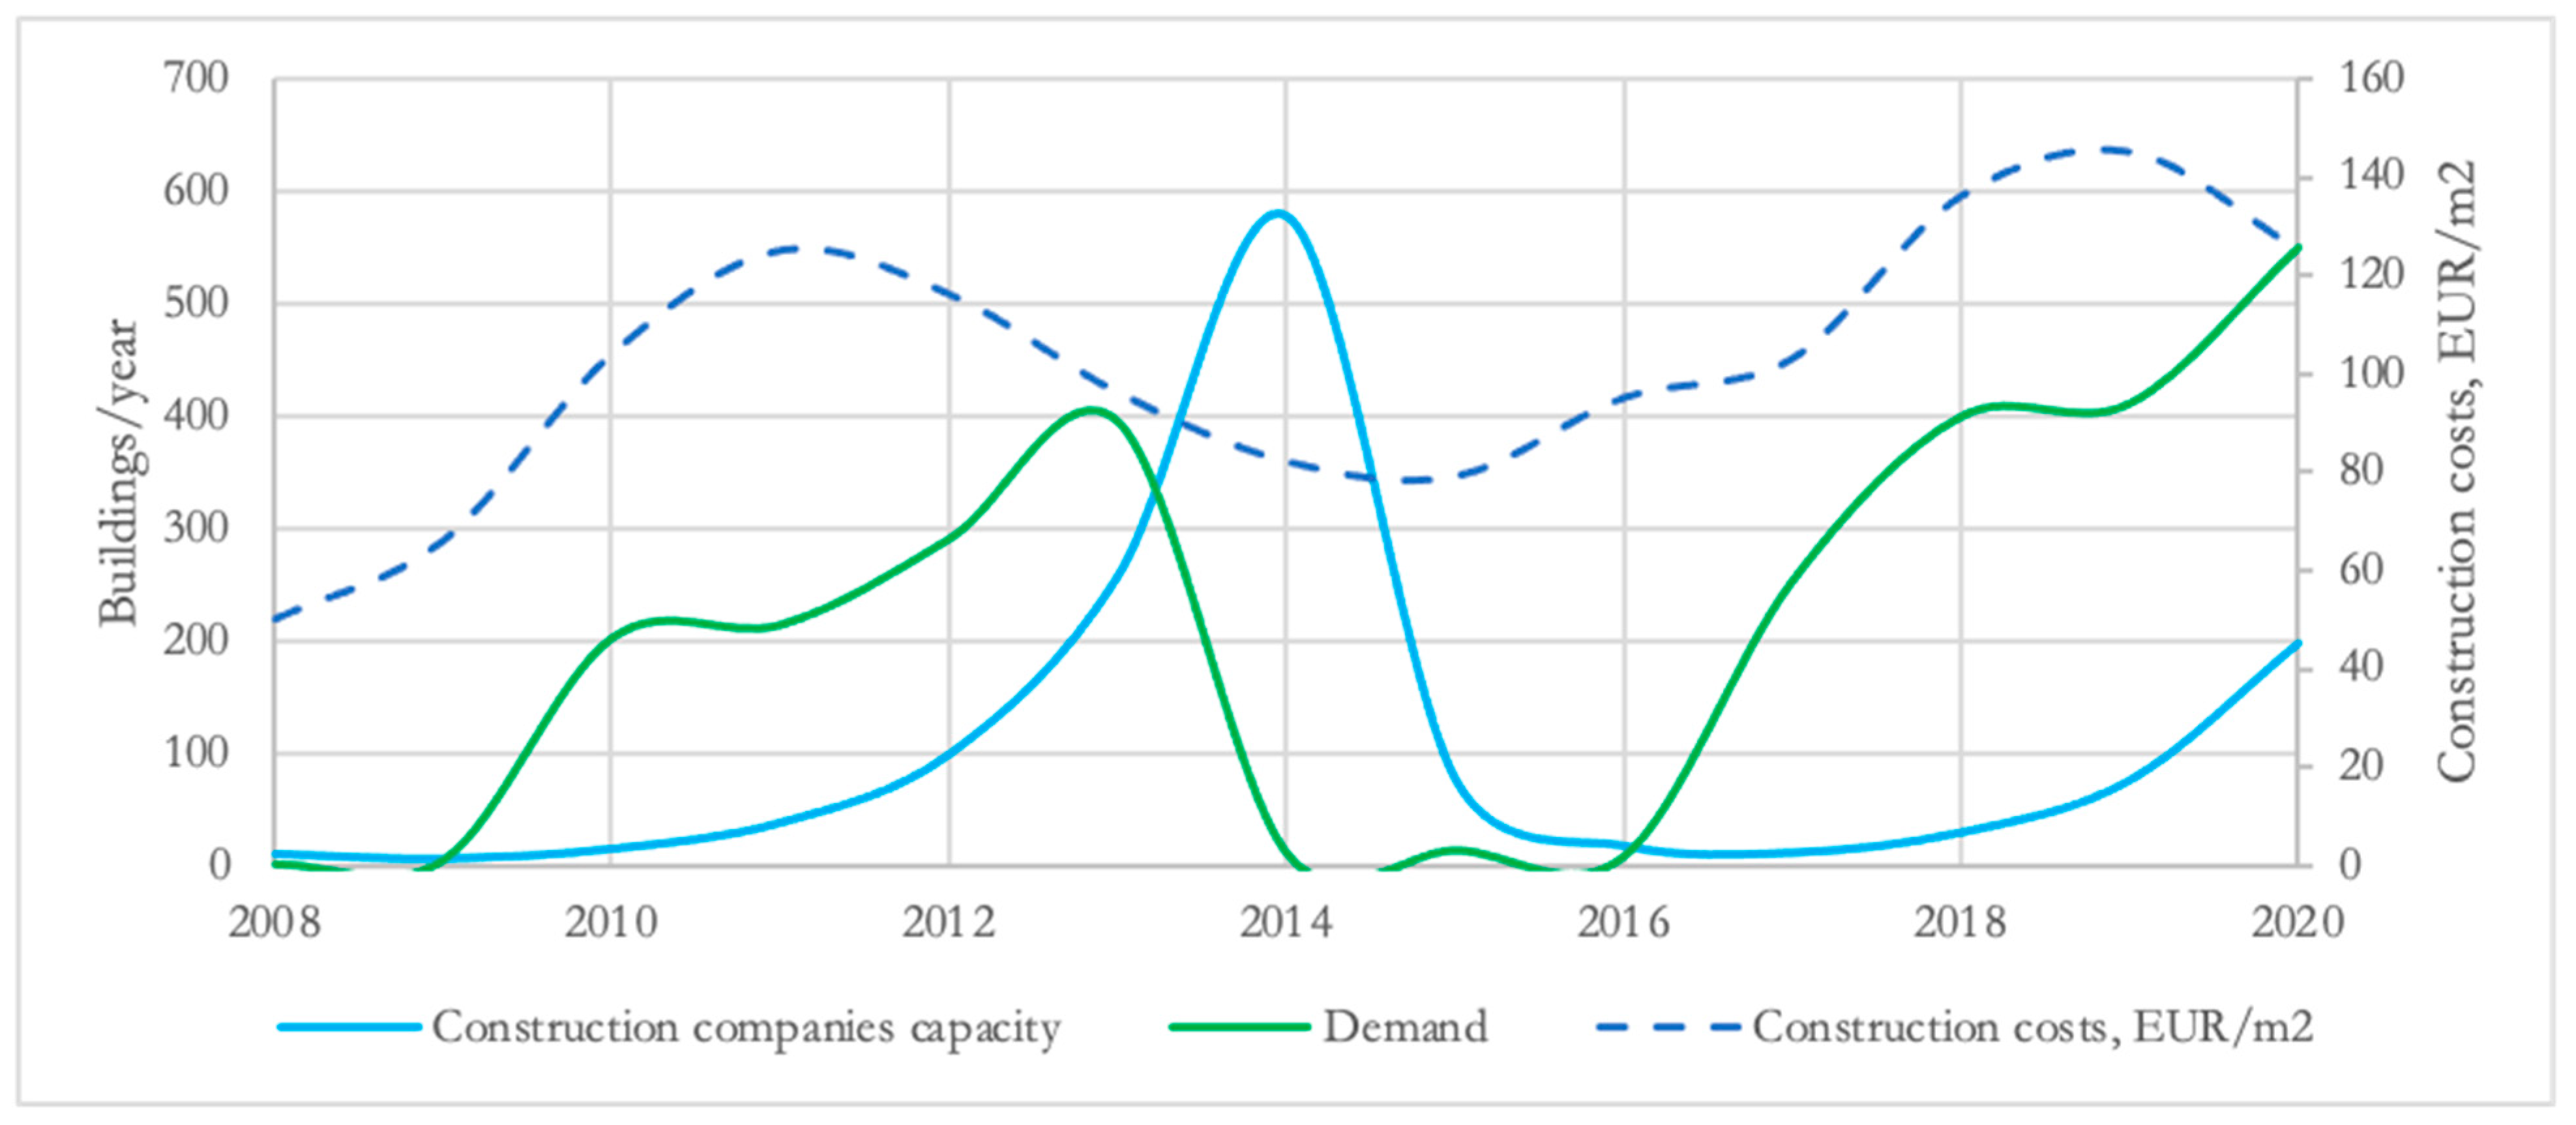
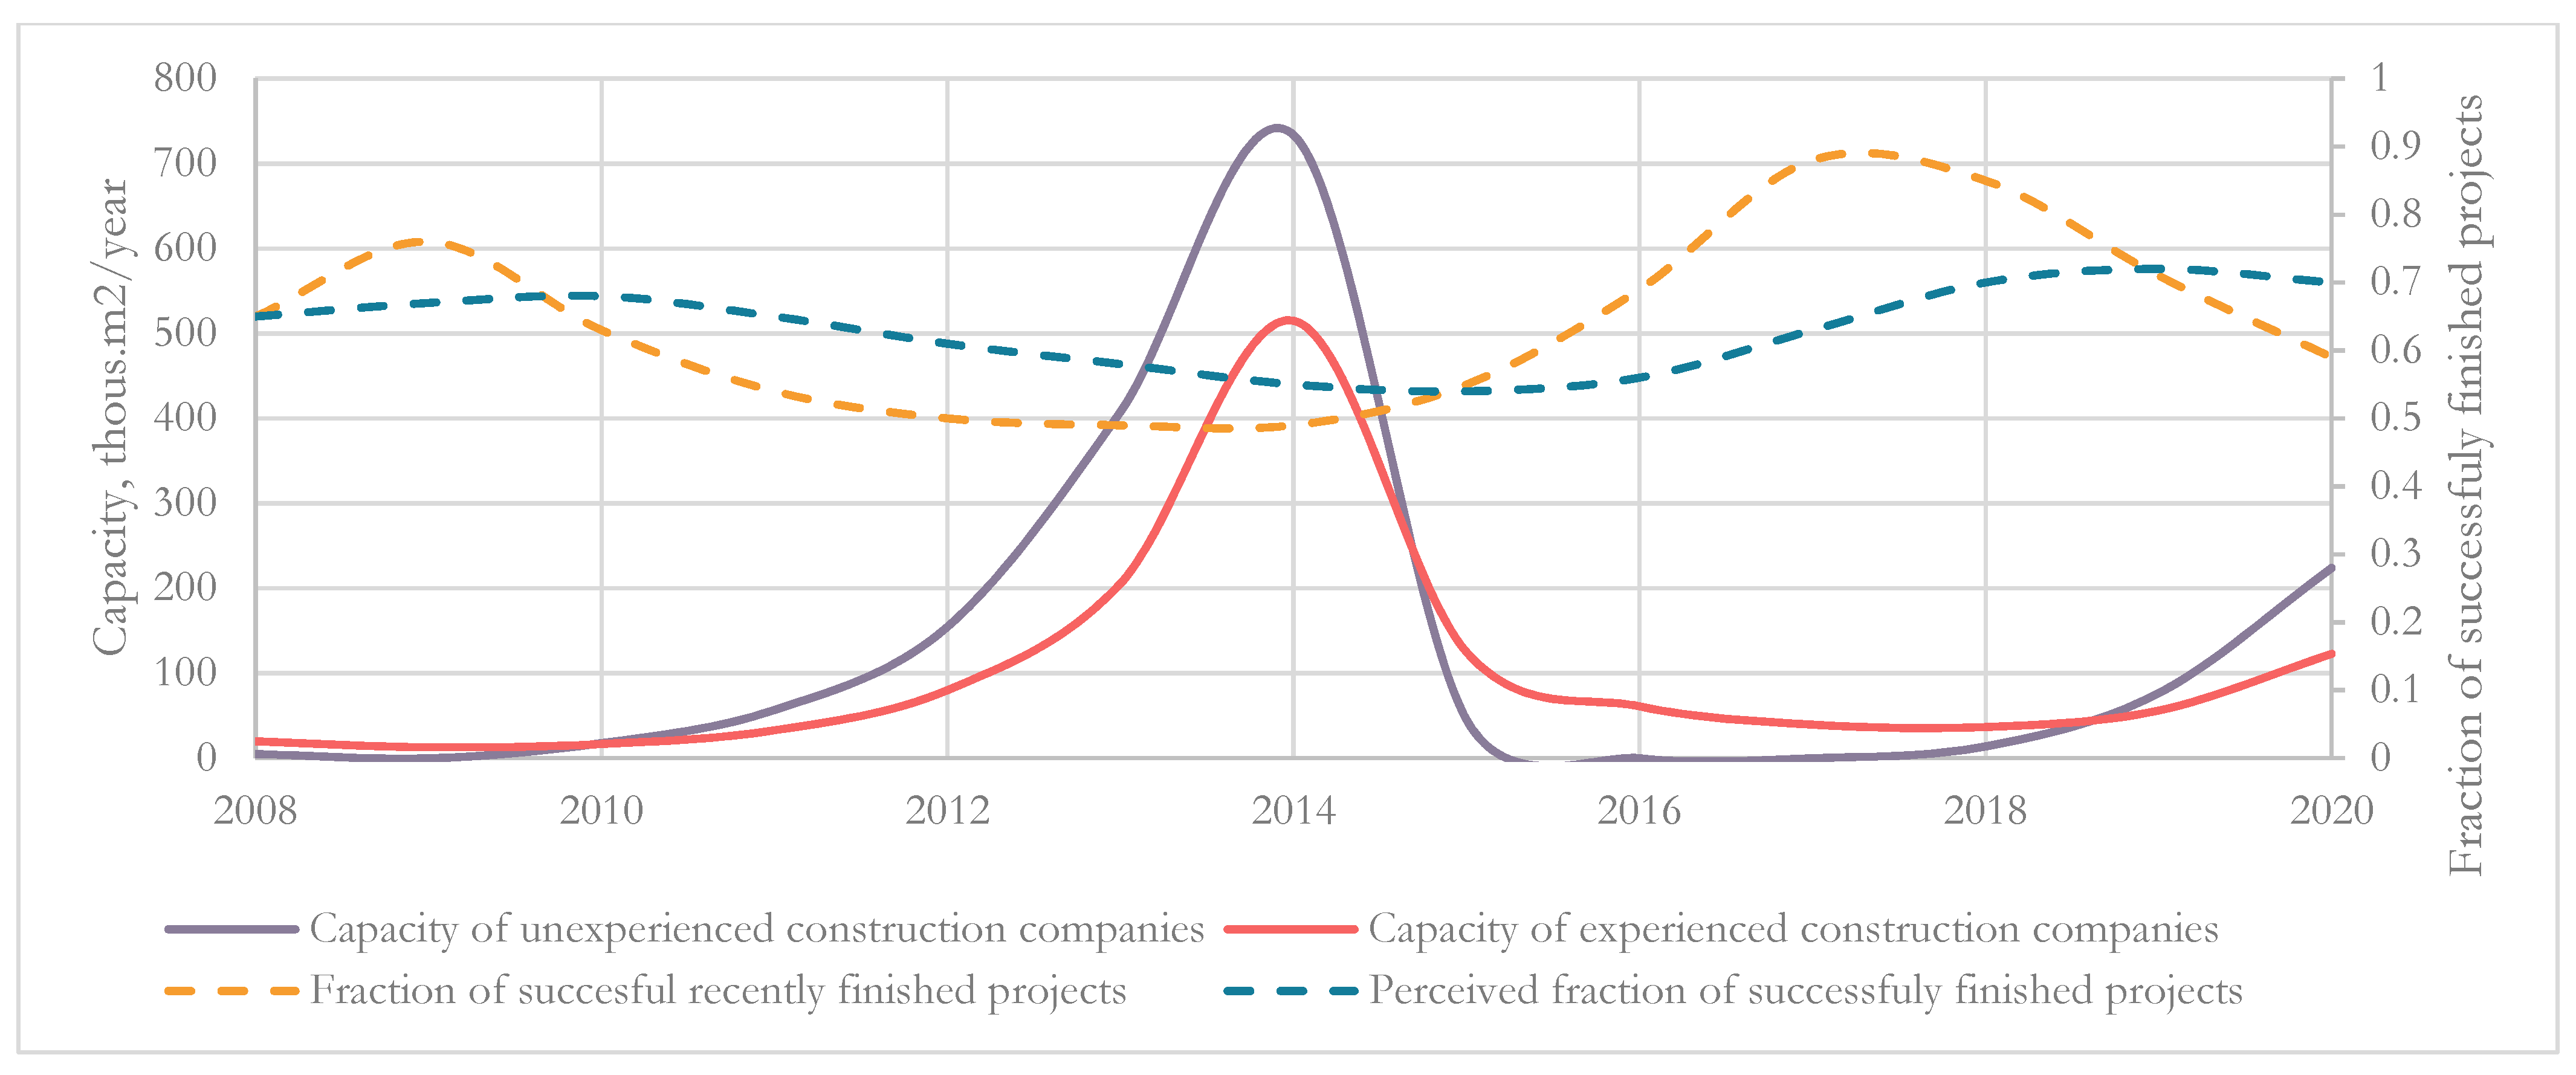
3.1.3. Delays and Construction Quality

Actual data on the implementation of energy efficiency projects show (see Figure 4) that there are delays between the submission, approval, contract signing, and finishing of a project. The experts involved in energy efficiency projects in multi-family buildings discussed delays and concluded that the implementation time of projects increased mainly due to bureaucratic barriers and the low quality of project management [52]. Simulation results in Figure 18 illustrate similar delays in the system if existing policy tools are applied.
If a penalty–reward scheme and EU funding are used in combination, the same delays are observed, but the total accumulated number of projects would be much higher in 2020 (see Figure 19).
The instability of EU funding has a significant impact on the demand and supply of construction capacity. The Ministry of Economics has defined the low quality of construction works as a problem. It has suggested that the selection of the constructor companies should be based on criteria of social responsibility, values, and reputation, instead of price offers [56]. Around 20% of public building renovation projects financed by Climate Change Financial Instrument have not reached expected savings, the main reasons being the low quality of energy audits (25%), technical specifications (20%), construction works (20%), and operation of buildings (35%) [57]. Building up capacity takes time, and this impacts the quality of construction works because quality is lower for inexperienced companies than for experienced companies (see Figure 20). This impacts the fraction of successfully completed projects, and it takes time for an apartment owner to perceive this fraction, which in turn has an impact on demand.
The stability of financing leads to an increased number of experienced construction companies (see Figure 21), an increased quality of works, and an increased fraction of successfully completed projects and demand.
Lower construction quality leads to a bad reputation of renovation works in general, causing a misperception in society, e.g., windows will blur, the renovation will cause molding, and there will be no fresh air in the room. Such bias comes from the low-quality works and experience in early 2000, and these myths still exist despite improvements in quality standards since then.

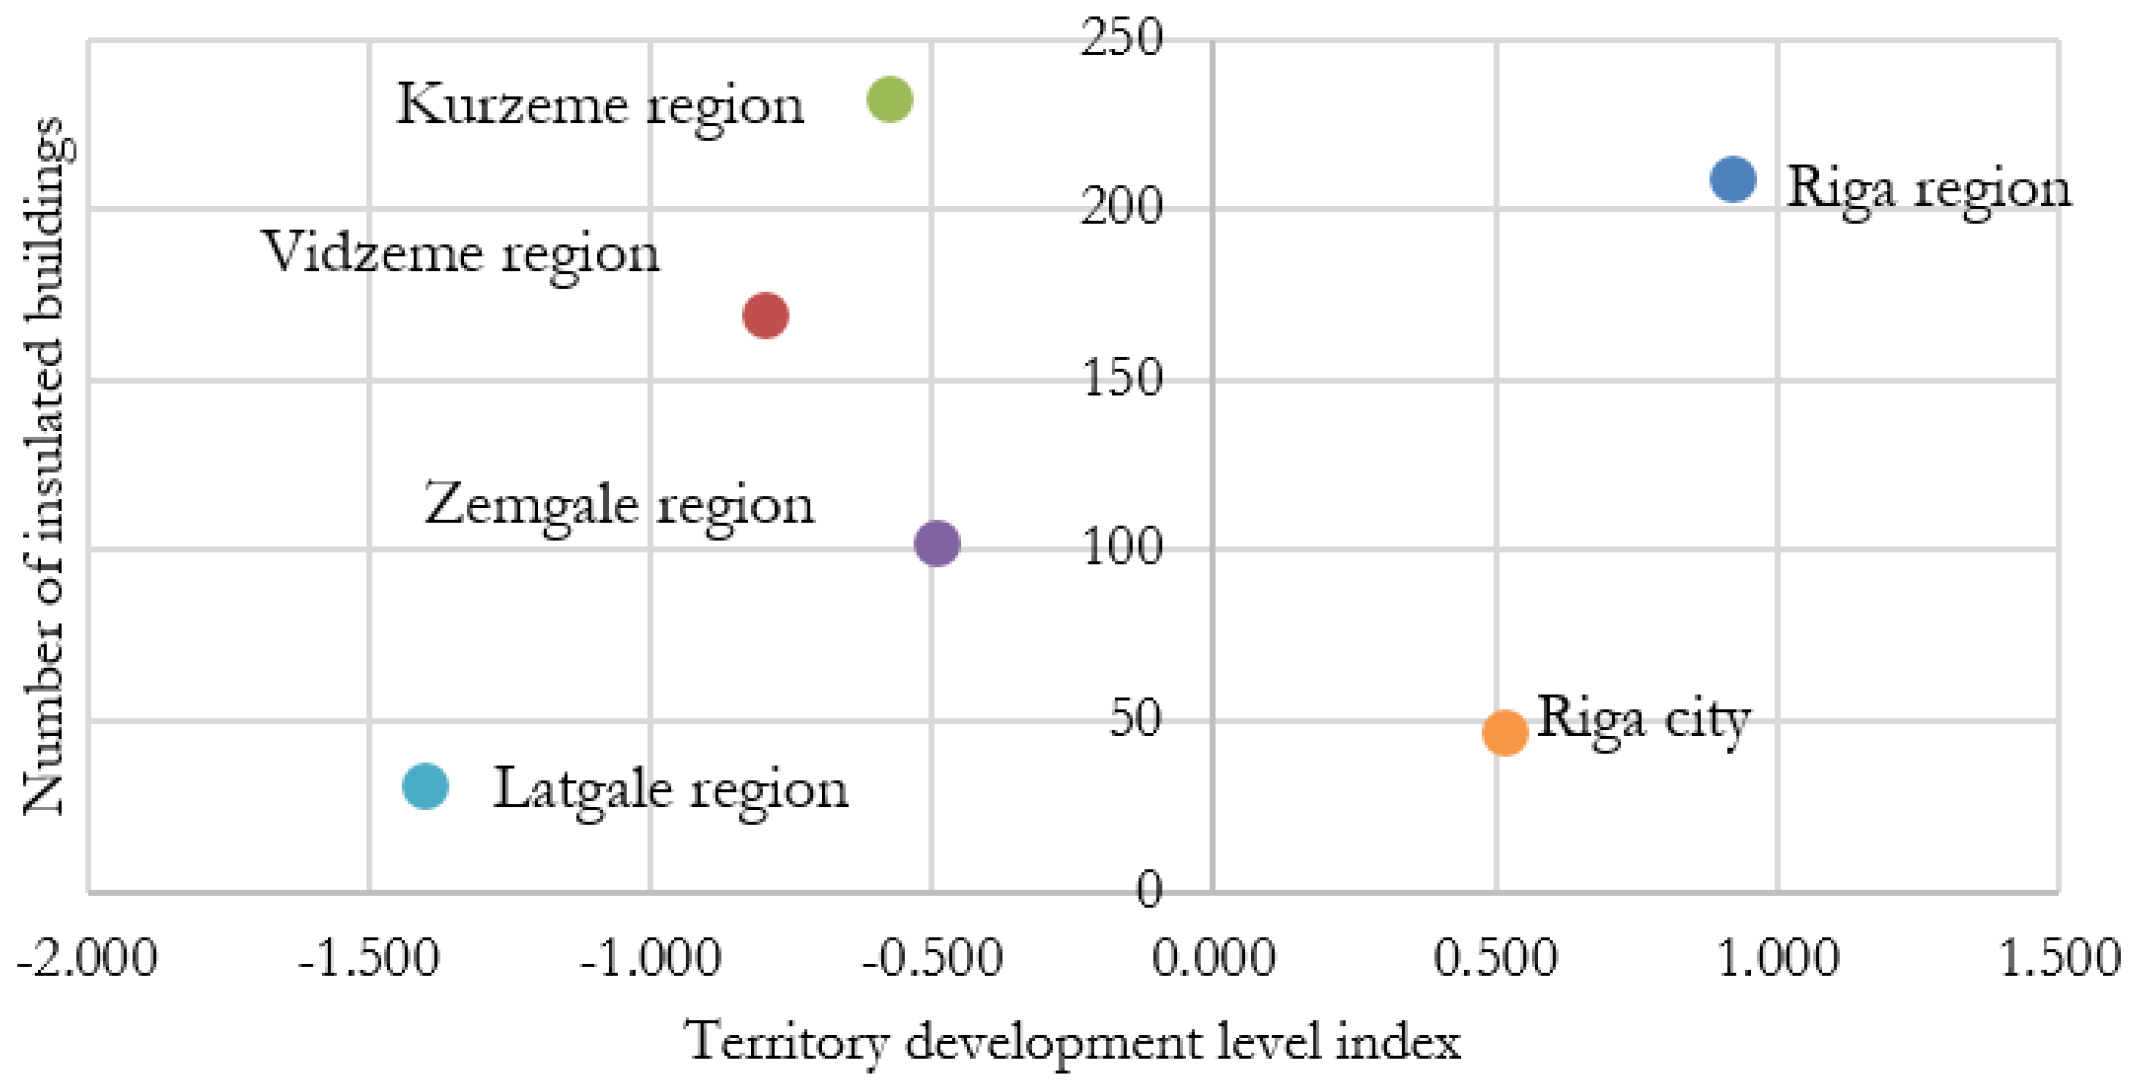
3.1.4. Social Context, Social Interactions, and Social Behavior

This study presents social context, social interactions, and social behavior as the word-of-mouth effect and social trust in strangers (outsiders) and neighbors (insiders). The word-of-mouth effect can either reinforce or mitigate the diffusion rate of renovation projects, and an increase in the share of successful projects reinforces diffusion while a reduction mitigates it. The dynamics of the word-of-mouth effect and its impact are mentioned by different stakeholders, e.g., in the city of Jelgava, “Buildings come and demand energy efficiency projects” [58], “In 2010, the owners of Mungidciems’ first house Saulītes agreed on the renovation. After completion of the project, its results and benefits were evaluated by neighbors; the difference in payments for heat was a reason to encourage others to follow the lead. There was a positive ‘backyard effect’” [59], etc.
On the other hand, the low quality of construction works causes a negative word-of-mouth effect. If the expected savings are not achieved, the payback time increases, creating problems for the building owners to pay back loans and receive planned benefits. That in turn gives rise to a negative word-of-mouth effect and a reduction in diffusion rate. Information spreads like an infection with a lower rate at the beginning (measured as living area renovated in m2 per year) and increasing as more buildings get renovated (see Figure 22). The word-of-mouth effect is higher for a sustainable funding scheme because more buildings are renovated.
Many project implementers value the aesthetical aspects and comfort gained with renovation projects. In small cities or villages, inhabitants of non-renovated buildings experience social pressure from neighbors due to the word-of-mouth effect for the degradation of the common landscape. As 12 years of project implementation experience shows, the most critical factor for the diffusion of renovation projects in multi-family buildings is social trust in “strangers”, e.g., public bodies and institutions and neighbors. The social trust of apartment owners determines the strength of cooperation with the municipality, housing maintenance company, and other “strangers”. The presence and activity of an insider (trustworthy apartment owner living in the building) who can champion and lead the project indicate the strength of social trust among neighbors. Many cases support this, e.g., “…multi-family building renovation in Latvia differs among different administrative territories and cities. Local factors and the cooperation of stakeholders are the key to starting a project. Public authorities manage energy efficiency programs, so the role of municipalities is individual…” [59], and “…how to get apartment owners to support renovation projects? The most important thing is the insider (apartment owner) from the building—how active he will be because, undeniably, he will be trusted the most. At best, 30% of all apartment owners come to the apartment owners’ collective meetings”, says T. Cīrulis. Furthermore, “The insider from the building talks to other apartment owners as much as possible, but the rest we contact and try to convince by ourselves….” [60]. A degradation of social trust in state institutions and banks has been observed since the economic crisis in 2008, bringing uncertainty and bias regarding banks and loans in general. In addition, there is a prejudice towards intermediates, with ESCO companies often seen as such.

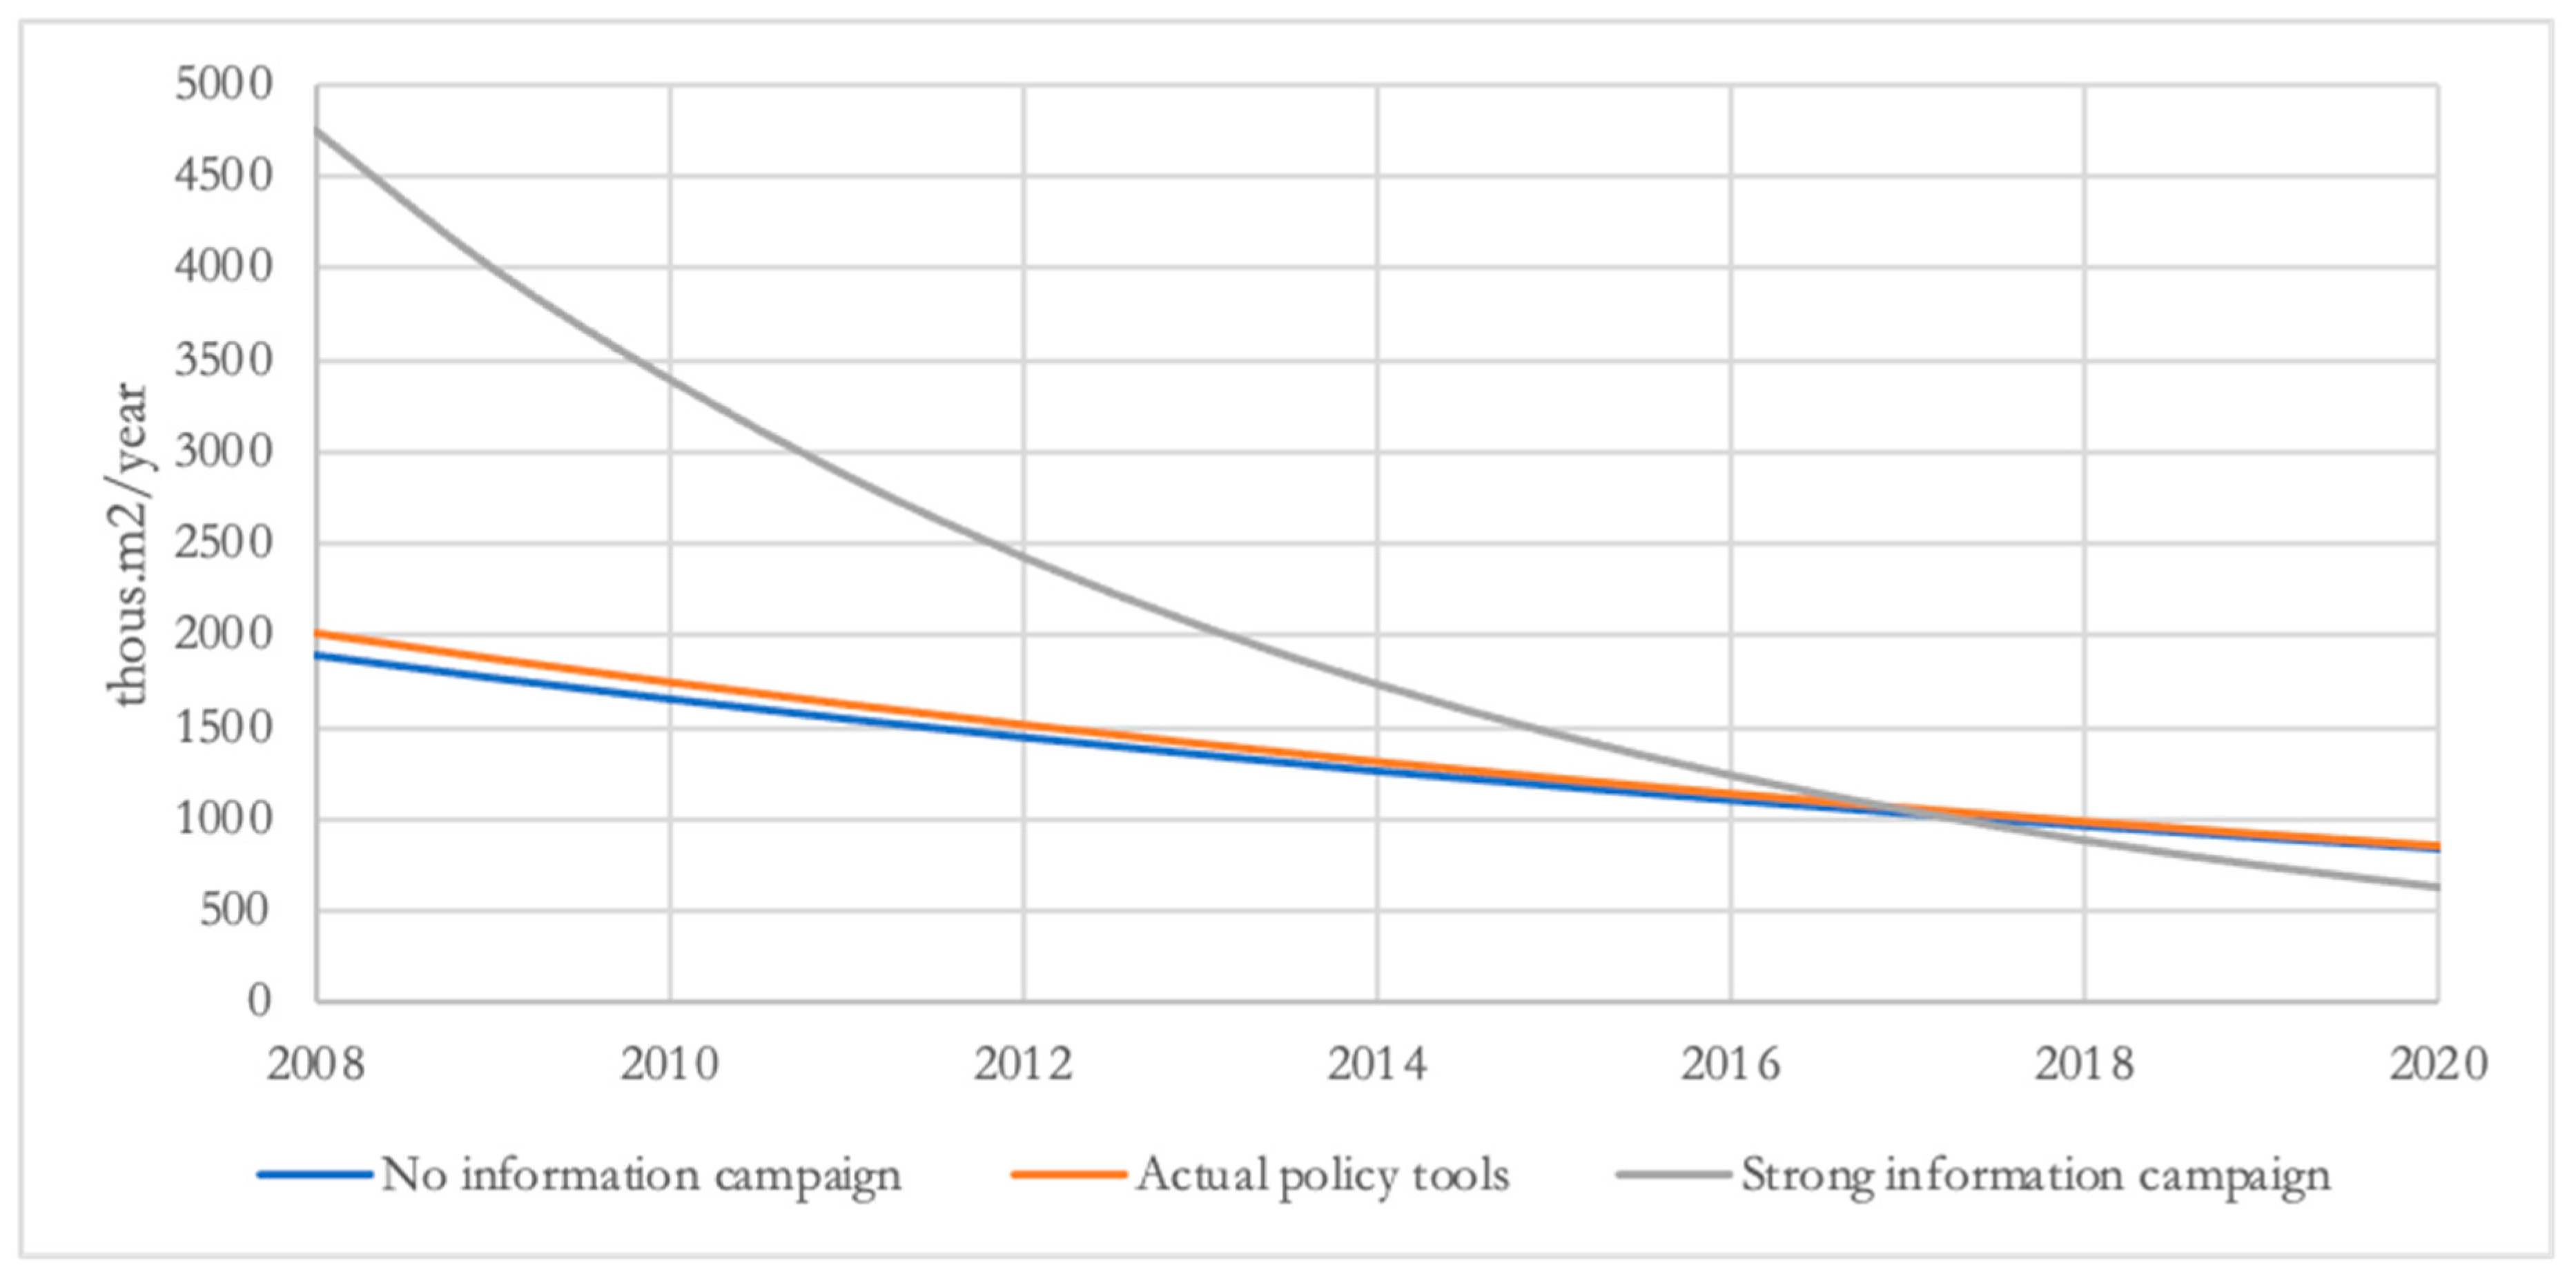
3.1.5. Information Dissemination

In combination with other policy tools, information activities can increase the insulation rate in both the short and long term. However, information activities must resonate with people’s central values [61], next to the content of the information program and how the information is presented [3]. In response to low awareness and interest in renovation projects, the ministry responsible for the program ran the information campaign “Let’s live warmer” from 2010 to 2020 (mainly grassroots activities such as seminars in municipalities). Four hundred and twenty-six events were organized, and 46,430 participants attended the information events, i.e., 7% of the target audience were reached during a ten-year period or 200 thousand m2 per year, assuming that all informed persons were not informed before [62]. The results of simulations (see Figure 23) show that the information campaign carried out is just a little stronger than no information campaign, and a more robust campaign is needed to increase the rate of informed buildings.

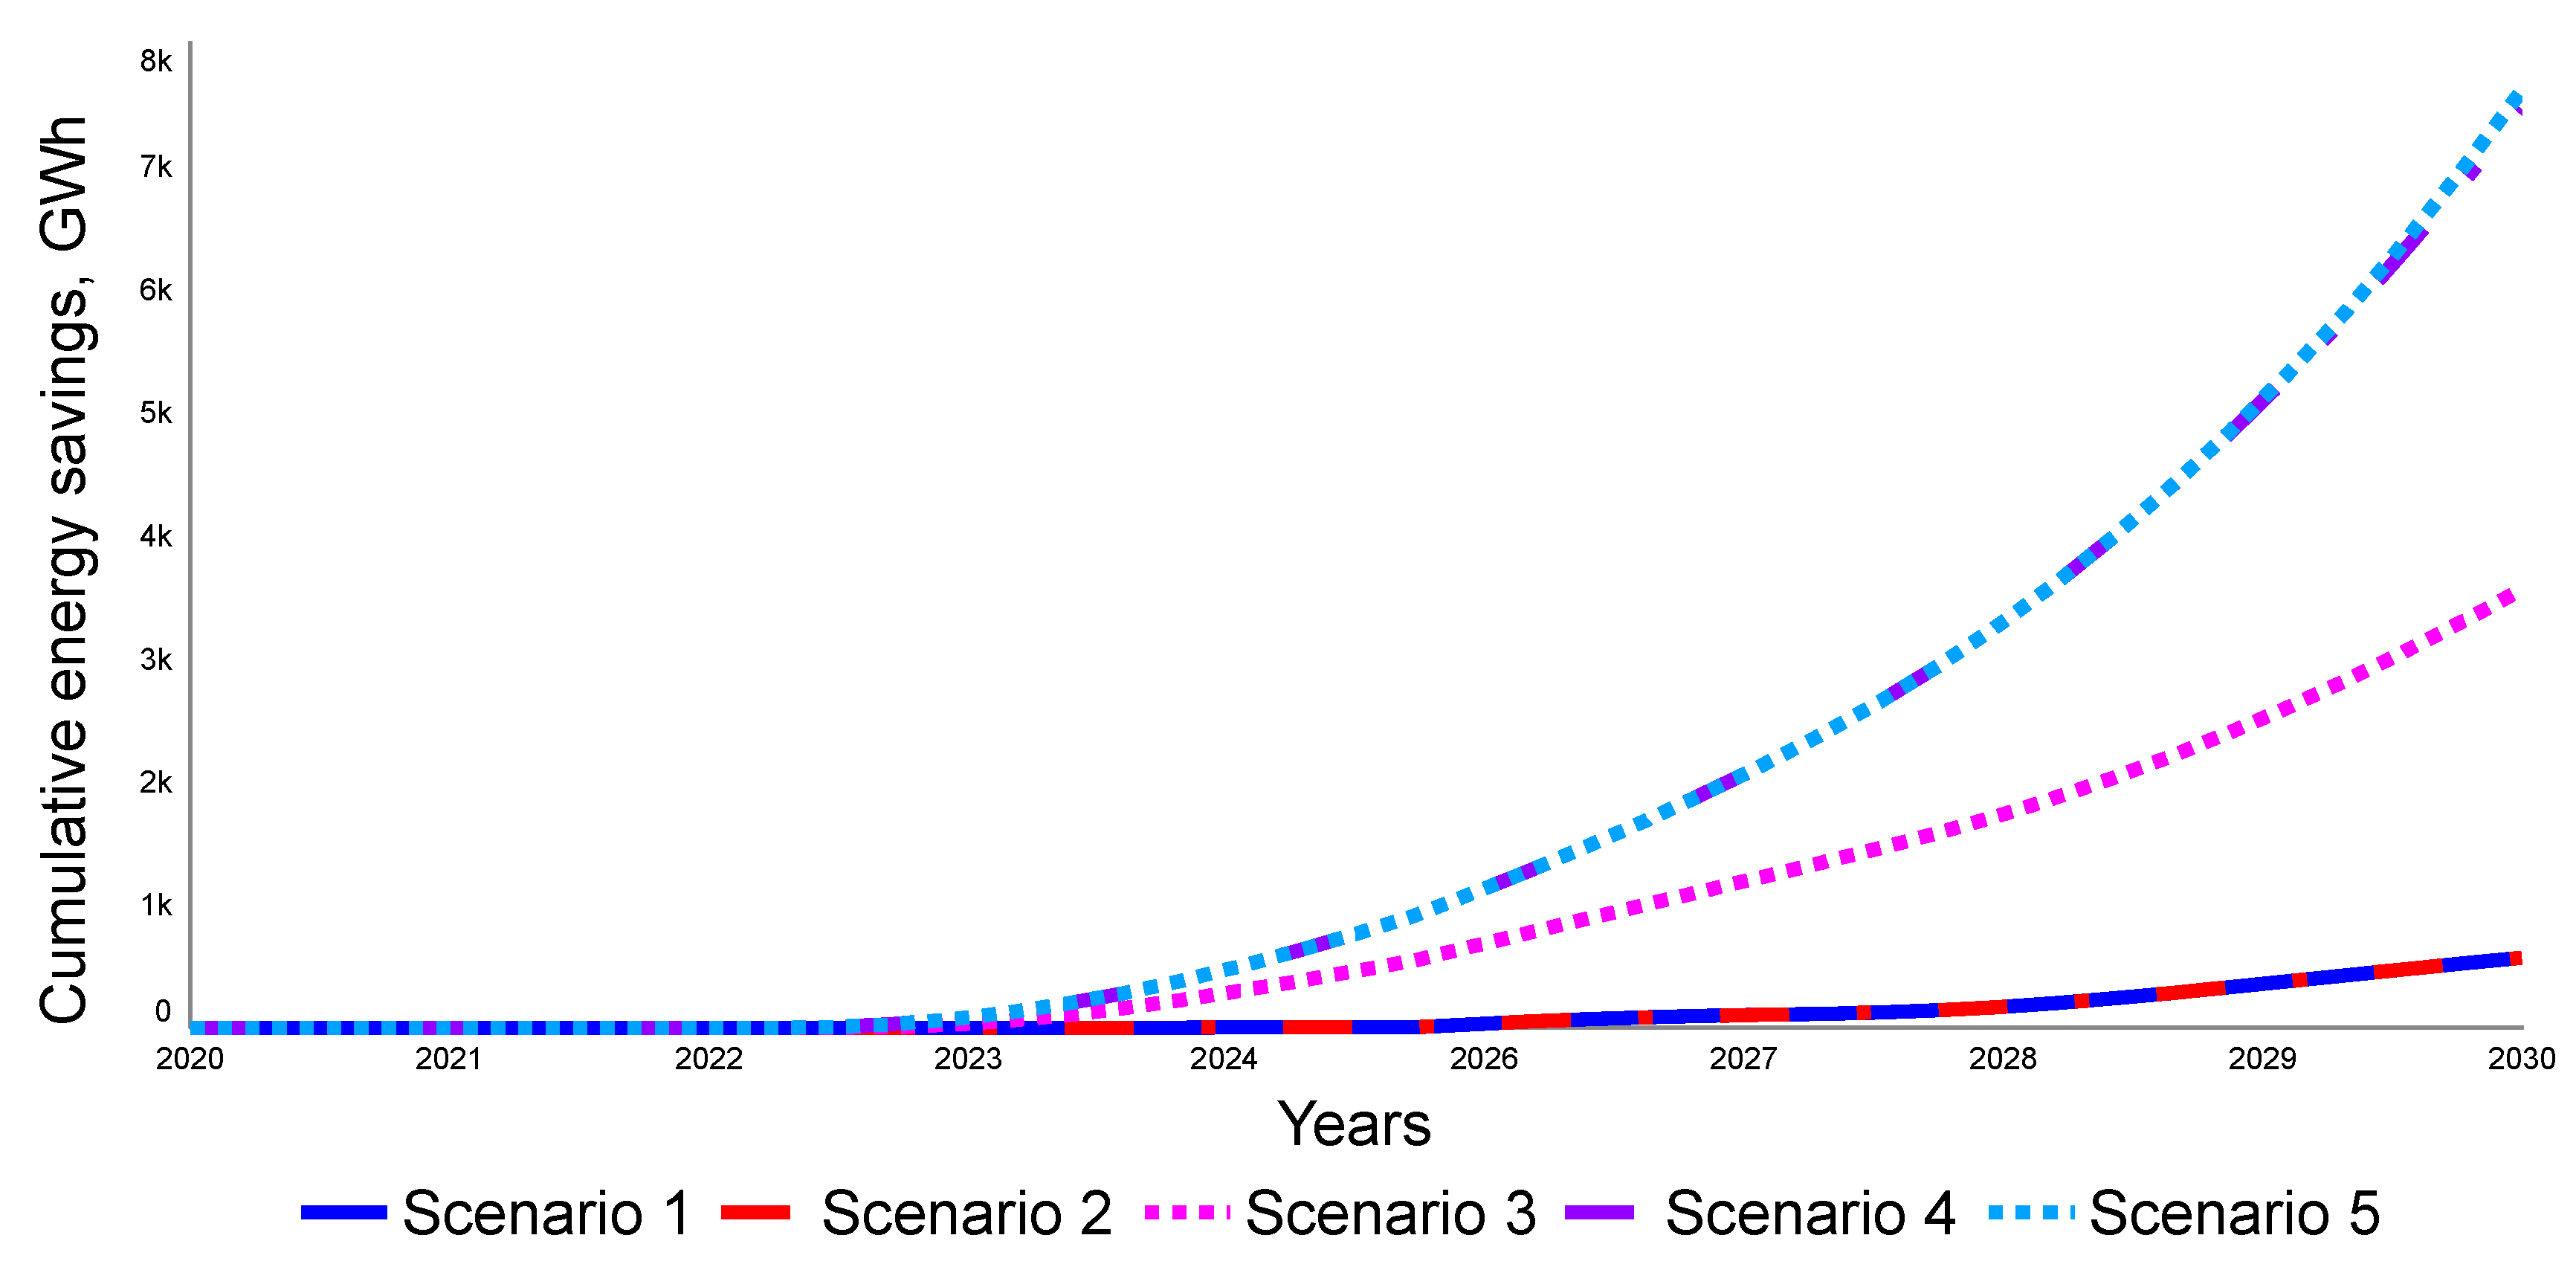
3.2. Future Scenarios

In this section, a series of scenarios that answer “what if” questions regarding the implementation of different policies displayed in the model interface are explored:
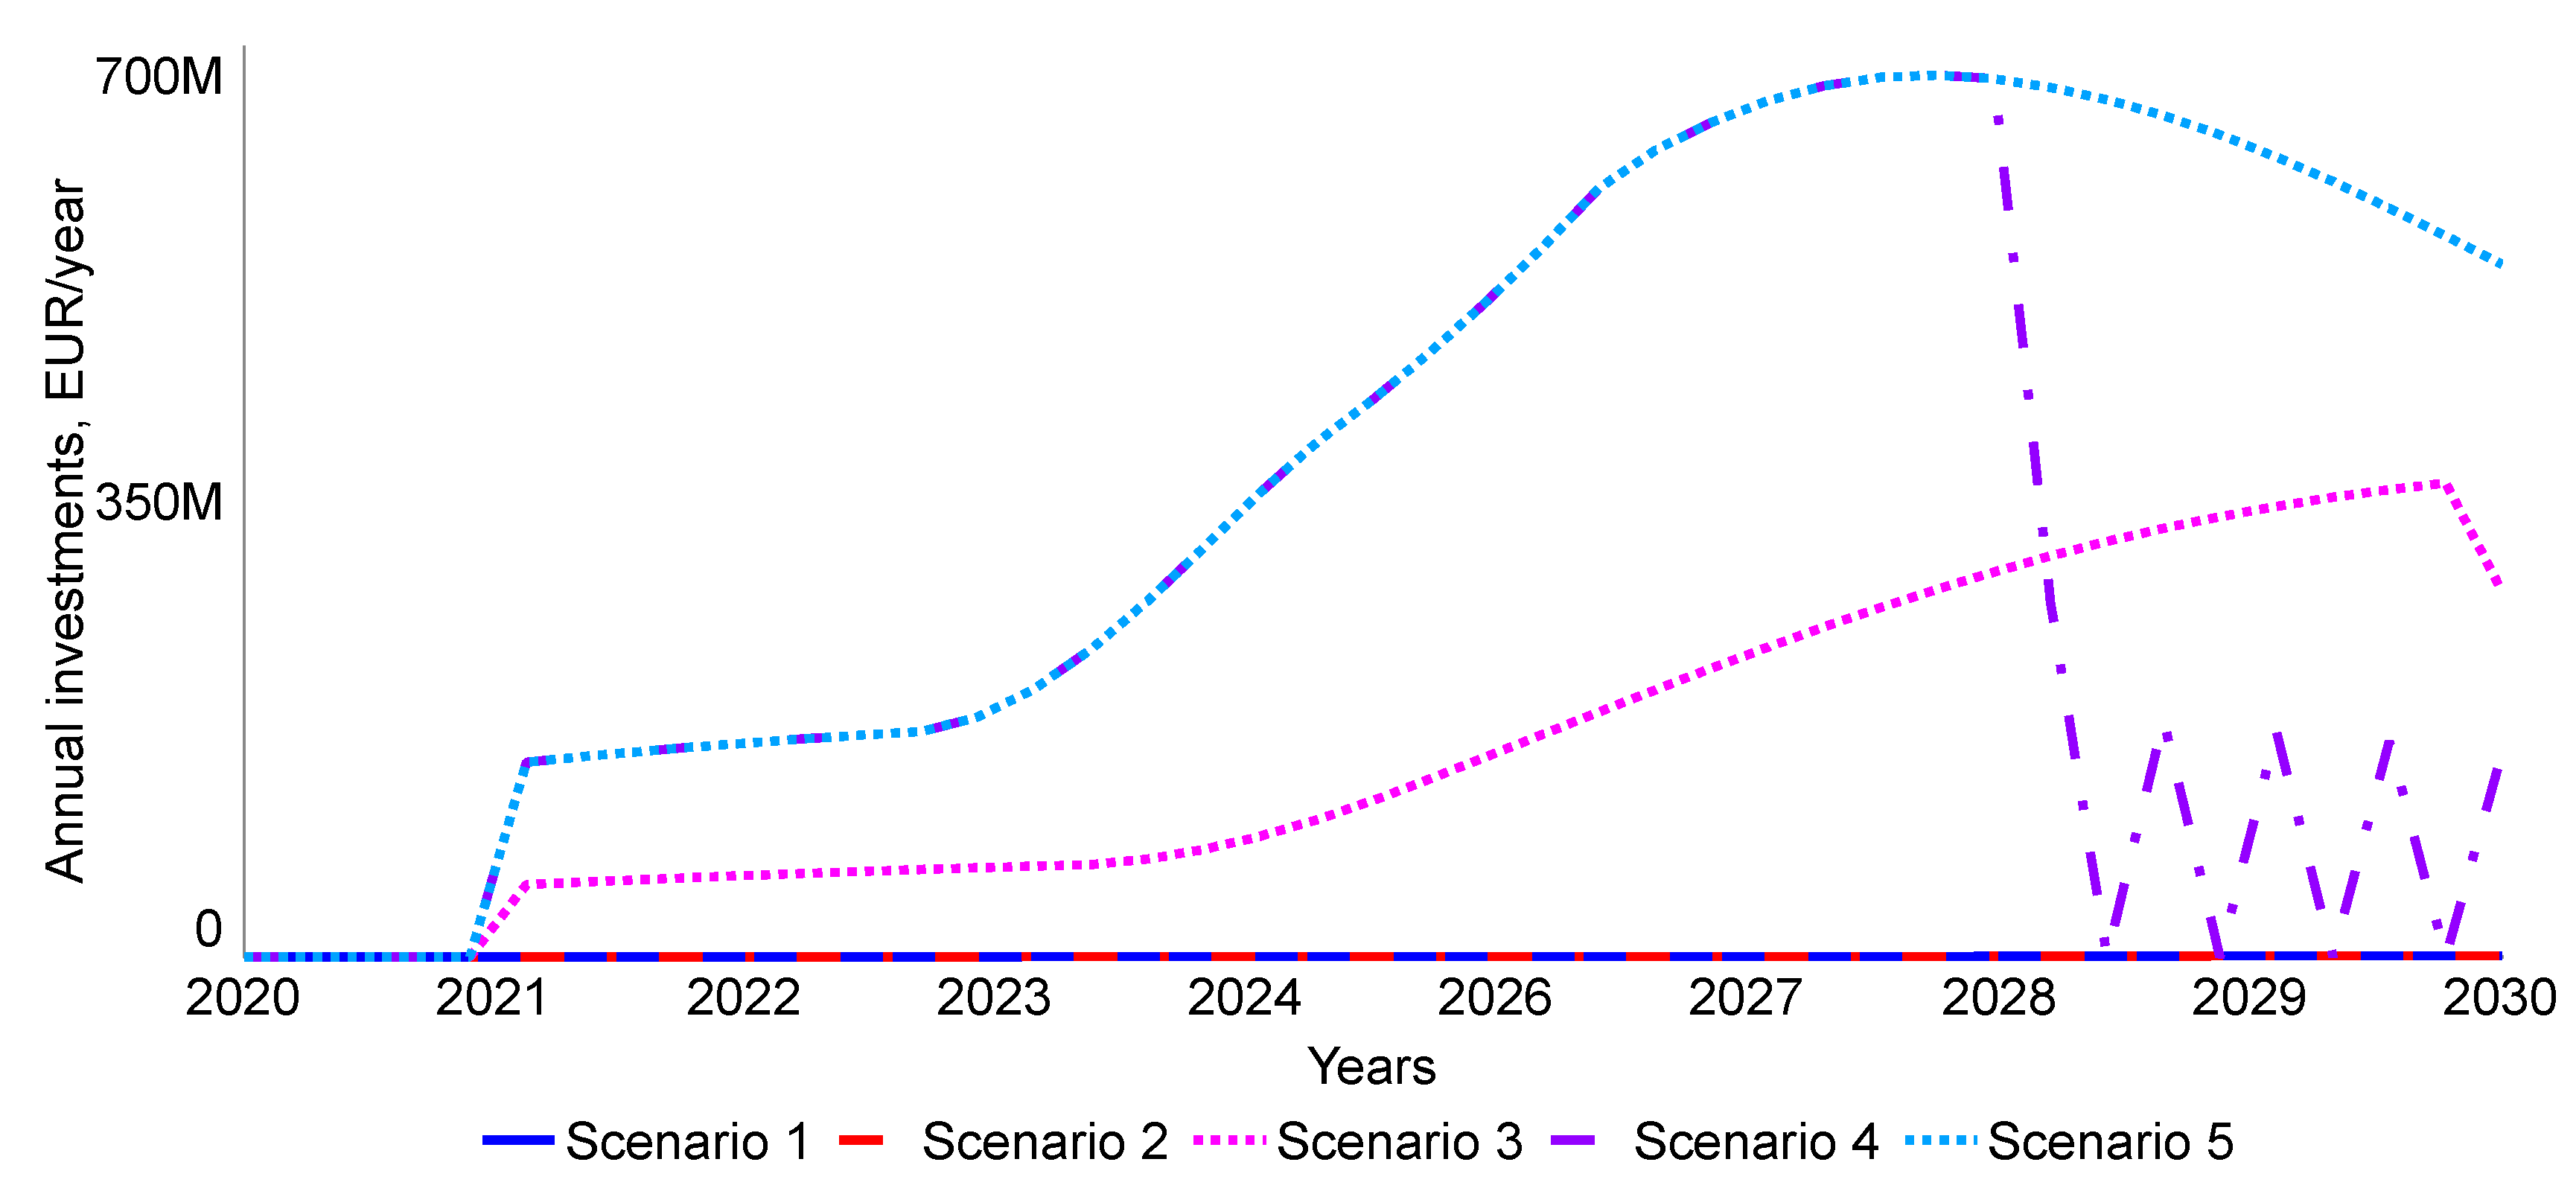
  • Scenario 1, or baseline scenario, is based on the current ongoing policy in Latvia according to the National Energy and Climate Plan 2030. In 2022, the total available EU funding is 200 million EUR (140 million EUR from the EU Multiannual finance framework and 140 million EUR from the EU Resilience Fund). The support intensity for multi-apartment buildings is 30%. The information is provided by the grassroots information activities via the campaign Let’s live warmer. In addition to that, energy efficiency obligation scheme is used for electricity providers with an annual savings goal of 1.50%.
  • Scenario 2 has the same set of policy tools as Scenario 1, but funding is increased three times and is 600 million EUR.
  • Scenario 3 has the same amount of EU funding as Scenario 1 and the same support intensity and is combined with other policy tools provided by the interface.
  • Scenario 4 has the same amount of EU funding as Scenario 2 and the same support intensity and is combined with other policy tools provided by the interface.
  • Scenario 5 has the same set of policy tools as Scenario 4, but funding is increased to 1000 million EUR.
More detailed information about each policy scenario is provided in Table 2.
Figure 24 illustrates the results of cumulative energy savings for all four scenarios, and Figure 25 shows results for annual costs for each scenario.
Scenario 1 results show that, by the current policy mechanisms, the actual cumulative savings in the housing sector will be 570 GWh by 2030, and the total cumulative costs will be 1.15 million EUR. The same results are reached in Scenario 2 and show that the result will not change even when multiplying the investment but not changing the policy tools. Scenario 3 shows that even by having the same amount of investments as in Scenario 1 and combining it with the targeted policy tools, the improvement could be reached. The cumulative savings will increase to 3600 GWh, the total cumulative costs will be 715 million EUR, and the annual investment rate will gradually increase over the years. Scenario 4 shows that cumulative savings will reach 7400 GWh, which is slightly lower than in Scenario 5. The total cumulative costs in Scenario 4 will reach 1285 million EUR, while in Scenario 5 it will be 1715 million EUR. The difference between both scenarios can be observed in Figure 19, wherein the annual investment rate differs from 2028. In Scenario 4, the available EU funding will be spent by 2028, and the penalty–reward scheme will provide co-financing for projects but not enough to co-finance all projects (up and down behavior shows that all income from the scheme will be immediately spent on projects). In Scenario 5, the amount from EU funding will still be available, and the implementation of projects will continue until 2030.

4. Discussions

Our first version of the system dynamics model was built to study the diffusion of energy efficiency measures in multi-family building stock at the dusk of policies in this sector and based solely on the literature and expert views. Simulation of human behavior was limited to a single parameter, “uncertainty costs”. In this study, the attitude–behavior–context model was used to supplement the model with a behavior sub-module. Knowledge was elicited about the real system from scientific literature, the experts, and the stakeholders, and was validated with the data from experience and the group model building sessions. However, the model can be improved further by applying other social theories, such as the network theory.
The system dynamics model’s structure was built for aggregated parameters, which limits the application of this modeling approach to study social dynamics evolving from individual behavior as it can be achieved with other simulation methods, e.g., agent-based modeling. This should be considered in further studies because “…all social phenomena, and especially the function of all social institutions, should always be understood as resulting from the decisions, actions, attitudes, etc. of human individuals, and … we should never be satisfied by an explanation in terms of so-called ‘collectives’….” [63].
Another significant limitation of the study was the size of the model. One of the essential aspects of modeling is to keep models as simple as possible by making them complex enough to explain the behavior generated by the system’s structure. Traditionally, most of the research undertaken on energy efficiency has focused on a specific factor, such as cost-effectiveness, or policy initiative, such as financial support, while if the total effect is considered at all, it is assumed to be the sum of the parts. However, a lack of focus on the bigger picture can miss the interactions between factors at different levels and the holistic nature of this issue. On the other hand, considering every possible factor and every causal link between them may be as imprecise as the research on single factors. This limitation was addressed by building the model with the focus on balance between simplicity and complexity by setting the boundaries of the system and defining factors, policy initiatives, and limiting causal and feedback links.

5. Conclusions

Our study shows how seemingly positive policy tools set the stage for a series of unintended adverse effects due to the complex interactions between different system components and how the common assumption that information and financial support should result in significant energy efficiency diffusion results is impeding national energy efficiency goals. The system of the multi-family building sector is far more complex than what is intuitively assumed because there are several major reinforcing and balancing mechanisms in the system that can counter the effects of energy efficiency policy tools used by the government.
Similar to other studies [64,65], this study shows that rapid and substantial changes in available funding can destabilize a system due to multiple feedback loops and delays. For steep and short-term growth in complex system, these effects are not intuitive [31]. A lack of long-term policy planning caused two waves of funding from 2008 to 2020 and resulted in a wide array of adverse effects for energy efficiency policy such as the misbalance between supply and demand of construction services causing an oscillation in price, pay-back time, net benefits, and quality of construction works, an addiction to financial support based on EU funding, and a negative word-of-mouth effect. The results show that the capacity of construction companies adjusted slowly to the demand, and a significant gap arose between the demand and the capacity supply. This in turn affected the renovation costs, thus dampening the demand via a negative feedback loop to catch up with demand. If the renovation costs are high, net benefits decrease and the rate of building renovation decreases. Two other negative feedback loops balanced the demand for the services of construction companies. The first loop was aroused at the early stages when capacity grew very fast, i.e., as demand rises, more inexperienced companies enter the market, leading to an increase in unsuccessful projects. The second loop balanced out the reinforcing process of an information campaign due to the impact of unsuccessful projects delivered by inexperienced companies. The negative loop of availability of the reinvestment sources dampened ESCOs supply. The reinforcing effect of the information campaign was weak, while the word-of-mouth effect reinforced renovation processes, especially outside the capital city.
The implementation of energy efficiency policy between 2008 and 2020 revealed other vital drivers for the diffusion of energy efficiency projects in multi-family buildings, such as social trust and strength of cooperation between the municipality, housing maintenance company, and the insider (trustworthy apartment owner living in the building) who can champion and lead the project. These drivers increase the probability of investing in energy efficiency, which in turn increases the rate of renovation. These findings coincide with a similar study carried out in the multi-family building sector in Slovenia [66]. Other studies [67,68] also underline the importance of the role of a trustworthy neighbor; they suggest that the information provided by block leaders (persons belonging to the same social network and using face-to-face interactions) is a very effective intervention. People conform to social norms because it is a mental shortcut to address complexity in decision making, and it is essential because social norms can effectively induce behavioral change [69]. The word-of-mouth effect reinforces and mitigates the diffusion of renovation projects because they bring forth social comparison and increase social norms in favor of energy efficiency.
Sustained, smooth, and predictable funding levels set the conditions for the necessary stability in the system. Penalty–reward schemes can be used as one of the alternatives for stabilizing the system. Combined with other policy tools, such as excessive information campaign and investment in R&D, as well as an increase in building sector standards, diffusion of energy efficiency measures in multi-family buildings can be enhanced. As simulation results show, a combination of different policy tools provides a reinforcing effect while not increasing the total costs.

Author Contributions

This research is the joint efforts of all authors. Conceptualization and methodology, A.B., D.B. and G.B.; software and validation, A.B. and G.B.; for-mal analysis and investigation, I.I., J.N. and D.B.; resources and data curation, S.V., I.I. and J.N.; writing—original draft preparation, A.B.; writing—review and editing, S.V., D.B. and G.B.; visualization, S.V.; supervision, project administration and funding acquisition, G.B. All authors have read and agreed to the published version of the manuscript.

Funding

This research was funded by Ministry of Economics of Latvia in terms of the National Research Program Energy project VPP-EM-EE-2018/1- 0004, assessment and analysis of energy efficiency policies.

Institutional Review Board Statement

Not applicable.

Informed Consent Statement

Not applicable.

Data Availability Statement

Not applicable.

Acknowledgments

This paper is developed in the scope of the National Research Program Energy project VPP-EM-EE-2018/1-0004, assessment and analysis of energy efficiency policies.

Conflicts of Interest

The authors declare no conflict of interest.

References

  1. European Commission. The European Green Deal; Communication from the Commission to the European Parliament; The European Council; The Council, The European Economic and Social Committee and the Committee of the Regions: Brussels, Belgium, 2019; 640p. [Google Scholar]
  2. Eurostat. Energy Consumption and Use by Households. 2019. Available online: https://ec.europa.eu/eurostat/web/products-eurostat-news/-/DDN-20190620-1 (accessed on 8 May 2021).
  3. Cattaneo, C. Internal and external barriers to energy efficiency: Which role for policy interventions? Energy Effic. 2019, 12, 1293–1311. [Google Scholar] [CrossRef] [Green Version]
  4. European Commission. Revision of the Energy Performance of Buildings Directive 2010/31/EU, Inception Impact Assessment; Ref.Ares 1397833; European Comission: Brussels, Belgium, 2021. [Google Scholar]
  5. Labanca, N.; Bertoldi, P. Beyond energy efficiency and individual behaviours—Policy insights from social practice theories. Energy Policy 2018, 115, 494–502. [Google Scholar] [CrossRef]
  6. Gardner, G.T.; Stern, P.C. Environmental Problems and Human Behavior; Pearson Custom Publishing: Boston, MA, USA, 2002. [Google Scholar]
  7. Wiese, C.; Larsen, A.; Pade, L.-L. Energy Efficiency Policy: A Review of Instruments and Potential Interaction Effects. In Proceedings of the 40th Annual IAEE International Conference, Singapore, 18–21 June 2017. [Google Scholar]
  8. Casado, F.; Hidalgo Carmen, M.; Garcia-Leiva, P. Energy efficiency in households—The effectiveness of different types of messages in advertising campaigns. J. Environ. Psychol. 2017, 53, 198–205. [Google Scholar] [CrossRef]
  9. Ebrahimigharehbaghi, S.; Qian, K.Q.; Meijer, M.F.; Visscher, J.H. Unravelling Dutch homeowners’ behaviour towards energy efficiency renovations—What drives and hinders their decision-making. Energy Policy 2019, 129, 546–561. [Google Scholar] [CrossRef]
  10. Wilson, C.; Crane, L.; Chryssochoidis, G. Why do homeowners renovate energy efficiently? Contrasting perspectives and implications for policy. Energy Res. Soc. Sci. 2015, 7, 12–22. [Google Scholar] [CrossRef] [Green Version]
  11. Caird, S.; Roy, R.; Herring, H. Improving the energy performance of UK households: Results from surveys of consumer adoption and use of low- and zero carbon technologies. Energy Effic. 2008, 1, 149–166. [Google Scholar] [CrossRef]
  12. Ramos, A.; Labandeira, X.; Löschel, A. Pro-environmental households and energy efficiency in Spain. Environ. Resour. Econ. 2015, 63, 367–393. [Google Scholar] [CrossRef]
  13. Trotta, G. The determinants of energy efficient retrofit investments in the English residential sector. Energy Policy 2018, 120, 175–182. [Google Scholar] [CrossRef]
  14. Heinzle, S.L. Disclosure of energy operating cost information: A silver bullet for overcoming the energy-efficiency gap? J. Consum. Policy 2012, 35, 43–64. [Google Scholar] [CrossRef]
  15. Camilleri, A.R.; Larrick, R.P. Metric and scale design as choice architecture tools. J. Public Policy Mark. 2014, 33, 108–125. [Google Scholar] [CrossRef]
  16. Ungemach, C.; Camilleri, A.R.; Johnson, E.J.; Larrick, R.P.; Weber, E.U. Translated attributes as choice architecture: Aligning objectives and choices through decision signposts. Manag. Sci. 2017, 64, 1975–2471. [Google Scholar] [CrossRef] [Green Version]
  17. Tsagarakis, P.; Karyotakis, K.; Zografakis, N. Implementation conditions for energy saving technologies and practices in office buildings—Part 2. Double glazing windows, heating and air-conditioning. Renew. Sustain. Energy Rev. 2012, 16, 3986–3998. [Google Scholar] [CrossRef]
  18. Girod, B.; Stucki, T.; Woerter, M. How do policies for efficient energy use in the household sector induce energy-efficiency innovation. An evaluation of European countries. Energy Policy 2017, 103, 223–237. [Google Scholar] [CrossRef]
  19. Kivimaa, P.; Kern, F. Creative destruction or mere niche support. Innovation policy mixes for sustainability transitions. Res. Policy 2016, 45, 205–217. [Google Scholar] [CrossRef] [Green Version]
  20. Fresner, J.; Morea, F.; Krenn, C.; Uson, J.A.; Tomasi, F. Energy efficiency in small and medium enterprises—Lessons learned from 280 energy audits across Europe. J. Clean. Prod. 2017, 142, 1650–1660. [Google Scholar] [CrossRef]
  21. Rosenow, J.; Kern, F.; Rogge, K. The need for comprehensive and well targeted instrument mixes to stimulate energy transitions—The case of energy efficiency policy. Energy Res. Soc. Sci. 2017, 33, 95–104. [Google Scholar] [CrossRef]
  22. Kamal, A.; Al-Ghamdi, S.G.; Koc, M. Revaluing the costs and benefits of energy efficiency—A systematic review. Energy Res. Soc. Sci. 2019, 45, 68–84. [Google Scholar] [CrossRef]
  23. Blumberga, A.; Žogla, G.; Laicāne, I. Planning and Evaluation Tools for Energy Efficiency Policy in the Housing Sector in Latvia. In Proceedings of the International Energy Program Evaluation Conference, Rome, Italy, 12–14 June 2012. [Google Scholar]
  24. Pikasa, E.; Kurnitski, J.; Liias, R.; Thalfeldt, M. Quantification of economic benefits of renovation of apartment buildings as a basis for cost optimal 2030 energy efficiency strategies. Energy Build. 2015, 86, 151–160. [Google Scholar] [CrossRef]
  25. Kern, F.; Kivimaa, P.; Martiskainen, M. Policy packaging or policy patching. The development of complex energy efficiency policy mixes. Energy Res. Soc. Sci. 2017, 23, 11–25. [Google Scholar] [CrossRef] [Green Version]
  26. Cunningham, P.; Edler, J.; Flanagan, K.; Laredo, P. Innovation Policy Mix and Instrument Interaction: A Review. Available online: https://media.nesta.org.uk/documents/innovation_policy_mix_and_instrument_interaction.pdf (accessed on 30 August 2021).
  27. Rosenow, J.; Fawcett, T.; Eyre, N.; Oikonomou, V. Energy Saving Policies and Energy Efficiency Obligation Schemes. D5.1 Combining of Energy Efficiency Obligations and Alternative Policies. Available online: https://enspol.eu/sites/default/files/results/D5.1Combining%20of%20Energy%20Efficiency%20Obligations%20and%20alternative%20policies.pdf (accessed on 30 August 2021).
  28. European Commission. A Renovation Wave for Europe—Greening Our Buildings, Creating Jobs, Improving Lives; Communication from the Commission to the European Parliament; The European Council; The Council, The European Economic and Social Committee and The Committee Of The Regions: Brussels, Belgium, 2019; 662p. [Google Scholar]
  29. Geels, F.W. Technological transitions as evolutionary reconfiguration processes: A multi-level perspective and a case-study. Res. Policy 2002, 31, 1257–1274. [Google Scholar] [CrossRef] [Green Version]
  30. Ripple, W.J.; Wolf, C.; Newsome, T.M.; Galetti, M.; Alamgir, M.; Crist, E.; Mahmoud, M.I.; Laurance, W.F. World Scientists’ Warning to Humanity: A Second Notice. BioScience 2017, 67, 1026–1028. [Google Scholar] [CrossRef]
  31. Forrester, J.W. Counterintuitive behavior of social systems. Technol. Forecast. Soc. Chang. 1971, 3, 1–22. [Google Scholar] [CrossRef]
  32. Moxnes, E. Misperceptions of basic dynamics: The case of renewable resource management. Syst. Dyn. Rev. 2004, 20, 139–162. [Google Scholar] [CrossRef]
  33. Rahmandad, H.; Sterman, J.D. Heterogeneity and Network Structure in the Dynamics of Diffusion: Comparing Agent-Based and Differential Equation Models. Manag. Sci. 2008, 54, 998–1014. [Google Scholar] [CrossRef] [Green Version]
  34. Arthur, W.B. Positive Feedbacks in the Economy. Sci. Am. 1990, 262, 92–99. [Google Scholar] [CrossRef]
  35. Sterman, J. Business Dynamics: Systems Thinking and Modeling for a Complex World; McGraw-Hill: New York, NY, USA, 2000. [Google Scholar]
  36. Foxon, T.J.; Hammond, G.P.; Pearson, P.J.G. Developing transition pathways for a low carbon electricity system in the UK. Technol. Forecast. Soc. Chang. 2010, 77, 1203–1213. [Google Scholar] [CrossRef] [Green Version]
  37. Rotmans, J.; Loorbach, D. Complexity and transition management. J. Ind. Ecol. 2009, 13, 184–196. [Google Scholar] [CrossRef] [Green Version]
  38. De Gooyert, V.; Rouwette, E.; van Kranenburg, H.; Freeman, E.; van Breen, H. Sustainability transition dynamics; Towards overcoming policy resistance. Technol. Forecast. Soc. Chang. 2016, 111, 135–145. [Google Scholar] [CrossRef] [Green Version]
  39. Cabinet of Ministers of Latvia. Ministru Kabineta Rīkojums Nr.266, Par Latvijas Republikas Pirmo Energoefektivitātes Rīcības Plānu 2008–2010.Gadam. (Latvia First Energy Efficiency Action Plan 2008–2010) 20 May 2008; Cabinet of Ministers of Latvia: Riga, Latvia, 2008. [Google Scholar]
  40. Cabinet of Ministers of Latvia. Ministru Kabineta Rīkojums Nr.460. Par Latvijas Republikas Otro Energoefektivitātes Rīcības Plānu 2011–2013.Gadam. (Latvia Second Energy Efficiency Action Plan 2011–2013) 16 September 2011; Cabinet of Ministers of Latvia: Riga, Latvia, 2011. [Google Scholar]
  41. Cabinet of Ministers of Latvia. Ministru Kabineta Rīkojums Nr. 257. Par Energoefektivitātes Politikas Alternatīvo Pasākumu Plānu Enerģijas Galapatēriņa Ietaupījuma Mērķa 2014–2020. Gadam Sasniegšanai. (On the Energy Efficiency Policy Alternative Action Plan to Achieve the 2014–2020 Energy End-Use Savings Target) 24 May 2017; Cabinet of Ministers of Latvia: Riga, Latvia, 2017. [Google Scholar]
  42. Ministry of Economics of Latvia. Renovēto ēku Statistika. (Statistics of Renovated Buildings). 2021. Available online: https://www.em.gov.lv/lv/renoveto-eku-statistika (accessed on 30 August 2021).
  43. Forrester, J.; Senge, P. Tests for building confidence in system dynamics models. TIMS Stud. Manag. Sci. 1980, 14, 209–228. [Google Scholar]
  44. Blumberga, A.; Zogla, G.; Moxnes, E.; Davidsen, P. Residential Energy Efficiency Policy in Latvia: A System Dynamics Approach. In Proceedings of the 29th International Conference of the System Dynamics Society, Washington, DC, USA, 24–28 July 2011; pp. 373–396. [Google Scholar]
  45. Blumberga, A.; Blumberga, D.; Bažbauers, G.; Žogla, G.; Laicāne, I. Sustainable Development Modelling for the Energy Sector. J. Clean. Prod. 2014, 63, 134–142. [Google Scholar] [CrossRef]
  46. Cabinet of Ministers of Latvia. Reģionālās Attīstības Uzraudzības un Novērtēšanas Kārtība. (Regulation on Regional Development Assessment and Monitoring) 1 July 2014; Ministru Kabineta Noteikumu Nr. 367; Cabinet of Ministers of Latvia: Riga, Latvia, 2014. [Google Scholar]
  47. Stern, P.C.; Oskamp, S. Handbook of Environmental Psychology; Wiley: New York, NY, USA, 1987. [Google Scholar]
  48. Lewin, K. Field theory and experiment in social psychology: Concepts and methods. Am. J. Sociol. 1939, 44, 868–896. [Google Scholar] [CrossRef]
  49. Vennix, J.A.M. Group Model Building: Facilitating Team Learning Using System Dynamics; John Wiley & Sons: Hoboken, NJ, USA, 1996. [Google Scholar]
  50. Andersen, D.F.; Richardson, G.P.; Vennix, J.A.M. Group model building: Adding more science to the craft. Syst. Dyn. Rev. 1997, 13, 187–201. [Google Scholar] [CrossRef] [Green Version]
  51. Barlas, Y. Formal aspects of model validity and validation in system dynamics. Syst. Dyn. Rev. 1996, 12, 183–210. [Google Scholar] [CrossRef]
  52. Rimma, A. Namu Pārvaldnieka un Ekspertu Sadarbība Energoefektivitātes Projektos. Problēmas un Ieteikumi. (Cooperation of Building Manager and Experts in Energy Efficiency Project. Problems and Suggestions) Diskusija Energoefektivitātes Projekti un to Kvalitātes Uzlabošanas Iespējas. Rīga. 20 March 2017. Available online: https://www.youtube.com/watch?v=l9-WmijAueU&list=PLKEejtELkPcs89J9Z28SQjA50wf6LC-9k (accessed on 30 August 2021).
  53. Kazlauskaite, A. Financial Instruments for Energy Efficiency in the Programming Period 2014–2020. 2019. Available online: https://www.fi-compass.eu/sites/default/files/publications/presentation_20161020_vienne_agne_kazlauskaite_1.pdf (accessed on 10 August 2021).
  54. Levionoka, O. SIA “RenESCO” Rezultāti un Pieredze no Esošajiem Projektiem Latvijā (RenESCO Results and Experience from Renovation Projects in Latvia). 2020. Available online: https://50001seaps.eu/fileadmin/user_upload/3_RENESCO_Pieredze_rezultati_eku_renovacija.pdf (accessed on 10 August 2021).
  55. Ministry of Economics of Latvia. Energoservisa Pakalpojumu Uzņēmumu Finanšu Pieejamības Ex-ante Izvērtējums. (Ex-ante Evaluation of Financial Availability of Energy Service Companies). 2017. Available online: https://www.fi-compass.eu/content/ex-ante-assessment-summary-latvia-financial-accessibility-energy-efficiency-improvement (accessed on 10 August 2021).
  56. Valantis, E. Pasākumi Būvniecības Kvalitātes Celšanai, t.sk. Būvspeciālistu un Setificējošās Iestādes Atbildība. (Measures to Improve the Quality of Construction, Incl. the Responsibility of the Construction Specialist and the Certifying Authority). 27 March 2017. Available online: https://www.youtube.com/watch?v=ae5jPrHQPHM&list=PLKEejtELkPcs89J9Z28SQjA50wf6LC-9k&index=6&t=0s (accessed on 5 August 2021).
  57. Liepkalns, V. Energoefektivitātes Rādītājs—Svarīgs Kritērijs ēku Atjaunošanas Projektos (Energy Efficiency Indicator—Important Criteria in Renovation Projects, Workshop) Energoefektivitātes Garantija—Viens no Risinājumiem Kvalitatīvai ēku Atjaunošanai, 29 September 2020, Riga. Available online: https://sharex.lv/wp-content/uploads/VLiepkalns_LVIF.pdf (accessed on 8 May 2021).
  58. Kukuts, O. Daudzdzīvokļu Dzīvojamo Māju Energoefektivitātes Paaugstināšana—Dzīvokļu Īpašnieku Ilgtspējīgs Lēmums. (Improving the Energy Efficiency of Apartment Buildings—A Sustainable Decision for Apartment Owners) Workshop “Energoefektivitāte Ilgtspējīgai Nākotnei”. 5 July 2019. Available online: https://www.slideshare.net/siltinam/ku-energoefektivitte-133417947 (accessed on 10 August 2021).
  59. Pētersone, K. Pirmais Jaunās Energoefektivitātes Programmas Objekts—Nu Visas Ciema Daudzdzīvokļu Ēkas Nosiltinātas (The First Object of the New Energy Efficiency Program Is Now All the Apartment Buildings in the Village have been Renovated). 2017. Available online: http://www.zalabriviba.lv/jaunumi/pirmais-jaunas-energoefektivitates-programmas-objekts-nu-visas-ciema-daudzdzivoklu-ekas-nosiltinatas/ (accessed on 11 August 2021).
  60. Helmane, I. Daudzdzīvokļu Māju Siltināšanas Pieredze. (Experience of Multi-Family Building Renovation Projects). 2018. Available online: https://lvportals.lv/norises/292875-daudzdzivoklu-maju-siltinasanas-pieredze-2018 (accessed on 13 August 2021).
  61. Steg, L.; Perlaviciute, G.; van der Werff, E. Understanding the human dimensions of a sustainable energy transition. Front. Psychol. 2015, 6, 805. [Google Scholar] [CrossRef] [PubMed] [Green Version]
  62. Ministry of Economics of Latvia. Information about Communication Campaign. 2020. Available online: https://www.slideshare.net/siltinam/dzvo-siltk-10 (accessed on 5 August 2021).
  63. Popper, K. The Open Society and Its Enemies; Routledge: Oxfordshire, UK, 1945. [Google Scholar]
  64. Rosenow, J.; Eyre, N. A post mortem of the Green Deal: Austerity, energy efficiency, and failure in British energy policy. Energy Res. Soc. Sci. 2016, 21, 141–144. [Google Scholar] [CrossRef]
  65. Gomez, M.; Ghaffarzadegan, N.; Larson, R.C. Unintended effects of changes in NIH appropriations: Challenges for biomedical research workforce development. In Proceedings of the 30th International Conference of the System Dynamics Society, St. Gallen, Switzerland, 22–26 July 2012. [Google Scholar]
  66. Cerinsek, G.; Bancic, D.; Podjed, D.; D’Oca, S.; Vetrsek, J.; Dolinsek, S.; Op’t Veld, P. Boosting affordability, acceptability and attractiveness of deep energy renovations of residential buildings—A people-centred ethnographic approach. In Proceedings of the CLIMA 2019, Bucharest, Romania, 26–29 May 2019. [Google Scholar]
  67. Allcott, H. Social norms and energy conservation. J. Public Econ. Spec. Issue Role Firms Tax Syst. 2011, 95, 1082–1095. [Google Scholar] [CrossRef] [Green Version]
  68. Abrahamse, W.; Steg, L. Social influence approaches to encourage resource conservation: A meta-analysis. Glob. Environ. Chang. 2013, 23, 1773–1785. [Google Scholar] [CrossRef]
  69. Schultz, P.W.; Nolan, J.M.; Cialdini, R.B.; Goldstein, N.J.; Griskevicius, V. The constructive, destructive, and reconstructive power of social norms. Psychol. Sci. 2007, 18, 429–434. [Google Scholar] [CrossRef] [PubMed] [Green Version]
Figure 1. Actual and planned cumulative energy savings for multi-family buildings in Latvia.
Energies 14 07792 g001
Figure 2. Methodology of the study (the dark-colored boxes present the scope of the study) (EE—energy efficiency; ESCO—energy service company).
Energies 14 07792 g002
Figure 3. The territory development level index of regions/cities and number of renovated projects in different regions from 2008 to 2013.
Energies 14 07792 g003
Figure 4. Attitude–behavior–context model for energy efficiency implementation in the residential sector (adjusted from (Stern and Oskamp, 1987)).
Energies 14 07792 g004
Figure 5. Broad causal loop diagram for the residential energy efficiency improvement process. Reinforcing loops are shown with symbols “R” and balancing loops are shown with symbols “B”.
Energies 14 07792 g005
Figure 6. Survey responses on whether it is worth participating in the insulation of respondents’ homes (“I am ready to support the initiative of my neighbours, not to initiate it myself”).
Energies 14 07792 g006
Figure 7. Generic stock and flow structure for decision making in multi-family building sector sub-module.
Energies 14 07792 g007
Figure 8. Effect of perceived relative change in a factor (the values on x-axis) on the indicated probability of investing in energy efficiency (the values on y-axis): (a) additional payment for energy efficiency measures added to the monthly housing management fee, (b) other factors. The graphs were taken as print-screens from STELLA ARCHITECT to present an approach for how the effects of relative changes in the factors are represented as changes in the probabilities to invest in energy efficiency.
Energies 14 07792 g008
Figure 9. Validation of simulation results with actual data for cumulative number of energy efficiency projects in multi-family buildings and national energy efficiency goal for the multi-family building sector.
Energies 14 07792 g009
Figure 10. Penalty–reward scheme based on real estate tax and ratio of the actual energy consumption of building to the value based on the current building standards.
Energies 14 07792 g010
Figure 11. The first layer of Internet-based model interface for selection of policy tools.
Energies 14 07792 g011
Figure 12. Interface for more in-depth policy analysis of supply and demand of construction companies.
Energies 14 07792 g012
Figure 13. Interface for more in-depth analysis of apartment owner decision-making dynamics.
Energies 14 07792 g013
Figure 14. Simulated supply, demand, and prices of construction works for multi-family buildings and the public sector with the existing policy tools in force.
Energies 14 07792 g014
Figure 15. Simulated supply, demand, and construction costs of multi-family buildings and public sectors with combined penalty–reward scheme and EU funding.
Energies 14 07792 g015
Figure 16. Simulated number of ESCO-renovated buildings with actual policy tools in place if no reinvestment fund is available.
Energies 14 07792 g016
Figure 17. Simulated number of ESCO-renovated buildings with actual policy tools in place and with and without reinvestment fund.
Energies 14 07792 g017
Figure 18. Simulated number of renovated buildings when actual policy tools are applied.
Energies 14 07792 g018
Figure 19. Simulated number of renovated multi-family buildings with combined penalty–reward scheme and EU funding.
Energies 14 07792 g019
Figure 20. Simulated fraction of successfully completed projects and capacity of experienced and inexperienced construction companies with existing policy tools applied.
Energies 14 07792 g020
Figure 21. Simulated fraction of successfully completed projects and capacity of experienced and unexperienced construction companies with sustainable EU funding and penalty–reward scheme used.
Energies 14 07792 g021
Figure 22. Simulated word-of-mouth effect with actual policy tools and with sustainable EU funding scheme and penalty–reward scheme in force.
Energies 14 07792 g022
Figure 23. Simulated impact of different types of information campaigns measured as building area represented by the informed inhabitants (not being informed before), in m2 per year.
Energies 14 07792 g023
Figure 24. Simulation results of cumulative energy savings for all four scenarios.
Energies 14 07792 g024
Figure 25. Simulation results for annual costs for each scenario.
Energies 14 07792 g025
Table 1. Results of regression analysis.
FactorQuestion, Text, or StatementBeta Coefficient
1The insulation of the building where my apartment is located would be useful to prevent the heat loss0.294596
2In general, people benefit when their houses are insulated0.289907
3The profession of the respondent: specialist, civil servant0.28926
4The housing management company of my building supports the insulation0.27466
5I expect that I will be able to live in my home long-term or sell it for a reasonable price, so I am ready to invest in it0.219648
6Among the inhabitants of my house, there is a trusted “champion” who could manage the insulation works (e.g., to take care of the paperwork, etc.)0.218237
7The majority of inhabitants of my building support the insulation0.198879
8The insulation must be organized by the housing management company of the building and paid for by the inhabitants0.175085
9I think that the apartment owners in my house would be capable of agreeing on a project such as insulation0.17447
10How much would you agree to pay per month during one year if somebody agreed to take over the responsibility for organizing the insulation? (average)0.1740372
11How much would you agree to pay per month during one year if somebody agreed to take over the responsibility for organizing the insulation? (maximum)0.1732232
12How much would you agree to pay per month along with your house caretaker bill? (maximum)0.1645948
13How much would you agree to pay per month along with your housing management company bill? (maximum)0.1633131
Table 2. Input data for policy tools for each policy scenario.
Policy ToolsScenario 1Scenario 2Scenario 3Scenario 4Scenario 5
EU funding, million EUR 2006002006001000
EU funding support intensity, %3030303030
Start year of EU funding20222022202220222022
Penalty–reward schemeOffOffOnOnOn
ESCO reinvestment fundOffOffOnOnOn
EEOS electricityOnOnOnOnOn
EEOS heatOffOffOnOnOn
EEOS savings goal, %/year1.501.501.501.501.50
Impact of information dissemination0.200.20111
R&D support, million EUR/yearOffOff1 M10 M10 M
Support program for “champions”, thous. EUR/yearOffOff0.3 M0.5 M0.5 M
Building standards and norms (starting year/strengthening frequency (years)/energy consumption reduction (kWh/m2/year))OffOff5/35/105/10
Publisher’s Note: MDPI stays neutral with regard to jurisdictional claims in published maps and institutional affiliations.

