1. Introduction
The world needs to reach net-zero carbon emissions by 2050 to limit global warming to 1.5 °C [
1]. Ukraine is one of the 196 Parties to the Paris Agreement that aims at keeping a global temperature rise in the 21st century to well below 2 °C above pre-industrial levels and to pursue efforts to limit the temperature increase to 1.5 °C [
2].
Ukraine’s greenhouse gas (GHG) emissions amounted to approximately 332 Mt CO
2-eq in 2019 [
3]. Out of these, ~66% were energy related, 18% came from industrial process and product use, 13% from agriculture, and the remaining 4% originated in waste management and land use, land-use change and forestry (LULUCF). Ukraine’s GHG emissions have remained relatively stable since 2000, constituting approximately 38% of the 1990 level in 2019 [
3]. The Ukraine 2050 Low Emission Development Strategy [
4], the only long-term strategic document to 2050, projects GHG emissions to constitute 31% of the 1990 level in 2050 in its most ambitious scenario (
Table A1). Ukraine has recently updated its nationally determined contribution (NDC) to 65% economy-wide GHG emissions reduction compared to 1990 by 2030 and indicated its consistency with a trajectory to achieve net zero GHG emissions by 2060 [
5].
The Energy balance of Ukraine is dominated by fossil fuels. They accounted for about 71% of the total primary energy supply (TPES) in 2019, with the remainder covered by nuclear (~25%) and renewables and waste (~5%) [
6]. Ukraine depends on energy imports, which account for 33% of its natural gas, 50% of its coal and 83% of its oil consumption [
7]. In the final energy consumption, the largest share is held by natural gas (27%), followed by oil and oil products (22%), electricity (20%), heat (15%), coal (12%) and biofuels and waste (4%) [
6]. More than half of the electricity production is from nuclear power [
7]. The largest share of final energy consumption is in the residential and industrial sectors, 28% and 33% respectively [
6].
Ukraine has a number of energy and climate related targets in its legislation. The adopted legislation targets environmental policy in general [
8], energy [
9], transport [
10], renewable energy [
11], energy efficiency [
12] and heat supply [
13].
Table A2 presents key targets from these documents. None of the targets go beyond 2035.
Long-term energy system modelling and scenarios are commonly used in the literature to analyse the development of national energy systems. The studies often apply energy system models representing the whole energy system of a country [
14,
15,
16] or a wider geographical region [
17,
18,
19] to analyse the role of different technologies (e.g., residential heat pumps [
20], hydrogen [
19], storage [
21], district heating [
22] or heating technologies [
23]), policy measures (e.g., increasing efficiency [
24], electrification [
25,
26] and nuclear reduction [
27]) and other developments (e.g., growth in data centres [
28]) in reducing GHG emissions or energy transition, often focusing on the period until 2050. Some articles address the uncertainties inherent to long-term energy planning studies such as the present one [
29,
30,
31]. Some studies combine several models to obtain deeper sectoral insights and analyse the effects on the wider economy [
32,
33,
34]. Others focus on a single sector independently of whether the model includes only the sector [
35,
36,
37,
38,
39] or the whole energy system [
40,
41,
42]. Representing the whole energy system is important when analysing decarbonisation pathways as it allows the representation of trade-offs between sectors under resource constraints [
16].
There is limited academic literature analysing long-term Ukraine energy system development published in international journals. Chepeliev et al. [
43] soft-linked TIMES-Ukraine and Ukrainian Computable General Equilibrium models to assess low-emission development scenarios for Ukraine. Nevertheless, long-term energy system modelling in Ukraine has been used to support the development of national strategies [
4,
44,
45] and produced technical reports [
46].
The Ukraine Energy Outlook 2021 is an independent study of the Ukrainian energy system, utilising the energy system model TIMES-Ukraine [
47], which analyses the possible development of the energy system in Ukraine under various scenarios, taking into account enacted policies, technological development and environmental considerations. The Outlook is part of a long standing effort of the Danish Energy Agency to support long-term energy planning processes in partner countries in the framework of government-to-government cooperation through application of modelling tools and practices. It presents a quantitative assessment and comparison of different energy sector development pathways with regards to various indicators (including investment cost, energy intensity and GHG emissions), enabling the benefits and drawbacks of respective scenarios to be evaluated. The Outlook can thus be used as a technical reference when planning new measures in the climate and energy sectors, to assess the impact of policy measures and to provide inputs to national energy strategy documents in order to achieve national energy and climate goals. Previously, Energy Outlooks have been developed for China [
48,
49,
50,
51,
52], Indonesia [
53] and Vietnam [
54]. The findings of the Ukraine Energy Outlook 2021 are presented and further developed in this study.
The aim of this paper is to fill the gap in the academic literature on the possible long-term energy system development in Ukraine given current policies, using long-term energy system modelling, as well as to develop an indication of possible outcomes of measures aimed at decarbonisation and energy transition. The remainder of the paper is organised as follows.
Section 2 and
Section 3 describe the TIMES-Ukraine model and the scenarios analysed, respectively.
Section 4 presents both sector-specific results and results for the whole energy system across main scenarios, as well as the results of the alternative scenarios. Finally, this is followed by a discussion and conclusions section.
2. Materials and Methods
2.1. TIMES Modelling Framework
The Integrated MARKAL-EFOM System (TIMES) modelling framework [
55,
56,
57] is developed and maintained by the Energy Technology Systems Analysis Programme (ETSAP), an International Energy Agency (IEA) Technology Collaboration Programme which was established in 1976. TIMES models follow the bottom-up energy system modelling approach [
58,
59] and are typically single or multi-regional models of local [
60], national [
16,
25], multinational [
61] or global [
62] energy systems. They are often characterised by databases allowing ample technology choice and are used for both medium- and long-term energy systems analysis and planning. The TIMES code, implemented in General Algebraic Modelling System (developed by GAMS Software GmbH, Frechen, Germany), is open-source and is distributed under GNU General Public License version 3 [
63].
TIMES assumes perfectly competitive markets and full foresight is typically used for the entire modelling horizon. However, it is also possible to perform an analysis in myopic mode or using the rolling horizon optimisation approach. The objective function is to maximise the total surplus by minimising the total system costs discounted to the reference year. It includes the following components: investment costs, fixed and variable operation and maintenance (O&M) costs, import costs and export revenues, taxes and subsidies, as well as the residual value of technologies (salvage value) at the end of the modelling horizon. The type of inputs used to build TIMES models are exogenous energy service demand projections, supply curves (i.e., resource potentials and costs), policies, as well as both technical and economic parameters for various technologies. Outputs of TIMES include optimal investments, operation and import (export) levels that are both time- and region-specific (for multi-regional models). Costs, environmental indicators, marginal prices and commodity flows are also included alongside the optimal solution.
2.2. TIMES-Ukraine Model
The TIMES-Ukraine energy system model is a member of the the MARKAL/TIMES model family. It includes a comprehensive characterisation of the Ukrainian energy system suitable for representing the energy dynamics in the long-term [
47]. The model structure follows the methodological approach of the State Statistics Service of Ukraine [
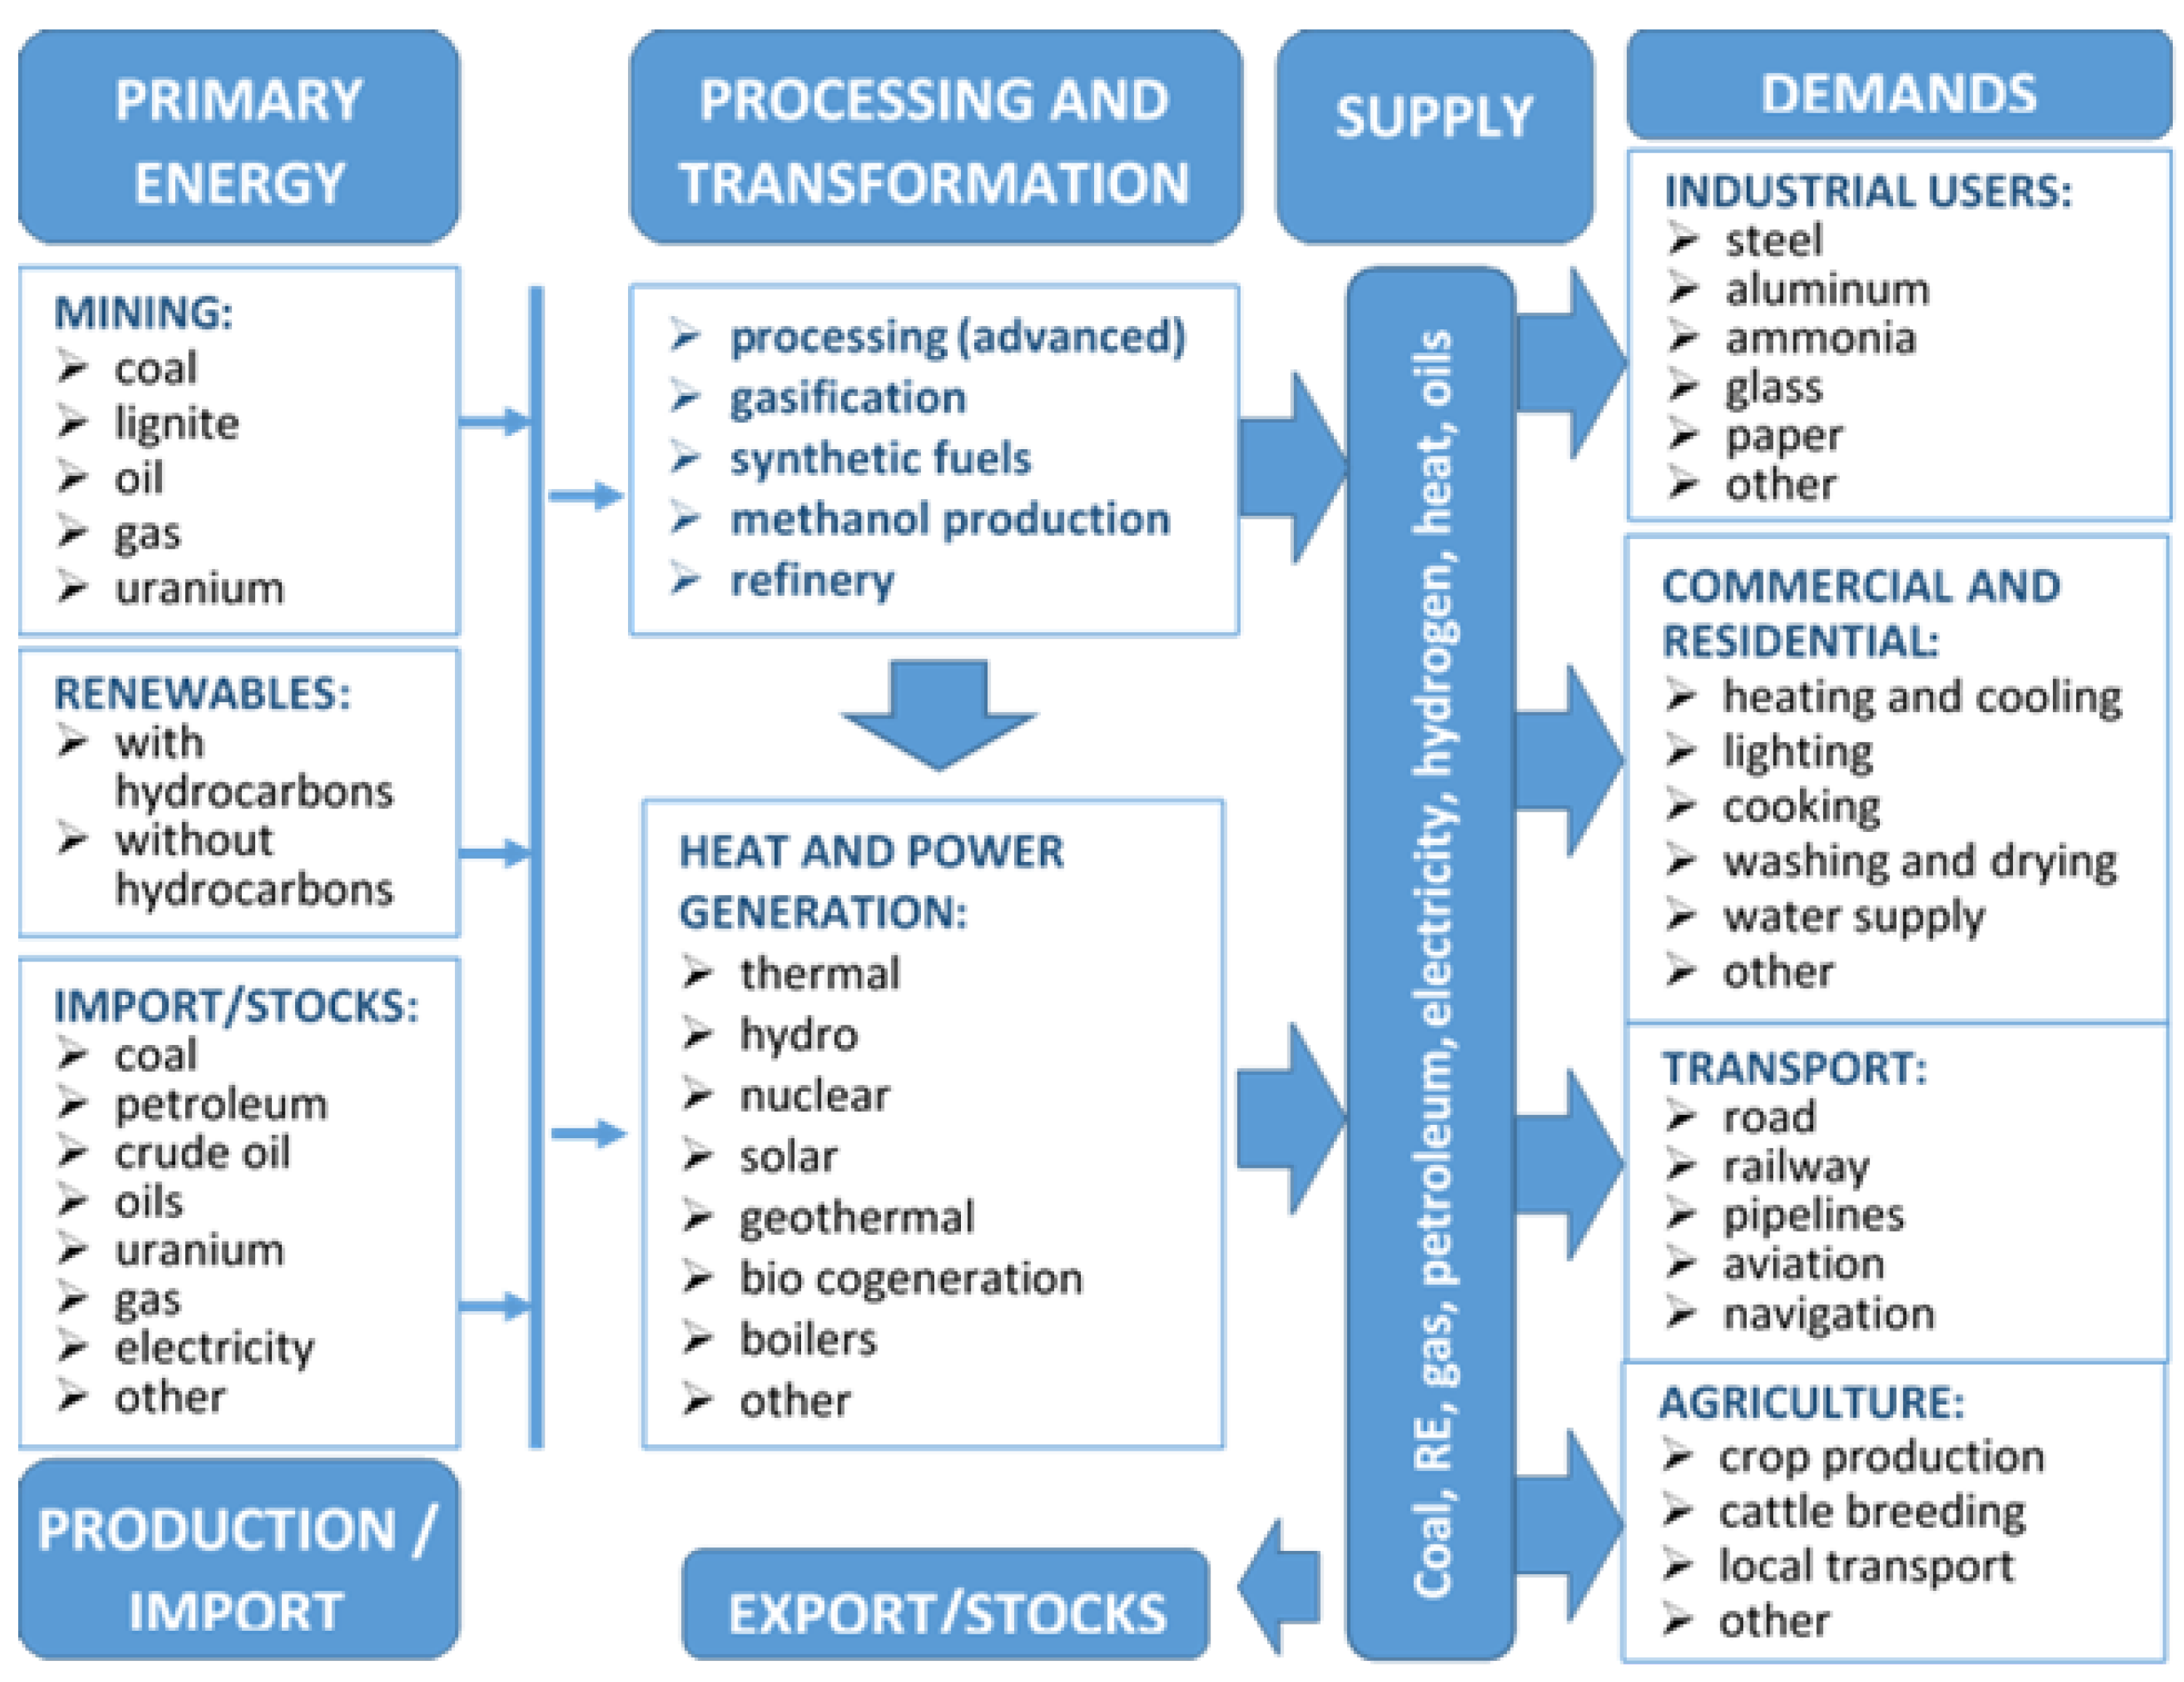
64] on energy statistics, which is harmonised with the IEA and Eurostat, and includes a representation of more than 1800 technologies. The TIMES-Ukraine model divides the energy system into seven sectors (
Figure 1).
The database of the model contains economic and energy statistics data for 2005–2019. Any of the following years can be used as a starting point for the optimisation (i.e., calibration years): 2005, 2009, 2012 and 2015. Key input data for the model are regularly updated and include annual energy production statistics, international trade, information on power plant and boiler performance, etc.
Based on their energy intensity, industrial users in the model are categorised into two groups. Energy-intensive energy branches are represented through technologies that are product-specific. For the rest, a generic representation is adopted based on the four process types: thermal processes, electric engines, electrochemical processes and other processes.
The transport sector in TIMES-Ukraine includes a representation of the following types of transportation: pipelines, road, railway, navigation and aviation. Energy services related to passenger and freight transport are delivered by road and rail transport technologies.
The most energy-intensive energy service demands determine energy consumption in the commercial and residential sectors. They include water heating, heating and cooling of dwellings, cooking, refrigeration, dish washing, washing and drying (ironing) of clothes, lighting, etc.
The agriculture sector in TIMES-Ukraine includes a representation of energy consumption for cattle breeding, crop production, local transport and other demands.
The modelling horizon in TIMES-Ukraine is defined until 2050 with most of the modelling periods comprising 5-year intervals. Energy service demand projections are included until the end of the modelling horizon and are based on aggregated macroeconomic indicators (gross domestic product (GDP) and real personal income), sector-specific production and economic performance indicators (gross value added, industrial production index, passenger and freight transportation), and demographic and social indicators (population categorised by place of living, number of dwellings and living conditions).
TIMES-Ukraine, and similar energy system models, are typically applied to analyse energy system development pathways in the long-term. Scenarios can be developed and analysed by changing the assumptions on, e.g., technologies, useful energy demands, prices or other exogenous variables. The result of the modelling is a least-cost solution for satisfying energy service demands of the entire energy system under given conditions and restrictions.
3. Analysed Scenarios
3.1. Main Scenarios
3.1.1. Frozen Policy
The Frozen Policy (FZP) scenario includes currently implemented policies only, which are based on the current (limited) level of implementation of the existing legislation, i.e., when legislation is not enforced, implemented only partially or with significant delays, or with limited scope and legislation targets. The FZP scenario is similar to the Business As Usual scenario developed for the updated NDC of Ukraine [
44], but is based on updated macroeconomic, technical and other parameters.
This hypothetical scenario is useful in assessing the implications of the other policy options and scenarios considered in this study. The FZP scenario can also be considered as providing the upper limit of energy consumption and GHG emissions until 2050.
3.1.2. Least-Cost Development
The Least-Cost Development (LCD) scenario is an unconstrained scenario, free of targets and additional constraints, but with all decarbonisation measure options (energy efficiency, renewables, new technologies, etc.). The LCD scenario shows how the technological structure and energy mix may change through the competition of technologies to supply the demand, without implementing any significant policies (e.g., taxation).
3.1.3. Stated Policy
The Stated Policy (STP) scenario includes all stated future policies in addition to currently implemented ones. These are included to show the impact of timely implementation of existing climate-related legislation (
Table A1 and
Table A2). Compared to the FZP scenario, this scenario provides insight into the effect of forthcoming policies and identifies the gains achieved through implementation of the new policies. The STP scenario is similar to the Reference Scenario developed for the updated NDC of Ukraine [
44].
3.2. Alternative Scenarios
FZP is a very conservative representation of the energy system future. LCD and STP allow for more ambitious developments in renewable energy and GHG reductions, but cannot be characterised as disruptive or drastic. Therefore, we have analysed three alternative scenarios characterised by different methods for reducing GHG emissions: Climate Neutral Economy (CNE), Strong Carbon Tax (SCT) and Early Coal Phase-out (CPO) scenarios.
3.2.1. Climate Neutral Economy
The Climate Neutral Economy scenario is based on the Ukraine’s recently updated NDC [
5], which is consistent with a trajectory that achieves net zero GHG emissions by 2060. The CNE scenario includes only climate mitigation targets to model the least cost pathway to a low carbon society, with the GHG emissions in 2050 set to reduce to 14% of the 1990 level.
3.2.2. Strong Carbon Tax
Under the Strong Carbon Tax scenario, the carbon tax for industry, supply, power and heat sectors in Ukraine increases from the present level (€0.35 per ton) to about the average 2020 EU ETS carbon price (€26 per ton) by 2030 and reaches €140 per ton by 2050.
3.2.3. Early Coal Phase-Out
The Early Coal Phase-out scenario shows the cost and implications of a phase-out of coal from electricity and heat production by 2035. This scenario represents an example of a policy that has been seen in several European countries, e.g., Denmark and Finland, which have decided to phase out coal by 2028 and 2029, respectively.
4. Results
4.1. Power and Heat Sector
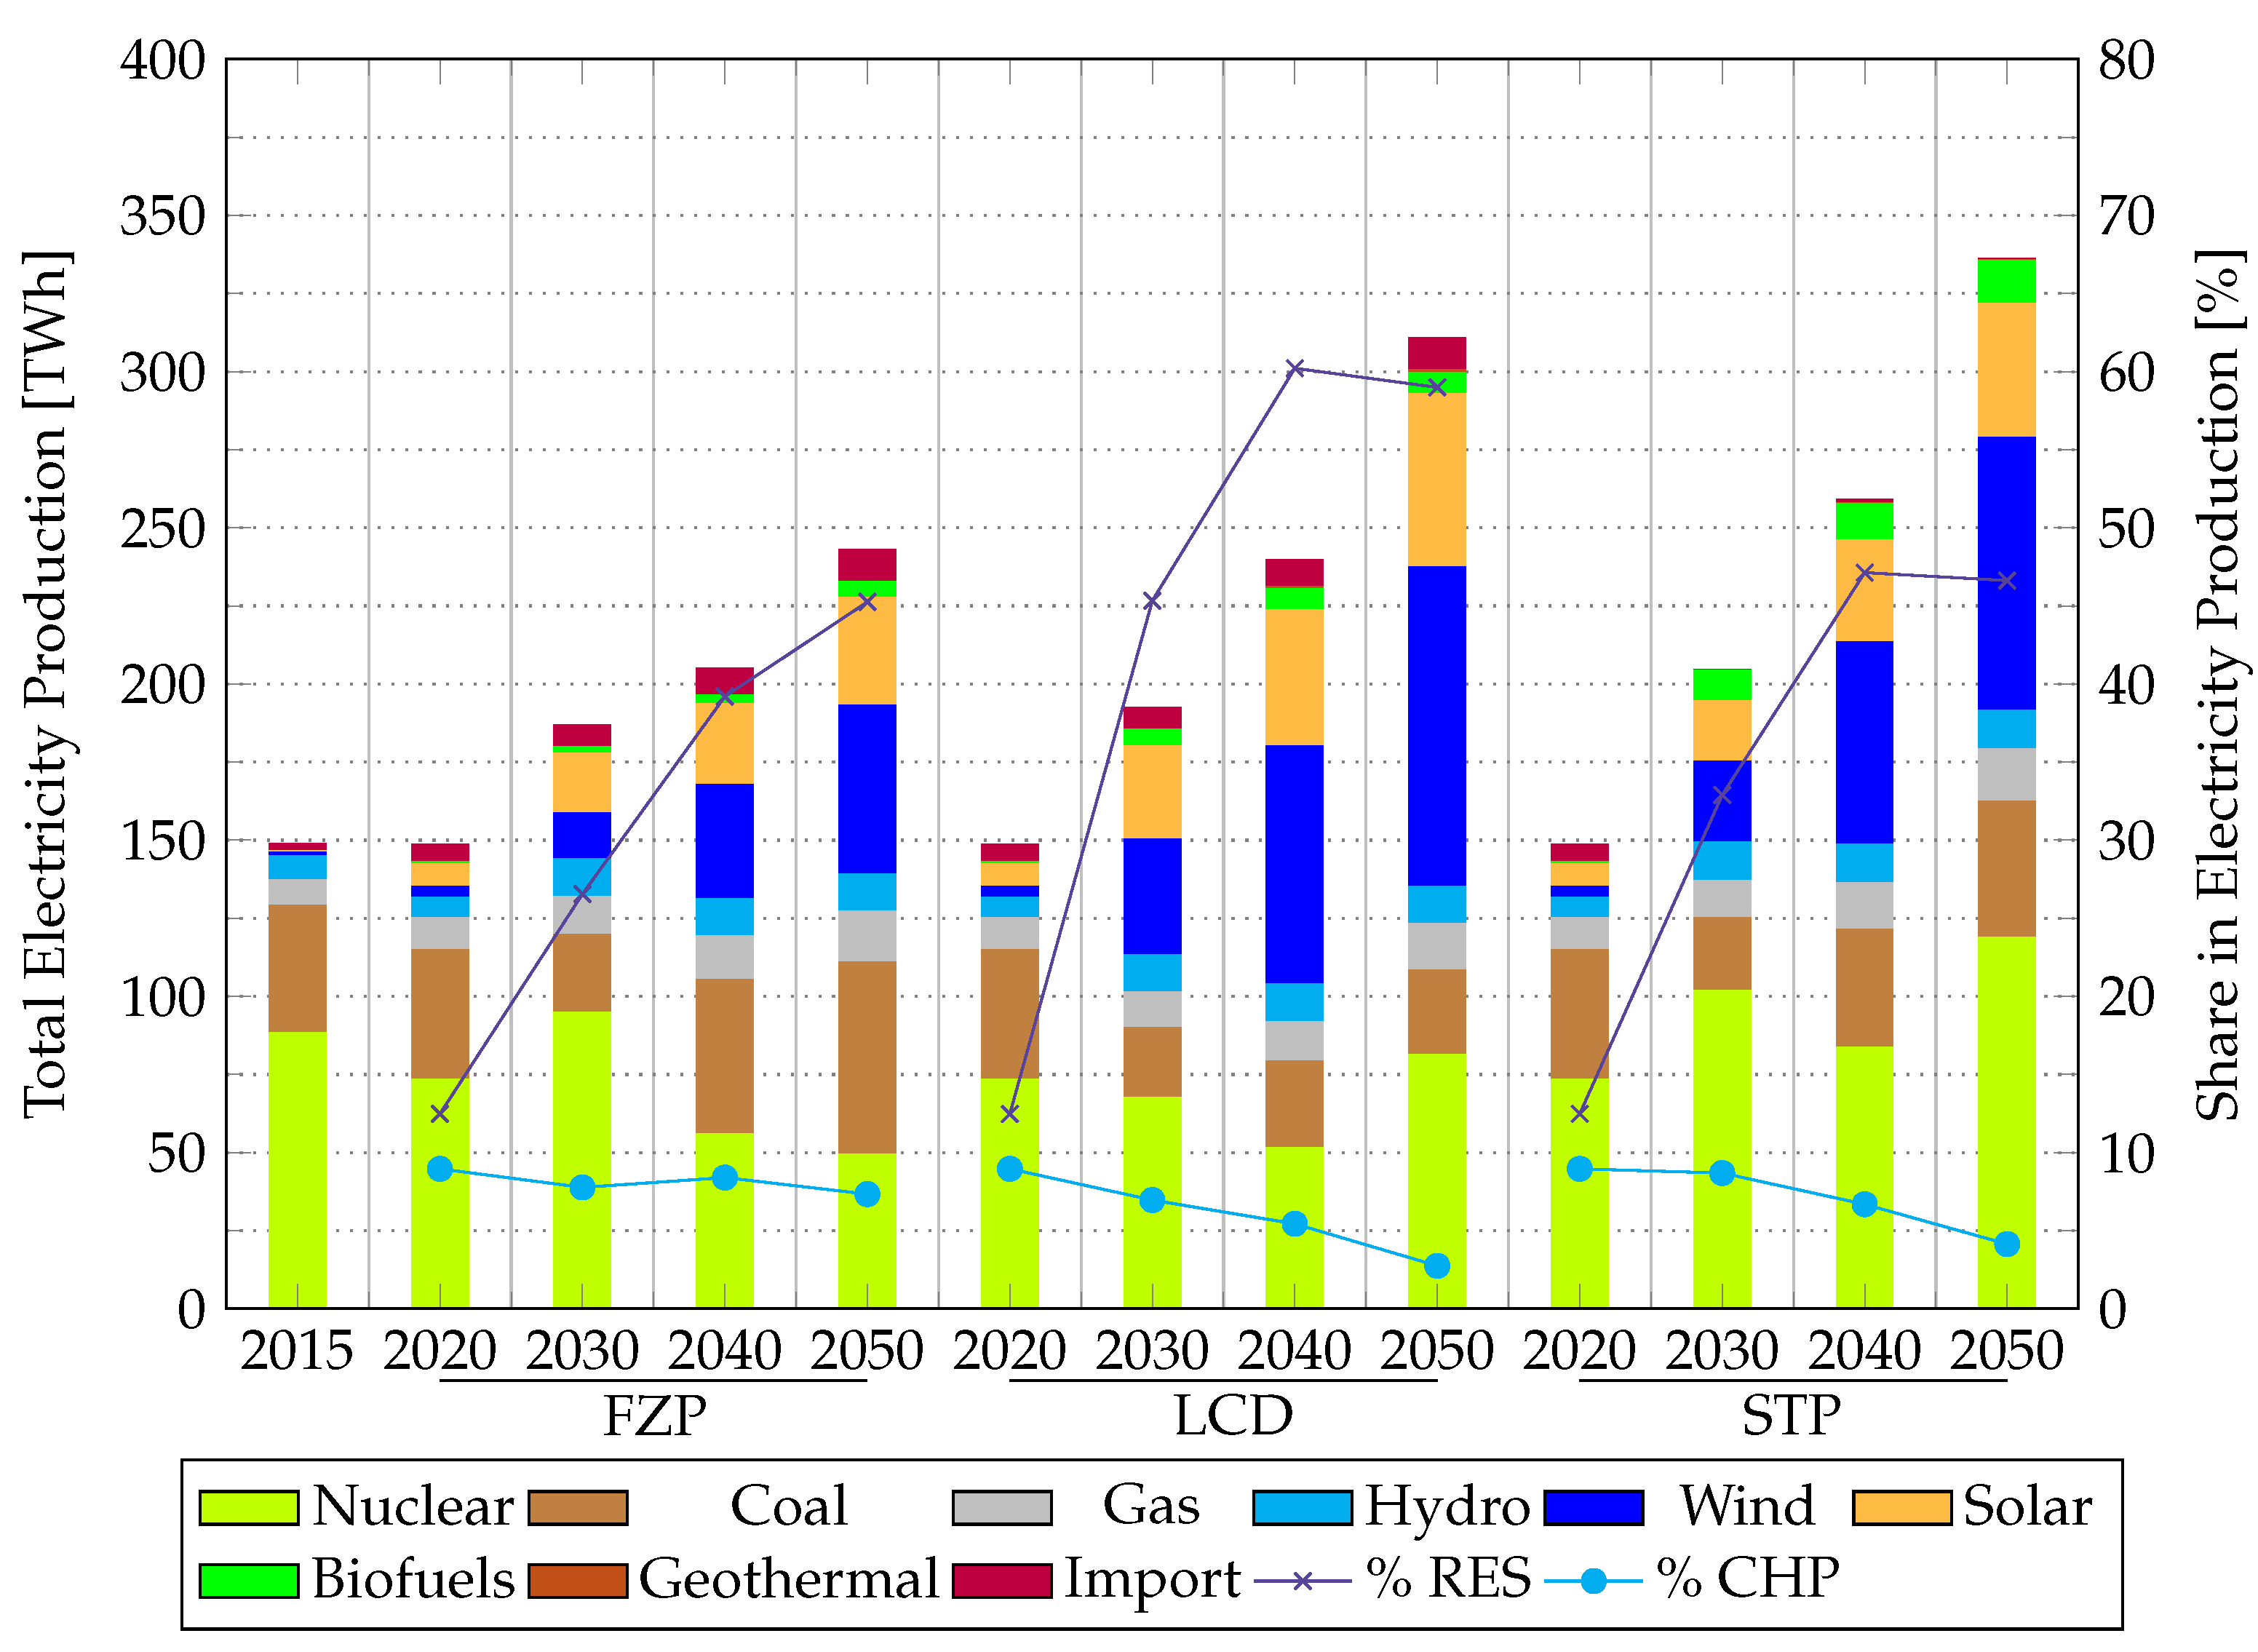
The total electricity production, share of renewables and share of generation from CHPs are presented in
Figure 2. Electricity production increases between 2020 and 2050 in all scenarios, but the magnitude of the increase differs. In the FZP scenario, electricity production increases from 149 TWh in 2020 to 243 TWh in 2050. For the other scenarios, electricity demand more than doubles during the same period, reaching 311 TWh and 336 TWh in 2050 in the LCD and STP scenarios, respectively. Despite the lack of a renewable energy sources (RES) development policy in the FZP scenario, the share of RES in the structure of electricity generation will grow rapidly, and exceed the RES-targets of the current Energy Strategy of Ukraine to 2035.
The RES are consistently highest in the LCD scenario and lowest in the FZP scenario. In the FZP scenario, the RES share increases each decade and reaches 45% in 2050. However, in the LCD and STP scenarios, the RES values peak at 60% and 47%, respectively, in 2040. The RES then decrease in the subsequent decade, due to construction of additional nuclear units. Implementing measures of the STP scenario can also reduce electricity imports.
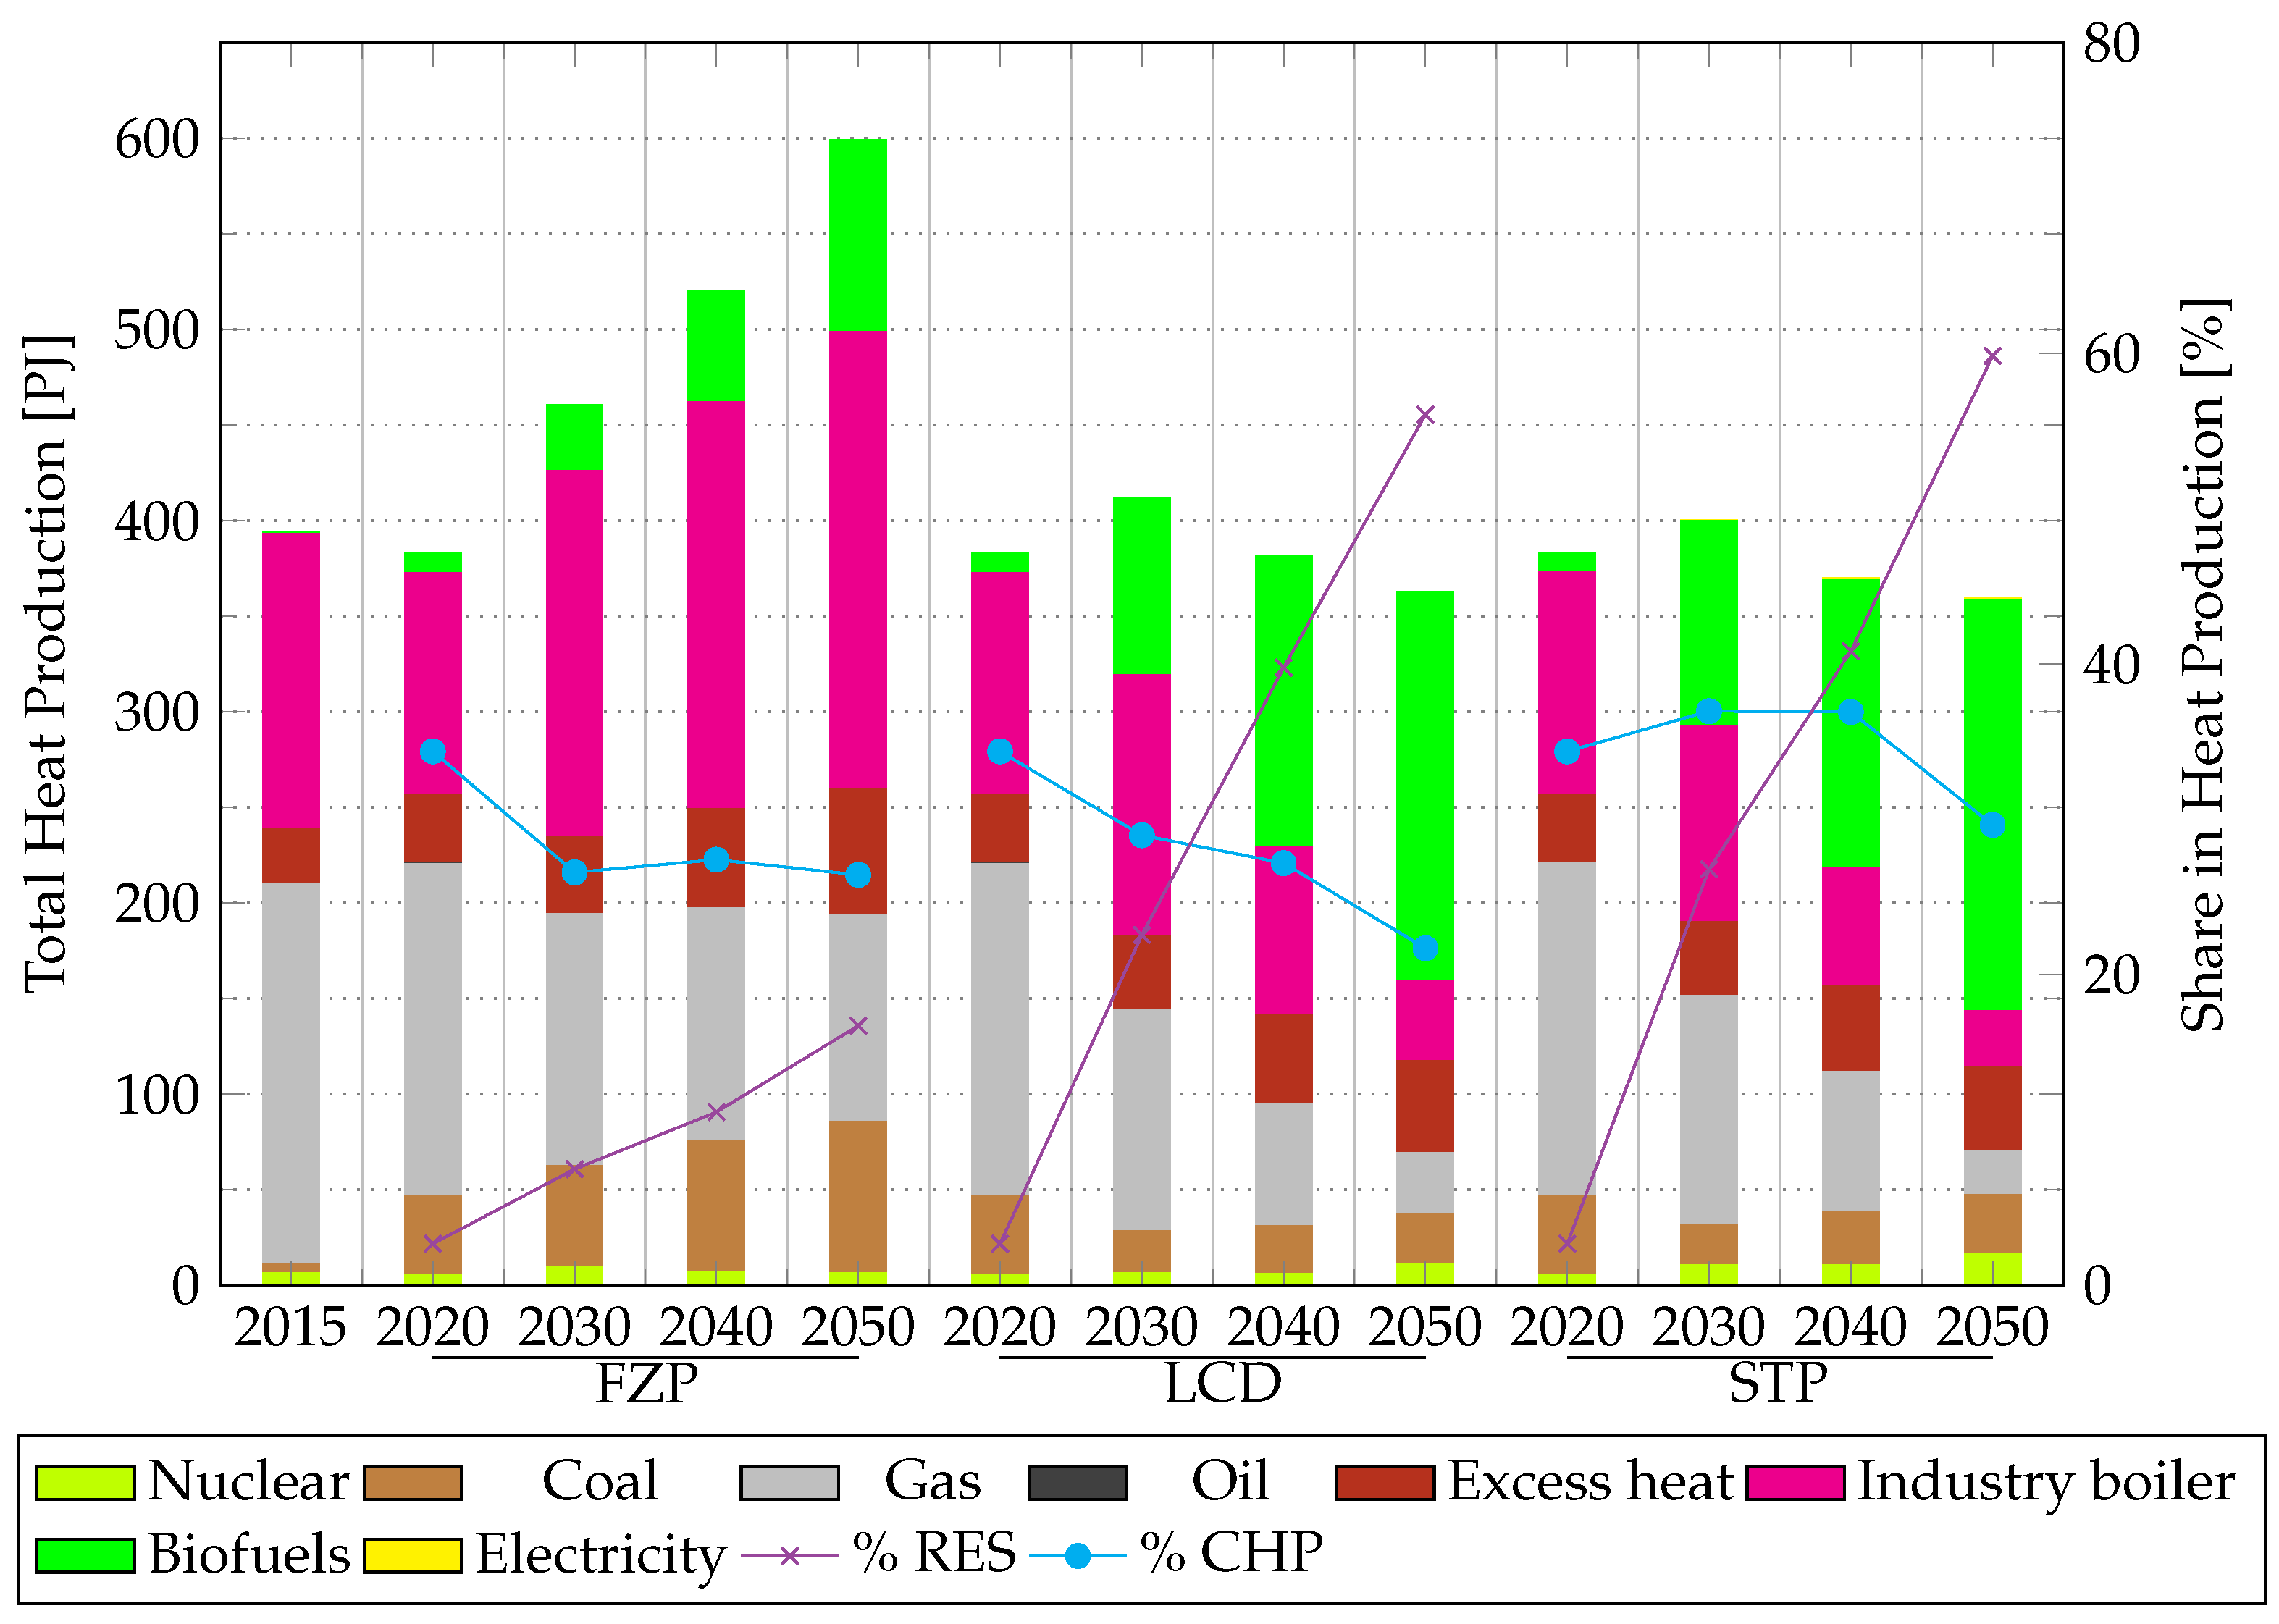
The district heating (DH) production in the FZP scenario will increase by more than 50% until 2050 compared to 2020, while the LCD and STP scenarios go in different direction (
Figure 3). The DH production will decrease in these scenarios by around 5% in the same period. The reason for the decrease is cost-effective thermal insulation of buildings which is reducing heat production of all heat supply options, including DH.
In both the LCD and STP scenarios, DH production is converted from natural gas dominated production to biofuels as the primary energy source. In the FZP scenario, the majority of DH production originates from industrial boilers. At the same time, the share of CHP units in the DH production declines in all scenarios, resulting in shares of 26%, 22% and 30% in 2050, respectively, in the FZP, LCD and STP scenarios. The decreasing share is primarily due to the phase-out of gas-based autoproduction and only partial replacement by autoproduction using biofuels. CHPs with gas are almost completely replaced with an equal capacity of biofuel-based CHPs.
The share of renewables will reach almost 60% in 2050 in the LCD and STP scenarios, while only moderate increase in share is seen in the FZP scenario. Excess heat contributes with around 45 PJ in 2050 in both the LCD and STP scenarios, and 66 PJ in the FZP scenario. The utilisation of high temperature excess heat for DH does not grow significantly in the LCD and STP scenarios because a reduction of heating demand in buildings, due to thermal insulation, proves to be more cost-effective for the Ukrainian energy system. A significant increase in biofuel utilisation for DH from 2020 onwards will contribute to an increased RES share. Domestic biomass can thereby significantly replace imported gas in DH generation. However, this will require considerable improvement of the existing biofuels market. In all scenarios, there is a steady increase in excess heat utilisation. This the rate could potentially be increased through effective policy choices.
4.2. Buildings
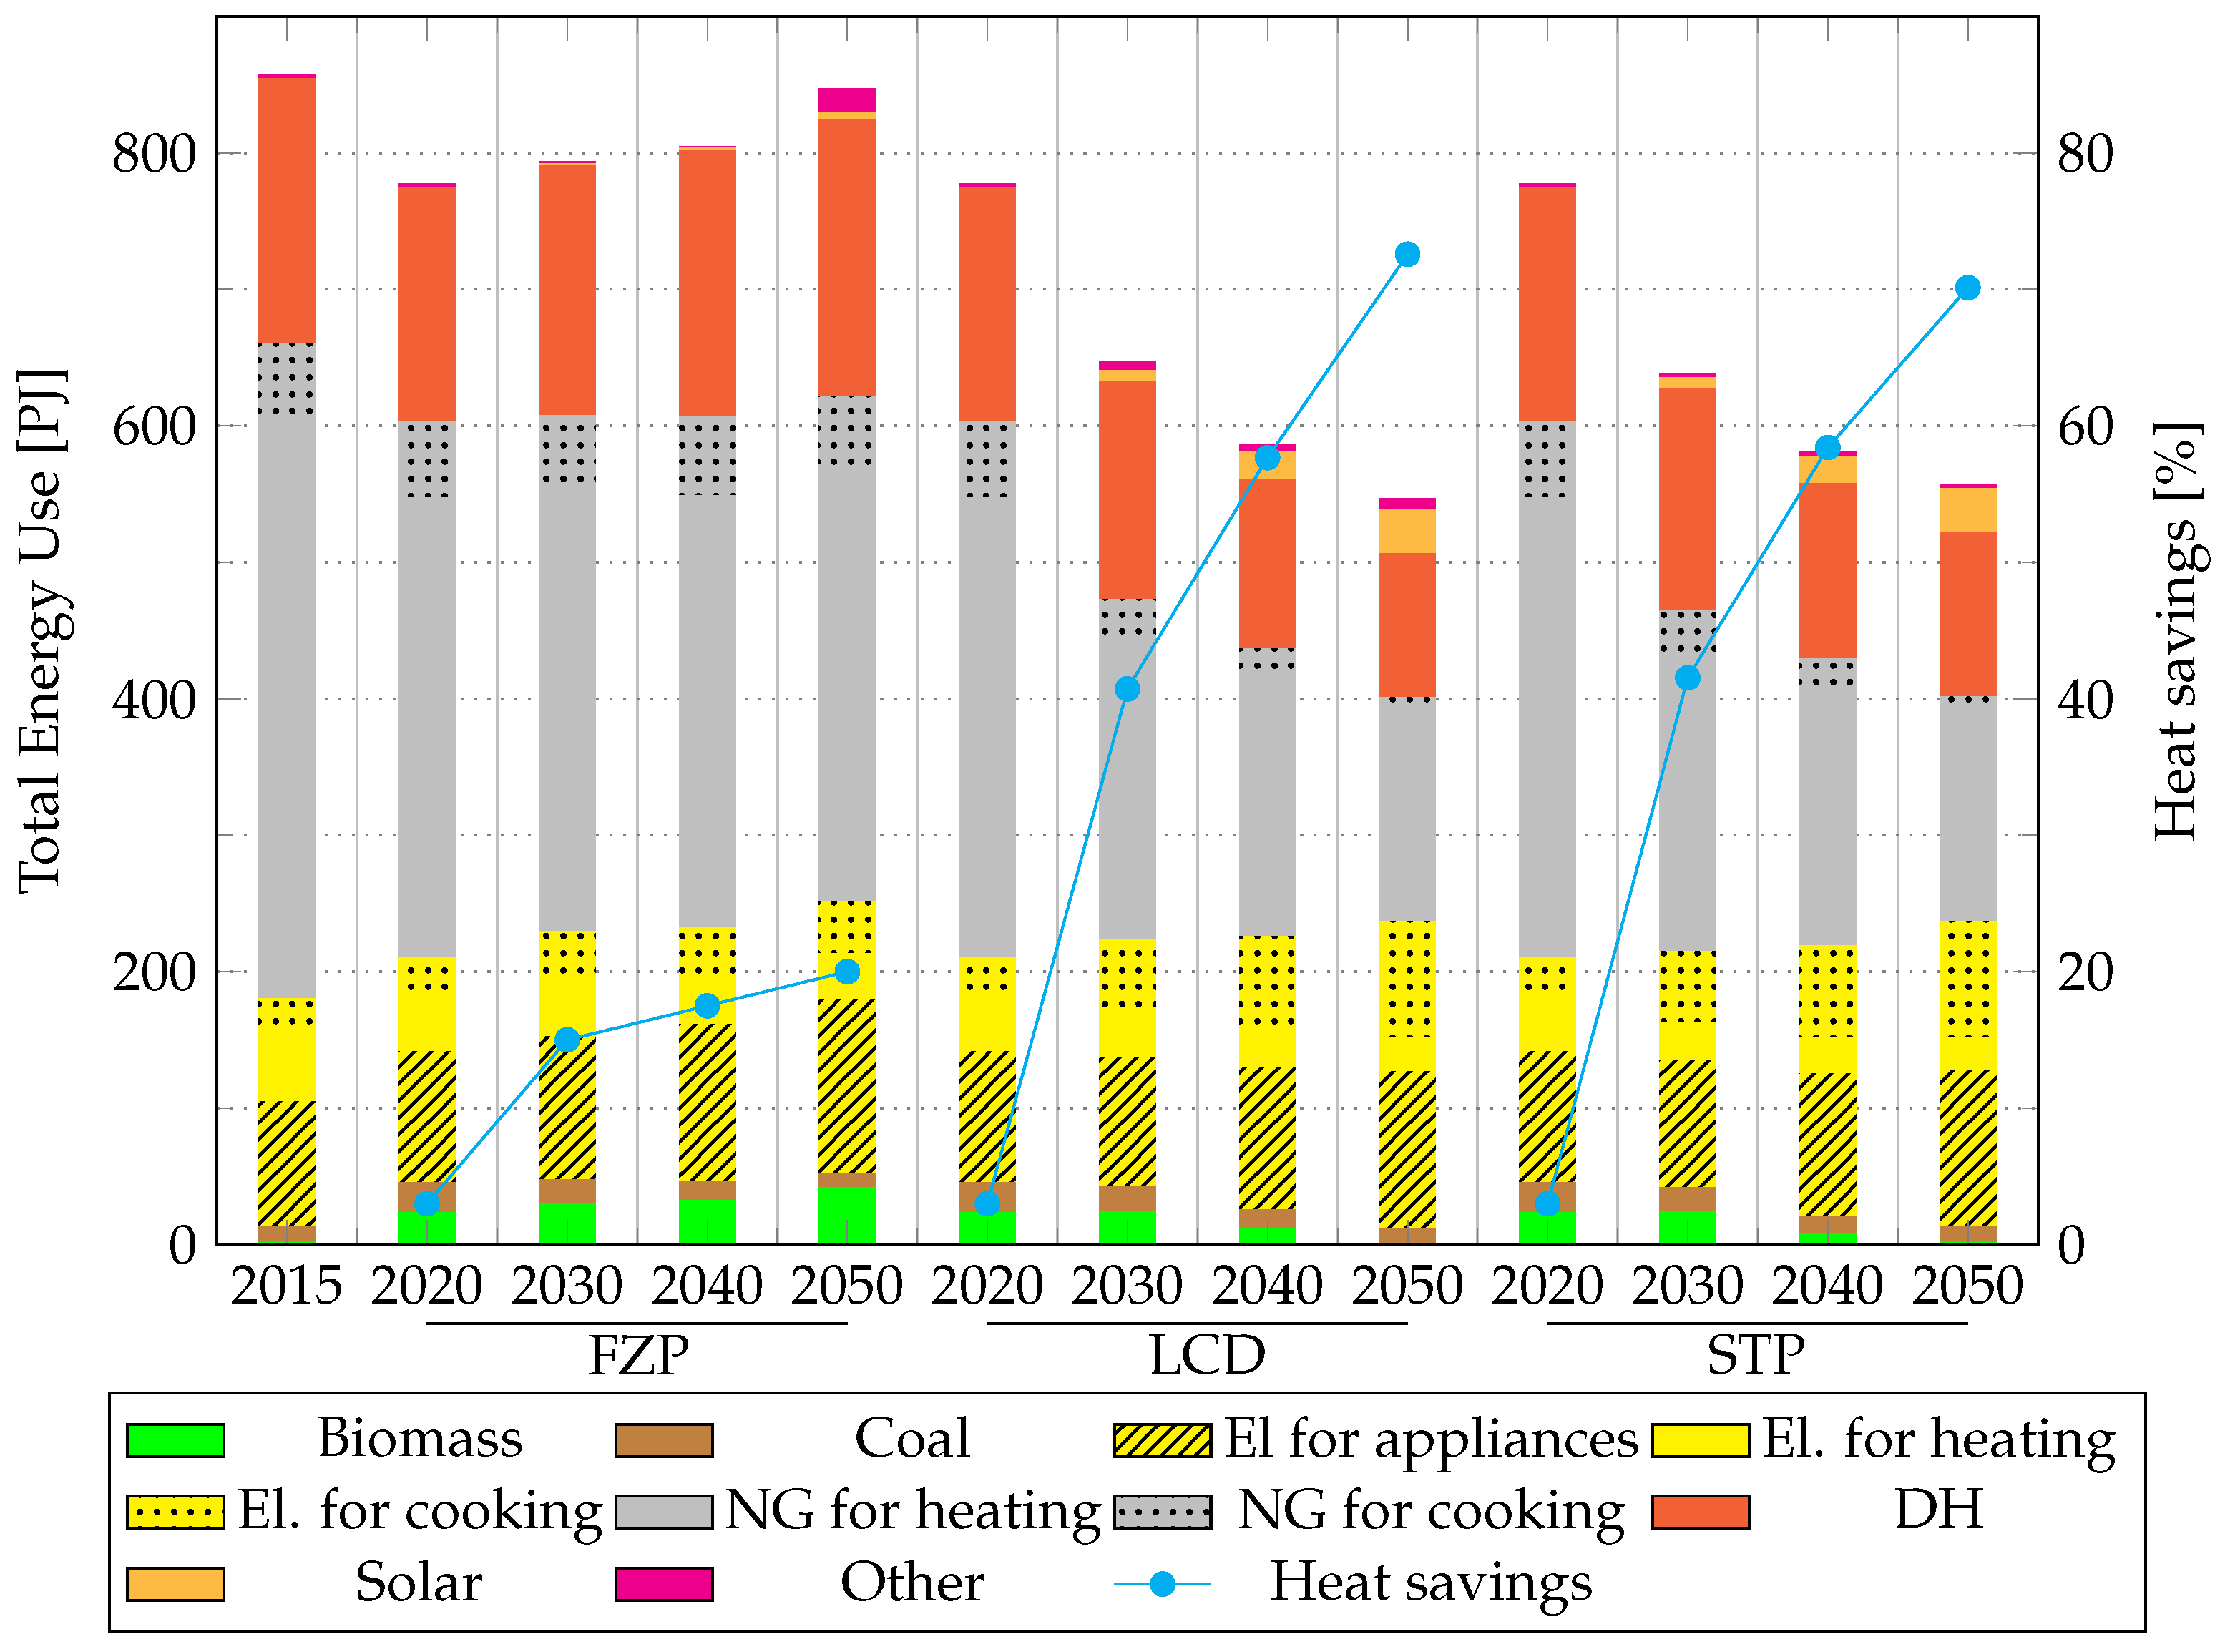
The use of electricity and fuels in buildings until 2050, in all main scenarios, is presented in
Figure 4. In the FZP scenario, there is little change between 2020 and 2050, while the LCD and STP scenarios change noticeably from 2020 to 2050. Natural gas remains the dominant fuel for cooking in the FZP scenario even though its share drops from 69% in 2015 to 61% in 2050, while the use of electricity grows from 31% to 39% in the same period. The reason for using natural gas for cooking is the long lifetime of cooking devices and high cost of electricity relative to natural gas. On the other hand, there is a lack of policies that would give a stronger push to electric cookers. The LCD and STP scenarios develop in the opposing direction to the FZP scenario: the share of electric cooking grows to 93% in 2050.
The economic growth assumptions drive an increase of energy service demands from appliances. These assumptions, combined with absence of energy efficiency policies, translates in a 40% increase in electricity use for appliances between 2015 and 2050 in the FZP scenario. The policies introduced in STP scenario drive the development of energy efficient devices in buildings in the same direction as in LCD scenario, namely, the electricity use for appliances is 26% larger in the LCD and STP scenarios than in 2015 or 28% lower than in FZP scenario.
Space heating and sanitary hot water are produced mostly using natural gas boilers, DH and electric heating, in all scenarios. There is a minor change between the scenarios and over the analysed period: the minimum combined share of natural gas boilers, DH and electric heating in heat supply to buildings of 84% occurs in 2050 in LCD scenario, but most often it is between 87% and 92%. The shares of individual supply options are also stable: natural gas boilers vary between 48% and 56%, DH between 28% and 35%, while electric heating supplies between 5% and 7% of the demand. There are also two noticeable differences between the scenarios. Firstly, the impact of insulation measures on the space heating demand linearly grows from 3% in 2020 to 20%, 73% and 70% in 2050 in the FZP, LCD and STP scenarios, respectively. Therefore, space heating in the FZP scenario is responsible for two-thirds of the buildings’ heating demands in 2050 and only ~40% in the LCD and STP scenarios. Secondly, solar heating is negligible in the STP scenario, while, being driven by decreasing technology costs and favourable policies, it supplies 10% of the heating demand in 2050 in LCD and STP scenarios.
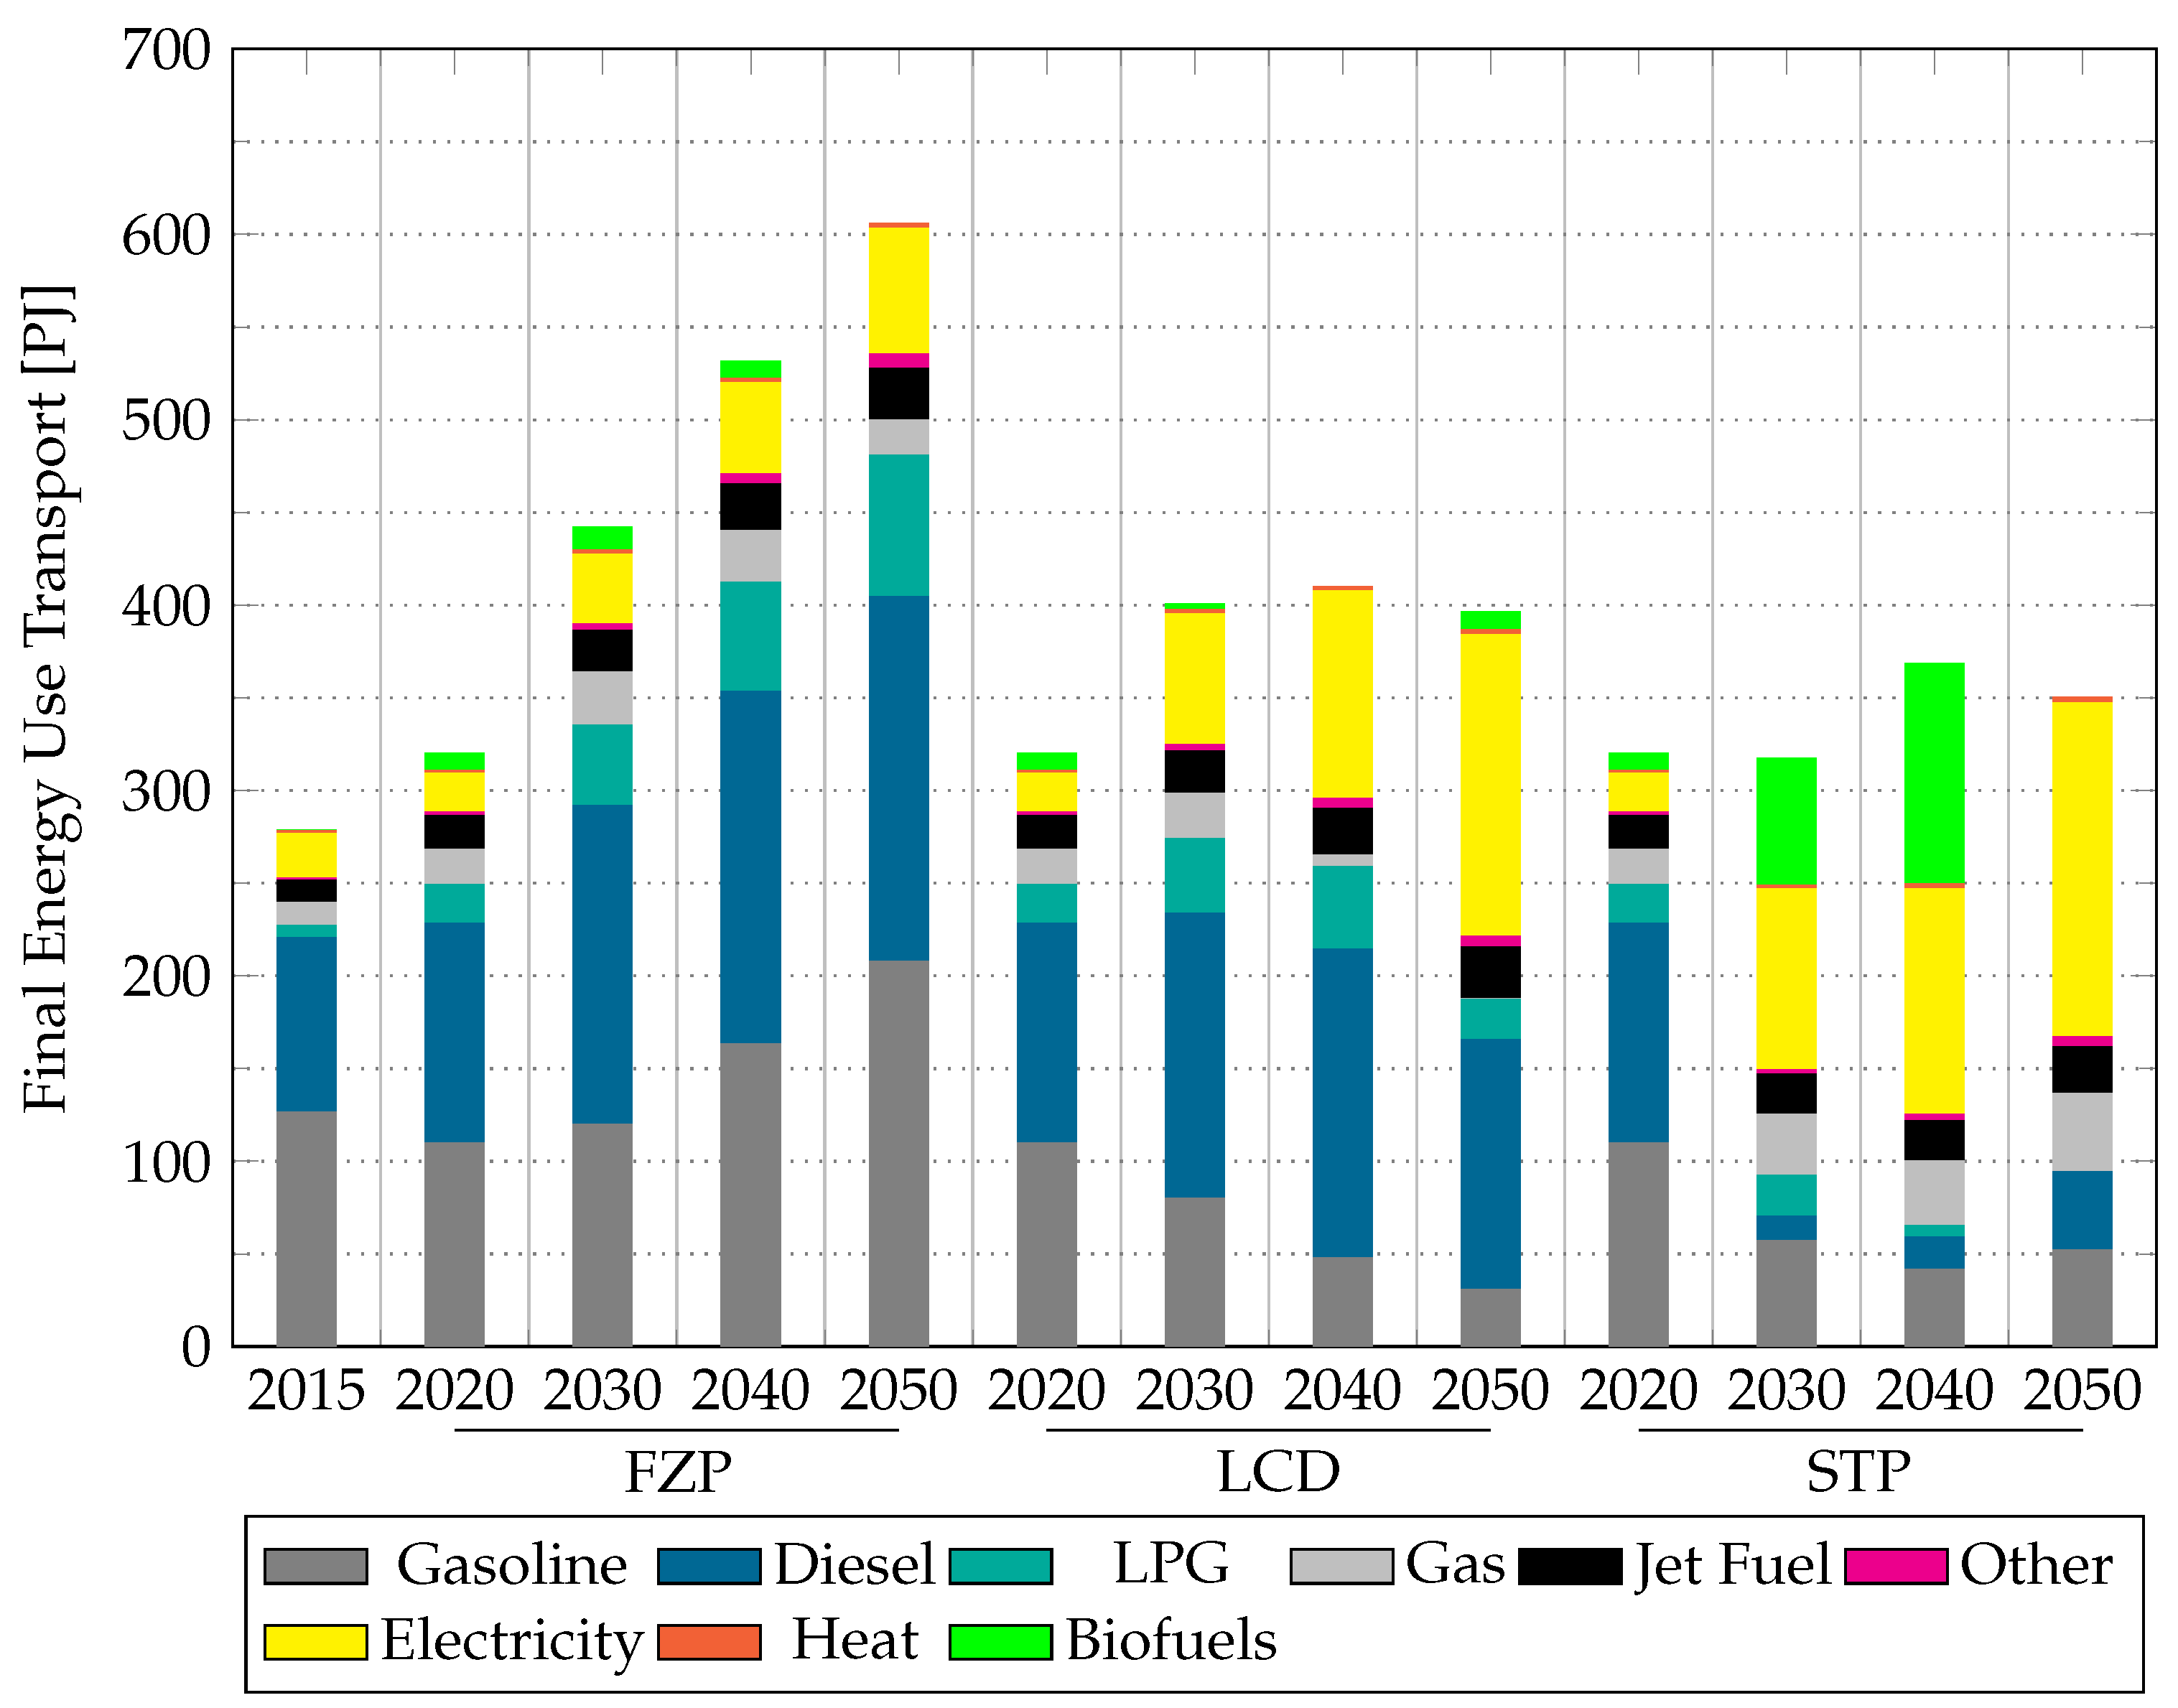
4.3. Transport
The final energy use in the transport sector is shown in
Figure 5. In all the main scenarios, energy consumption in transport is higher in 2050 compared to 2020, albeit quite differently, as a result of increased car ownership level. In the FZP scenario, energy use is almost doubled by 2050, compared to 2020. The LCD scenario shows a lower growth of ~80 PJ until 2030, followed by relatively unchanged levels of energy consumption to 2050, as the electric vehicle fleet undergoes expansion. Like in the LCD scenario, final energy use in transport in the STP scenario stays at a much lower level compared to FZP. Additionally, higher electric vehicle (EV) adoption rates bring the level further down. Contrary to the other scenarios, biofuels see a significant role as “drop-in” fuels in the period from 2030–2040 in the STP scenario.
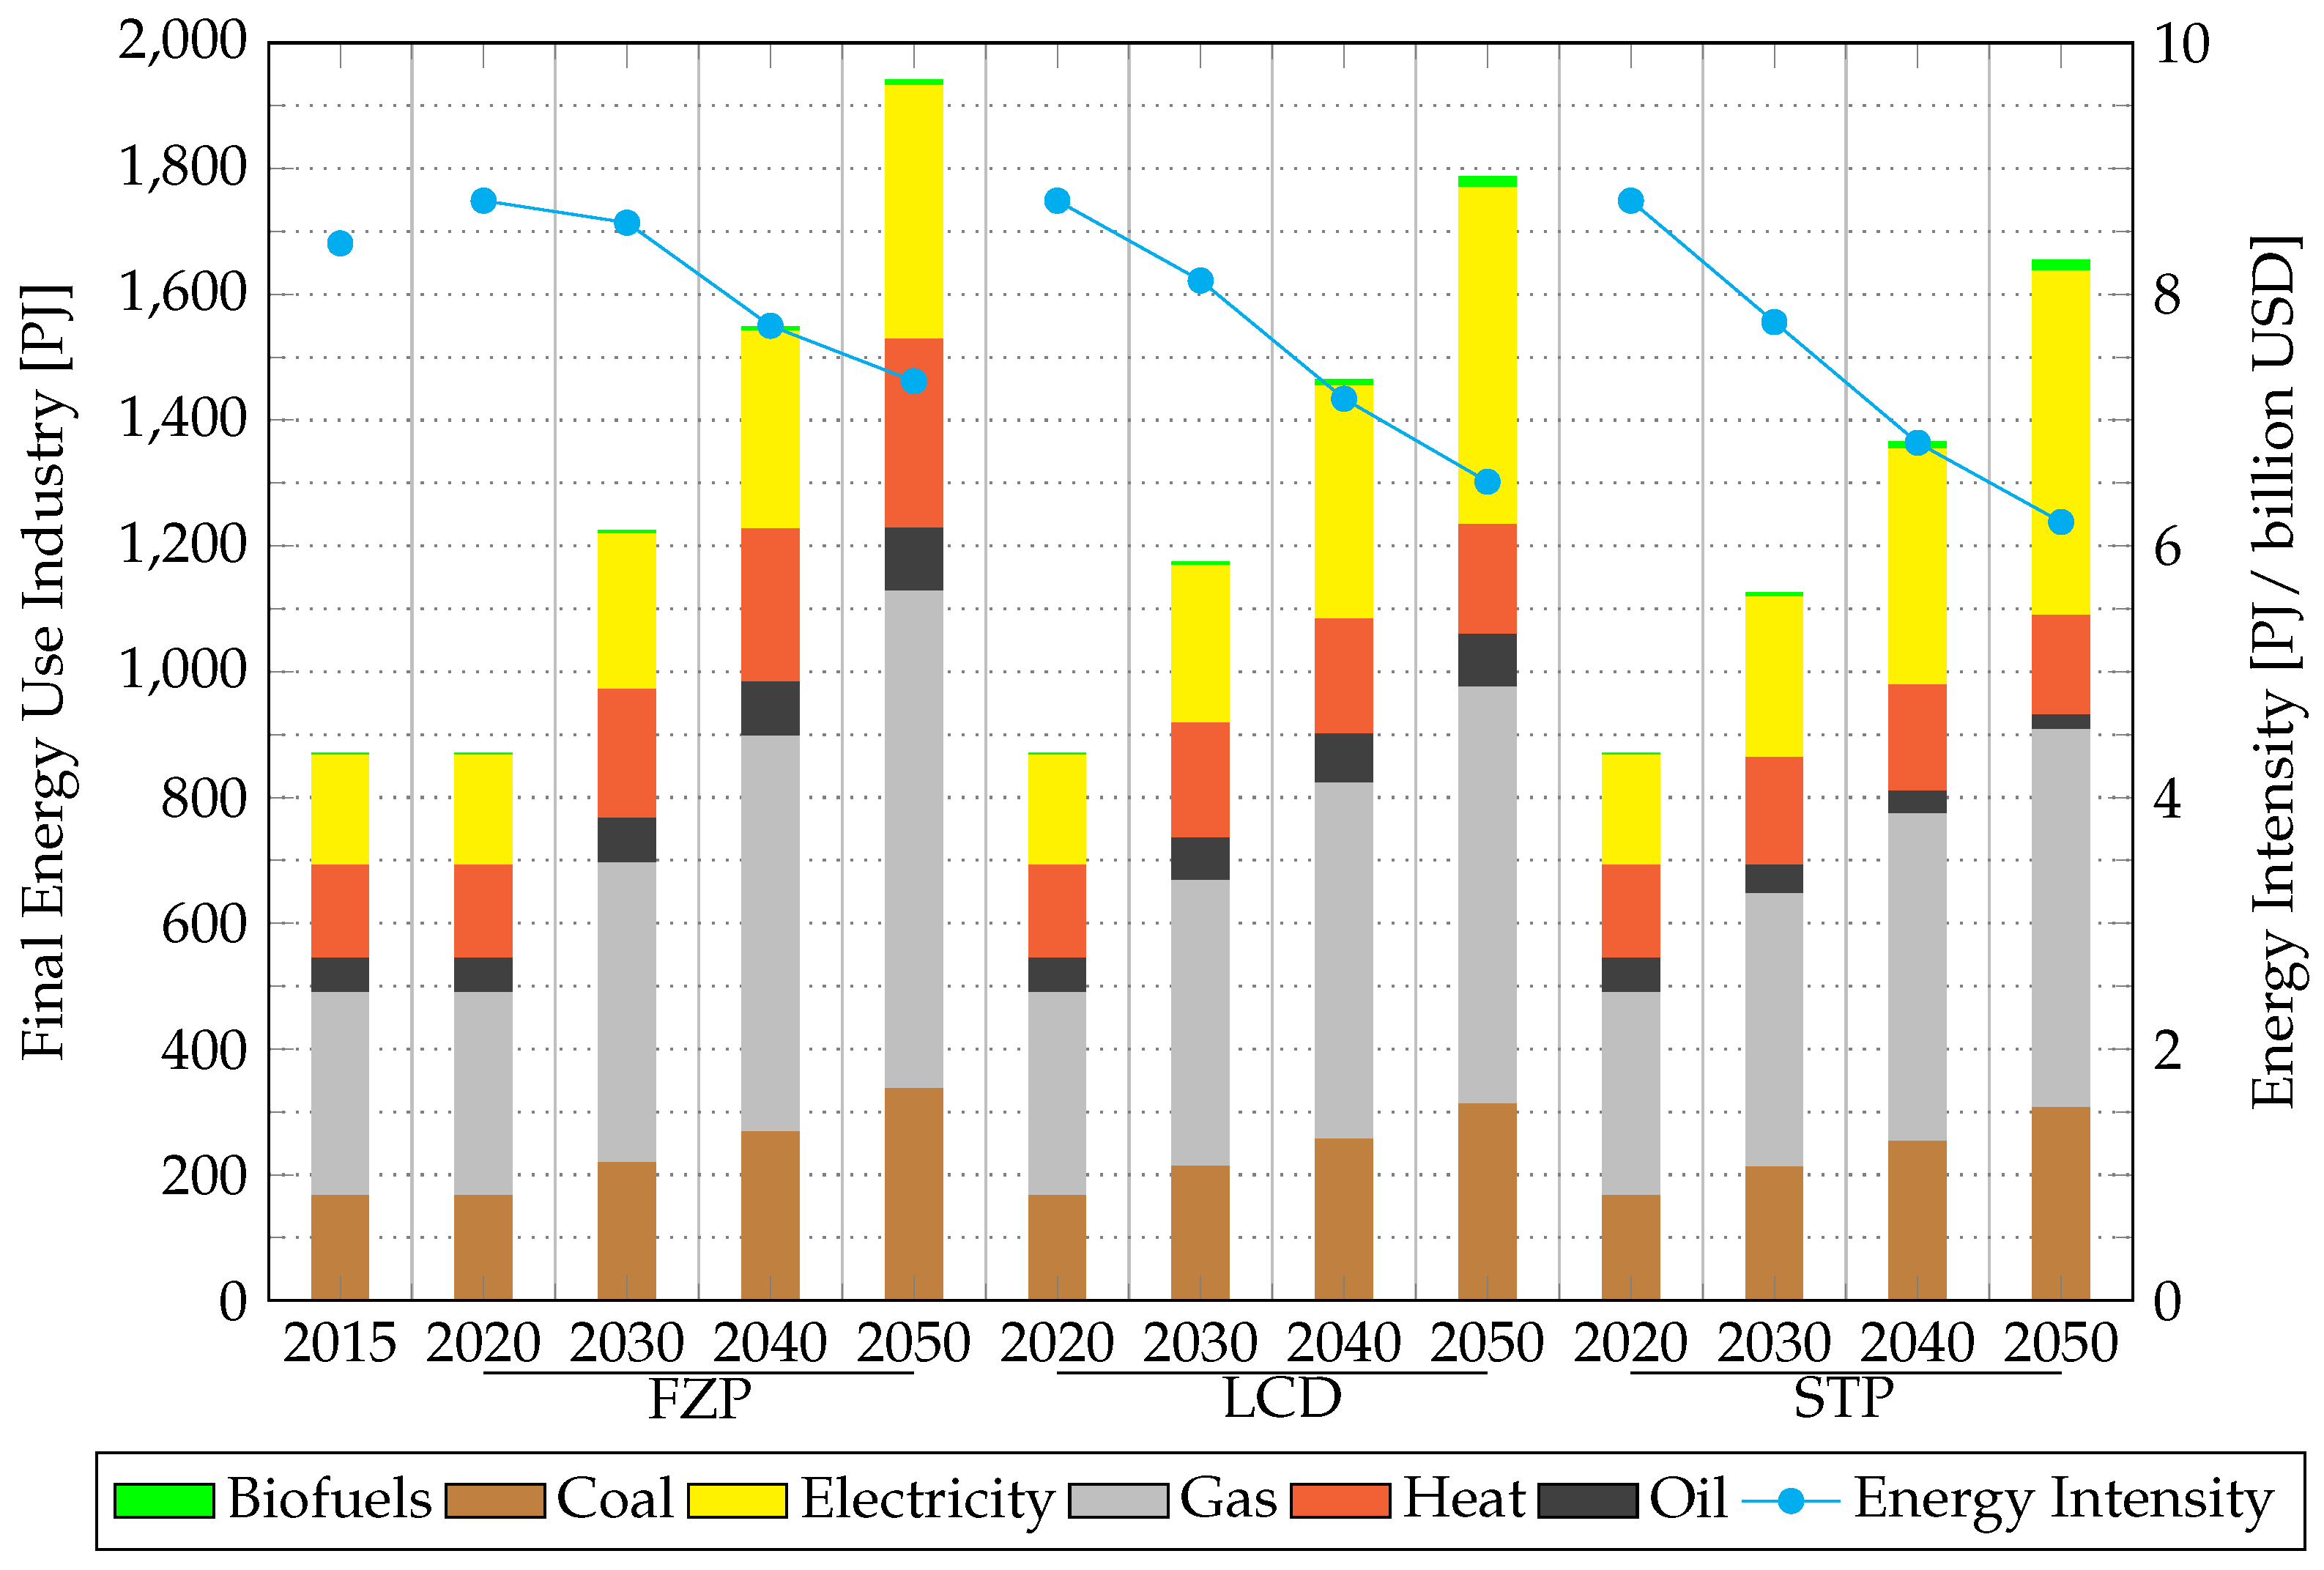
4.4. Industry
The final energy use and energy intensity of the industrial sector in Ukraine are shown in
Figure 6. It can be seen that the energy use will more than double in 2050 compared to the baseline in 2015 in all scenarios. The energy intensity will however decline by more than 25% in the LCD and STP scenario. The STP will result in almost 300 PJ less final energy use than in the FZP scenario. Approximately 58% of energy use in the FZP scenario in 2050 is from direct use of fossil fuels, while this share is 55% in the LCD and STP scenario. The absolute amount of coal used is comparable in all scenarios, while the use of natural gas shows only a slight decrease in the LCD and STP scenarios. While the use of biofuels and oil is very small, electrification in industry will lead to considerably higher electricity use in the industry.
The energy intensity, as an indicator for energy efficiency of the industry, as well as the composition of the industry, will decline in all scenarios. The indicator describes the final energy use per USD of GDP from the industrial sector. The lowest energy intensity is reached in the STP scenario, which is slightly lower than that of LCD.
The heat used in industry does not increase in the LCD and STP scenario, while energy intensity reduces. This indicates the installation of efficient process equipment and electrification of processes in many parts of the industry.
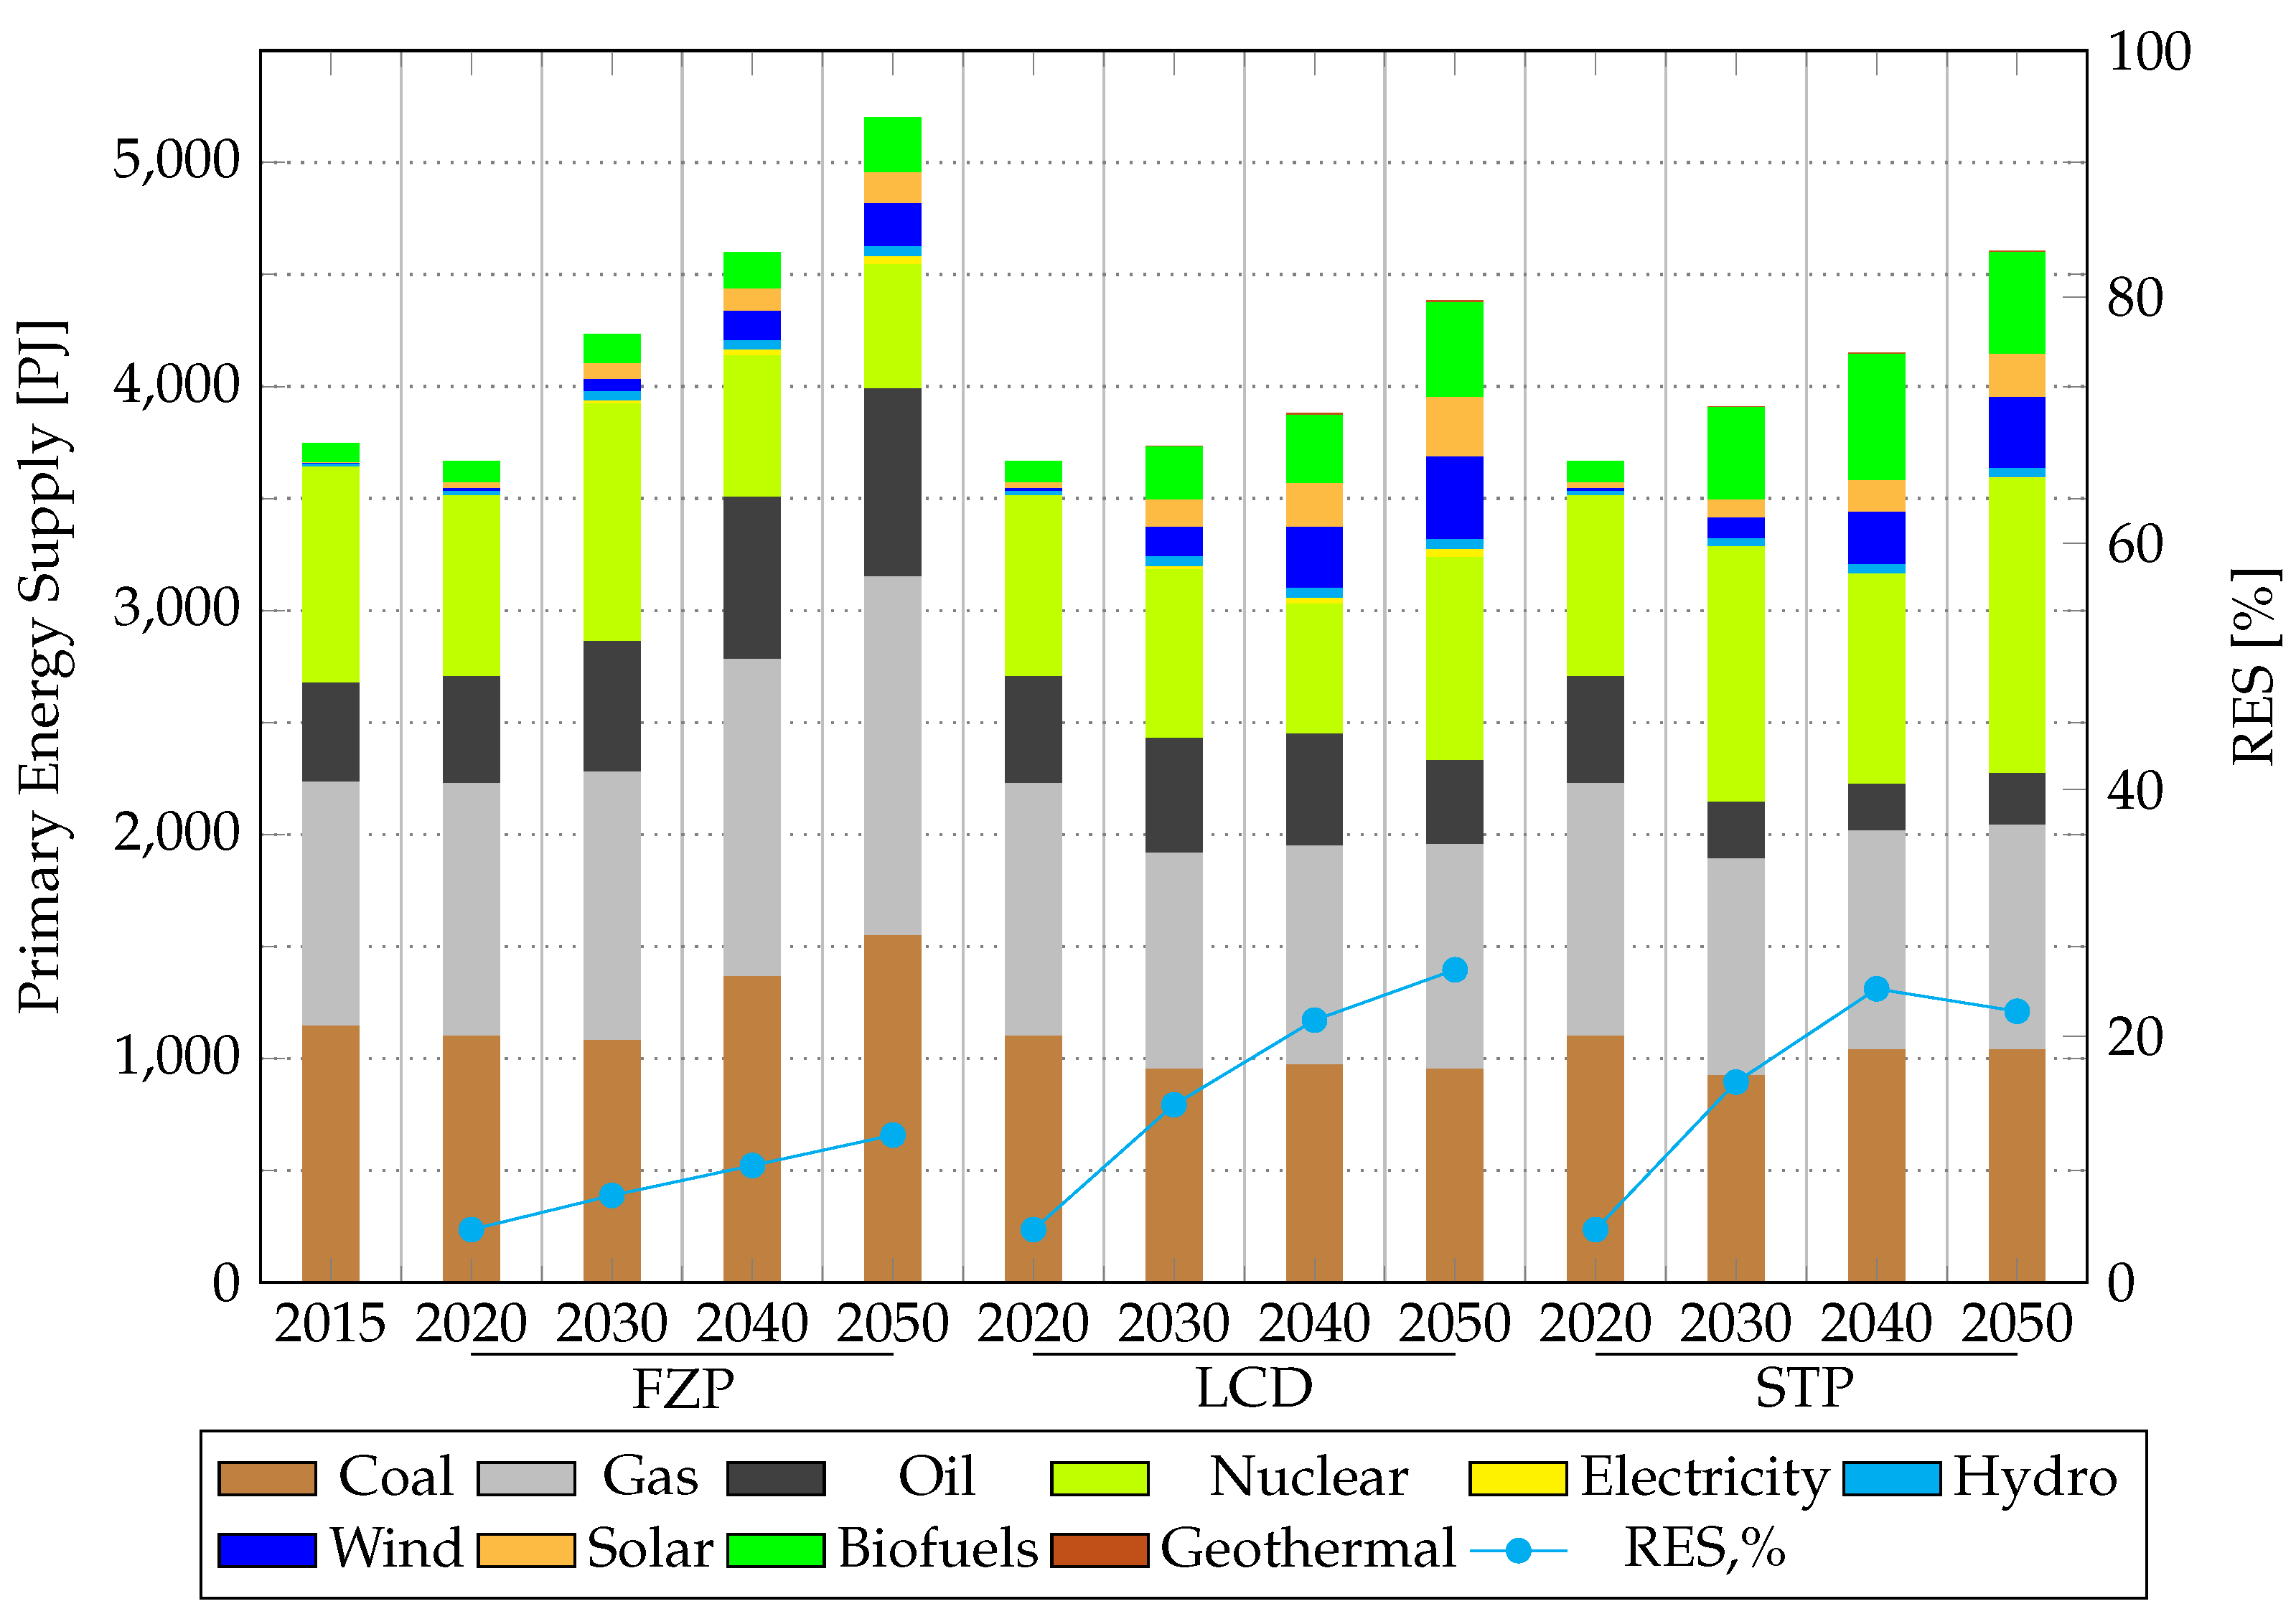
4.5. Supply
In the FZP scenario, development of the energy sector requires a significant increase in the consumption of energy resources, primarily carbon-intensive fuels, towards 2050 (
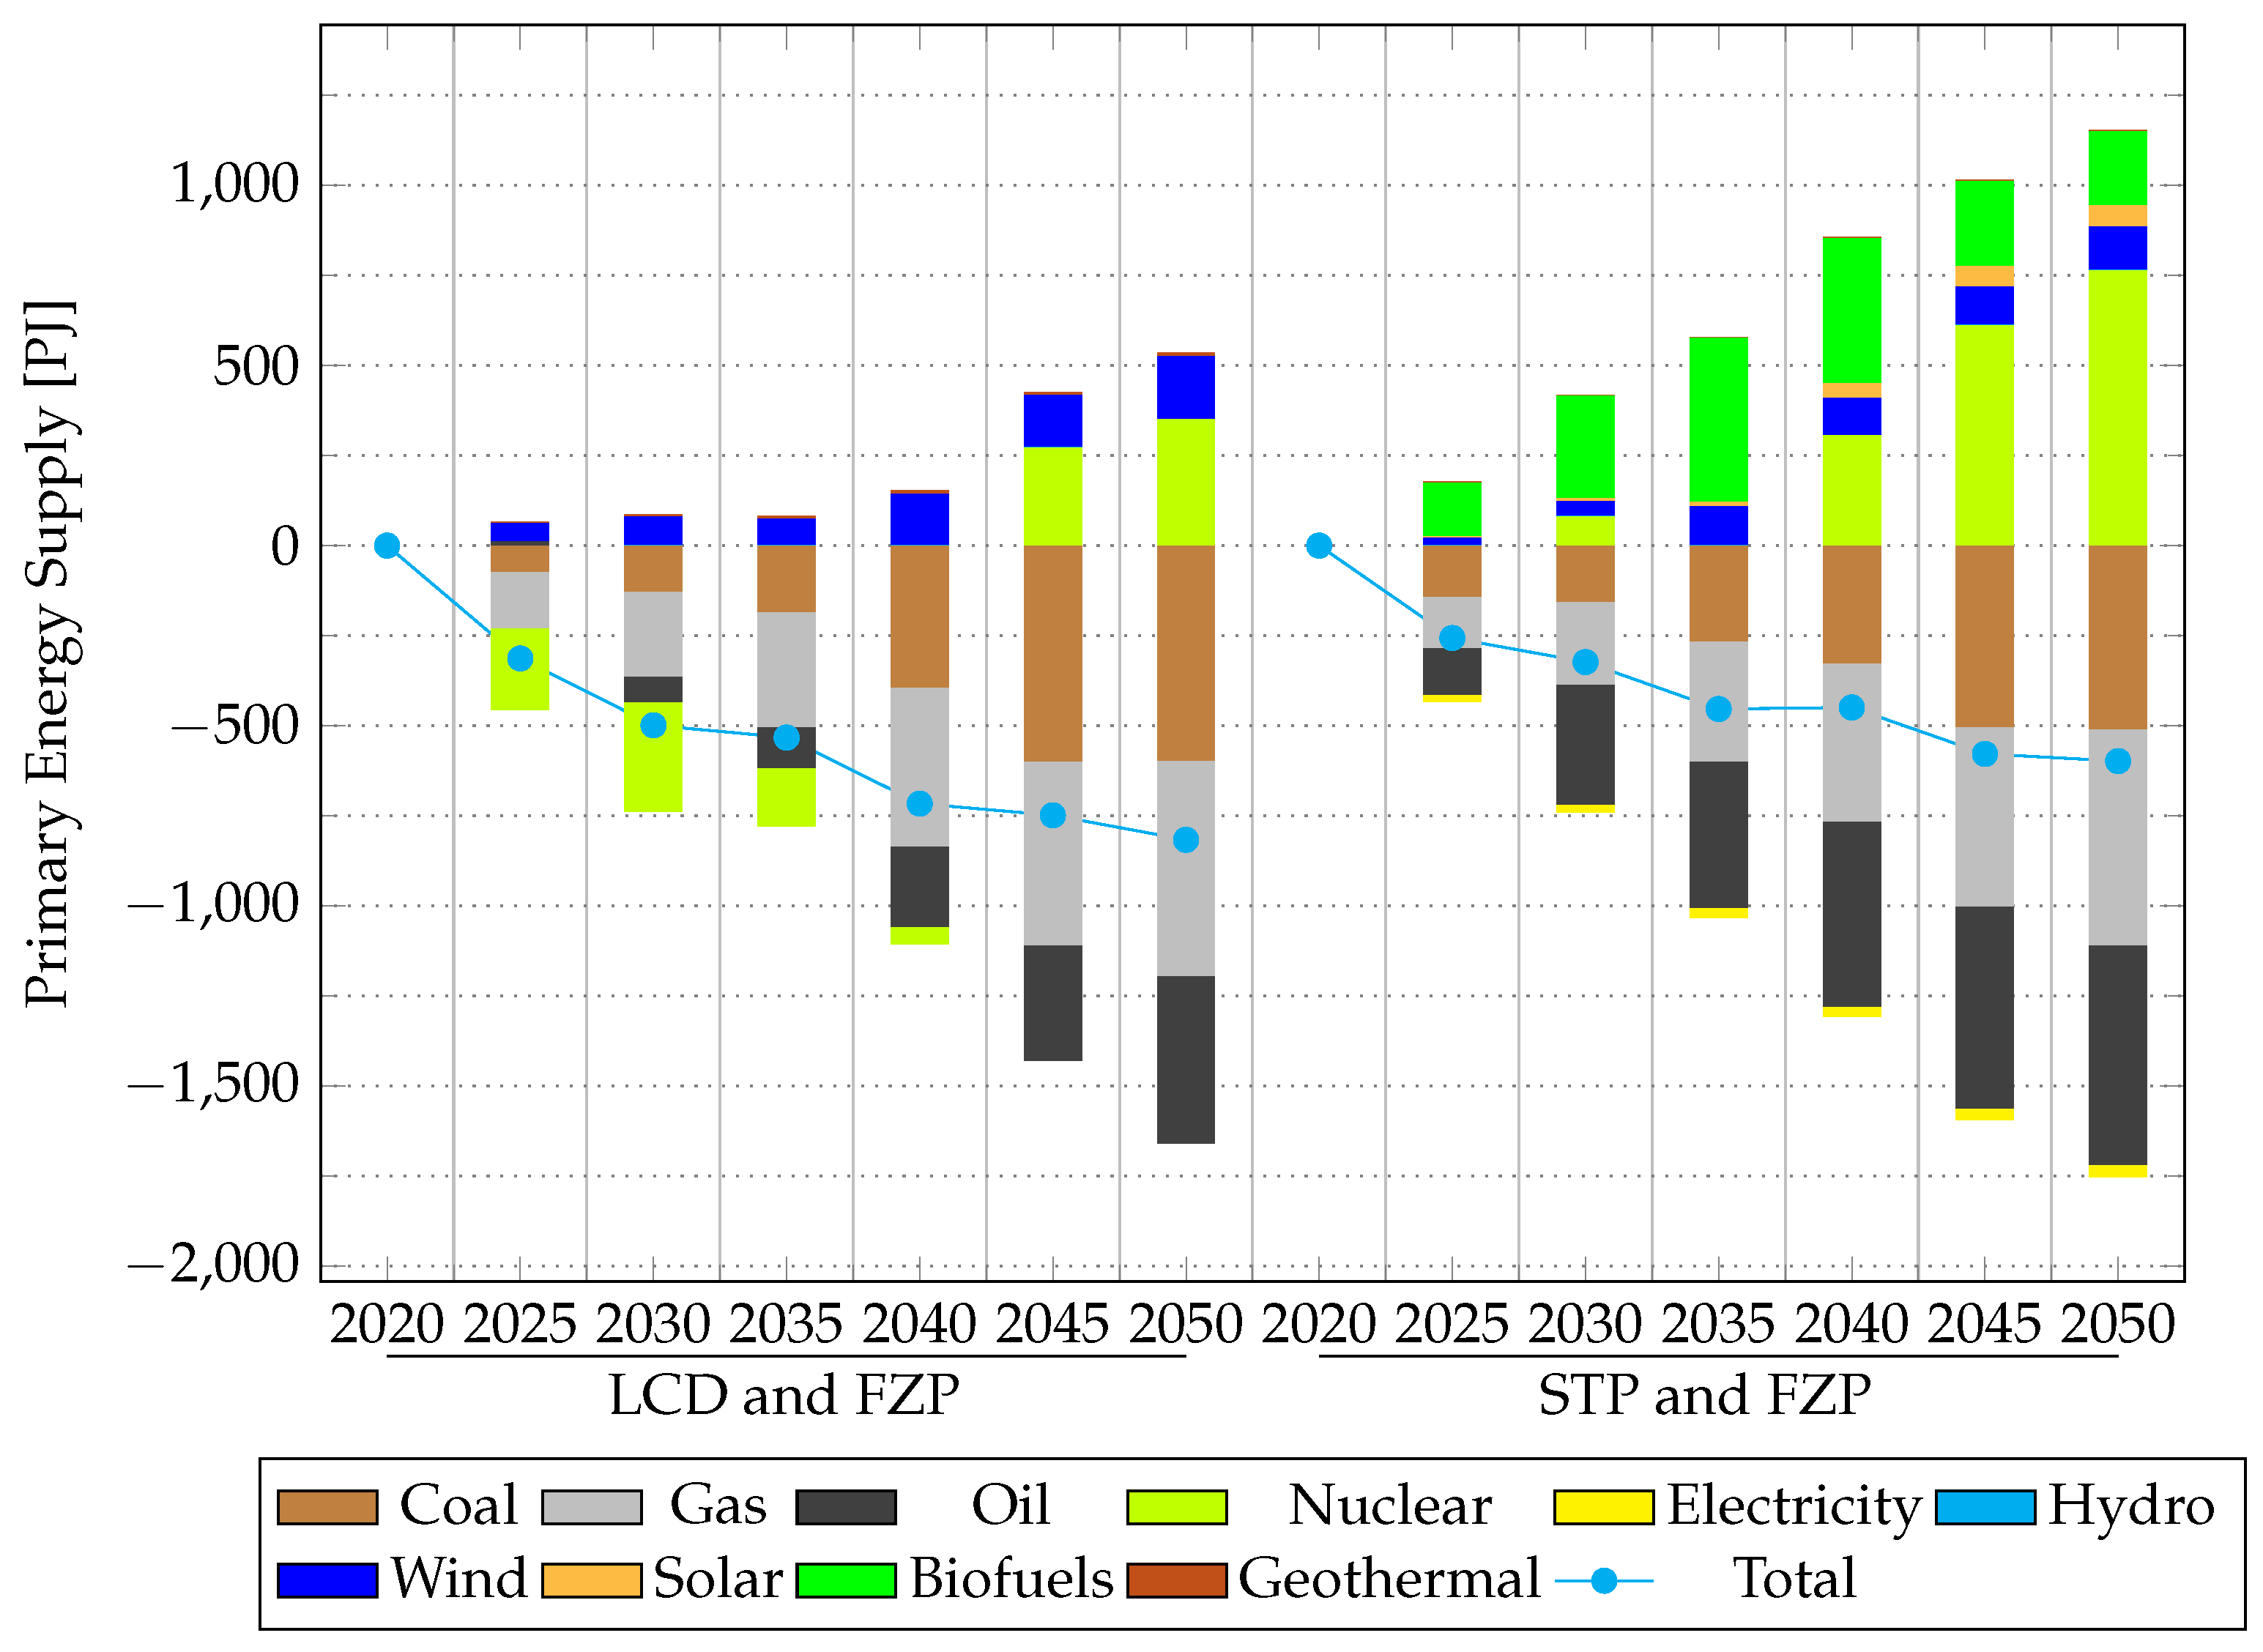
Figure 7). Energy supply from renewable sources increases 4-fold between 2020 and 2050, from 157 to 622 PJ. The share of RES in TPES thereby increases to 12% by 2050. The carbon intensity of the TPES generally increases due to increased consumption of fossil fuels and reduced nuclear energy, despite increased renewable energy supply.
The TPES required in the respective STP and LCD scenarios is lower than the FZP scenario (
Figure 8). The TPES in the LCD scenario will be less by 12% in 2030 and 16% in 2050, relative to the FZP scenario. Compared to the FZP scenario, both the STP and LCD scenarios are less dependent on fossil fuels and have increased RES share. The STP also has increased power supply from nuclear from 2030. The carbon-intensity of energy supply will decrease slowly, as additional demand will be supplied by RES in the LCD scenario, or both RES and nuclear in the STP scenario. The TPES results show that RES compete with other energy sources on market terms, without using policies or support mechanisms to stimulate investments.
The STP scenario has the highest share of nuclear power, due to commissioning of power plants in 2030 and 2050. Before 2050, the STP scenario has the highest RES share, but a decrease in RES share occurs in 2050 due to nuclear power plants. Nuclear power substitutes fossil fuels in the TPES compared to the FZP scenario, and RES and oil in the LCD scenario.
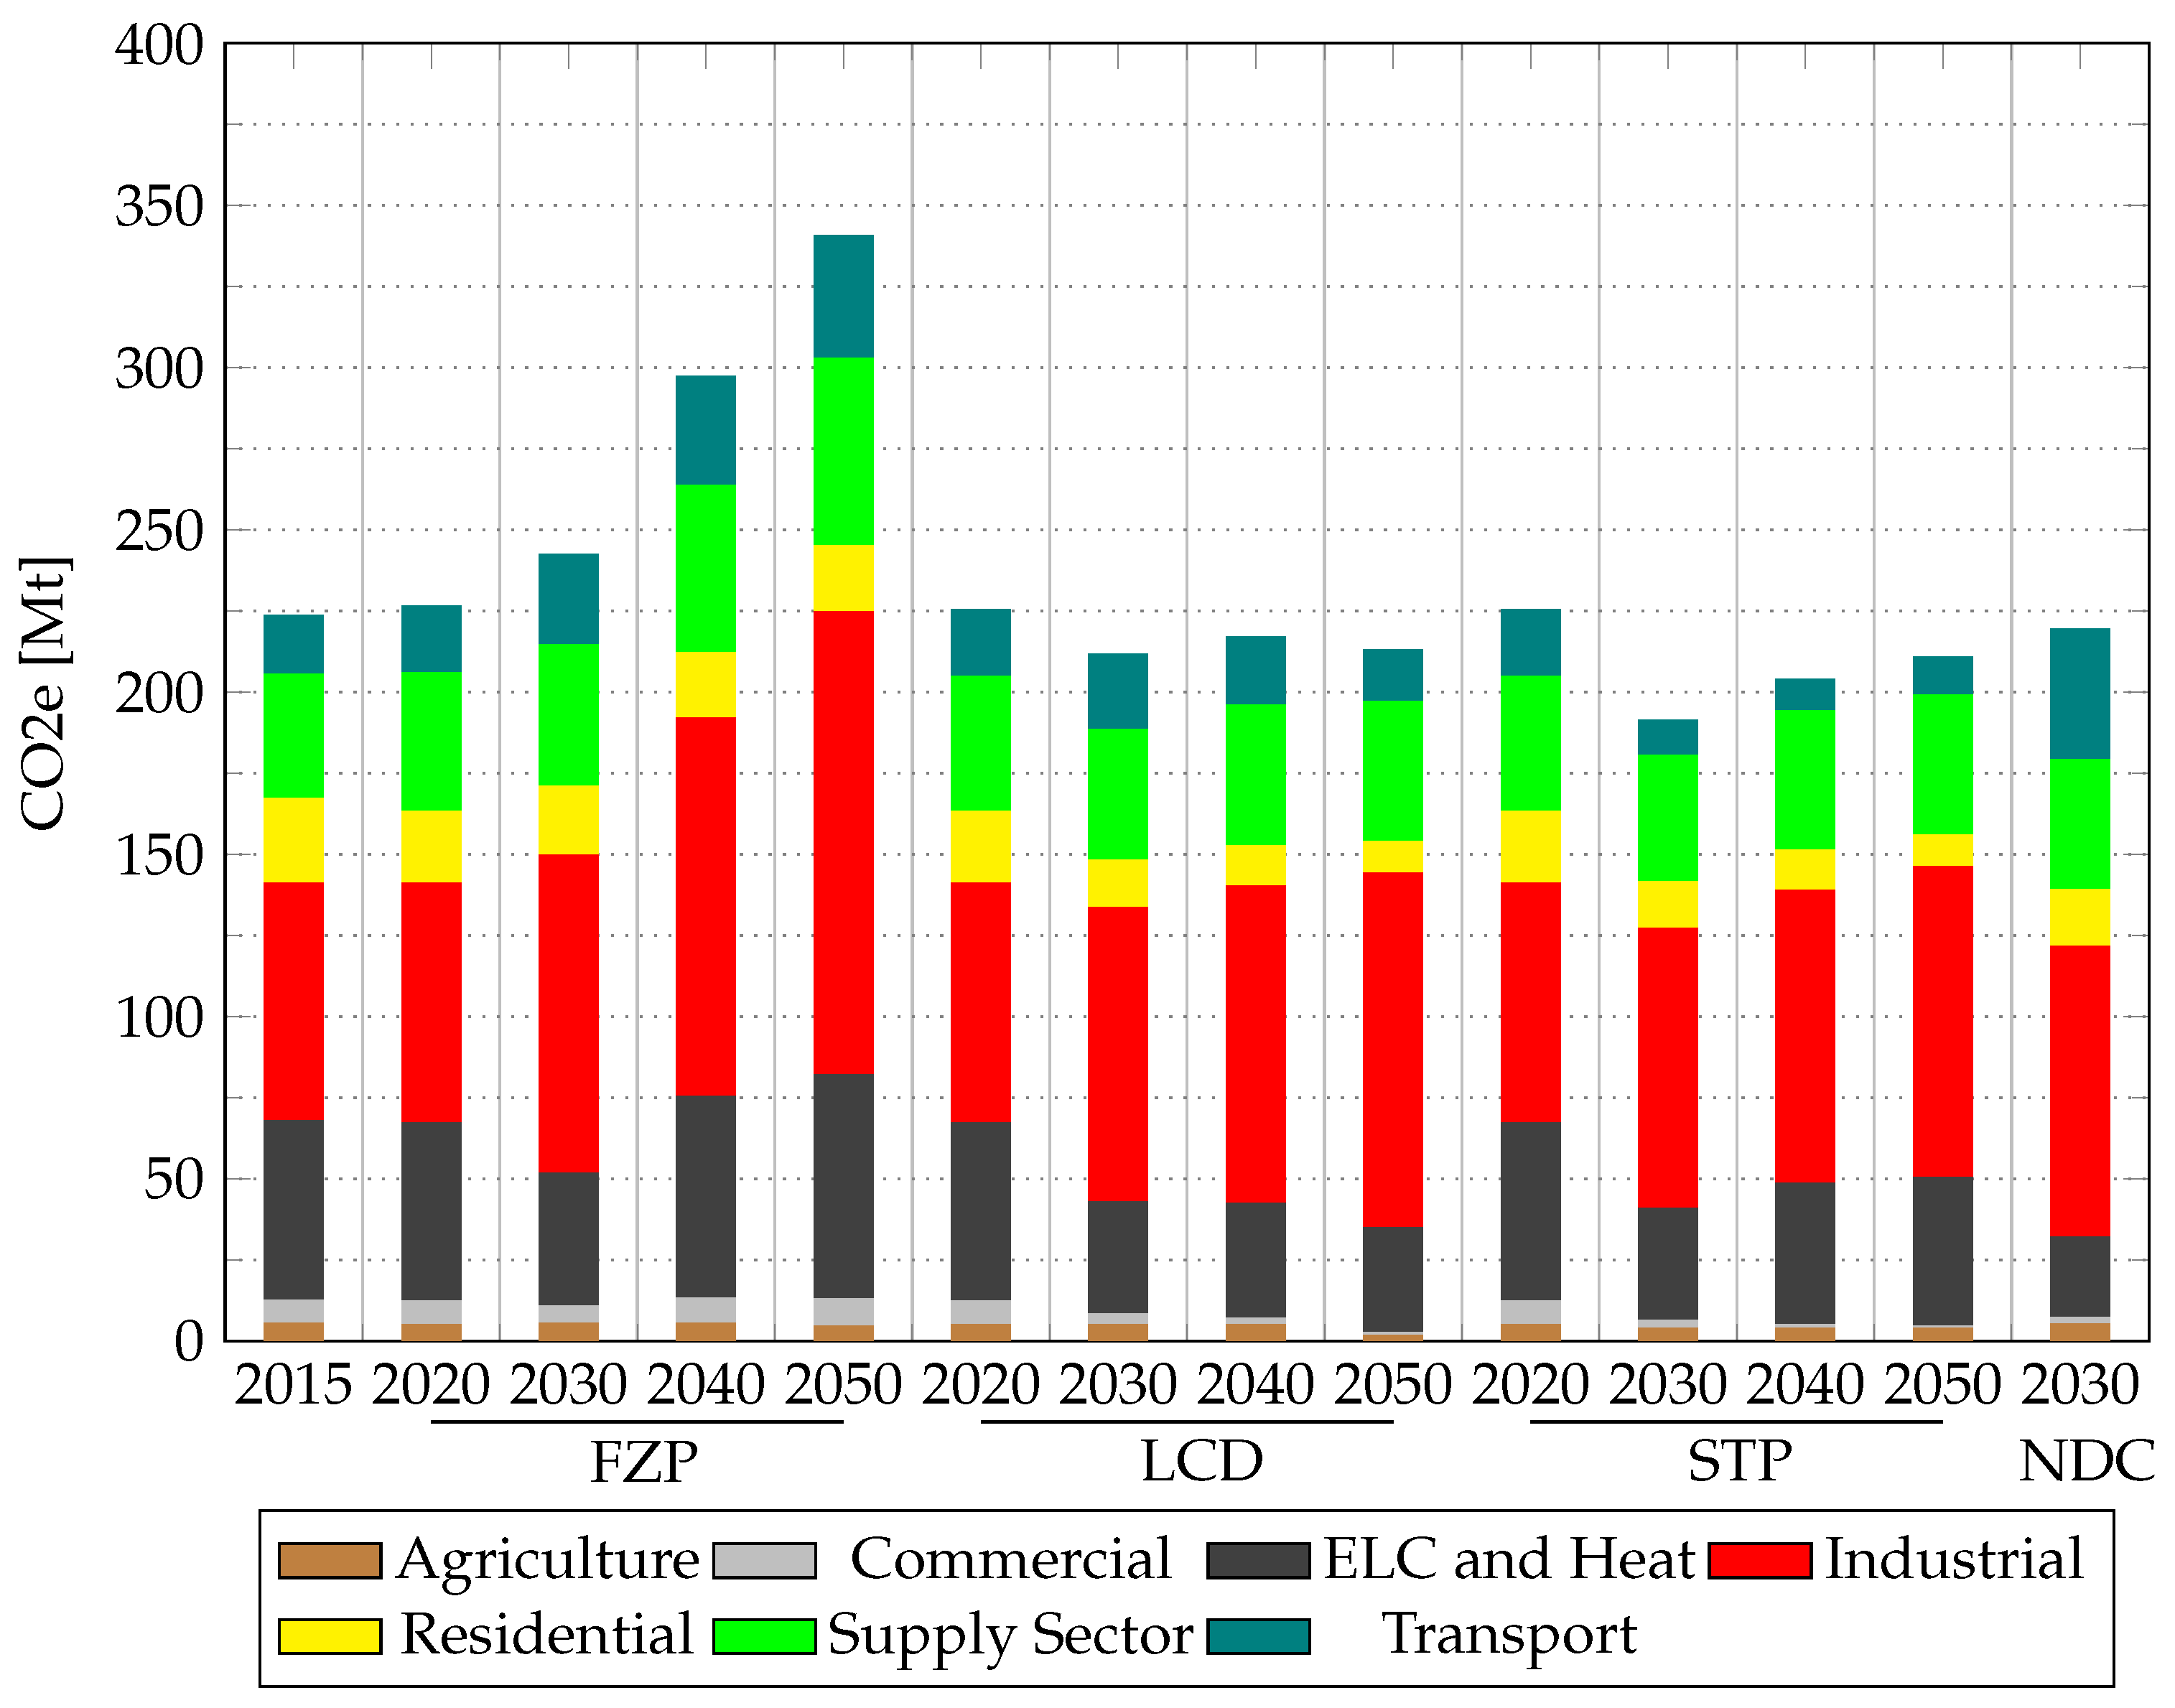
4.6. Emissions
The total emissions in both the LCD and STP scenarios comply with the 2030 NDC for Ukraine, while they do not in the FZP scenario. In the LCD scenario, GHG emissions stabilise in the future at about the level of 2015 with the share of industry at around 50% (
Figure 9). Compared to the FZP scenario, in the LCD scenario, the largest reduction of GHG emissions is in the electricity and heat generation and industry sectors. The transport sector reduces the emissions in 2050 by 23% compared to 2020, despite growth of demand, and by 58% compared to the FZP scenario. In industry, the emissions in 2050 are more than 50% higher than in 2020, but still 20% smaller than in the FZP scenario. However, this is achieved together with an increase of production output and without structural changes.
In the STP scenario, GHG emissions decrease significantly until 2030, as a result of adopted targets and policies (see
Table A1), but increase thereafter to the level specified in the Low Emission Development Strategy [
4]. The FZP and LCD scenarios have no climate constraints, but GHG emission trajectories differ significantly due to diverse options for energy efficiency implementation, renewables and other measures (
Figure 9). In order to maintain the trajectory of the GHG emission reductions achieved in the STP scenario before 2030, new and more ambitious policies relevant for the period beyond 2030 are required.
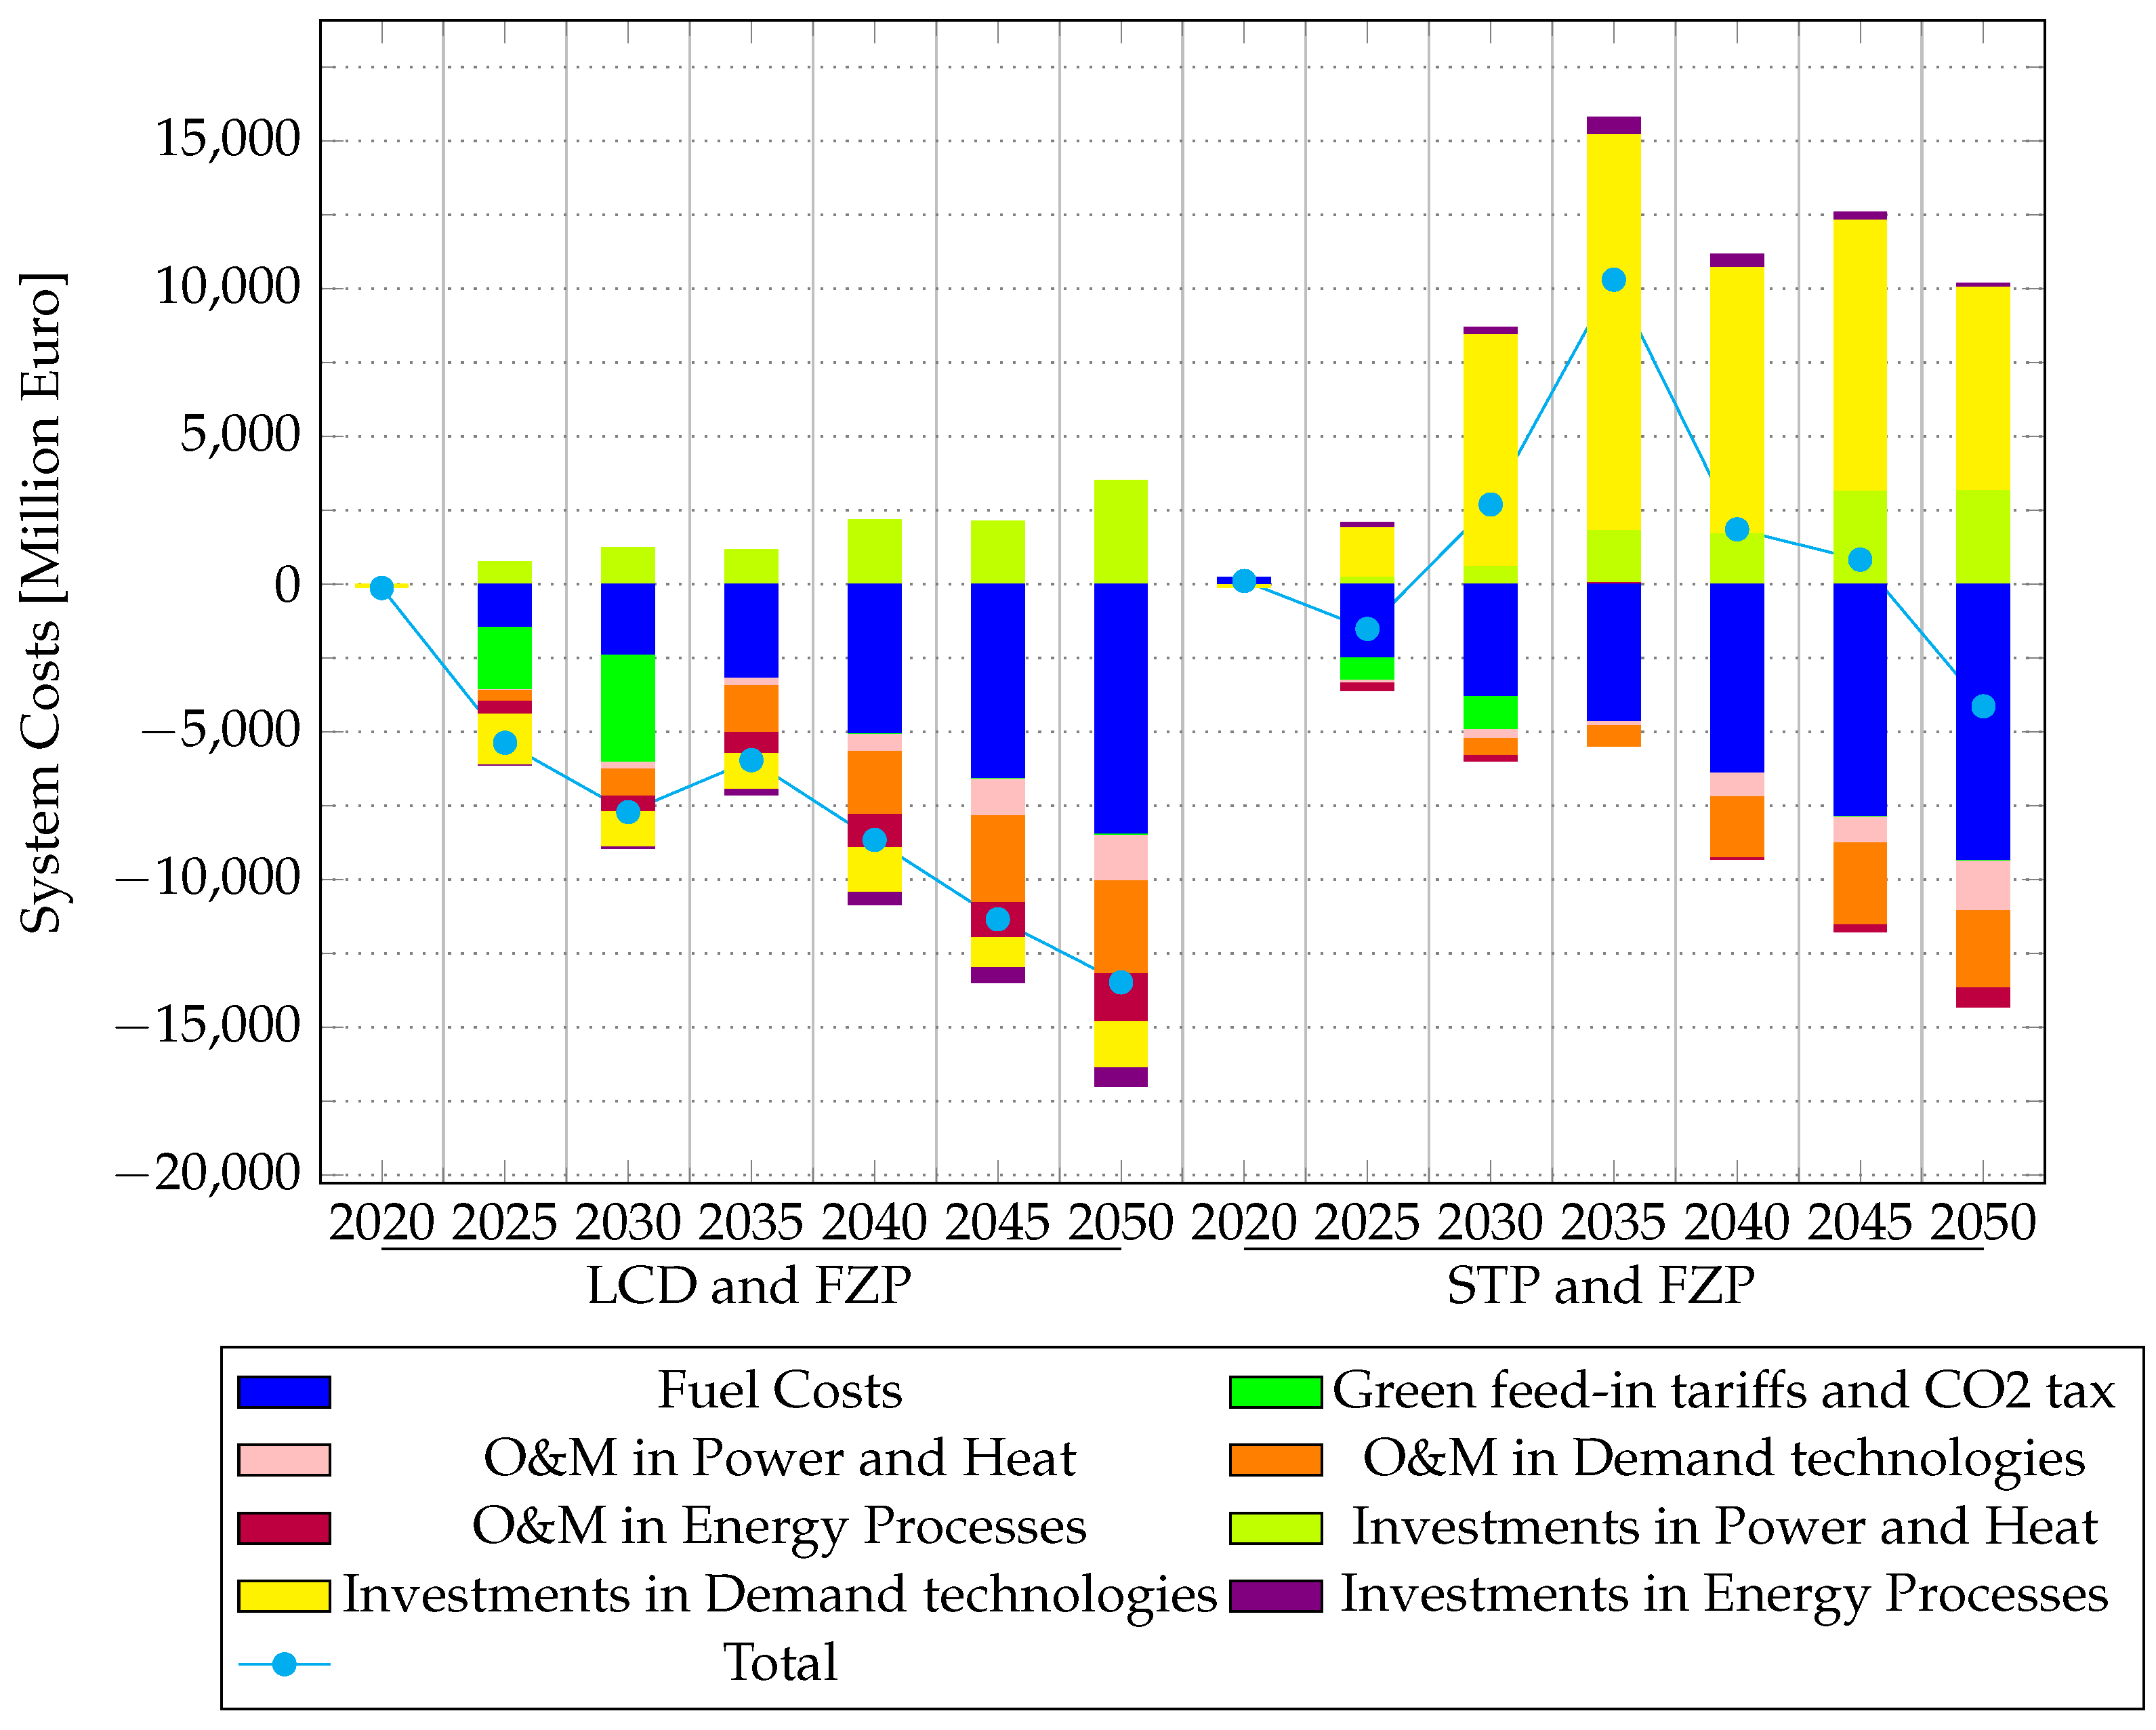
4.7. Costs
Figure 10 shows that, without any strong restrictions and targets, but with options to implement new technologies and measures, annual system costs in the LCD scenario are lower than in the FZP scenario. The STP scenario sees considerably higher investment in more efficient end use (demand) technologies and the power and heat sector leading to significantly lower fuel and O&M expenditures: the savings almost balance the increased costs by 2045 and outweigh them by 2050.
4.8. Alternative Scenarios
For each of the three alternative scenarios, the most significant variables are compared for the period 2020–2050 with their respective values in the FZP scenario. The summary of results for the alternative scenarios is presented in
Table 1. They confirm a lack of ambition in the FZP scenario and present renewable alternatives to the development of the Ukrainian energy system in the main scenarios.
The alternative scenarios show similar development with regards to heat supply to buildings—heat savings in buildings grow drastically relative to the FZP scenario, while DH production decreases while increasing the share of renewables. The share of DH in the heat supply to buildings changes in a narrow range of [−2%, 7%], which means that buildings supplied by DH are equally affected by heat savings as are buildings supplied from individual heating sources.
The results of alternative scenarios for the transport sector are also uniform—the sector is switching towards electricity, leading to a decrease of fuel use due to the higher efficiency of electric vehicles compared to vehicles with internal combustion engines. The use of biofuels in the alternative scenarios remains insignificant (between 0.4% in the CPO to 1.3% in the CNE scenario), the large relative differences appear due to even smaller values in the FZP scenario.
In the industrial sector, the alternative scenarios point in the same direction— heavy industry in Ukraine reduces use of coal and oil considerably, while there is a slight decrease in the use of natural gas and DH. The use of renewables more than doubles. The use of electricity increases and thus provides twofold benefits—reduction of environmental emissions due to strong reduction of carbon content of electricity and a transition towards more energy efficient processes. This is accompanied by a reduction of fuel use in the industrial sector.
Electricity production increases in all the alternative scenarios relative to FZP due to increased electrification of the transport and industrial sectors. Fossil and nuclear-based generation reaches the end of its lifetime, at the time when the investment costs of photovoltaics (PV) and wind power are assumed to decrease. This brings a strong increase in electricity production from wind and PV and a decrease in fossil and nuclear production.
Decarbonised electricity and increased renewable energy use is responsible for reduction of emissions in the transportation and industrial sectors. At the same time, electricity use for heating decreases in the alternative scenarios, while the emissions from commercial and residential buildings decrease due to a large amount of heat saving measures (insulation), decarbonisation of DH supply and introduction of solar heating. The remaining use of electricity in buildings is limited to appliances, while natural gas boilers remain the dominant heat supply provider.
The alternative scenarios are also characterised by more than a doubling of renewable energy in the energy system. At the same time, the electrification of the industrial and transport sectors, along with energy efficiency measures in buildings and industry, lead to reduced TPES. Finally, the total system cost of the energy system is lower in the alternative scenarios than in the FZP scenario (between 3% in SCT and 8% in CPO). This means that major emissions reductions and minor cost reductions are possible for the future Ukrainian energy system.
5. Discussion
The results show that the Ukrainian energy system can reduce GHG emissions, increase renewable energy share and improve energy efficiency while not pressuring the total system costs. Increased electrification of industrial and transport sectors and buildings based on wind, solar and nuclear power is at the centre of this development. However, many assumptions influence the present analysis; they are discussed in this section.
Energy efficiency and electrification are the main pillars of the Ukrainian energy transition. The present analysis shows that the improved energy efficiency in the industrial, transportation and buildings sector is cost-beneficial for the energy system as a whole, but it does not analyse the business-economic perspective or behavioural aspects. The private-economic aspect is the most important for industries, while the decisions on energy efficiency improvements in buildings depend on both economic and behavioural factors. Finally, the choice of vehicles, especially in passenger transport depend both on economic and social factors. The behavioural aspects of the energy transition are not directly included in the present study.
In many studies, especially in countries with developed DH networks, DH is characterised by use of CHPs, utilisation of excess heat from industries and biofuels production, solar heating, large-scale heat pumps driven by renewable electricity and thermal storage. In these studies, DH is at the centre of the energy transition. The present study gives another view of the future—heating demands are reduced strongly (around 70%), individual natural gas boilers are supplying the majority of the demand, while DH, electric heating and solar heating (in alternative scenarios) are contributing in smaller shares. The focal point of insulation measures in the heating sector in ambitious renewable scenarios and unconstrained cost-optimised scenarios has twofold indication: (i) heat savings in Ukrainian buildings are less expensive in comparison with heat supply alternatives due to poor thermal standards of the buildings and (ii) stated policies regarding the energy efficiency of buildings in Ukraine are adequately designed from the energy system point of view.
CNE and SCT are the most ambitious emission-reduction scenarios in the study. The emissions reach 96 Mt and 86 Mt CO2eq in 2050 or 18% and 28% reduction relative to 2020, respectively. However, as the world needs to reach net-zero carbon emissions by 2050 according to the Paris Agreement, even the alternative scenarios do not seem to be overly ambitious. Currently, the TIMES-Ukraine model lacks options such as use of hydrogen in industry or Direct Air Capture to reach net zero or net negative emission goals. On the other hand, the emission pathways presented in the present article are encouraging as they are achieved simultaneously with growth in energy service demands and reduced total system cost relative to the FZP scenario.
The CO2eq emissions have different trajectories across scenarios. GHG emissions in FZP grow throughout the analysed period; they decrease in STP until 2030 and then grow again. In CNE and SCT emissions are stable to 2040 and decrease afterwards, while in CPO and LCD emissions grow to 2035 and then stay constant. Therefore, if reduction of GHG emissions is a prioritary policy, FZP should be avoided, STP could be followed in the short to medium term, CPO and LCD in the long term.CNE and SCT could be followed throughout the whole period. Instead of following a single scenario, a combination of measures behind the scenarios would be desirable.
Export and import of electricity is very limited in the present article. Export and import individually amount to approximately 2% of electricity production in Ukraine in 2020 in all scenarios. In all analysed scenarios, the import drops almost to zero in 2050, while in all scenarios except STP, the import reaches approximately 3% of domestic electricity production in 2050. Ukraine is in the process of joining the European Network of Transmission System Operators for Electricity (ENTSO-E) interconnection. After joining the network, larger exports and imports are expected as well as significant reduction of energy system costs.
All the issues discussed in this section deserve further consideration in further work.
6. Conclusions
The present article is among the only long-term analyses of the future Ukrainian energy system in the academic literature. The analysis is performed until 2050 with the TIMES-Ukraine model, which covers all sectors of the Ukrainian energy system. We have analysed three main scenarios with moderate emission reduction ambitions and three alternative scenarios with higher ambitions.
The development of the Ukrainian energy system is based on energy efficiency improvements, electrification and renewable energy. Energy efficiency improvements are most pronounced in the buildings sector, while improved energy efficiency in industrial and transport sector is closely linked to electrification. Finally, renewable energy mostly enters the energy system through electricity production from wind and PV. In the buildings sector, space heating demand is reduced by approximately 70% in all scenarios except FZP. This means that in an average Ukrainian building in 2050, sanitary hot water could be responsible for approximately 60% of the heating demands, while the rest would go to space heating.
In the industrial sector, electrification is key to unlocking several benefits: improved energy efficiency, an increased share of renewable energy, and reductions in carbon and energy intensity. The improvement in energy efficiency results from the difference in efficiencies between combustion and electrical processes and leads to a reduction in final energy consumption in the industrial sector of 5% in LCD and 10% in STP scenario and between 5% and 11% in the alternative scenarios. As the overall industrial structure does not change in the presented scenarios (high share of energy intensive industries), improved energy efficiency leads to reduced energy intensity by 26–36% in 2050 relative to 2020 in all scenarios except FZP where it is reduced by 16%. Most of the increased renewable energy share comes indirectly from increased share of renewables in the electricity generation mix, even though the direct use of renewables in alternative scenarios reaches 11% to 14% in 2050. Reduced carbon emissions come from reduced use of fossil fuels and increased use of renewables and electricity.
Energy efficiency improvements and emission reductions in the transport sector are achieved through electrification. Average use of electricity in transport grows throughout the analysed period in all the scenarios except FZP; it reaches 51% in STP scenario and 40–42% in the other scenarios. Use of biofuels is negligible in all scenarios except STP where it is used as a “transitional fuel”, namely, comprising 32–37% of final energy consumption in the transport sector.
The present analysis shows that the Stated Policy scenario presents a cost-efficient alternative for keeping Ukraine’s GHG emissions at today’s level. At the same time, the trajectory of the energy system under the STP scenario is very similar to the least-cost development (presented in LCD scenario). Finally, the SCT scenario results in 3% lower total GHG emissions compared to the STP scenario while reducing the total system costs.
Finally, large potential for cost-effective introduction of renewable energy in electricity production (mostly wind and PV), energy efficiency improvements in buildings and industries and electrification of transportation and industrial sectors should be the focus of policy measures in Ukraine as well as of future research.
Author Contributions
Conceptualisation, S.N.P., O.D., R.P. and O.B.; methodology, S.N.P., O.D., R.P. and O.B.; software, O.D., A.S. and O.B.; validation, S.N.P., O.D., A.S. and R.P.; formal analysis, S.N.P., O.D., A.S. and O.B.; investigation, S.N.P., O.D., A.S., R.P., F.B., R.G., M.B. and O.B.; data curation, O.D., A.S. and R.P.; writing—original draft preparation, S.N.P., O.D., A.S., F.B., R.G., M.B. and O.B.; writing—review and editing, S.N.P., O.D., F.B. and O.B.; visualisation, O.D., A.S., F.B. and O.B.; project administration, S.N.P.; All authors have read and agreed to the submitted version of the manuscript.
Funding
This research received no external funding.
Acknowledgments
The authors would like to acknowledge the contribution of Kenneth Karlsson and Mikkel Bosack Simonsen—support on the development of TIMES-Ukraine model; Galyna Trypolska—support on analysis of renewables policy and measures; Roman Yukhymets—support on analysis of energy efficiency policy and measures; and Tetiana Saprykina, Vladyslav Pekkoev and Valentyna Kozubra—support on data collection.
Conflicts of Interest
The authors declare no conflict of interest.
Abbreviations
The following abbreviations are used in this manuscript:
| TPES | Total Primary Energy Supply |
| GHG | Greenhouse gas |
| LULUCF | Land Use, Land use Change and Forestry |
| NDC | Nationally Determined Contributions |
| DH | District heating |
| FZP | Frozen Policy |
| LCD | Least-cost Development |
| STP | Stated Policy |
| CNE | Carbon Neutral Economy |
| SCT | Strong Carbon Tax |
| CPO | Early Coal Phase-out |
Appendix A
Table A1.
Projections of GHG emissions in Energy and Industrial processes sectors in Ukraine 2050 Low-Emission Development Strategy [
4].
Table A1.
Projections of GHG emissions in Energy and Industrial processes sectors in Ukraine 2050 Low-Emission Development Strategy [
4].
| | 2015 | 2020 | 2025 | 2030 | 2035 | 2040 | 2045 | 2050 |
|---|
| Share of GHG emission compared to 1990 in the most ambitious scenario,% | 31 | 31 | 31 | 29 | 28 | 31 | 31 | 31 |
Table A2.
Current adopted energy and climate targets in Ukraine.
Table A2.
Current adopted energy and climate targets in Ukraine.
| Indicators | 2015 | 2018 | 2020 | 2025 | 2030 | 2035 |
|---|
| The Law of Ukraine on the Basic Principles (Strategy) of the State Environmental Policy of Ukraine for the period up to 2030 [8] |
| Share of renewables (incl. hydro power plants) in TPES,% | 4 | | 8 | 12 | 17 | |
| Primary Energy Intensity, toe/$1000 GDP (PPP) | 0.28 | | 0.2 | 0.18 | 0.13 | |
| Share of GHG emission compared to 1990,% | 37.8 | | <76 | <60 | <60 | |
| Air pollutant emissions from stationary sources,% of 2015 | 100 | | <6 | <16.5 | <22.5 | |
| Electric vehicles,% of new vehicles purchased | | | 0.1 | 0.5 | 10 | |
| Energy Strategy of Ukraine until 2035 [9] |
| Primary Energy Intensity, toe/$1000 GDP (PPP) (constant 2011 US$) | 0.28 | | 0.20 | 0.18 | 0.15 | 0.13 |
| Share of renewables (incl. big hydro) in TPES,% | | | 8 | 12 | 17 | 25 |
| Share of renewables (incl. hydro power plants) in power generation,% | 5 | | 7 | 10 | >13 | >25 |
| Share of GHG emission compared to 1990,% | | | <60 | <60 | <60 | <50 |
| National transport strategy of Ukraine for the period up to 2030 [10] |
| GHG emission and air pollutions from stationary sources,% of 1990 | | | | | <60 | |
| Share of alternatives fuels,% | 10 | | | | 50 | |
| Share of electric transport in urban public transport,% | | | | | 75 | |
| National Renewable Energy Action Plan until 2020 [11] |
| Share of renewables in cooling and heating systems,% | 6.7 | 10 | 12.4 | | | |
| Share of renewables in electricity production,% | 8.3 | 10.4 | 11 | | | |
| Share of renewables in transport,% | 5 | 8.2 | 10 | | | |
| Share of renewables in Gross Final Energy Consumption (GFEC),% | 6.7 | 9.1 | 11 | | | |
| National Energy Efficiency Action Plan until 2020 [12] |
| Share of retrofit residential buildings,% | | 25 | | | | |
| Share of retrofit public buildings,% | | 20 | | | | |
| Net-zero energy building,% per year | | 3 | | | | |
| Energy saving in 2020 from average FEC in 2005–2009,% | | 9 | | | | |
| Concept of implementation of the state policy of heat supply until 2035 [13] |
| Heat production losses,% | | 8 | | | | |
| Transmission heat losses,% | | 12 | | | | 10 |
| Share of alternative energy in heat production,% | | | 30 | | 40 | |
References
- IPCC. Global Warming of 1.5 °C. An IPCC Special Report on the Impacts of Global Warming of 1.5 °C above Pre-Industrial Levels and Related Global Greenhouse Gas Emission Pathways, in the Context of Strengthening the Global Response to the Threat of Climate Change, Sustainable Development, and Efforts to Eradicate Poverty; Masson-Delmotte, V., Zhai, P., Pörtner, H.-O., Roberts, D., Skea, J., Shukla, P.R., Pirani, A., Moufouma-Okia, W., Péan, C., Pidcock, R., et al., Eds.; 2018; in press. [Google Scholar]
- UNFCCC. Adoption of the Paris Agreement; UNFCCC: Bonn, Germany, 2015. [Google Scholar]
- MEPR. Ukraine’s Greenhouse Gas Inventory 1990–2019; MEPR: Kyiv, Ukraine, 2021. [Google Scholar]
- The Government of Ukraine. Ukraine 2050 Low Emission Development Strategy; Technical report; Governmentl of Ukraine: Kyiv, Ukraine, 2017.
- MEPR. Updated Nationally Determined Contribution of Ukraine to the Paris Agreement; MEPR: Kyiv, Ukraine, 2021. [Google Scholar]
- SSSU. Energy Balance Data Time Series for the Period of 1990–2019; SSSU: Kyiv, Ukraine, 2020. [Google Scholar]
- IEA. Ukraine Energy Profile; IEA: Paris, France, 2020. [Google Scholar]
- Verkhovna Rada of Ukraine. The Law of Ukraine on the Basic Principles (Strategy) of the State Environmental Policy of Ukraine for the period up to 2030; Verkhovna Rada of Ukraine: Kyiv, Ukraine, 2019.
- The Government of Ukraine. Energy Strategy of Ukraine till 2035; Government of Ukraine: Kyiv, Ukraine, 2017.
- The Government of Ukraine. National Transport Strategy of Ukraine for the Period up to 2030; Government of Ukraine: Kyiv, Ukraine, 2018.
- The Government of Ukraine. National Renewable Energy Action Plan till 2020; Government of Ukraine: Kyiv, Ukraine, 2014.
- State Agency on Energy Efficiency and Energy Saving of Ukraine. National Energy Efficiency Action Plan till 2020; State Agency on Energy Efficiency and Energy Saving of Ukraine: Kyiv, Ukraine, 2015.
- The Government of Ukraine. Concept of Realization of the State Policy of Heat Supply till 2035; Government of Ukraine: Kyiv, Ukraine, 2017.
- Lund, H.; Mathiesen, B.V. Energy system analysis of 100% renewable energy systems-The case of Denmark in years 2030 and 2050. Energy 2009, 34, 524–531. [Google Scholar] [CrossRef]
- Ćosić, B.; Krajačić, G.; Duić, N. A 100% renewable energy system in the year 2050: The case of Macedonia. Energy 2012, 48, 80–87. [Google Scholar] [CrossRef] [Green Version]
- Balyk, O.; Andersen, K.S.; Dockweiler, S.; Gargiulo, M.; Karlsson, K.; Næraa, R.; Petrović, S.; Tattini, J.; Termansen, L.B.; Venturini, G. TIMES-DK: Technology-rich multi-sectoral optimisation model of the Danish energy system. Energy Strategy Rev. 2019, 23, 13–22. [Google Scholar] [CrossRef]
- Capros, P.; Tasios, N.; Vita, A.D.; Mantzos, L.; Paroussos, L. Model-based analysis of decarbonising the EU economy in the time horizon to 2050. Energy Strategy Rev. 2012, 1, 76–84. [Google Scholar] [CrossRef]
- Dominković, D.F.; Bačeković, I.; Ćosić, B.; Krajačić, G.; Pukšec, T.; Duić, N.; Markovska, N. Zero carbon energy system of South East Europe in 2050. Appl. Energy 2016, 184, 1517–1528. [Google Scholar] [CrossRef] [Green Version]
- Sgobbi, A.; Nijs, W.; Miglio, R.D.; Chiodi, A.; Gargiulo, M.; Thiel, C. How far away is hydrogen? Its role in the medium and long-term decarbonisation of the European energy system. Int. J. Hydrogen Energy 2016, 41, 19–35. [Google Scholar] [CrossRef]
- Petrović, S.N.; Karlsson, K.B. Residential heat pumps in the future Danish energy system. Energy 2016, 114, 787–797. [Google Scholar] [CrossRef] [Green Version]
- Caldera, U.; Breyer, C. The role that battery and water storage play in Saudi Arabia’s transition to an integrated 100% renewable energy power system. J. Energy Storage 2018, 17, 299–310. [Google Scholar] [CrossRef]
- Lund, H.; Möller, B.; Mathiesen, B.V.; Dyrelund, A. The role of district heating in future renewable energy systems. Energy 2010, 35, 1381–1390. [Google Scholar] [CrossRef]
- Mathiesen, B.V.; Lund, H.; Connolly, D. Limiting biomass consumption for heating in 100% renewable energy systems. Energy 2012, 48, 160–168. [Google Scholar] [CrossRef]
- Blesl, M.; Das, A.; Fahl, U.; Remme, U. Role of energy efficiency standards in reducing CO2 emissions in Germany: An assessment with TIMES. Energy Policy 2007, 35, 772–785. [Google Scholar] [CrossRef]
- Fortes, P.; Simoes, S.G.; Gouveia, J.P.; Seixas, J. Electricity, the silver bullet for the deep decarbonisation of the energy system? Cost-effectiveness analysis for Portugal. Appl. Energy 2019, 237, 292–303. [Google Scholar] [CrossRef]
- Khanna, N.; Fridley, D.; Zhou, N.; Karali, N.; Zhang, J.; Feng, W. Energy and CO2 implications of decarbonization strategies for China beyond efficiency: Modeling 2050 maximum renewable resources and accelerated electrification impacts. Appl. Energy 2019, 242, 12–26. [Google Scholar] [CrossRef]
- Gota, D.I.; Lund, H.; Miclea, L. A Romanian energy system model and a nuclear reduction strategy. Energy 2011, 36, 6413–6419. [Google Scholar] [CrossRef]
- Petrović, S.; Colangelo, A.; Balyk, O.; Delmastro, C.; Gargiulo, M.; Simonsen, M.B.; Karlsson, K. The role of data centres in the future Danish energy system. Energy 2020, 194. [Google Scholar] [CrossRef]
- Scott, I.J.; Carvalho, P.M.; Botterud, A.; Silva, C.A. Long-term uncertainties in generation expansion planning: Implications for electricity market modelling and policy. Energy 2021, 227. [Google Scholar] [CrossRef]
- Ozawa, A.; Kudoh, Y.; Murata, A.; Honda, T.; Saita, I.; Takagi, H. Hydrogen in low-carbon energy systems in Japan by 2050: The uncertainties of technology development and implementation. Int. J. Hydrogen Energy 2018, 43, 18083–18094. [Google Scholar] [CrossRef]
- Pizarro-Alonso, A.; Ravn, H.; Münster, M. Uncertainties towards a fossil-free system with high integration of wind energy in long-term planning. Appl. Energy 2019, 253. [Google Scholar] [CrossRef]
- Andersen, K.S.; Wiese, C.; Petrovic, S.; McKenna, R. Exploring the Role of Households’ Hurdle Rates and Demand Elasticities in Meeting Danish Energy-Savings Target; Energy Policy; Elsevier Ltd.: Amsterdam, The Netherland, 2020; Volume 146. [Google Scholar] [CrossRef]
- Capros, P.; Paroussos, L.; Fragkos, P.; Tsani, S.; Boitier, B.; Wagner, F.; Busch, S.; Resch, G.; Blesl, M.; Bollen, J. European decarbonisation pathways under alternative technological and policy choices: A multi-model analysis. Energy Strategy Rev. 2014, 2, 231–245. [Google Scholar] [CrossRef]
- Kato, E.; Kurosawa, A. Evaluation of Japanese Energy System toward 2050 with TIMES-Japan—Deep Decarbonization Pathways; Energy Procedia; Elsevier Ltd.: Amsterdam, The Netherland, 2019; Volume 158, pp. 4141–4146. [Google Scholar] [CrossRef]
- Hedegaard, K.; Münster, M. Influence of individual heat pumps on wind power integration—Energy system investments and operation. Energy Convers. Manag. 2013, 75, 673–684. [Google Scholar] [CrossRef] [Green Version]
- Odenberger, M.; Kjärstad, J.; Johnsson, F. Prospects for CCS in the EU Energy Roadmap to 2050; Energy Procedia; Elsevier Ltd.: Amsterdam, The Netherland, 2013; Volume 37, pp. 7573–7581. [Google Scholar] [CrossRef] [Green Version]
- Fernandes, L.; Ferreira, P. Renewable energy scenarios in the Portuguese electricity system. Energy 2014, 69, 51–57. [Google Scholar] [CrossRef] [Green Version]
- Amorim, F.; Pina, A.; Gerbelová, H.; Pereira da Silva, P.; Vasconcelos, J.; Martins, V. Electricity decarbonisation pathways for 2050 in Portugal: A TIMES (The Integrated MARKAL-EFOM System) based approach in closed versus open systems modelling. Energy 2014, 69, 104–112. [Google Scholar] [CrossRef] [Green Version]
- Solomon, A.A.; Bogdanov, D.; Breyer, C. Solar driven net zero emission electricity supply with negligible carbon cost: Israel as a case study for Sun Belt countries. Energy 2018, 155, 87–104. [Google Scholar] [CrossRef]
- Ichinohe, M.; Endo, E. Analysis of the vehicle mix in the passenger-car sector in Japan for CO2 emissions reduction by a MARKAL model. Appl. Energy 2006, 83, 1047–1061. [Google Scholar] [CrossRef]
- Hugues, P.; Assoumou, E.; Maizi, N. Assessing GHG mitigation and associated cost of French biofuel sector: Insights from a TIMES model. Energy 2016, 113, 288–300. [Google Scholar] [CrossRef]
- Tattini, J.; Mulholland, E.; Venturini, G.; Ahanchian, M.; Gargiulo, M.; Balyk, O.; Karlsson, K. A long-term strategy to decarbonise the danish inland passenger transport sector. Lect. Notes Energy 2018, 64, 137–153. [Google Scholar] [CrossRef]
- Chepeliev, M.; Diachuk, O.; Podolets, R. Economic assessment of low-emission development scenarios for Ukraine. Lect. Notes Energy 2018, 64, 277–295. [Google Scholar] [CrossRef]
- Diachuk, O.; Chepeliev, M.; Podolets, R. Support to the Government of Ukraine on Updating its Nationally Determined Contribution (NDC); Modeling report; Technical report; Institute for Economics and Forecasting of the National Academy of Sciences of Ukraine: Kyiv, Ukraine, 2020. [Google Scholar]
- Diachuk, O.; Podolets, R.; Yukhymets, R.; Pekkoiev, V.; Balyk, O.; Simonsen, M. Long-term Energy Modelling and Forecasting in Ukraine: Scenarios for the Action Plan of Energy Strategy of Ukraine until 2035; Danish Energy Agency: Copenhagen, Denmark, 2019. [Google Scholar]
- Diachuk, O.; Chepeliev, M.; Podolets, R. Transition of Ukraine to the Renewable Energy by 2050; Art Book Ltd.: Kyiv, Ukraine, 2018; p. 88. [Google Scholar]
- Podolets, R.; Diachuk, O. Strategic Planning in Fuel and Energy Complex Based on TIMES-Ukraine Model: Scientific Report; Technical report; Institute for Economics and Forecasting: Kyiv, Ukraine, 2011. [Google Scholar]
- ERI; CNREC. China Renewable Energy Outlook 2016; Danish Energy Agency: Copenhagen, Denmark, 2016. [Google Scholar]
- ERI; CNREC. China Renewable Energy Outlook 2017; Danish Energy Agency: Copenhagen, Denmark, 2017. [Google Scholar]
- ERI; CNREC. China Renewable Energy Outlook 2018; Danish Energy Agency: Copenhagen, Denmark, 2018. [Google Scholar]
- ERI; NDRC. China Renewable Energy Outlook 2019; Danish Energy Agency: Copenhagen, Denmark, 2019. [Google Scholar]
- ERI; NDRC. China Renewable Energy Outlook 2020; Danish Energy Agency: Copenhagen, Denmark, 2021. [Google Scholar]
- SGNEC. Indonesia Energy Outlook 2019; Danish Energy Agency: Copenhagen, Denmark, 2019. [Google Scholar]
- EREA; DEA. Vietnam Energy Outlook Report 2019; Danish Energy Agency: Copenhagen, Denmark, 2019. [Google Scholar]
- Loulou, R.; Goldstein, G.; Kanudia, A.; Lettila, A.; Remme, U. Documentation for the TIMES Model Part I: TIMES Concepts and Theory; ETSAP: Paris, France, 2016. [Google Scholar]
- Loulou, R.; Lehtila, A.; Kanudia, A.; Remme, U.; Goldstein, G. Documentation for the TIMES Model Part II: Reference Manual; ETSAP: Paris, France, 2016. [Google Scholar]
- Goldstein, G.; Kanudia, A.; Lehtila, A.; Remme, U.; Wright, E. Documentation for the TIMES Model Part III: The Operation of the TIMES Code; ETSAP: Paris, France, 2016. [Google Scholar]
- Bhattacharyya, S.C.; Timilsina, G.R. A review of energy system models. Int. J. Energy Sect. Manag. 2010, 4, 494–518. [Google Scholar] [CrossRef]
- Gargiulo, M.; Gallachóir, B.Ó. Long-term energy models: Principles, characteristics, focus, and limitations. Wiley Interdiscip. Rev. Energy Environ. 2013, 2, 158–177. [Google Scholar] [CrossRef]
- Simoes, S.G.; Dias, L.; Gouveia, J.P.; Seixas, J.; De Miglio, R.; Chiodi, A.; Gargiulo, M.; Long, G.; Giannakidis, G. InSmart—A methodology for combining modelling with stakeholder input towards EU cities decarbonisation. J. Clean. Prod. 2019, 231, 428–445. [Google Scholar] [CrossRef]
- Blanco, H.; Nijs, W.; Ruf, J.; Faaij, A. Potential for hydrogen and Power-to-Liquid in a low-carbon EU energy system using cost optimization. Appl. Energy 2018, 232, 617–639. [Google Scholar] [CrossRef]
- Føyn, T.H.Y.; Karlsson, K.; Balyk, O.; Grohnheit, P.E. A global renewable energy system: A modelling exercise in ETSAP/TIAM. Appl. Energy 2011, 88, 526–534. [Google Scholar] [CrossRef] [Green Version]
- IEA-ETSAP. Etsap-TIMES/TIMES_Model: Current and Previous TIMES Versions; ETSAP: Paris, France, 2020. [Google Scholar] [CrossRef]
- State Statistics Service of Ukraine. Methodological Recommendations for Drawing up the Energy Balance; SSSU: Kyiv, Ukraine, 2011. [Google Scholar]
| Publisher’s Note: MDPI stays neutral with regard to jurisdictional claims in published maps and institutional affiliations. |
© 2021 by the authors. Licensee MDPI, Basel, Switzerland. This article is an open access article distributed under the terms and conditions of the Creative Commons Attribution (CC BY) license (https://creativecommons.org/licenses/by/4.0/).


 ,
, 