
Novel Dual Walling Cob Building: Dynamic Thermal Performance

 , , and
Abstract
:1. Introduction
2. Methodology and Experimental Investigations of Cob Material
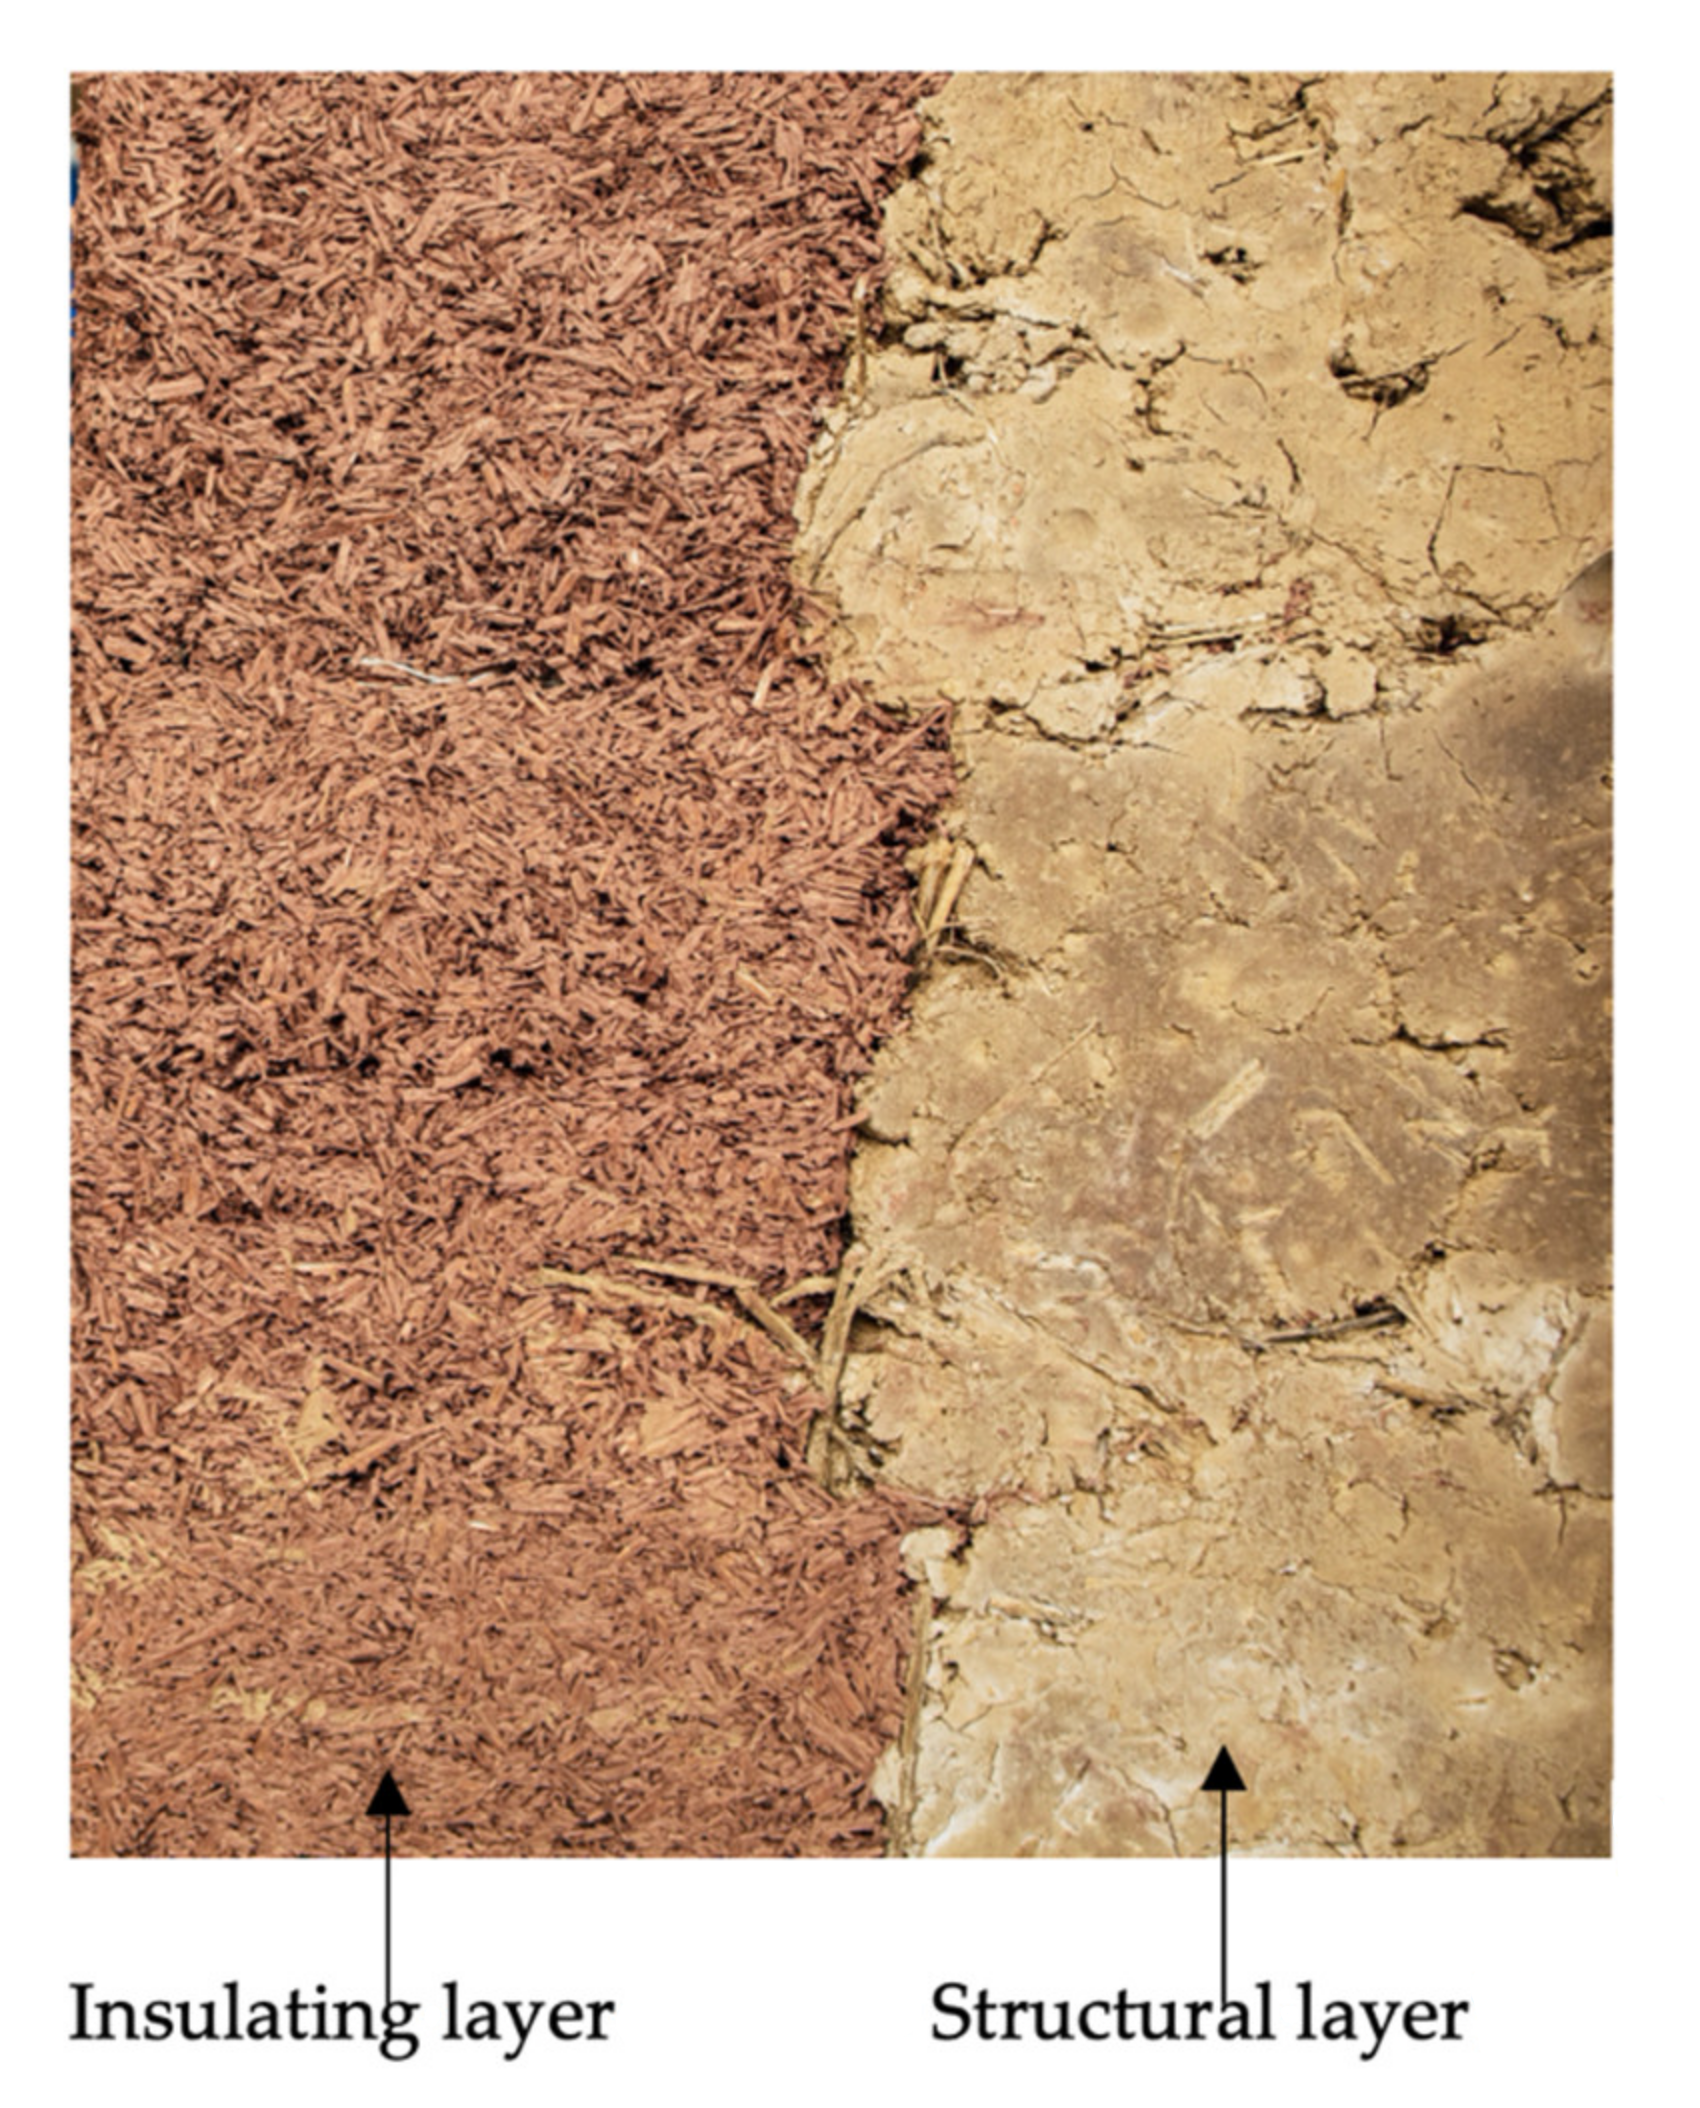
2.1. Test Section
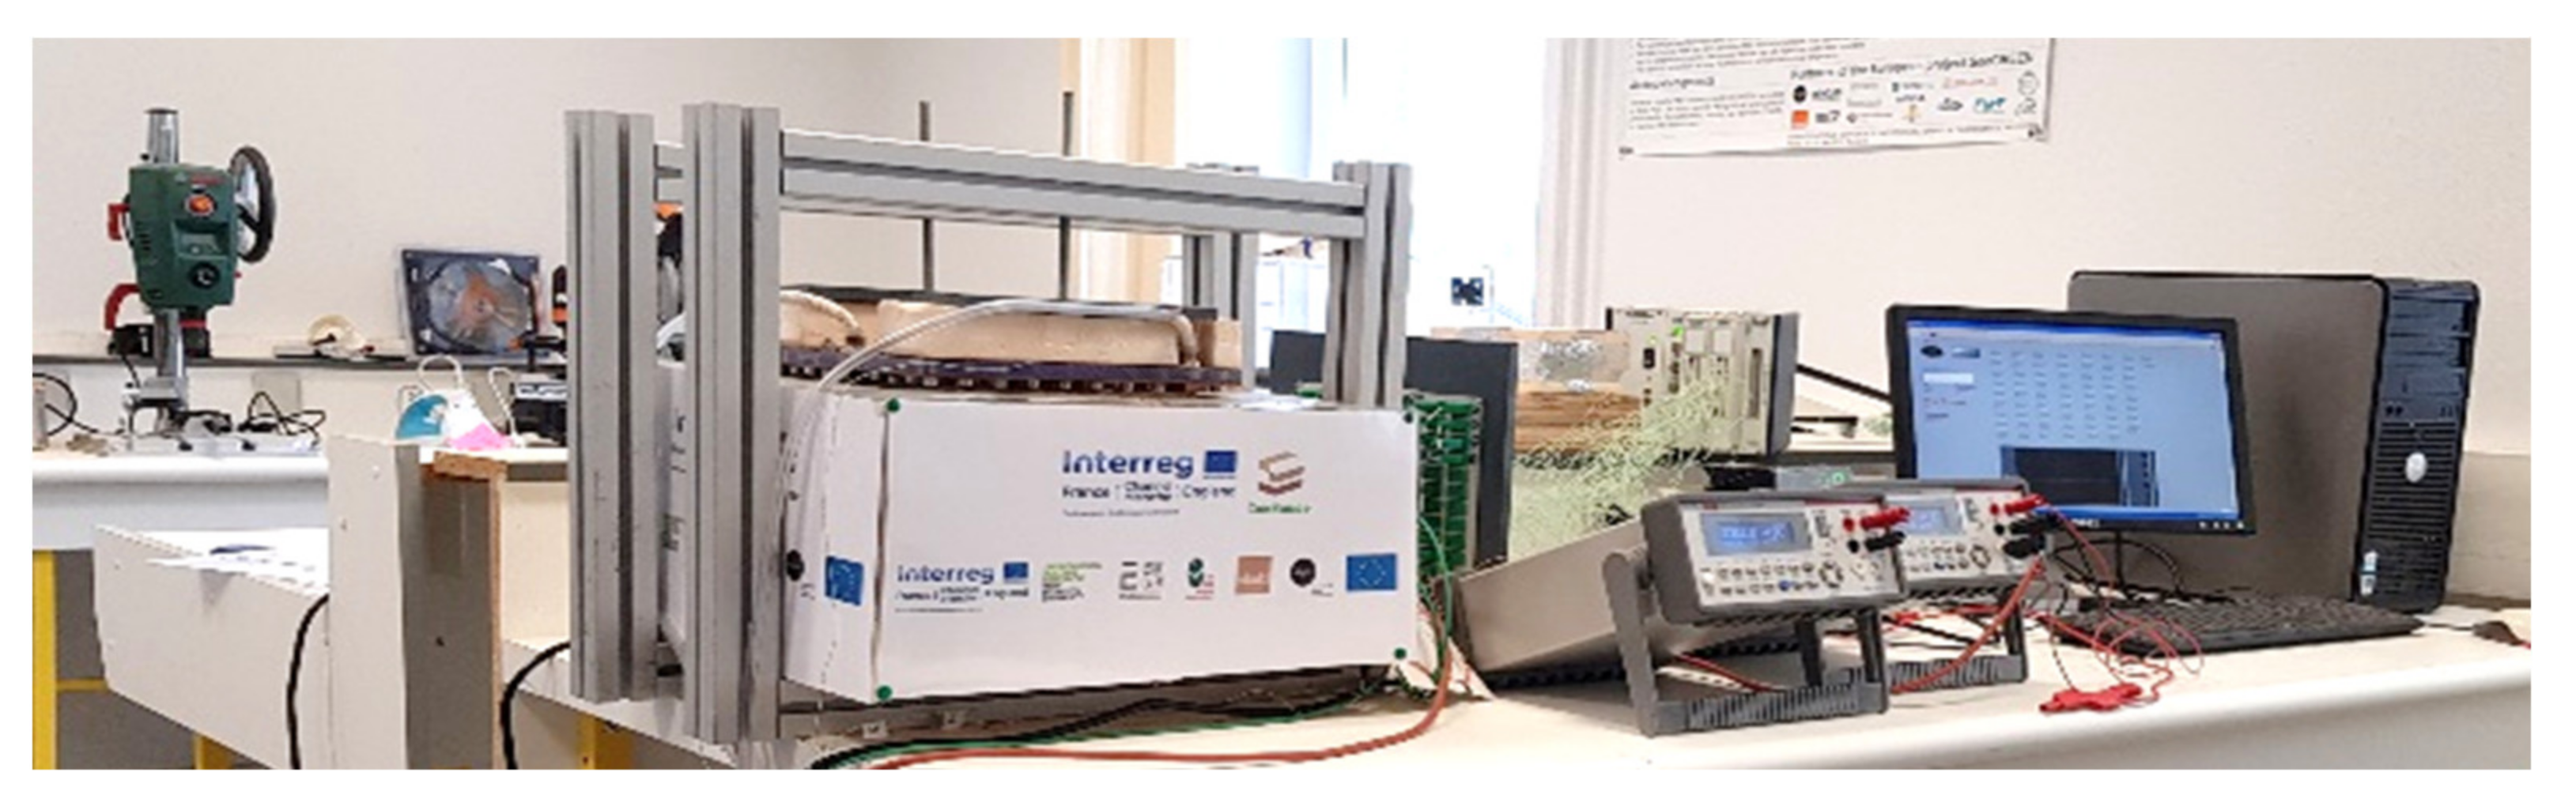
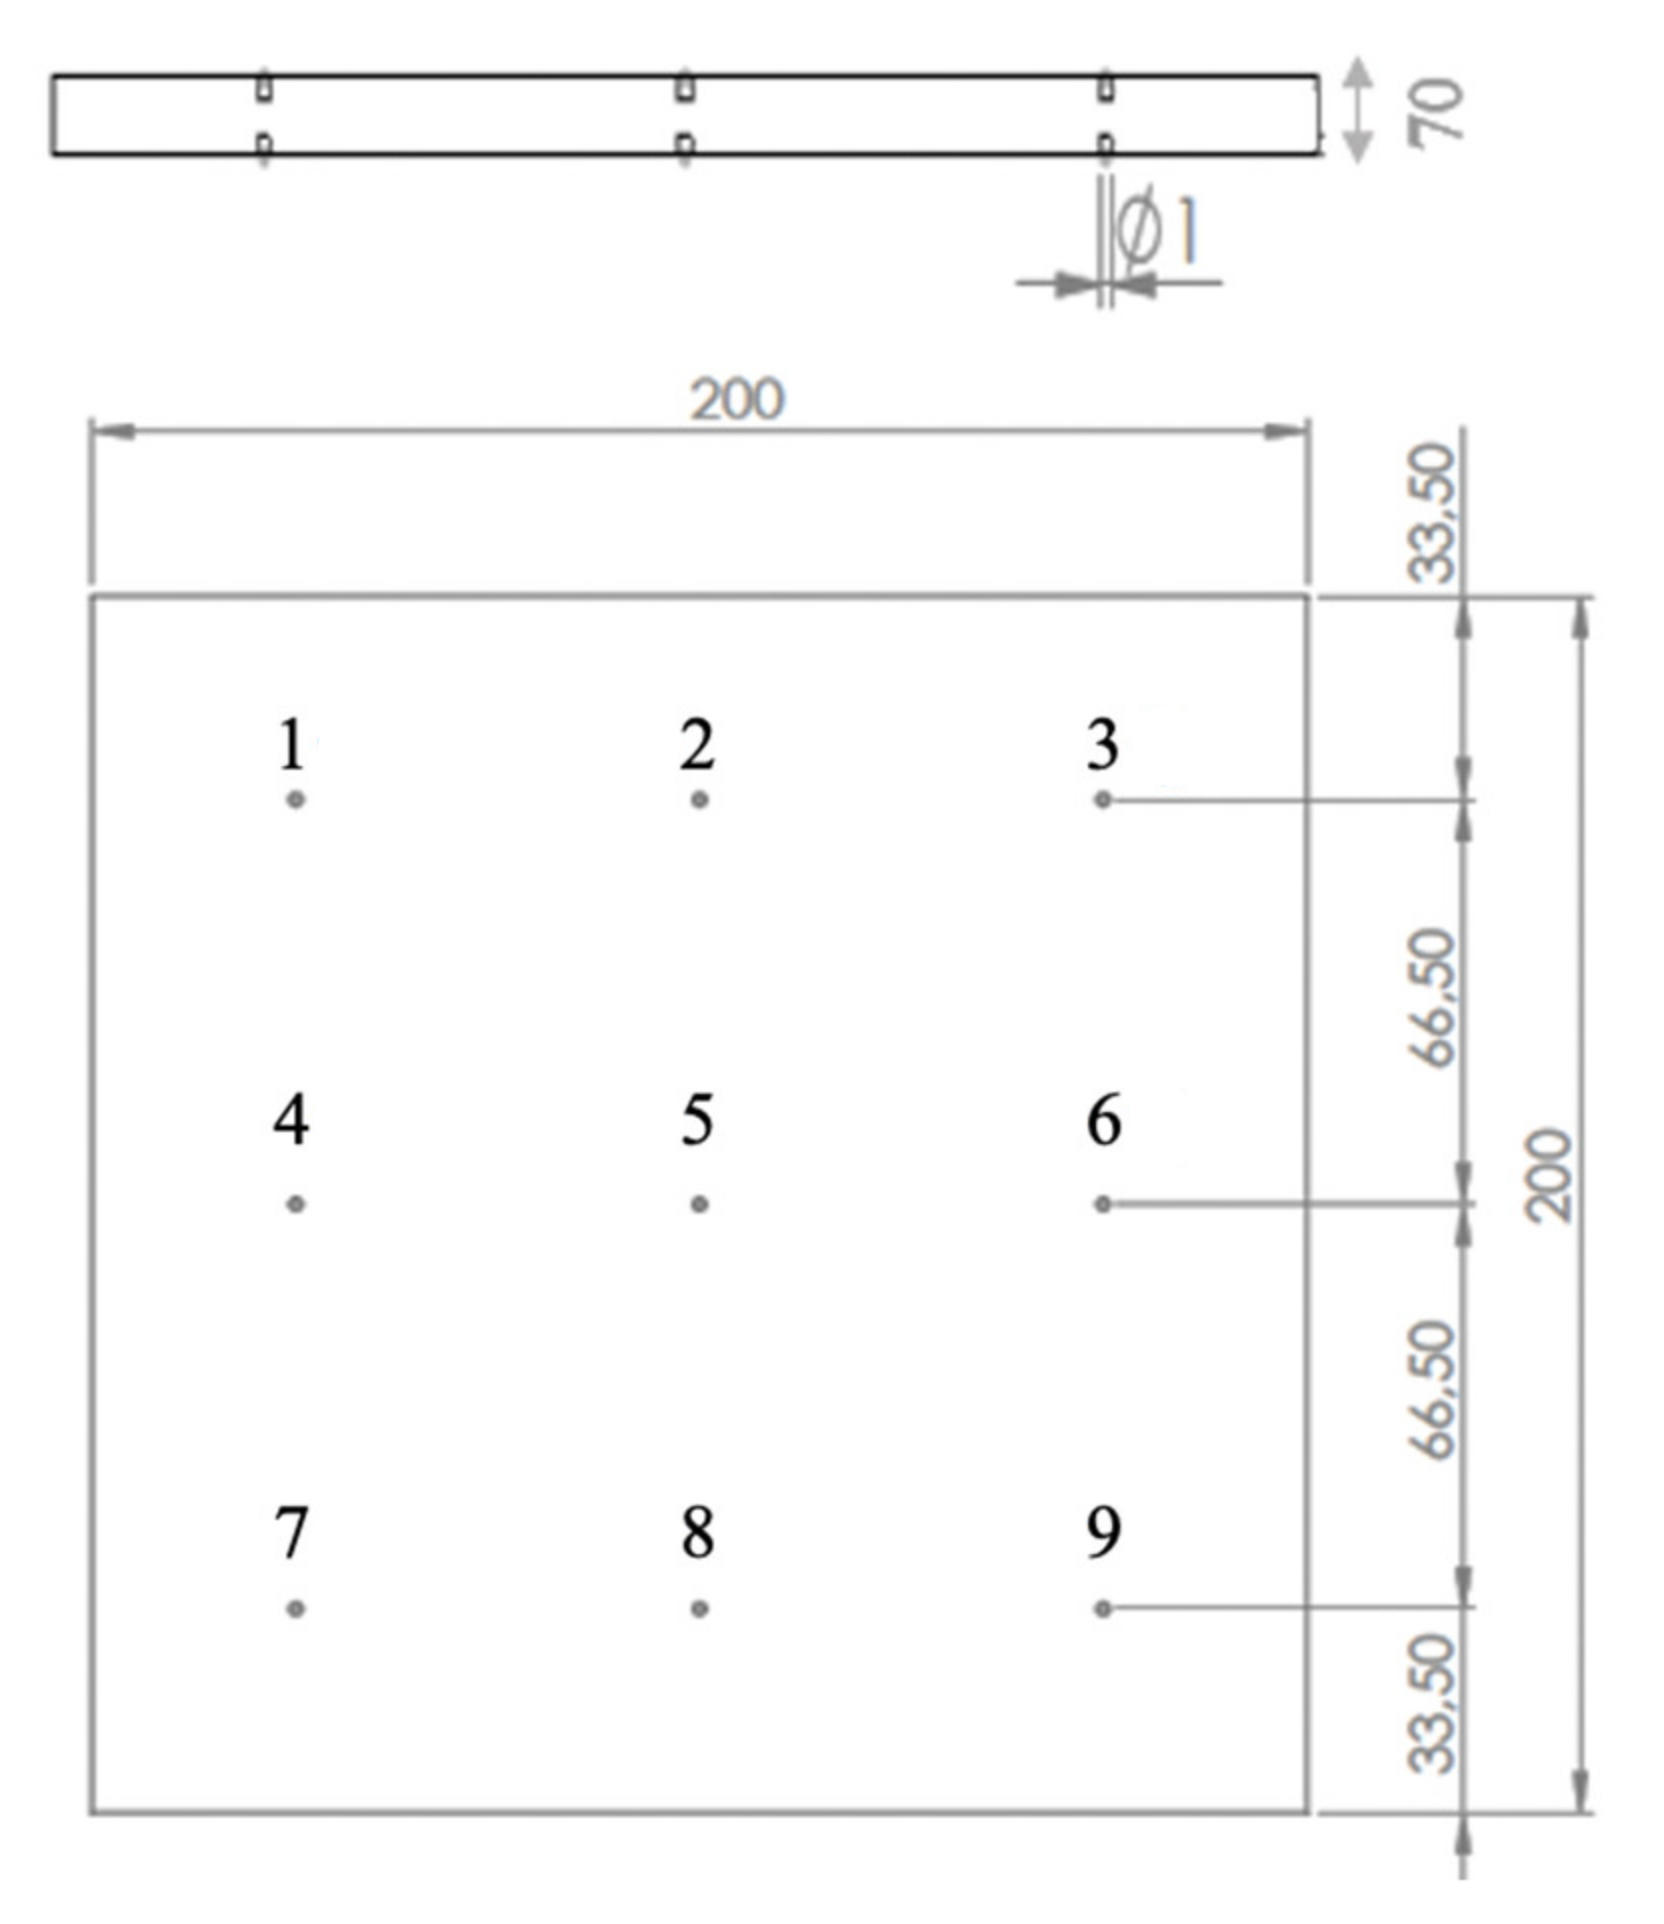
2.2. Experimental Procedure
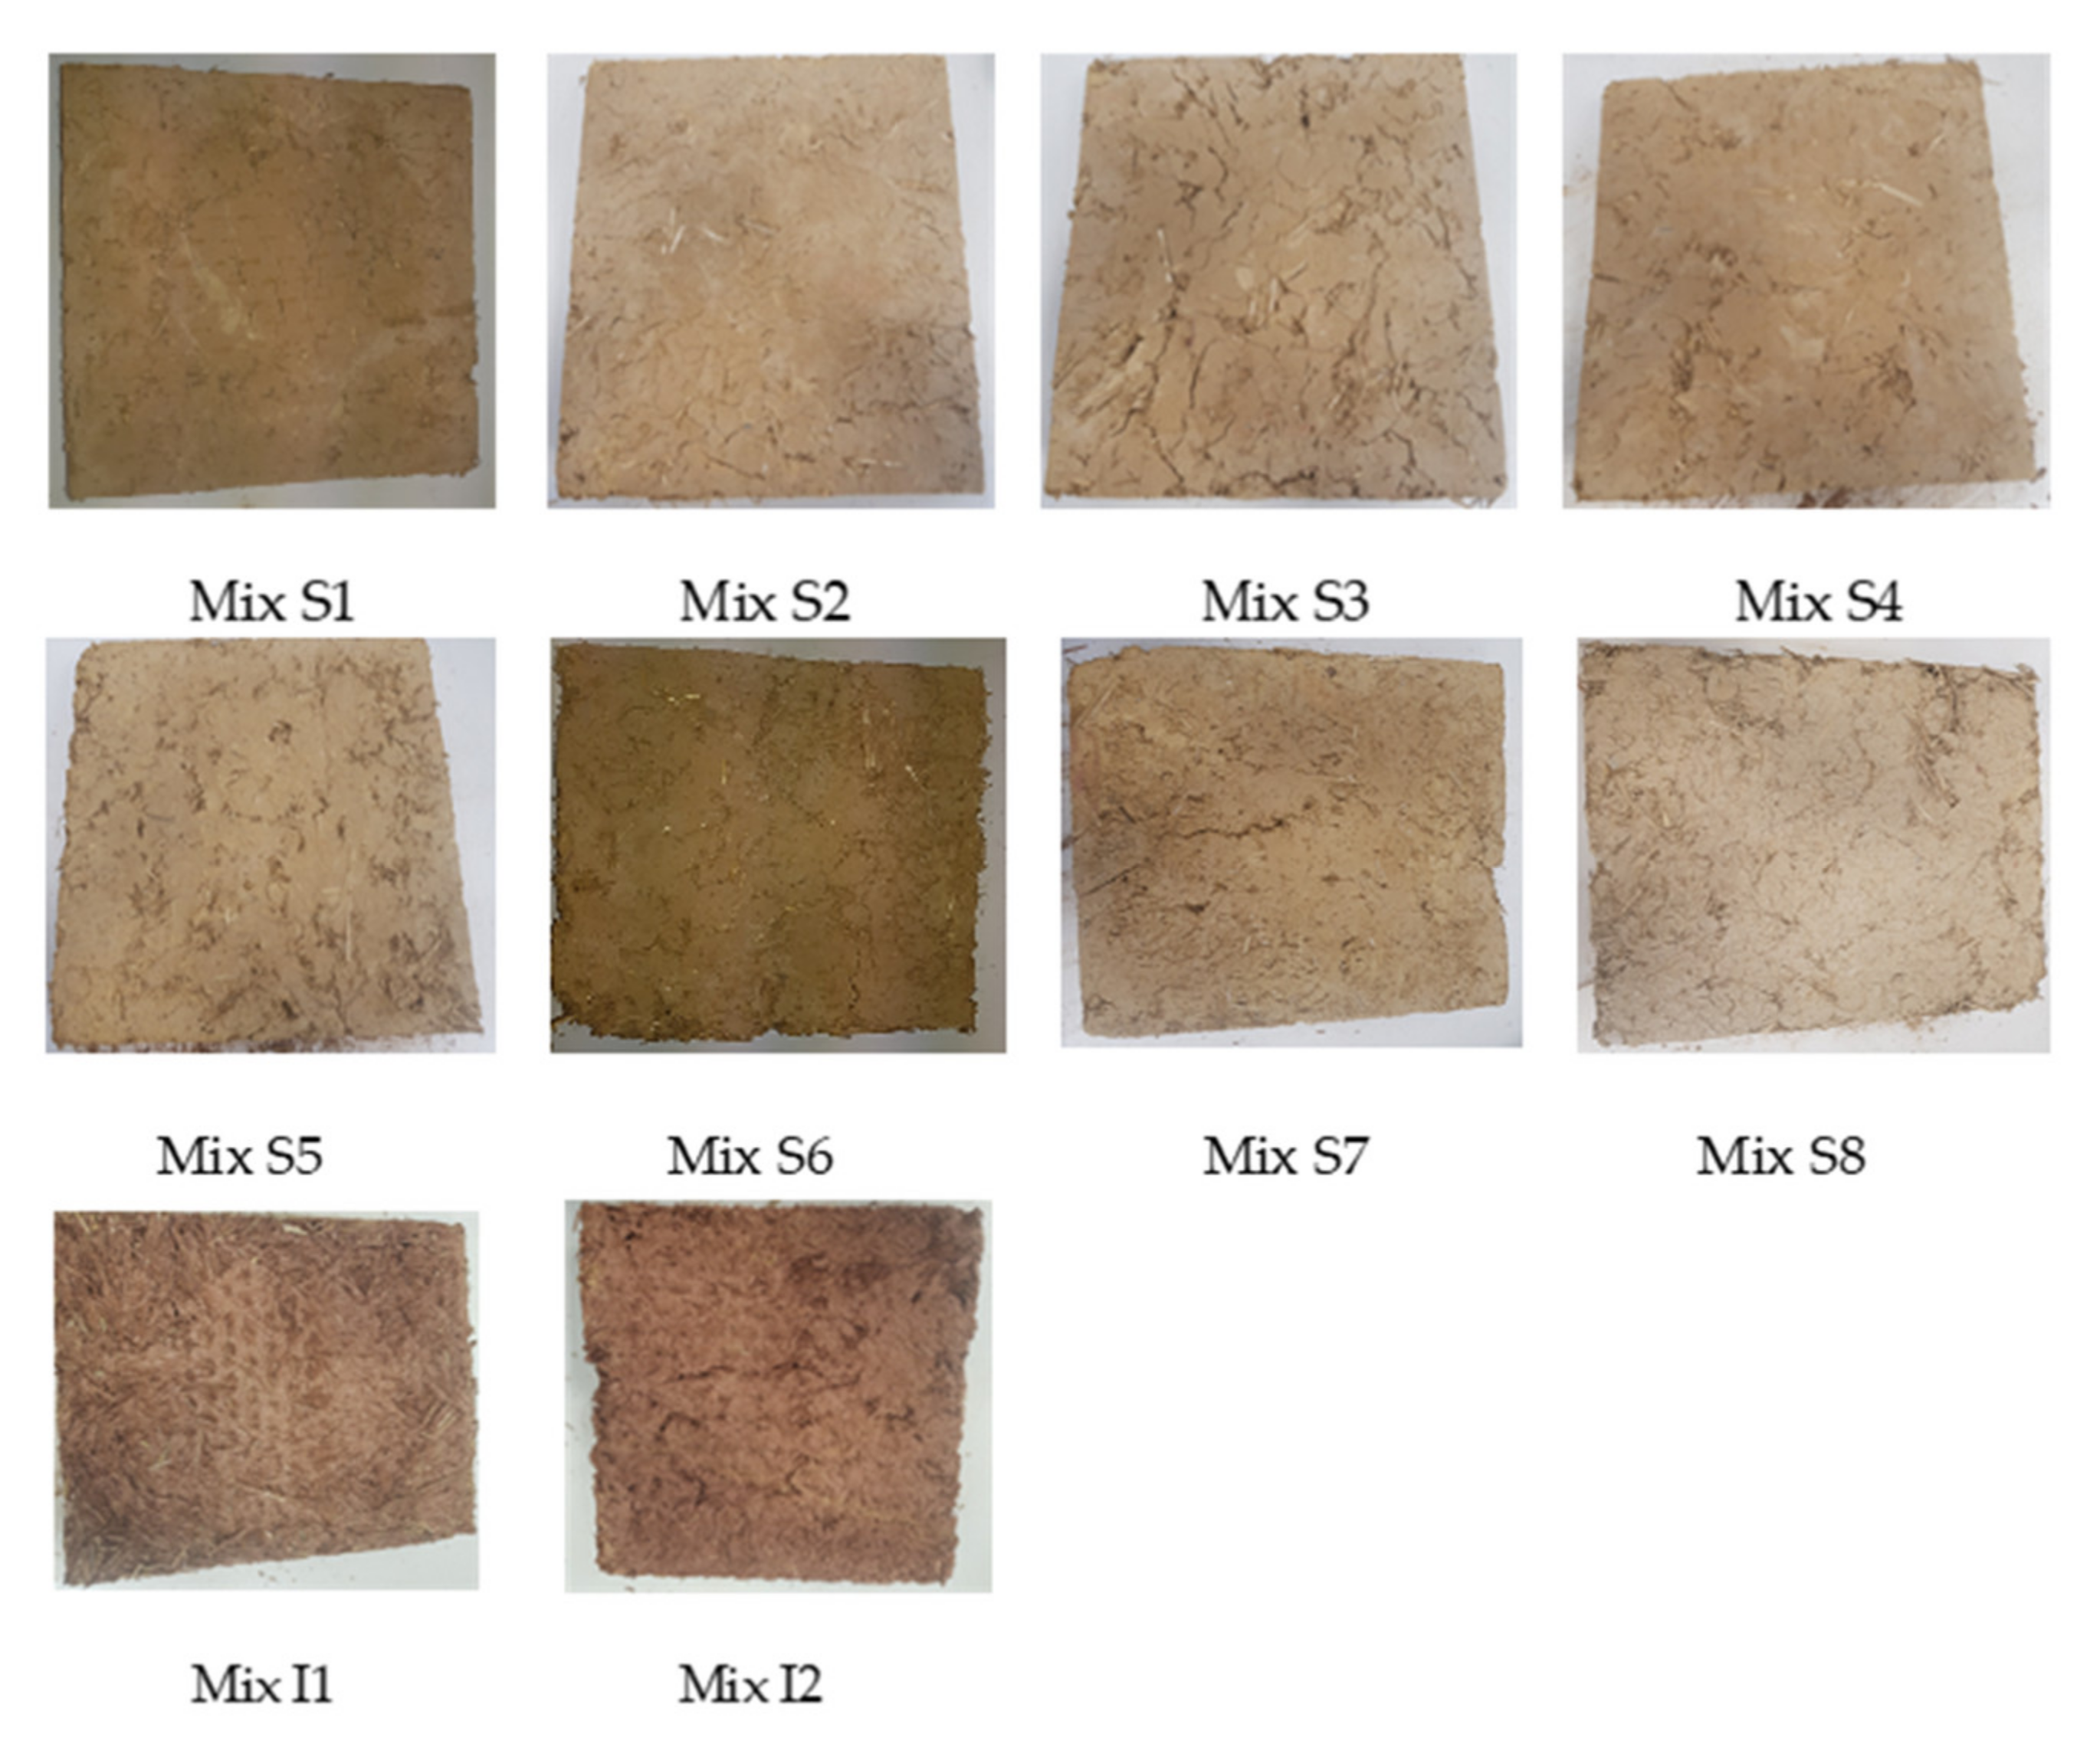
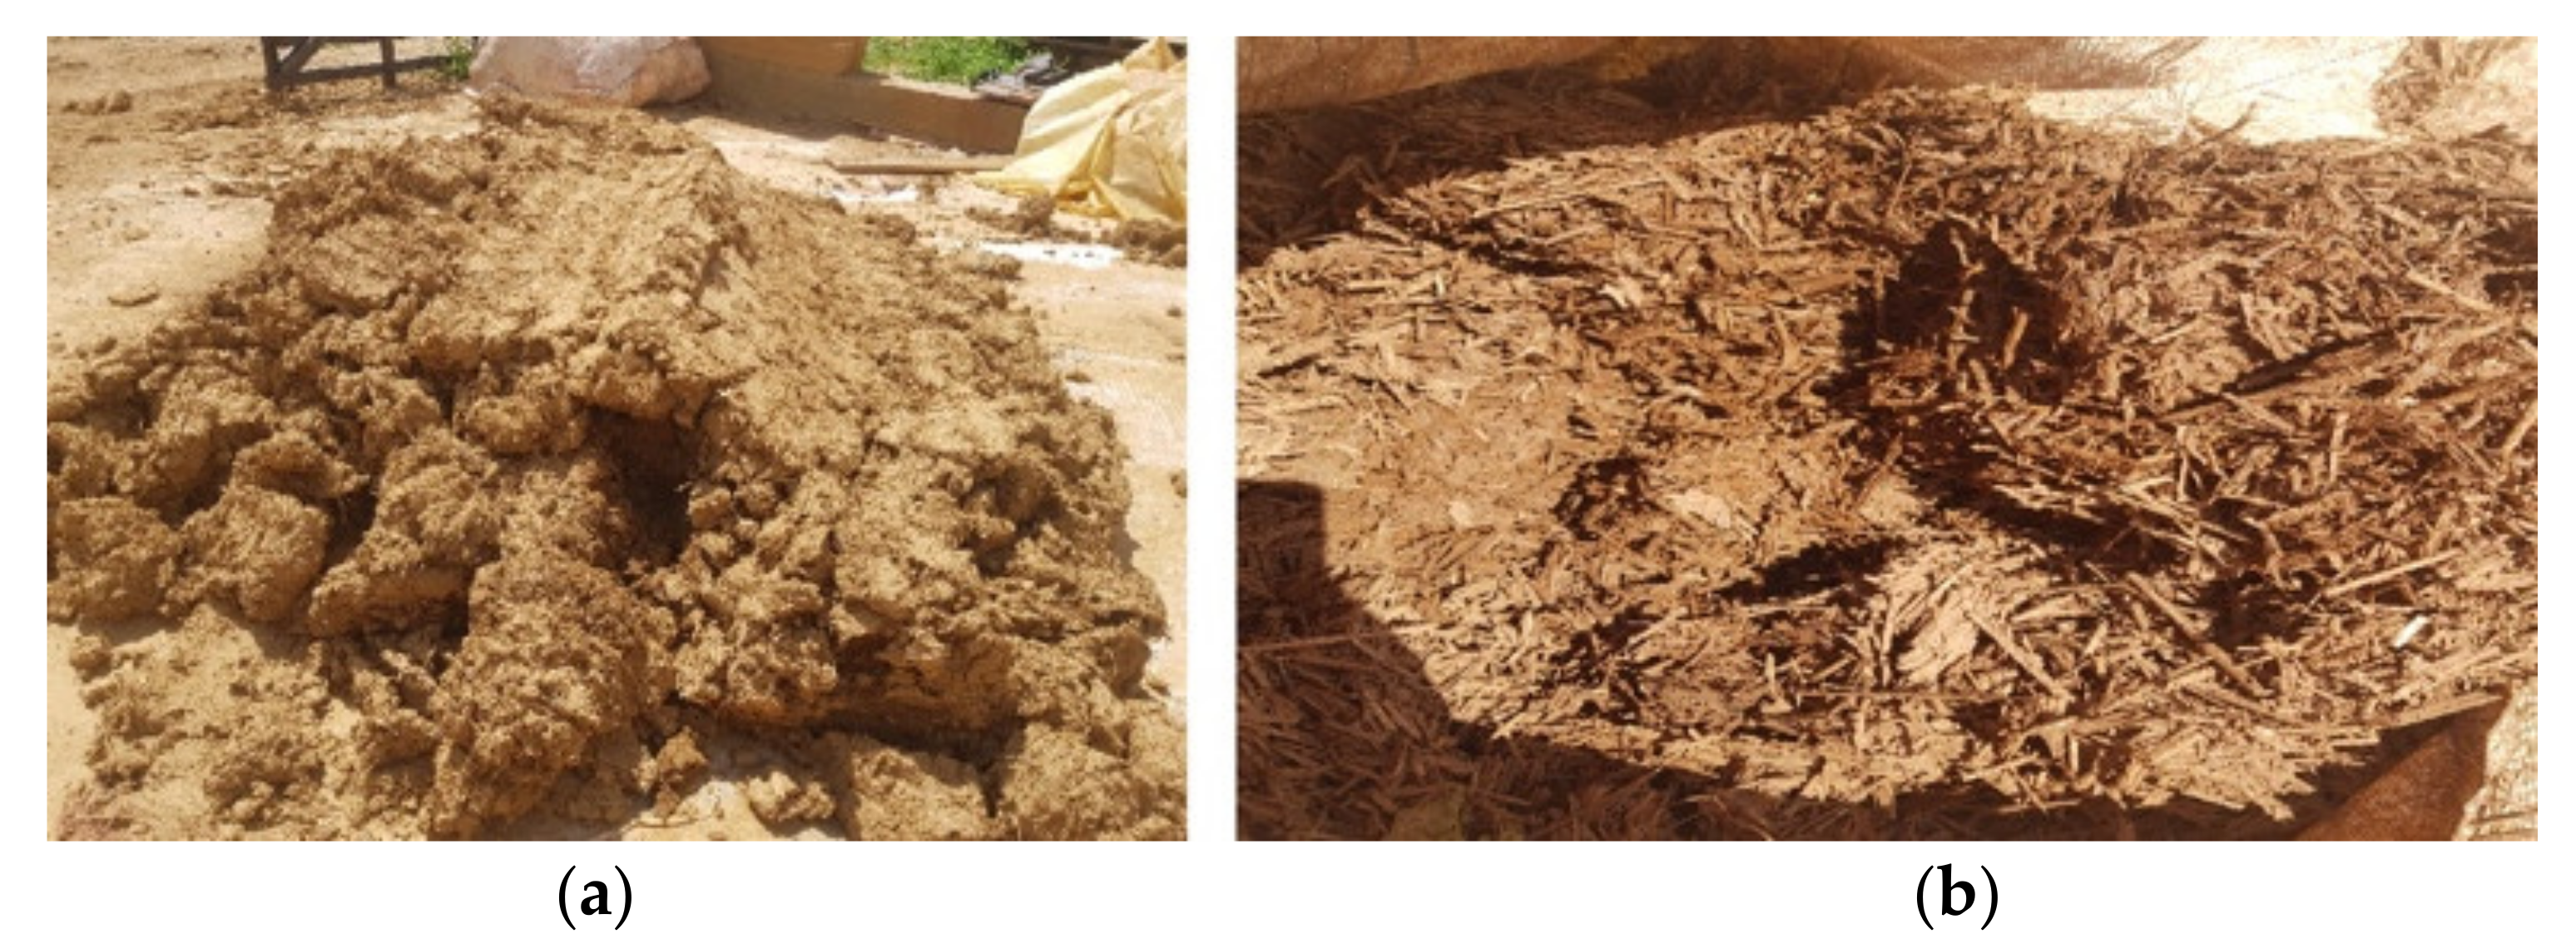
2.3. Materials and Test Method
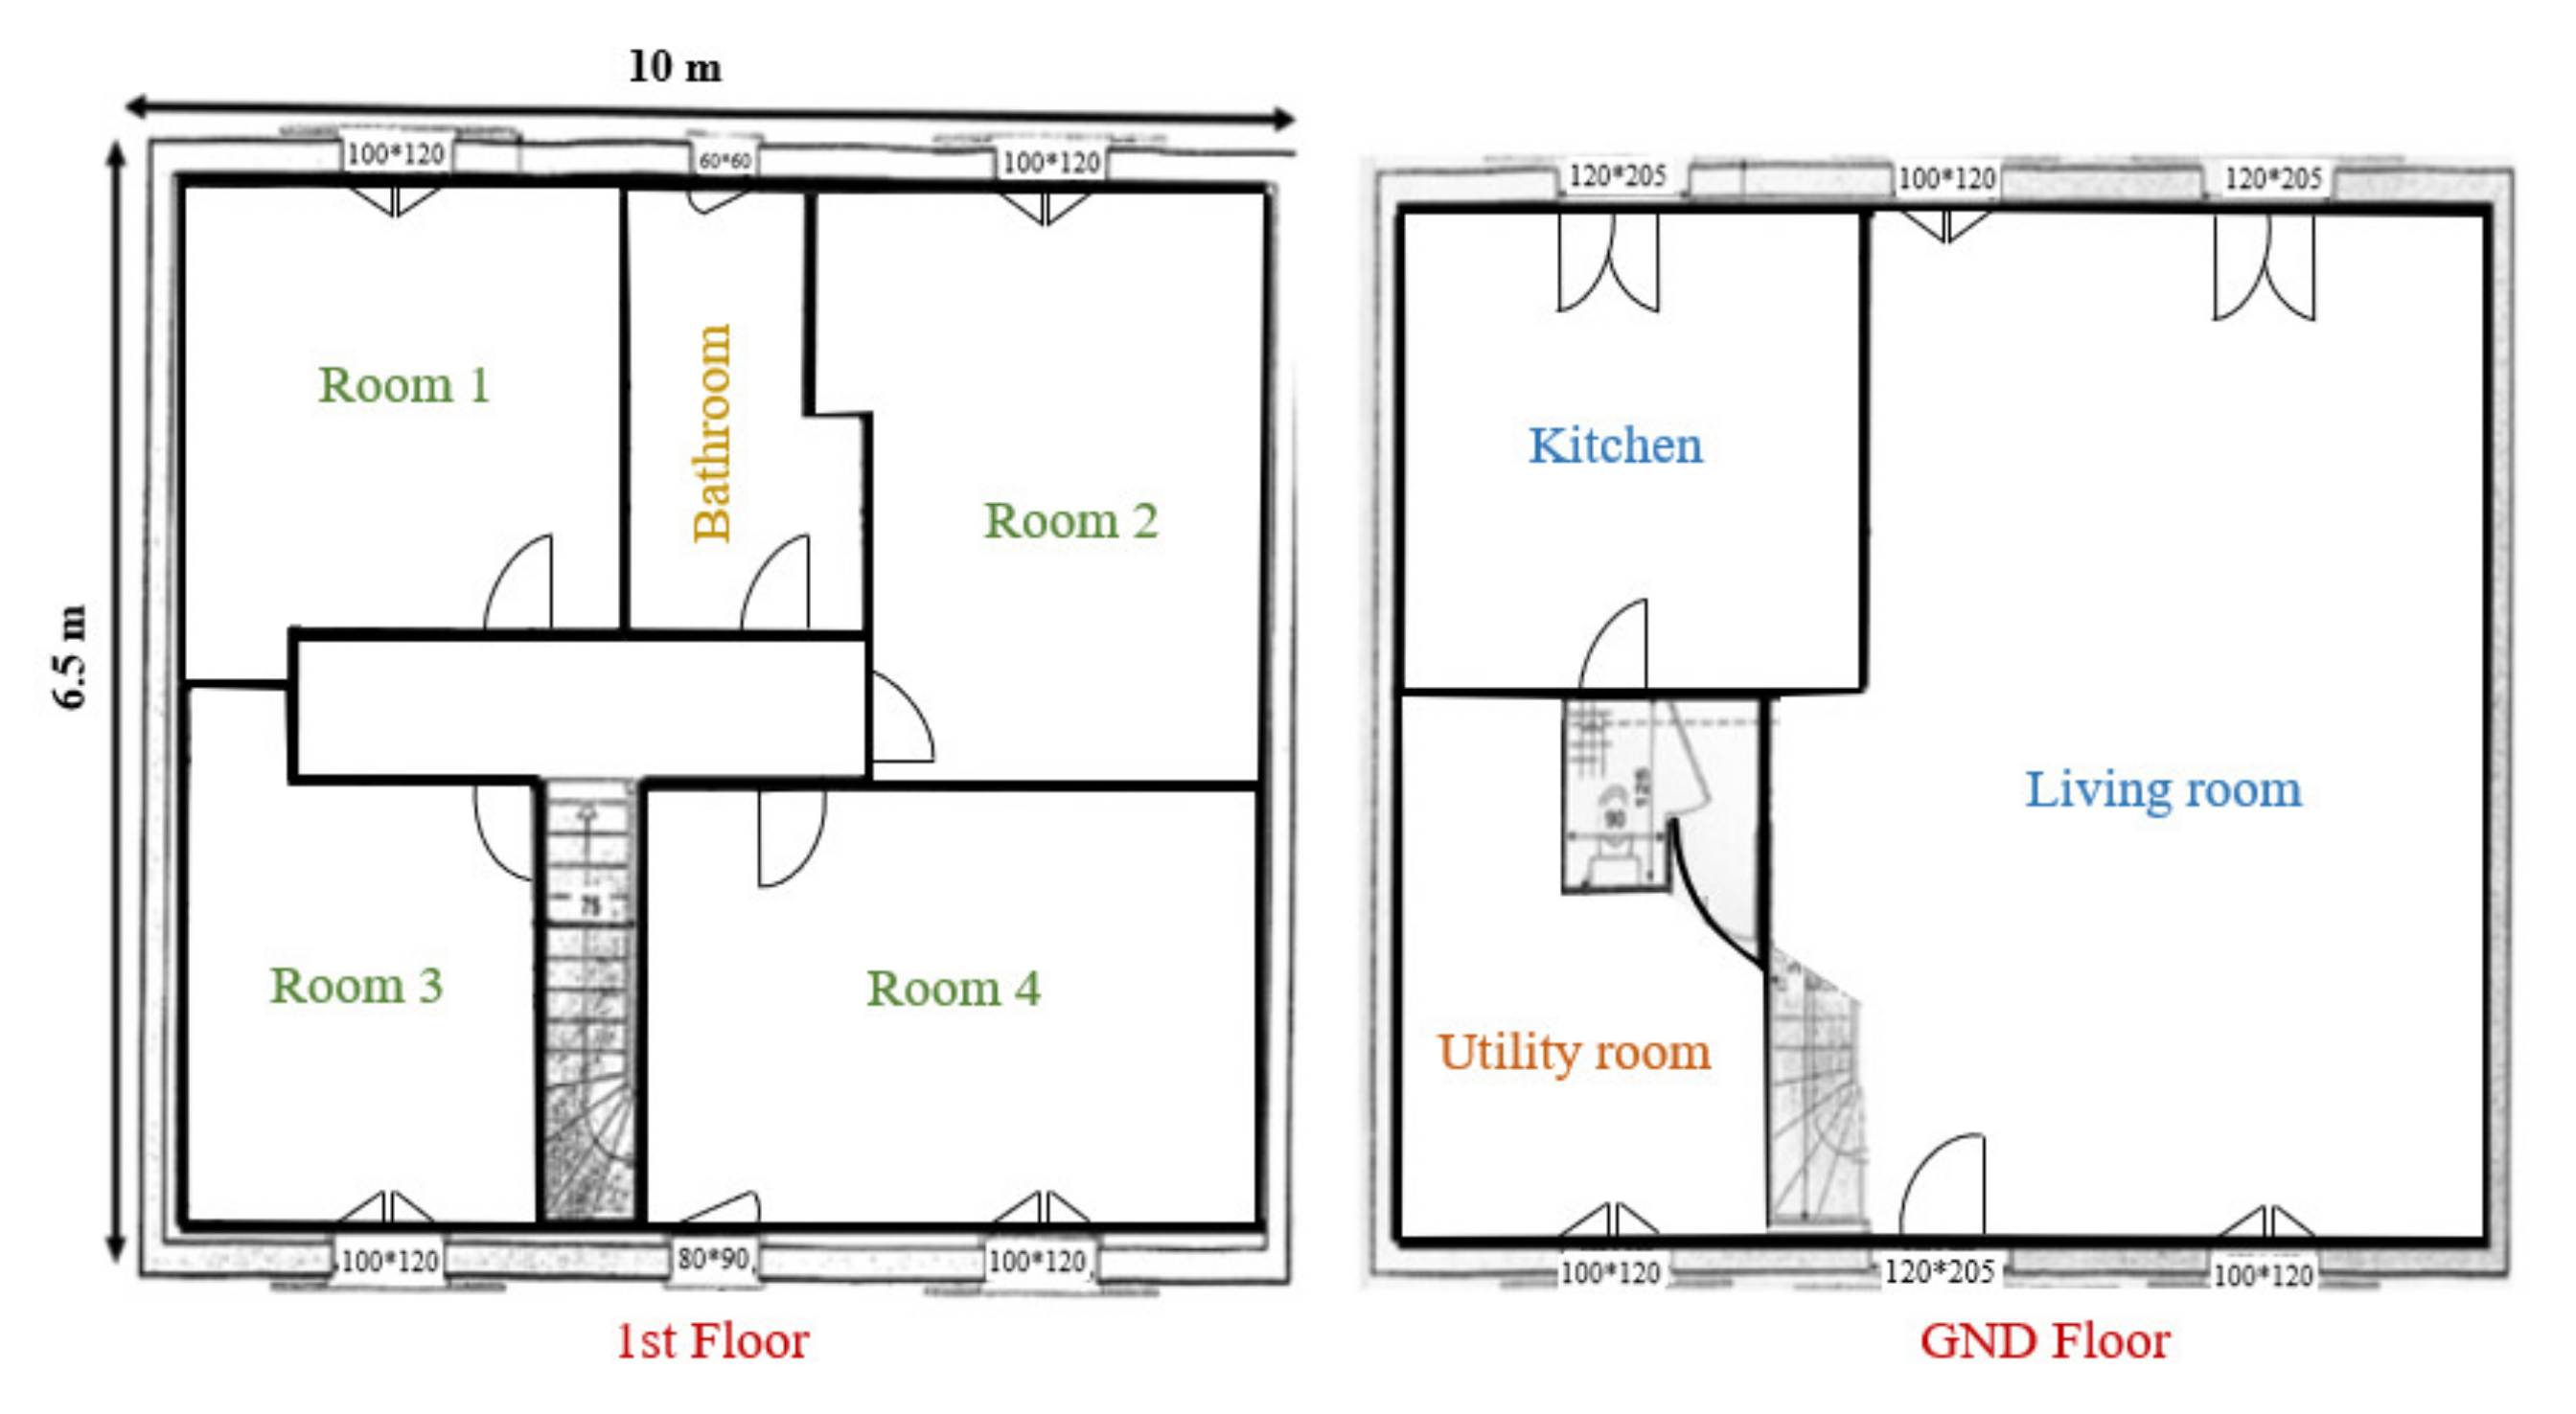
3. Cob Building Thermal Performance Modelling
4. Results and Analysis
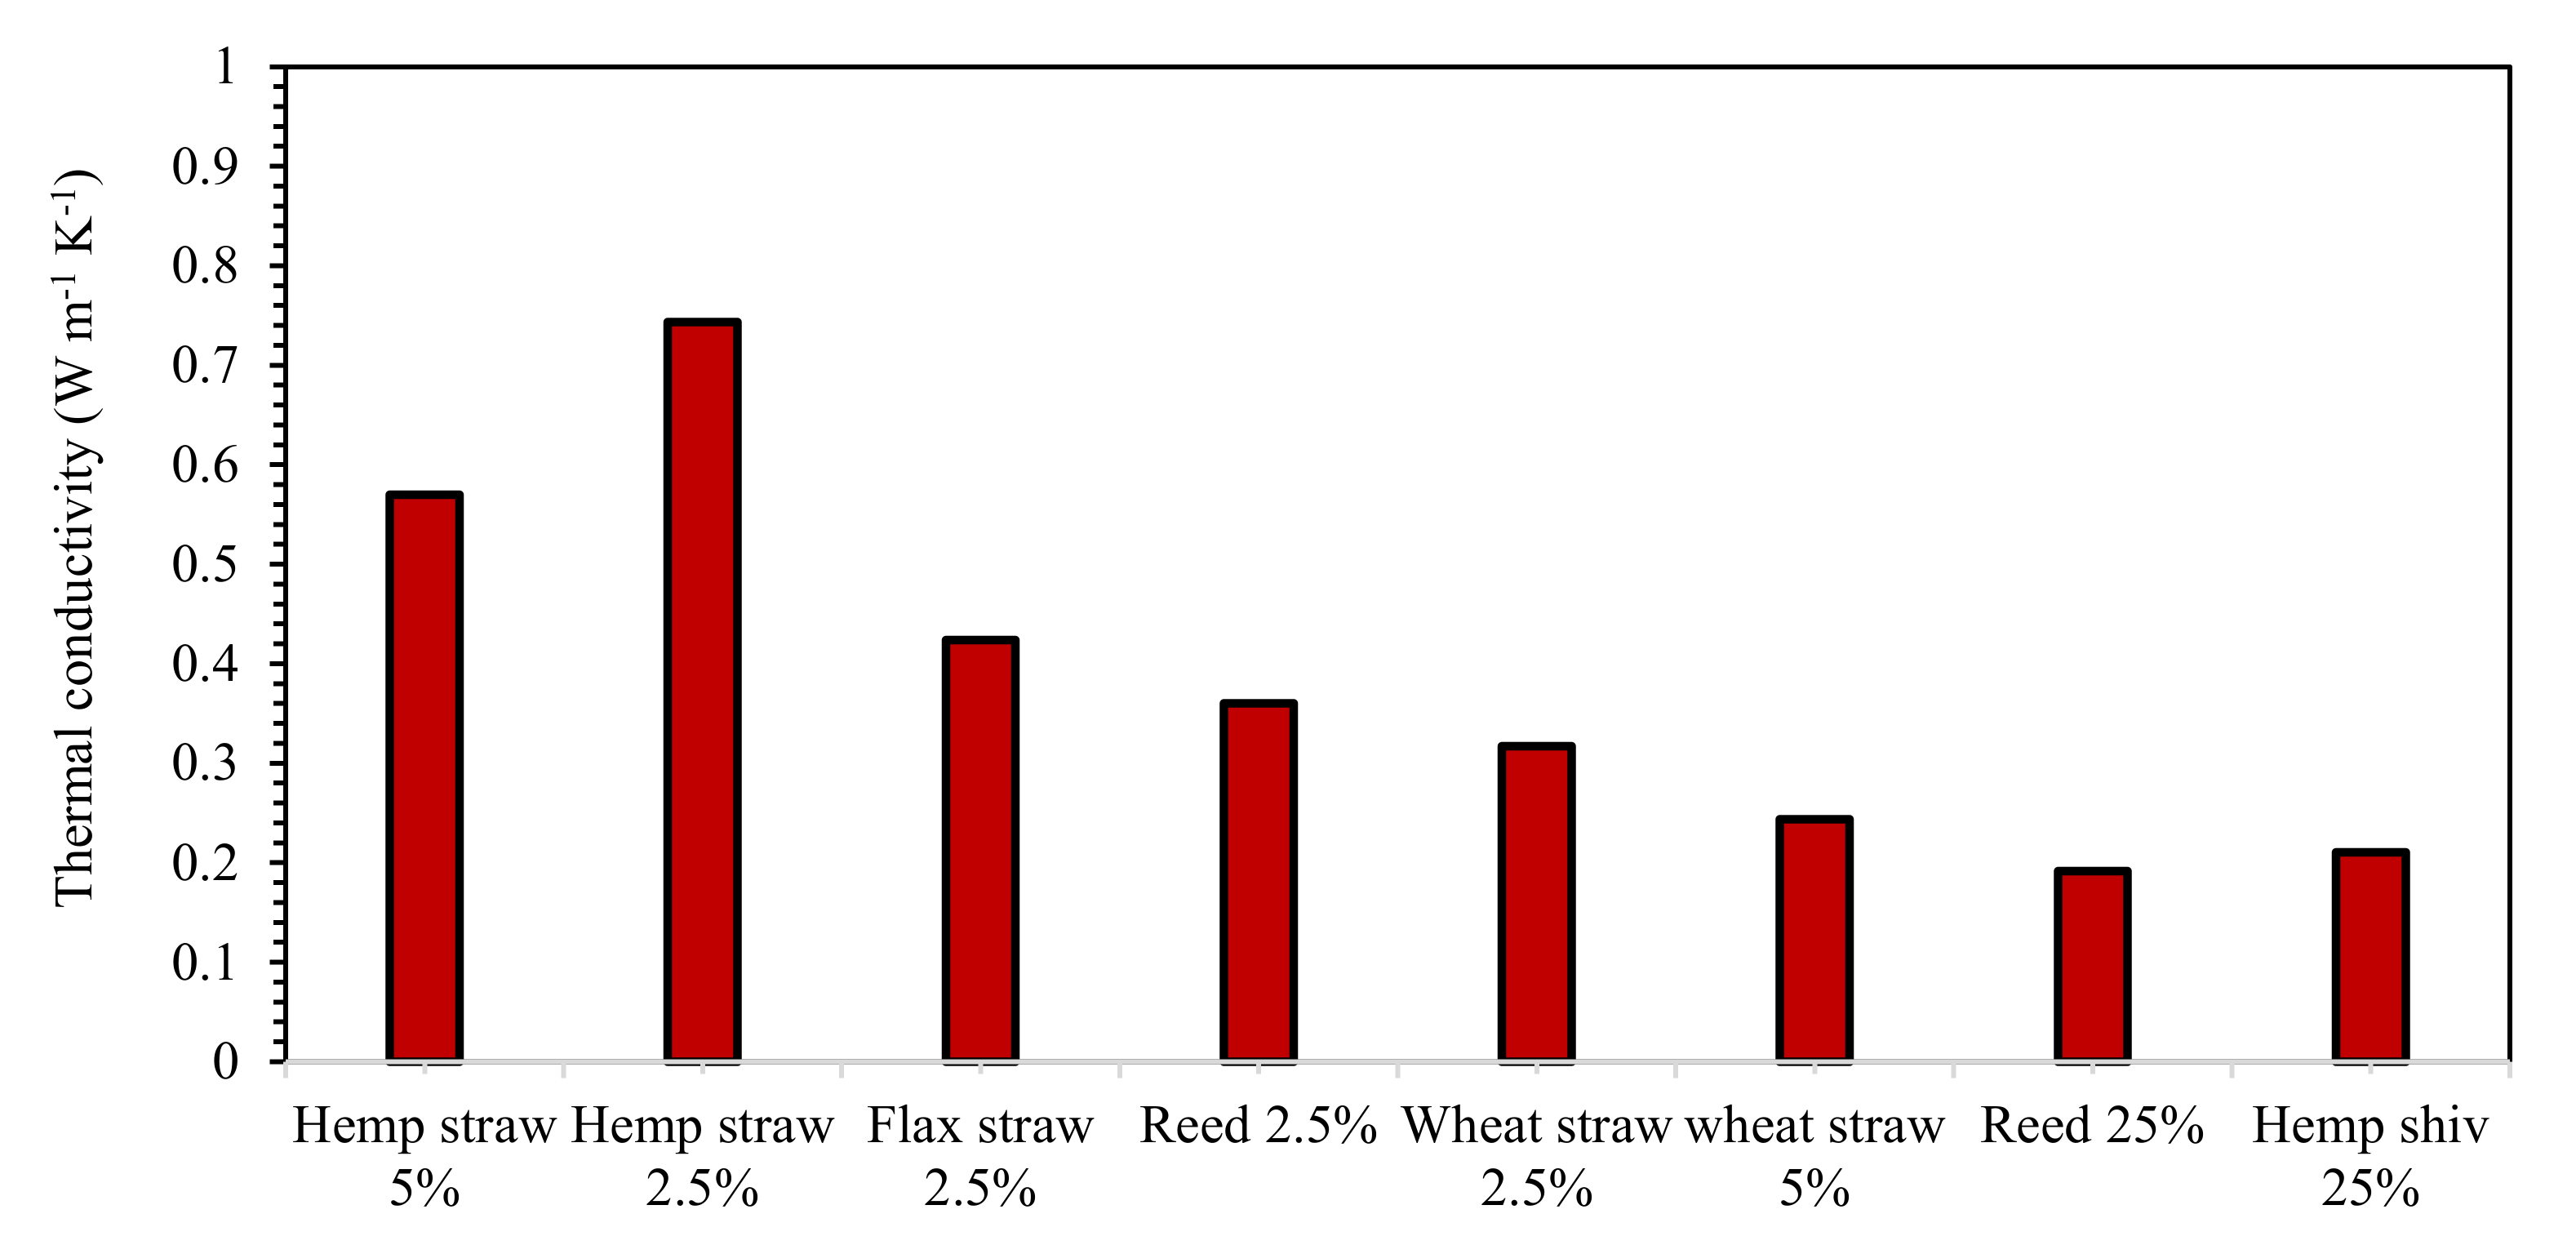
4.1. Cob Mixes Thermal Conductivity
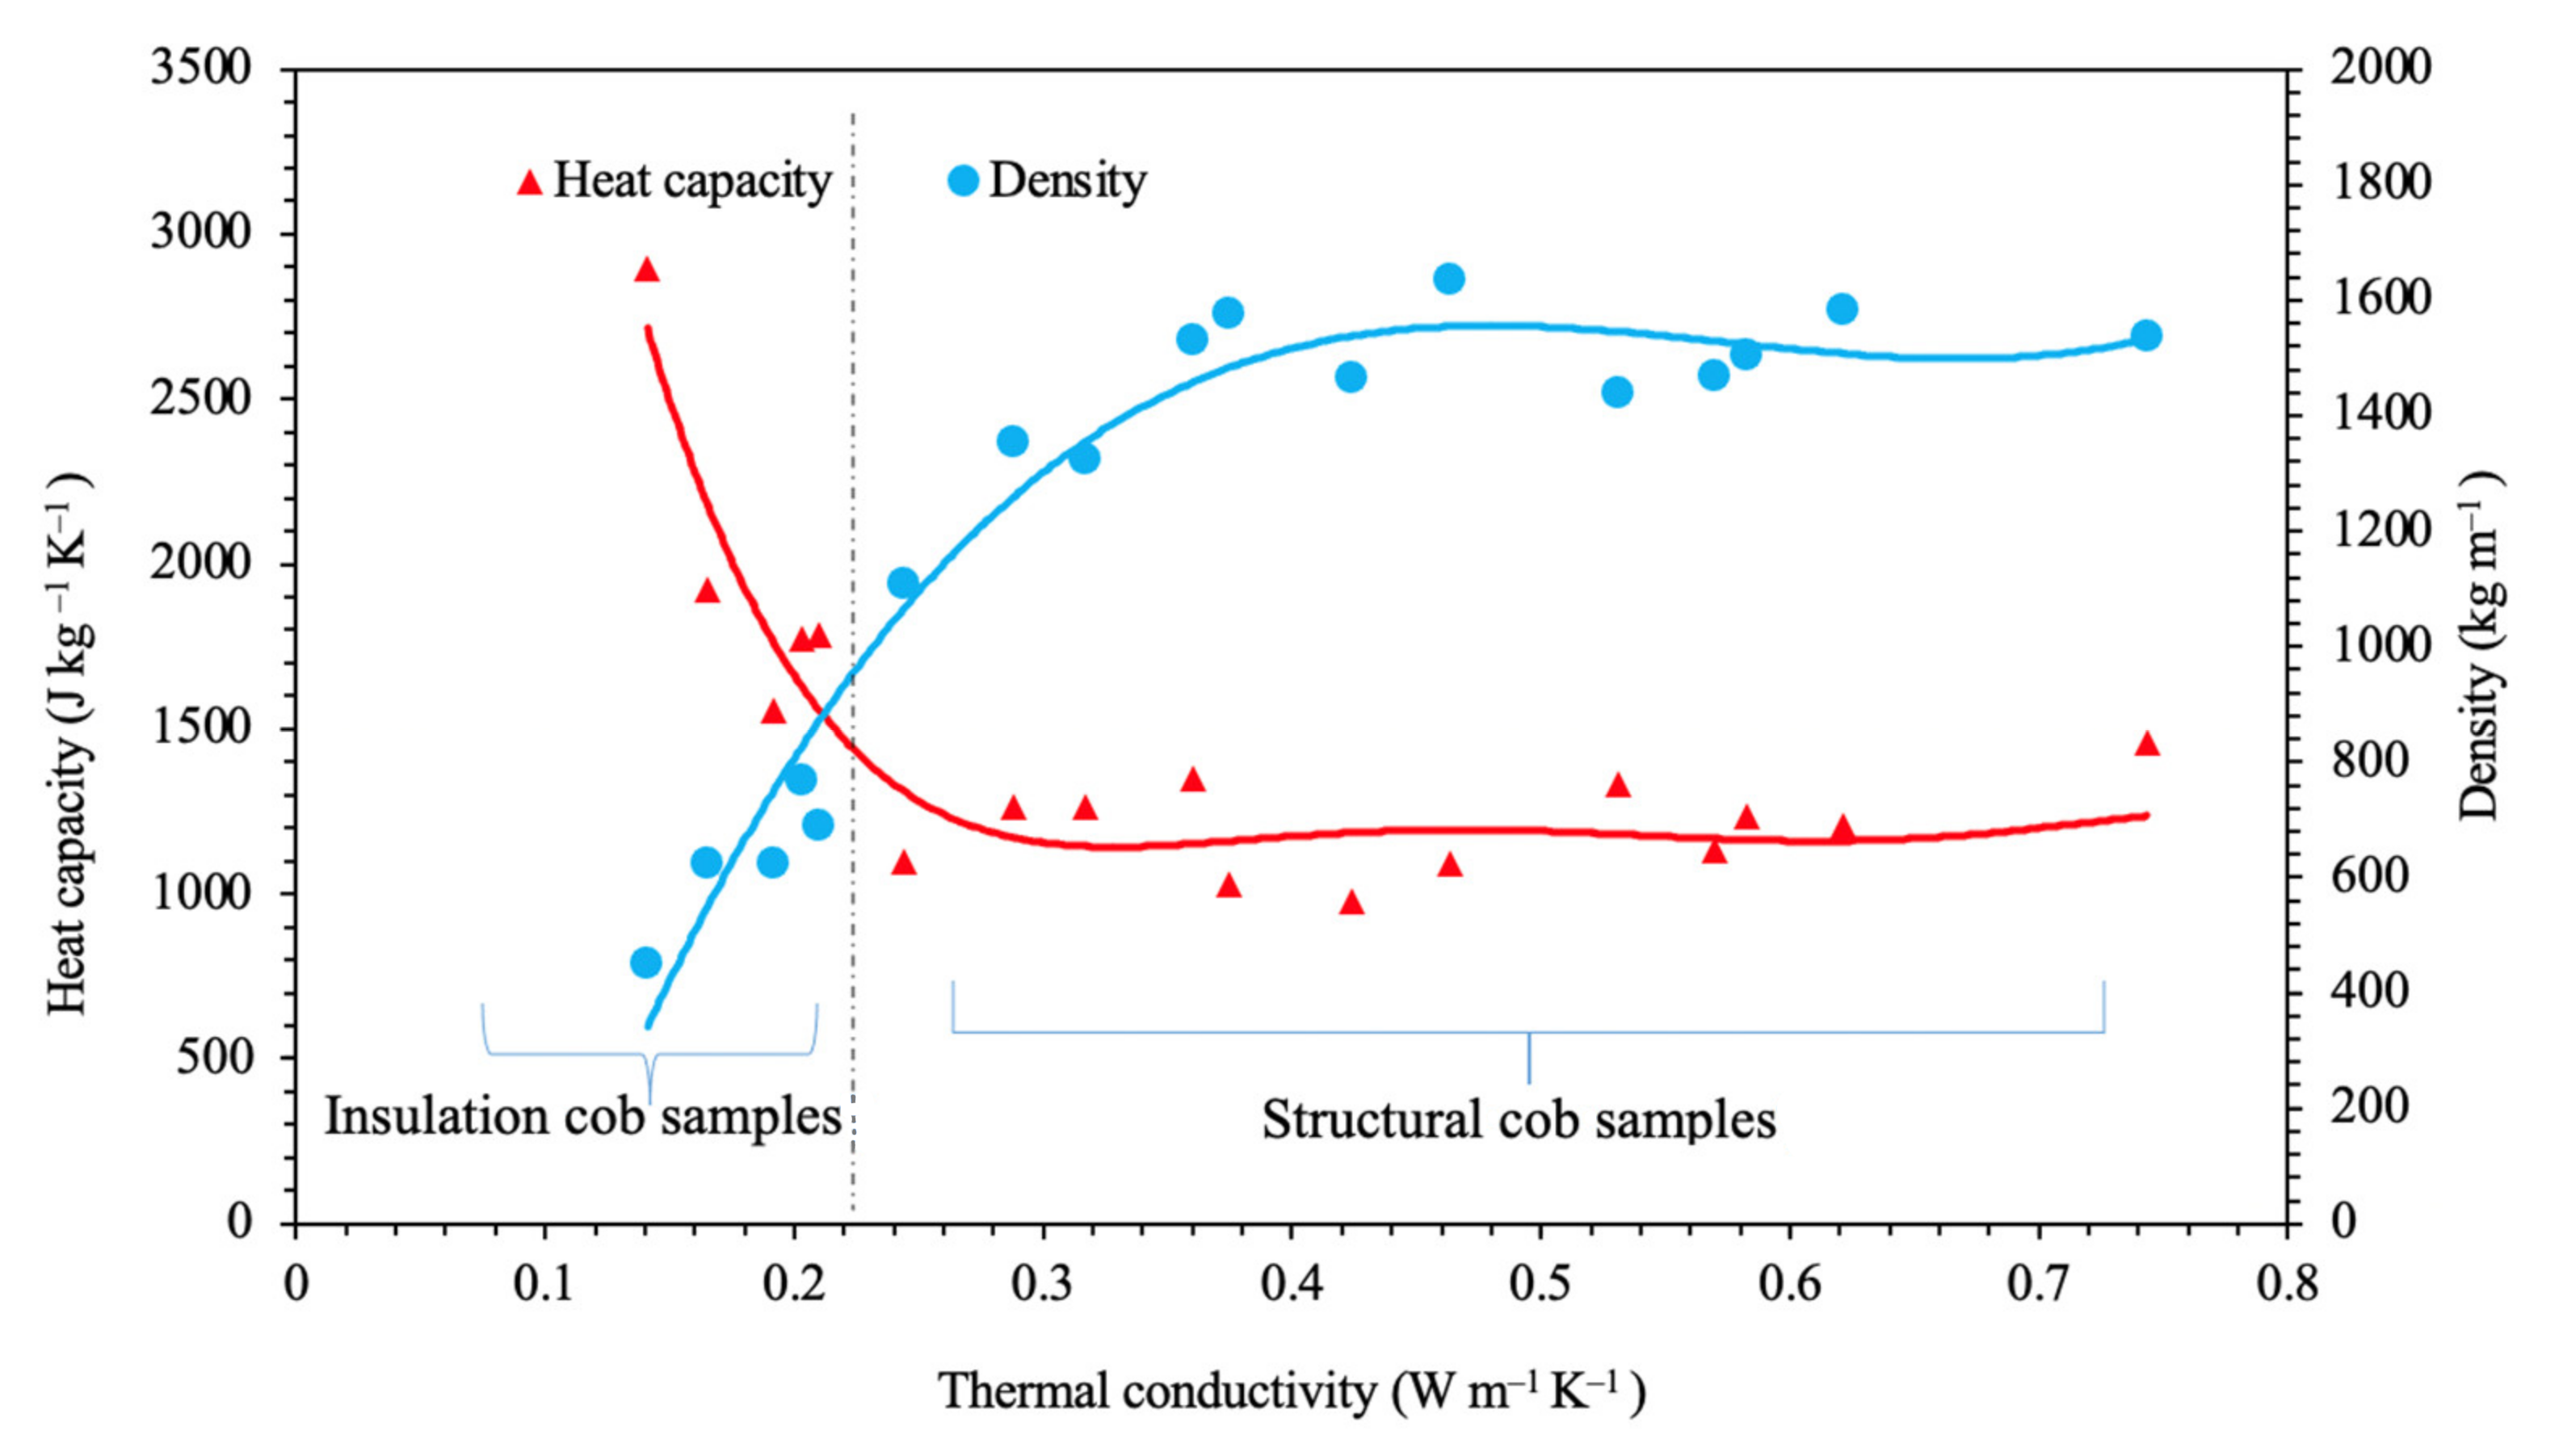
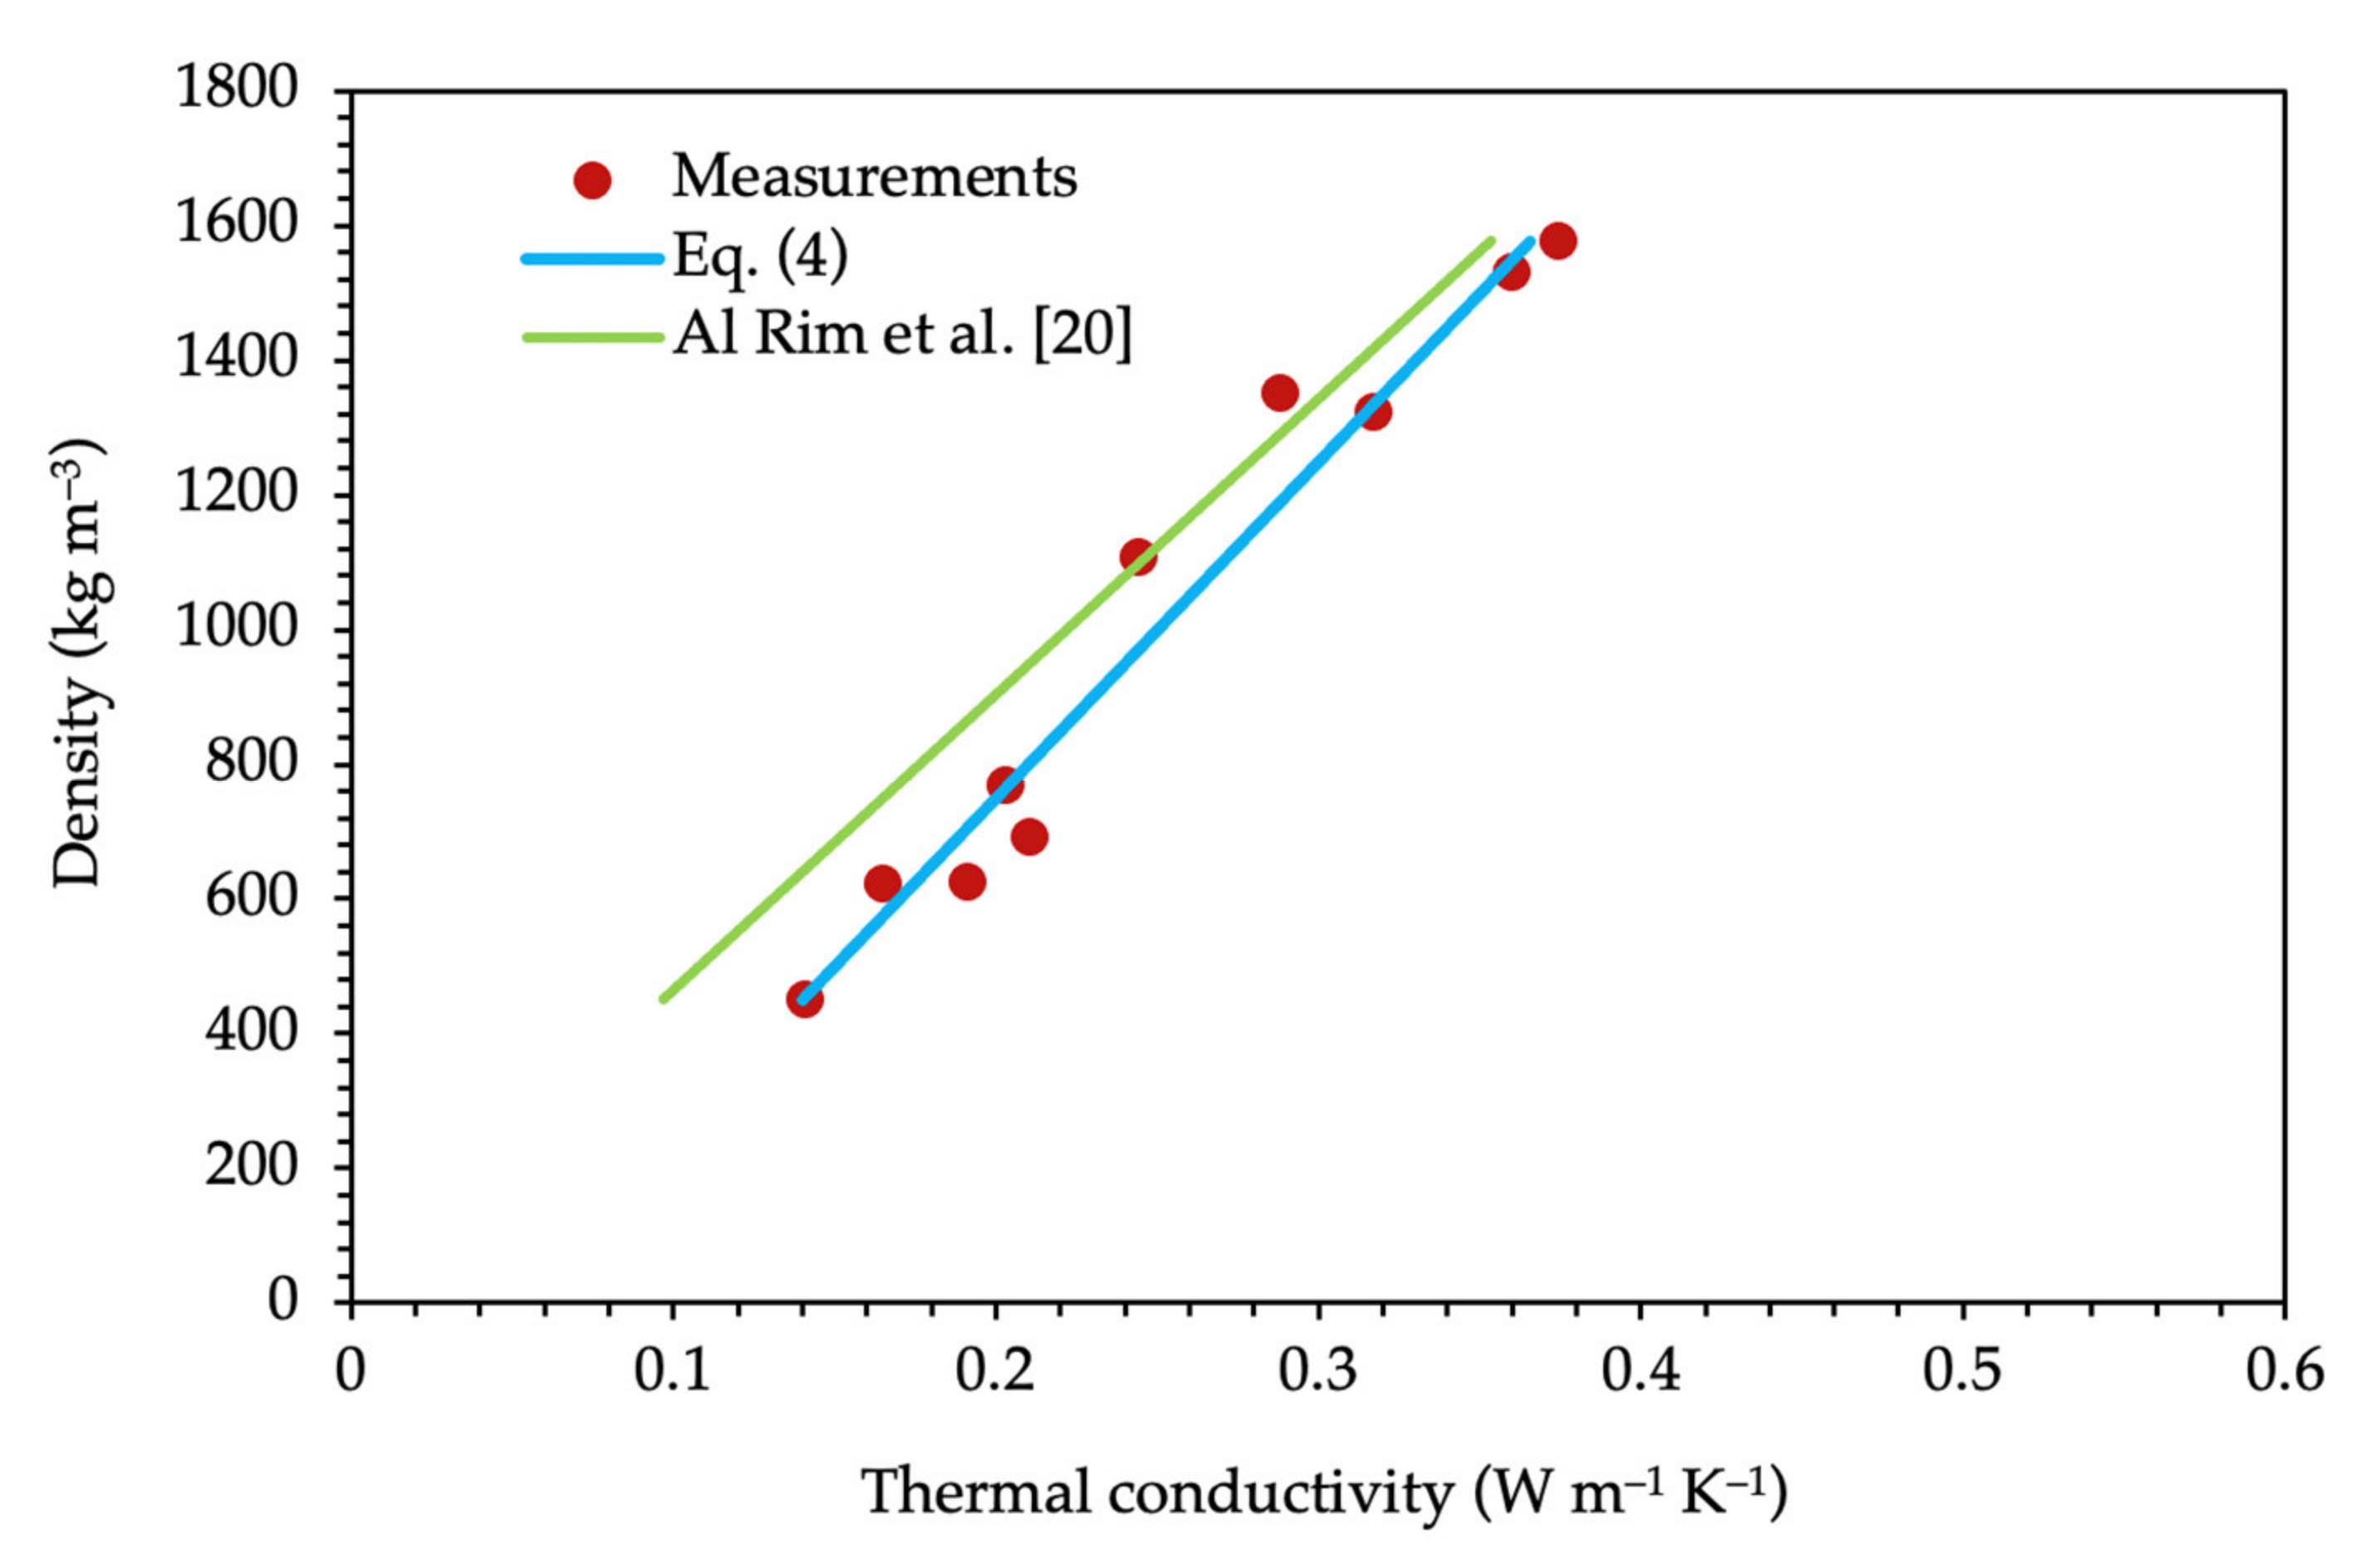
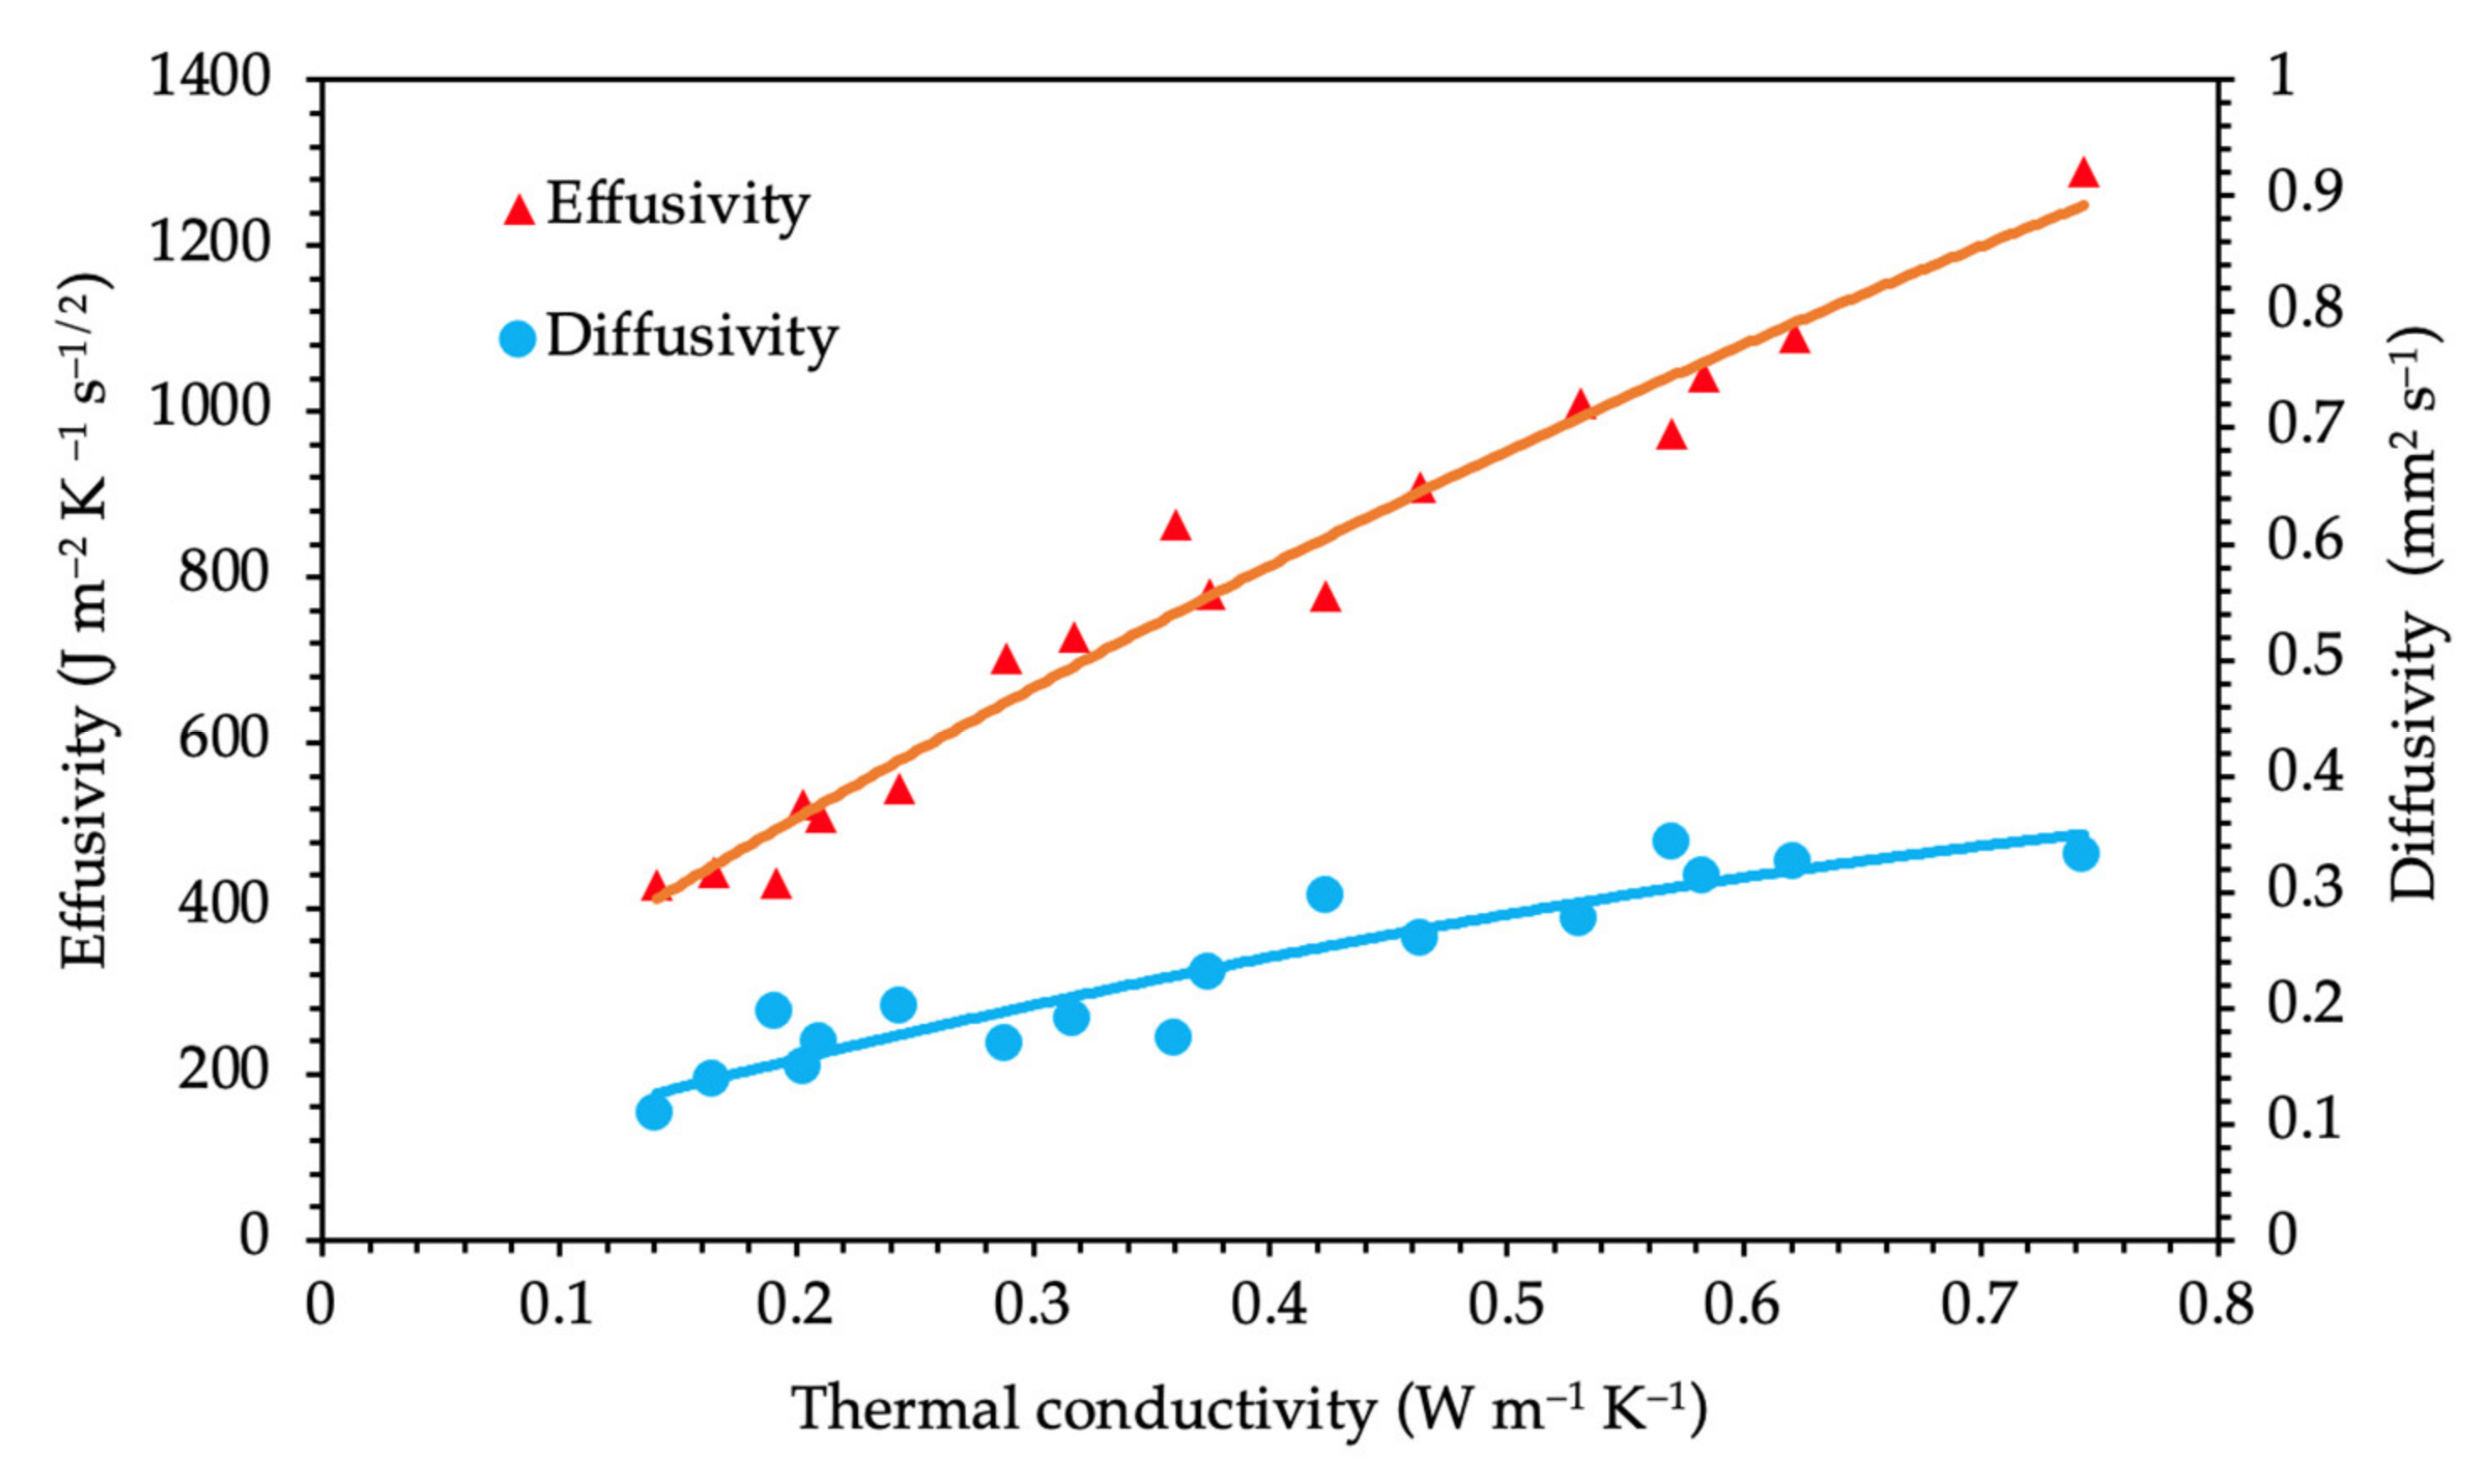
4.2. Cob Thermal Diffusivity, Effusivity, Heat Capacity and Density
- -
- The results obtained here are compared with those already published concerning thermal properties of earth-based materials. Al Rim et al. [18] obtained a linear relation for clay-cement-wood mixtures:
4.3. Cob building Thermal Performance
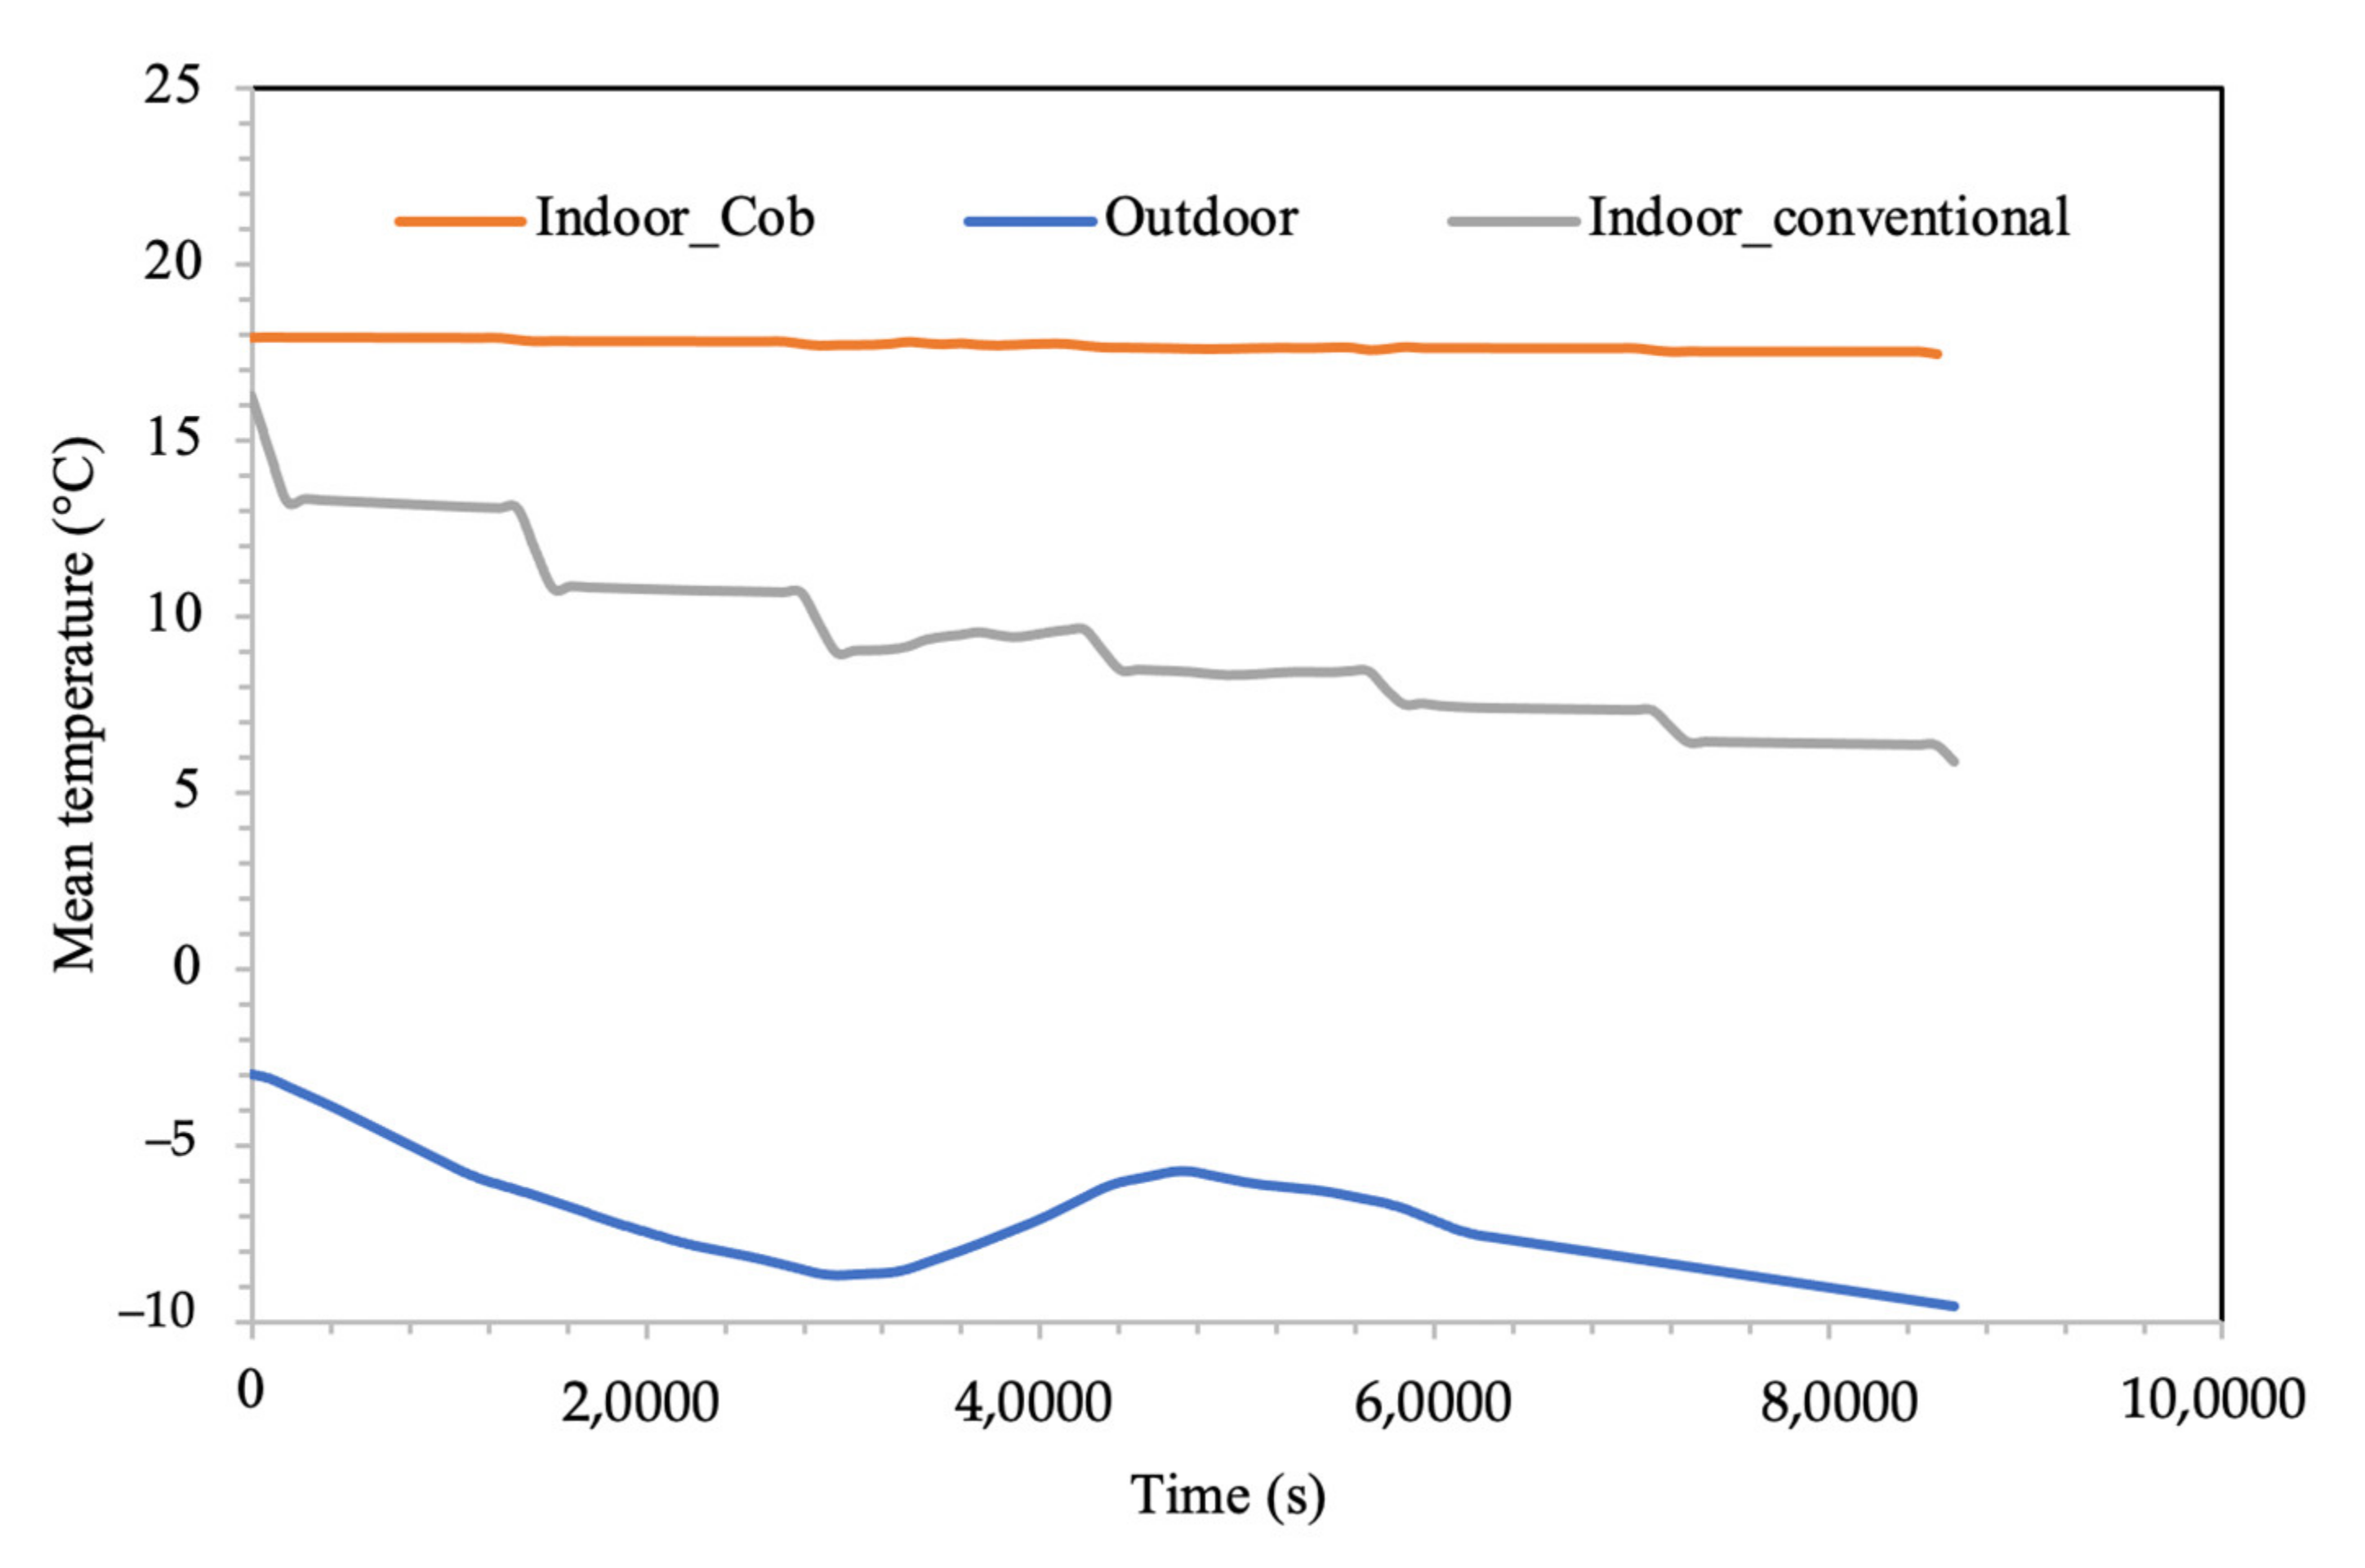
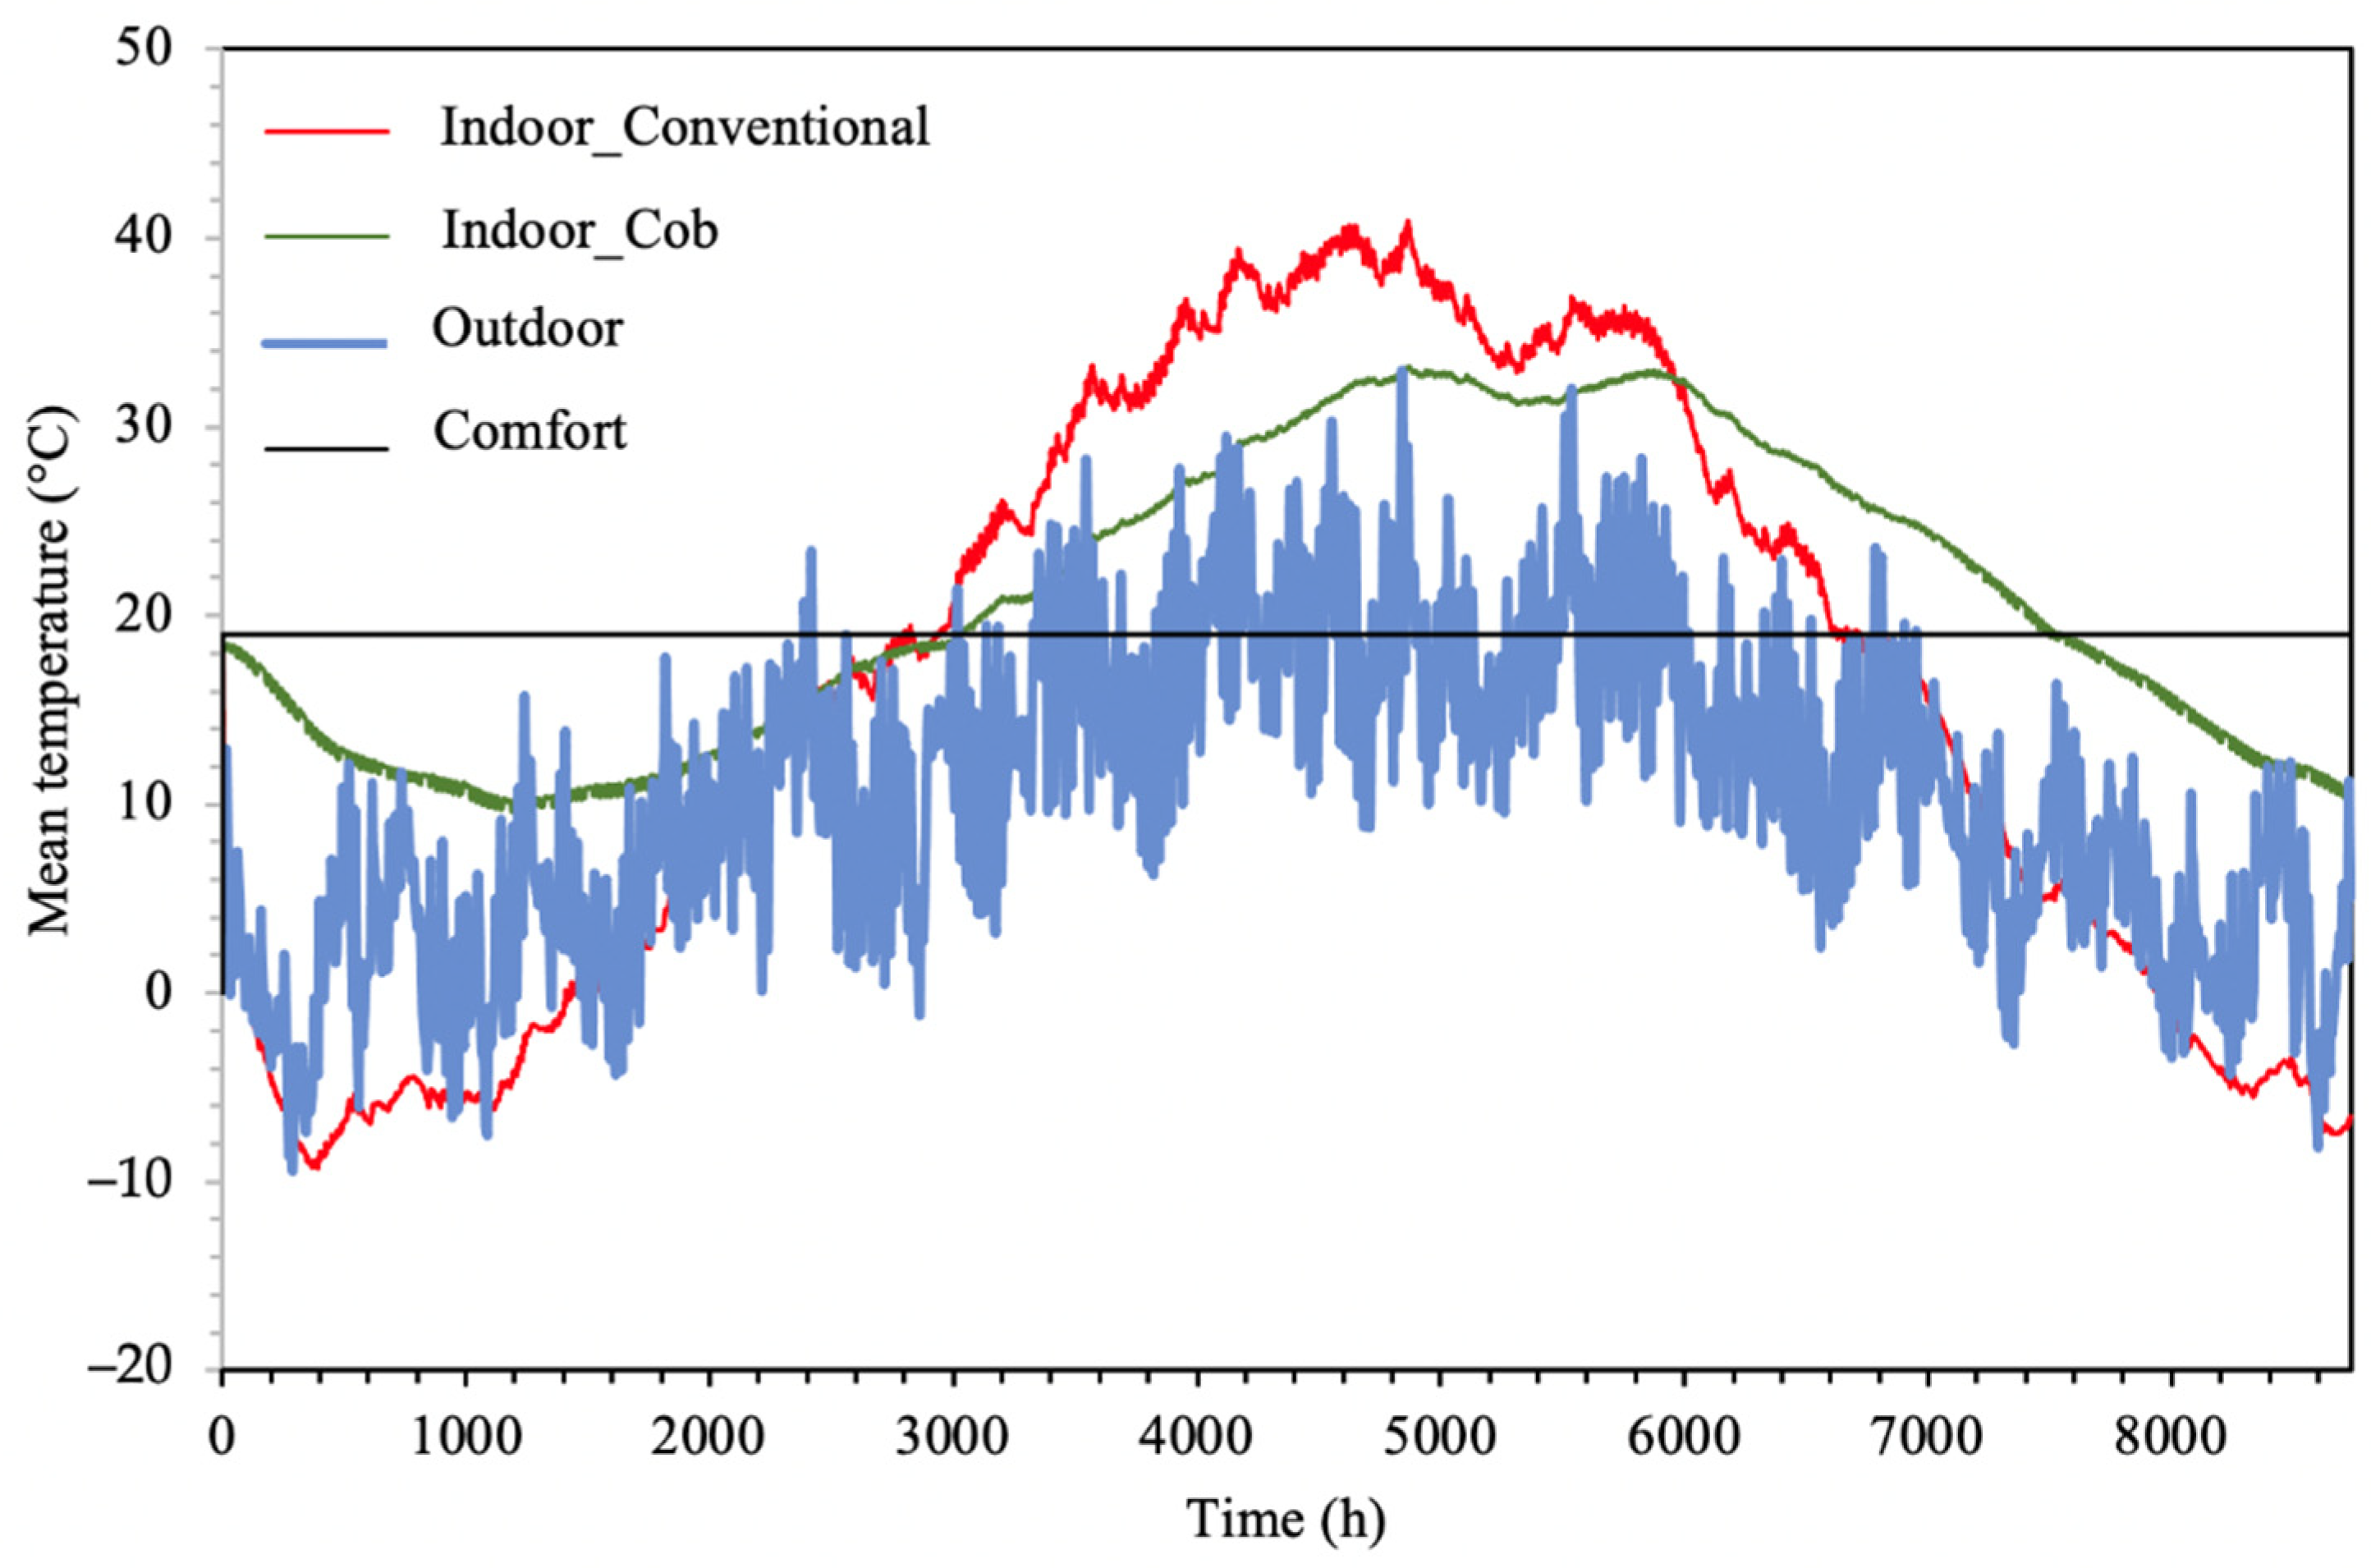
4.3.1. Cob Building Thermal Performance without Indoor Heating Source
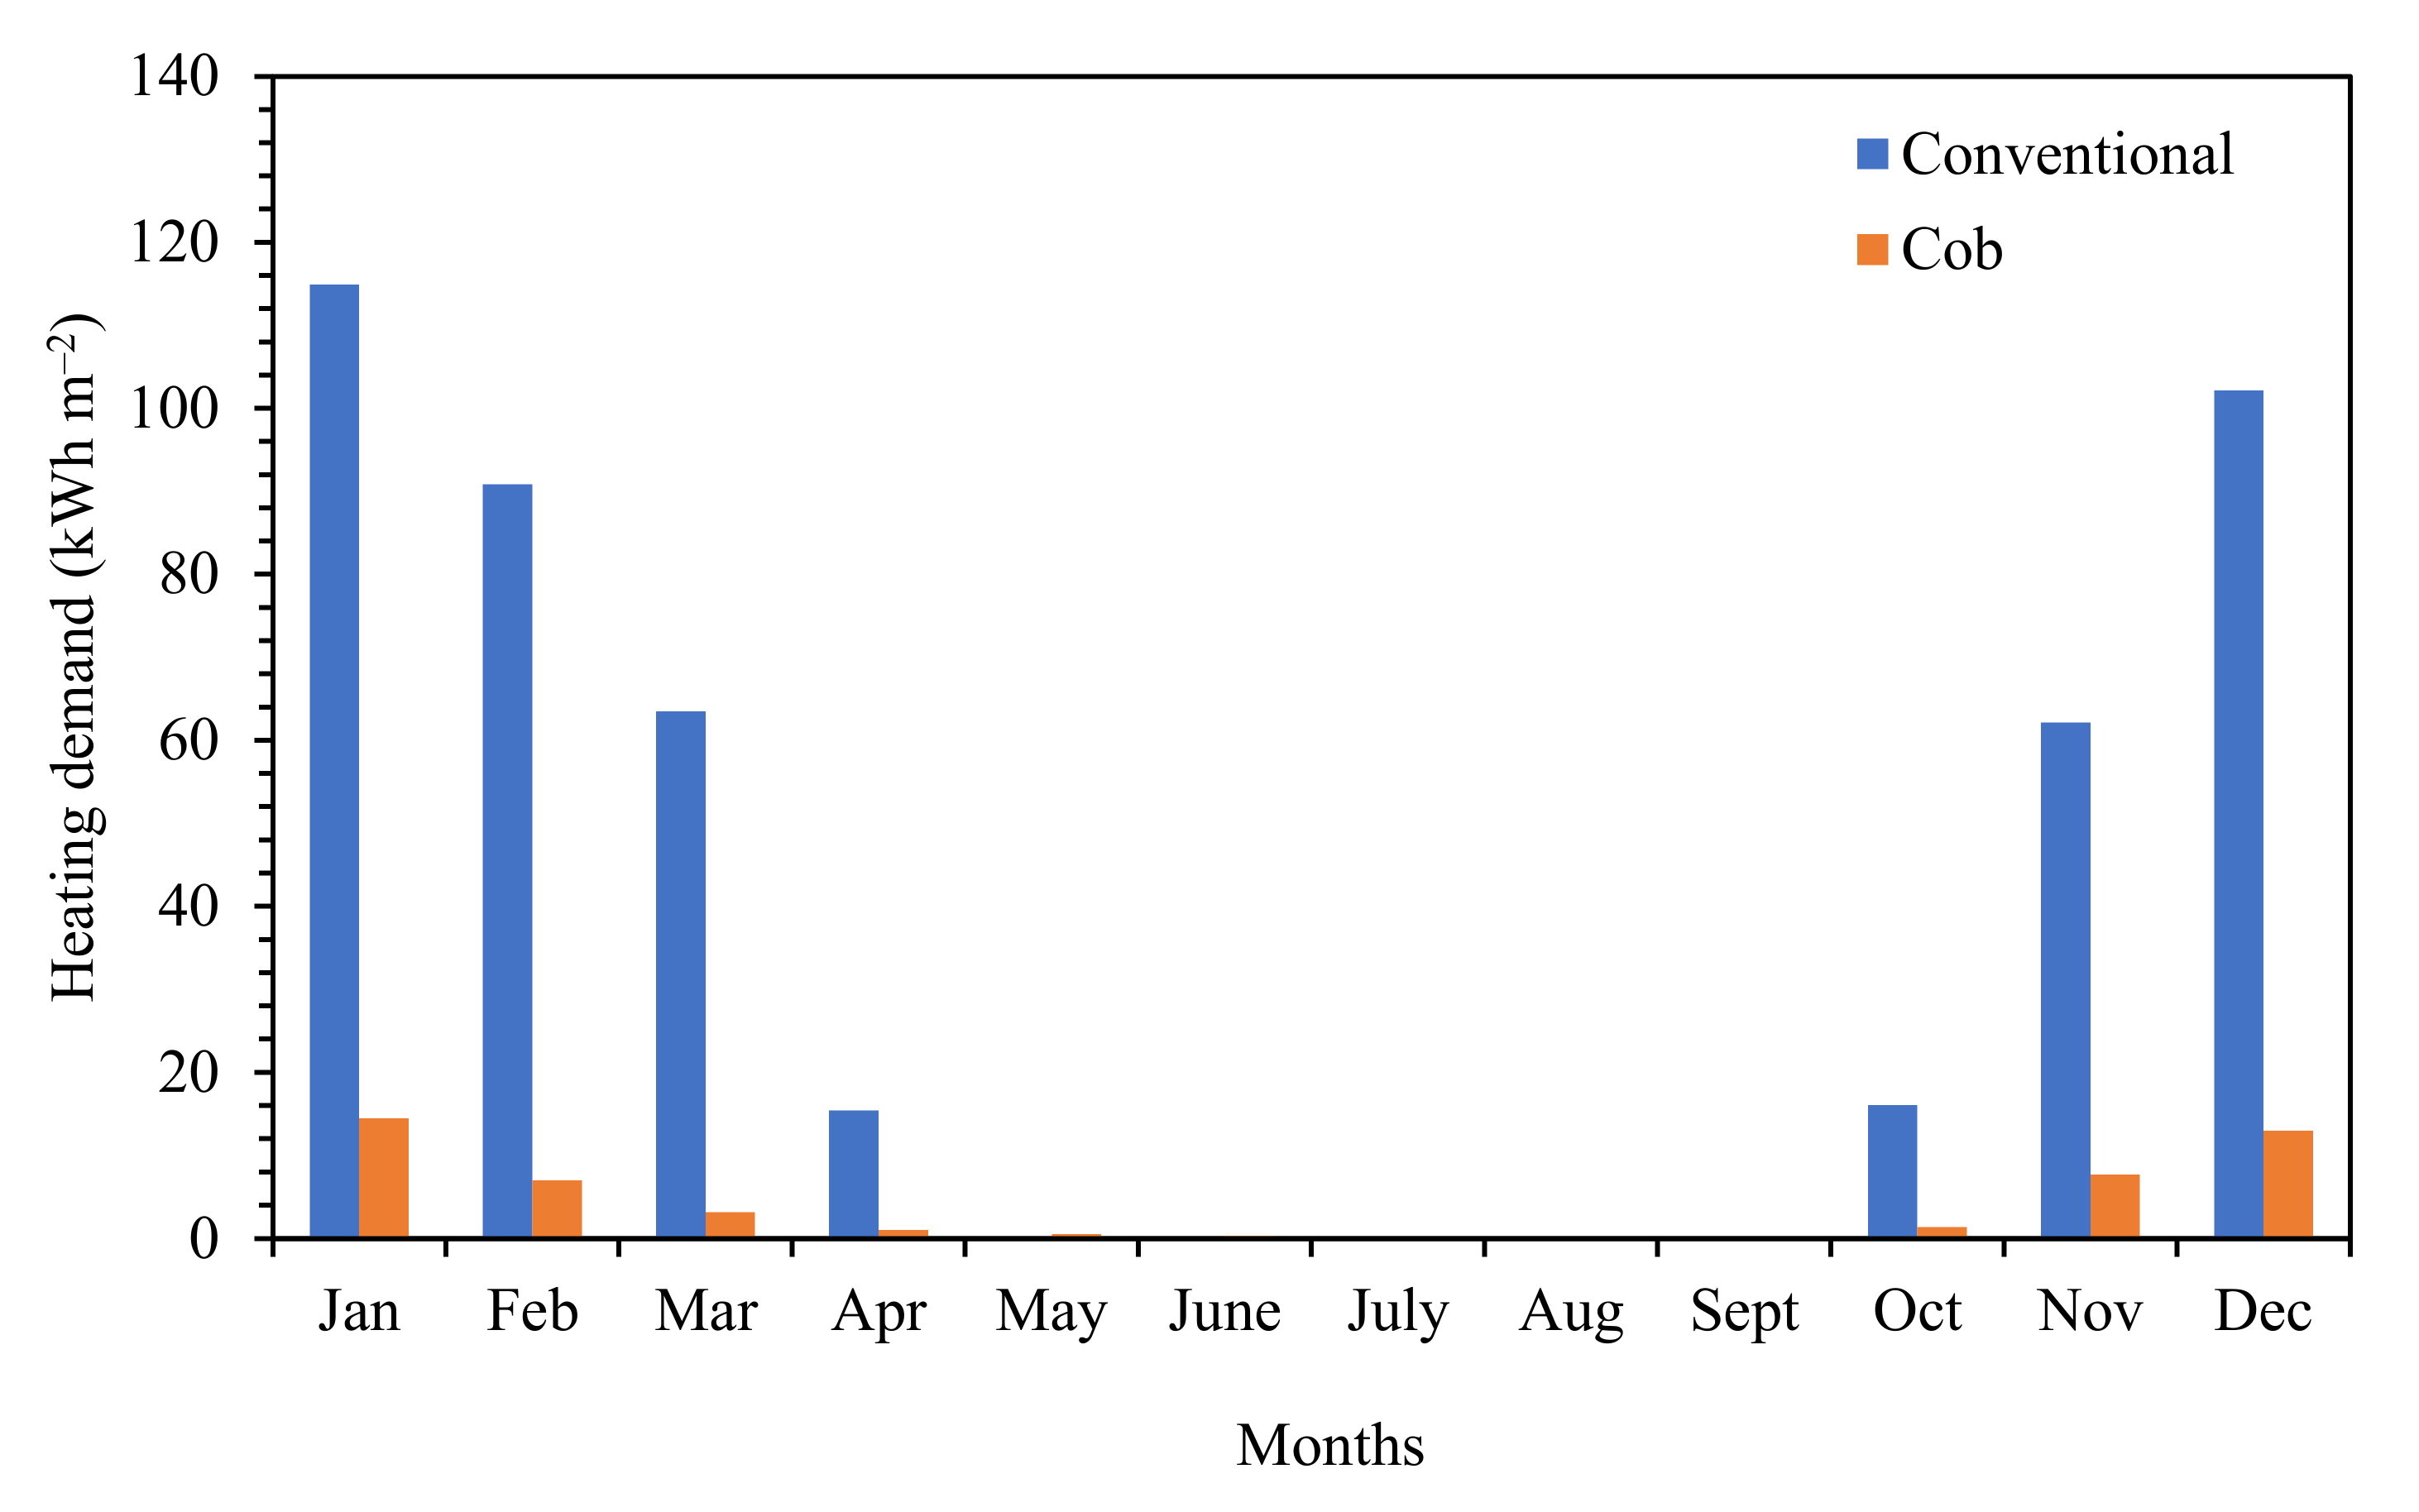
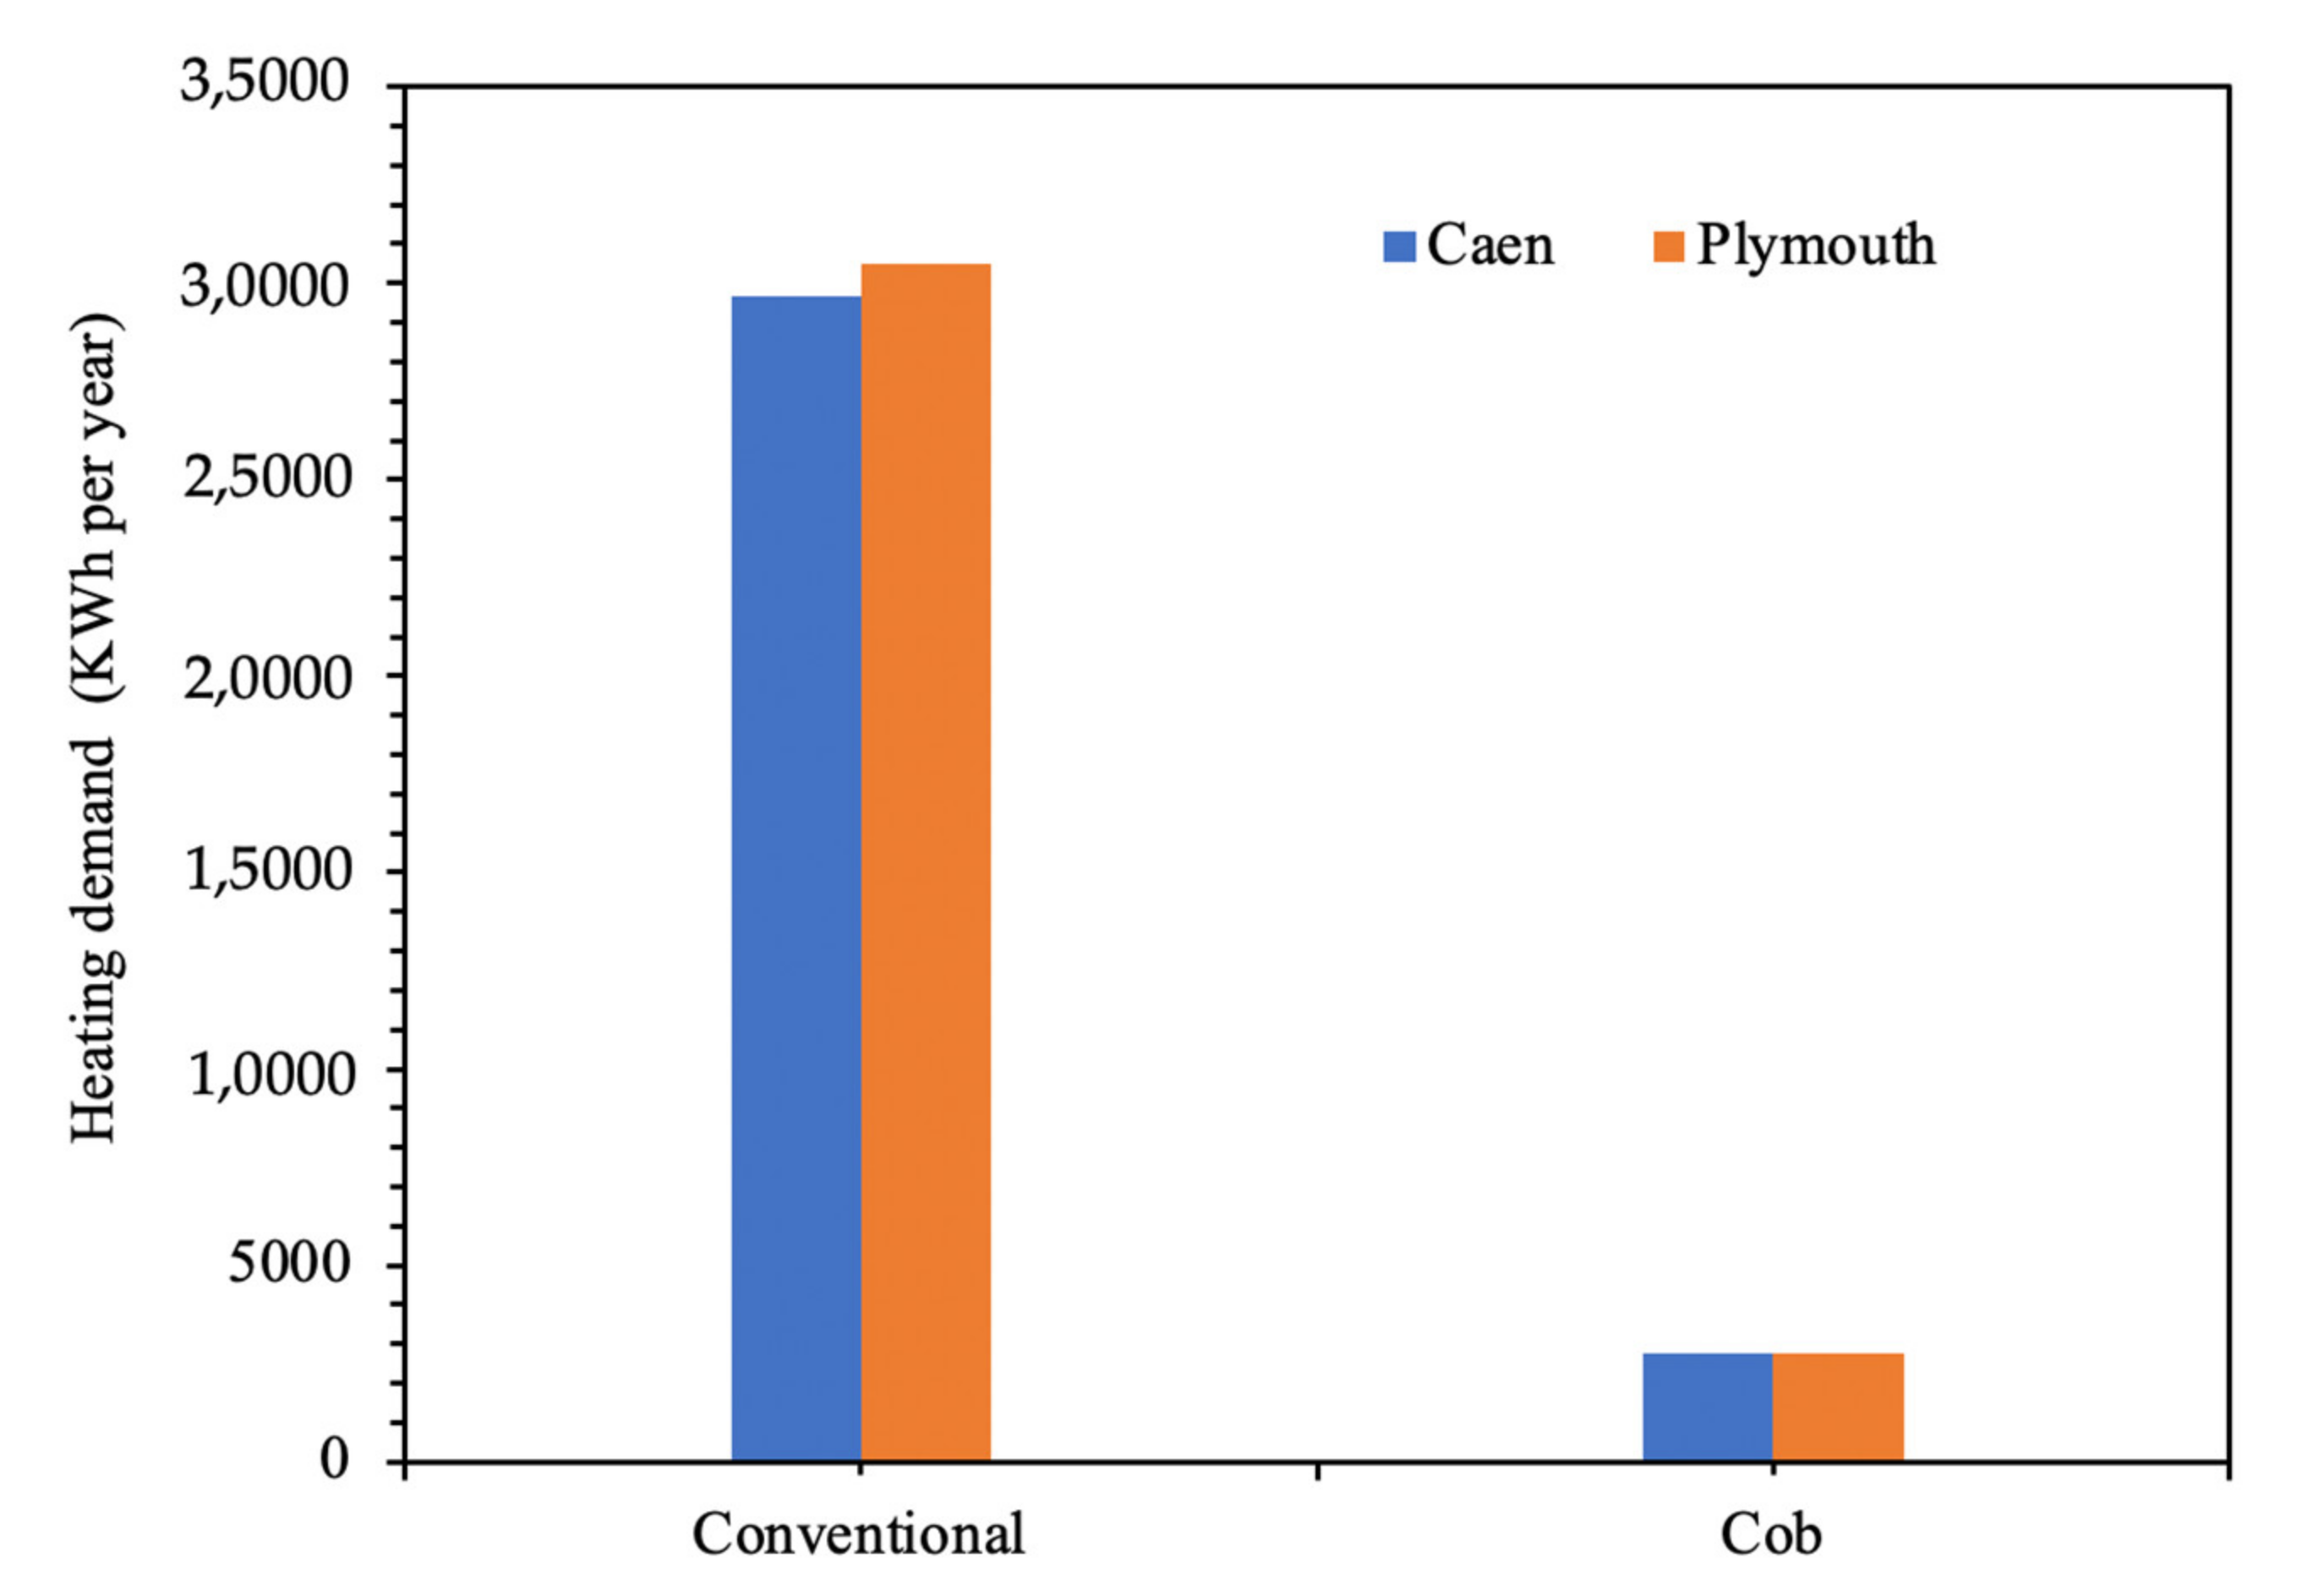
4.3.2. The Cob and Conventional Buildings Heating Need
5. Conclusions
Author Contributions
Funding
Institutional Review Board Statement
Informed Consent Statement
Acknowledgments
Conflicts of Interest
References
- Huo, H.; Jinga, C.; Li, K.; Huo, H. Synergic relationships between thermophysical properties of wall materials in energy-saving building design. Int. J. Heat Mass Tran. 2015, 90, 246–253. [Google Scholar] [CrossRef]
- International Energy Agency. Tracking Buildings Report. Tracking Report-June 2020; International Energy Agency: Paris, France, 2020. [Google Scholar]
- Painuly, J.P.; Park, H.; Lee, M.K.; Noh, J. Promoting energy efficiency financing and ESCOs in developing countries: Mechanisms and barriers. J. Clean. Prod. 2003, 11, 659–665. [Google Scholar] [CrossRef]
- Mora, E.P. Life cycle, sustainability and the transcendent quality of building materials. Build. Environ. 2007, 42, 1329–1334. [Google Scholar] [CrossRef]
- Goodhew, S.; Griffiths, R. Sustainable earth walls to meet the building regulations. Energy Build. 2005, 37, 451–459. [Google Scholar] [CrossRef]
- Mansour, M.B.; Jelidi, A.; Cherif, A.S.; Jabrallah, S.B. Optimizing thermal and mechanical performance of compressed earth blocks (CEB). Constr. Build. Mater. 2016, 104, 44–51. [Google Scholar] [CrossRef]
- Meukam, P.; Jannot, Y.; Noumowe, A.; Kofane, T.C. Thermo physical characteristics of economical building materials. Constr. Build. Mater. 2004, 18, 437–443. [Google Scholar] [CrossRef]
- Ashour, T.; Wieland, H.; Georg, H.; Bockisch, F.J.; Wu, W. The influence of natural reinforcement fibres on insulation values of earth plaster for straw bale buildings. Mater. Des. 2010, 31, 4676–4685. [Google Scholar] [CrossRef]
- Ashour, T.; Georg, H.; Wu, W. An experimental investigation on equilibrium moisture content of earth plaster with natural reinforcement fibres for straw bale buildings. Appl. Therm. Eng. 2011, 31, 293–303. [Google Scholar] [CrossRef]
- Maddison, M.; Mauring, T.; Kirsimäe, K.; Mander, Ü. The humidity buffer capacity of clay–sand plaster filled with phytomass from treatment wetlands. Build. Environ. 2009, 44, 1864–1868. [Google Scholar] [CrossRef]
- Laborel-Préneron, A.; Magniont, C.; Aubert, J.E. Characterization of barley straw, hemp shiv and corn cob as resources for bioaggregate based building materials. Waste Biomass Valorization 2018, 9, 1095–1112. [Google Scholar] [CrossRef]
- El Fgaier, F.; Lafhaj, Z.; Antczak, E.; Chapiseau, C. Dynamic thermal performance of three types of unfired earth bricks. Appl. Therm. Eng. 2016, 93, 377–383. [Google Scholar] [CrossRef]
- Sanjaya, C.S.; Wee, T.H.; Tamilselvan, T. Regression analysis estimation of thermal conductivity using guarded-hot-plate apparatus. Appl. Therm. 2011, 31, 1566–1575. [Google Scholar] [CrossRef]
- Barnaure, M.; Bonnet, S.; Poullain, P. Earth buildings with local materials: Assessing the variability of properties measured using non-destructive methods. Constr. Build. Mater. 2021, 281, 122613. [Google Scholar] [CrossRef]
- Goodhew, S.; Boutouil, M.; Streiff, F.; Le Guern, M.; Carfrae, J.; Fox, M. Improving the thermal performance of earthen walls to satisfy current building regulations. Energy Build. 2021, 240, 110873. [Google Scholar] [CrossRef]
- Leguern, M.; Sebaibi, N.; Boutouil, M. Technical Report Cobbauge Project. Soil and Fibre Characterisation, Mixes Choice and Mixes Characteristics; ESITC Caen: Épron, France, 2018. [Google Scholar]
- Arrêté du 28 Décembre 2012 Relatif aux Caractéristiques Thermiques et aux Exigences de Performance Énergétique des Bâtiments Nouveaux et des Parties Nouvelles de Bâtiments Autres que ceux Concernés par L’Article 2 du Décret du 26 Octobre 2010 Relatif aux Caractéristiques Thermiques et à la Performance Énergétique des Constructions. JORF 2012, 46, 97.
- Al Rim, K.; Ledhem, A.; Douzane, O.; Dheilly, R.M.; Queneudec, M. Influence of the proportion of wood on the thermal and mechanical performances of clay-cement-wood composites. Cem. Concr. Compos. 1999, 21, 269–276. [Google Scholar] [CrossRef]
- Labat, M.; Magniont, C.; Oudhof, N.; Aubert, J.E. From the experimental characterization of the hygrothermal properties of straw-clay mixtures to the numerical assessment of their buffering potential. Build. Environ. 2016, 97, 69–81. [Google Scholar] [CrossRef]
- Laborel-Préneron, A.; Magniont, C.; Aubert, J.E. Hygrothermal properties of unfired earth bricks: Effect of barley straw, hemp shiv and corn cob addition. Energy Build. 2018, 178, 265–278. [Google Scholar] [CrossRef]
- Meukam, P.; Noumowe, A.; Jannot, Y.; Duval, R. Thermophysical and mechanical characterization of stabilized clay bricks for building thermal insulation. Mater. Struct. 2003, 36, 453–460. [Google Scholar]
- Cagnon, H.; Aubert, J.E.; Coutand, M.; Magniont, C. Hygrothermal properties of earth bricks. Energy Build. 2014, 80, 208–217. [Google Scholar] [CrossRef]


| Mixes type | Mix | Fibre type | Fibre Mass (%) | Water Content (%) |
|---|---|---|---|---|
| Structural | S1 | Hemp straw | 5 | 25 |
| S2 | Hemp straw | 5 | 28 | |
| S3 | Hemp straw | 2.5 | 28 | |
| S4 | Flax straw | 2.5 | 28 | |
| S5 | Flax straw | 2.5 | 31 | |
| S6 | Wheat straw | 2.5 | 31 | |
| S7 | Reed | 2.5 | 31 | |
| S8 | Wheat straw | 5 | 31 | |
| Insulation | I1 | Reed | 25 | 131 |
| I2 | Hemp shiv | 25 | 131 |
| Parameters | Uncertainty |
|---|---|
| Heat flux (W) | ±10% |
| Temperature (°C) | ±0.1 |
| Distance (mm) | ±0.5 |
| Thermal conductivity (W m−1 K−1) | ±10% |
| Days | Lowest T (°C) | Highest T (°C) | Mean T (°C) | Maximum Mean Solar Radiation W m−² |
|---|---|---|---|---|
| 11 Jan | −9.56 | −3 | −7.15 | 250 |
| 21 July | 13.7 | 33 | 24.5 | 975 |
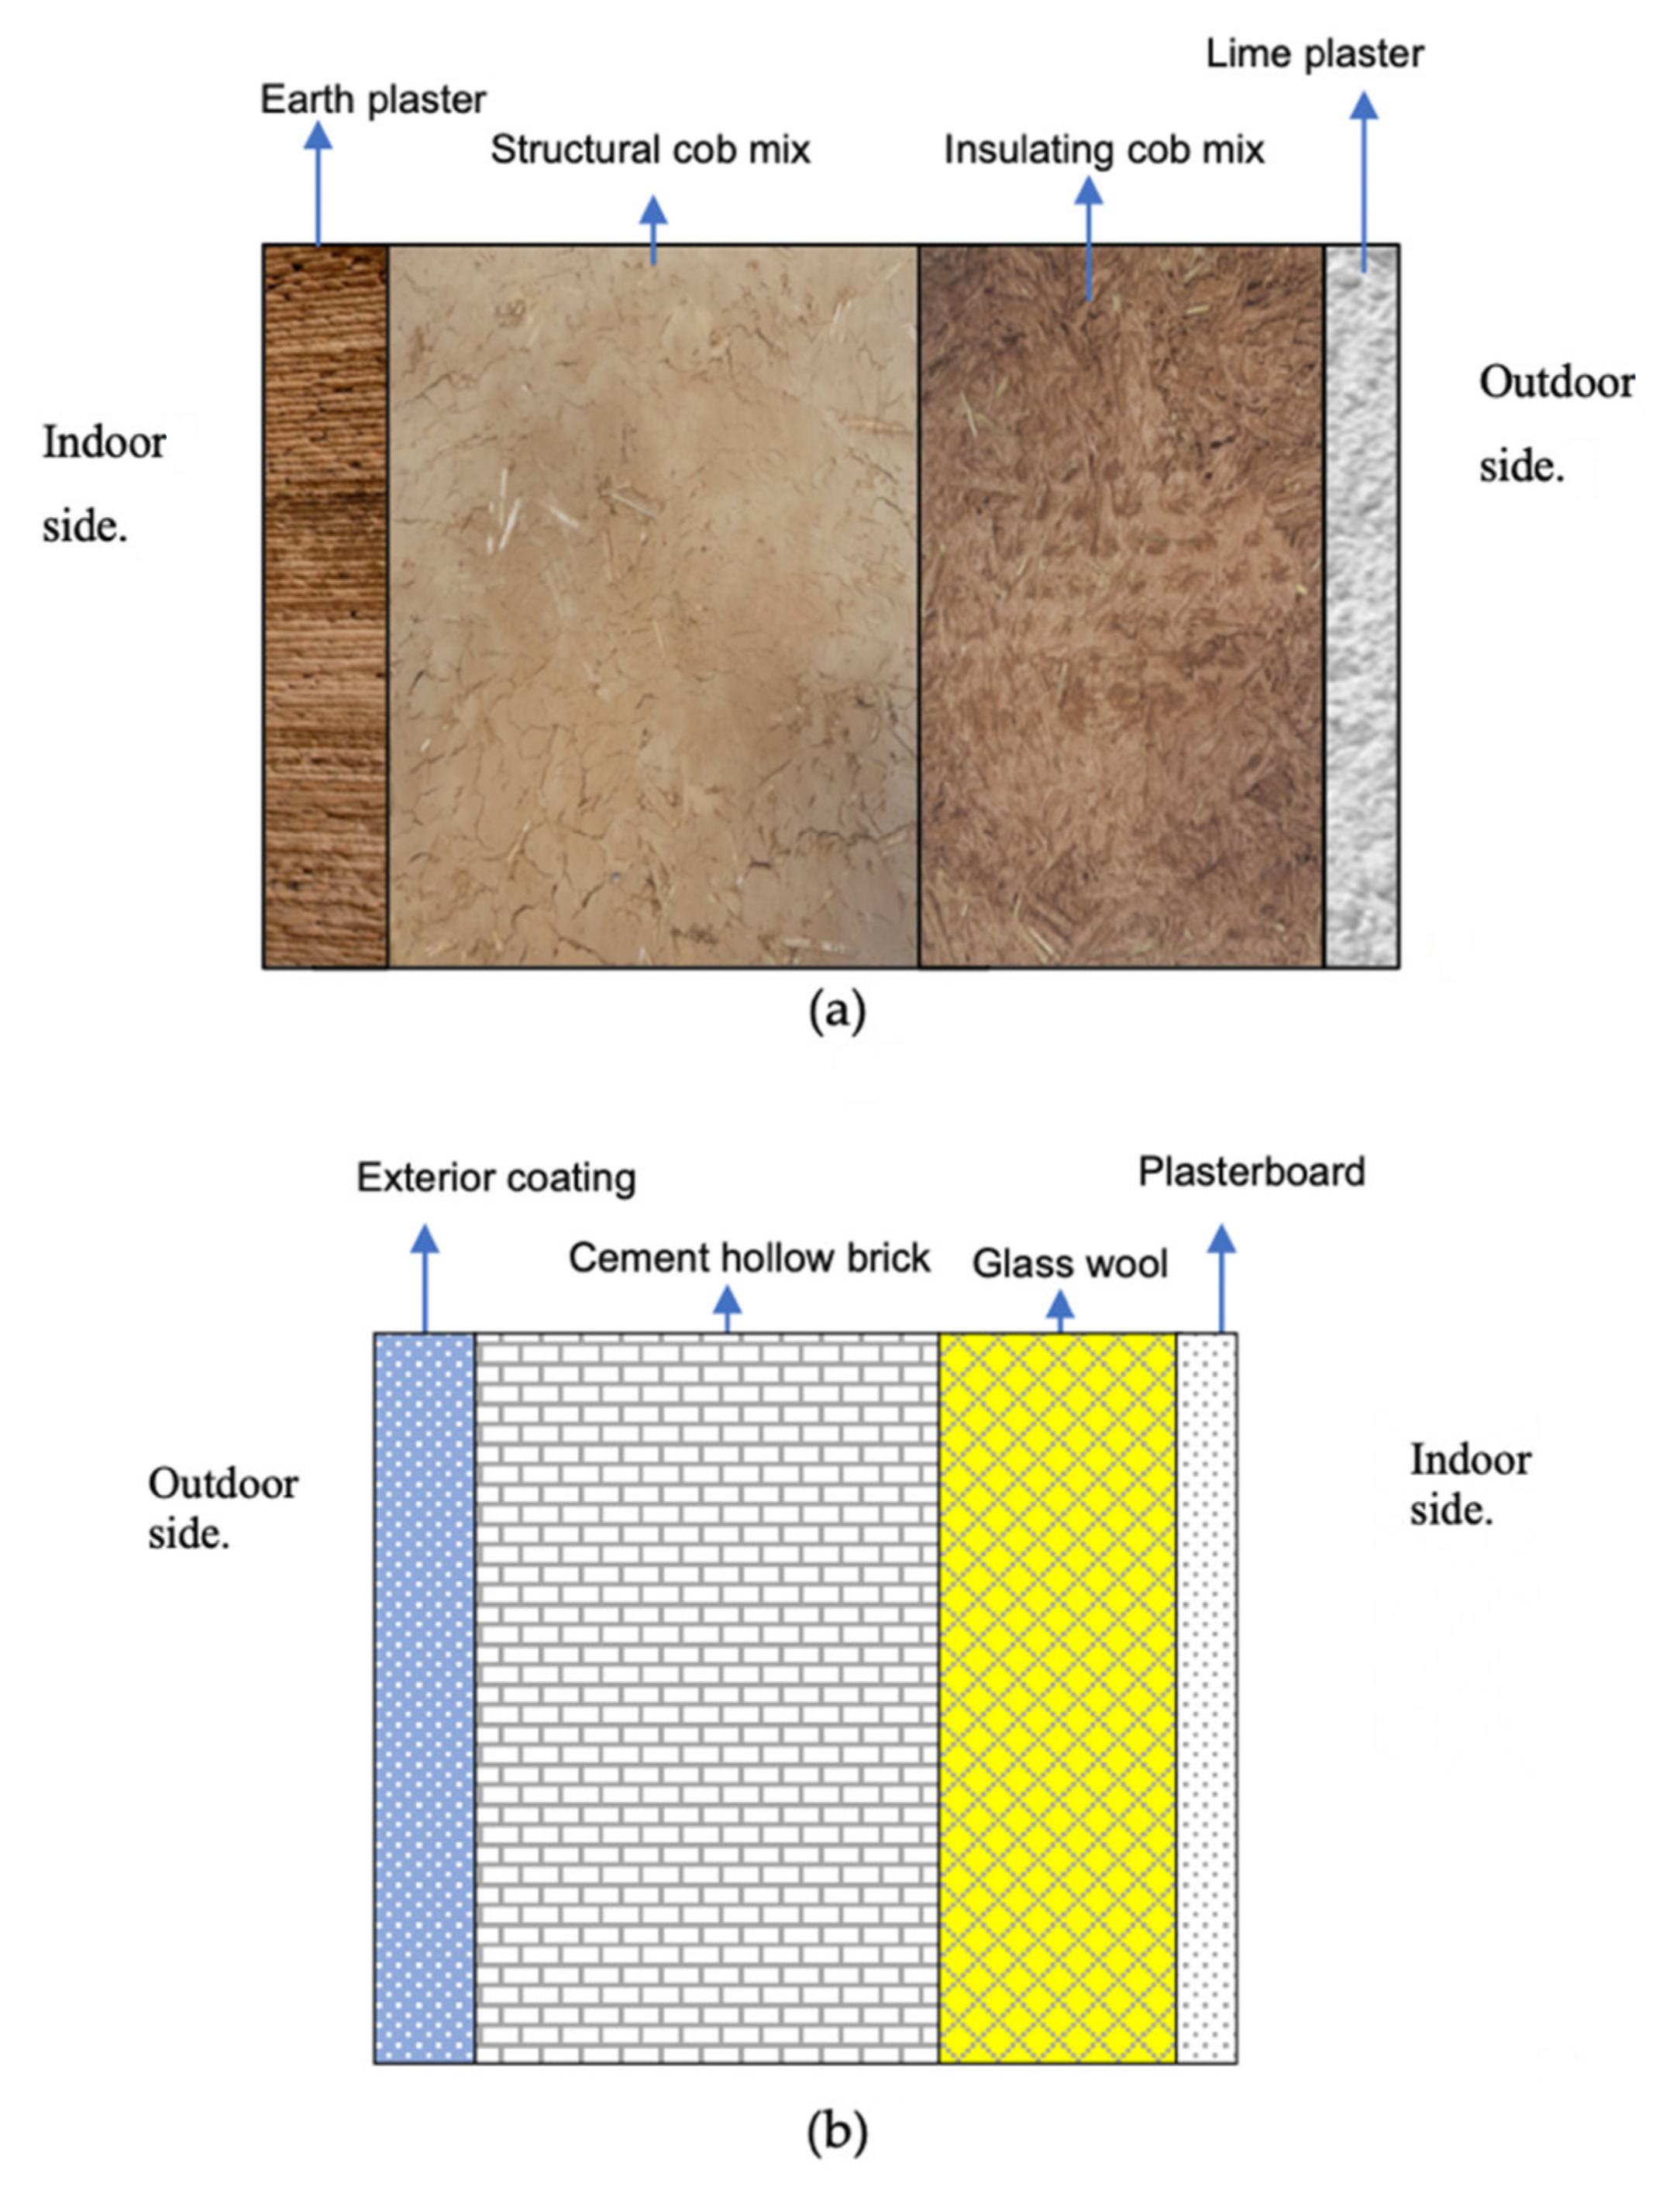
| Building Type | Building Composition | Material | Thickness (mm) | Thermal Conductivity (W m−1 K−1) |
|---|---|---|---|---|
| Cob building | Floor | clay | 30 | 0.09 |
| slab of lime | 120 | 0.55 | ||
| Fired earth | 20 | 0.22 | ||
| Ceiling | lime | 13 | 0.55 | |
| Cob (insulation) | 300 | 0.14 | ||
| Wood panels | 30 | 0.15 | ||
| Walls | lime | 13 | 0.55 | |
| Cob (insulation) | 300 | 0.14 | ||
| Cob (construction) | 400 | 0.74 | ||
| Raw earth | 15 | 0.75 | ||
| Conventional building | Floor | Floating screed | 50 | 1.2–1.5 |
| reinforced concrete | 100 | 1.5 | ||
| Extruded EPS | 60–80 | 0.021–0.029 | ||
| Ceiling | plasterboard | 13 | 0.25 | |
| Glass wool | 20 | 0.047 | ||
| Wood panels | 19 | 0.15 | ||
| Walls | Plasterboard | 13 | 0.25 | |
| Glass wool | 150 | 0.046 | ||
| Cement hollow brick | 200 | |||
| exterior coating | 15 | 1.3 |
Publisher’s Note: MDPI stays neutral with regard to jurisdictional claims in published maps and institutional affiliations. |
© 2021 by the authors. Licensee MDPI, Basel, Switzerland. This article is an open access article distributed under the terms and conditions of the Creative Commons Attribution (CC BY) license (https://creativecommons.org/licenses/by/4.0/).
Share and Cite
Zeghari, K.; Gounni, A.; Louahlia, H.; Marion, M.; Boutouil, M.; Goodhew, S.; Streif, F. Novel Dual Walling Cob Building: Dynamic Thermal Performance. Energies 2021, 14, 7663. https://doi.org/10.3390/en14227663
Zeghari K, Gounni A, Louahlia H, Marion M, Boutouil M, Goodhew S, Streif F. Novel Dual Walling Cob Building: Dynamic Thermal Performance. Energies. 2021; 14(22):7663. https://doi.org/10.3390/en14227663
Chicago/Turabian StyleZeghari, Kaoutar, Ayoub Gounni, Hasna Louahlia, Michael Marion, Mohamed Boutouil, Steve Goodhew, and François Streif. 2021. "Novel Dual Walling Cob Building: Dynamic Thermal Performance" Energies 14, no. 22: 7663. https://doi.org/10.3390/en14227663
APA StyleZeghari, K., Gounni, A., Louahlia, H., Marion, M., Boutouil, M., Goodhew, S., & Streif, F. (2021). Novel Dual Walling Cob Building: Dynamic Thermal Performance. Energies, 14(22), 7663. https://doi.org/10.3390/en14227663