
Numerical Model of Heat Pipes as an Optimization Method of Heat Exchangers


Abstract
:1. Introduction
2. Materials and Methods
2.1. Used Materials and Their Properties
2.2. Research Methodology
- Methodology of “thin” interfacial layers, when the number of cells in the interfacial layer is not sufficient to determine the temperature and flow profiles;
- Methodology of “thick” interfacial layers, when the number of cells in the interphase layer is sufficient for the correct determination of the above-mentioned values;
- Indirect methodology, combining the features of both models.
3. Results
3.1. Pipe I
3.1.1. Air
3.1.2. R134A Refrigerant-10% Filling of the Entire Volume of the Tube
3.1.3. R404A-10% Filling of the Entire Tube Volume
3.1.4. R407C-5% Filling of the Entire Tube Volume
3.2. Pipe II
3.2.1. R134A-10% Filling of the Entire Tube Volume
3.2.2. R404A-10% Fill the Entire Volume of the Tube
3.2.3. R407C-30% Filling of the Entire Tube Volume
4. Discussion
4.1. Discussion on the Operation of the Heat Pipe with the Use of Low-Boiling Agents
4.1.1. Heat Pipe with Air
4.1.2. Heat Pipe with Low-Boiling Factors
5. Conclusions
- Selection of the most optimal working medium and its amount in a given temperature range.
- Efficiency of the heat pipes and the value of the heat flux transmitted by them.Based on the numerical model and computer simulations, it can be concluded that the 1769 mm long heat pipe is preferable to the 550 mm long heat pipe by comparing the most advantageous types and amounts of working media used in them. The heat pipe made of copper was more efficient and generated greater temperature differences, which is mainly due to a larger heat exchange surface on both the evaporator and condenser sides.
- Usefulness of using heat exchangers of the heat tube type.Heat pipes can be used in many industries, mainly where effective heat transport is needed without direct contact of factors with each other. An example of this is, for example, phase change materials, which offer a very large heat storage capacity and are capable of quickly absorbing and releasing heat. The problem with the use of phase change materials is the heat exchange between them and the factor supplying and receiving heat from them. The contact of the factor with the materials is often unacceptable, and they do not currently use the full ability to receive and give off heat by phase change materials, for example, in heat and cold stores. Therefore, a series of numerical analyses and computer simulations were necessary to analyze the operation of heat pipes and determine the most optimal heat exchangers of the heat pipe type depending on their operating conditions. The results of computer simulations will enable the selection of heat pipes for a given temperature range of their operation and will allow estimation of their efficiency and the power of the transferred heat flux.
Author Contributions
Funding
Institutional Review Board Statement
Informed Consent Statement
Data Availability Statement
Acknowledgments
Conflicts of Interest
Nomenclature
| Sm | Volume sources |
| g | Gravitational acceleration |
| F | External forces acting on the fluid |
| p | Pressure, Pa |
| mpq, mqp | Mass flows between phases |
| Tl | Liquid temperature, °C |
| Tg | Gas temperature, °C |
| Tsat | Saturation temperature, °C |
| Volumetric mass source | |
| Coef | Empirical coefficient |
| k | Thermal conductivity, W/(m∙K) |
| h | Heat transfer coefficient, W/(m2∙K) |
| R | Thermal resistance, K/W |
| f | Friction coefficient |
| ν | Kinematic viscosity, m2/s |
| ρ | Density, kg/m3 |
| Nu | Nusselt number |
| Pr | Prandlt number |
| 𝑄 | Heat transfer rate through heat pipe, W |
| QH | External source of heat, W |
| Cμ | Model coefficient, dependent on flow type |
| u | Fluid velocity, m/s |
| Sij | Reynolds-averaged strain-rate tensor |
| q | Heat flux density |
| y | Distance from point to the wall, m |
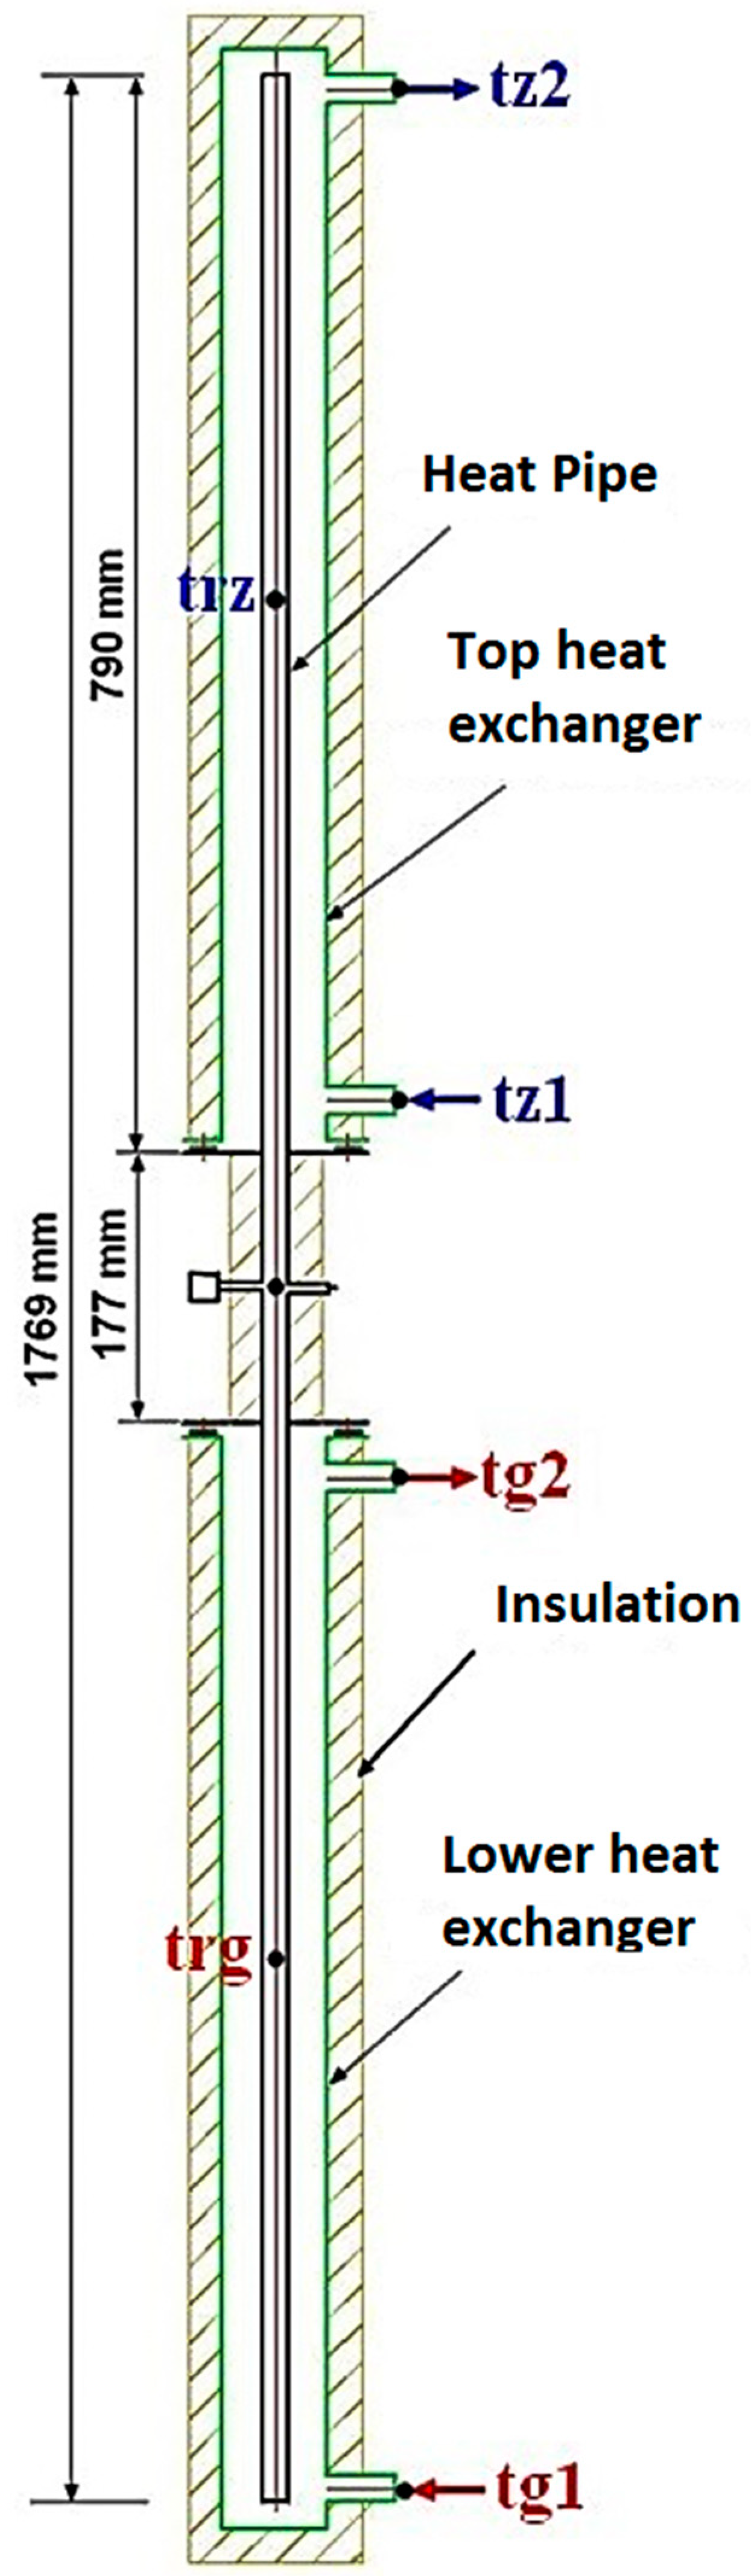
| tz1 | Cold water temperature at the inlet to the cooling exchanger, °C |
| tz2 | Cold water temperature at the outlet from the cooling exchanger, °C |
| tg1 | Hot water temperature at the entrance to the heat exchanger, °C |
| tg2 | Hot water temperature at the outlet of the heating exchanger, °C |
| trz | Heat pipe wall temperature in the center of the condensing section, °C |
| trg | Heat pipe wall temperature in the center of the evaporating section °C |
| Greek Symbols | |
| τ | Viscous stress |
| αq | Volume fraction of q-phase in the cell |
| Indices | |
| v | Vapour |
| l | Liquid |
| ij | Matrix coordinates |
References
- Eurostat. Sustainable Development in the European Union—Monitoring Report on Progress towards the SDGs in an EU Context—2021 Edition; Publications Office of the EU: Luxembourg, 2021. [Google Scholar] [CrossRef]
- Eurostat. Environmental Goods and Services Sector Accounts—Handbook 2016 Edition; Publications Office of the EU: Luxembourg, 2016. [Google Scholar] [CrossRef]
- Eurostat. Panorama of Energy; Environment and Energy; Collection: Statistical Books; Eurostat: Luxembourg, 2009; ISBN 978-92-79-11151-8. [Google Scholar]
- Eurostat. Handbook on Environmental Goods and Services Sector; Eurostat: Luxembourg, 2009; ISSN 1977-0375. [Google Scholar]
- Wu, X.P.; Johnson, P.; Akbarzadeh, A. Application of heat pipe heat exchangers to humidity control in air-conditioning systems. Appl. Therm. Eng. 1997, 17, 561–568. [Google Scholar] [CrossRef]
- Adrian, Ł.; Szufa, S.; Piersa, P.; Kuryło, P.; Mikołajczyk, F.; Kurowski, K.; Pochwała, S.; Obraniak, A.; Stelmach, J.; Wielgosiński, G.; et al. Analysis and Evaluation of Heat Pipe Efficiency to Reduce Low Emission with the Use of Working Agents R134A, R404A and R407C, R410A. Energies 2021, 14, 1926. [Google Scholar] [CrossRef]
- Chen, Q.; Shi, Y.; Zhuang, Z.; Weng, L.; Xu, C.; Zhou, J. Numerical Analysis of Liquid–Liquid Heat Pipe Heat Exchanger Based on a Novel Model. Energies 2021, 14, 589. [Google Scholar] [CrossRef]
- Qian, Z.; Wang, Q.; Lv, S. Research on the Thermal Hydraulic Performance and Entropy Generation Characteristics of Finned Tube Heat Exchanger with Streamline Tube. Energies 2020, 13, 5408. [Google Scholar] [CrossRef]
- Gao, Q.; Zhang, P.; Peng, W.; Chen, S.; Zhao, G. Structural Design Simulation of Bayonet Heat Exchanger for Sulfuric Acid Decomposition. Energies 2021, 14, 422. [Google Scholar] [CrossRef]
- Kim, B.; Kim, K.; Kim, S. Numerical Study on Novel Design for Compact Parallel-Flow Heat Exchanger with Manifolds to Improve Flow Characteristics. Energies 2020, 13, 6330. [Google Scholar] [CrossRef]
- Zhang, Y.-D.; Chen, M.-R.; Wu, J.-H.; Hung, K.-S.; Wang, C.-C. Performance Improvement of a Double-Layer Microchannel Heat Sink via Novel Fin Geometry—A Numerical Study. Energies 2021, 14, 3585. [Google Scholar] [CrossRef]
- Teodori, E.; Pontes, P.; Moita, A.; Georgoulas, A.; Marengo, M.; Moreira, A. Sensible Heat Transfer during Droplet Cooling: Experimental and Numerical Analysis. Energies 2017, 10, 790. [Google Scholar] [CrossRef] [Green Version]
- Song, E.-H.; Lee, K.-B.; Rhi, S.-H. Thermal and Flow Simulation of Concentric Annular Heat Pipe with Symmetric or Asymmetric Condenser. Energies 2021, 14, 3333. [Google Scholar] [CrossRef]
- Pang, L.; Luo, K.; Yu, S.; Ma, D.; Zhao, M.; Mao, X. Study on Heat Transfer Performance of Antifreeze-R134a Heat Exchanger (ARHEx). Energies 2020, 13, 6129. [Google Scholar] [CrossRef]
- Yang, J.; Zhao, Y.; Chen, A.; Quan, Z. Thermal Performance of a Low-Temperature Heat Exchanger Using a Micro Heat Pipe Array. Energies 2019, 12, 675. [Google Scholar] [CrossRef] [Green Version]
- Ochman, A.; Chen, W.-Q.; Błasiak, P.; Pomorski, M.; Pietrowicz, S. The Use of Capsuled Paraffin Wax in Low-Temperature Thermal Energy Storage Applications: An Experimental and Numerical Investigation. Energies 2021, 14, 538. [Google Scholar] [CrossRef]
- Rossomme, S. Modélisation de L’éVaporation Des Lms Liquides Minces, Y Compris AU Voisinage Des Lignes de Contact: Application Aux Caloducs à Rainures. Ph.D. Thesis, Université libre de Bruxelles, Bruxelles, Belgique, 2008. [Google Scholar]
- Kaya, M. An experimental investigation on thermal efficiency of two-phase closed thermosyphon (TPCT) filled with CuO/water nanofluid. Eng. Sci. Technol. Int. J. 2020, 23, 812–820. [Google Scholar] [CrossRef]
- Wong, S.-C. The Evaporation Mechanism in the Wick of Copper Heat Pipes; Springer: Berlin/Heidelberg, Germany, 2014; ISBN 978-3-319-04494-1. [Google Scholar] [CrossRef]
- Haque, M.E.; Efthakher, M.; Mashud, H. Performance Analysis of a Heat Pipe with Stainless Steel Wick. J. Eng. Adv. 2020, 1, 16–22. [Google Scholar] [CrossRef]
- Schepper, S.C.K.; Heynderickx, G.J.; Marin, G.B. CFD modeling of all gas–liquid and vapor–liquid flow regimes predicted by the Baker chart. Chem. Eng. J. 2008, 138, 349–357. [Google Scholar] [CrossRef] [Green Version]
- Smirnov, H.; Henry, F. Transport Phenomena in Capillary-Porous Structures and Heat Pipes; CRC Press: Boca Raton, FL, USA, 2010. [Google Scholar] [CrossRef]
- Nowak-Ocłoń, M.; Ocłoń, P. Thermal and economic analysis of preinsulated and twin-pipe heat network operation. Energy 2020, 193, 116619. [Google Scholar] [CrossRef]
- Ochman, A.; Pietrowicz, S. The thermal behaviour of a special heat exchanger filled with the phase change material dedicated for low—Temperature storage applications. In EPJ Web of Conferences; EDP Sciences: Les Ulis, France, 2019. [Google Scholar] [CrossRef] [Green Version]
- Smakulski, P.; Pietrowicz, S.; Ishimoto, J. The numerical modeling of cell freezing in binary solution under subcooling conditions. Int. J. Numer. Methods Heat Fluid Flow 2020, 30, 3005–3025. [Google Scholar] [CrossRef]
- Fydrych, J.; Pietrowicz, S. A comparative thermodynamic analysis of helium distribution systems with central and distributed precooling heat exchangers. IOP Conf. Ser. Mater. Sci. Eng. 2019, 502, 012173. [Google Scholar] [CrossRef]
- Adrian, Ł.; Piersa, P.; Szufa, S.; Romanowska-Duda, Z.; Grzesik, M.; Cebula, A.; Kowalczyk, S.; Ratajczyk-Szufa, J. Experimental research and thermographic analysis of heat transfer processes in a heat pipe heat exchanger utilizing as a working fluid R134A. In Renewable Energy Sources: Engineering, Technology, Innovation; Mudryk, K., Werle, S., Eds.; Springer Proceedings in Energy ICORES 2017; Springer: Cham, Switzerland, 2018; pp. 413–421. ISBN 978-3-319-72370-9. [Google Scholar] [CrossRef]
- Głogowski, M.; Kubiak, P.; Szufa, S.; Piersa, P.; Adrian, Ł.; Krukowski, M. The Use of the Fourier Series to Analyze the Shaping of Thermodynamic Processes in Heat Engines. Energies 2021, 14, 2316. [Google Scholar] [CrossRef]
- Siuda, R.; Kwiatek, J.; Szufa, S.; Obraniak, A.; Piersa, P.; Adrian, Ł.; Modrzewski, R.; Ławińska, K.; Siczek, K.; Olejnik, T.P. Industrial verification and research development of lime-gypsum fertilizer granulation method. Minerals 2021, 11, 119. [Google Scholar] [CrossRef]
- Adrian, Ł.; Szufa, S.; Piersa, P.; Romanowska-Duda, Z.; Grzesik, M.; Cebula, A.; Kowalczyk, S.; Ratajczyk-Szufa, J. Thermographic analysis and experimental work using laboratory installation of heat transfer processes in a heat pipe heat exchanger utilizing as a working fluid R404A and R407A. In Renewable Energy Sources: Engineering, Technology, Innovation; Wróbel, M., Jewiarz, M., Szlęk, A., Eds.; Springer Proceedings in Energy; Springer: Cham, Switzerland, 2020; pp. 799–807. ISBN 978-3-030-13887-5. [Google Scholar] [CrossRef]


| Coolant | Amount of Coolant in the Pipe [%] | |
|---|---|---|
| Copper Pipe | Brass Pipe | |
| R134A | 10 | 10 |
| R404A | 10 | 10 |
| R407C | 5 | 30 |
Publisher’s Note: MDPI stays neutral with regard to jurisdictional claims in published maps and institutional affiliations. |
© 2021 by the authors. Licensee MDPI, Basel, Switzerland. This article is an open access article distributed under the terms and conditions of the Creative Commons Attribution (CC BY) license (https://creativecommons.org/licenses/by/4.0/).
Share and Cite
Adrian, Ł.; Szufa, S.; Piersa, P.; Mikołajczyk, F. Numerical Model of Heat Pipes as an Optimization Method of Heat Exchangers. Energies 2021, 14, 7647. https://doi.org/10.3390/en14227647
Adrian Ł, Szufa S, Piersa P, Mikołajczyk F. Numerical Model of Heat Pipes as an Optimization Method of Heat Exchangers. Energies. 2021; 14(22):7647. https://doi.org/10.3390/en14227647
Chicago/Turabian StyleAdrian, Łukasz, Szymon Szufa, Piotr Piersa, and Filip Mikołajczyk. 2021. "Numerical Model of Heat Pipes as an Optimization Method of Heat Exchangers" Energies 14, no. 22: 7647. https://doi.org/10.3390/en14227647
APA StyleAdrian, Ł., Szufa, S., Piersa, P., & Mikołajczyk, F. (2021). Numerical Model of Heat Pipes as an Optimization Method of Heat Exchangers. Energies, 14(22), 7647. https://doi.org/10.3390/en14227647