1. Introduction
From personal devices and computers to large industrial equipment, electricity is pivotal to modern life. It is also a commodity possessing unique characteristics. Electricity cannot be stored at a reasonable cost nor can be easily transmitted over very long distances. For its steady supply, a continuous equilibrium between power production and consumption is required. The demand for electricity heavily depends on the business activity (weekdays vs. weekends/holidays) and regional climate/weather factors (e.g., sunshine hours, temperature, precipitation and wind speed).
In the past thirty years, the global electricity industry has experienced continuous deregulation due to the political willingness to open power production/retailing to competition. Deregulation has created the need for structural pricing models [
1]. Despite the fact that in each country the transition to a fully competitive market has passed through several phases (legislation reform, initial deregulation, privatization, third-party entrance, re-regulation, etc.), each step has resulted in a more complex state of the electricity market (see [
2] for a detailed discussion). No doubt, contemporary electricity markets form a complex network of zonal/regional/national exchanges, each with its own specificities and regulations.
The developments mentioned above have infused special properties to electricity prices. A typical price series is characterized by volatility, periodicity, spikes, negative values and long memory (persistence) [
3,
4]. The latter property-which receives special attention in this study-refers to the fact that price autocorrelation decays slowly with the time distance between two observations [
5,
6]. The complex behavior of power prices, originating from the very nature of the commodity and the design of power markets, makes it difficult to derive accurate forecasts both in the short and medium term. The participants of the electricity wholesale market are particularly concerned about these complexities. As Joskow [
7] claims, utilities can experience huge financial losses in periods of excessive price volatility and spikes. An example is the California electricity power crisis in 2000–2001, during which wholesale electricity prices climbed to USD 300/MWh (almost ten times higher than where they were in previous years) but retail prices remained at the same level. Understanding the power price dynamics becomes of paramount importance for determining the optimal participation strategy in an electricity market and managing price risk.
The purpose of this study is to estimate fundamental pricing laws in six European day-ahead electricity markets. We investigate the extent at which temporal price variations can be attributed to shifts in two fundamental indices of power markets: the predicted load and the renewable energy (RE) generation prognosis. The rest of the text is structured as follows:
Section 2 reviews existing literature on electricity price modelling, with a focus on fundamental valuation.
Section 3 states the purpose and the contribution of the study.
Section 4 describes the modelling techniques and
Section 5 presents empirical results.
Section 6 concludes the study and discusses directions for future research.
2. Literature Review
According to Weron [
8], there are two main communities of researchers interested in modelling electricity prices (electrical engineers and statisticians) but a plethora of approaches. Researchers have tried to categorize published studies into two literature streams. Niimura [
9] reviewed more than 100 published papers and tagged them as either simulation or statistical/econometric studies. Aggarwal et al. [
10] evaluated the practical relevance of a rich group of simulation models and statistical techniques (moving average, regression analysis, artificial intelligence models) for the analysis of electricity markets. They argue that there is no technique that clearly dominates others in terms of faithfully reproducing the statistical properties of power prices and providing accurate forecasts.
In the statistical literature, there is a variety of model specifications that promise forecasting superiority. Contreras et al. [
11] apply ARIMA techniques to hourly price data from the Spanish and the Californian power market and report an average forecasting error of 10% and 5%, respectively. A seasonal ARIMAX approach to the modelling of Nordool prices is also presented in Kristiansen [
12]. Using data from the Californian electricity market, Knittel and Roberts [
13] employ a combined ARMA model (with seasonal indicators) for the conditional mean and an EGARCH parametrization for the conditional variance. They claim that an improvement of the forecasting performance is not possible without explicitly considering some stylized facts of power prices, such as volatility clustering and long-range dependence. An interesting additional empirical property that is highlighted in the aforementioned paper is the
inverse leverage effect, a term which describes the higher responsiveness of price volatility to a positive price shock.
Many researchers advocate fundamental valuation analysis, i.e., the use of market variables or weather indicators to explain the properties of price time series. According to Weron [
8], this requirement can be met in practice by supplementing AR models with “exogenous” variables, such as load, ambient temperature, generation fuel prices, the value of CO
2 allowance rights, etc. (see also [
1,
12,
14]). Woo et al. [
15] employ an iterated SUR model to quantify the solar and wind merit-order effect in regional (day-ahead and real-time) Californian markets. Macedo et al. [
16] provide empirical evidence for the wind merit-order effect in a Swedish bidding zone (SE3-BZ), using a mixture of seasonal ARMA and GARCH modelling techniques. Adopting a similar modelling approach, Papaioannou et al. [
17] measure the impact of fundamental drivers under the recent regulatory reforms in the Greek day-ahead market. Afanasyev et al. [
18], using data from two pricing zones of the Russian market and the English APX exchange, investigate the responsiveness of electricity price to three fundamental factors (load, coal/natural gas price). Employing a flexible specification univariate modelling framework, they conclude that price responsiveness to fundamentals is time dependent. In all markets, the coal and the natural gas supply cost shapes the medium- or long-term course of power prices, but load can also cause significant variations in the short run; particularly in the UK market and in one of the two Russian pricing zones (European Russia and Ural).
De Menezes et al. [
19] investigate the convergence of European electricity prices and long-run linkages with the value of the CO
2 emission rights (obtained from the EU Emissions Trading System) and other fossil fuels (coal prices from the API2 Coal and natural gas prices from the UK NBP Natural Gas). Using recent daily data from the English, Nordic and French electricity market, they detect a cointegrating relationship between electricity price and generation fuel cost in the UK market, while in France and Scandinavia this long-run linkage is only observed with price developments in adjacent interconnected markets. Collecting hourly data from the Spanish day-ahead market, Ballester and Furió [
20] analyze the impact of renewable energy generation on electricity price. They conclude that increasing levels of clean energy supply are typically associated with a significant reduction in prices and a lower probability of observing positive spikes. Still, in periods of large renewable energy in-feed, prices become more volatile. Another example of a fundamental approach to power valuation is the work of Vahviläinen and Pyykkönen [
21]. They use a rich set of endogenous and exogenous indicators (nuclear power production, unregulated hydro-generation, temperature dependent components, precipitation, etc), which affect both the demand and supply side of the Nordic market and potentially drive monthly price changes. Finally, Karakatsani and Bunn [
1] employ regime-switching regression techniques to perform a fundamental analysis of half-hourly British electricity prices. They conclude that the inclusion of market indicators improves the predictive ability of their model.
A theoretical justification of the fundamental approach to electricity price modelling is given by Geman and Roncoroni [
22]. They argue that fundamentals determine the equilibrium level of electricity prices. Still, the equilibrium is not static but varies in response to the course of fundamental factors, which is also shaped by unanticipated events. This implies that many of the proclaimed causal relationships between prices and fundamentals are often the result of latent (unobserved) factors that influence both dependent and explanatory variables.
The spurt increase in computing power has given many researchers the opportunity to investigate more complex power pricing laws using multivariate modelling paradigms. In the context of day-ahead electricity markets, multivariate models are not just an alternative approach but often the right way to proceed with the modelling of hourly price series. Participants in the day-ahead market set the price for power delivery in each of the 24 hourly frames of the following trading day
simultaneously based on information collected up to the gate closing time. This discontinuity in the trading process invalidates many of the univariate paradigms that merge hourly prices in a single time series (see also [
23,
24,
25] for a discussion). In fact, in the case of the German EEX market, Cuaresma et al. [
26] report an improvement in the predictive ability of ARMA specifications if a separate model is used for each hourly trading session. Similar evidence in favor of the multivariate treatment of hourly prices is provided by Weron and Misiorek [
14] in the context of the Californian electricity market.
3. Purpose of the Study
The purpose of this study is to quantify the impact of load and renewable generation on electricity prices across several European day-ahead markets (Belgian, French, Italian, Polish, Portuguese and Spanish). These markets reflect the diversity of Continental power systems, in terms of generation technologies, grid connectivity and load. The assessment of the importance of the previously mentioned fundamental indicators is conducted for each hourly trading session, in accordance with how information flows into electricity markets. The literature reviewed in the previous section stresses the need for a multivariate (system) approach to the modelling of electricity prices. In this spirit, recent studies ([
27,
28,
29]) advocate the use of panel data models, which mitigate many of the weaknesses of the univariate specifications and other multivariate paradigms (such as vector autoregressions). Panel data models can vary the pricing relationship between hourly trading sessions (this is the so-called
slope heterogeneity property) by using regressors that are pertinent to each session (
hour-specific regressors). Recent developments in panel data techniques, such as the common correlated effects estimator of Pesaran [
30] and its refinements proposed by Ergemen [
31] and Thomaidis and Biskas [
29], make it possible to consistently estimate price responsiveness to fundamental variates, taking also into account unobserved cross-correlation, long-range dependance and short-memory dynamics in innovations. Although the focus of interest may be the derivation of empirical fundamental pricing laws, all “secondary” aspects of the system dynamics can adversely affect the above task, often leading to inconsistent estimators for the slope coefficients. The panel data model employed in this study (assuming long memory and interactive fixed effects) manages to deliver consistent estimates under such a rich data-generating processes. It also allows us to investigate possible equilibrium relationships between price and fundamentals and measure variations in the cointegration strength between peak and off-peak hours.
This paper is an empirical investigation of fundamental pricing laws across European markets. The selected markets differ not only in terms of the total supply capacity but also in their generation mix. Later in this paper, we attempt to explain the estimated price elasticities to various fundamental drivers on the grounds of the involved generation technologies and their relative share in the total energy supply. Other studies adopt a similar design ([
28,
29]) but use older data and focus on a single market. Afanasyev et al. [
18] also examine pricing laws in three European markets employing univariate modelling techniques, with all the risks mentioned earlier in this paper. The methodological weaknesses of the univariate approach are also likely to explain the conflicting empirical evidence presented in de Menezes et al. [
19] as to the existence of cointegrating relationships. Similarly to Ballester and Furió [
20], we study the relationship between renewable generation and electricity prices. Still, our study is an improvement over [
20], as it takes into account more markets (on top of the Spanish), adopts a multivariate framework and considers a second fundamental driver (load) to identify more accurately the sources of price fluctuations.
4. Methodology
In our study, we apply an heterogeneous panel data model with common correlated effects to unveil systematic determinants of electricity prices in each national market (Due to space restrictions, we are confined to a high-level (operational) description of the core methodology. Readers interested in more mathematical details can consult references [
29,
31]). In the style of [
28,
29,
31], we assume that hourly prices follow the law:
where
denotes the log-price of the contract delivering power in hour
of the operational day
,
is a
vector of deterministic variables,
is a
vector of individual regressors and
is a
vector of common unobserved factors. Two individual regressors of potentially high explanatory power are employed in this study: the forecasted load and the renewable generation prognosis pertaining to trading session
of each national market. For the shake of uniformity, we also use the logarithms of the above variables as individual regressors. Further details are given in the empirical section. Our model assumes the following data-generating process for individual regressors:
The vector is exposed to the same deterministic (observed) and latent (unobserved) common factors. In the terminology of panel data econometrics, the term captures individual fixed effects, whereas is the vector of slope coefficients, which measure how sensitive prices are to variations in load and renewable generation prognosis. Since both the dependent variable and individual regressors enter in logarithms, each slope coefficient is perceived as the price elasticity to the fundamental covariate . Coefficients and other model parameters are estimated separately for each electricity market.
As Equations (2) and (4) show, our model assumes the existence of common latent effects
in the innovations of price and individual regressors (denoted by
and
, respectively). Additionally, we postulate that the vector
of system errors (shocks) is characterized by both contemporaneous and lagged cross-dependences, which can be sufficiently modelled using a VAR(
) structure (see [
29,
31] for details). Another interesting aspect of the dynamics implied by Equations (1)–(4) is the fact that system shocks do not die out instantly but have a long-lasting effect on prices and hour-specific regressors. This is modelled using fractional integration techniques (see [
6] for a thorough discussion). A process
is said to be fractionally integrated of order
, if
for a stationary ARMA process
of finite order (
is the lag operator). In empirical applications, we often use the truncated fractional difference operator
, which can be expressed through ratios of Gamma functions:
It can be shown that if , is mean and covariance stationary, while if , the process retains the mean-reversion property but becomes non-stationary in covariance. We assume that (after removing deterministic effects) variables , , and are fractionally integrated of orders , and , respectively. Coefficient is of particular interest in our study, as it determines, among other things, the strength of coupling between and . This can be perceived as the tendency of the price to revert to a notional fundamental level dictated by load and renewable generation. The intuition is that if (corrected for common latent and deterministic effects) has a memory length well above , much of its long-range dependence can be attributed to slow-cycling fundamentals. In this case, and are considered fractionally cointegrated.
Τhe confluence of interactive fixed effects, long-memory and cross-dependence in system innovations makes common regression techniques (such as OLS) inappropriate for the estimation of fundamental pricing relationships. In particular, OLS would result in inconsistent estimators for the true price elasticities
. To avoid the adverse consequences of enriching the model specification, we applied the Ergemen’s [
31] version of the common correlated effects estimator, originally proposed in [
30,
32].
5. Empirical Study
5.1. Data
Sample data include hourly quotes of electricity prices, forecasted load, and predicted renewable production for six day-ahead European electricity markets (Italian, Belgian, Portuguese, French, Spanish and Polish). Our data source is the Transparency Platform (
https://transparency.entsoe.eu/dashboard/show, (accessed on 10 April 2021)) of the European Network of Transmission System Operators for Electricity (ENTSO-E) (The structure of the Italian market is not fully represented in our dataset. Even though generating units are remunerated in the zonal prices, load representatives buy energy at the National Single Price (called PUN), which is defined as a weighted average over all Italian bidding areas. (Source:
https://www.mercatoelettrico.org/En/Mercati/MercatoElettrico/MPE.aspx, (accessed on 5 April 2021)). The Transparency Platform of ENTSO-E only reports zonal prices, not the PUN. In our study, we solely used data for Southern Italy that has a generation mix similar to other markets in discourse, as opposed to Northern Italy that has hardly any wind generating capacity. In this bidding zone, hydroelectric and solar power generators are the two main suppliers of renewable energy. Source:
https://download.terna.it/terna/PROVISIONAL%20DATA%20OF%20THE%20ITALIAN%20ELECTRICITY%20SYSTEM_2019_EN_WEB_8d7f8db3334aef3.pdf (accessed on 7 April 2021)). Sample observations span the period 01/01/2015 to 31/12/2020. The Transparency Platform stacks hourly quotes on top of each other, so raw data had to be arranged in panels to meet the requirements of our methodology. After the removal of missing and non-positive values, we ended up with
daily observations in the time dimension. The cross-sectional dimension is
.
Panel data models were estimated on a national basis. In each market, the dependent variable is the log-price of electricity for delivery at hour of the following operational day (variable code [12.1.D] in the ENTSO-E platform). Prices are measured in Euros per MWh. The right-hand side of the equation for the panel unit includes individual regressors. These are the D-1 log-forecasts of the
Hourly total load, measured in MWh (variable code [6.1.B]);
Hourly wind and solar generation, also measured in MWh (variable code [14.1.D]).
Day-ahead prices are released at D-1 at a different local time (this is e.g., 12:00 in France, 14:00 in Belgium and 14:30 in Poland (
https://ec.europa.eu/energy/sites/default/files/documents/overview_of_european_electricity_markets.pdf, (accessed on 6 April 2021)). In the estimation of our models, the vector
of deterministic components is composed of one holiday, eleven monthly (February to December) and six weekday (Monday to Saturday) dummy variables (the holiday dummy is constructed separately for each country according to the list of national holidays).
5.2. Preliminary Analysis
All countries share a similar intraday (forecasted) load profile, which is briefly presented here due to space limitations. Typically, the load peaks in the afternoon (between hourly sessions H14 and H15) and early at night (between H20 and H21), with its lowest value attained in early morning hours (H04–H05). The predicted renewable generation intraday profile is also common amongst all countries. The renewable energy in-feed is maximized in the afternoon (between H14 and H15), as the solar energy production reaches its peak, levels at night (H22–H03) and hits its lowest point between H04 and H06, when solar power stations hardly produce any energy and wind blows mildly. The Polish and the Portuguese market deviate from the norm. Both ENTSO-E and the Polish transmission system operator (PSE) do not report the forecasted and the actual solar generation for Poland until 10 April 2020, which results in reduced levels of renewable energy production between H08 and H14. On the contrary, the renewable energy in-feed increases at night (between H22 and H03), which is mainly due to the operation of wind farms. In the case of Portugal, the renewable generation prognosis has two local maxima (located at H16 and H22). This feature may be attributed to the increasing share of wind power generation. In 2020, the wind energy supply in Portugal accounted for 24.43% of the total electricity generation [
33].
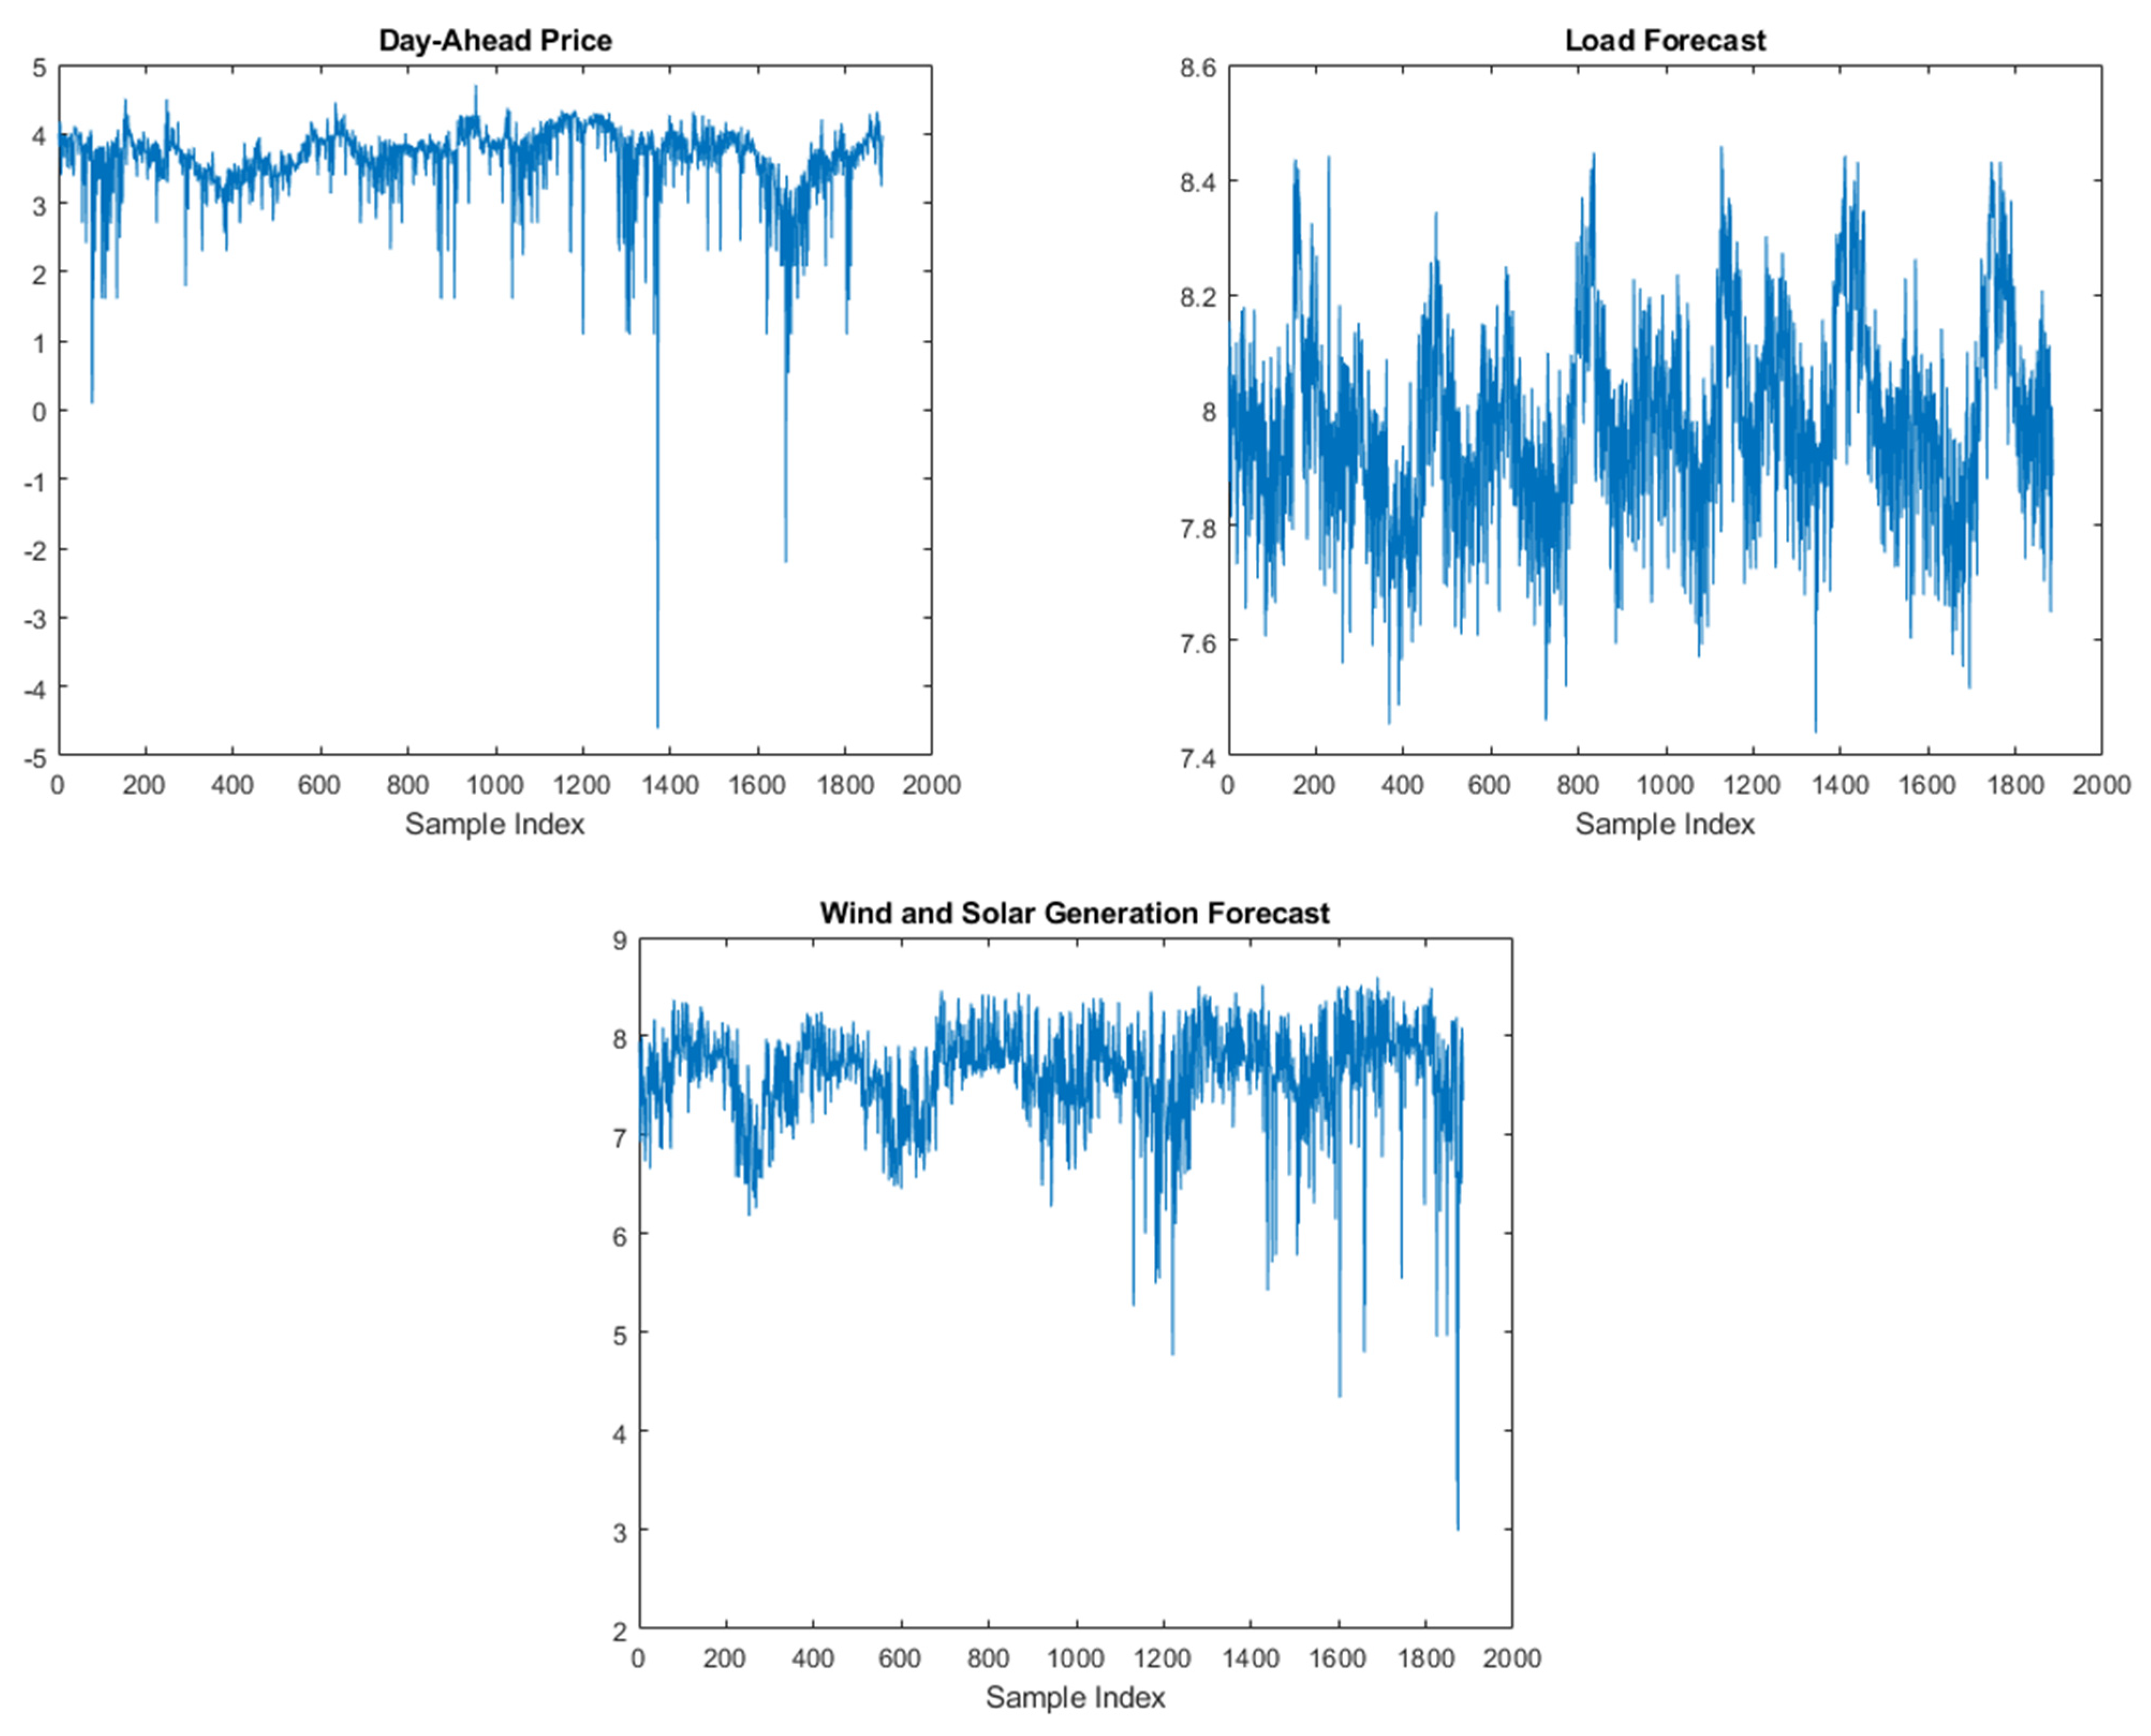
Figure 1 shows the time series of price, load and renewable generation for the H15 trading session of the Italian market. A similar time evolution of the basic model variables is observed across all markets and reference hours. The displayed time series have a clear seasonal signature. The price exhibits way more outliers, although most of the quotes range from 0.2 to 4.5 (in logarithmic scale). Load forecasts show lower dispersion, varying between 7.5 and 8.4, while the typical logarithmic range of renewable generation prognosis is 3.0–8.5.
5.3. Fractional Integration and Persistence
A preliminary analysis of model residuals revealed substantial remaining autocorrelation in all reference hours and markets. In many cases, significant sample autocorrelations extend up to the 14th lag. In response to this finding, we assumed that system shocks follow a vector autoregressive process of orders in all markets except France, where a more parsimonious VAR() filter proved successful in removing serial and lagged cross-correlation in system errors.
In
Section 4, we briefly reviewed the concepts of fractional integration and cointegration. In this section, we empirically assess the persistence of electricity prices across the selected European markets. As in [
29], we compared the estimates of
and
to indicate whether the chosen covariates (load and renewable generation) are responsible for the drifting behaviour of power prices (For the estimation of
, we applied the conditional-sum of squares technique to the seasonally adjusted and defactored power prices. For details, see [
29],
Section 5.4. As the panel model employed in this study does not include common stochastic regressors, we were able to approximate the latent factor structure using cross-sectional averages of individual regressors and the dependent variable.). A large value of
−
is evidence for the existence of a
rational stochastic trend in price (i.e., price drifts because it follows slow-cycling fundamentals).
The estimated memory length coefficients of (seasonally adjusted and defactored) price series ranged between 0.92 and 1.08 across all hours and countries, being indicative of a non-stationarity (both in mean and covariance) process. Following Ergemen et al. [
28] and Thomaidis and Biskas [
29], we also calculated the reduction in the estimated price persistence levels (i.e., the difference
). Through bootstrapping, we were able to calculate confidence intervals for the estimated cointegration gap and thus gauge its statistical significance.
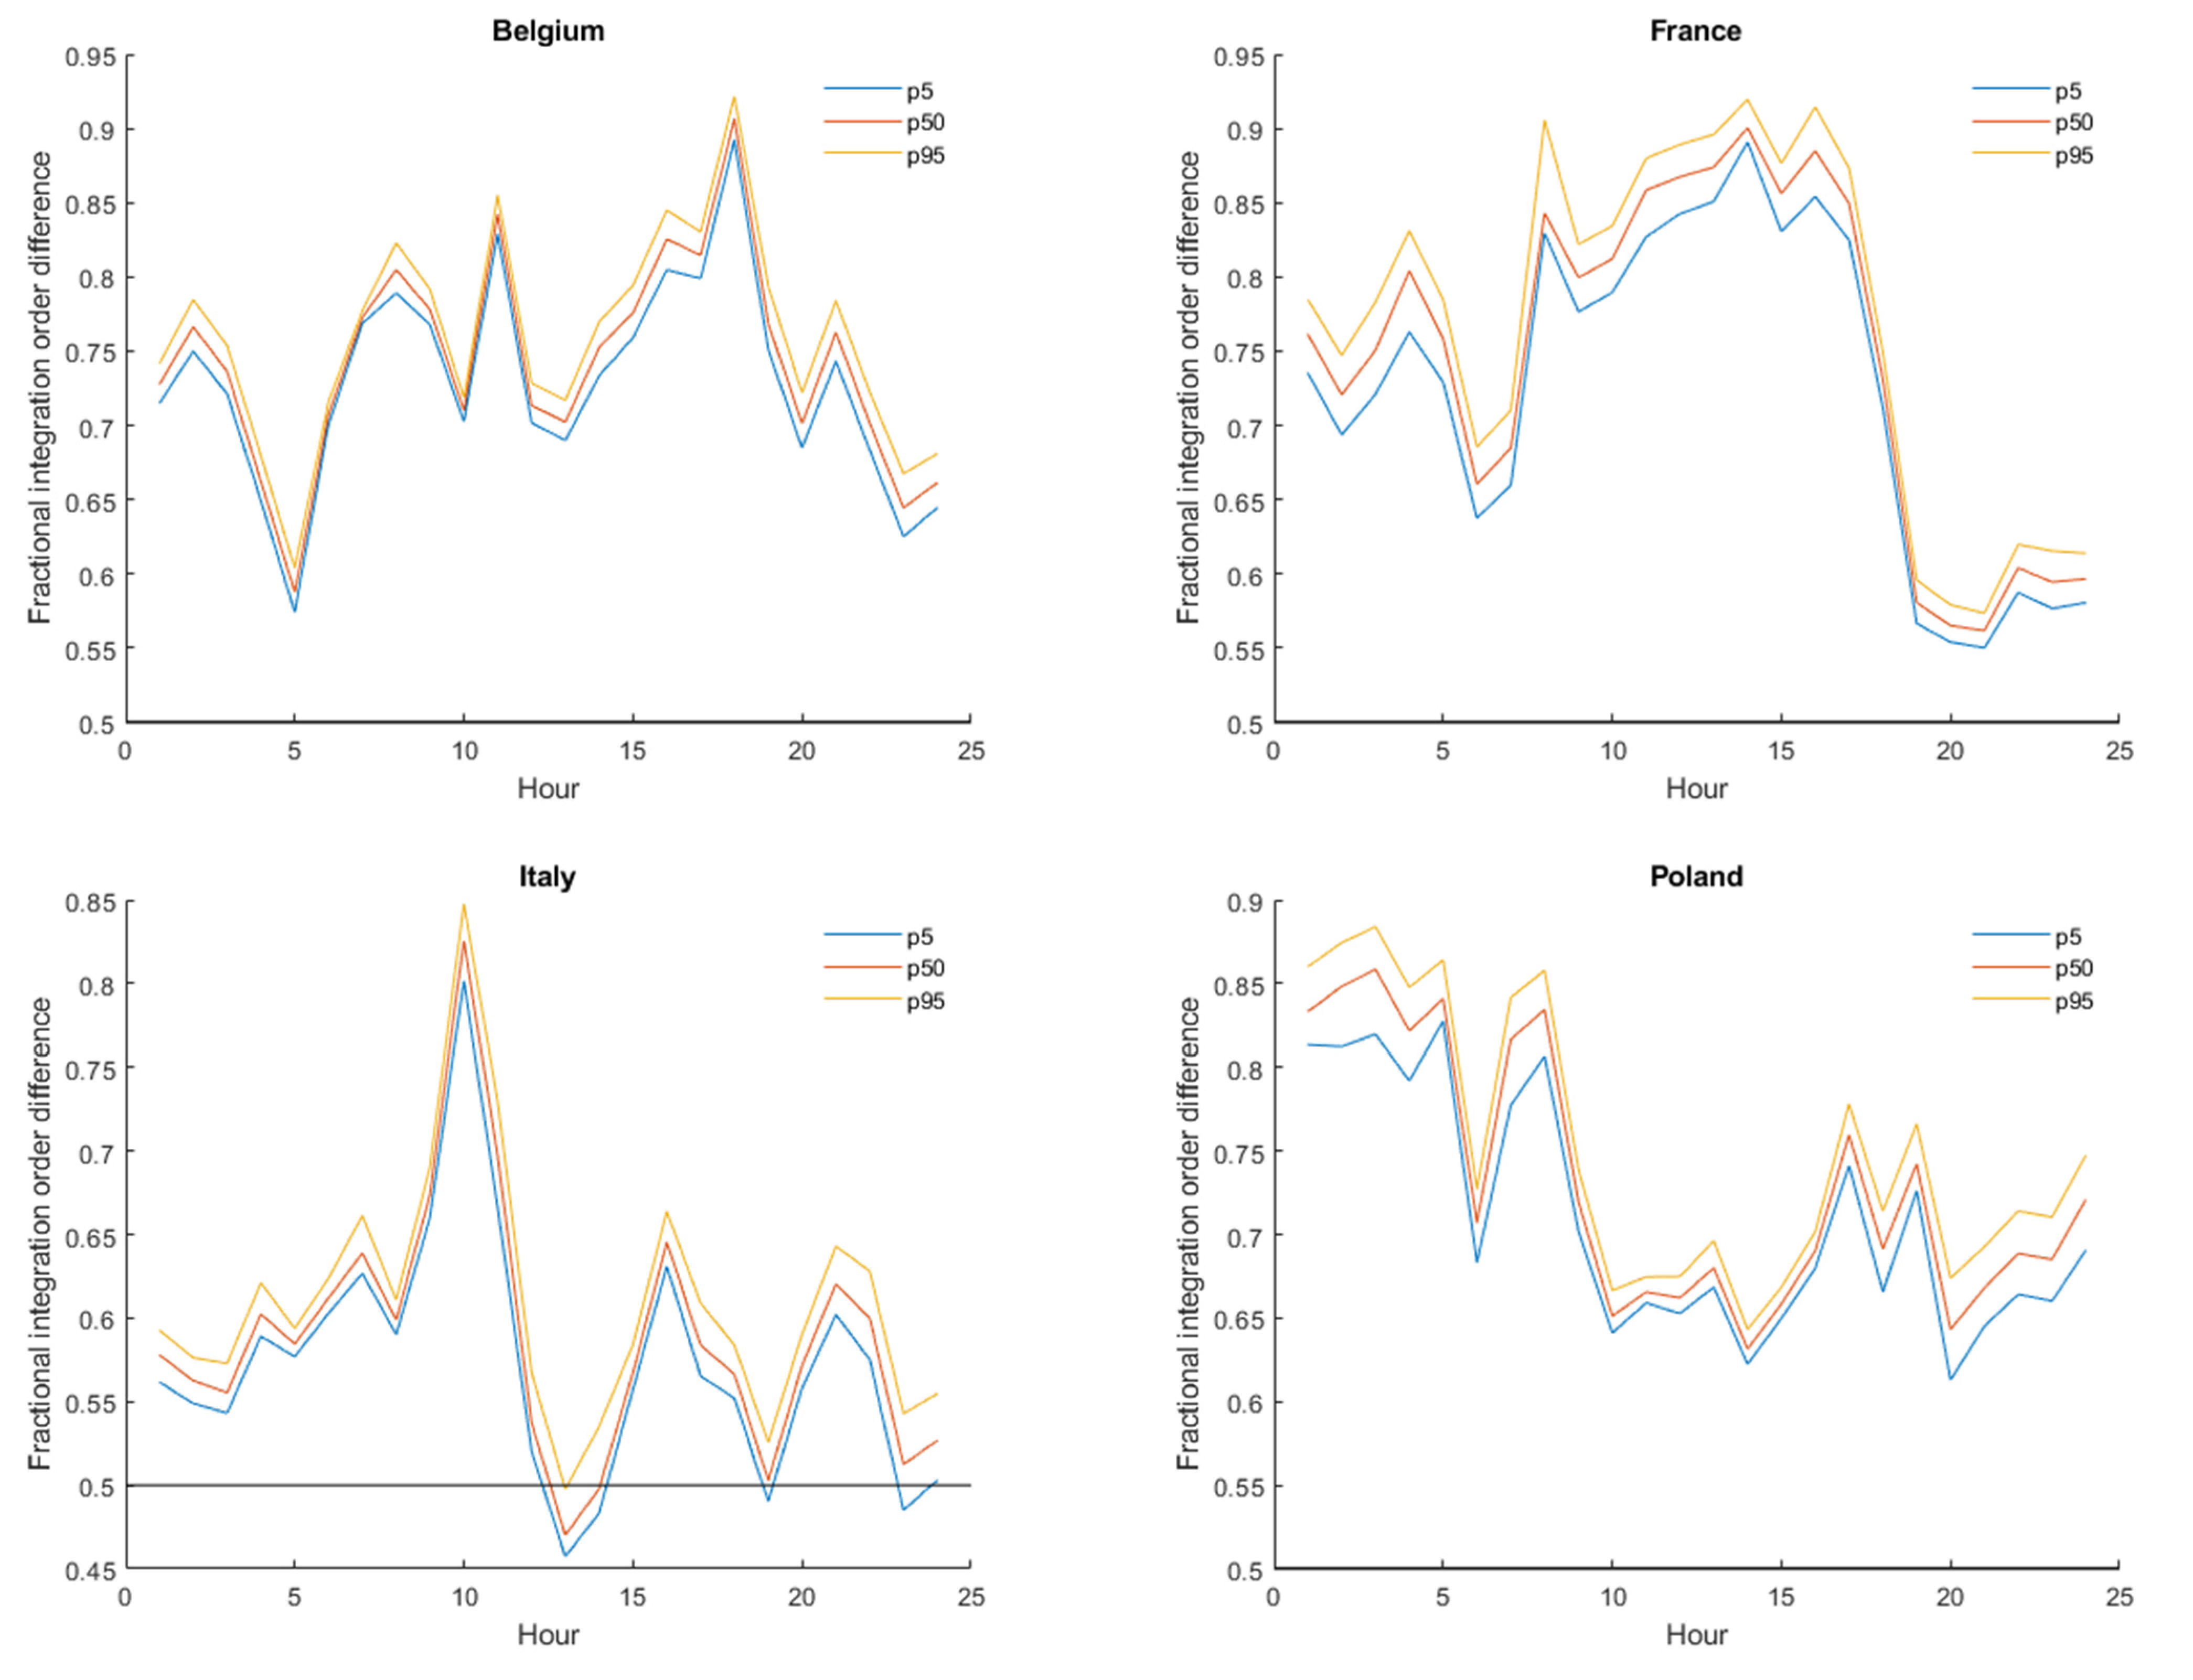
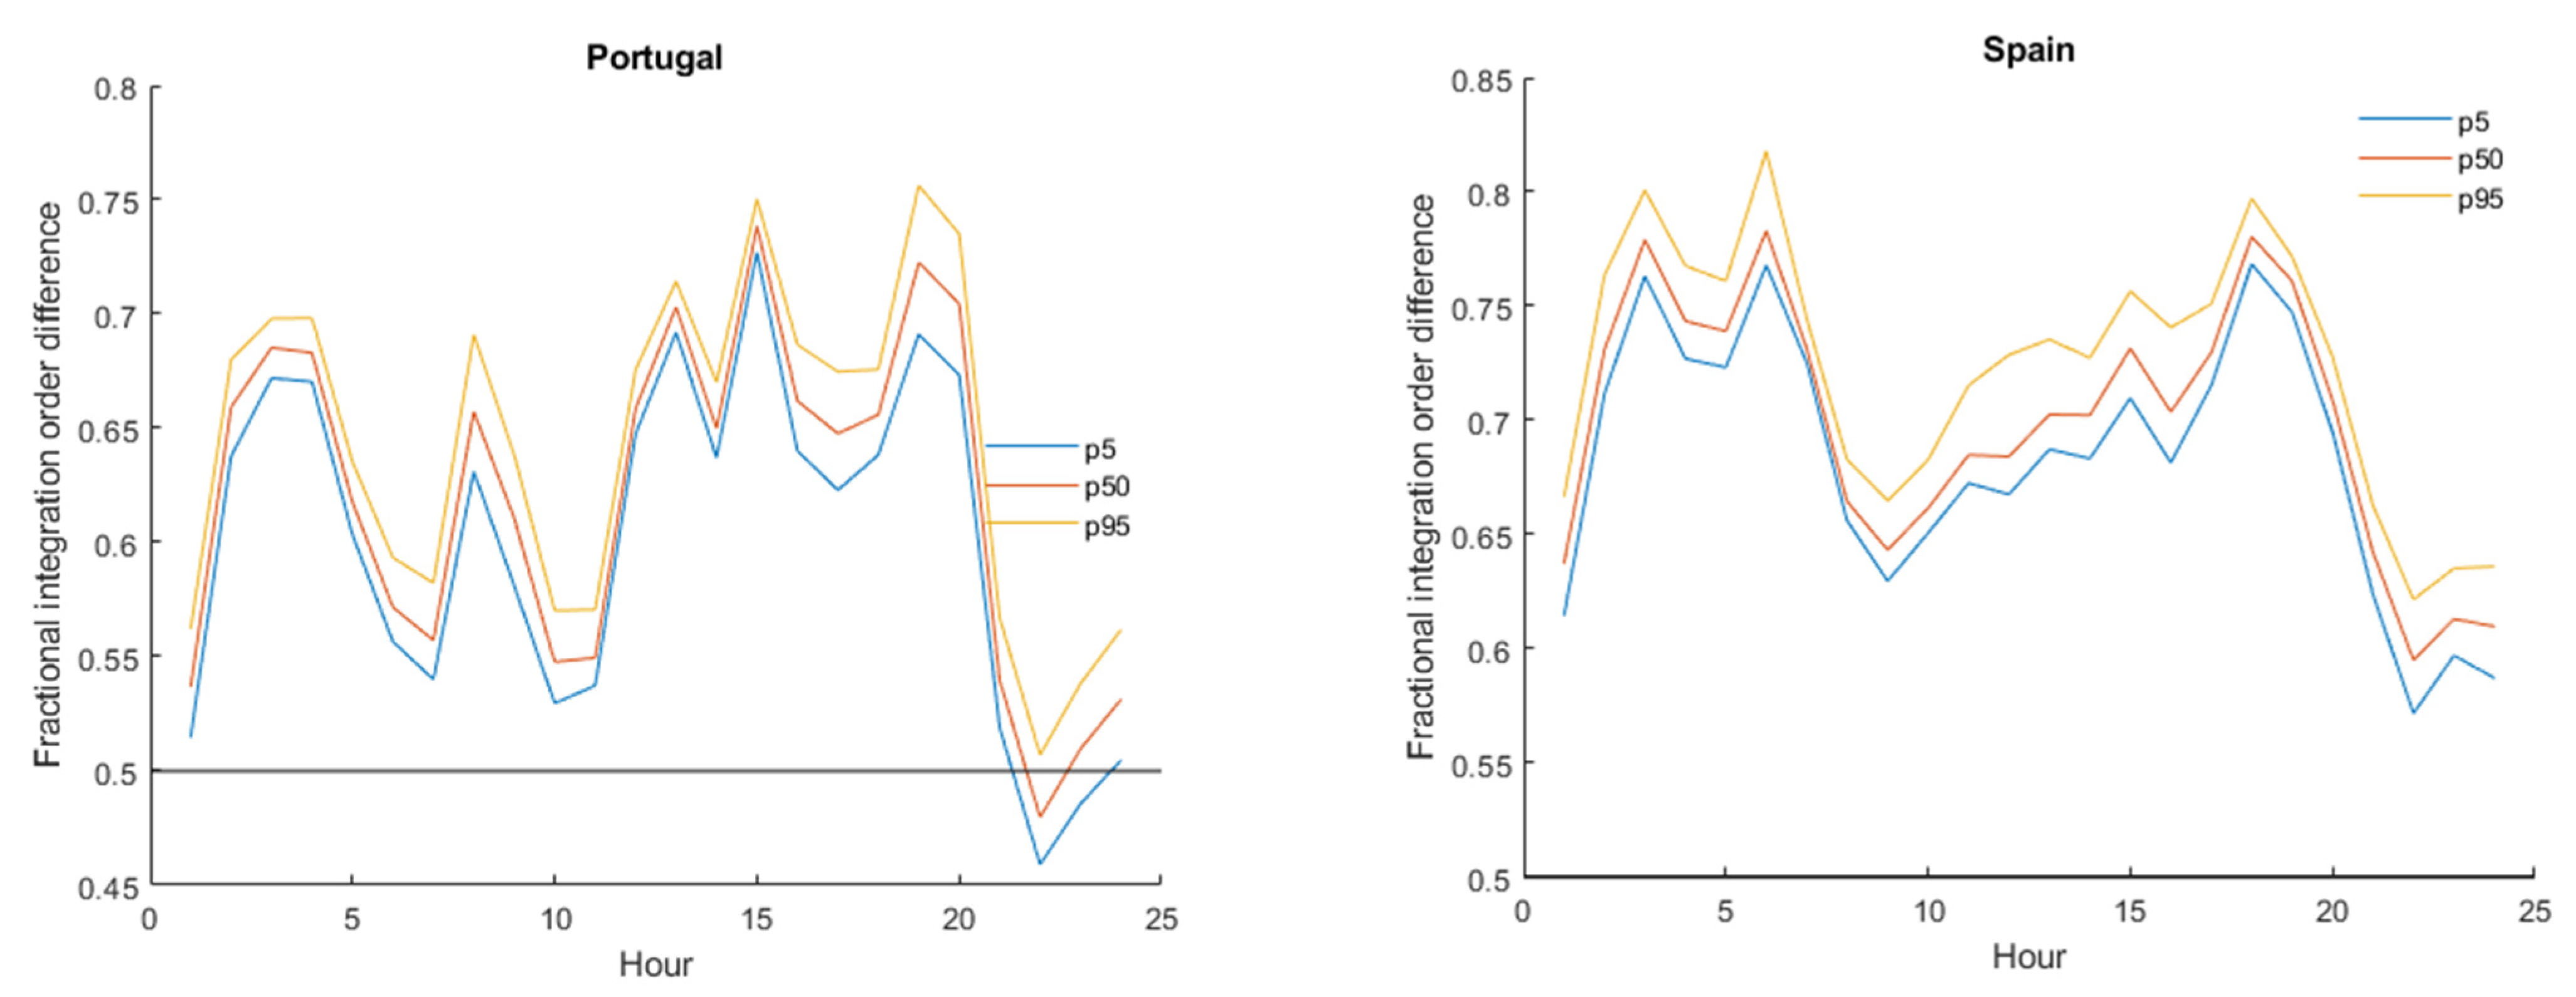
Figure 2 shows the 5th, 50th and the 95th percentile of the cointegration gap bootstrap distribution across reference hours and countries. Overall, our results are supportive of the existence of fractional cointegration between prices and fundamental covariates. In all graphs, the intraday curve of the 5th percentile lies above 0, implying a significant reduction in price persistence when prices are corrected for time variations in load and renewable generation. The biggest gap is typically observed in working hours, while for near-midnight and early morning prices, the reduction in the persistence levels is less prominent. Notably, in many cases, the estimated
exceeds 0.5, which allows us to conclude that the non-stationarity of prices is largely a property inherited by fundamentals (i.e., fundamental shocks are persistent). This holds true for all Belgian power delivery contracts and Italian morning contracts. After removing load or renewable generation cycles, prices become mean reverting with bounded variance.
5.4. Price Elasticities
Table 1 shows the estimated slope coefficients for the hourly regressors of our model (load forecast and RE generation prognosis). The symbols *, **, and *** indicate statistical significance at 10%, 5% and 1%, respectively. The level of significance of each estimate was determined through a resampling scheme (following a design similar to [
29]). Overall, results are consistent with economic theory and empirical findings. In almost all power delivery contracts, load is positively correlated with price. In some countries, load elasticity estimates have a mixed sign, although negative estimates are not statistically significant. This result can be attributed to the effect of outliers, which tend to “pull” slope coefficient estimates in the negative segment of the real line. Still, these extreme values do not show up in repeated samplings, hence the insignificance of the estimate. The estimates for the renewable generation elasticity are stably negative across all hours and countries. In all but two hourly power delivery contracts, the hypothesis that the true value of the RE slope coefficient is zero is rejected with 95% confidence (in most cases the null hypothesis can be rejected with higher statistical certainty).
The importance of fundamental covariates to the shaping of price varies across markets. In Poland, the average impact of a 1% increase in the load forecast to the hourly electricity price is 0.75%. The full range of significant slope estimates for load is 0.32 to 1.11. On the contrary, an 1% increase in the renewable generation prognosis is expected to drive the hourly electricity price down by 0.07% on average (hourly significant estimates vary between −0.09 and −0.05). In the French market, the average price elasticity to load is much higher (1.79), although significant slope estimates vary from 0.87 to 4.78 across trading hours.
We also find that a 1% increase in the renewable energy supply (uniformly across all trading hours) is expected to reduce the French electricity price by 0.17% on average. Significant estimates for the renewable generation elasticity vary between −0.50 and −0.07. The Spanish market has an average price elasticity to load equal to 1.21 (the min and max of the significant load coefficient estimates is 0.75 and 2.22, respectively) while the renewable energy coefficients range from −0.33 to −0.12, with an average of −0.21.
The estimates of the load slope coefficients are indicative of a complex pricing relationship in particular hours and/or countries. Theory dictates that the sensitivity of price to load variations should increase when electricity demand is high. In this system condition, electricity demand crosses the energy offer curve at a steep point, dominated by units of high marginal generation cost.
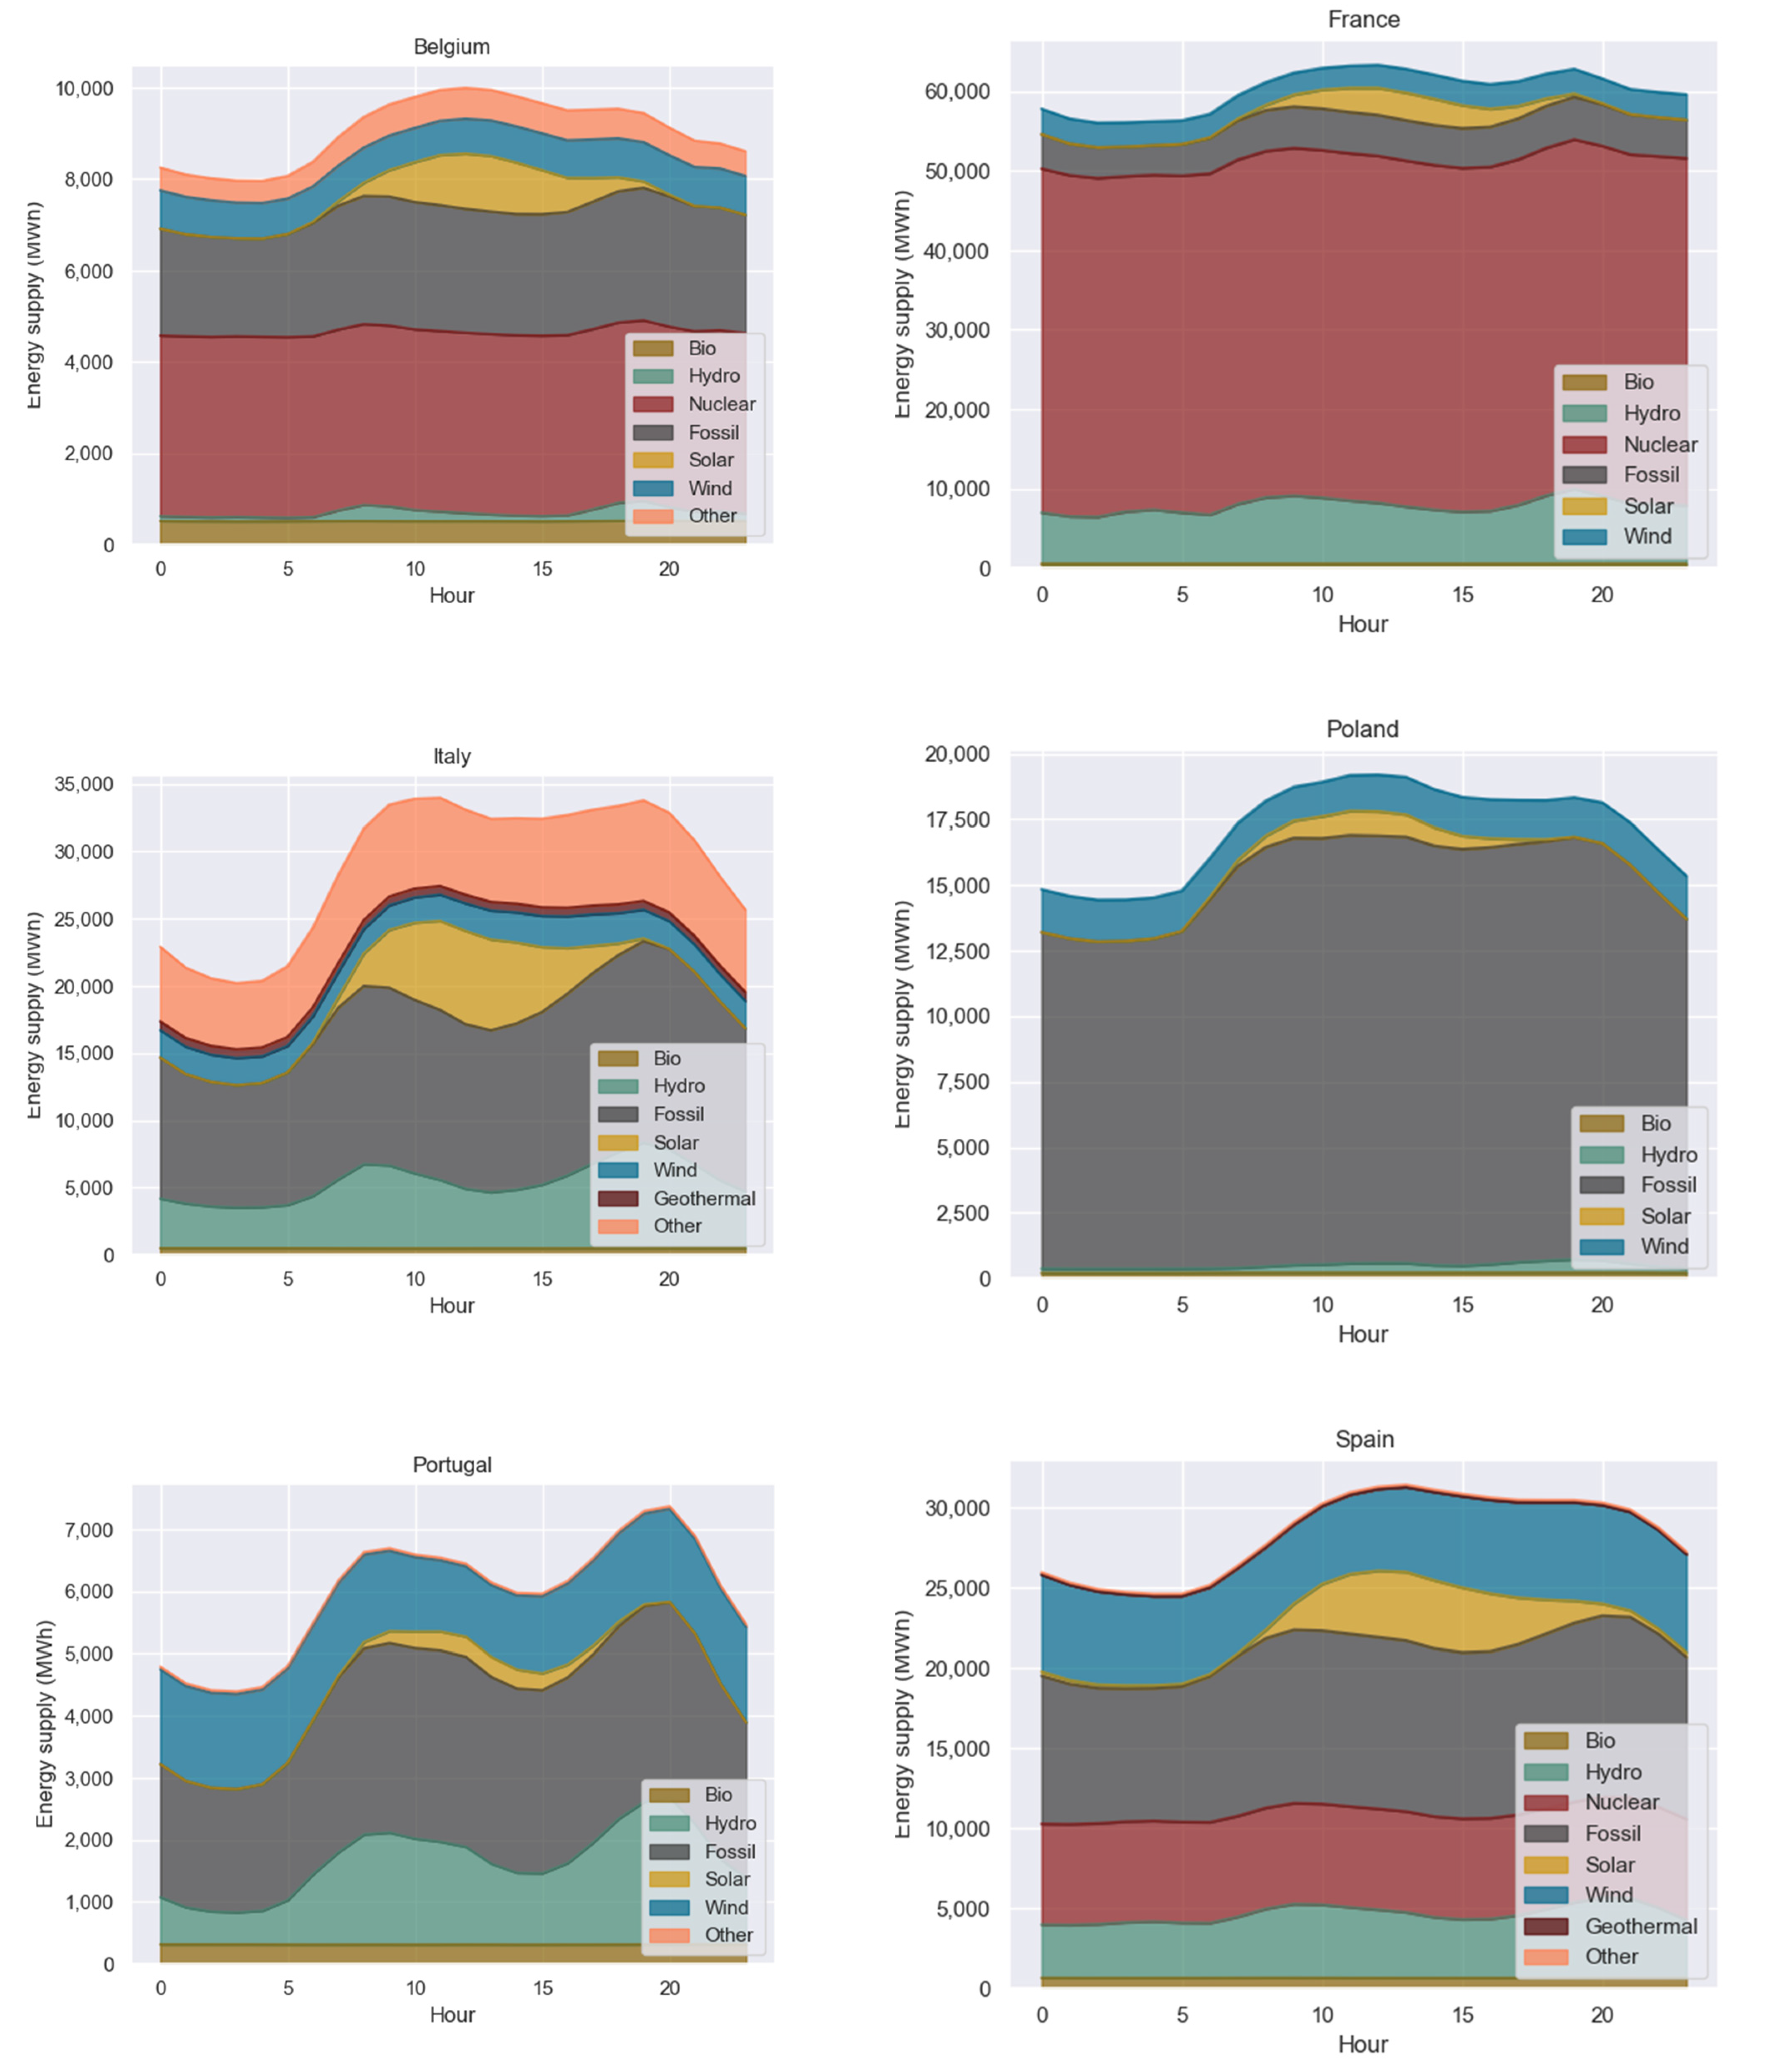
Figure 3 depicts each country’s generation mix per power delivery hour. The vertical space between two consecutive lines shows the average share of a generation technology in the hourly energy supply. Raw data were obtained from the ENTSO-E platform (Aggregated Generation per Type, codes 16.1.B and C). As markets are in continuous balance, the top line in each graph also reflects the intraday profile of (actual) load. In the Spanish market, load elasticity estimates are relatively elevated in sessions H15–H19 (ranging from 1.28 to 2.22). As the bottom-right panel of
Figure 3 shows, the demand for electricity in these hours is also high. In the French market, exceptionally large estimates for the load coefficient are reported for H13–H15, which are also peak hours according to the top-right panel of
Figure 3.
Table 1 shows that in most countries the intraday curve of load elasticities has two local maxima that are not necessarily located in hours of increased demand.
As opposed to load, the intraday pattern of price elasticity to renewable generation varies significantly across countries.
Table 1 shows that in Belgium and France the merit-order-effect is more notable in the afternoon (H13–H15), while in other countries large (absolute) values of renewable generation elasticity are observed later (H16–H17) or earlier (H02–H05) in the day. These variations can be explained by the intraday generation shares of wind and solar power stations in each country.
Figure 3 illustrates that solar power generation is almost absent in all countries early in the morning and late at night. The contribution of hydroelectric energy is also relatively low in these trading sessions, while nuclear, fossil-fuel-burning and wind power plants become the main sources of energy. The flat proportion of wind energy in the generation mix is significantly larger in Portugal/Spain compared to France/Italy. Solar energy is underrated in the Portuguese generation mix. This is also the case with Poland, but as we pointed out in
Section 5.2, the small share of solar energy production can be attributed to incompleteness of data for this country. Solar energy in Italy, Belgium and Spain occupies a large portion of the average energy supply in daylight hours. Fossil generation fuels play a decisive role in the Polish market and a less important part in the Italian, Portuguese and Spanish generation mix. Their contribution is much lower in Belgium and France, where the nuclear energy is the dominant source across all hourly sessions (The ENTSO-E Transparency platform does not provide further information on the source tagged as “Other” in the Italian generation mix. We conjecture that it refers to imported energy. TERNA reports that in 2019 domestic power generation covered 88% of the annual demand, with the remaining 12% was met by imports. See the ”2019 Provisional Data On Operation Of The Italian Electricity System” available from
https://download.terna.it/terna/PROVISIONAL%20DATA%20OF%20THE%20ITALIAN%20ELECTRICITY%-20SYSTEM_2019_EN_WEB_8d7f8db3334aef3.pdf (accessed on 7 April 2021)). A closer inspection of
Table 1 estimates reveals that load and RE generation elasticities typically attain their maxima in adjacent trading sessions. Representative of this pattern is the H13 power delivery contract of the French market. The price of this contract is exceptionally elastic to load (the slope coefficient estimate is 3.17) but also very reactive to RE generation variations (the elasticity estimate is −0.50). In the H13 trading session of the French market, shifts in the forecasted load can have a high impact on price, unless more renewable energy is fed into the grid. Renewable energy in-feeds tend to shift the supply curve to the right. Even if demand is high, it will cross the power supply curve at a less steep point resulting in a lower (net) price disturbance. A similar “dipolar” profile of elasticities is observed in the Belgian and the Spanish market, although large absolute values for the slope coefficients do not always coincide with peaking load
6. Discussion and Future Research
The aim of this study was to estimate and assess the importance of fundamental price drivers in several European day-ahead electricity markets (Belgian, French, Italian, Polish, Portuguese and Spanish). Among the many possible indicators that determine the evolution of hourly prices, we examined the load forecast and the predicted in-feed from wind and solar power plants. Applying new panel data techniques that take into account slope heterogeneity and common unobserved effects, we found that the renewable generation prognosis has a negative impact on hourly prices, uniformly across all power delivery hours and countries. This finding is supportive of the merit-order-effect hypothesis, which has also been a topic of research in other studies on electricity markets. The impact of the load forecast is more concentrated; load seems to be a decisive determinant of electricity price in selected hourly trading sessions. Experimental results show that in many markets renewable energy supply can largely offset the load elasticity thus reducing price risk.
An additional objective of this study was to explore the long-memory property of electricity prices. We found that the price of contracts for power delivery in all hours of the subsequent day and across all selected markets is very persistent. The degree of persistence remains high (similar to random walk) even if one purges seasonality and unobserved commonality. In many contracts, non-stationarity can be attributed to swings in the postulated fundamental drivers; price residuals appear to be mean-reverting and have bounded unconditional variance. This finding may be indicative of the inability of market players to exert power in these trading sessions, as price shocks do not seem to have a long-lasting effect. Still the mean-reversion rate varies significantly with the reference hour, which does not allow us to draw safe conclusions on the degree of market competitiveness.
Our study attempts to highlight the forces that shape the intraday price curve dynamics, thus assisting in the development of more efficient strategies for managing market risks. The unique characteristics of electricity prices have motivated market participants to seek hedging strategies that offer protection against power price shifts. In the light of a merit-order effect, these strategies need to be extended to the control of volumetric risk (associated with fluctuations in the output of variable generators), which until now has only been the concern of renewable energy traders.
There are several directions at which our study can be extended in the future. The recent COVID-19 pandemic has initiated a literature stream that investigates possible effects on the operation of electricity markets around the globe. No doubt, COVID-19 has caused disruptions in both commercial and industrial activity, altering the patterns of electricity consumption. Ghiani et al. [
34] attempt to quantify the effect of the COVID-19 pandemic on electricity demand in Italy. They claim that although more people have started working from home, the increase in residential consumption could not balance the negative demand shock coming from the lockdown of industries. Their study reports a 37% decrease in electricity consumption (compared to the years preceding the pandemic outbreak) and a parallel 30% reduction in the wholesale electricity price. According to the authors, the observed decline in the wholesale price cannot be solely attributed to the (net) negative demand shock, as during the pandemic the renewable energy generation share has also increased. Santiago et al. [
35], using data from the period 2015–2020, estimated an average reduction of 13.49% in electricity consumption during the COVID-19 pandemic period (the reduction is 14.53% on working days and 10.62% on weekends). The authors also report significant changes in the intraday demand profile. The largest decline has occurred in the evening and morning hours when electricity consumption normally peaks. Agdas and Barooah [
36] present opposite evidence on the effect of the pandemic on the U.S. electricity consumption. Based on power system data from three states (Florida, California and New York) spanning a period of two years (2019 and 2020), they conclude that there is no clear indication of a shift in electricity demand. All in all, the available literature evidence does not firmly suggest that the COVID-19 pandemic has infused a structural break in the electricity markets operation. Yet this constitutes a promising area for future research.


