Article

Characteristics of Pore Structure and Gas Content of the Lower Paleozoic Shale from the Upper Yangtze Plate, South China

1
State Key Laboratory of Coal Resources and Safe Mining, China University of Mining and Technology (Beijing), Beijing 100083, China
2
College of Geoscience and Surveying Engineering, China University of Mining and Technology (Beijing), Beijing 100083, China
3
Key Laboratory of Exploration Technologies for Oil and Gas Resources (Yangtze University), Ministry of Education, College of Resources and Environment, Yangtze University, Wuhan 430100, China
4
College of Geology and Environment, Xi’an University of Science and Technology, Xi’an 710054, China
*
Author to whom correspondence should be addressed.
Energies 2021, 14(22), 7603; https://doi.org/10.3390/en14227603
Submission received: 12 October 2021 / Revised: 8 November 2021 / Accepted: 10 November 2021 / Published: 13 November 2021
(This article belongs to the Special Issue New Challenges in Shale Gas and Oil)

Abstract

:
This study is predominantly about the differences in shale pore structure and the controlling factors of shale gas content between Lower Silurian and Lower Cambrian from the upper Yangtze plate, which are of great significance to the occurrence mechanism of shale gas. The field emission scanning electron microscopy combined with Particles (Pores) and Cracks Analysis System software, CO2/N2 adsorption and the high-pressure mercury injection porosimetry, and methane adsorption were used to investigate characteristics of overall shale pore structure and organic matter pore, heterogeneity and gas content of the Lower Paleozoic in southern Sichuan Basin and northern Guizhou province from the upper Yangtze plate. Results show that porosity and the development of organic matter pores of the Lower Silurian are better than that of the Lower Cambrian, and there are four main types of pore, including interparticle pore, intraparticle pore, organic matter pore and micro-fracture. The micropores of the Lower Cambrian shale provide major pore volume and specific surface areas. In the Lower Silurian shale, there are mesopores besides micropores. Fractal dimensions representing pore structure complexity and heterogeneity gradually increase with the increase in pore volume and specific surface areas. There is a significant positive linear relationship between total organic carbon content and micropores volume and specific surface areas of the Lower Paleozoic shale, and the correlation of the Lower Silurian is more obvious than that of the Lower Cambrian. The plane porosity of organic matter increases with the increase in total organic carbon when it is less than 5%. The plane porosity of organic matter pores is positively correlated with clay minerals content and negatively correlated with brittle minerals content. The adsorption gas content of Lower Silurian and Lower Cambrian shale are 1.51–3.86 m3/t (average, 2.31 m3/t) and 0.35–2.38 m3/t (average, 1.36 m3/t). Total organic carbon, clay minerals and porosity are the main controlling factors for the differences in shale gas content between Lower Cambrian and Lower Silurian from the upper Yangtze plate. Probability entropy and organic matter plane porosity of the Lower Silurian are higher than those of Lower Cambrian shale, but form factor and roundness is smaller.

1. Introduction

Shale gas resources, as an important unconventional resource, have attracted extensive attention [1,2,3]. In the past decade, China has made considerable progress in shale gas exploration and development after the shale gas revolution in North America [4,5,6]. Moreover, shale gas of middle-shallow layer (<3500 m) achieves economic developments on a large scale, and the deep layer (3500–4500 m) shale gas is an important field for further shale gas exploration [7]. Different from conventional reservoirs, shale reservoirs have the characteristics of low porosity and low permeability [8]. The states of shale gas are mainly adsorption state and free state. As the core element of reservoir evaluation, the pore structure characteristics of shale are of great significance to the study of shale gas generation conditions and occurrence regularity [9]. According to the classification method of the International Union of Pure and Applied Chemistry (IUPAC), shale matrix pores are classified into micropore (<2 nm), mesopore (2–50 nm) and macropore (>50 nm) [10]. Pore structure parameters mainly include pore volume (PV), specific surface areas (SSA), porosity, pore diameter and other parameters, which are the key factors for shale gas reservoir evaluation and control the reservoir capacity and seepage capacity of gas in the reservoir [11].
Qualitative and quantitative analysis of shale pores has been studied to a certain extent [12,13,14]. The research methods of pore structure mainly include direct observation of photos under the microscope and fluid injection technologies such as N2 and CO2 [15]. The methods of intuitive observation of shale microscopic pores include scanning electron microscopy (SEM), field emission scanning electron microscopy (FE-SEM), transmission electron microscopy broad ion beam scanning electron microscopy (TEM), focused ion beam scanning electron microscopy (FIB SEM), and small angle and ultra-small angle neutron scattering (SANS and USANS) [16,17,18,19,20,21,22]. SEM/FE-SEM technology is widely used in shale pore morphology, and the advantages are that they have lower cost and are less time-consuming. FE/SEM combined with Particles (Pores) and Cracks Analysis System (PCAS) software can obtain the data of shale pore size, number, porosity and other parameters. PV, SSA and pore size distribution (PSD) of shale pore can be obtained by high-pressure mercury injection porosimetry experiments (HMIP), N2 and CO2 adsorption experiments [23,24,25]. Shale is a heterogeneous porous medium, which is both the source rock and reservoir of shale gas. It is mainly due to the complexity and heterogeneity of internal pores and matrix development, resulting in strong heterogeneity of shale reservoirs [26]. The characteristics of pore heterogeneity have an impact on the fine reservoir evaluation and promote the complexity of pore structure, which has a significant influence on the occurrence and enrichment of shale gas. The quantification of heterogeneity is based on fractal dimension [27]. There are many methods to obtain fractal dimension, but the most common method is based on N2 adsorption data and the Frenkel−Halsey−Hill (FHH) model [28].
Among the various nanoscale shale pores of Longmaxi formation (Fm) in southern Sichuan Basin, organic matter (OM) pores are important, and they are affected by compaction, cementation and dissolution, resulting in different pore size and morphology and complex pore structure [29,30,31]. The pore types mainly include clay mineral interlayer pores, strawberry-like pyrite intergranular pores, dissolution pores and micro-fractures [32]. The average pore size was, on average, 2.6–39.8 nm, mainly with fine-necked ink bottles and slit holes. Mesoporous pores with pore size of 10–20 nm and macropores with pore size of 1–10 μm provide the main PV, while micropores with pore size less than 0.9 nm contribute greatly to SSA [33]. The shale pores of Qiongzhusi Fm in southern Sichuan Basin are mainly intergranular pores, intragranular pores, OM pores and micro-fractures. Micropores and mesopores are the main shale gas reservoir space of Qiongzhusi Fm. The pore structure types are mainly round pores, wedge pores, flat slit pores and mixed pore structure. Total organic carbon (TOC), Ro and mineral content are important factors affecting the shale pore structure characteristics of Qiongzhusi Fm in southern Sichuan Basin [34]. Compared with the Niutitang Fm in northern Guizhou province, the shale porosity and permeability of Longmaxi Fm in this area is higher, and the pore system is relatively developed, which is conducive to the adsorption and migration of shale gas [35,36]. TOC, quartz content and macropores developed by clay mineral particles are positively correlated with porosity. In the mature stage, the development of OM pores increases first and then decreases slightly with the increase in TOC, and even directly shows a negative correlation between the development degree of organic pores and TOC [37,38,39]. Previous studies focus on local areas and have strong localization, especially in Sichuan Basin. Moreover, the existing studies concentrate on sedimentary environment, organic geochemical characteristics, pore structure and gas-bearing evaluation. As an important material basis for shale accumulation, the study of OM pore is not comprehensive enough.
The exploration and development of the two sets of target strata in the Lower Paleozoic of the Upper Yangtze area have made positive progress. However, the development situation is not ideal, especially the Niutitang shale. In order to further clarify the fundamental reasons for this phenomenon, and it is necessary to strengthen systematic comparative analysis the characteristics and heterogeneity of pore structure in the two sets strata from the whole upper Yangtze plate. The study on the genetic types, morphology, quantitative characteristics and vertical spatial variation in organic pores is of great significance. In this study, FE-SEM combined with PCAS software, CO2/N2 adsorption experiment and HMIP experiments and methane adsorption were used to investigate characteristics of overall shale pore structure, organic matter pore, heterogeneity and gas content of the Lower Paleozoic in southern Sichuan Basin and northern Guizhou province from the upper Yangtze plate. The research provides a theoretical basis for occurrence mechanism and reference for the development of shale gas resources.

2. Geological Setting

The upper Yangtze plate refers to the region south of Qinling orogenic belt, north of Yadu-Ziyun-Luodian fault, east of Longmenshan thrust belt and west of Xuefengshan tectonic belt, with an area of about 3.5 × 10⁵ km2 [40,41]. There are several tectonic movements, especially the strong reformation in the Indo−Chinese epoch, and formed fold-thrust belts with different structural distribution and different deformation intensity and periods in its periphery [42]. From the perspective of tectonic units, the main parts of the upper Yangtze plate include Sichuan Basin, Xuefeng intracontinental tectonic deformation system, Longmenshan intracontinental orogenic belt, South Dabashan fold-thrust belt, E’meishan−Liangshan fold-thrust belt, Micangshan uplift belt, Kangdian tectonic belt, and Diandong uplift (Figure 1). The upper Yangtze plate is one of the key areas for oil and gas exploration in marine strata, and it is also the most active area for shale gas research and development in China [43]. The Lower Silurian Longmaxi Fm and the Lower Cambrian Qiongzhusi/Niutitang Fm with different facies in the same period are widely developed in the upper Yangtze Plate. The shale of Lower Cambrian is called Niutitang Fm in central and northern Guizhou province, which is mainly distributed in Zunyi, Jinsha rock hole and Xishui. However, in southwest Sichuan Basin and northeast Yunnan province, it is called Qiongzhusi Fm [44,45]. Under the background of the overall uplift structure in the upper Yangtze sedimentary area caused by Caledonian movement, the Zunyi fault-convex of the platform uplift in northern Guizhou was formed by continuous uplift under the regional faulting of Devonian–Carboniferous. During Caledonian movement, Liupanshui fault depression west of Weining−Guanling fault zone and Zunyi fault uplift east of it uplifted the surface [46]. The shale thickness of Qiongzhusi Fm in southern Sichuan Basin is 20–160 m, which is larger than that of Niutitang Fm in northern Guizhou province [47,48]. However, the lithology is basically the same, mainly black-carbonaceous shale, which belongs to anoxic shelf sedimentary facies [49]. The shale thickness of Longmaxi Fm is 0–150 m. The Longmaxi Fm shale belongs to an open shelf deposits, and the lithology is mainly calcareous shale, silty shale, black shale, carbonaceous shale, containing abundant graptolite fossil (Figure 2) [50].

3. Material and Methods

3.1. Sample Collection and Geochemical Analyses

The research samples were taken from two sets strata, namely, the Lower Silurian Longmaxi Fm and the Lower Cambrian Qiongzhusi Fm in southern Sichuan Basin, and the Lower Silurian Longmaxi Fm and the Lower Cambrian Niutitang Fm in northern Guizhou province from the upper Yangtze plate. A total of 26 core samples were collected from 7 wells (Figure 1 and Table 1). Nine samples were taken from SCL-03 well of the Lower Silurian Longmaxi Fm in southern Sichuan Basin, with a depth of 2100–2400 m. The lithology is mainly siliceous shale, black shale and carbonaceous shale. There are four sampling wells of the Lower Cambrian Qiongzhusi Fm in southern Sichuan Basin. Two samples were taken from each well of SCQ-01 and SCQ-06, with depths of 5000–5100 m and 2500–2700 m, respectively. One sample was taken from each well of SCQ-04 and SCQ-09, respectively, with depths of 4229 m and 4966.4 m. The lithology of Qiongzhusi Fm in southern Sichuan Basin was mainly black shale and carbonaceous shale. Six samples were taken from GYL-02 well of the Lower Silurian Longmaxi Fm in northern Guizhou province, with a depth of 50–100 m. The lithology is mostly silty shale, calcareous shale, black shale and carbonaceous shale. Five samples were taken from GYN-01 well of the Lower Cambrian Niutitang Fm in northern Guizhou province, with a depth of 20–50 m. The lithology is mainly black shale and carbonaceous shale. After collecting fresh core samples, they were directly prepared in the experimental institutions immediately through sorting and classification. X−ray diffraction (XRD), TOC content, Ro and other organic geochemical characteristics of the samples were analyzed and tested.

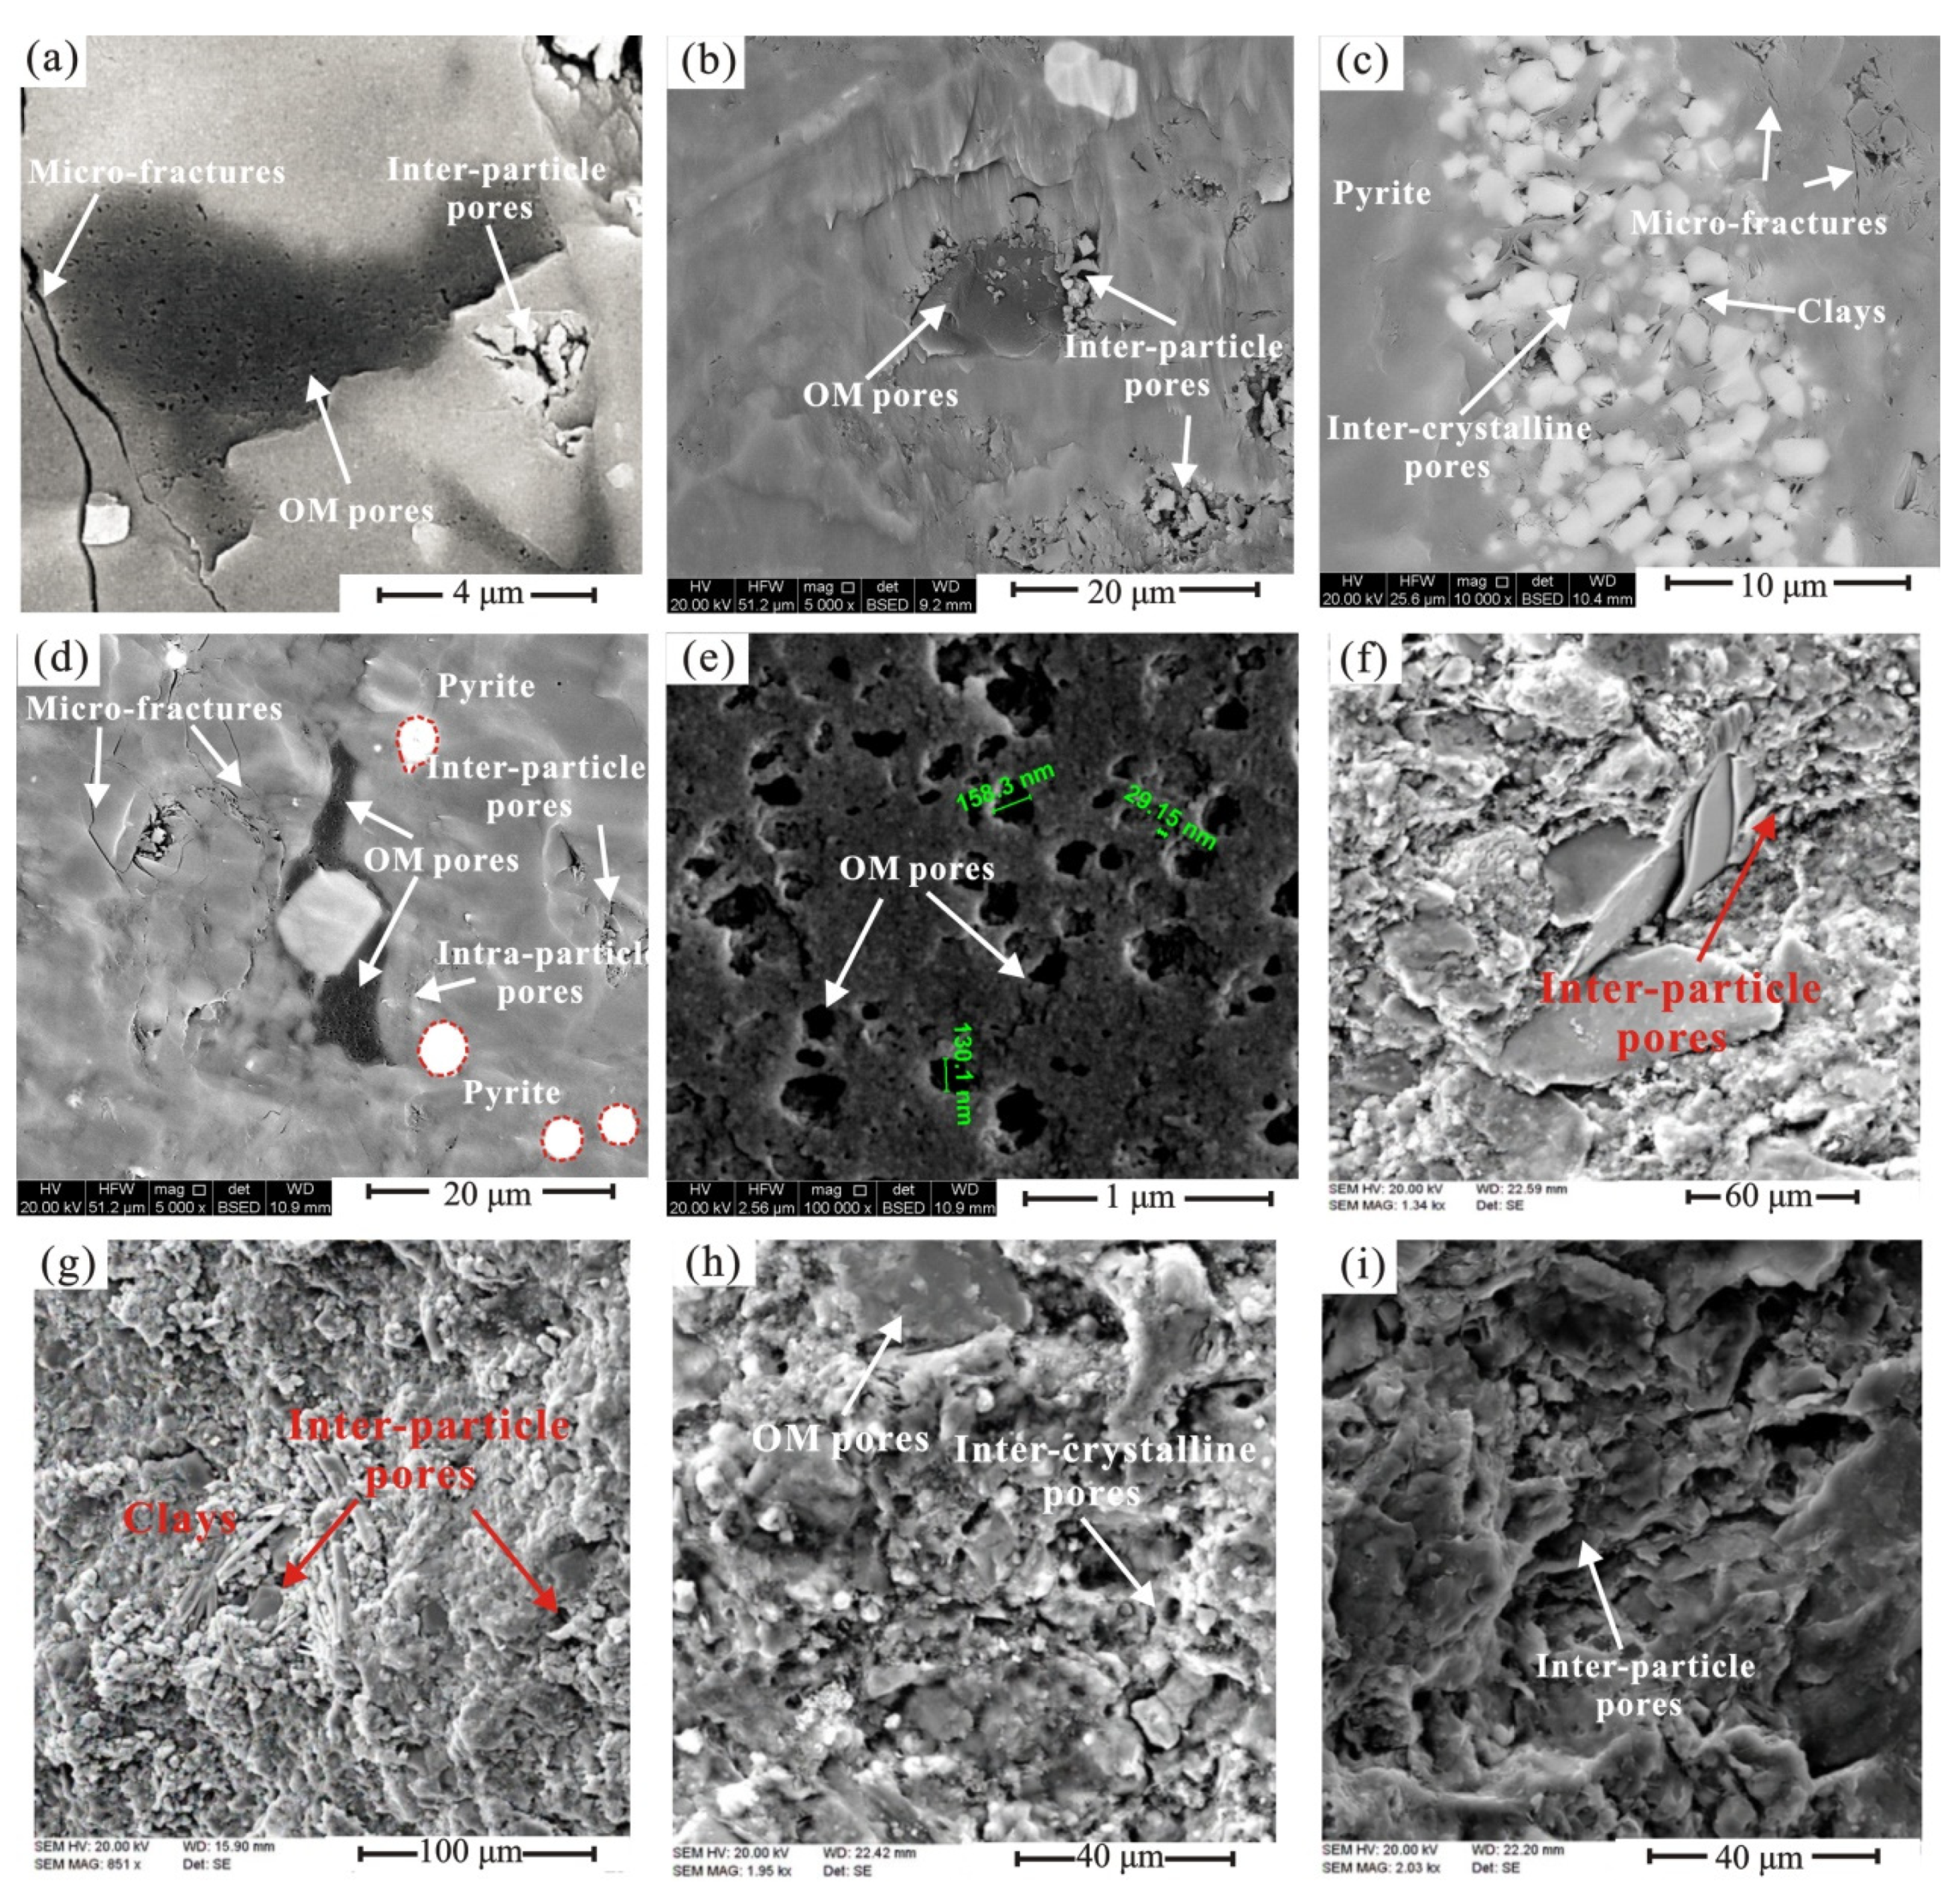
3.2. SEM/FE–SEM Experiment

The overall situation of spatial distribution of microscopic pores and fractures can be observed SEM of the VEFALSH II. Compared with SEM, FE-SEM is more suitable for accurate measurement of pore size, and its magnification can reach up to 1.2 nm. Both methods comply with the Chinese oil and gas industry standard SY/T 5162–2014 [51]. During the sample pretreatment, naturally exfoliated fragments should be preferentially selected so as not to produce new cracks by artificial fragmentation. Samples with thickness less than 3 mm and maximum area less than 1 cm2 were fixed on the sample table used conductive adhesive. Taking six samples as a group, gold plating was carried out by example sputtering SCD500 with thickness of about 15 nm. Gold plating on the surface of the sample in FE-SEM experiment is beneficial for clearer imaging. FE-SEM is to use field emission scanning electron microscopy to observe and analyze the polished shale samples under microscope. This method can effectively observe and analyze the pore structure characteristics in shale samples.

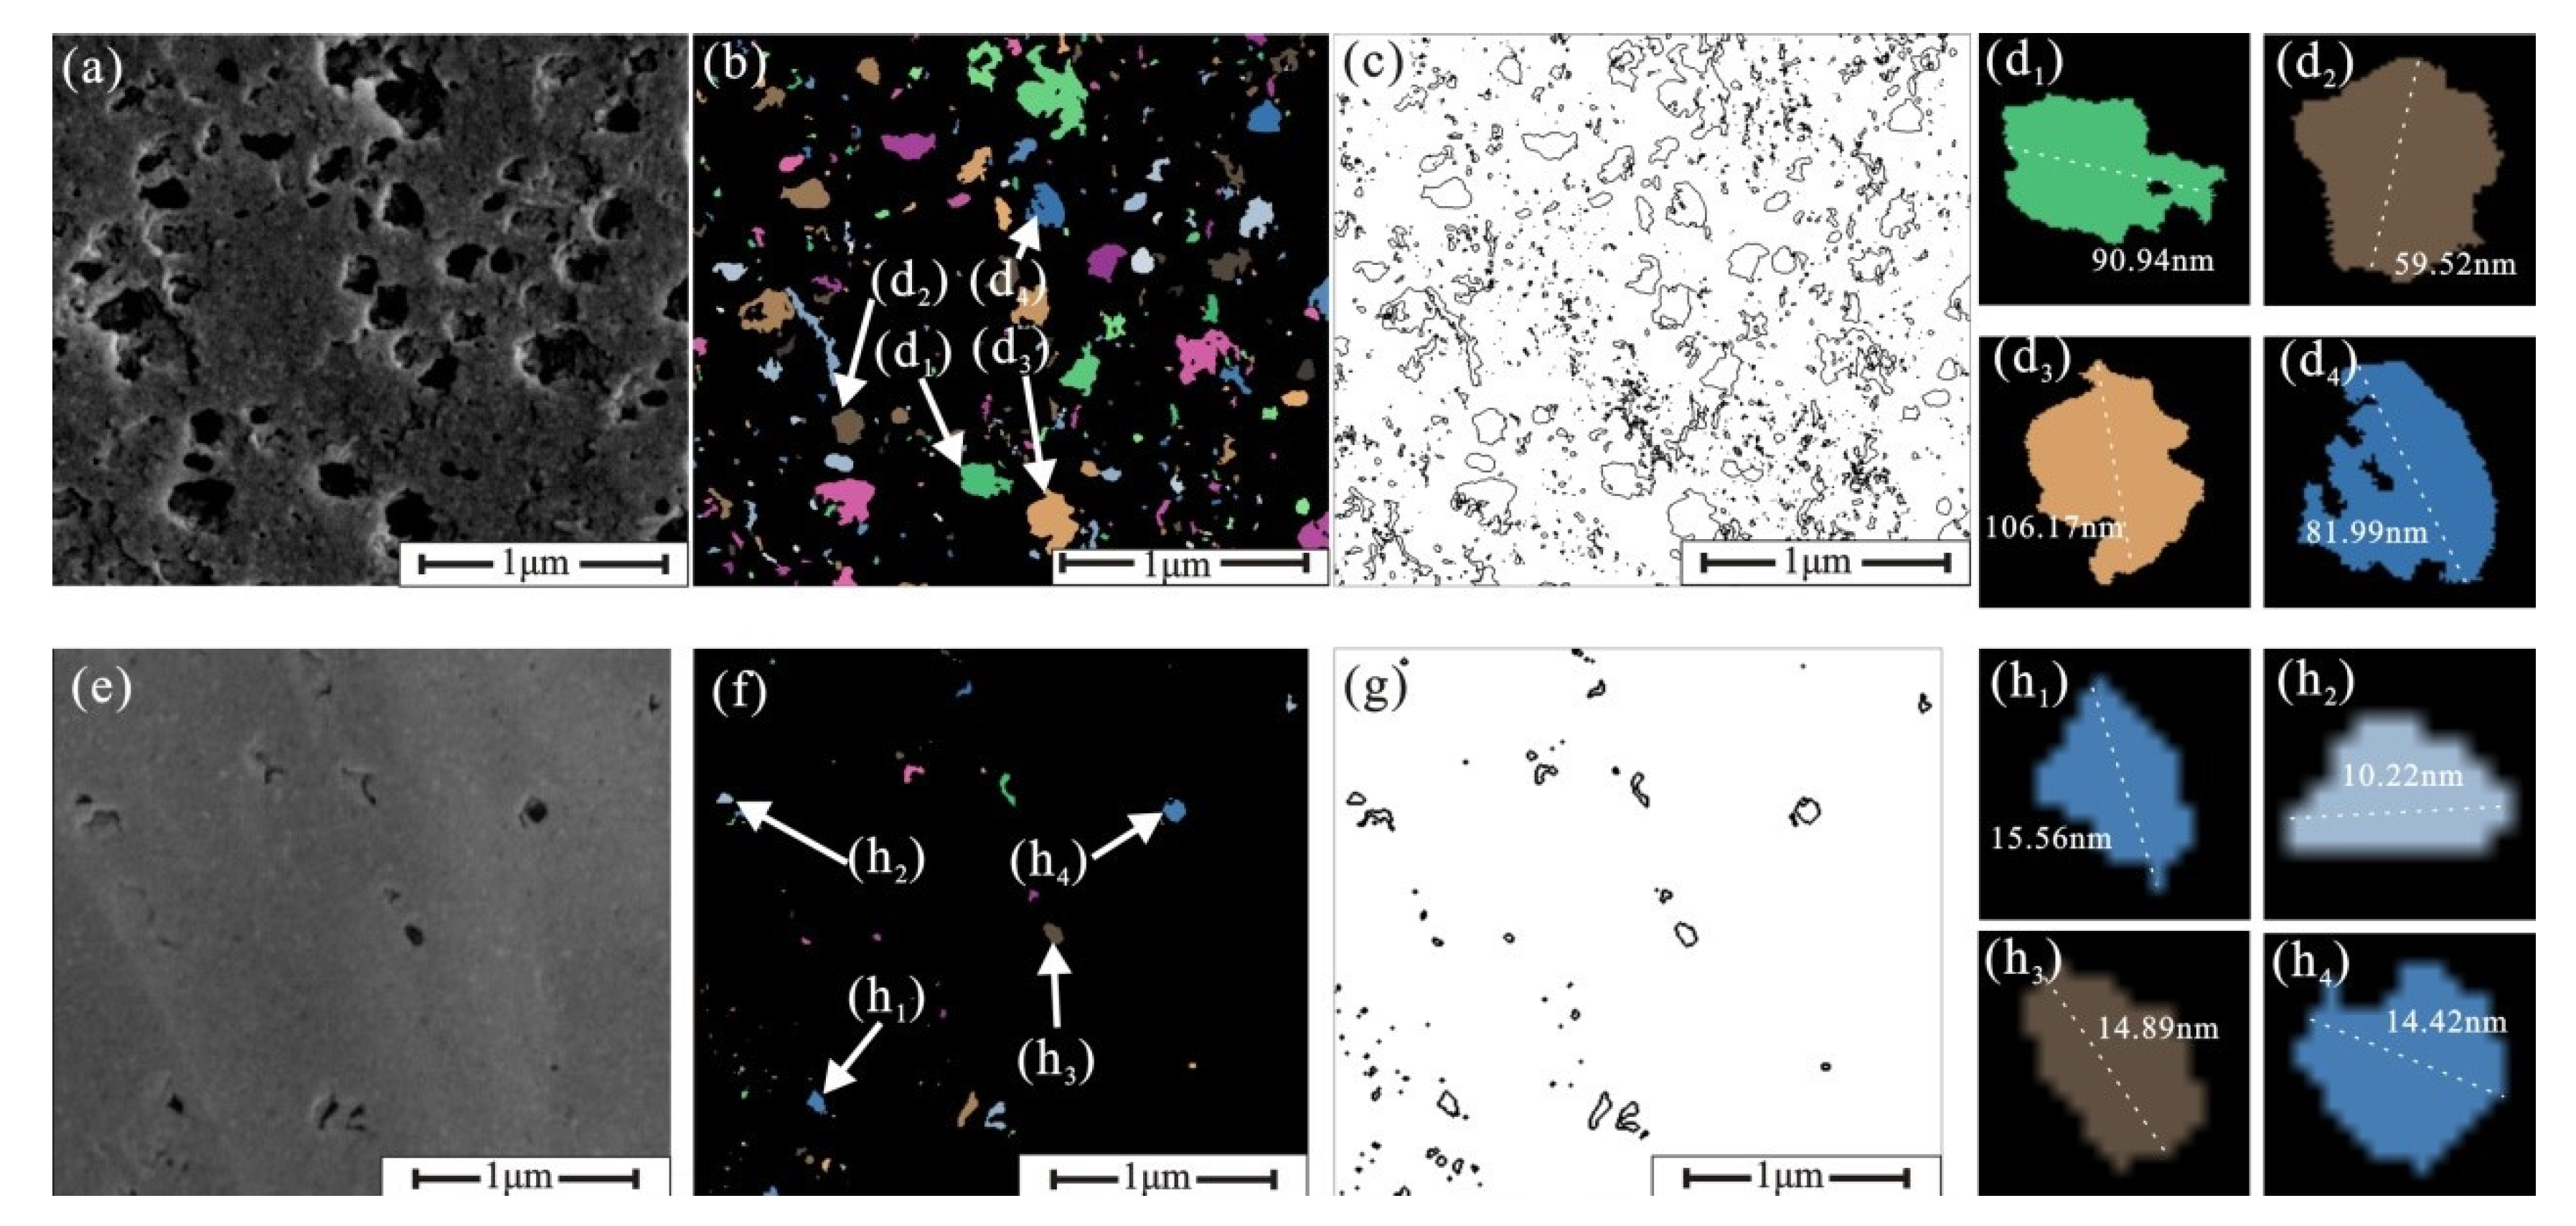
3.3. PCAS Software Principle and Parameters

Quantitative study of shale pore is based on high-resolution FE-SEM images and PCAS software. PCAS software has the characteristics of high accuracy in identifying pores, and can accurately obtain quantitative parameters such as pore size and shape [52]. In PCAS program, the global threshold method is used to segment the image, and the pores and background are separated by determining the appropriate gray threshold. It is crucial that the appropriate threshold be selected through several individuals. The average pore perimeter, area, length and width are not enough to fully characterize the complex pore system, and statistical parameters such as form factor, probability entropy and roundness are introduced. The length and width of pores refer to the max and min value of Feret diameter.
Form factor (ff) are usually used to describe the morphological characteristics of two-dimensional shape objects. Form factor is defined as follows:
f f = 4 · π · S / C 2
where S is the area and C is the perimeter of pore. The Form factor can reflect the roundness and roughness of pores, and the value is between 0–1. Form factor of circular pores is 1 and the square is 0.785. The smaller form factor value indicates that the pore morphology is more complex and irregular.
Probability entropy is used to describe the orientation characteristics of pores. It is defined as follows:
H = i = 1 n p i log n p i
where H is the probability entropy and Pi represents the percentage of pores in a certain range. If the angle of direction on the 2D plane is defined as 180°, then n = 18. When i = 1, the direction is 0°–10°. The value of probabilistic entropy is between 0–1. When H = 0, it shows that pores have the same arrangement direction. When H = 1, all the pores are in disordered arrangement direction. With the increase in probability entropy, the arrangement of pores becomes more chaotic.
The roundness is used to characterize the degree of the pores close to the circle. It is defined as follows:
R = M i / M a    
where R is roundness, Mi is the short axis length of the pore (the shortest Feret diameter), Ma is the long axis length of the pore (the longest Feret diameter). Feret diameter is the distance between the parallel lines of the projection boundary in an irregular region. The shortest Feret diameter obtained by image processing is often longer than the real pore throat diameter.

3.4. Fluid Injection Technologies

QKY−ZN porosity analyzer is used in the helium porosity measurement experiment. The sample was prepared as a column with a diameter of 1.0 cm and height of 2.5 cm. It increased gradually from the beginning pressure of <0.6 MPa to make helium enter the pores. The diameter of helium molecule is 0.2 nm, which can fill all the pores of shale. The results of this method are more accurate than mercury intrusion porosimetry.
HMIP using automatic porosity analyzer Pore Master GT60, specifies that the requirements of experimental samples are cylindrical shapes with diameter of <1 cm and height of <2 cm.
CO2 and N2 gas adsorption experiments strictly follow the China National Standard GB/T 19587–2017 [53]. The instrument for gas adsorption is NOVA 4200e specific surface area and porosity analyzer. Firstly, the sample was crushed to less than 5 mm in diameter, and 1 g sample was dried and loaded into the test tube for degassing treatment. The adsorbate gas was selected as CO2/N2, and the pressure was gradually increased in the analyzer, and the corresponding adsorption gas amount was recorded under different pressures. Pore size of CO2 and N2 are 0.3–1.5 nm and 1.3–100 nm. The weighted average method is used for the pore size of the overlapping area. The experimental analysis mainly analyzes the pore structure characteristics of shale according to the gas adsorption and desorption curve. According to the N2 adsorption experiment, the mesoporous PV and SSA of the samples were measured by Barrett−Joyner−Halenda (BJH) and Brunauer−Emmett−Teller (BET) methods, respectively, [54]. Based on the CO2 adsorption experiment, the micropore PV and SSA were estimated by D−A and density functional theory (DFT) [55].
The determination of shale adsorbed gas content is carried out by methane adsorption experiment in accordance with the China National Standards GB/T 19560–2008 [56]. The 100–150 g of each sample were sealed and put into the instrument. The sealing test was carried out to ensure the safety of the experiment and the accuracy of the experimental results, and the temperature was constant at 30 °C. The adsorption of methane gas is carried out by high pressure system with a high pressure of up to 20 MPa. At the partial pressure point, the corresponding gas adsorption values were obtained and fitted by Langmuir equation.

3.5. Heterogeneity Analysis

Fractal analysis can determine the quantitative parameters of sample surface fractal dimension D [57]. Fractal dimensions 2 and 3 represent smooth surface samples and completely irregular or rough surface samples, respectively. When the fractal dimension is greater than 3 or less than 2, the corresponding pores have no fractal structure [58]. The fractal dimension can characterize the internal structure of shale. The internal structure of shale becomes more complex and heterogeneous with the increase in fractal dimension [59,60].
The fractal dimension is studied by FHH model. Its definition equation is as follows:
ln V = D 3   ln ln p 0 / p + constant
where V is the volume of N2 adsorbed at the equilibrium pressure p, p0 is the saturation pressure, D is the fractal dimension, and (D − 3) represents the slope of the double logarithm curve of ln (V) versus ln[ln (p0/p)].

4. Results

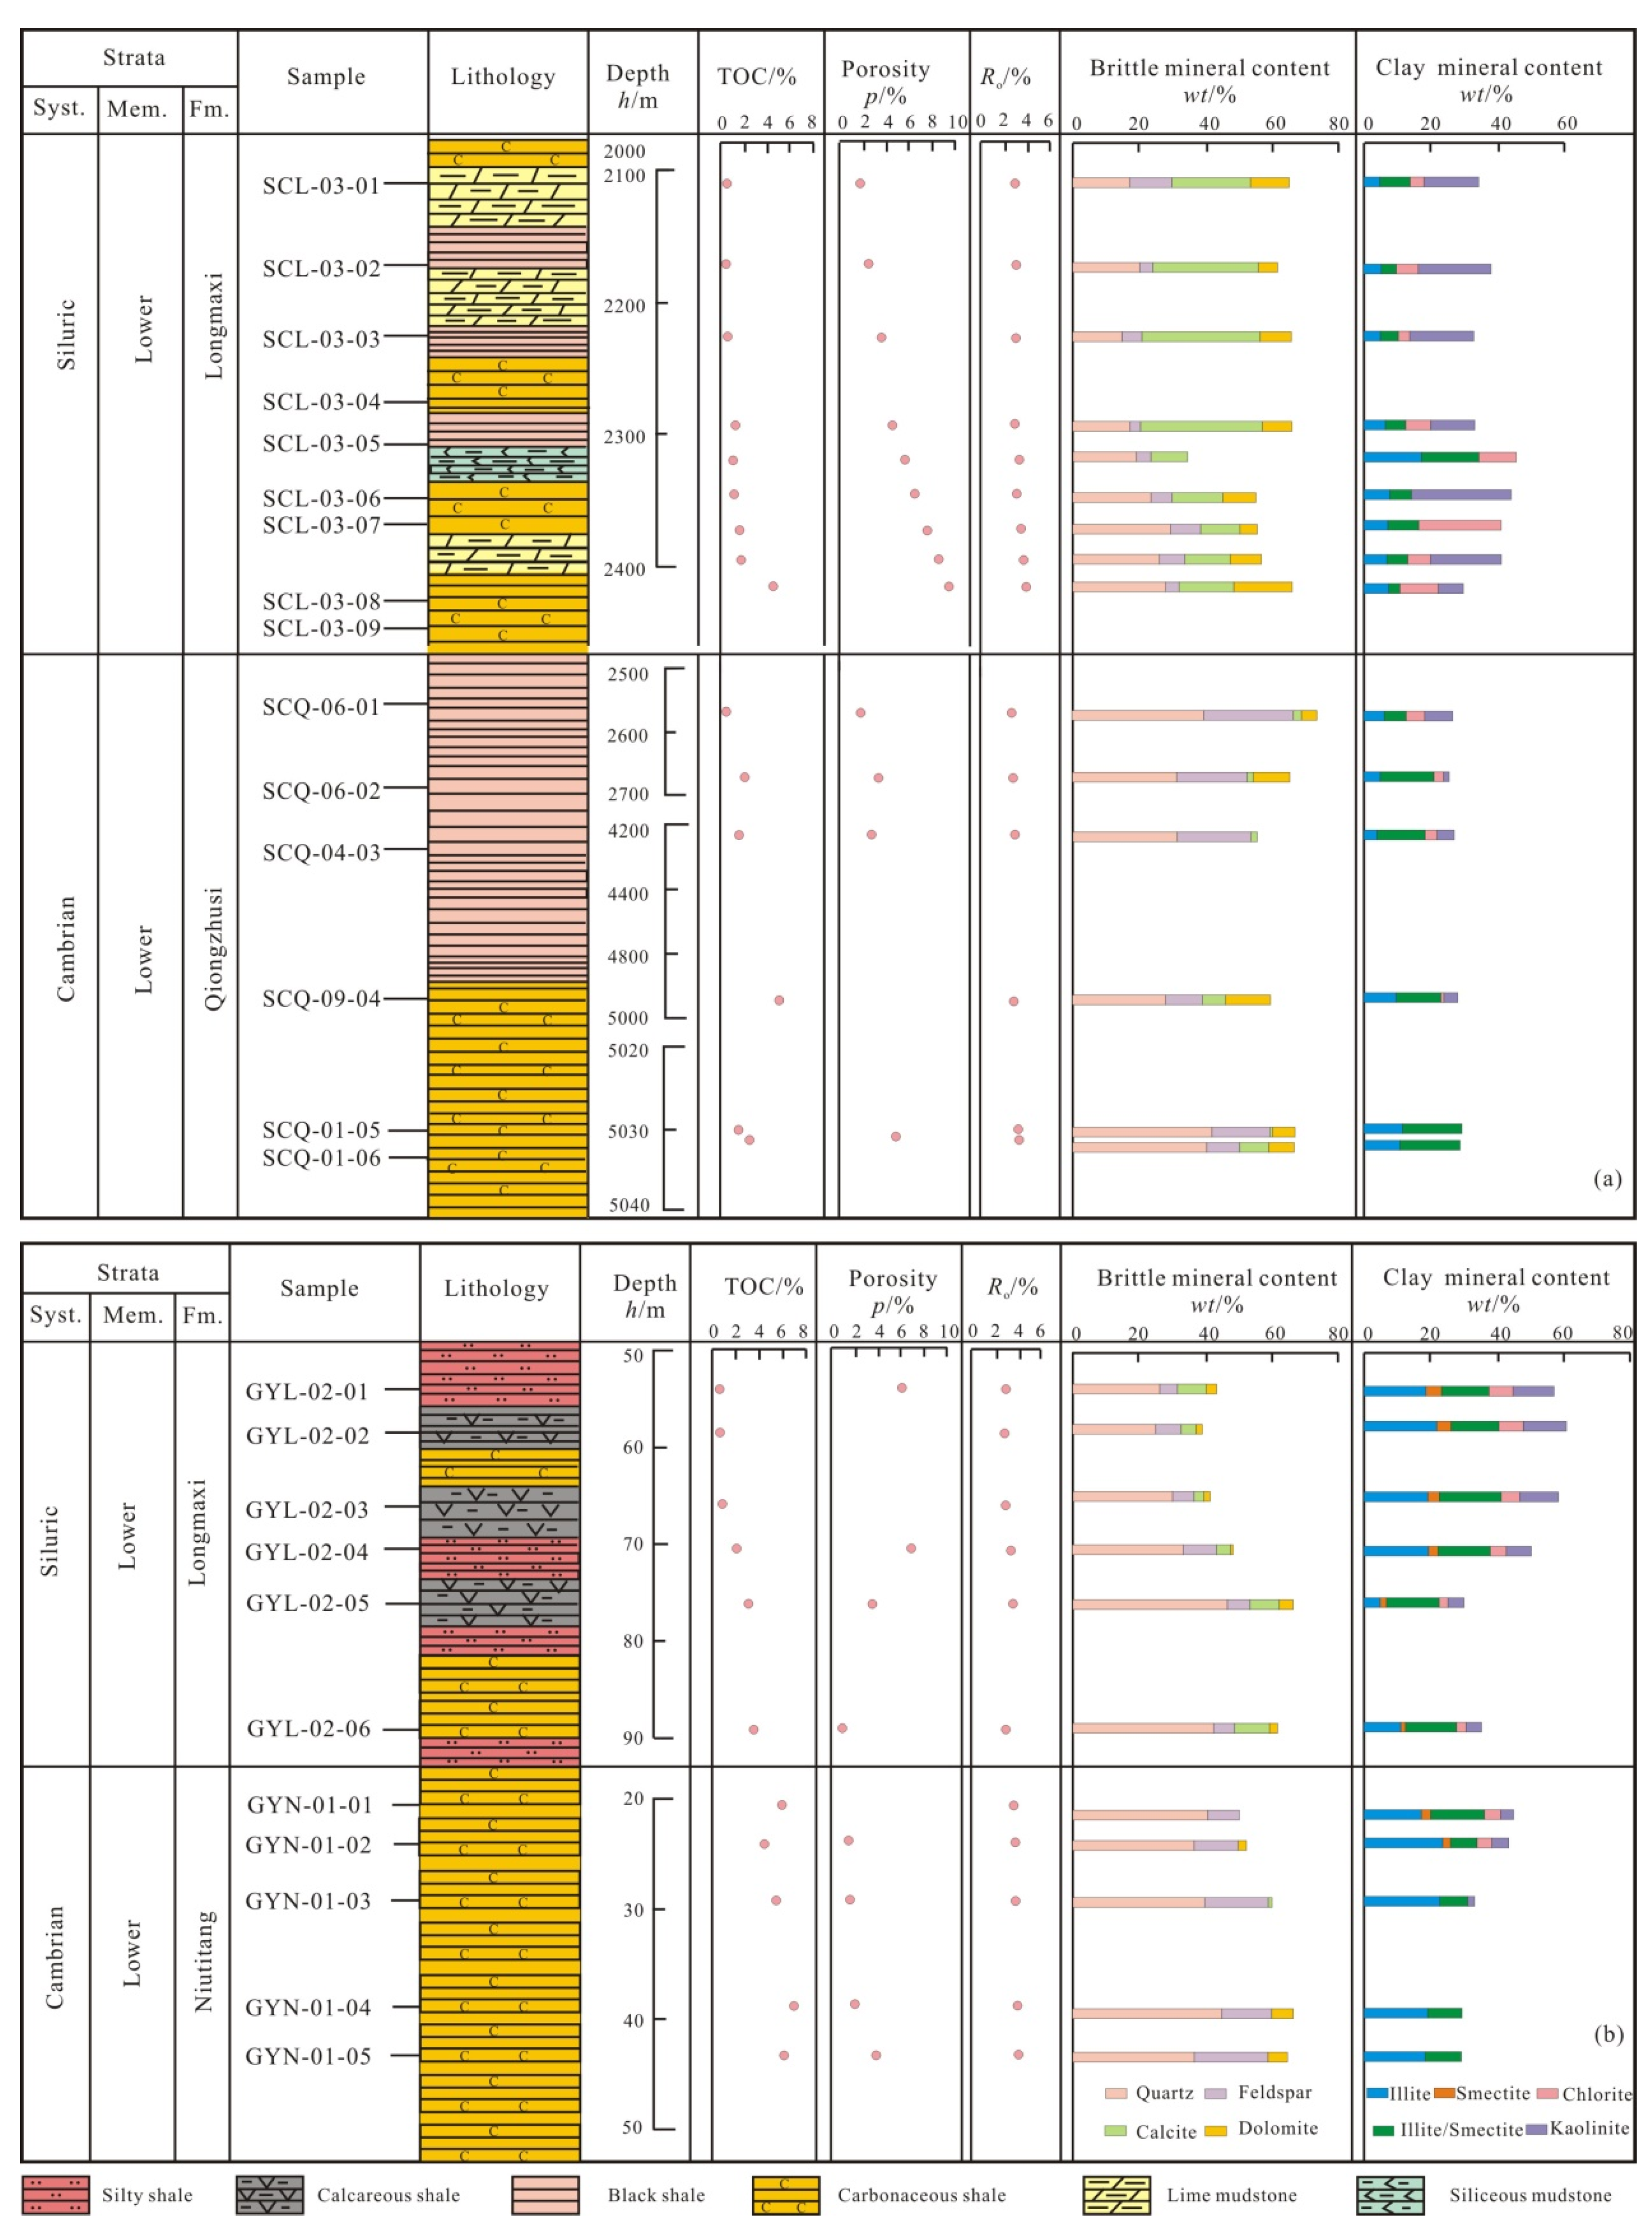
4.1. Geochemical Characteristics and Mineral Composition Analyses

As shown in Table 1 and Figure 2, TOC contents of the Longmaxi and Qiongzhusi shales in southern Sichuan Basin are 0.15–4.38% (mean of 1.21%) and 0.34–4.71% (mean of 2.02%). By contrast, TOC content of the Longmaxi and Niutitang shales in northern Guizhou province ranges are 0.70–3.55% (mean of 1.87%) and 4.24–6.99% (mean of 5.76%), respectively. Vertically, the TOC contents of the Lower Cambrian from the upper Yangtze plate were higher than that of the Lower Silurian, increasing with the increase in burial depth. The value of Ro of the Lower Paleozoic shale from the upper Yangtze plate is in the range of 2.21% and 3.90% (mean of 2.82%) belonging to high–over mature stage.
The clay mineral contents of the Lower Silurian from the upper Yangtze plate are 29.30–57.25% (mean of 41.44%), and that of the Lower Cambrian are 20.50–44.05% (mean of 30.90%). The clay mineral contents of the Lower Paleozoic shale from the upper Yangtze plate are comparable to that of marine shales in the North America [61], and both are lower than that of continental shale (Figure 3). The brittle mineral contents of the Lower Silurian from the upper Yangtze plate are 34.7–66.52% (mean of 55.12%), and that of the Lower Cambrian are 34.7–66.52% (mean of 61.85%).

4.2. Pore Classification and Porosity

Shale pores and the micro-fractures are primary storage and accumulation spaces for shale gas, and they also provide the main channels for gas migration. According to different classification standards, shale pores can be divided into various types, interparticle (interP) pore, intraparticle (intraP) pore, OM pore, and micro-fracture (Figure 4).
InterP pores are mainly developed between clay flocculates, brittle minerals grains and detrital, and they are commonly polygonal, angular and irregular morphologies (Figure 4a–d,f,h,i). The sizes of these pores range from 0.5 to 1.5 μm controlled by compaction, diagenetic and thermal evolution processes. Intercrystalline pores are developed between pyrite framboids crystals with polygonal shapes, and their sizes diameters are from several nm to hundreds nm. InterP pore development of the Lower Cambrian is slightly better than that of the Lower Silurian.
IntraP pores are commonly found in detrital mineral interior, rock debris and organic matter with circular, elliptic and irregular shapes (Figure 4e,h,i). IntraP pore of the Lower Paleozoic shale from the upper Yangtze plate is isolated and poorly connected, probably providing limited contribution to the passage of shale gas. Its diameters are 10–400 nm, relatively small.
OM pores are superiorly developed in the OMs, which include hydrocarbon generation pores, organic dissolution pores and biological fossil pores (Figure 4a,b,d,e,h). These pore sizes are less than 1 μm with the elliptical, honeycomb, nearly spherical and irregular shapes. OM pores are closely related to the formation and accumulation of shale gas, and also provide the major space for the occurrence of shale gas [62]. OM pore development of the Lower Silurian is better than that of the Lower Cambrian, which is more beneficial to gas adsorption.
Micro-fracture is not only the reservoir space of shale gas, but also the seepage channel. The micro-fracture of the Lower Paleozoic shale from the upper Yangtze plate is well developed (Figure 4a,c,d). The width of micro-fracture is less than 1.5 μm, mostly between 50 nm and 600 nm. The development of OM pores in continental shale is relatively poor, and inorganic mineral pores are widely distributed. By contrast, OM pores are well developed in the Lower Paleozoic marine shale of the upper Yangtze plate.
The shale porosity of Longmaxi Fm in southern Sichuan Basin is 2.35–6.87% (mean of 4.08%). The shale porosity of Qiongzhusi Fm is 1.35–2.87% (mean of 2.35%). The shale porosity of Longmaxi Fm and Niutitang Fm in northern Guizhou province are 1.56–8.08% (mean of 4.68%) and 1.3–3.26% (mean of 1.85%), respectively. The shale porosity of the Lower Silurian is greater than that of the Lower Cambrian from the upper Yangtze plate.

4.3. Overall Pore Structure Analysis

4.3.1. CO2 and N2 GAS Adsorption

The CO2 adsorption isotherms of the shale samples are similar to the type I adsorption isotherm set by the IUPAC, indicating that there are open micropores with diameters of <2 nm. As shown in Figure 5, the adsorption isotherms coincides with the desorption isotherms. In low pressure CO2 adsorption-desorption process, there is no capillary condensation phenomenon. When the relative pressure (P/P0) was less than 0.01, the amount of CO2 adsorption increased with the increase in P/P0. This phenomenon is caused by the enhancement of low-pressure adsorption potential, and the adsorbate molecules have strong capture capability [63]. When P/P0 is greater than 0.01, the increasing trendy of CO2 adsorption is slowed down with the increase in P/P0. Until it is close to saturation state, and the saturated adsorption value is equal to the filling volume of micropores. The CO2 gas adsorption volume of Longmaxi Fm is higher than that of Qiongzhusi Fm in southern Sichuan Basin. However, the CO2 gas adsorption volume of Niutitang Fm is higher than the Longmaxi Fm in northern Guizhou province. It indicates that there is strong gas adsorption capacity in previous two formations.
According to the classification standard of adsorption isotherms and hysteresis loops, the N2 adsorption isotherms of the Lower Paleozoic shales from the upper Yangtze plate were divided into type IV and the hysteresis loop types were type H3 and H4, respectively (Figure 6). When P/P0 is of <0.25, the monolayer adsorption is dominant and the amount of N2 adsorption is small. Notably, there is the transition between monolayer adsorption and multi-layer adsorption, and the amount of N2 adsorption gradually increases. The hysteretic loop appears under the P/P0 > 0.5, showing that there is a multi-layer adsorption stage and the adsorption amount of N2 increases rapidly. In addition, N2 adsorption-desorption isotherms were not closed under P/P0 < 0.5, manifesting that some samples had expansion circumstance. This finding indicates that pores were characterized by inkbottle-shaped, wedge-shaped, slit-shaped tablets, cylindrical, and mixed pores.

4.3.2. The Pore Structure Parameters

As shown in Table 2 and Figure 7 and Figure 8, the total PV and SSA of the Niutitang Fm in northern Guizhou province are 0.0096–0.0265 cm3/g (average, 0.0188 cm3/g) and 16.0397–29.5020 m2/g (average, 24.5076 m2/g). For micropore, the PV and SSA are 0.0028–0.0055 cm3/g (average, 0.0043 cm3/g) and 11.1120–19.3130 m2/g (average, 15.8658 m2/g), respectively. The PV and the SSA of mesopore are 0.0066–0.0167 cm3/g (average, 0.0115 cm3/g) and 4.9253–11.3730 m2/g (average, 8.6387 m2/g). For macropore, the PV and SSA are 0–0.00018 cm3/g (average, 0.00008 cm3/g) and 0–0.0070 m2/g (average, 0.0031 m2/g).
The total PV and SSA of the Longmaxi Fm in northern Guizhou province are 0.0178–0.0265 cm3/g (average, 0.0217 cm3/g) and 19.0397–29.954 m2/g (average, 22.4498 m2/g), respectively. PV of micropore and mesopore are 0.0026–0.0048 cm3/g (average, 0.0038 cm3/g) and 0.0121–0.0163 cm3/g (average, 0.0146 cm3/g). The SSA of micropore and mesopore are 8.7397–16.2740 m2/g (average, 12.7007 m2/g) and 8.1914–10.6760 m2/g (average, 9.7452 m2/g), respectively. For macropore, PV and SSA are 0.0021–0.0060 cm3/g (average, 0.0033 cm3/g) and 0.003–0.0045 m2/g (average, 0.0040 m2/g). The micropore and mesopore accounted for 99.4% of the total PV and 99.97% of the total SSA of the Niutitang Fm in northern Guizhou province, while the proportions of Longmaxi Fm were 85.11% and 99.98%. The contribution of the Niutitang Fm micropore to the total PV and SSA was greater than that of Longmaxi Fm in northern Guizhou province.
The total PV and SSA of the Qiongzhusi Fm in southern Sichuan Basin are 0.0021–0.0129 cm3/g (average, 0.0187 cm3/g) and 5.7065–17.3951 m2/g (average, 8.7677 m2/g), respectively. PV of micropore and mesopore are 0.0005–0.0040 cm3/g (average, 0.0018 cm3/g) and 0.0008–0.0051 cm3/g (average, 0.0032 cm3/g). The SSA of micropore and mesopore are 0.0005–0.004 m2/g (average, 0.0018 m2/g) and 0.7221–4.4631 m2/g (average, 2.2274 m2/g). PV and SSA of macropore are 0–0.0039 cm3/g (average, 0.0016 cm3/g) and 2.3895–12.9280 m2/g (average, 6.3185 m2/g).
The total PV and SSA of Longmaxi Fm in southern Sichuan Basin are 0.0106–0.0250 cm3/g (average, 0.0151 cm3/g) and 10.2421–29.399 m2/g (average, 16.0596 m2/g), respectively. The PV of micropore and mesopore are 0.0009–0.0048 cm3/g (average, 0.0022 cm3/g) and 0.0071–0.0159 cm3/g (average, 0.0103 cm3/g). The SSA of micropore and mesopore are 3.6436–15.8650 m2/g (average, 7.8254 m2/g) and 5.9245–13.5340 m2/g (average, 8.2305 m2/g) respectively. The PV and SSA of macropore are 0.0018–0.0043 cm3/g (average, 0.0025 cm3/g) and 0–0.0130 m2/g (average, 0.0037 m2/g). The micropore and mesopore accounted for 80.6% of the total PV and 29.3% of the total SSA of the Qiongzhusi Fm, while the proportions of Longmaxi Fm were 83.4% and 99.98%. Generally, the micropores contribution of the Longmaxi Fm in southern Sichuan Basin to the SSA were greater than that of the Qiongzhusi, and the contributions of micropores and mesoporous of the Longmaxi Fm to the total PV were also greater than that of the Qiongzhusi Fm.

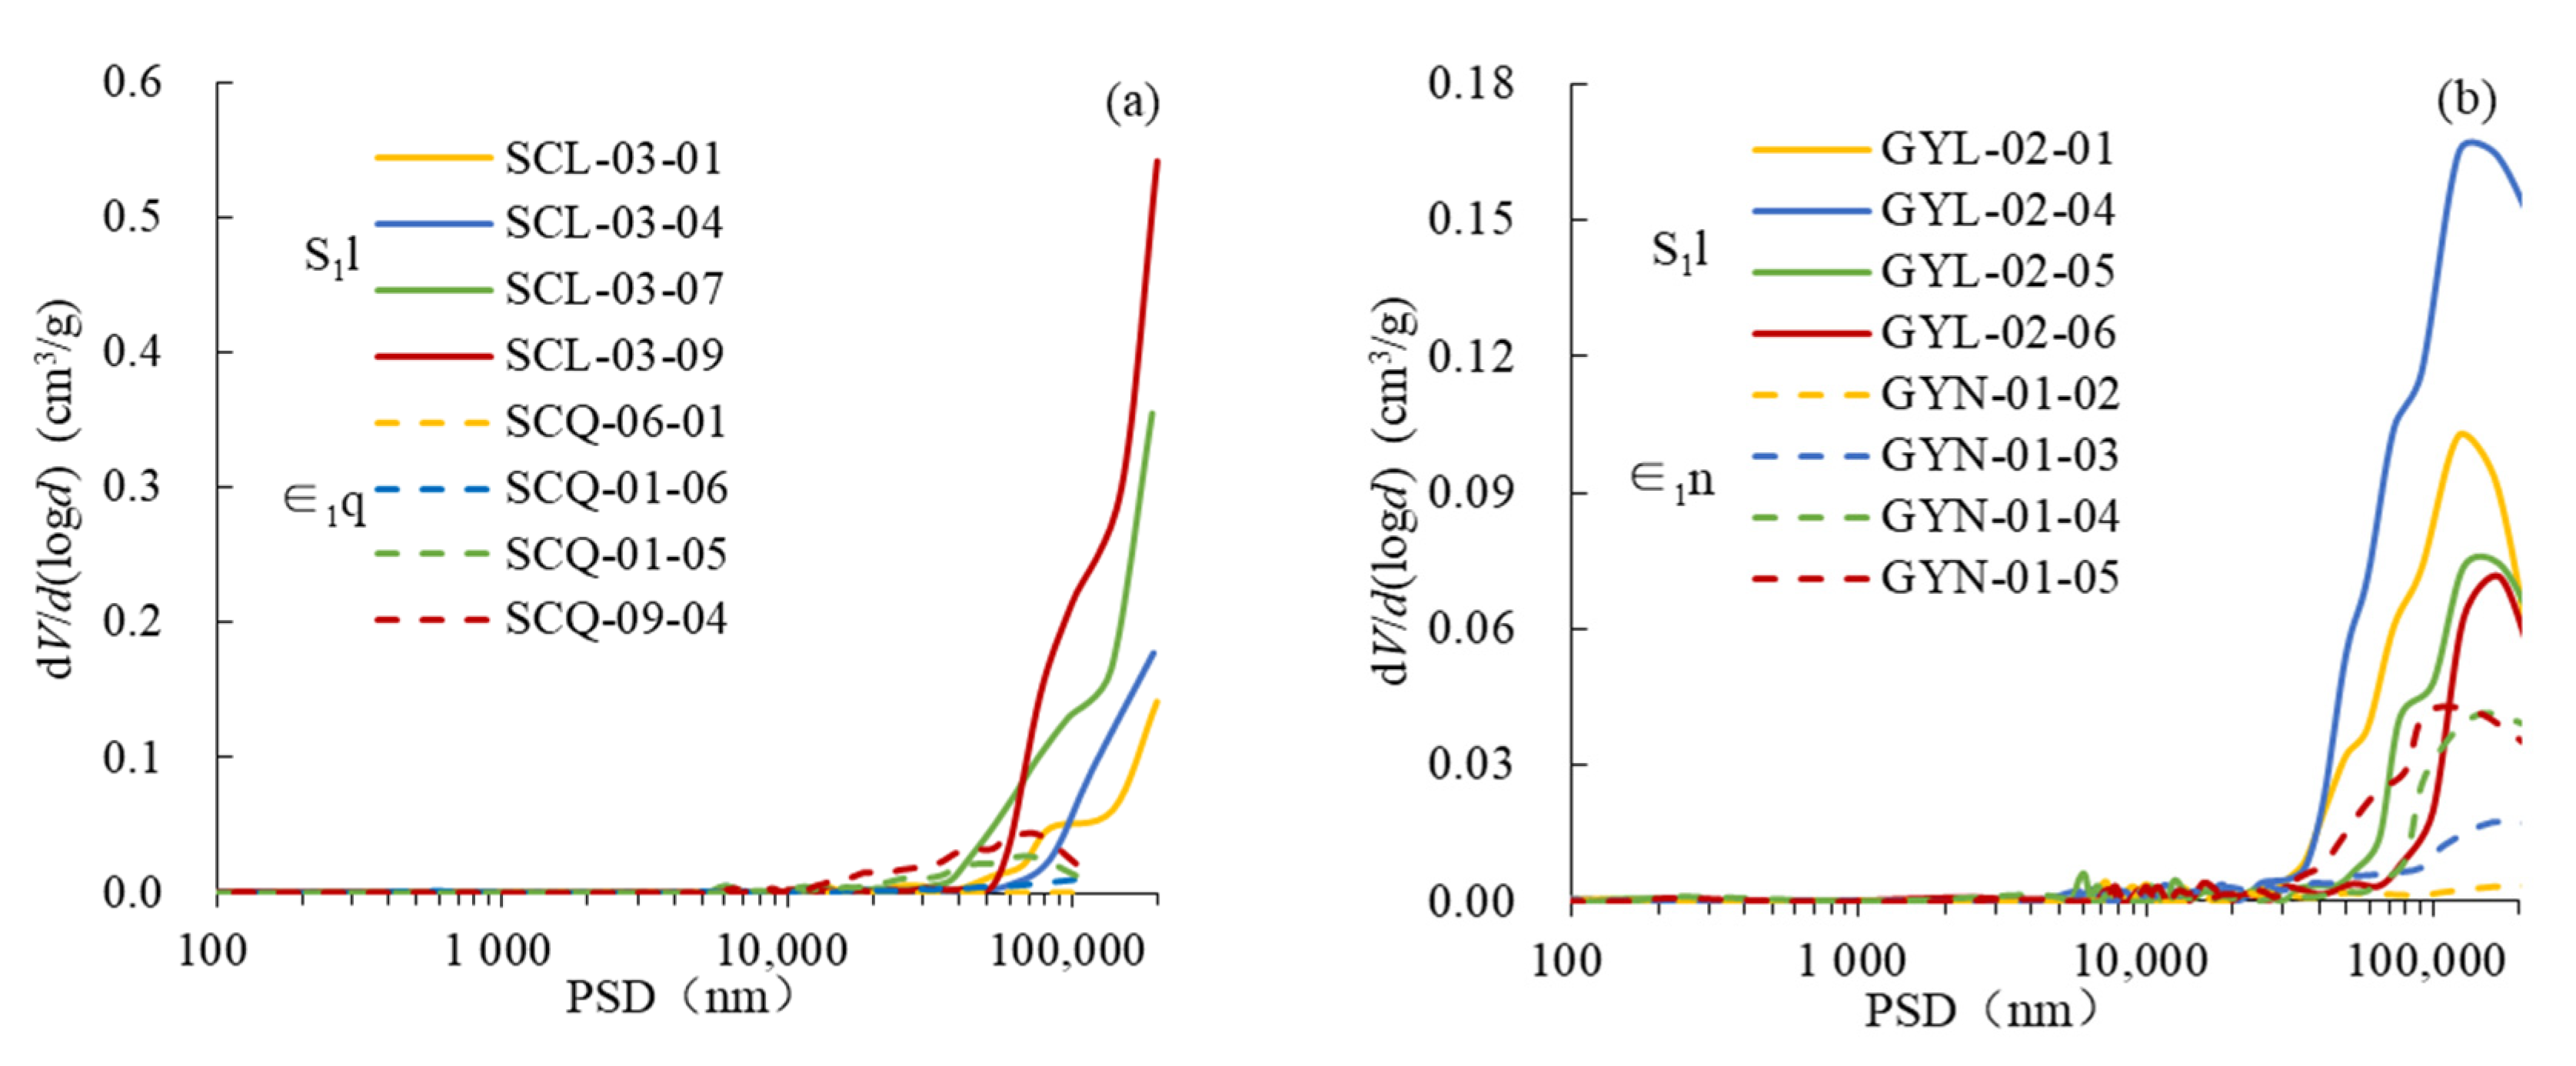
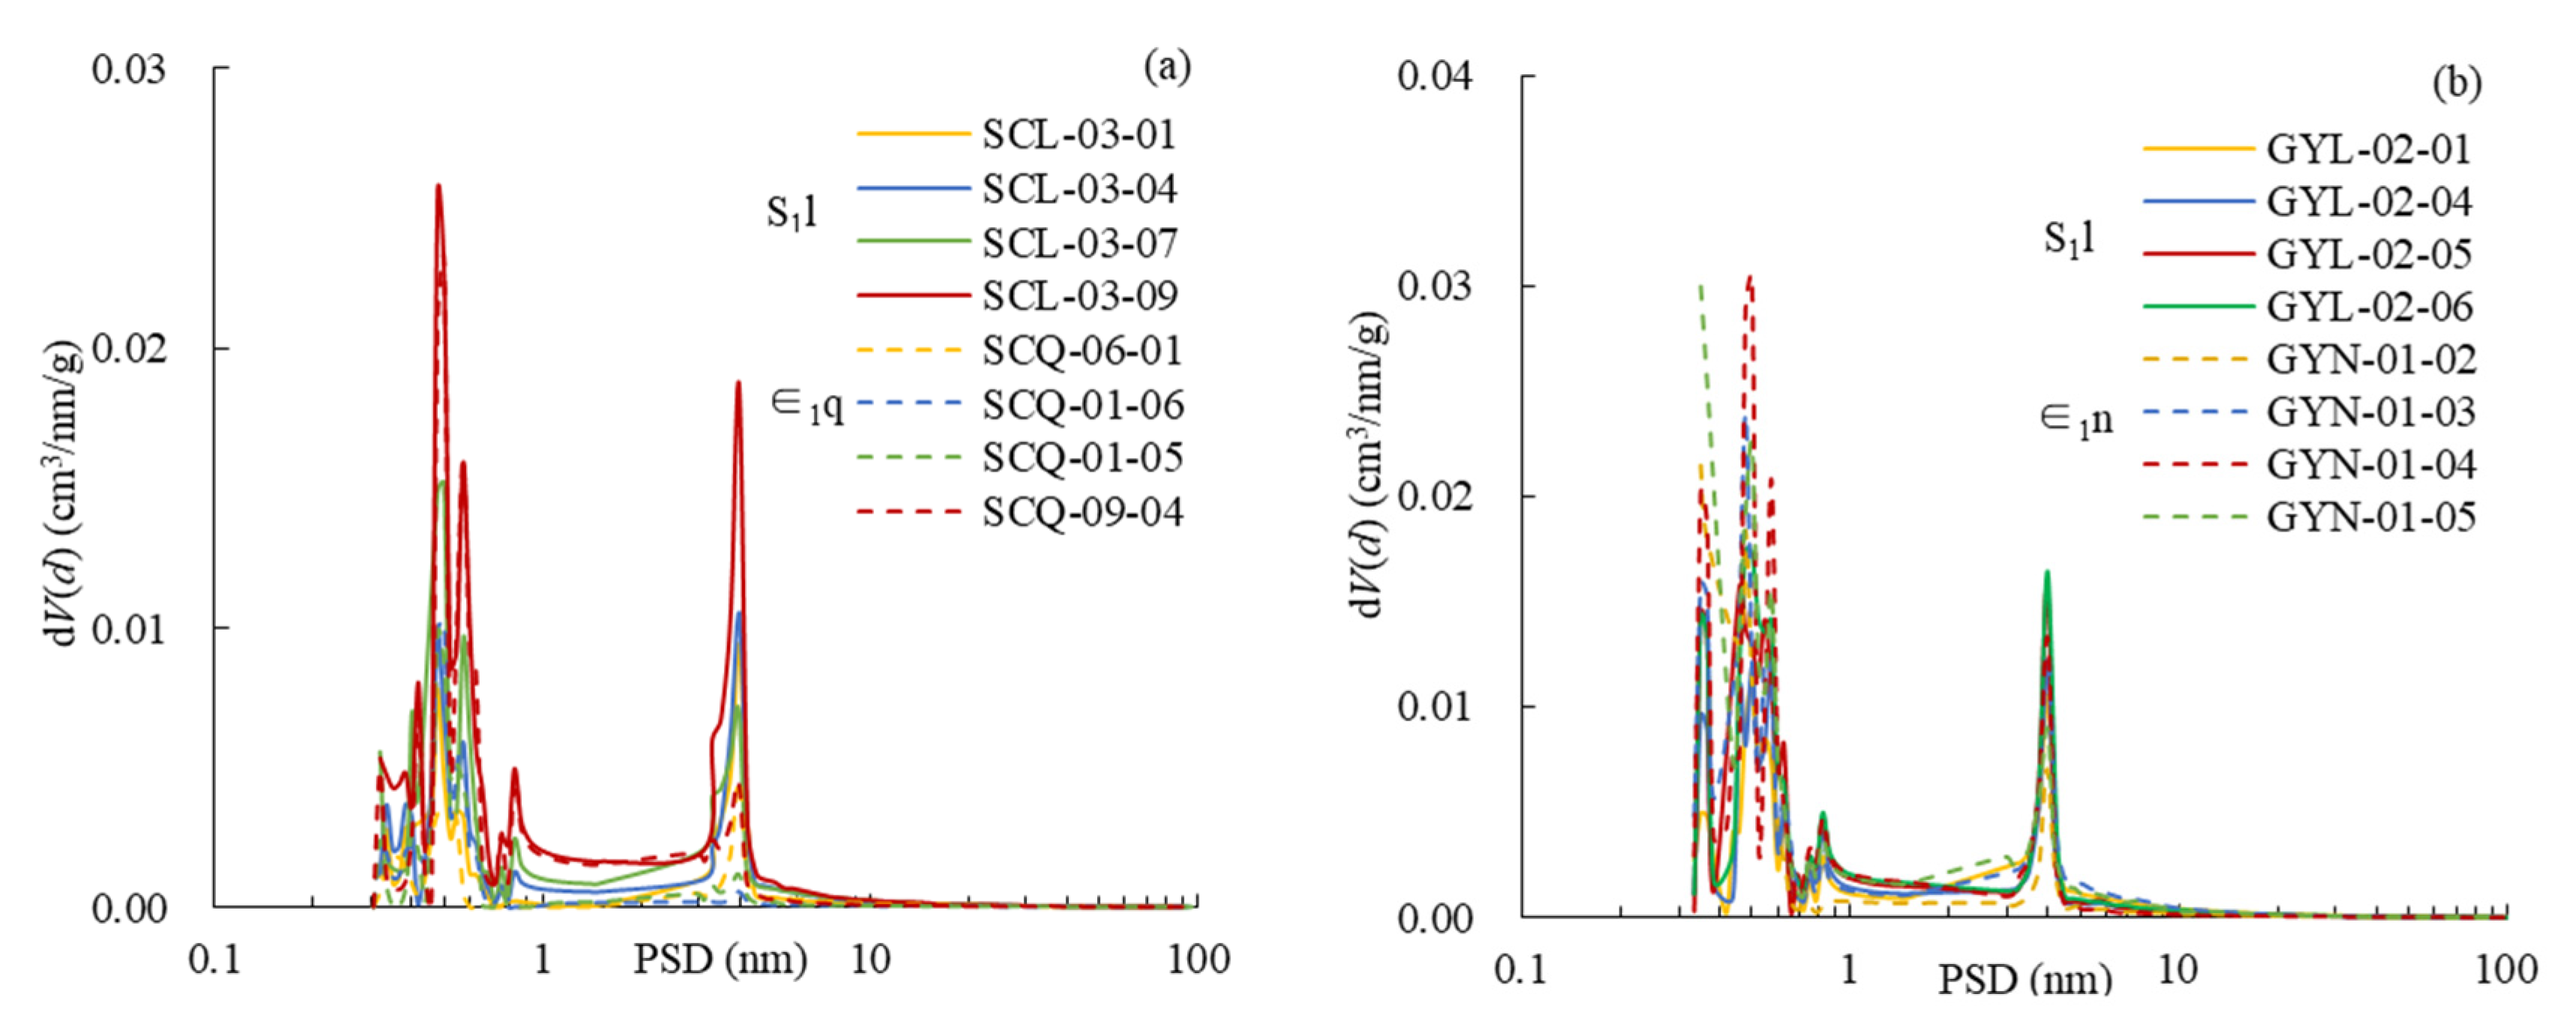
4.3.3. Description of PSD

The Pore size distribution (PSD) curves of the HMIP are expressed by the relationship between dV/dlog(d) and pore diameter (Figure 9). Mercury intrusion is almost zero when pore size is less than 10 μm. A gentle rising trend was detected in the range of 10–40 μm, and the mercury injection inflow increases sharply under the pore size of 40–100 μm. On the whole, the mercury inflow amount of the Lower Silurian is larger than that of the Lower Cambrian from the upper Yangtze plate.
The PSD curves of the CO2 and N2 adsorption experiments are expressed by the relationship between dV/(d) and pore diameter (Figure 10). The weighted average method is used to fit the overlapping parts. Based on CO2 adsorption experiments, the PSD curves of the Lower Paleozoic shale from the upper Yangtze plate is a three-stage pattern, which is obtained by DFT method. A major peak position of pore diameter is distributed in 0.45–0.50 nm, with two minor peaks around 0.35–0.40 nm and 0.55–1.0 nm. On the basis of the BJH model in N2 adsorption experiments, all the plots of dV/(d) versus pore size diameter showed a unimodal mode peak. The pore diameter corresponding to the peak position is around 4 nm. This is an artificial peak due to tension. Compared with continental shale, the micropores in the Lower Paleozoic shale from the upper Yangtze plate are obviously better developed. With the increase in TOC content, the peak value of micropores increased significantly, while there was no similar phenomenon in continental shale [64]. This indicates that the micropores of marine shale in the Lower Paleozoic shale from the upper Yangtze plate are mainly derived from organic matter, while those of continental shale are affected by other mineral components besides organic matter.

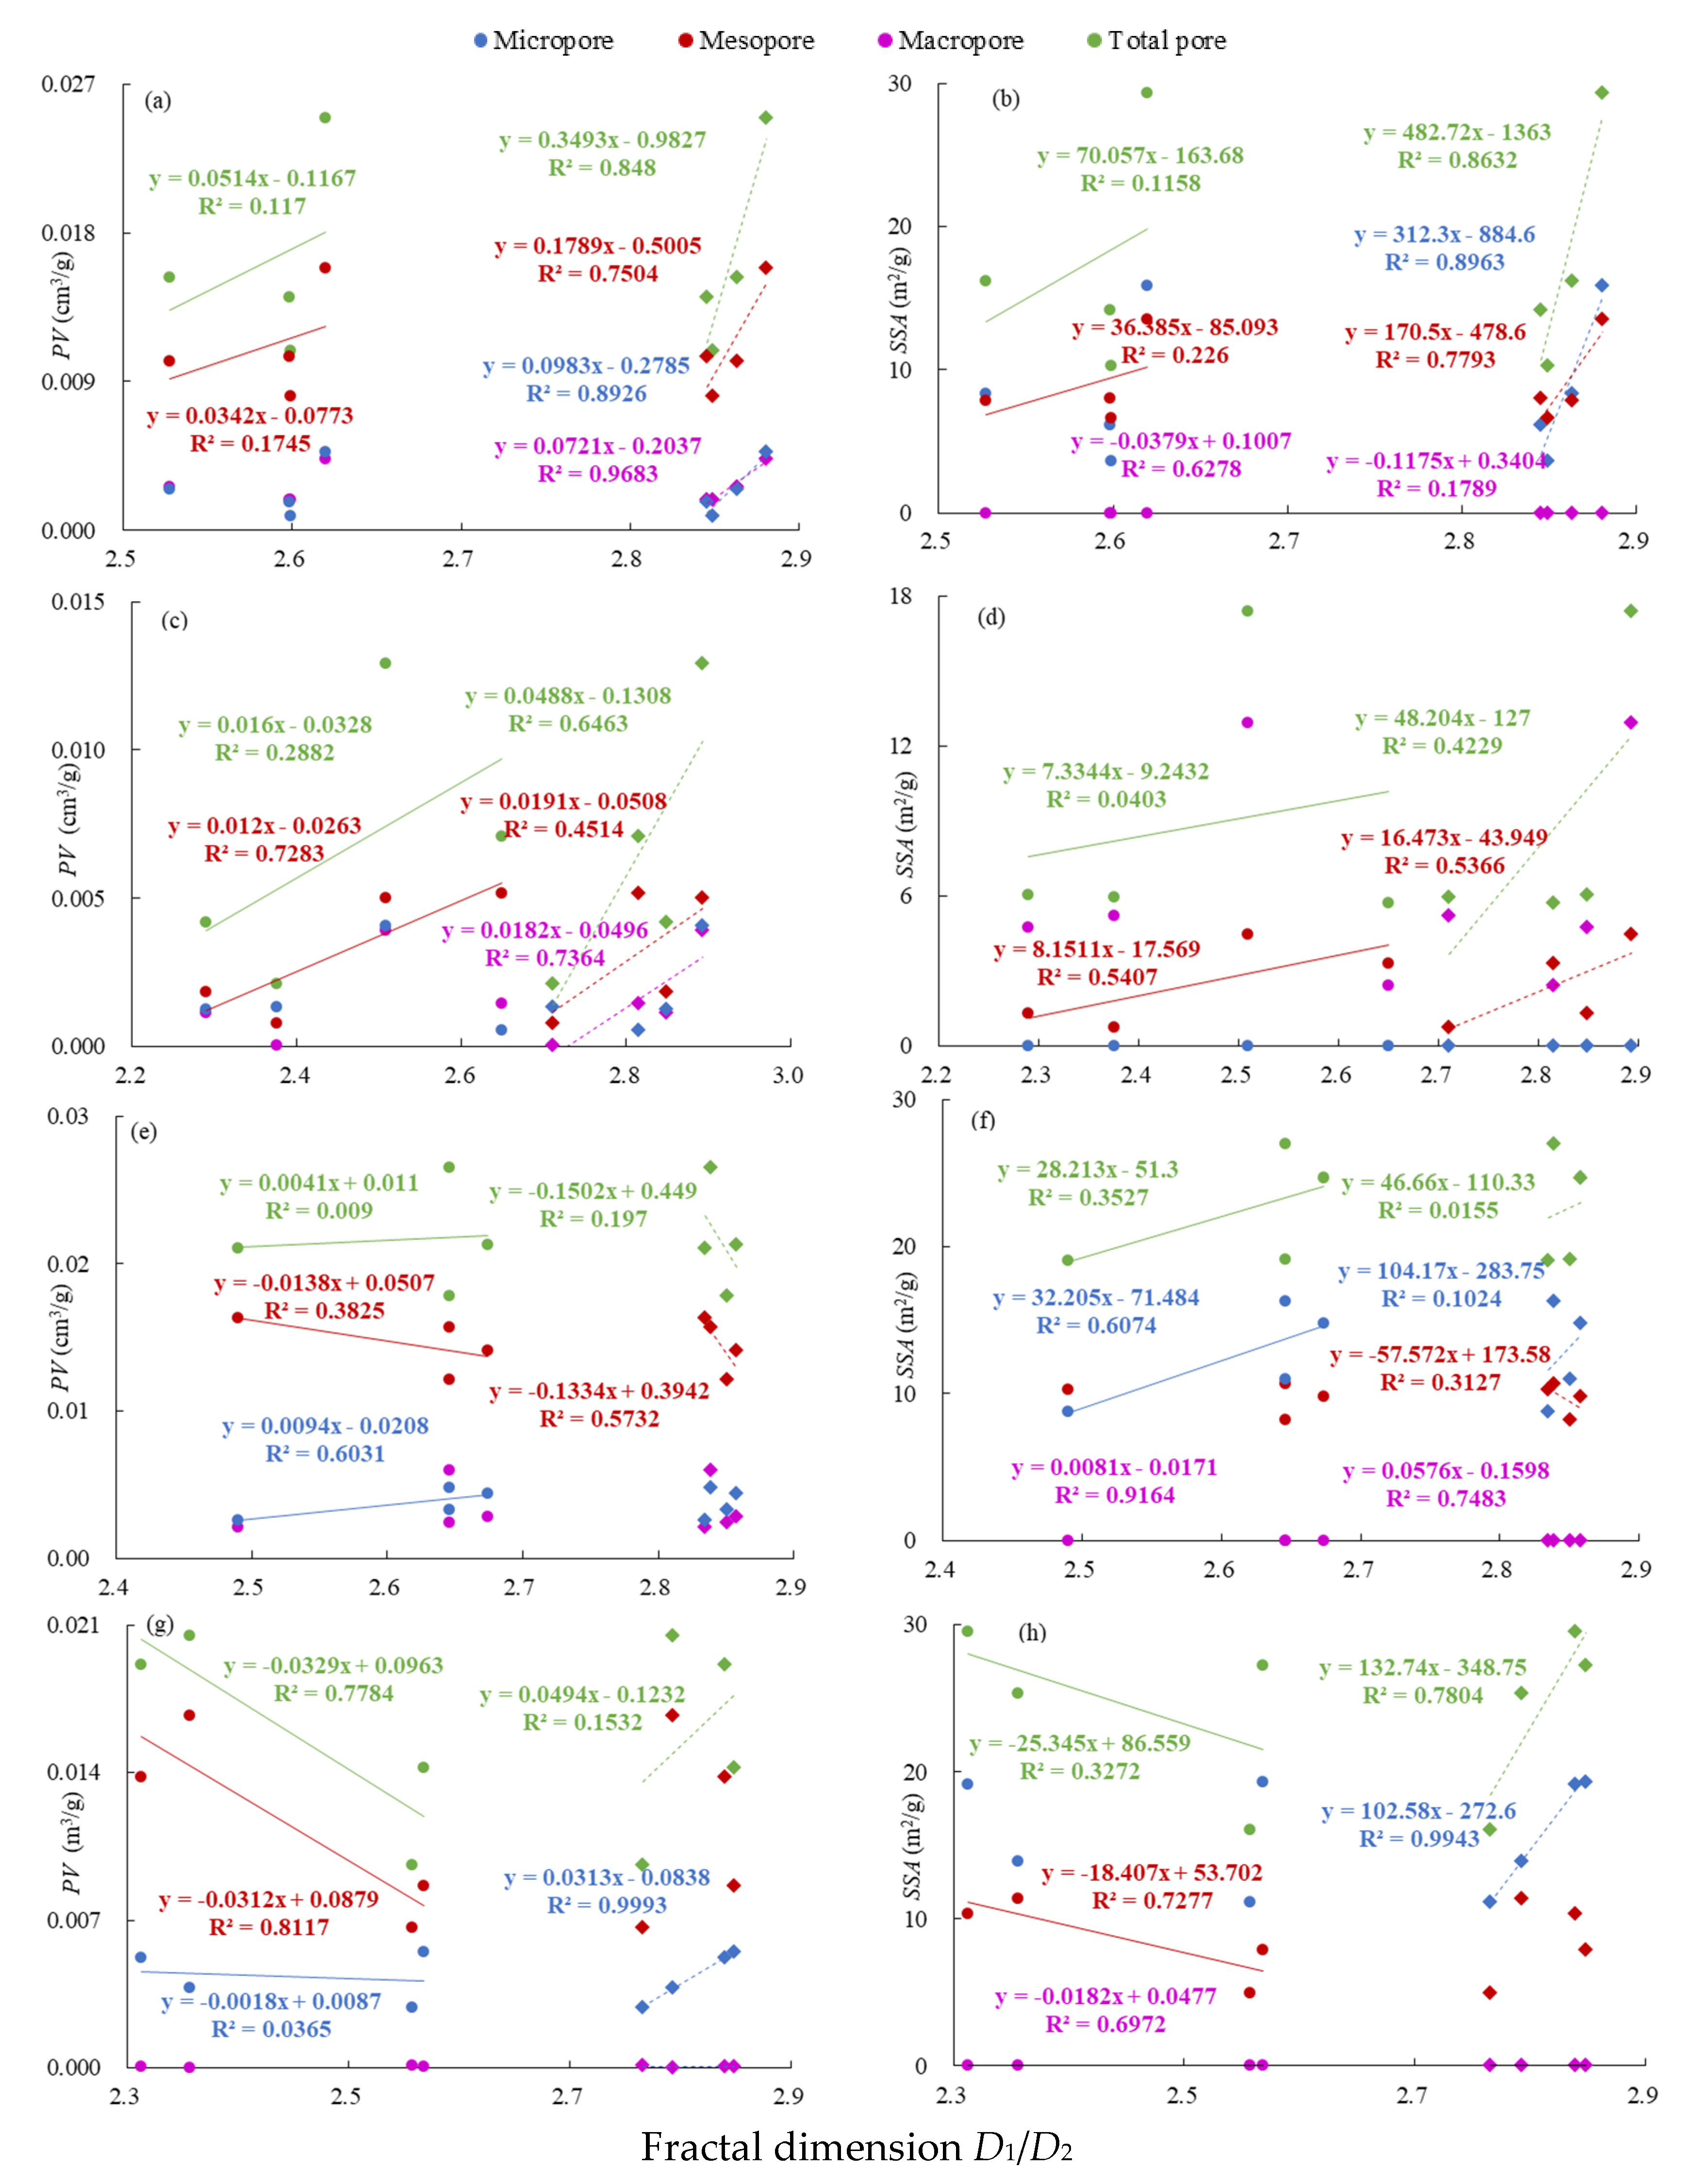
4.3.4. Fractal Dimensions from N2 Adsorption Isotherms

The plots of lnV versus ln(ln(P0/P)) from shale samples and their analysis results are shown in Figure 11 and Table 3 on the basis of the fractal FHH model and N2 adsorption data. The fractal dimension D1 is calculated from the linear segment of P/P0 intervals of 0–0.5, which is commonly used to characterize the irregularity of shale pore surface. The fractal dimension D2 is calculated from P/P0 intervals of 0.5–1.0, which is used to characterize the complexity of shale pore internal structure. The correlation coefficient R2 of the two line segments of all samples are all greater than 0.9, indicating that the fractal characteristics of shale are obvious.
D1 and D2 of Niutitang Fm in northern Guizhou province are 2.31–2.57 (average, 2.45) and 2.77–2.85 (average, 2.81). Similarly, D1 and D2 of Qiongzhusi Fm in southern Sichuan Basin are 2.29–2.65 (average, 2.46) and 2.71–2.89 (average, 2.82). D1 and D2 of Longmaxi Fm in northern Guizhou province are close to those of Longmaxi Fm in southern Sichuan Basin. The former is 2.49–2.67 (average, 2.61) and 2.84–2.86 (mean 2.85). The latter is 2.53–2.62 (average, 2.58) and 2.85–2.89 (average, 2.87). D1 and D2 of the Lower Silurian from the upper Yangtze plate are bigger than those of the Lower Cambrian. It is different from D1 and D2 of the continental shale, but similar to the North American shale. It reflects that the pore structure of the Lower Silurian Longmaxi Fm shale from the upper Yangtze plate is more complex, and the complex pore structure will increase the SSA, which is conducive to the adsorption and occurrence of shale gas. The complex pore structure also expands pore connectivity and promotes shale gas seepage to a certain extent, which is beneficial to production and development of shale gas.

4.4. OM Pore Structure Analysis

The OM pore is thermally generated pore developed within OM. Generally, the organic component is affected by the increase in temperature and pressure in the late burial diagenesis, and it gradually becomes loose and porous in the conversion process of pyrolysis hydrocarbon generation [65]. Compared with continental shale, OM pore in marine shale of Lower Paleozoic from the upper Yangtze plate is more developed and distributed uniformly and densely. It is characterized by large pores nested with small pores and good connectivity (Figure 4 and Figure 12). OM pores found in Longmaxi Fm are mainly nanopore with bubble-like, oval-like, harbor-like, circular arc and irregular shapes. When OM and clay minerals present simultaneously, a large number of organic pores are arranged along the direction of filamentous illite.
As shown (Table 4, Figure 12 and Figure 13), the average length and width of OM pore in Longmaxi Fm of the upper Yangtze plate are 20.69 nm and 11.99 nm. The number and surface rate of OM pore are 114–354 (average, 270) and 2.15–14.31% (average, 6.85%). These parameters used to characterize OM pore were significantly higher than those in the Lower Cambrian. Probability entropy of OM pore in Longmaxi Fm is close to 1, indicating that pores are in disordered arrangement direction. With the increase in probability entropy, the arrangement of pores becomes more chaotic. Form factor and roundness of the Lower Cambrian shale are larger than those of the Lower Silurian shale, indicating that the OM pore in Lower Cambrian is closer to the circle, which is related to the higher maturity in the later stage. This phenomenon can be clearly demonstrated in the three-dimensional image of nano-CT [66]. Similar to the Barnett shale in North America, the pore size range of OM pore in the Lower Paleozoic marine shale from the upper Yangtze plate is less than 1 μm. Most OM pore diameter range within 100 nm, while larger pore size distribution is rare. When TOC content is roughly equal, the average OM porosity of the Longmaxi Fm is relative higher.

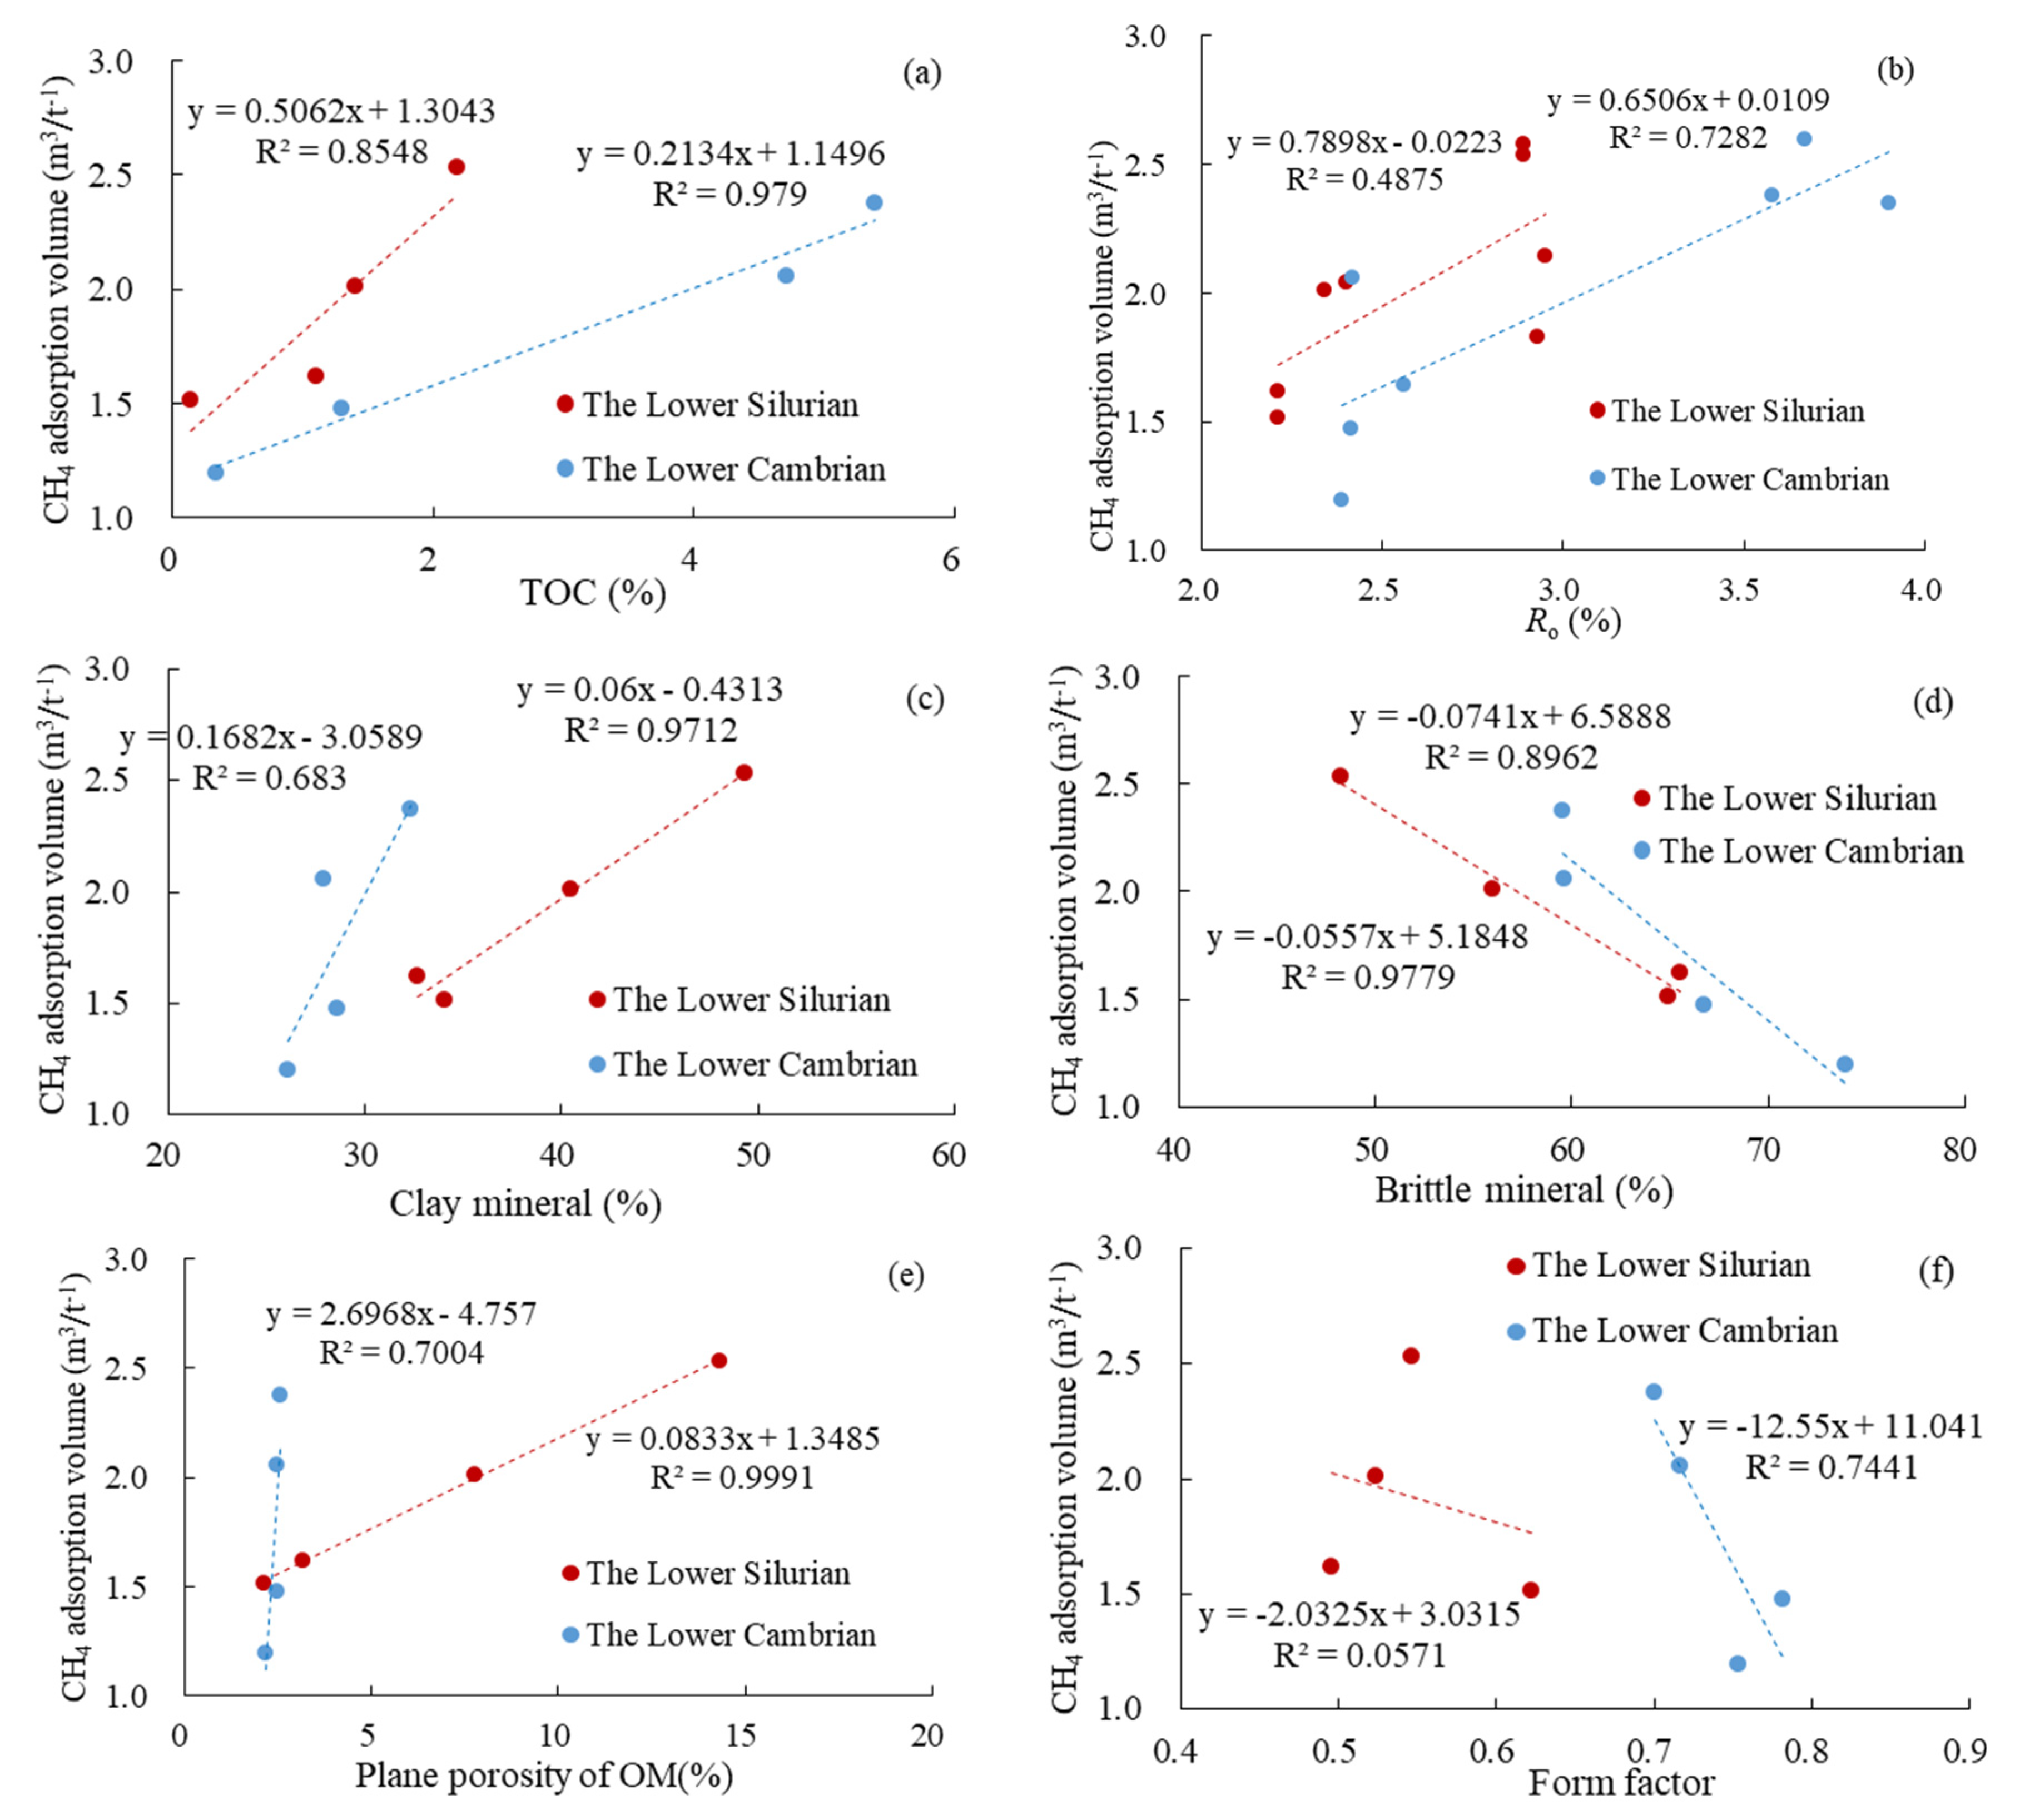
4.5. Methane Adsorption Capacity

Shale gas content is an important indicator for evaluating resource potential and identifying favorable zones for shale gas exploration. There are two main occurrence states of shale gas, namely, free state and adsorption state. The proportion of the two occurrence states of shale gas is different, but it is generally believed that the adsorbed gas content in marine shale reservoirs accounts for 20−85%. Rich organic matter, clay mineral content and microscopic pores provide favorable conditions for shale gas generation, adsorption and storage. Adsorption gas content is usually obtained by methane adsorption experiment and the Langmuir adsorption model, and it is the key factor for shale reservoir evaluation and shale gas resource favorable area evaluation.
The experimental results of methane adsorption and Langmuir adsorption isotherm are shown in Figure 14. The adsorption capacities of shale in Lower Silurian and Lower Cambrian of upper Yangtze plate are 1.51–3.86 m3/t (average, 2.31 m3/t) and 0.35–2.38 m3/t (average, 1.36 m3/t). According to the model method, the shale gas adsorption capacity of the Lower Silurian and Lower Cambrian in the upper Yangtze area is 1.47–3.98 m3/t and 0.61–2.59 m3/t, respectively. With the increase in TOC content, methane adsorption amount increases gradually. The methane adsorption capacity of Lower Cambrian shale is weaker than that of Lower Silurian shale, and that of marine shale is stronger than that of continental shale.

5. Discussion

5.1. Control Factors of Pore Structure

As shown in Figure 15 and Figure 16, TOC contents of the Qiongzhusi Fm in southern Sichuan Basin were significantly correlated with SSA of micropore, macropore, total pore and PV of micropore, and R2 was 0.94, 0.94, 0.86 and 0.94, respectively. However, TOC content of the Longmaxi Fm were clearly correlated with the SSA and PV of the different pore sizes, except those of macropore; R2 is between 0.982 and 0.999. Ro of Longmaxi Fm is positively correlated with SSA and PV of micropore. On the contrary, Ro is weakly negatively correlated with SSA and PV of Qiongzhusi Fm. There is negative correlation between the brittle mineral of Qiongzhusi Fm and SSA of micropore, macropore and micropore PV, R2 is 0.85, 0.88 and 0.85, respectively. The brittle mineral of Longmaxi Fm demonstrates a poor correlation with SSA and PV. Pores in the brittle minerals are less developed, and intergranular pores are mainly formed between brittle mineral particles. These pores are distributed very scattered, which results in weak negative correlations with the pore volumes and specific surface areas. The content of clay mineral of the Lower Paleozoic shale in southern Sichuan Basin showed a weak negative correlation with PV and SSA.
In northern Guizhou province, there is a significant positive correlation between TOC content of Niutitang Fm and micropore parameter, and the correlation coefficients R2 are 0.91 and 0.95. The correlation between TOC content and other pore parameters is weak. A similar situation prevails in Longmaxi Fm. The increase in PV micropore is the main reason for the increase in porosity caused by TOC content. The value of Ro is positively related to structure parameter of different pore size. In particular, significant positive relationships are found between Ro and the SSA and PV of micropore and total pore SSA of Longmaxi Fm, and the correlation coefficient R2 is 0.99, 0.99 and 0.97, respectively. There are good positive relationships between brittle mineral and micropore PV, micropore SSA and total SSA of Niutitang Fm, and R2 is 0.96, 0.94 and 0.89. The same correlation exists in the Longmaxi Fm. Meanwhile, clay mineral content showed a negative relationship with the structure parameters of different pore size, significant negative linear relationships with micropore PV, micropore SSA and total SSA of Niutitang Fm, coefficients R2 is 0.85, 0.84 and 0.97, respectively. Similarly, the correlation of Longmaxi Fm is relatively poor, and R2 is 0.88, 0.88 and 0.78.

5.2. Correlations between Pore Structure and Fractal Dimension

As shown in Figure 17, it can be seen from the scatter diagram that D1/D2 increases with increasing of PV and SSA, except for macropores, which indicates that reservoir heterogeneity is stronger, and the pore structure is more complex with the increase in pore SSA and PV. There is a positive correlation between D2 and micropore PV and micropore SSA of Longmaxi Fm in southern Sichuan Basin, and R2 is greater than 0.89. D1 is positively correlated with the mesopore PV and mesopore SSA of Qiongzhusi Fm in southern Sichuan Basin, and R2 is 0.73 and 0.54. A positive linear relationship is presented between D2 and the mesopore PV and SSA, and R2 is 0.45 and 0.54.
D2 is significantly positively correlated with micropore PV, SSA of Niutitang Fm in northern Guizhou province, and R2 is 0.9993 and 0.9943. By contrast, D1 is negatively correlated with PV and SSA. D1 is positively correlated with micropore PV and micropore SSA and macropore SSA of Longmaxi Fm in northern Guizhou province, and R2 are 0.60, 0.61 and 0.92. However, D2 is negatively correlated with mesopore PV and SSA, and positively correlated with macropore SSA, with R2 of 0.57, 0.31 and 0.75. The development of micropores increases D2, while the development of all pores, especially mesopore and macropores, weakens D1 of Niutitang Fm. On the contrary, the development of micropore increases D1, while the development of mesopore weakens D2 of Longmaxi Fm in southern Sichuan Basin.

5.3. Influence Factors of OM Pore Structure

Vertically, the TOC contents of the Lower Cambrian shale from the upper Yangtze plate were higher than that of the Lower Silurian. As shown in Figure 18a, there is a significant positive correlation between TOC and plane porosity of OM when TOC is 2–5%. After TOC > 5%, the plane porosity of OM decreases with the increase in TOC. The high TOC value promotes the carbonization of organic matter [68]. After the OM expelled some gas, the edge of OM pore is prone to collapse due to the compaction effect and the abnormal pressure in the hydrocarbon generation process [69,70,71]. This phenomenon leads to the closure or decrease in OM pore, thus reducing the porosity of OM and greatly changing the OM pore diameter. There is a negative linear relationship between the pore size of organic matter and TOC value Figure 18b. Similar to the North American Marcellus shale, it is easy to be compacted after TOC > 5.6%, which is not conducive to the preservation of OM pore. With the increase in Ro, shrinkage cracks at the edge of OM begin to appear, and internal micro-cracks are also visible in partial. The development degree of OM pore in the same sample showed significant differences under the same perspective. The OM pores of organic particle mixed with clay mineral such as illite are obviously more developed than those of single organic particles Figure 18c. It shows that clay minerals such as illite are beneficial to the development of organic pores. On the microscopic scale, brittle mineral plays a negative role in the development of OM pore Figure 18d. There are great differences in the degree of development of OM pore in different macerals. Micro-fracture and intraP pore were well developed in vitrinite, and OM pores were well developed in sapropelinite [68,72]. The bacteria and algae retain the original morphological characteristics of organisms with well-developed connectivity of their internal structure.

5.4. Controlling Factors of Shale Gas Content

As shown in Figure 19, TOC content and adsorption gas content of Lower Cambrian and Lower Silurian shale have a linear normal fitting relationship, and the correlation coefficients are 0.8548 and 0.949, respectively. A large number of micropores and mesopores are developed in OM, resulting in the larger plane porosity of OM. These pores can provide abundant methane molecular adsorption sites, which is conducive to the adsorption of shale gas. The maturity of the Lower Paleozoic shale in the upper Yangtze plate is in an over-mature stage, and it is positively correlated with methane adsorption capacity. The clay mineral content in shale reservoirs of Lower Silurian and Lower Cambrian has a positive impact on adsorption gas content, and the correlation coefficients are 0.9712 and 0.683. As the micropores in clay minerals contribute abundant SSA, they have a strong adsorption capacity for gas. The shale samples in this study have higher brittle mineral content on the whole, but adsorption capacity of brittle minerals is poor. InterP pores are mostly developed in brittle mineral layers with large pore volume, which is conducive to the enrichment of free gas to a certain extent and is not conducive to the occurrence of adsorption gas. The OM pore form factor of Lower Silurian and Lower Cambrian shale is negatively correlated with adsorbed gas content, and the correlation coefficient is 0.06 and 0.74, respectively. It shows that the pores with a small shape coefficient have more complex internal structure, which is beneficial to the adsorption of shale gas.
The TOC of the whole shale reservoir in the Lower Paleozoic of the upper Yangtze plate is large, with an average value of more than 2%. Ro is greater than 2% in an over-mature stage, and the brittle mineral content is high. Through isothermal adsorption tests and previous research results [36,38], the total gas content of Lower Silurian shale in the upper Yangtze region is significantly higher than that of Lower Cambrian shale. As shown in Figure 20, TOC, clay minerals and porosity are the main controlling factors for the difference in shale gas content between Lower Silurian and Lower Cambrian from the upper Yangtze plate. The probability entropy and OM plane porosity of the Lower Silurian are higher than those of Lower Cambrian shale, but form factor and roundness is smaller. In summary, shales of the Lower Silurian have more complex pore structure and irregular pores, and the adsorbed gas content is higher than that of Lower Cambrian shale.

6. Conclusions

The heterogeneity, pore structure and the main controlling factors of gas content of the Lower Silurian and Lower Cambrian from the upper Yangtze plate were studied through the characterization of the overall pore structure and organic matter pore, and measurement, simulation of shale gas adsorption. The important conclusions are as follows:
(1)
There are four main types of pore, including interP pore, intraP pore, OM pores and micro-fracture. Inkbottle-shaped, wedge-shaped, cylindrical, and slit-shaped tablets pores are the major pore morphology composition. The development of OM pores and porosity of the Lower Silurian is better than that of the Lower Cambrian.
(2)
The micropores of the Lower Cambrian shale provide major PV and SSA, accounting for 99.4% in Qiongzhusi Fm from southern Sichuan Basin and 80.6% in Niutitang Fm from northern Guizhou province, respectively. In addition to micropores, mesopores also provide the main PV and SSA of the Lower Silurian shale, accounting for more than 83.4%. Fractal dimensions representing pore structure complexity and heterogeneity gradually increase with the increase in PV and SSA.
(3)
There is a significant positive linear relationship between TOC content and micropores PV and SSA of the Lower Paleozoic shale, and the correlation of the Lower Silurian is more obvious than that of the Lower Cambrian. The development degree of shale pores is better with the increase in Ro. The plane porosity of OM pores increases with the increase in TOC when TOC of <5%. The plane porosity of OM pores is positively correlated with clay minerals content and negatively correlated with brittle minerals content.
(4)
The adsorption gas content of the Lower Silurian and Lower Cambrian shale are 1.51–3.86 m3/t (average, 2.31 m3/t) and 0.35–2.38 m3/t (average, 1.36 m3/t). TOC, clay minerals and porosity are the main controlling factors for the difference in shale gas content between Lower Silurian and Lower Cambrian. Probability entropy and OM plane porosity of the Lower Silurian are higher than those of Lower Cambrian shale, but form factor and roundness is smaller.

Author Contributions

Conceptualization, X.Z. and X.L.; methodology, X.Z.; software, X.Z.; validation, X.Z., X.L. and J.Z.; formal analysis, X.Z.; investigation, M.G.; resources, P.Z.; data curation, X.L.; writing—original draft preparation, X.Z.; writing—review and editing, X.Z., X.L., J.Z. and H.L.; visualization, X.Z.; supervision, X.L.; project administration, X.L.; funding acquisition, X.L. All authors have read and agreed to the published version of the manuscript.

Funding

This research was funded by the National Natural Science Foundation of China (Nos. U1810201, 41572125), the National Science and Technology Major Project of China (No. 2016ZX05007−003), and the National Program on Key Research Project (973 Program) (No. 2012CB214702−01), and the Fundamental Research Funds for the Central Universities (Nos. 2020YJSMT02, 2021YJSMT09).

Institutional Review Board Statement

Not applicable.

Informed Consent Statement

Not applicable.

Data Availability Statement

Not applicable.

Acknowledgments

We are indebted to Xianming Xiao and Qiang Wei for their insightful suggestions on the original manuscript. All the editors and anonymous reviewers are gratefully acknowledged.

Conflicts of Interest

The authors declare no conflict of interest.

References

  1. Wang, Q.; Chen, X.; Jha, A.N.; Rogers, H. Natural gas from shale formation—The evolution, evidences and challenges of shale gas revolution in United States. Renew. Sustain. Energy Rev. 2014, 30, 1–28. [Google Scholar] [CrossRef]
  2. Khan, I.; Zhong, N.N.; Luo, Q.Y.; Ai, J.Y.; Yao, L.P.; Luo, P. Maceral composition and origin of organic matter input in Neoproterozoic-Lower Cambrian organic-rich shales of Salt Range Formation, upper Indus Basin, Pakistan. Int. J. Coal Geol. 2020, 217, 103319. [Google Scholar] [CrossRef]
  3. Richard, M.; Pollastro, D.M.; Jarvie, R. Geologic framework of the Mississippian Barnett Shale, Barnett-Paleozoic total petroleum system, Bend archndashFort Worth Basin, Texas. AAPG Bull. 2007, 4, 405–436. [Google Scholar]
  4. Potter, C.J. Paleozoic shale gas resources in the Sichuan Basin, China. AAPG Bull. 2018, 102, 987–1009. [Google Scholar] [CrossRef]
  5. Chalmers, G.R.L.; Bustin, R.M. The organic matter distribution and methane capacity of the Lower Cretaceous strata of Northeastern British Columbia, Canada. Int. J. Coal Geol. 2007, 70, 223–239. [Google Scholar] [CrossRef]
  6. Curtis, J.B. Fractured shale-gas systems. AAPG Bull. 2002, 86, 1921–1938. [Google Scholar]
  7. Liu, S.G.; Jiao, K.; Zhang, J.C. Research progress on the pore characteristics of deep shale gas reservoirs: An example from the Lower Paleozoic marine shale in the Sichuan Basin. Nat. Gas Ind. 2021, 41, 29–41. [Google Scholar]
  8. Zou, C.N.; Yang, Z.; Dai, J.X.; Dong, D.Z.; Zhang, B.M.; Wang, Y.M.; Deng, S.H.; Huang, J.L.; Liu, K.Y.; Yang, C.; et al. The characteristics and significance of conventional and unconventional Siniane Silurian gas systems in the Sichuan Basin, central China. Mar. Pet. Geol. 2015, 64, 386–402. [Google Scholar] [CrossRef]
  9. Jarvie, D.M.; Hill, R.J.; Ruble, T.E.; Pollastro, R.M. Unconventional shale-gas systems: The Mississippian Barnett Shale of north-central Texas as one model for thermogenic shale-gas assessment. AAPG Bull. 2007, 91, 475–499. [Google Scholar] [CrossRef]
  10. Loucks, R.G.; Reed, R.M.; Ruppel, S.C.; Hammes, U. Spectrum of pore types and networks in mudrocks and a descriptive classification for matrix-related mudrock pores. AAPG Bull. 2012, 96, 1071–1098. [Google Scholar] [CrossRef] [Green Version]
  11. Cavelan, A.; Boussafir, M.; Rozenbaum, O.; Laggoun-Défarge, F. Organic petrography and pore structure characterization of low-mature and gas-mature marine organic-rich mudstones: Insights into porosity controls in gas shale systems. Mar. Pet. Geol. 2019, 103, 331–350. [Google Scholar] [CrossRef] [Green Version]
  12. Yang, C.; Zhang, J.C.; Tang, X.; Ding, J.H.; Zhao, Q.R.; Dang, W.; Chen, H.Y.; Su, Y.; Li, B.; Lu, D.F. Comparative study on micro-pore structure of marine, terrestrial, and transitional shales in key areas, China. Int. J. Coal Geol. 2017, 171, 76–92. [Google Scholar] [CrossRef]
  13. Fishman, N.S.; Hackley, P.C.; Lowers, H.A.; Hill, R.J.; Egenhoff, S.O.; Eberl, D.D.; Blum, A.E. The nature of porosity in organic–rich mudstones of the Upper Jurassic Kimmeridge Clay Formation, North Sea, offshore United Kingdom. Int. J. Coal Geol. 2012, 103, 32–50. [Google Scholar] [CrossRef]
  14. Yuan, Y.J.; Rezaee, R. Comparative Porosity and Pore Structure Assessment in Shales: Measurement Techniques, Influencing Factors and Implications for Reservoir Characterization. Energies 2019, 12, 2094. [Google Scholar] [CrossRef] [Green Version]
  15. Liu, Y.M.; Shen, B.; Yang, Z.Q.; Zhao, P.Q. Pore Structure Characterization and the Controlling Factors of the Bakken Formation. Energies 2018, 11, 2879. [Google Scholar] [CrossRef] [Green Version]
  16. Schieber, J. SEM Observations on ion-milled samples of Devonian Black Shales. AAPG Bull. 2013, 32, 153–171. [Google Scholar]
  17. Suchy, V.; Sykorova, I.; Stejskal, M.; Safanda, J.; Machovic, V.; Novotna, M. Dispersed organic matter from Silurian shales of the Barrandian Basin, Czech Republic: Optical properties, chemical composition and thermal maturity. Int. J. Coal Geol. 2002, 53, 1–25. [Google Scholar] [CrossRef]
  18. Bahadur, J.; Ruppert, L.F.; Pipich, V.; Sakurovs, R.; Melnichenko, Y.B. Porosity of the Marcellus Shale: A contrast matching small-angle neutron scattering study. Int. J. Coal Geol. 2018, 188, 156–164. [Google Scholar] [CrossRef]
  19. Bernard, S.; Horsfield, B.; Schulz, H.; Wirth, R.; Schreiber, A.; Sherwood, N. Geochemical evolution of organic-rich shales with increasing maturity: A STXM and TEM study of the Posidonia Shale (Lower Toarcian, northern Germany). Mar. Pet. Geol. 2012, 31, 70–89. [Google Scholar] [CrossRef]
  20. Clarkson, C.R.; Solano, N.; Bustin, R.M.; Bustin, A.M.M.; Chalmers, G.R.L.; He, L.; Melnichenko, Y.B.; Radliński, A.P.; Blach, T.P. Pore structure characterization of North American shale gas reservoirs using USANS/SANS, gas adsorption, and mercury intrusion. Fuel 2013, 103, 606–616. [Google Scholar] [CrossRef]
  21. Yao, S.P.; Jiao, K.; Zhang, K.; Hu, W.X.; Hai, D.; Li, M.C.; Pei, W.M. An atomic force microscopy study of coal nanopore structure. Chin. Sci. Bull. 2011, 56, 2706–2712. [Google Scholar] [CrossRef] [Green Version]
  22. Zhao, J.H.; Jin, Z.J.; Hu, Q.H.; Jin, Z.K.; Barber, T.J.; Zhang, Y.X.; Bleuel, M. Integrating SANS and fluid-invasion methods to characterize pore structure of typical American shale oil reservoirs. Sci. Rep. 2017, 7, 15413. [Google Scholar] [CrossRef]
  23. Zhao, D.F.; Guo, Y.H.; Wang, G.; Jiao, W.; Hui, Y. Quantitative characterization of nano-scale poresin shale reservoirs of Wufeng-Longmaxi formation based on image processing. Fresenius Environ. Bull. 2020, 29, 3992–3999. [Google Scholar]
  24. Zhang, J.Z.; Li, X.Q.; Wei, Q.; Sun, K.X.; Zhang, G.W.; Wang, F.Y. Characterization of Full-Sized Pore Structure and Fractal Characteristics of Marine-Continental Transitional Longtan Formation Shale of Sichuan Basin, South China. Energy Fuels 2017, 31, 10490–10504. [Google Scholar] [CrossRef]
  25. Medina-Rodriguez, B.X.; Alvarado, V. Use of Gas Adsorption and Inversion Methods for Shale Pore Structure Characterization. Energies 2021, 14, 2880. [Google Scholar] [CrossRef]
  26. Chen, S.B.; Zhu, Y.M.; Wang, H.Y.; Liu, H.L.; Wei, W.; Fang, J.H. Shale gas reservoir characterisation: A typical case in the southern Sichuan Basin of China. Energy 2011, 36, 6609–6616. [Google Scholar] [CrossRef]
  27. Zhang, M.; Zhong, Q.; Li, G.F.; Fu, X.H.; Duan, C.C.; Liu, H.H.; Xu, H.J. Fluid distribution and pore structure multifractal characteristics analysis of coal measure mudstone. J. Nat. Gas Sci. Eng. 2021, 88, 103810. [Google Scholar]
  28. Pomonis, P.J.; Tsaousi, E.T. Frenkel-Halsey-Hill Equation, Dimensionality of Adsorption, and Pore Anisotropy. Langmuir 2009, 25, 9986–99941. [Google Scholar] [CrossRef]
  29. Wu, J.; Liang, C.; Hu, Z.Q.; Yang, R.C.; Xie, J.; Wang, R.Y.; Zhao, J.H. Sedimentation mechanisms and enrichment of organic matter in the Ordovician Wufeng Formation-Silurian Longmaxi Formation in the Sichuan Basin. Mar. Pet. Geol. 2019, 101, 556–565. [Google Scholar] [CrossRef]
  30. Chen, L.; Lu, Y.; Jiang, S.; Li, J.; Guo, T.; Luo, C. Heterogeneity of the Lower Silurian Longmaxi marine shale in the southeast Sichuan Basin of China. Mar. Pet. Geol. 2015, 65, 232–246. [Google Scholar] [CrossRef]
  31. Jiang, Y.; Chen, L.; Qi, L.; Luo, M.; Chen, X.; Tao, Y.; Wang, Z. Characterization of the Lower Silurian Longmaxi marine shale in Changning area in the south Sichuan Basin, China. Geol. J. 2018, 53, 1656–1664. [Google Scholar] [CrossRef]
  32. Nie, H.; Jin, Z.; Zhang, J. Characteristics of three organic matter pore types in the Wufeng-Longmaxi Shale of the Sichuan Basin, Southwest China. Sci. Rep. 2018, 8, 7014. [Google Scholar] [CrossRef] [PubMed] [Green Version]
  33. Wang, Q.; Lu, H.; Wang, T.; Liu, D.; Peng, P.; Zhan, X.; Li, X. Pore characterization of Lower Silurian shale gas reservoirs in the Middle Yangtze region, central China. Mar. Pet. Geol. 2018, 89, 14–26. [Google Scholar] [CrossRef]
  34. Xue, H.; Jiang, P.; Xu, R.; Zhao, B.; Shangwen, Z. Characterization of the reservoir in Lower Silurian and Lower Cambrian shale of south Sichuan Basin, China. J. Nat. Gas Sci. Eng. 2016, 29, 150–159. [Google Scholar] [CrossRef]
  35. Li, A.; Ding, W.; He, J.; Dai, P.; Yin, S.; Xie, F. Investigation of pore structure and fractal characteristics of organic-rich shale reservoirs: A case study of Lower Cambrian Qiongzhusi formation in Malong block of eastern Yunnan Province, South China. Mar. Pet. Geol. 2016, 70, 46–57. [Google Scholar] [CrossRef]
  36. Li, X.Q.; Li, Y.Y.; Li, J.H.; Zou, X.Y.; Guo, M.; Wang, Z.; Zhang, X.Q.; Wang, F.Y. Characteristics of pore structures from the Lower Paleozoic shale gas reservoirs in northern Guizhou, South China. J. Nat. Gas Sci. Eng. 2020, 5, 241–253. [Google Scholar] [CrossRef]
  37. Chen, S.B.; Han, Y.F.; Fu, C.Q.; Zhang, H.; Zhu, Y.M.; Zuo, Z.X. Micro and nano-size pores of clay minerals in shale reservoirs: Implication for the accumulation of shale gas. Sediment. Geol. 2016, 342, 180–190. [Google Scholar] [CrossRef]
  38. Khan, M.Z.; Feng, Q.; Zhang, K.; Guo, W. Biogenic silica and organic carbon fluxes provide evidence of enhanced marine productivity in the Upper Ordovician-Lower Silurian of South China. Palaeogeogr. Palaeoclimatol. Palaeoecol. 2019, 534, 109278. [Google Scholar] [CrossRef]
  39. Curtis, M.E.; Cardott, B.J.; Sondergeld, C.H.; Rai, C.S. Development of organic porosity in the Woodford Shale with increasing thermal maturity. Int. J. Coal Geol. 2012, 103, 26–31. [Google Scholar] [CrossRef]
  40. Yan, D.; Li, S.; Fu, H.; Jasper, D.M.; Zhou, S.; Yang, X.; Zhang, B.; Mangi, H.N. Mineralogy and geochemistry of Lower Silurian black shales from the Yangtze platform, South China. Int. J. Coal Geol. 2021, 237, 103706. [Google Scholar] [CrossRef]
  41. Chen, Q.; Zhang, J.; Tang, X.; Li, W.; Li, Z. Relationship between pore type and pore size of marine shale: An example from the Sinian-Cambrian formation, upper Yangtze region, South China. Int. J. Coal Geol. 2016, 158, 13–28. [Google Scholar] [CrossRef]
  42. Han, Y.; Ran, B.; Liu, S.; Li, Z.; Ye, Y.; Sun, W.; Yang, D.; Wang, S. Main controlling factors of organic-matter enrichment in the Ordovician-Silurian marine organic-rich mudrock in the Yangtze Block, South China. Mar. Pet. Geol. 2021, 127, 104959. [Google Scholar] [CrossRef]
  43. Liu, L.; Tang, S.H.; Xi, Z.D. Total Organic Carbon Enrichment and Its Impact on Pore Characteristics: A Case Study from the Niutitang Formation Shales in Northern Guizhou. Energies 2019, 12, 1480. [Google Scholar] [CrossRef] [Green Version]
  44. Zhao, W.; Li, J.; Yang, T.; Wang, S.; Huang, J. Geological difference and its significance of marine shale gases in South China. Pet. Explor. Dev. 2016, 43, 547–559. [Google Scholar] [CrossRef]
  45. Zhang, K.; Song, Y.; Jiang, S.; Jiang, Z.; Jia, C.; Huang, Y.; Liu, X.; Wen, M.; Wang, X.; Li, X.; et al. Shale gas accumulation mechanism in a syncline setting based on multiple geological factors: An example of southern Sichuan and the Xiuwu Basin in the Yangtze Region. Fuel 2019, 241, 468–476. [Google Scholar] [CrossRef]
  46. Li, Q.; Pang, X.; Tang, L.; Chen, G.; Shao, X.; Jia, N. Occurrence features and gas content analysis of marine and continental shales: A comparative study of Longmaxi Formation and Yanchang Formation. J. Nat. Gas Sci. Eng. 2018, 56, 504–522. [Google Scholar] [CrossRef]
  47. Li, Z.; Oyediran, I.A.; Huang, R.; Hu, F.; Du, T.; Hu, R.; Li, X. Study on pore structure characteristics of marine and continental shale in China. J. Nat. Gas Sci. Eng. 2016, 33, 143–152. [Google Scholar] [CrossRef]
  48. Wang, F.; Guan, J.; Feng, W.; Bao, L. Evolution of overmature marine shale porosity and implication to the free gas volume. Pet. Explor. Dev. 2013, 40, 819–824. [Google Scholar] [CrossRef]
  49. Dai, J.; Zou, C.; Liao, S.; Dong, D.; Ni, Y.; Huang, J.; Wu, W.; Gong, D.; Huang, S.; Hu, G. Geochemistry of the extremely high thermal maturity Longmaxi shale gas, southern Sichuan Basin. Org. Geochem. 2014, 74, 3–12. [Google Scholar] [CrossRef]
  50. Feng, Z.; Dong, D.; Tian, J.; Qiu, Z.; Wu, W.; Zhang, C. Geochemical characteristics of Longmaxi Formation shale gas in the Weiyuan area, Sichuan Basin, China. J. Pet. Sci. Eng. 2018, 167, 538–548. [Google Scholar] [CrossRef]
  51. Wei, G.Z.; Zhu, D.S.; Liu, W.X.; Li, X.W.; Wang, P.; Xie, Z.H.; Wang, W.Q.; Jin, J.C. The Oil and Gas Industry Standard of the People’s Republic of China: Analytical Method of Rock Sample by Scanning Electron Microscope (SY/T 5162–2014); Petroleum Industry Press: Beijing, China, 2014. [Google Scholar]
  52. Liu, C.; Shi, B.; Zhou, J.; Tang, C. Quantification and characterization of microporosity by image processing, geometric measurement and statistical methods: Application on SEM images of clay materials. Appl. Clay Sci. 2011, 54, 97–106. [Google Scholar] [CrossRef]
  53. Tan, L.X.; Liu, X.; Cai, Y.X.; Wang, L.; He, W.W.; Gao, Y.; Zhou, S.H.; Chen, J.M.; Gao, J.; Yan, X.Y.; et al. Determination of the Specific Surface Area of Solids by Gas Adsorption Using the BET Method (GB/T 19587–2017); Standards Press of China: Beijing, China, 2017. [Google Scholar]
  54. Liu, X.; Xiong, J.; Liang, L. Investigation of pore structure and fractal characteristics of organic-rich Yanchang formation shale in central China by nitrogen adsorption/desorption analysis. J. Nat. Gas Sci. Eng. 2015, 22, 62–72. [Google Scholar] [CrossRef]
  55. Wei, Q.; Li, X.Q.; Hu, B.L.; Zhang, X.Q.; Zhang, J.Z.; He, Y.K.; Zhang, Y.C.; Zhu, W.W. Reservoir characteristics and coalbed methane resource evaluation of deep-buried coals: A case study of the No.13−1 coal seam from the Panji Deep Area in Huainan Coalfield, Southern North China. J. Pet. Sci. Eng. 2019, 179, 867–884. [Google Scholar] [CrossRef]
  56. Zhang, Q.L.; Zhang, S.A. Experimental Method of High-Pressure Isothermal Adsorption to Coal (GB/T 19560–2008); Standards Press of China: Beijing, China, 2008. [Google Scholar]
  57. Sakhaee-Pour, A.; Li, W.F.; Li, W. Fractal dimensions of shale. J. Nat. Gas Sci. Eng. 2016, 30, 578–582. [Google Scholar] [CrossRef]
  58. Hazra, B.; Wood, D.A.; Vishal, V.; Varma, A.K.; Sakha, D.; Singh, A.K. Porosity controls and fractal disposition of organic-rich Permian shales using low-pressure adsorption techniques. Fuel 2018, 220, 837–848. [Google Scholar] [CrossRef]
  59. Simon, R.E.; Johnson, S.C.; Khatib, O.; Raschke, M.B.; Budd, D.A. Correlative nano-spectroscopic imaging of heterogeneity in migrated petroleum in unconventional reservoir pores. Fuel 2021, 300, 120836. [Google Scholar] [CrossRef]
  60. Shao, X.H.; Pang, X.Q.; Li, Q.W.; Wang, P.W.; Chen, D.; Shen, W.B.; Zhao, Z.F. Pore structure and fractal characteristics of organic-rich shales: A case study of the Lower Silurian Longmaxi shales in the Sichuan Basin, SW China. Mar. Pet. Geol. 2017, 80, 192–202. [Google Scholar] [CrossRef]
  61. Ding, W.; Li, C.; Li, C.; Xu, C.; Jiu, K.; Zeng, W.; Wu, L. Fracture development in shale and its relationship to gas accumulation. Geosci. Front. 2012, 3, 97–105. [Google Scholar] [CrossRef] [Green Version]
  62. Katz, B.J.; Arango, I. Organic porosity: A geochemist’s view of the current state of understanding. Org. Geochem. 2018, 123, 1–16. [Google Scholar] [CrossRef]
  63. Wei, Q.; Hu, B.L.; Li, X.Q.; Feng, S.B.; Xu, H.J.; Zheng, K.G.; Liu, H.H. Implications of geological conditions on gas content and geochemistry of deep coalbed methane reservoirs from the Panji Deep Area in the Huainan Coalfield, China. J. Nat. Gas Sci. Eng. 2021, 85, 103712. [Google Scholar] [CrossRef]
  64. Zhang, J.Z.; Li, X.Q.; Xie, Z.Y.; Li, J.; Zhang, X.Q.; Sun, K.X.; Wang, F.Y. Characterization of microscopic pore types and structures in marine shale: Examples from the Upper Permian Dalong formation, Northern Sichuan Basin, South China. J. Nat. Gas Sci. Eng. 2018, 59, 326–342. [Google Scholar] [CrossRef]
  65. Chen, J.; Xiao, X. Evolution of nanoporosity in organic-rich shales during thermal maturation. Fuel 2014, 129, 173–181. [Google Scholar] [CrossRef]
  66. Wang, P.F.; Jiang, Z.X.; Chen, L.; Yin, L.S.; Li, Z.; Zhang, C.; Tang, X.L.; Wang, G.Z. Pore structure characterization for the Longmaxi and Niutitang shales in the Upper Yangtze Platform, South China: Evidence from focused ion beameHe ion microscopy, nano–computerized tomography and gas adsorption analysis. Mar. Pet. Geol. 2016, 77, 1323–1337. [Google Scholar] [CrossRef]
  67. Chen, M.F.; He, S.Y.; Yi, J.Z.; Zhang, B.Q.; Shu, Z.G.; He, C.C.; Yang, R.; Dong, T. Development characteristics of organic pore in shale gas reservoir of Wufeng Formation–Member1 of Longmaxi Formation in Pingqiao block, Fuling shale gas field. Acta Pet. Sin. 2019, 40, 423–433. [Google Scholar]
  68. Zhang, Y.Y.; Jiang, S.; He, Z.L.; Li, Y.C.; Xiao, D.S.; Chen, G.H.; Zhao, J.H. Coupling between Source Rock and Reservoir of Shale Gas in Wufeng-Longmaxi Formation in Sichuan Basin, South China. Energies 2021, 14, 2679. [Google Scholar] [CrossRef]
  69. Wang, Y.M.; Dong, D.Z.; Cheng, X.Z.; Huang, J.L.; Wang, S.F.; Wang, S.Q. Electric property evidences of the carbonification of organic matters in marine shales and its geologic significance: A case of the Lower Cambrian Qiongzhusi Shale in southern Sichuan Basin. Nat. Gas Ind. 2014, 34, 1–7. [Google Scholar] [CrossRef] [Green Version]
  70. Zhu, H.; Ju, Y.; Qi, Y.; Huang, C.; Zhang, L. Impact of tectonism on pore type and pore structure evolution in organic–rich shale: Implications for gas storage and migration pathways in naturally deformed rocks. Fuel 2018, 228, 272–289. [Google Scholar] [CrossRef]
  71. Ross, D.J.K.; Marc Bustin, R. The importance of shale composition and pore structure upon gas storage potential of shale gas reservoirs. Mar. Pet. Geol. 2009, 26, 916–927. [Google Scholar] [CrossRef]
  72. Cao, T.T.; Liu, G.X.; Cao, Q.G.; Deng, M. Influence of maceral composition on organic pore development in shale: A case study of transitional Longtan Formation shale in eastern Sichuan Basin. Oil Gas Geol. 2016, 37, 422–438. [Google Scholar]
Figure 1. Well location distribution map of the upper Yangtze plate, South China.
Energies 14 07603 g001
Figure 2. Geochemical characteristics of the Lower Paleozoic shale from southern Sichuan Basin (a) and northern Guizhou province (b).
Energies 14 07603 g002
Figure 3. Mineral content cylindrical (a) and triangular (b) graphs of the Lower Paleozoic shale from the upper Yangtze plate. (S11 = the Lower Silurian Longmaxi Fm, ∈1q = the Lower Cambrian Qiongzhusi Fm, ∈1n = the Lower Cambrian Niutitang Fm, Qtz = quartz, Cb = Carbonate mineral, Clay = Clay mineral, Dol = dolomite, Py = pyrite, Sme = smectite, Kln = kaolinite, Chl = chlorite, Ill = illite, I/S = illite/smectite).
Energies 14 07603 g003
Figure 4. Typical pore types in the FE-SEM (ae) and SEM (fi) images of the Lower Paleozoic shale from the upper Yangtze plate. ((a,b,de,h), OM pores; (c,d), IntraP pores; (ad,fi), InterP pores; (a,c,d), micro-fractures).
Energies 14 07603 g004
Figure 5. CO2 adsorption isotherms of the Lower Paleozoic shales in southern Sichuan Basin (a) and northern Guizhou province (b). (S11 = the Lower Silurian Longmaxi Fm, ∈1q = the Lower Cambrian Qiongzhusi Fm, ∈1n = the Lower Cambrian Niutitang Fm).
Energies 14 07603 g005
Figure 6. N2 adsorption isotherms of the Lower Paleozoic shales in southern Sichuan Basin (a) and northern Guizhou province (b). (S11 = the Lower Silurian Longmaxi Fm, ∈1q = the Lower Cambrian Qiongzhusi Fm, ∈1n = the Lower Cambrian Niutitang Fm).
Energies 14 07603 g006
Figure 7. The distribution of PV (a) and SSA (b) of the Lower Paleozoic shales in the upper Yangtze plate.
Energies 14 07603 g007
Figure 8. The distribution range graph of PV (a) and SSA (b) of the Lower Paleozoic shales in the upper Yangtze plate. (S11 = the Lower Silurian Longmaxi Fm, ∈1q = the Lower Cambrian Qiongzhusi Fm, ∈1n = the Lower Cambrian Niutitang Fm).
Energies 14 07603 g008
Figure 9. PSD curves of the Lower Paleozoic shales based on the HMIP in southern Sichuan Basin (a) and northern Guizhou province (b). (S11 = the Lower Silurian Longmaxi Fm, ∈1q = the Lower Cambrian Qiongzhusi Fm, ∈1n = the Lower Cambrian Niutitang Fm).
Energies 14 07603 g009
Figure 10. PSD curves of the Lower Paleozoic shale based on CO2 and N2 adsorption experiments in southern Sichuan Basin (a) and northern Guizhou province (b). (S11 = the Lower Silurian Longmaxi Fm, ∈1q = the Lower Cambrian Qiongzhusi Fm, ∈1n = the Lower Cambrian Niutitang Fm).
Energies 14 07603 g010
Figure 11. Plots of ln(V) vs. ln(ln(P0/P)) for typical shale samples based on the data from N2 adsorption experiments.
Energies 14 07603 g011
Figure 12. OM pores in the FE-SEM images of the Lower Paleozoic shale from the upper Yangtze plate ((ad), Longmaxi Fm shale sample; (eh), Qiongzhusi Fm shale sample).
Energies 14 07603 g012
Figure 13. PSD of OM pores in the FE-SEM images of the Lower Paleozoic shale from the upper Yangtze plate ((ad) Longmaxi Fm; (e) Qiongzhusi Fm; (f) Niutitang Fm).
Energies 14 07603 g013
Figure 14. Methane isothermal adsorption curves (a) and gas content (b) of the Lower Paleozoic shale from the upper Yangtze plate.
Energies 14 07603 g014
Figure 15. Relationship between TOC, Ro and pore structure parameters of the Lower Paleozoic shale from the upper Yangtze plate.
Energies 14 07603 g015
Figure 16. Relationship between mineral content and pore structure parameters of the Lower Paleozoic shale from the upper Yangtze plate.
Energies 14 07603 g016
Figure 17. Relationships between D1/D2 and pore structure parameter ((a,b) Longmaxi Fm in southern Sichuan Basin. (c,d) Qiongzhusi Fm in southern Sichuan Basin. (e,f) Longmaxi Fm in northern Guizhou province. (g,h) Niutitang Fm in northern Guizhou province).
Energies 14 07603 g017
Figure 18. Relationship between TOC (a,b), clay mineral contents (c), brittle mineral contents (d) and OM pore of the Lower Paleozoic shale from the upper Yangtze Plate.
Energies 14 07603 g018
Figure 19. Relationship between CH4 adsorption volume and TOC (a), Ro (b), clay mineral (c), brittle mineral (d), plane porosity of OM (e), form factor (f) of the Lower Paleozoic shale from the upper Yangtze Plate.
Energies 14 07603 g019
Figure 20. Comprehensive analysis of main controlling factors of the Lower Paleozoic shale from the upper Yangtze plate.
Energies 14 07603 g020
Table 1. Mineral composition and geochemical characteristics of shale samples of the Lower Cambrian from the upper Yangtze plate.
RegionStrataWell NameSample NumberDepth h/mTOC/%Ro/%Porosity p/%Content of Whole Rock Mineral/%
QtzFelCalDolPyOthersClay
Southern Sichuan BasinLongmaxiSCL-03SCL-03-012100.80.152.212.3517.412.423.911.2111.234.1
SCL-03-022156.70.22.27-20.14.331.65.70.85.737.5
SCL-03-032208.20.342.352.5414.76.135.79.11.59.132.9
SCL-03-042268.91.112.213.117.33.5368.71.88.732.7
SCL-03-052291.80.752.364.4319.44.3110.00.519.944.9
SCL-03-062317.11.032.284.5823.66.714.910.21.310.243.3
SCL-03-072341.31.412.346.3629.9911.85.33.55.340.5
SCL-03-082362.31.52.42-26.87.513.19.42.69.440.6
SCL-03-092380.64.382.406.8728.54.116.317.44.417.429.3
QiongzhusiSCQ-06SCQ-06-012564.00.342.391.3540.126.72.44.70.0-26.1
SCQ-06-022684.02.062.222.8232.120.91.811.09.2-25.0
SCQ-04SCQ-04-034229.01.542.512.3631.722.51.40.015.9-26.5
SCQ-09SCQ-09-044966.44.712.42-28.410.97.213.19.3-27.9
SCQ-01SCQ-01-055030.42.152.562.874217.50.17.24.1-29.1
SCQ-01-065032.51.302.42-40.7108.57.54.7-28.6
Northern Guizhou ProvinceLongmaxiGYL-02GYL-02-0154.00.802.898.0826.665.378.72.490.9-55.85
GYL-02-0258.50.702.854.8225.607.504.61.551.2-59.53
GYL-02-0366.00.852.795.7629.946.483.21.521.30.2857.25
GYL-02-0470.52.192.894.9833.4710.214.00.552.5-49.32
GYL-02-0576.23.132.932.8646.406.799.24.023.80.4229.39
GYL-02-0689.03.552.951.5642.456.3710.22.503.6-34.91
NiutitangGYN-01GYN-01-0120.55.993.4513.3740.479.42--5.20.8744.05
GYN-01-0224.04.243.674.0130.2619.88-1.84.41.2342.36
GYN-01-0329.25.39-2.2939.6319.380.5-4.04.132.37
GYN-01-0438.86.99-1.8244.5615.21-6.34.50.4828.92
GYN-01-0543.26.193.901.3036.5822.36-5.55.61.0029.01
Note: (Qtz = quartz; Fel = feldspar; Cal = calcite; Dol = dolomite; Py = pyrite; Sme = smectite; Kln = kaolinite; Chl = chlorite; Ill = illite; I/S = illite/smectite).
Table 2. PV and SSA of the Lower Paleozoic shales from the upper Yangtze plate.
SamplePV (cm3/g)SSA (m2/g)
MicroporeMesoporeMacroporeTotalMicroporeMesoporeMacroporeTotal
SCL-03-010.00090.00810.00190.01093.646.600.0010.24
SCL-03-040.00170.01050.00180.01416.118.020.0014.14
SCL-03-070.00250.01020.00260.01538.357.840.0016.19
SCL-03-090.00470.01590.00430.025015.8713.530.0029.40
SCQ-06-010.00050.00510.00140.00710.003.322.395.71
SCQ-09-020.00400.00500.00390.01290.004.4612.9317.40
SCQ-01-040.00120.00180.00110.00420.001.294.746.02
SCQ-01-060.00130.00080.00000.00210.000.725.225.94
GYL-02-010.00260.01630.00210.02108.7410.300.0019.04
GYL-02-040.00320.01210.00240.017810.988.190.0019.17
GYL-02-050.00440.01410.00280.021314.819.820.0024.63
GYL-02-060.00480.01570.00600.026516.2710.680.0026.95
GYN-01-020.00290.00660.00010.009611.114.930.0016.04
GYN-01-030.00380.01670.00000.020513.9111.370.0025.28
GYN-01-040.00550.00860.00010.014219.317.890.0027.21
GYN-01-050.00520.01380.00010.019119.1310.360.0129.50
Table 3. Pore fractal dimensions D1, D2, and R2 derived from fractal FHH model.
SamplesP/P0: 0–0.5P/P0: 0.5–1.0
A1D1R12A2D2R22
SCL-03-01−0.39912.60090.9985−0.13792.86210.9149
SCL-03-02−0.46522.53480.9711−0.12322.87670.9111
SCL-03-03−0.42722.57280.9831−0.11542.88460.9088
SCL-03-04−0.40172.59830.9827−0.15442.84560.962
SCL03-05−0.39692.60310.9901−0.13352.86650.9614
SCL-03-06−0.40852.59150.9944−0.15402.84600.9453
SCL-03-07−0.47272.52730.9587−0.13692.86310.9536
SCL-03-08−0.43612.56390.9601−0.13702.86300.9644
SCL-03-09−0.38042.61960.9589−0.11912.88090.9496
SCQ-06-01−0.33952.66050.9801−0.17942.82060.9779
SCQ-09-04−0.49152.50850.9354−0.10762.89240.9481
SCQ-01-05−0.66522.33480.9370−0.14562.85440.9771
SCQ-01-06−0.62482.37520.9924−0.28972.71030.9861
GYL-02-01−0.51002.49000.9986−0.16512.83490.9619
GYL-02-04−0.35442.64560.9952−0.14902.85100.9729
GYL-02-05−0.32572.67430.9801−0.14192.85810.9730
GYL-02-06−0.35442.64560.9886−0.16062.83940.9781
GYN-01-02−0.44262.55740.9984−0.23352.76650.9746
GYN-01-03−0.64392.35610.9970−0.20742.79260.9316
GYN-01-04−0.43202.56800.9759−0.15072.84930.9312
GYN-01-05−0.68792.31210.9952−0.18592.84000.9128
Table 4. Characteristics of OM in the Lower Paleozoic shale from the upper Yangtze plate.
SampleTotal Region AreaRegion NumberRegion PercentageAverage PerimeterForm FactorAverage LengthAverage WidthProbability EntropyRoundness
SCL-03-01117,39235014.3174.480.5523.5414.290.990.46
SCL-03-0469,5923547.7663.920.5220.5312.930.970.53
SCL-03-0728,6972613.1852.70.4918.449.670.970.52
SCL-03-0919,1691142.1555.580.6220.2511.060.950.55
SCQ-01-054878972.1828.950.7511.233.80.730.64
SCQ-06-011212442.4730.50.7813.33.490.800.76
GYN-01-0417761081.2115.980.725.753.670.930.64
PY-01 [67]/4321.5/0.74/32.70.8/
PY-02 [67]/9012/0.79/22.70.91/
PY-03 [67]/17014.6/0.77/240.88/
PY-04 [67]/11013.1/0.73/290.89/
PY-05 [67]/699.9/0.73/38.70.89/
PY-06 [67]/895.6/0.77/32.60.93/
PY-07 [67]/384/0.75/47.10.86/
PY-08 [67]/11612.5/0.73/111.90.93/
PY-09 [67]/873.5/0.88/35.10.95/
PY-10 [67]/941.9/0.75/330.9/
PY-11 [67]/2165.4/0.74/17.70.94/
PY-12 [67]/47817.4/0.67/36.80.97/
PY-13 [67]/737/0.66/22.10.92/
PY-14 [67]/7119.7/0.68/57.80.85/
Publisher’s Note: MDPI stays neutral with regard to jurisdictional claims in published maps and institutional affiliations.

