1. Introduction
Numerical methods such as the finite element method (FEM) are effective tools for analysing and modelling electrical machines. These methods enable investigations of machine static and dynamic states while accounting for machine geometry, material properties of its components and also phenomena such as magnetic saturation of stator and rotor cores and the skin effect in rotor cage bars of induction motors (IMs). However, these methods are time consuming and complex. In fact, this eliminates their use in the applications where the rate of obtaining information on the current machine state plays a significant role, e.g., control of high-performance electrical machine drives. The control schemes are developed based on the space-vector models which are characterised by much lower computational complexity compared to the finite element (FE) models, and thus their microprocessor implementation does not pose too many difficulties.
The major problem related to the use of the IM space-vector models in the field oriented control (FOC) schemes is the variability of IM electromagnetic parameters. This variability results from the changes of motor winding temperature, stator and rotor core saturation, as well as the rotor deep-bar effect [
1]. The lack of capability of proper representation of the variability of IM electromagnetic parameters by the space-vector model with constant parameters results in inaccurate orientation of the control space vectors. This, in turn, is associated with precision deterioration of decoupling effectiveness of electromagnetic torque and rotor flux amplitude control paths, thus deteriorating the overall performance of the FOC [
2,
3].
Development of the IM space-vector model that would include the electromagnetic parameter variability of the real IM has been a subject investigated in many research institutions around the world [
4,
5,
6,
7,
8,
9,
10,
11,
12,
13,
14,
15,
16,
17,
18,
19,
20]. In the literature, i.a., [
4,
5], the control schemes of IM drives were presented which were based on the space-vector model extended with algorithms tracking the variability of selected IM electromagnetic parameters. These algorithms constitute the additional estimators in the IM control scheme to the one responsible for determination of the adopted coordinate system phase position, and so the orientation of the control space vectors. Despite the efficiency of these estimators, their use increases the computational complexity of the control scheme. Alternatively, the variability of selected IM electromagnetic parameters can be represented by model parameters varying as a function of changes in specified physical parameters. In the work [
6] the inverse magnetising inductance and leakage inductances of the T-type IM equivalent circuit were expressed as a function of the magnetising flux. A different approach was reported in another work [
7] where the stator and slot-bridge leakage inductances of the Γ-type IM equivalent circuit were defined as a function of the stator flux and the slot-bridge leakage flux, respectively. In other studies [
8,
9] the rotor resistance variability resulting from the deep-bar effect was conditioned by slip frequency changes. In a number of studies, the variability of IM electromagnetic parameters related to the rotor deep-bar effect was modelled by the IM space-vector models with the rotor represented by the cascade connection of two-terminal-pair networks [
7,
10,
11,
12,
13,
14,
15,
16,
17,
18,
19,
20,
21]. Relying on such a model, the airgap-flux-oriented control [
20,
22] and pseudorotor-flux-oriented control [
23] schemes were developed. In the work [
24] the presented theoretical basis led to the formulation of the rotor flux space-vector estimator based on the IM space-vector model with the rotor two-terminal network representation. This allows the implementation of the rotor-flux-oriented control scheme with the use of such a model.
Electromagnetic parameters of the IM equivalent circuit including the rotor deep-bar effect can be determined through an estimation process where the approximation accuracy of the investigated IM reference characteristic by the characteristic resulting from the adopted mathematical model is put to use as the parameter selection criterion. Numerous experimental procedures for determination of the IM reference characteristics were proposed in the literature. In [
10] the reference characteristic of the tested IM constituted the stator current response to the DC step voltage disturbance applied across stator terminals at standstill. In another study, [
11], the characteristics of the instantaneous input impedances of the tested IMs were considered as the reference. These characteristics were determined based on the measurement of stator voltages, currents and shaft angular velocity during a direct startup.
In many studies the electromagnetic parameter estimation of the space-vector IM model with the rotor two-terminal-pair network representation was conducted based on IM frequency characteristics. The use of these types of reference characteristics is particularly justified in the case of the estimation of the IM space-vector model parameters representing the variability of IM electromagnetic parameters conditioned by slip frequency changes. The rotor-cage impedance frequency characteristic was used in [
7]. This characteristic was determined based on a series of locked-rotor tests where the stator frequency varied in the considered range with maintaining constant magnitude of the stator current. In other works [
12,
13] the IM impedance frequency characteristics obtained from the phase-to-phase standstill variable frequency test were adopted as the reference. Another approach for determination of the reference frequency characteristic was reported in [
14]. In this work the electromagnetic parameter estimation was conducted based on the inductance frequency characteristic which was determined using the measurement data derived from the load curve test (LCT).
Realisation of the above-mentioned measurement procedures for determination of the IM reference characteristics can cause some problems, especially in the industrial conditions. In this case, electromagnetic parameters of the IM space-vector models can be calculated or estimated with the use of analytical or numerical methods.
The papers [
15,
16] present analytical investigations where the rotor bar was split into a finite number of sections such that the current density was approximately uniform along the depth of each section. This allowed for calculation of electromagnetic parameters for each section based on its geometry and material properties. Then, these parameters were included in the adopted equivalent circuits with the rotor two-terminal-pair network representation.
Analytical methods can also be used to determine the IM reference frequency characteristics for the estimation of electromagnetic parameters of the IM equivalent circuit including the rotor deep-bar effect. In [
17] the electromagnetic field analysis was carried out based on the IM multi-layer model and as a result the Laplace-domain inductance was formulated. This inductance, as an IM transfer function, can be represented in the form of frequency characteristics. In another study [
18] the rotor resistance and self-inductance variability were calculated from the Poynting flux after solving the electromagnetic field problem formulated for the simplified rotor bar model. Subsequently, the obtained frequency characteristics were considered as a reference in the electromagnetic parameter estimation for the rotor equivalent circuit composed of cascade connected Π-networks. A different analytical investigation was reported in [
19] where the electromagnetic field problem was formulated for the multiple-cage rotor bar model and as a result the expressions for the self-impedance of each conductor as well as the mutual inductances between conductors were formulated. Based on these expressions the frequency characteristics of rotor resistance and inductance can be determined.
Analytical methods are characterised by certain constraints, i.e., the simplified geometry of motor and rotor cage bar models, isotropic material properties and a model feeding usually reduced to the current fundamental harmonic. These all affect the accuracy of electromagnetic field calculations and so the electromagnetic parameter estimation for the IM space-vector models. The FEM is devoid of such constraints and allows one to model the exact IM geometry and material properties of its individual components without limiting the model feeding to the current fundamental harmonic. For this reason, the FEM is an attractive alternative to the measurement procedures for the reference characteristic determination in the electromagnetic parameter estimation of the IM space-vector models. In the work [
20], the FEM was used to determine the variability of the rotor bar impedance as a function of slip frequency and subsequently the obtained characteristic was employed in the electromagnetic parameter estimation. In another paper [
21], the FEM served for simulation of the impulse response test of the investigated IM, the results of which were used for the electromagnetic parameter estimation of the IM space-vector model with the rotor represented by two parallel connected two-terminals.
In this paper we are proposing an effective optimisation technique for the IM FE model based on the measurement of stator voltages and currents and shaft speed conducted during IM no-load operation. The overall goal is to develop a procedure for the electromagnetic parameter estimation of the IM space-vector models including the rotor deep-bar effect which constitutes an alternative for the procedure based on the LCT conducted experimentally, since its practical implementation can cause some difficulties. The main contributions to the state of the art presented in this paper are the following:
The methodology based on the LCT simulation performed by the FEM for determination of the reference frequency characteristic, intended for the electromagnetic parameter estimation of the IM space-vector models, where the measurement conducted under the IM no-load operation is only required;
The theoretical background supported by the results of a number of FEM simulations indicating the impact of adjustments of the FE-model selected parameters (e.g., geometric dimensions, material properties of model components or damping coefficient) on the individual stator current space-vector components and the slip frequency; and
The validation of the proposed optimisation technique for the IM FE model and the procedure for the electromagnetic parameter estimation of the IM space-vector model through experiments performed on an industrial IM.
The structure of the paper consists of six sections. The IM space-vector model including the rotor deep-bar effect is concisely described in
Section 2. This section also includes the procedure for the electromagnetic parameter estimation for such a model based on the reference frequency characteristic derived from the LCT carried out experimentally.
Section 3 discusses the theoretical background which demonstrates the influence of the FE-model selected parameter modifications on the individual stator current space-vector components and the slip frequency.
Section 4 includes the results of IM operation simulations conducted by the FEM which prove the theoretical considerations from
Section 3.
Section 5 describes the optimisation process of the FE model and confirms that the use of the optimised FE model enables accurate modelling of the actual IM operation. This translates into the reliable estimation of electromagnetic parameters for the IM equivalent circuit including the rotor deep-bar effect. The conclusions are collected in
Section 6.
The paper also includes four appendices:
Appendix A presents the rated values of the investigated IM corresponding to the adopted operating point, the cross-section dimensions and the material properties of the IM individual components. In
Appendix B, the IM modelling procedure employing the FEM is concisely described. Then, a short description of the laboratory test bench is included in
Appendix C. The evaluation function and the GA settings employed in the presented studies are given in
Appendix D.
3. Optimisation of the FE Model Based on the No-Load Test Measurement
The realisation of the LCT entails the need to apply a braking mechanism for controlling of the tested IM load which may pose difficulties in industrial conditions, especially in relation to high-power machines. Alternatively, the LCT can be simulated with the use of the FEM. This method enables analysis and modelling of the IM operation under steady and transient states with accuracy dependant on the FE-model fidelity to the real motor.
For the FE-model construction, knowledge of geometric dimensions and material properties of individual IM components is required. Based on this information, iron and winding losses and the reactive power required for magnetic flux generation are modelled. This knowledge is complemented by the information on friction and windage losses. The geometric dimensions with the assumed tolerance and the material properties of machine components are included in the manufacturer’s catalogues, while the information on friction and windage losses is usually acquired through the experimental test. Incorrect geometric dimensions of the FE model, inaccurately defined material properties of its components or wrongly determined friction and windage losses bring errors in modelling of considered IM operation under the LCT simulation. This, in turn, has an impact on correctness of the inductance frequency characteristic determination and, consequently, estimated electromagnetic parameters for the IM space-vector model.
Figure 2 presents the stator voltage and current space vectors under various IM load conditions. These space vectors are expressed in the coordinate system (
x-
y) that rotates synchronously with the stator voltage (SV) space vector. When the SV space vector is oriented towards the
x-axis of the adopted coordinate system
, the
x-axis and
y-axis components of the stator current (SC) space vector determine the total input active and reactive power of the considered IM, respectively. In such a coordinate system, the changes of the motor load involve the linear changes of the
x-axis component of the SC space vector
. At the same time, the
y-axis component of the SC space vector
, determining the IM demand for the reactive power for magnetic flux generation, is maintained at approximately the same level with changes of the IM load within its rated range. Thus, with IM load changes, the SC space vector moves along a straight line parallel to the
x-axis of the adopted coordinate system and shifted against the
x-axis by amplitude of the
y-axis component of the SC space vector (
Figure 2).
Under no-load operation when the load torque is equal to zero the x-axis component of the SC space vector determines the input active power consumed by the machine to cover the power losses including iron, winding, friction and windage losses. Therefore, the knowledge of the x-axis component of the SC space vector supplemented by the information on the slip frequency of the considered IM allows one to optimise the FE model in terms of the generated power losses by adjusting the damping coefficient or conductivity of the rotor cage or machine cores. Whereas the knowledge on the y-axis component of the SC space vector enables optimisation of the FE model with respect to reactive power consumption by adapting the magnetic properties of machine cores or the airgap thickness.
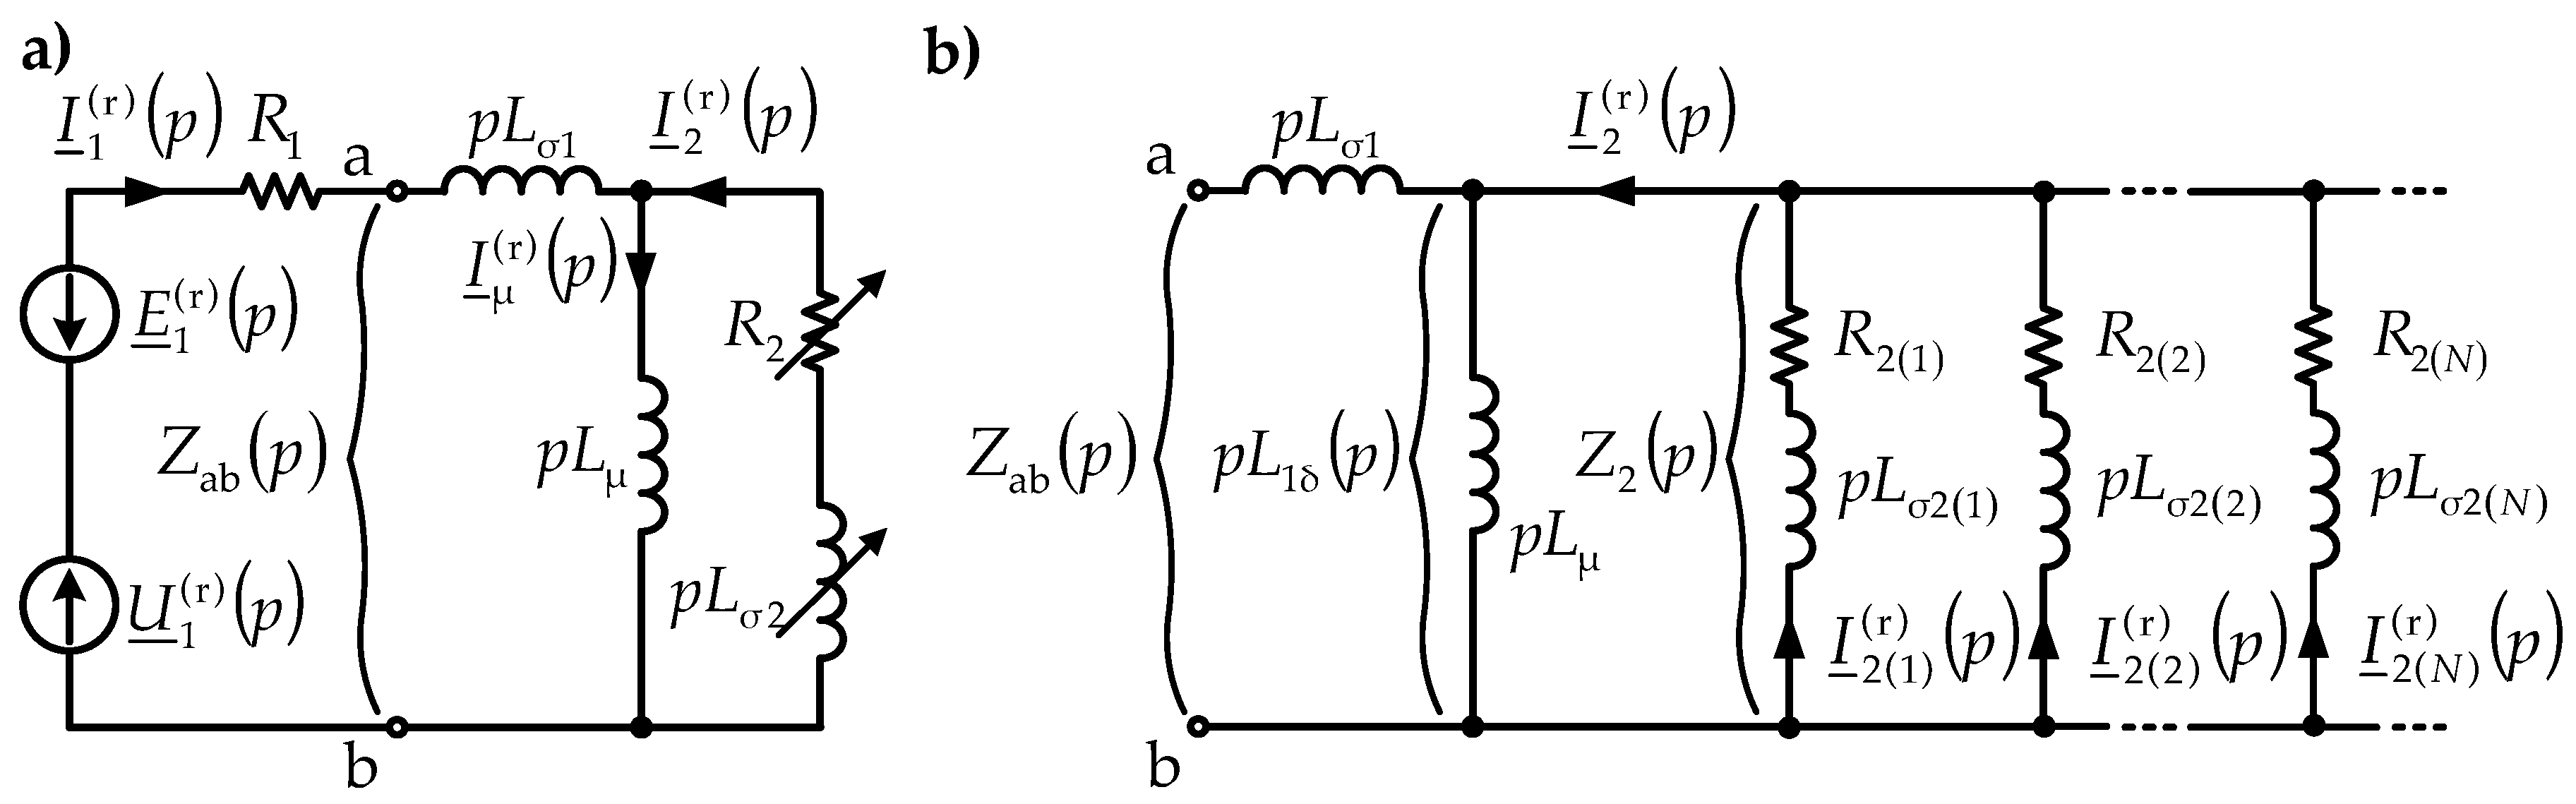
Concluding the above discussion, the measurement of the stator instantaneous voltages and currents carried out under no-load operation and complemented by the no-load shaft angular velocity measurement provides sufficient information on how to optimise the FE model. In cases where the tested IM is supplied directly from the AC line, the complex RMS values of the stator voltage and current can be used in place of the SV and SC space vectors since FE-model optimisation can be conveniently conducted on the data measured during the IM steady state operation. The optimised FE model can then be employed for simulation of the IM operation under the LCT. Based on the data derived from the LCT simulation, the IM inductance frequency characteristic
L1(
ω2) is determined which can be subsequently used as the reference characteristic in the electromagnetic parameter estimation for the IM space-vector model with the rotor two-terminal network representation (
Figure 1b).
4. Impact of Motor FE-Model Parameters on SC Space-Vector Components and Slip Frequency
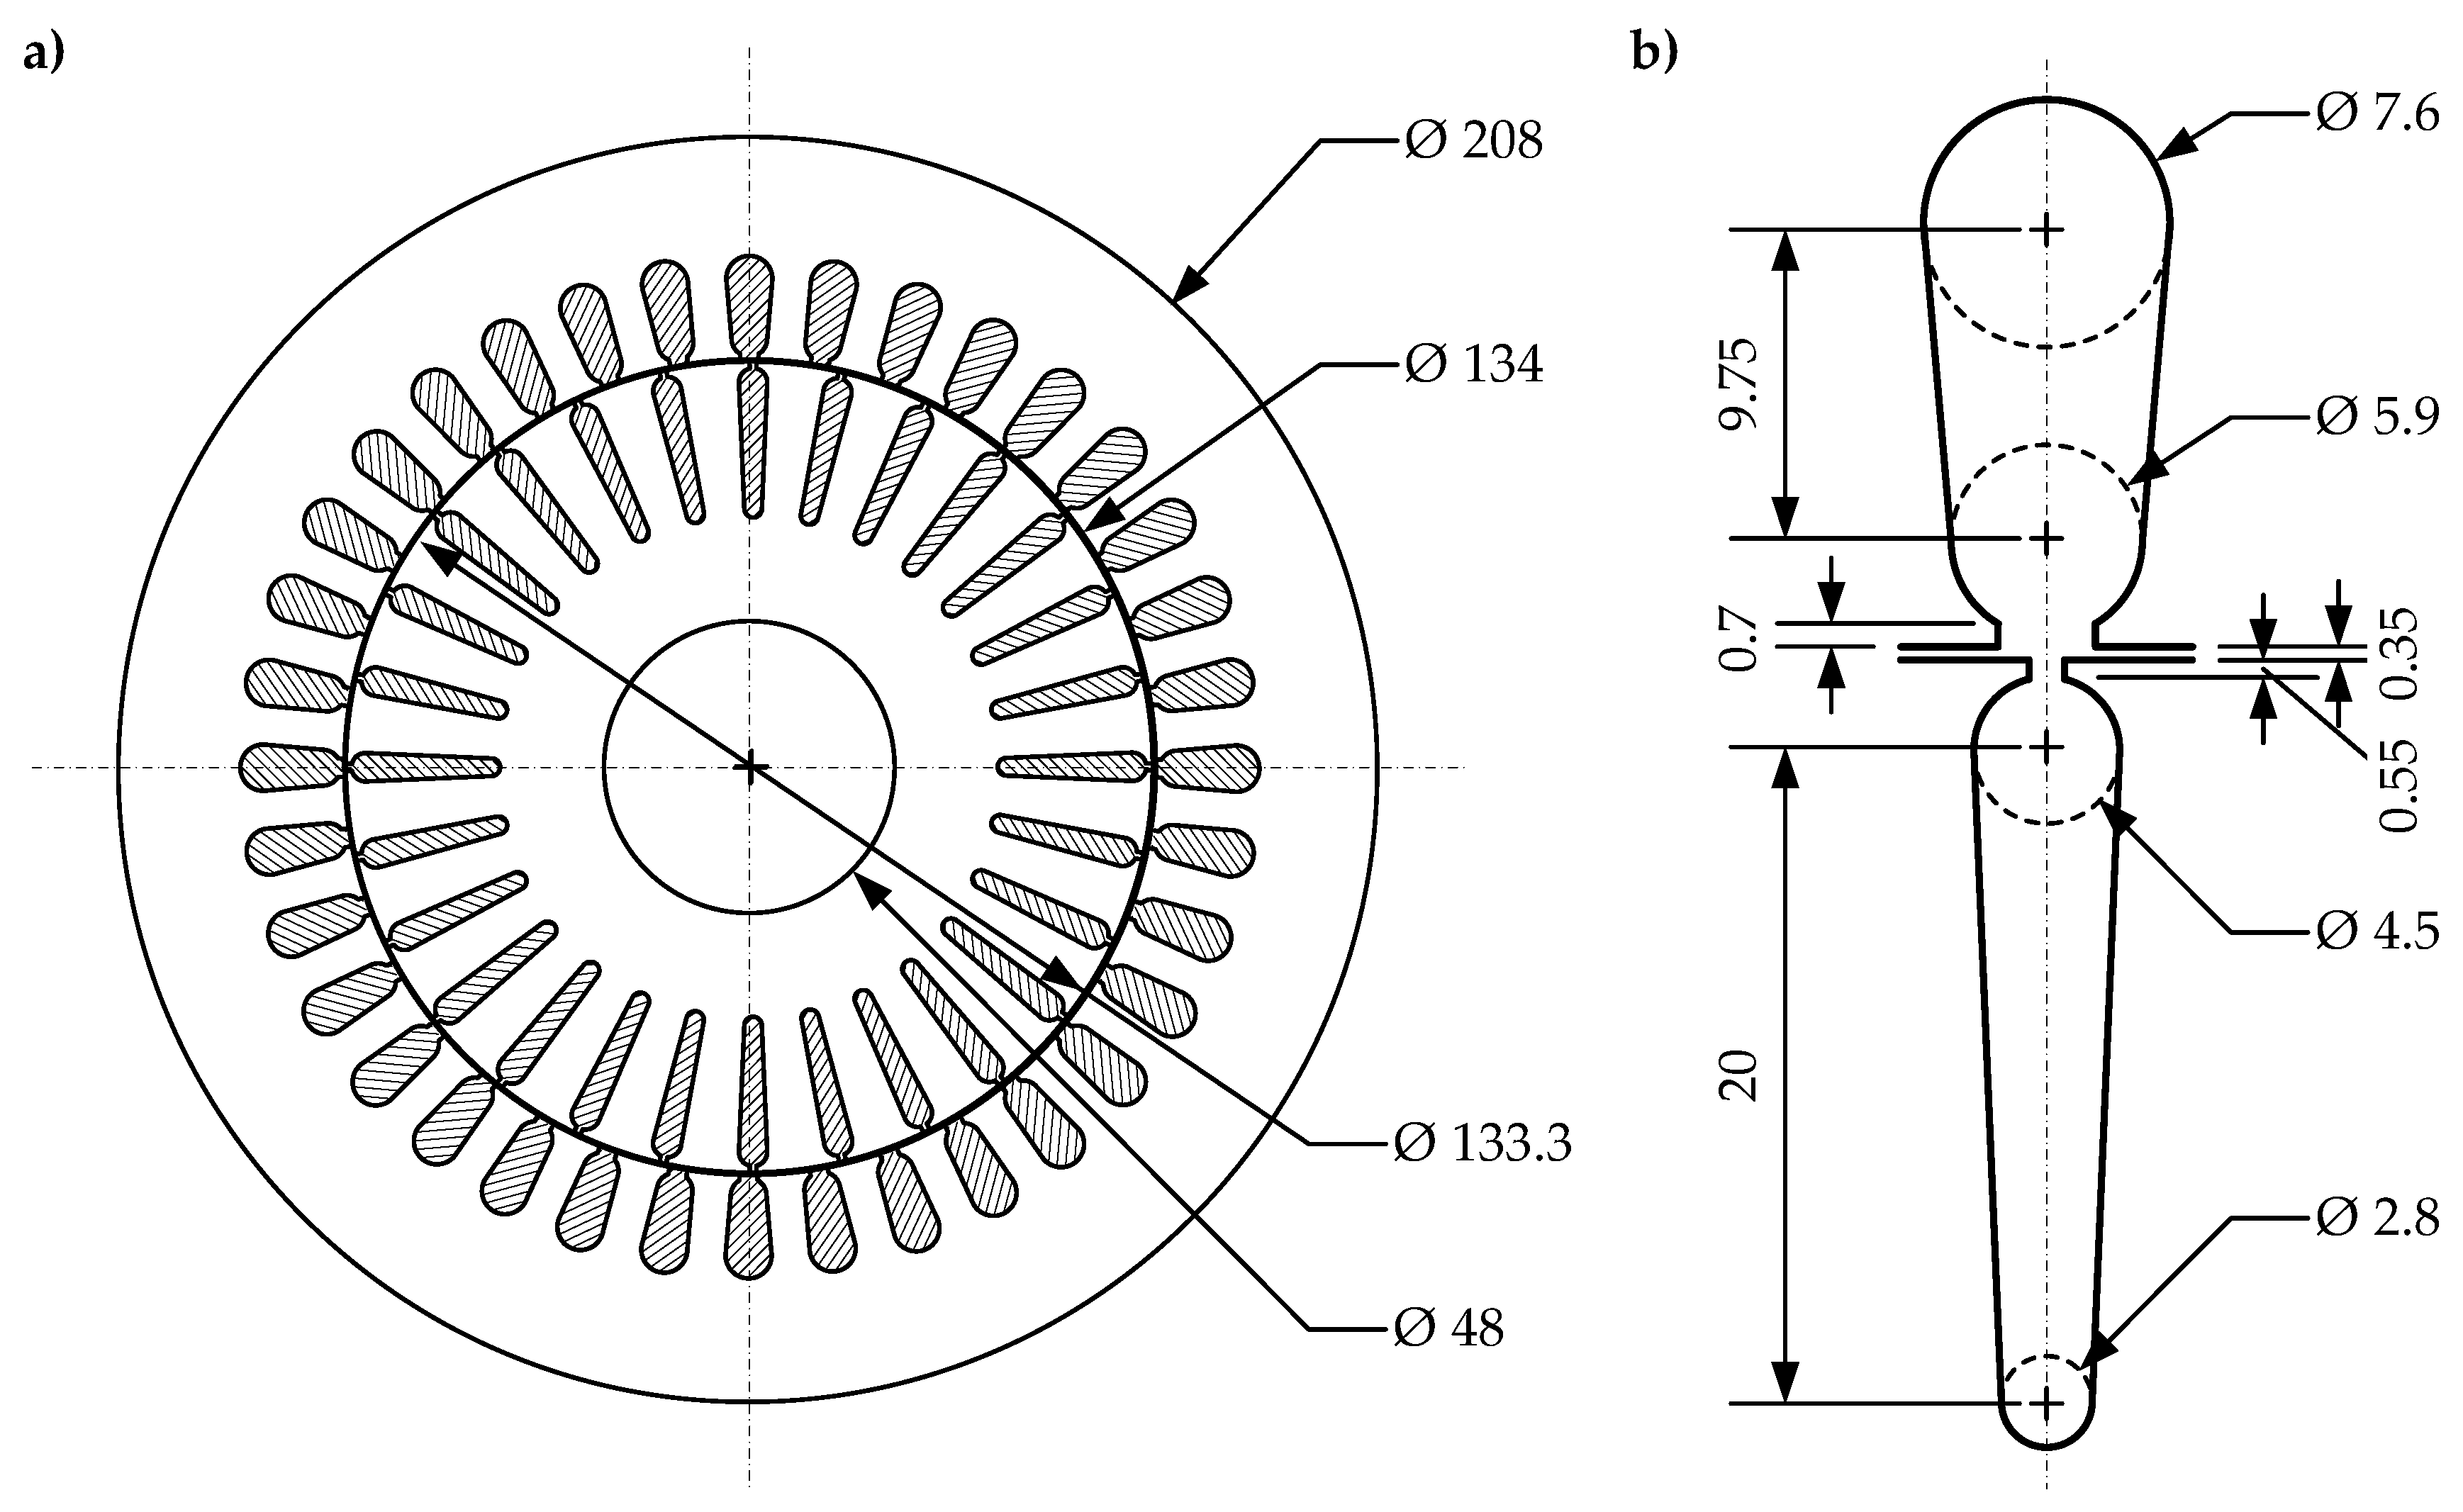
The presented studies were conducted to the squirrel-cage IM of type Sg 132S-4. The IM rated values corresponding to the adopted operating points are listed in
Table A1 included in
Appendix A. The data from the manufacturers’ catalogues involving dimensions of the tested IM cross-section (
Figure A1a), the stator and rotor slot cross-sections (
Figure A1b) and the material properties of IM individual components are also presented in
Appendix A.
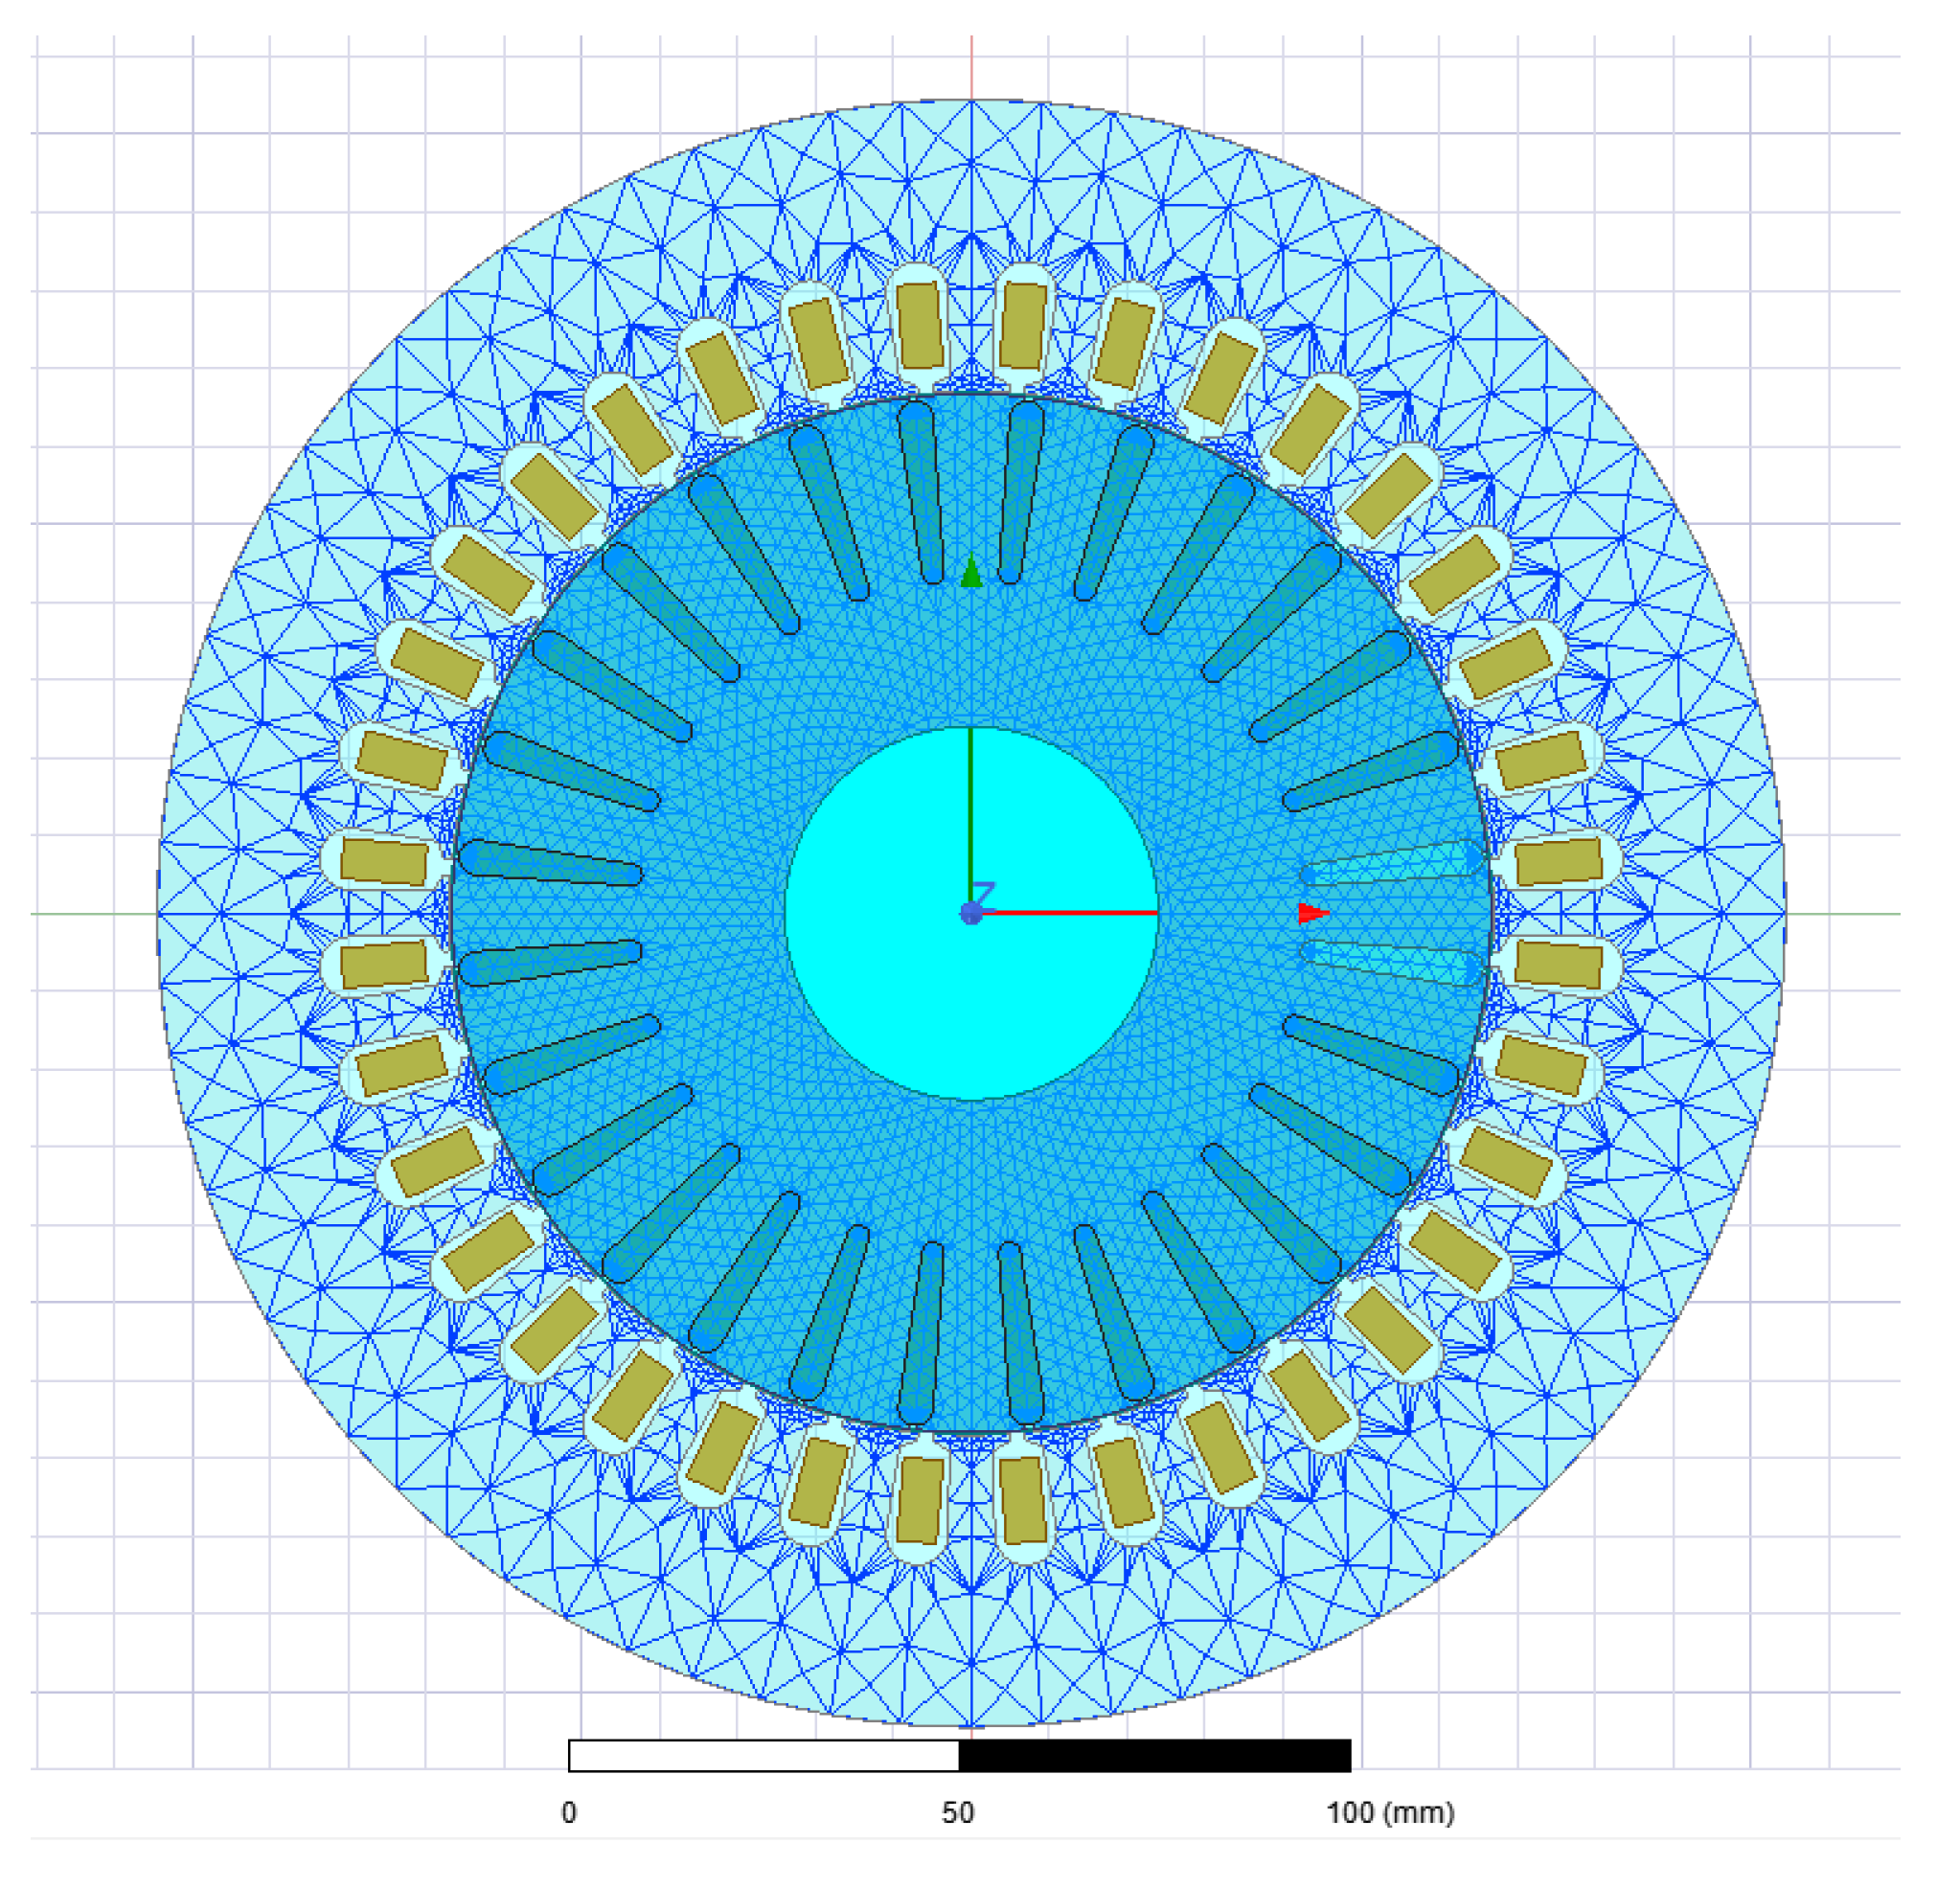
The numerous simulations of the IM operation were conducted by means of the FEM where one of the FE-model parameters: the damping coefficient, the airgap thickness or selected material properties of model components was modified in the specified range, whilst the other parameters were unaltered and consistent with the data from manufacturers’ catalogues. This was aimed to visualise the impact of adjustments of the FE-model selected parameters on the SC space-vector components and the slip frequency. The concise description of the IM modelling procedure with the use of the ANSYS Maxwell software is included in
Appendix B. There is also shown the 2D FE mesh (
Figure A2) employed in the presented studies.
In these studies, the direct-on-line starting of the tested IM under no-load operation was simulated. After starting, under the IM steady state operation the
x-axis and
y-axis components of the SC space vector were determined on the basis of the stator instantaneous voltages and currents returned by the FE model. Additionally, the relative differences between the SC space vector components or the slip frequency obtained from the FE model with the initially adopted catalogue parameters (the initial FE model) and the FE model with modified parameters were taken into account:
where:
x(int.),
x(k) are the
x-axis or
y-axis components of the SC space vector or the slip frequency acquired by the FE model with the initial parameters and by the FE model with
k-th modification of its selected parameter, respectively.
In the first instance, the FE model with the initial parameters was used for simulation of the direct-on-line starting of the tested IM under no-load operation. The damping coefficient, specifying the IM friction and windage losses, was assumed at 0.010 (N·m·s/rad) which corresponded to about 10 (%) of the IM rated torque. The
x-axis and
y-axis components of the SC space vector and the slip frequency determined on the basis of this simulation, employed as the reference values in the present considerations, are listed in
Table 1. The reference values are also included in
Table 2 and
Table 3 to facilitate the visualisation of the impact of modifications of the FE-model selected parameters on the SC space-vector components and the slip frequency.
In the second step, the impact of adjustments of the FE-model damping coefficient was examined. In the presented studies, the damping coefficient was modified within the relatively wide interval of (0.005 N·m·s/rad 0.025 N·m·s/rad). The
x-axis and
y-axis components of the SC space vector and the slip frequency obtained from conducted simulations are included in
Table 1. The relative differences between the SC space-vector components and the slip frequency obtained from the FE model with the initial parameters and the FE model with the modified damping coefficient are also listed in
Table 1.
According to the assumptions, the damping coefficient modification has an impact on the x-axis component of the SC space vector and the slip frequency while having a slight influence on the y-axis component of the SC space vector. It is worth pointing out that the approximately linear increments of the x-axis component of the SC space vector and the slip frequency as a function of the damping coefficient changes are observed.
In the next step, the impact of the B-H curve slope of the stator and rotor cores on the SC space-vector components and the slip frequency was examined.
Figure 3 presents the B-H curve of the M600-50A electrical steel. This figure also includes the two additional B-H curves formed for the purpose of the presented analysis through increasing (B-H curve 1) and decreasing (B-H curve 2) the slope of the M600-50A B-H curve on average by 25 (%).
Table 2 presents the
x-axis and
y-axis components of the SC space vector and the slip frequency achieved from the FE model with the three considered B-H curves of the stator and rotor cores. A modification of the B-H curve slope influences the IM magnetising current, i.e., the
y-axis component of the SC space vector which is found to be in line with expectations. The linear relationship between the B-H curve slope and the
y-axis component of the SC space vector is observed—this component changes approximately by 2.5 (%) with slope modifications of the M600-50A B-H curve on average by 25 (%). The adjustment of the M600-50A B-H curve slope in the analysed range had a negligible effect on the
x-axis component of the SC space vector and the slip frequency.
In the subsequent stage, the impact of the IM airgap thickness on the SC space-vector components and the slip frequency was analysed. Under these studies, the IM airgap thickness was altered in the interval (0.30 mm–0.60 mm) through changing the rotor diameter. The airgap thickness consistent with the data from the manufacturer catalogue is equal to 0.35 (mm) (
Figure A1). The
x-axis and
y-axis components of the SC space vector and the slip frequency obtained from the FE model with the airgap thickness altered within the above-mentioned interval are included in
Table 3.
As expected, the linear relationship between the IM airgap thickness and the
y-axis component of the SC space vector is registered. Slight changes in the
x-axis component of the SC space vector are also observed. However, due to their non-systematic nature, these few-percent fluctuations of the
x-axis component of the SC space vector should be related to the accuracy of numerical methods rather than looking for their relationship with a modification of the airgap thickness. As it results from
Table 3, the change in the IM airgap thickness had a negligible effect on the slip frequency.
The adjustment of the rotor-cage conductivity had no impact on the x-axis and y-axis components of the SC space vector. However, it influenced the slip frequency. This means that with some modifications of the rotor-cage conductivity the machine active and reactive power consumption remains unaltered, but the distribution of the power transmitted to the rotor into torque generation and rotor winding losses is affected.
5. Verification of the Proposed Approach for FE-Model Optimisation
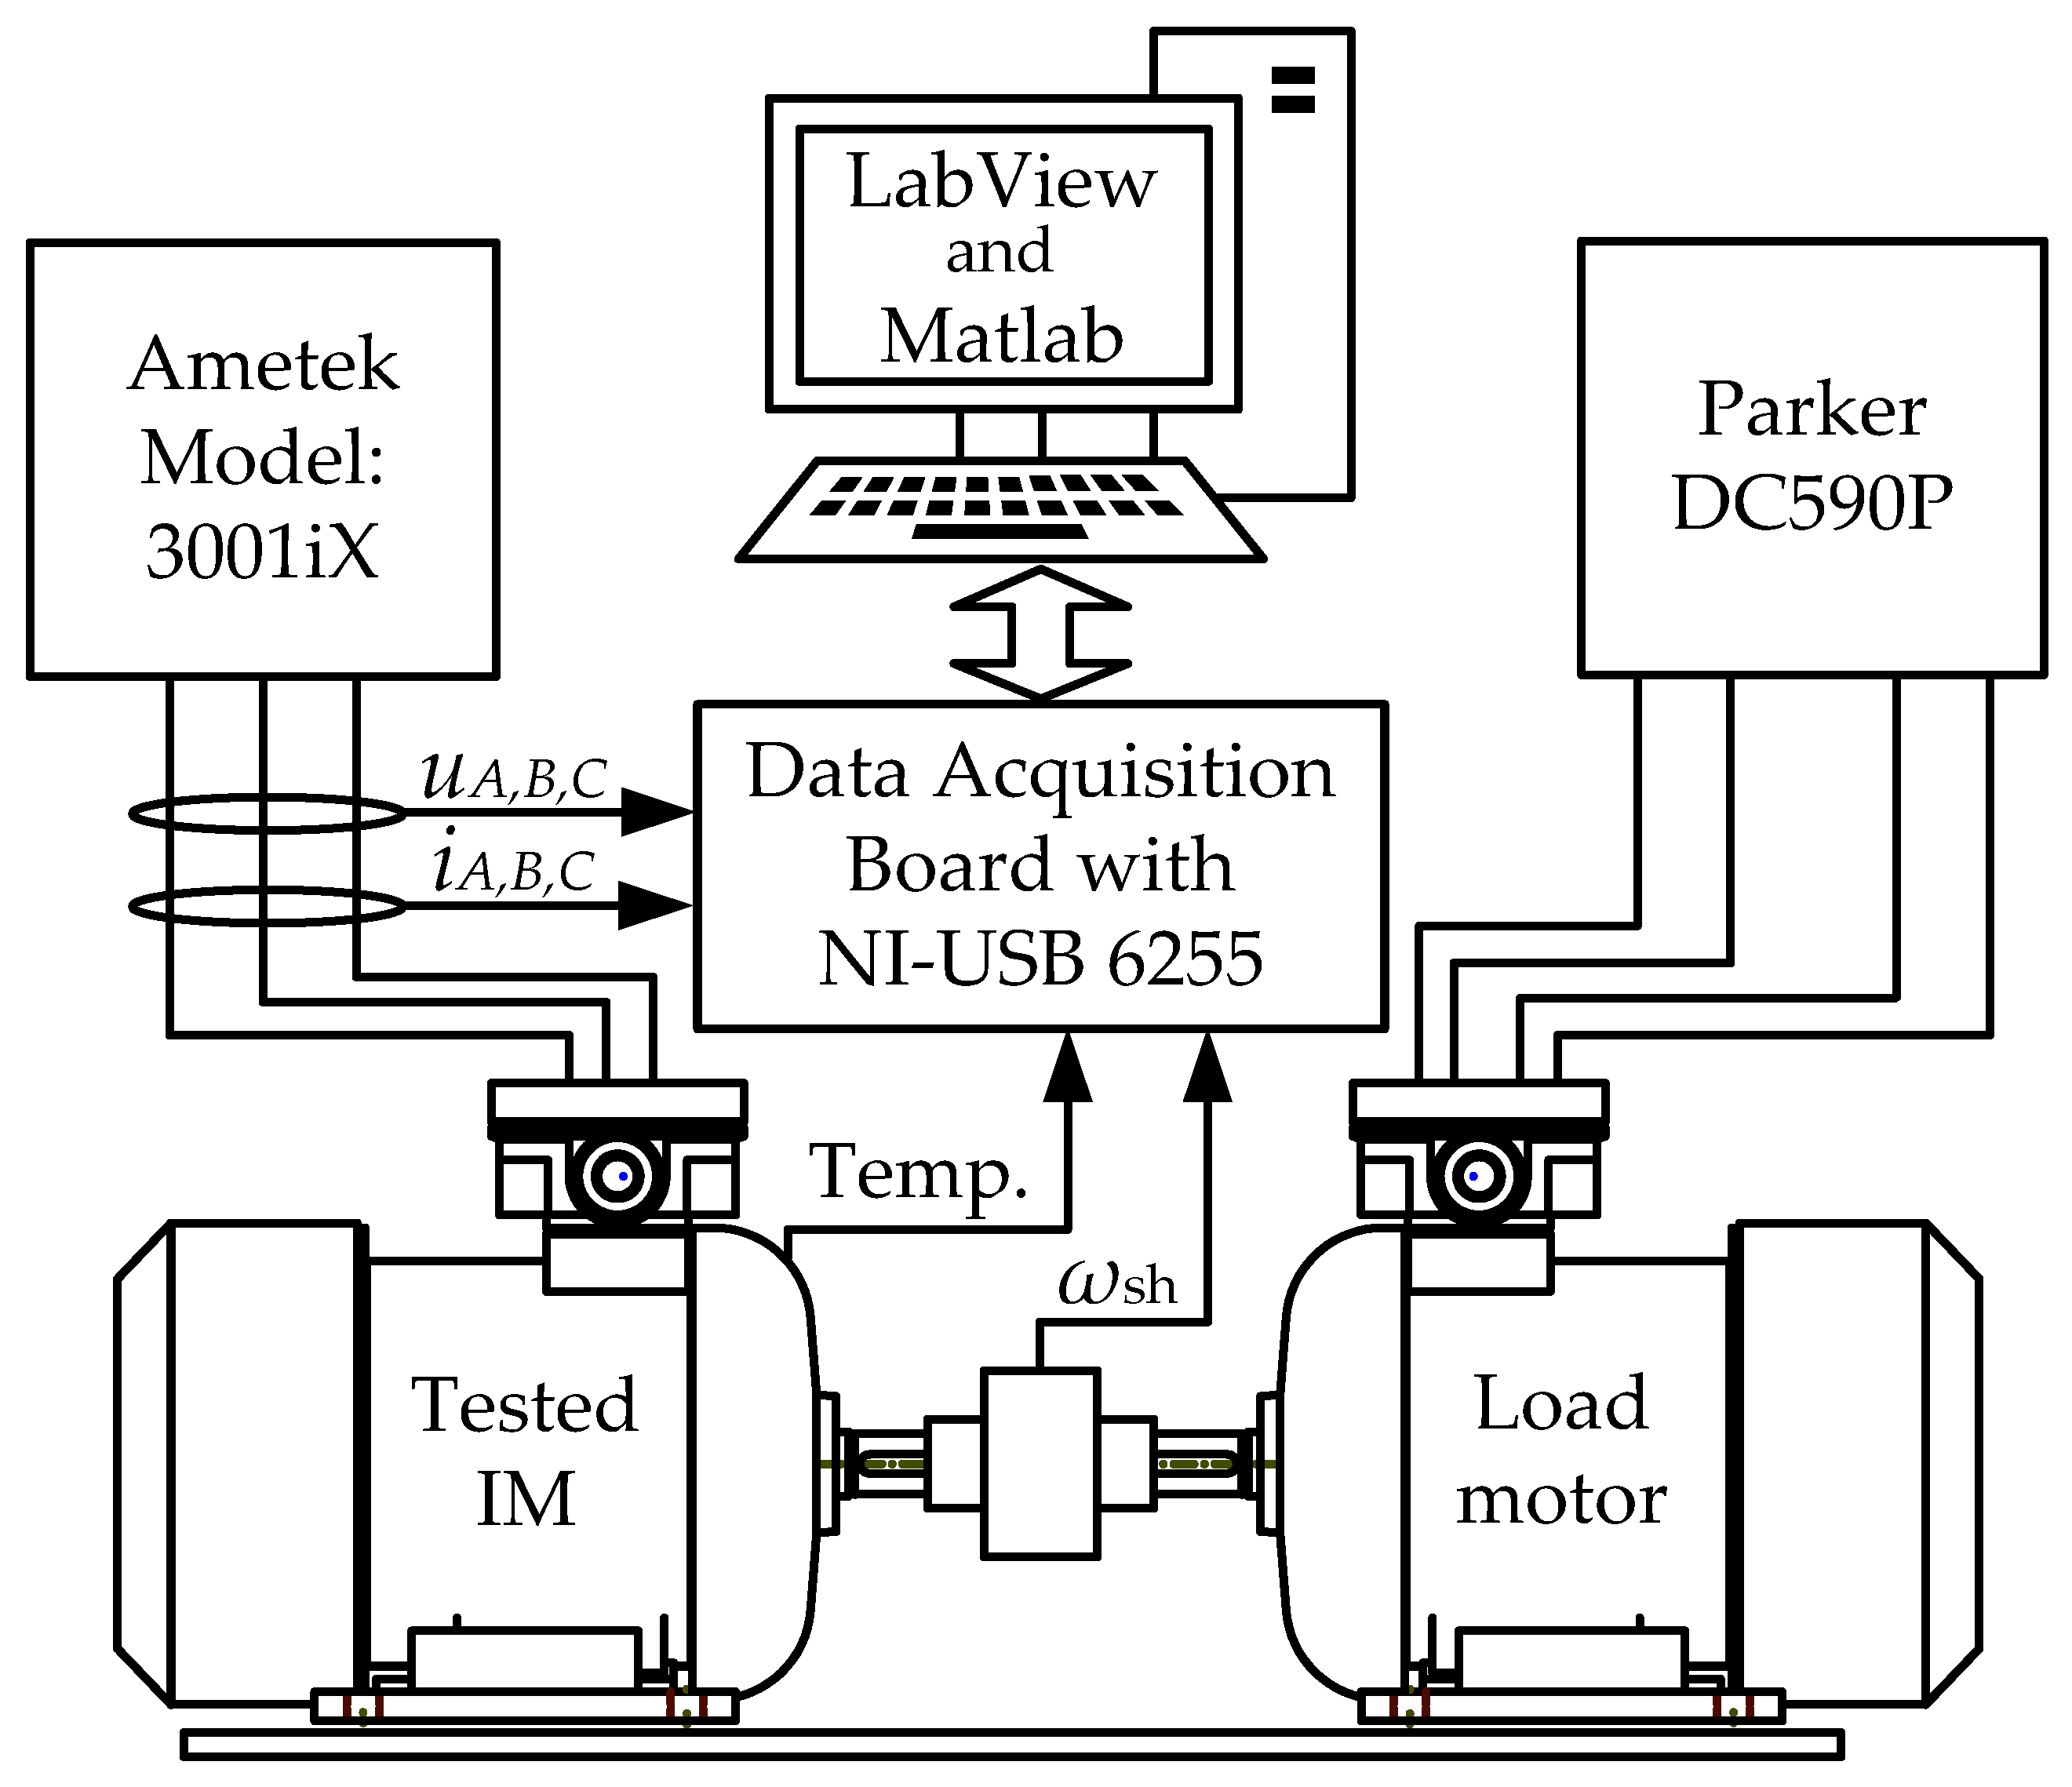
The proposed approach for FE-model optimisation was verified based on the measurement data derived from the LCT performed experimentally. The description and schematic diagram (
Figure A3) of the laboratory test bench are included in
Appendix C. Before starting the measurement conducted under the LCT, the tested IM operated with the given load torque to stabilise its temperature. This was carried out to limit the impact of the stator and rotor resistance changes on the measurement data employed in the verification studies. Afterwards, the measurement of the stator instantaneous voltages and currents, the stator winding temperature and the shaft angular velocity was realised at steady state operation for each IM load conditions adopted under the LCT.
The data from measurement performed under IM no-load operation served for optimisation of the FE model, whilst the data acquired in the whole considered range of the slip frequency were used in verification of the optimised FE model. Based on the conducted measurement the SV and SC space vectors were formed and the input IM impedance-versus-slip frequency characteristic was calculated as their quotient. Afterwards, the inductance frequency characteristic was determined following Equation (7). The modulus and argument of this characteristic are presented in
Figure 4.
5.1. Optimisation Process of the FE Model
The
x-axis and
y-axis components of the SC space vector, calculated based on the measurement data acquired under IM no-load operation, along with the no-load slip frequency, are listed in
Table 4. These values constitute the reference quantities in the optimisation process. As a comparison, the SC space-vector components and the slip frequency obtained from the simulation of the IM no-load operation conducted using the FE model with the catalogue parameters are also presented in
Table 4.
The study results presented in
Section 4 demonstrate the approximate linearity between the specified FE-model parameters and the
x-axis or
y-axis components of the SC space vector. For this reason, the results of the FE analysis conducted for two different settings of the selected FE-model parameter enable estimating the variability of the
x-axis or
y-axis components of the SC space vector as a function of the studied parameter. This property can be conveniently used in determining the FE-model parameters which provide the requested conformity between the SC space-vector components obtained from the measurement and the optimised FE model.
The increase of the
y-axis component of the SC space vector was achieved through the increment of the FE-model airgap thickness from 0.35 (mm) to 0.50 (mm). It allowed the reduction of the relative error between the SC space-vector
y-axis components obtained by the measurement and the FE models from about 33 (%) for the initial FE model to 3.6 (%) for the optimised FE model. Additionally, in order to increase the
x-axis component of the SC space vector, the FE-model damping coefficient was also slightly modified. Since the increment of the FE-model damping coefficient is associated with an increase in the slip frequency (
Table 1), which was not desired in the case under consideration, the damping coefficient was boosted only to 0.011 (N·m·s/rad). The decrease in the FE-model slip frequency could be achieved through increasing its rotor cage conductivity, and thus reducing the rotor winding losses. In this case, the absolute error between the no-load slip frequencies derived from the measurement and the simulation conducted with the use of the optimised FE model was approximately equal to 0.02 (Hz). The corrections of the FE-model slip frequency at the level of 0.02 (Hz) turned out to be problematic due to the limited calculation accuracy inherent for numerical methods. For this reason, the FE model of the tested IM was not subjected to further corrections. The SC space-vector components and the slip frequency derived from the simulation of the IM no-load operation performed with the use of the optimised FE model are included in
Table 4.
The optimised FE model was subsequently employed for the LCT simulation. The simulation was performed at the following values of the IM load torque
TL = (0.0, 2.5, 5.0, 7.5, 10, 12.5, 15.0, 17.5, 20.0) (N·m). These values were adopted based on the electromagnetic torque values determined from the LCT conducted experimentally (Figure 7), minus friction and windage losses which were assumed to be approximately 10 (%) of the IM rated torque. The stator instantaneous voltages and currents and the shaft angular velocity obtained from the LCT simulation were used to determine the inductance frequency characteristic. This characteristic is presented in
Figure 4 together with the characteristic obtained as a result of the LCT performed experimentally. For comparison, the LCT simulation was also carried out using the initial FE model. The inductance frequency characteristic determined on the data derived from this simulation is also included in
Figure 4.
The optimisation of the FE model according to the presented approach allowed for much more accurate modelling of the tested IM operation under the LCT in comparison to the initial FE model. A satisfying conformity between the inductance frequency characteristics obtained from the measurement and the simulation conducted using the optimised FE model was achieved. This was not attained with the use of the initial FE model.
5.2. Validation of the Electromagnetic Parameter Estimation for the IM Space-Vector Model
In the next stage, the verification of the proposed approach for FE-model optimisation was based on the reliability evaluation of the IM space-vector model in which electromagnetic parameters were estimated using the inductance frequency characteristics determined from the LCT performed experimentally and by means of the optimised FE model. These characteristics were employed as the reference characteristics in the estimation process which was performed with the genetic algorithm (GA) according to the procedures described in [
14,
24]. The evaluation function and a brief description of the GA settings employed in the presented studies are included in
Appendix D. As in the works [
14,
24], the criterion adopted in the estimation process of electromagnetic parameters for the IM equivalent circuit including the rotor deep-bar effect assumed the approximation of the reference characteristic modulus with an error not exceeding 2 (%) in the considered range of slip frequency. At the same time, a possible minimum approximation error of the reference characteristic argument and a minimum number
N of two-terminals in the rotor equivalent circuit were required under this criterion. The approximation of the reference characteristics with the adopted permissible modulus error was achieved by the IM space-vector model with two (
N = 2) parallel connected two-terminals in the rotor network representation (
Figure 5 and
Figure 6). In parallel, the approximation errors of the reference characteristic argument were at the acceptable level, not exceeding ±1.72 (deg) and ±1.4 (deg) for the characteristics obtained from measurement and simulation, respectively.
The electromagnetic parameters estimated based on the inductance frequency characteristics derived from the LCT performed experimentally and with the use of the optimised FE model were referred to as Set 1 and Set 2, respectively. These parameters are summarised in
Table 5.
The space-vector model with the electromagnetic parameters Set 1 and Set 2 was employed to calculate the torque-versus-slip frequency curves. These curves are set together with the torque-versus-slip frequency curve determined according to Equations (8) and (9) based on the data obtained from the LCT realised experimentally (
Figure 7a). Additionally,
Figure 7b presents the relative errors between the torque-versus-slip frequency curve derived from the experimental realisation of the LCT and the curves calculated by the IM space-vector model with two parallel connected two-terminals in the rotor network representation.
Both the torque-versus-slip frequency curves, calculated by the IM space-vector model with electromagnetic parameters Set 1 and Set 2, are in good agreement with the torque-versus-slip frequency curve derived from the measurements conducted under the LCT. The relative errors between the torque-versus-slip frequency curve determined from the experimental realisation of the LCT and the curves calculated by the IM space-vector model with electromagnetic parameters Set 1 and Set 2 are not significant in the whole considered range of slip frequency and, apart from the slip frequency corresponding to IM no-load operation, they do not exceed ±3.3 (%) and ±5.1 (%), respectively.
The relative error of 8 (%) between the torque-versus-slip frequency curve derived from the measurement under the LCT and the curve obtained by the IM space-vector model with electromagnetic parameters Set 1 results from limited approximation precision of the reference inductance frequency characteristic—also derived from the measurement under the LCT—by this model at the slip frequency corresponding to the IM no-load operation. The absolute approximation error of the reference characteristic argument is equal to about −1.72 (deg) at the no-load slip frequency and is the highest in the considered range of slip frequency.
The relative errors introduced by the IM space-vector model with the electromagnetic parameters Set 2 are predominantly related to limited conformity between the inductance frequency characteristics obtained in the result of the LCT performed experimentally and through the simulation conducted with the optimised FE model.


