Review

Optimal Control Method of Variable Air Volume Terminal Unit System

School of Architecture, Yeungnam University, Gyeongsan 38541, Korea
*
Author to whom correspondence should be addressed.
Energies 2021, 14(22), 7527; https://doi.org/10.3390/en14227527
Submission received: 19 September 2021 / Revised: 26 October 2021 / Accepted: 30 October 2021 / Published: 11 November 2021

Abstract

:
This study reviewed the existing studies on the types of variable air volume (VAV) terminal units, control and operation methods, prediction models, and sensor calibration methods. As a result of analyzing the existing research trends on the system type, characteristics, and control method of VAV terminal units studies such as theoretical verification and energy simulation were conducted to improve the existing control methods, reset the set value using a mathematical model, and add a monitoring sensor for the application of control methods. The mathematical model used in the study of VAV terminal unit control methods was used to derive set values for minimum air volume, supply temperature, ventilation requirements, and indoor comfort. The mathematical model has a limitation in collecting input information for professional knowledge and model development, and development of a building environment prediction model using a black box model is being studied. The VAV terminal unit system uses a sensor to control the device, and when an error occurs in the sensor, indoor comfort problems and energy waste occur. To solve this problem, sensor calibration techniques have been developed using statistical models, mathematical models, and Bayesian statistical models. The possibility of developing a method for calibrating the variable air volume terminal unit sensor using the prediction model was confirmed. In conclusion, the VAV terminal unit system is one of the most energy efficient systems. The energy saving potential of current VAV systems can still be improved through control methods, the use of predictive models, and sensor calibration methods.

1. Introduction

In 1992, the United Nations Framework Convention on Climate Change was adopted to prevent global warming and abnormal climates caused by greenhouse gases [1]. The Paris Agreement was adopted in November 2015, and participating countries must participate in greenhouse gas reduction, establish adaptation measures, provide financial support, and conduct implementation checks [2]. The building sector accounted for approximately 20% of the final energy consumption in 2019 [3]. In variable air volume (VAV) systems, as interest in energy conservation increases, they are being adopted in large buildings. Hence, various studies are being conducted for efficient operation [4]. Therefore, it is essential to control the terminal units installed in each zone to control the VAV system [5]. The terminal unit of the VAV system controls the air temperature by setting the minimum and maximum air flow rate based on the peak load [6]. Among them, the minimum air flow rate of the terminal unit is closely related to the indoor air quality and energy consumption [7]. Indoor air quality problems occur if the minimum air flow rate is set low, and energy waste occurs if the minimum air flow rate is set high because of excessive air flow rate supply. In ASHRAE, the minimum air flow rate of the VAV terminal unit was presented as a fixed value of 30% of the maximum air flow rate [8]. If there are no occupants, energy is wasted at the fixed minimum air flow rate, and indoor air quality problems may occur when the occupancy increases. These fixed set points do not reflect the various conditions of the building, and set points and control methods suitable for indoor conditions are required. These problems have been solved in some studies by resetting the set point using a mathematical model to match the fixed set point to the indoor condition. A previous study proposed the control method after deriving the control set point that satisfies the heating load and indoor air quality through a mathematical model. On the other hand, there is a limit to field applicability because it requires considerable information and data for model construction, as well as expertise to interpret the system.
In building equipment systems, big data and machine learning are being applied to improve building performance and reduce energy consumption [9]. Building systems are controlled and operated through sensors and set points installed in various systems [10]. Moreover, various techniques (statistics, big data, and machine learning) have been used to predict the system performance and optimize the control technology [11]. These technologies have been developed based on the data measured and collected through sensors, and the accuracy of the data must be supported for the reliability of the developed technologies. The VAV terminal unit system uses sensors (supply air flow rate, supply temperature, and room temperature) to control the devices (damper actuators and valve actuators). Indoor comfort problems and energy waste occur when an error occurs in the VAV sensor [12]. Therefore, this study reviewed the existing study on the types of VAV terminal units, control and operation methods, prediction models, and sensor calibration methods for VAV terminal unit

2. Type of VAV Terminal Unit System

The VAV system controls the indoor temperature by keeping the supply temperature constant and changing the air flow rate according to the indoor load. The VAV terminal unit can reduce energy wastage by controlling the air flow rate according to the load of each room through control of the VAV terminal unit for each room [13].
The VAV terminal unit is divided into a pressure-dependent terminal unit and a VAV pressure-independent terminal unit according to the control method [14]. In the pressure-dependent VAV terminal unit, the damper starts to close when the indoor temperature begins to decrease based on the indoor set temperature and controls up to the minimum damper opening rate. The damper opening rate changes according to the indoor temperature. If the minimum damper opening rate is set too high, energy may be wasted. Indoor air quality problems may occur if the minimum damper opening rate is set too low. On the other hand, a difference between the required air flow rate and the actual supplied air flow rate may occur if the supply air flow rate is controlled through the damper opening rate. The pressure-independent VAV terminal unit controls the air flow rate by adding an air flow rate sensor as a terminal unit configuration to improve the pressure-dependent VAV terminal unit. The pressure-independent type controls the damper to supply the required air flow rate within the maximum and minimum air flow rate set points when the room temperature drops [15]. The pressure-independent VAV terminal unit is divided into the throttle type, induction type, and fan-powered type according to the operation method [16].

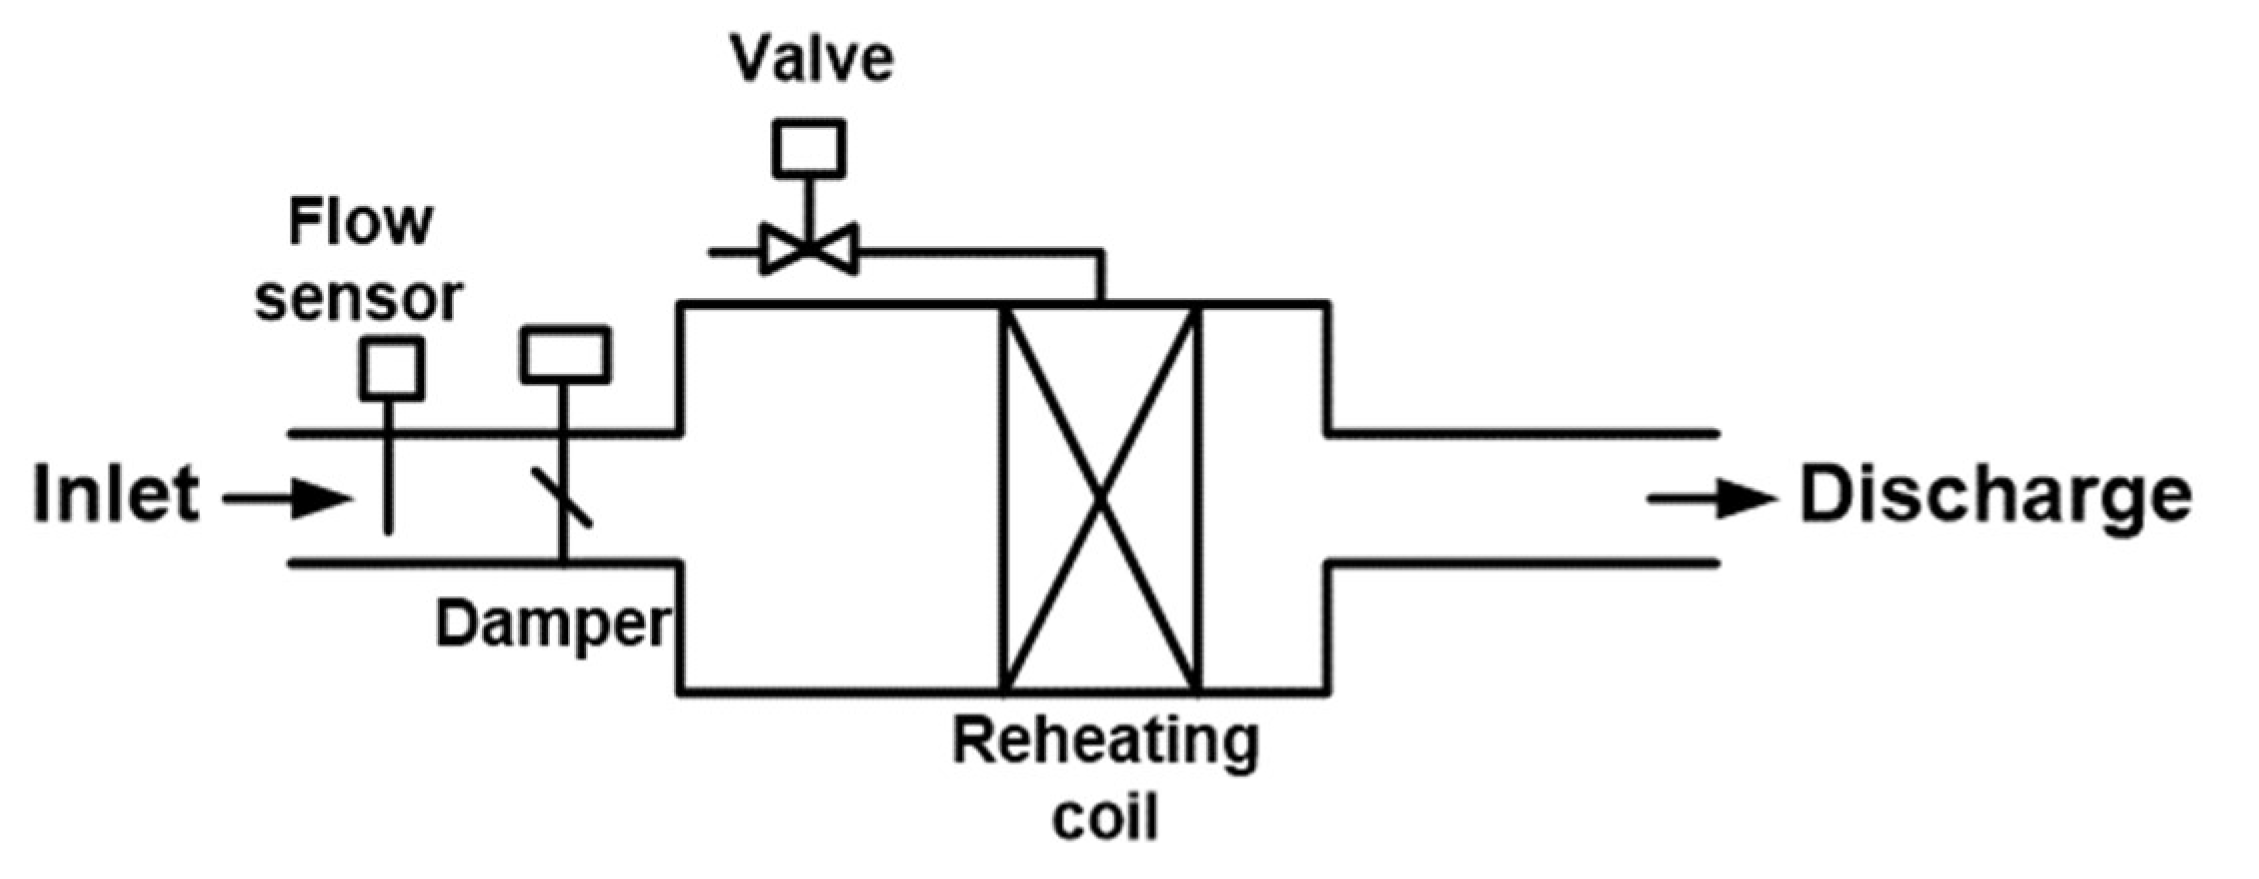
2.1. Throttling VAV Terminal Unit

The throttling type terminal unit is the most common VAV terminal unit and operates a damper to maintain the indoor set temperature based on the air flow rate sensor installed at the entrance. In a space where a heating load occurs, heating can be achieved by installing a reheat coil, and Figure 1 presents a throttling type VAV terminal unit, including a reheat coil.
The automatic control method of the throttling type terminal unit includes a single maximum control logic and a dual maximum control logic. Single Maximum control logic sets the maximum and minimum airflow, and the damper opening rate of the VAV terminal box is adjusted according to the temperature of the indoor zone. When the air flow rate of the terminal unit reaches the minimum air flow rate, and the heating load in the room is large, the temperature of the supplied air flow rate is increased by operating the reheat coil to maintain the set temperature in the room. The maximum air flow rate is calculated using the indoor maximum sensible heat load, the indoor set temperature, and the supply temperature. In addition, the minimum air flow rate is calculated using the indoor maximum heating load or ventilation requirement.
Figure 2 shows the Dual Maximum Control logic, which sets the maximum cooling airflow, maximum heating airflow, and minimum airflow and adjusts the damper opening rate of the VAV terminal unit according to the indoor set temperature and indoor temperature. In Dual Maximum Control logic, the minimum air flow rate can be lower than that of Single Maximum Control logic, thereby reducing the reheat energy and fan energy. On the other hand, indoor air quality problems and stratification may occur during heating if the minimum airflow is set too low.

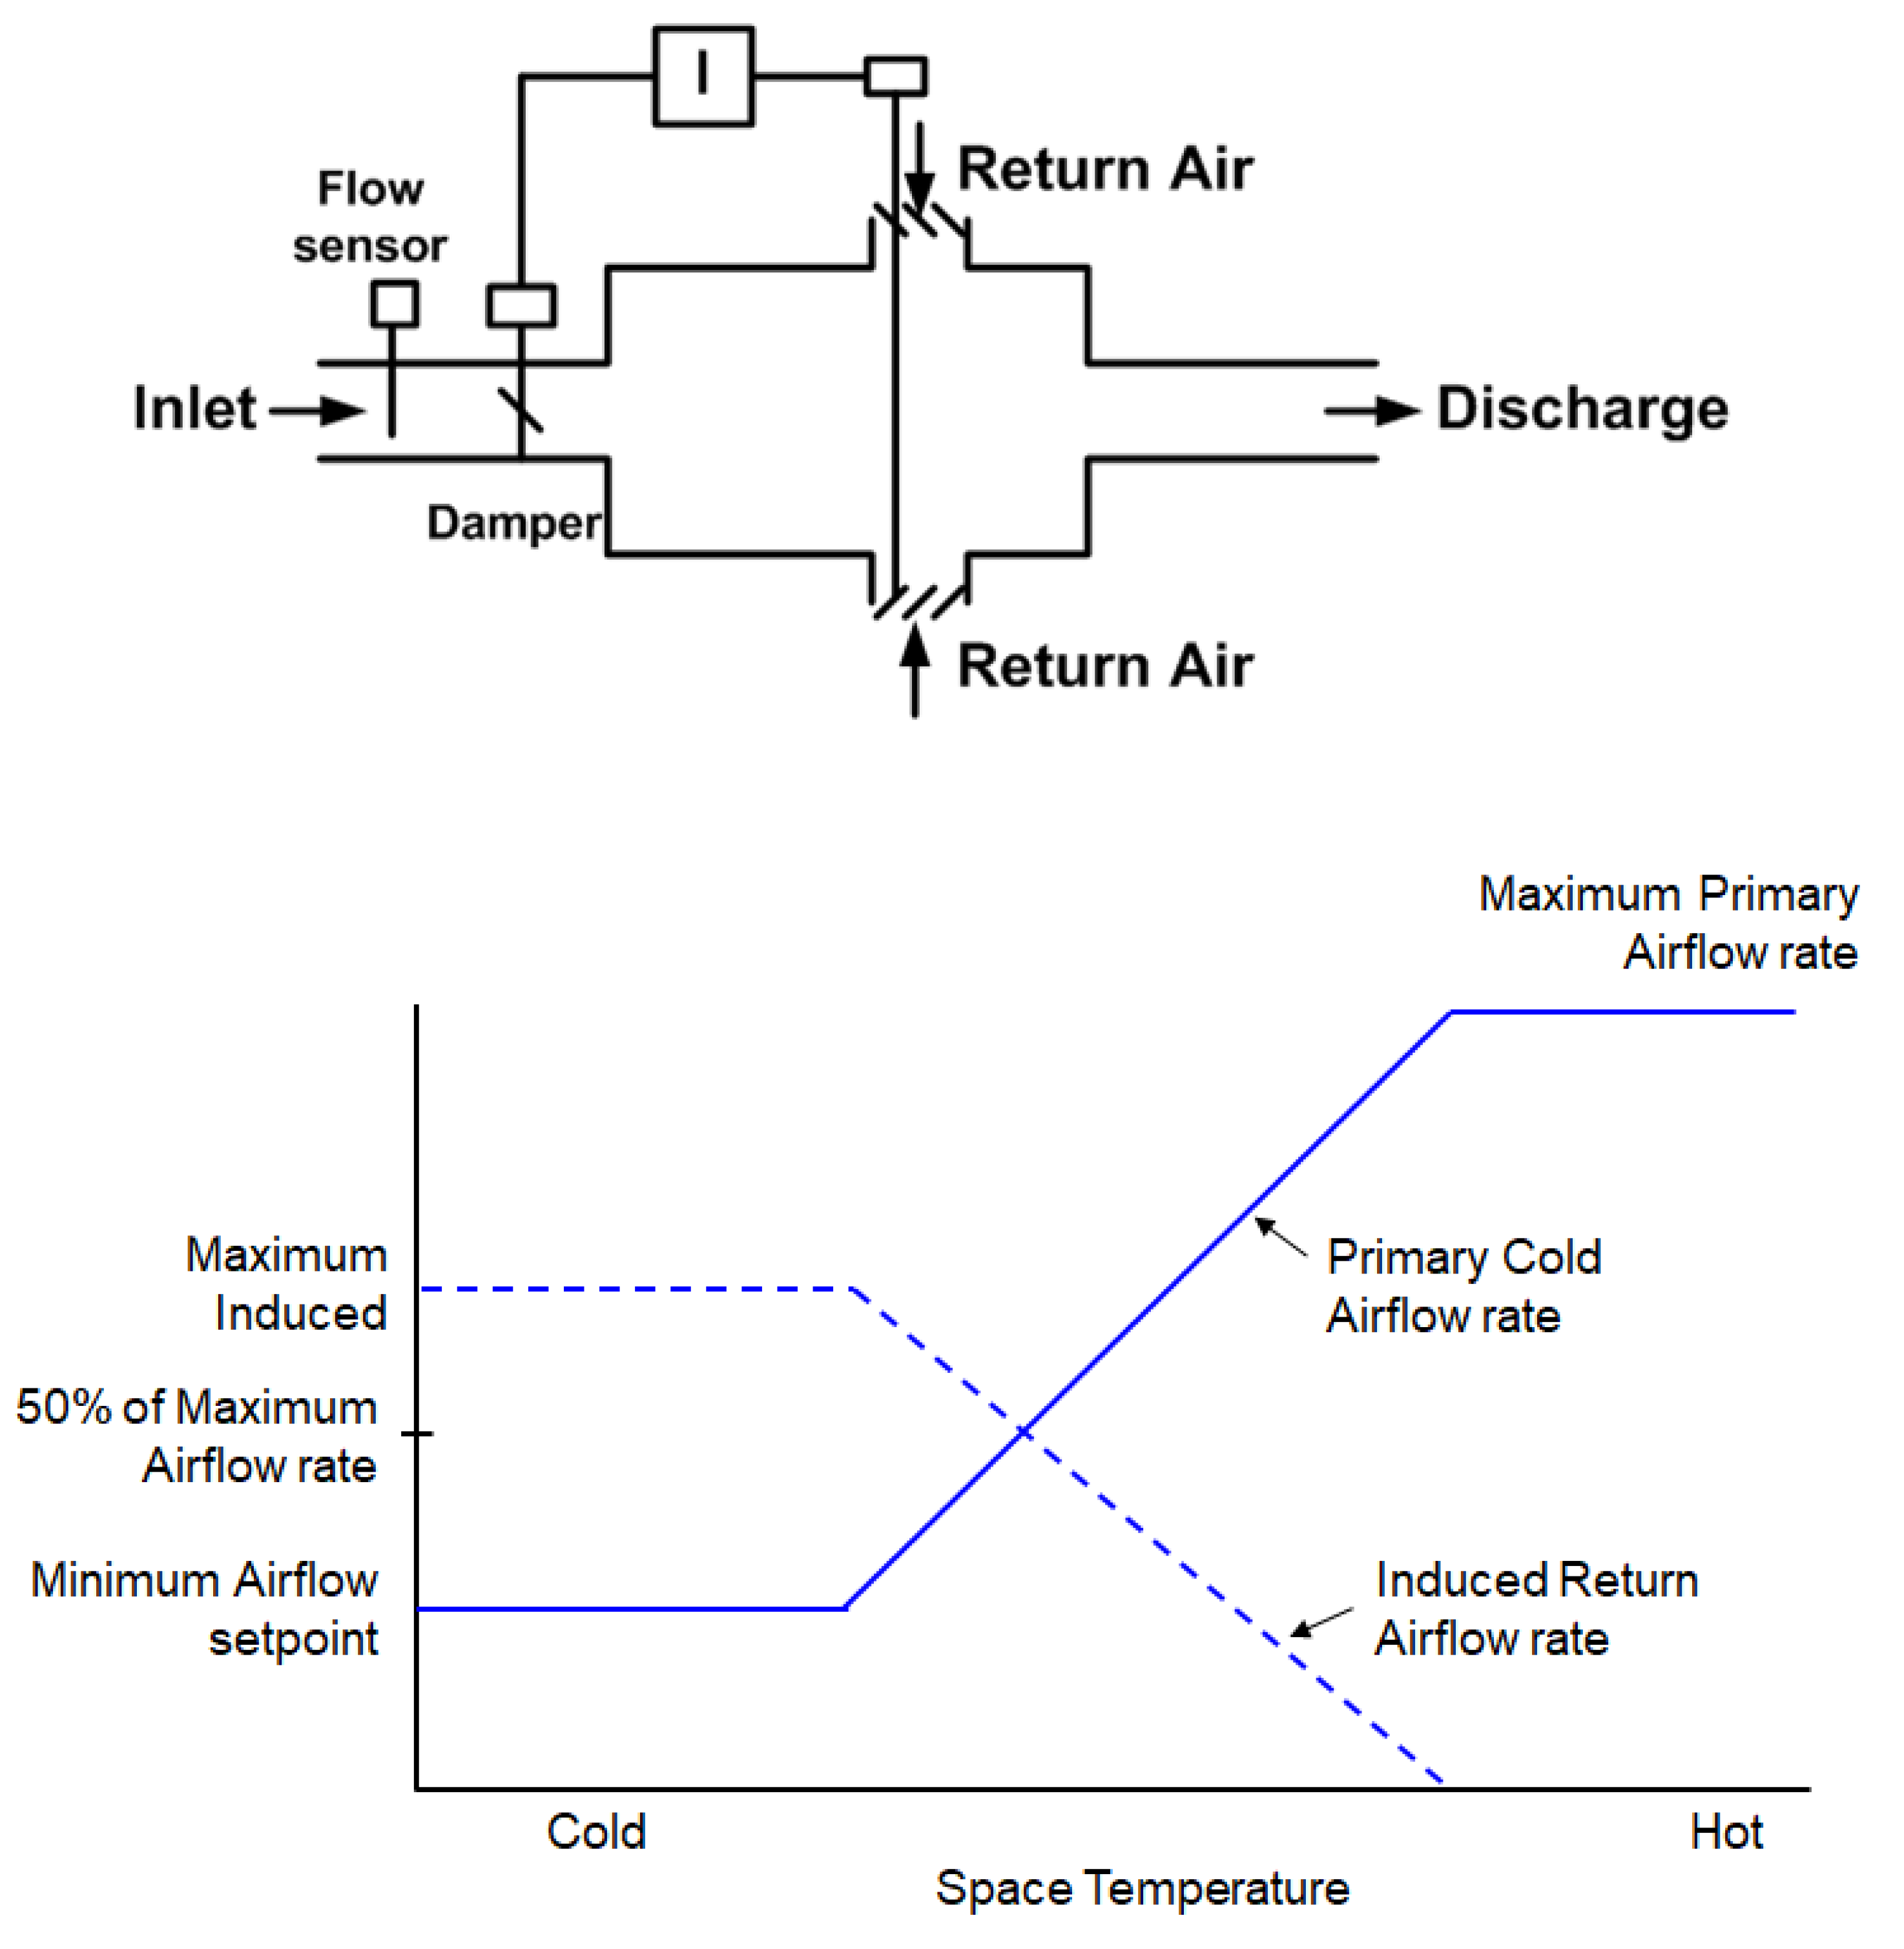
2.2. Induction VAV Terminal Unit

The induction terminal unit controls the room temperature by lowering the supply air flow rate and drawing room air into the ventilation plenum. The supply damper at the inlet of the terminal unit and the damper opening rate of the ventilation plenum operate in conjunction. The damper opening rate of the ventilation plenum increases when the supply damper opening rate decreases. When the room temperature is lower than the room set temperature, the supply damper closes to reach the minimum airflow, and the damper of the ventilation plenum opens. Figure 3 shows the induction terminal unit and the control sequence.

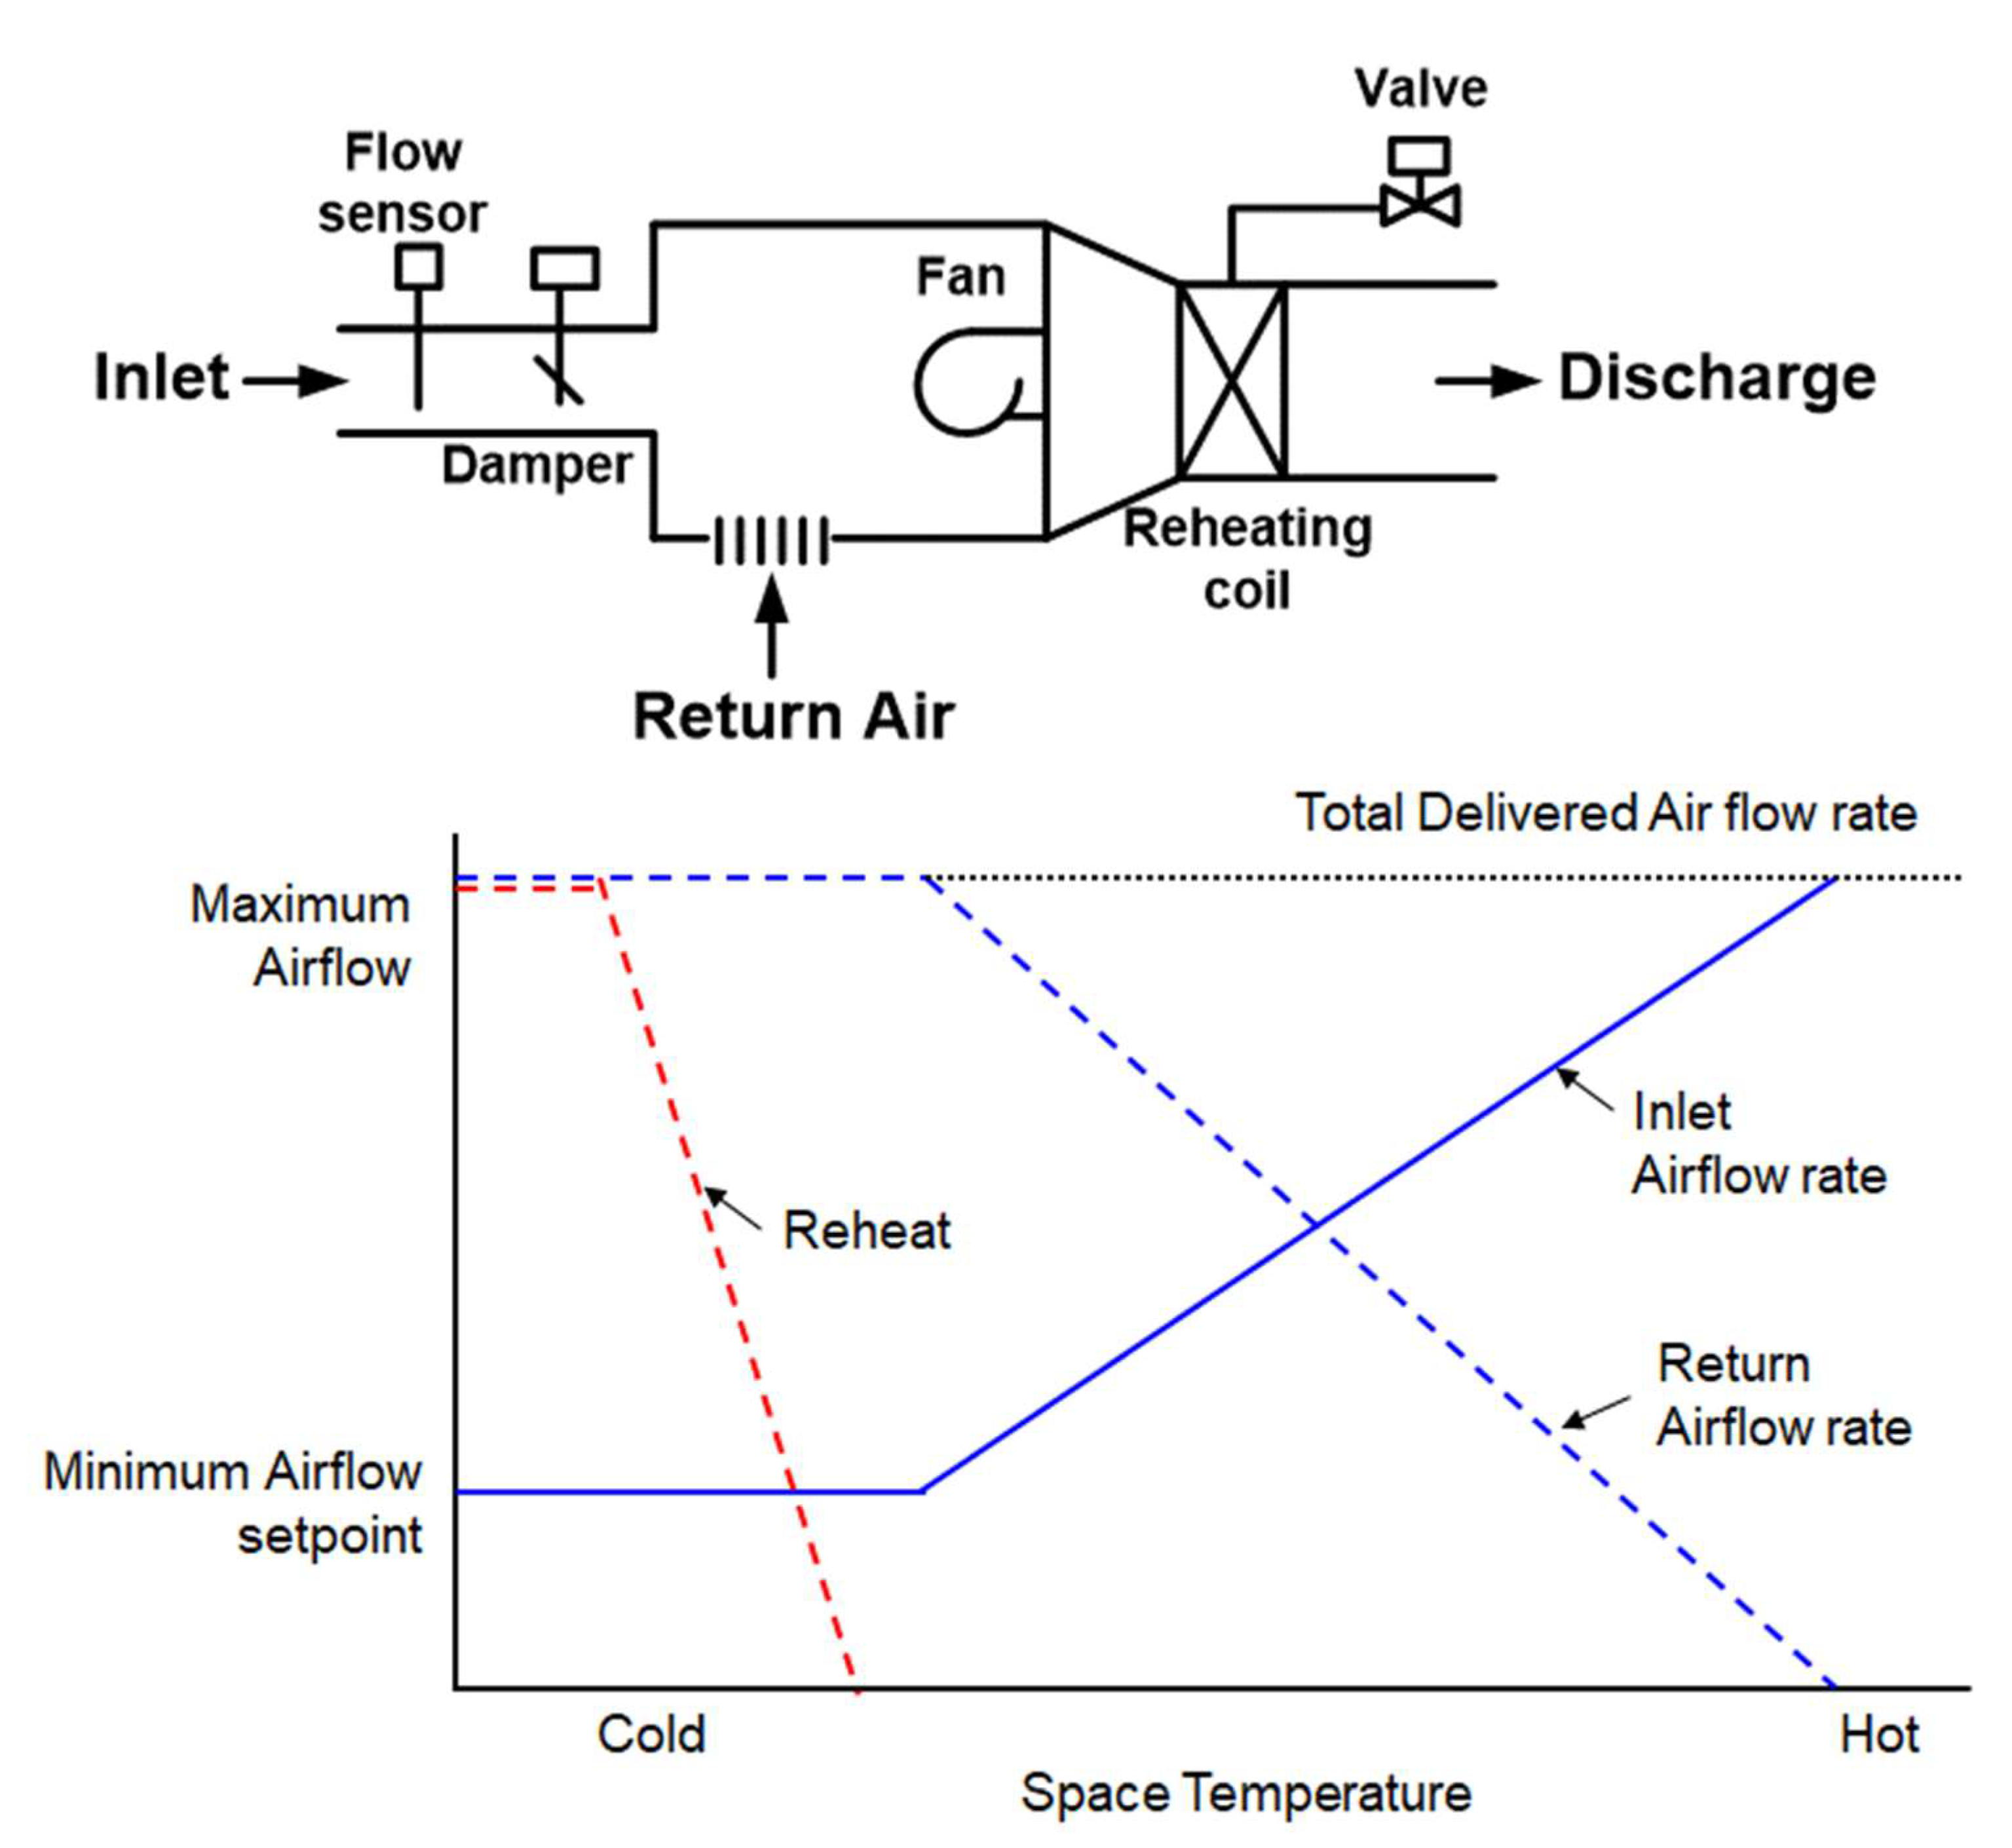
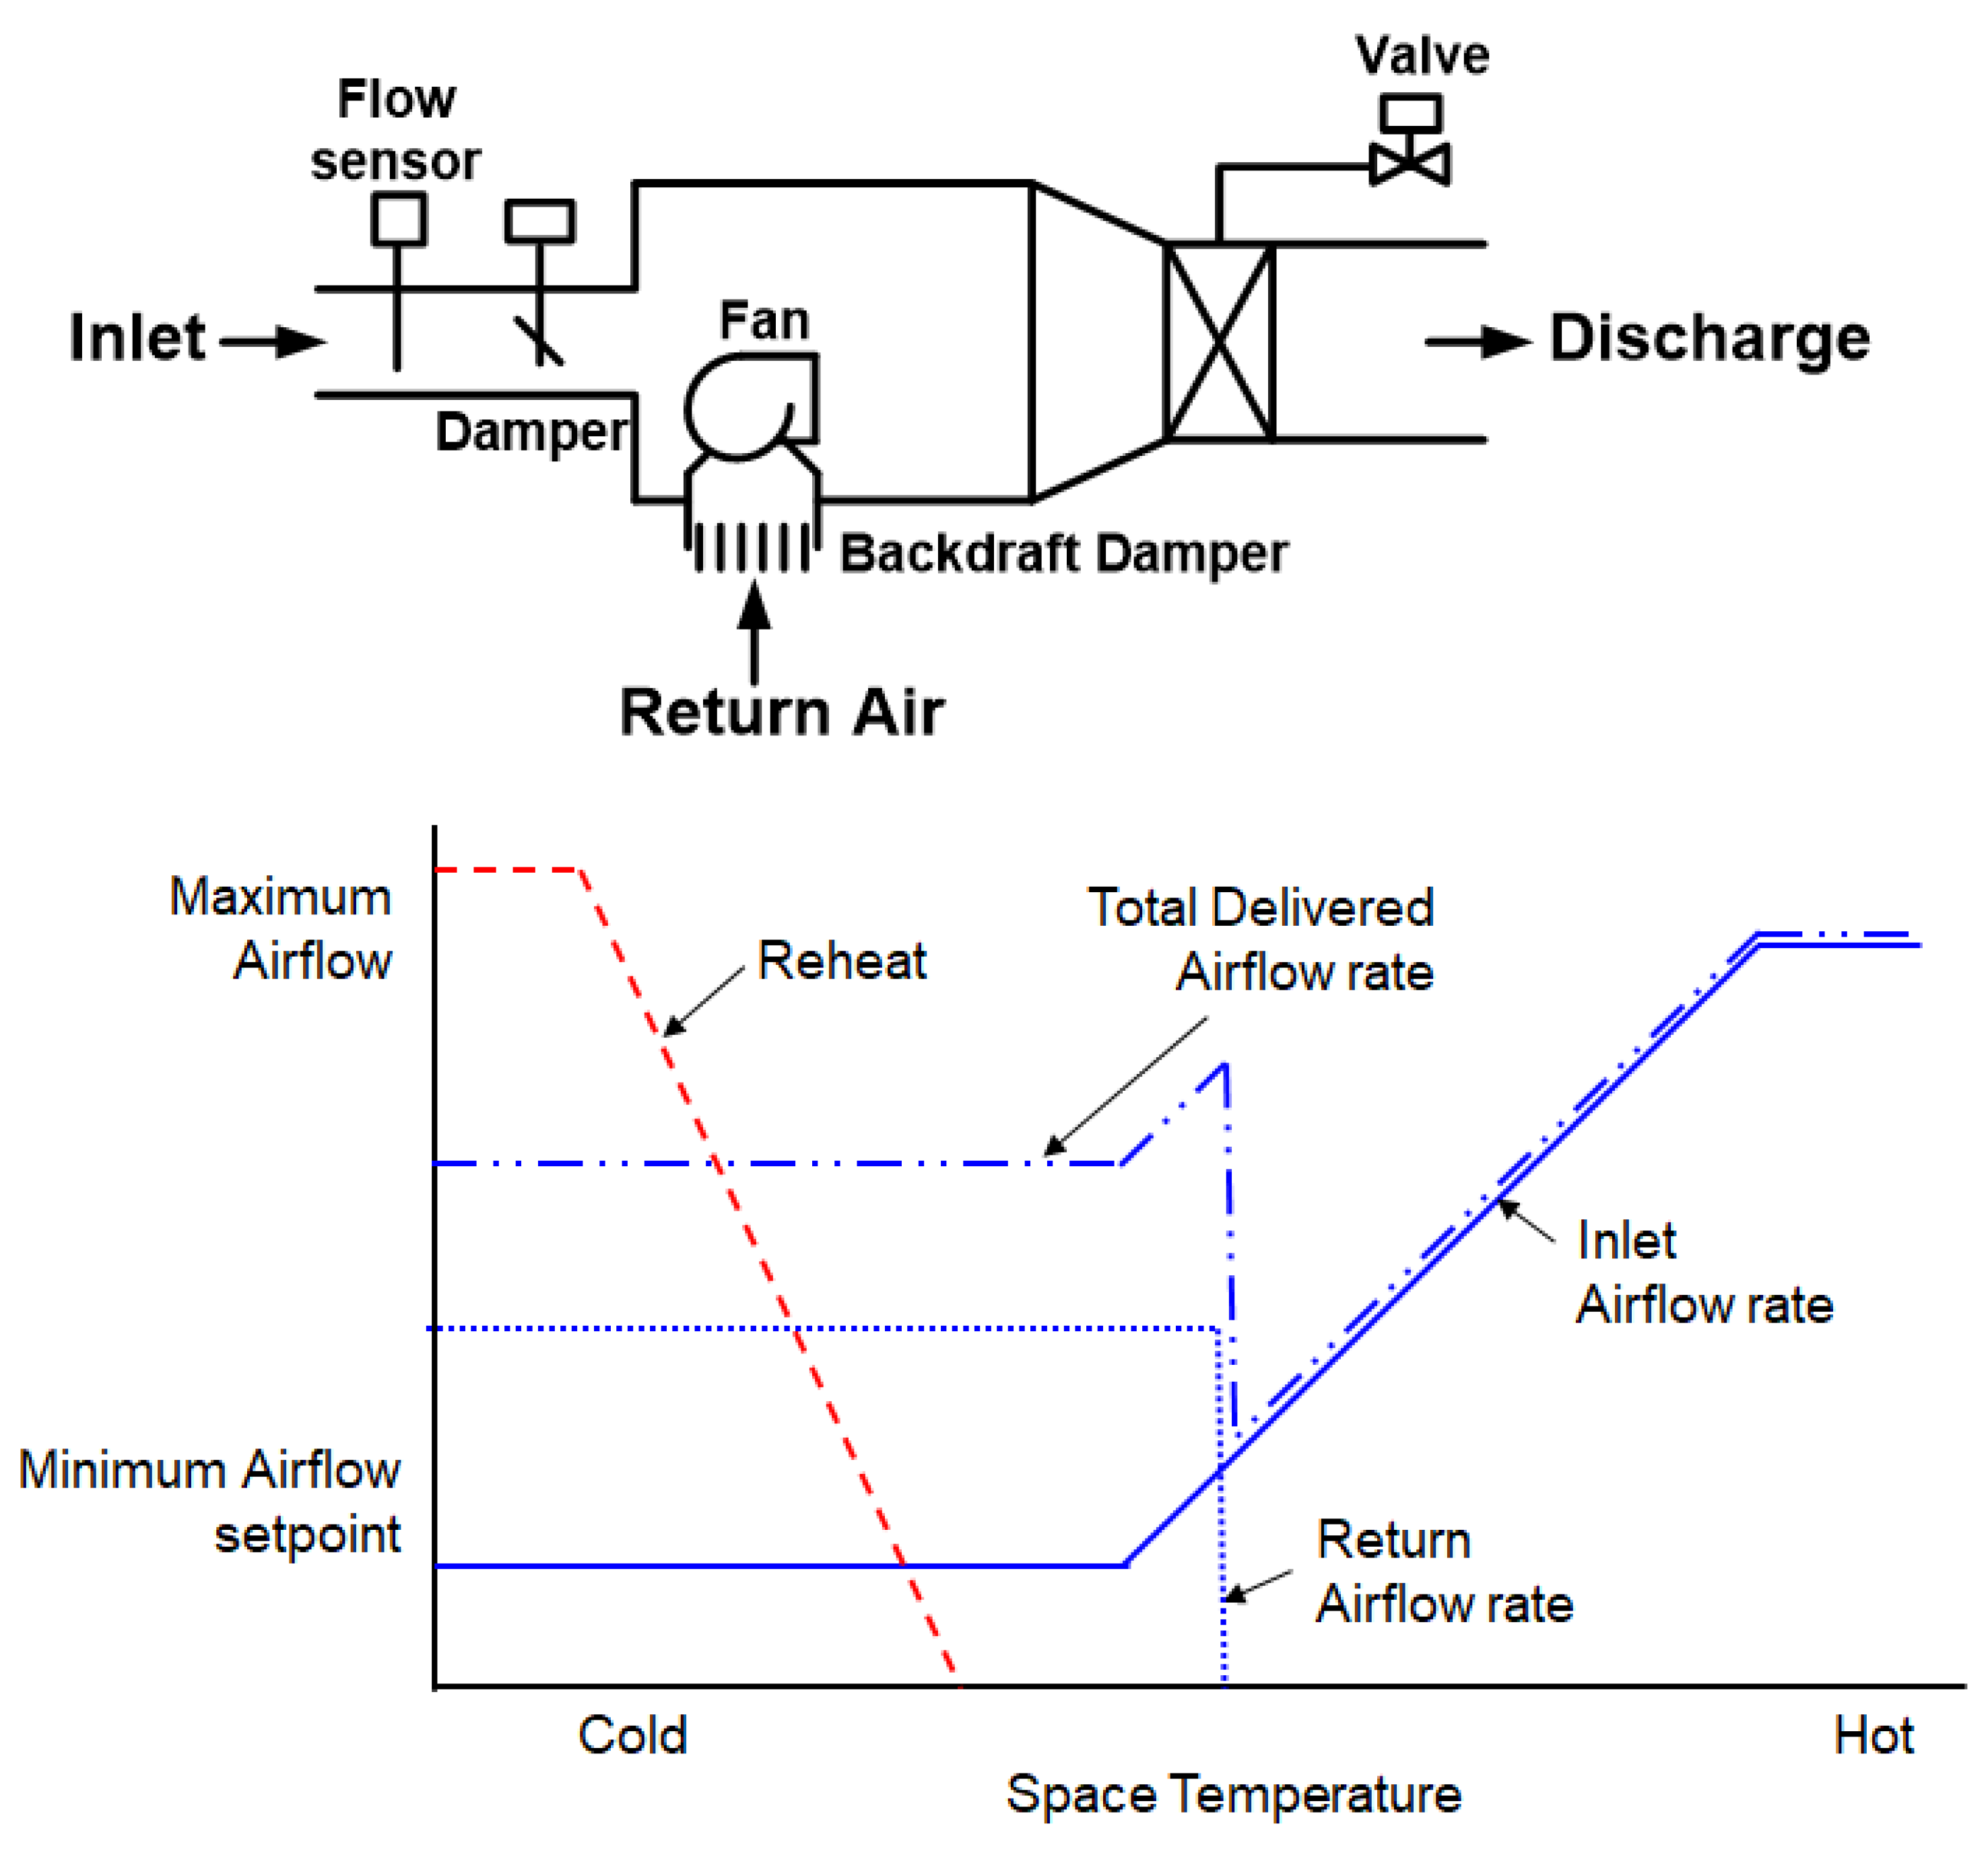
2.3. Fan-Powered VAV Terminal Unit

A fan power terminal unit is a terminal unit that includes a fan that supplies a constant air flow rate to the room and can be divided into series fan-powered and parallel fan-powered. The series fan power VAV terminal unit can improve the indoor air diffusion performance, and can be controlled for setback and warmup purposes, together with a reheat coil when the primary system is not operating. The fan operates to supply a constant air flow rate when there are occupants in the room. The fan of the terminal unit may introduce a ventilation air flow rate to reduce the supply air flow rate of the air conditioner.
When the room temperature drops below the set temperature, the supply damper begins to close, and the fan in the terminal unit introduces the ventilation air flow rate. A reheat coil is included for the outer perimeter of the building. The reheat coil is activated when the air flow rate of the terminal unit is supplied at the minimum air flow rate. Figure 4 presents the serial fan power terminal unit and control sequence.
The fan of the variable airflow terminal unit is located in parallel with the variable airflow terminal damper and is located in the ventilation plenum. Fans can operate to maintain a minimum room airflow to reduce the supply airflow. When the indoor temperature is reduced to below the cooling set temperature, the VAV terminal air flow rate is reduced, and the supplied air flow rate reaches the minimum air flow rate. The reheat coil valve operates when the room temperature falls below the indoor heating set temperature. When the indoor space is not occupied, and heating is required for setback or warmup, the terminal unit damper is closed and the fan and reheat coil valve are activated to satisfy the room set temperature in the non-occupant situation. Figure 5 shows the parallel fan power terminal unit and control sequence. On the other hand, the fan-powered terminal unit requires additional control for the operation of the fan. When controlling the indoor air flow rate using the fan, there may be a problem securing the required ventilation, fan noise problem, and high installation and maintenance costs.

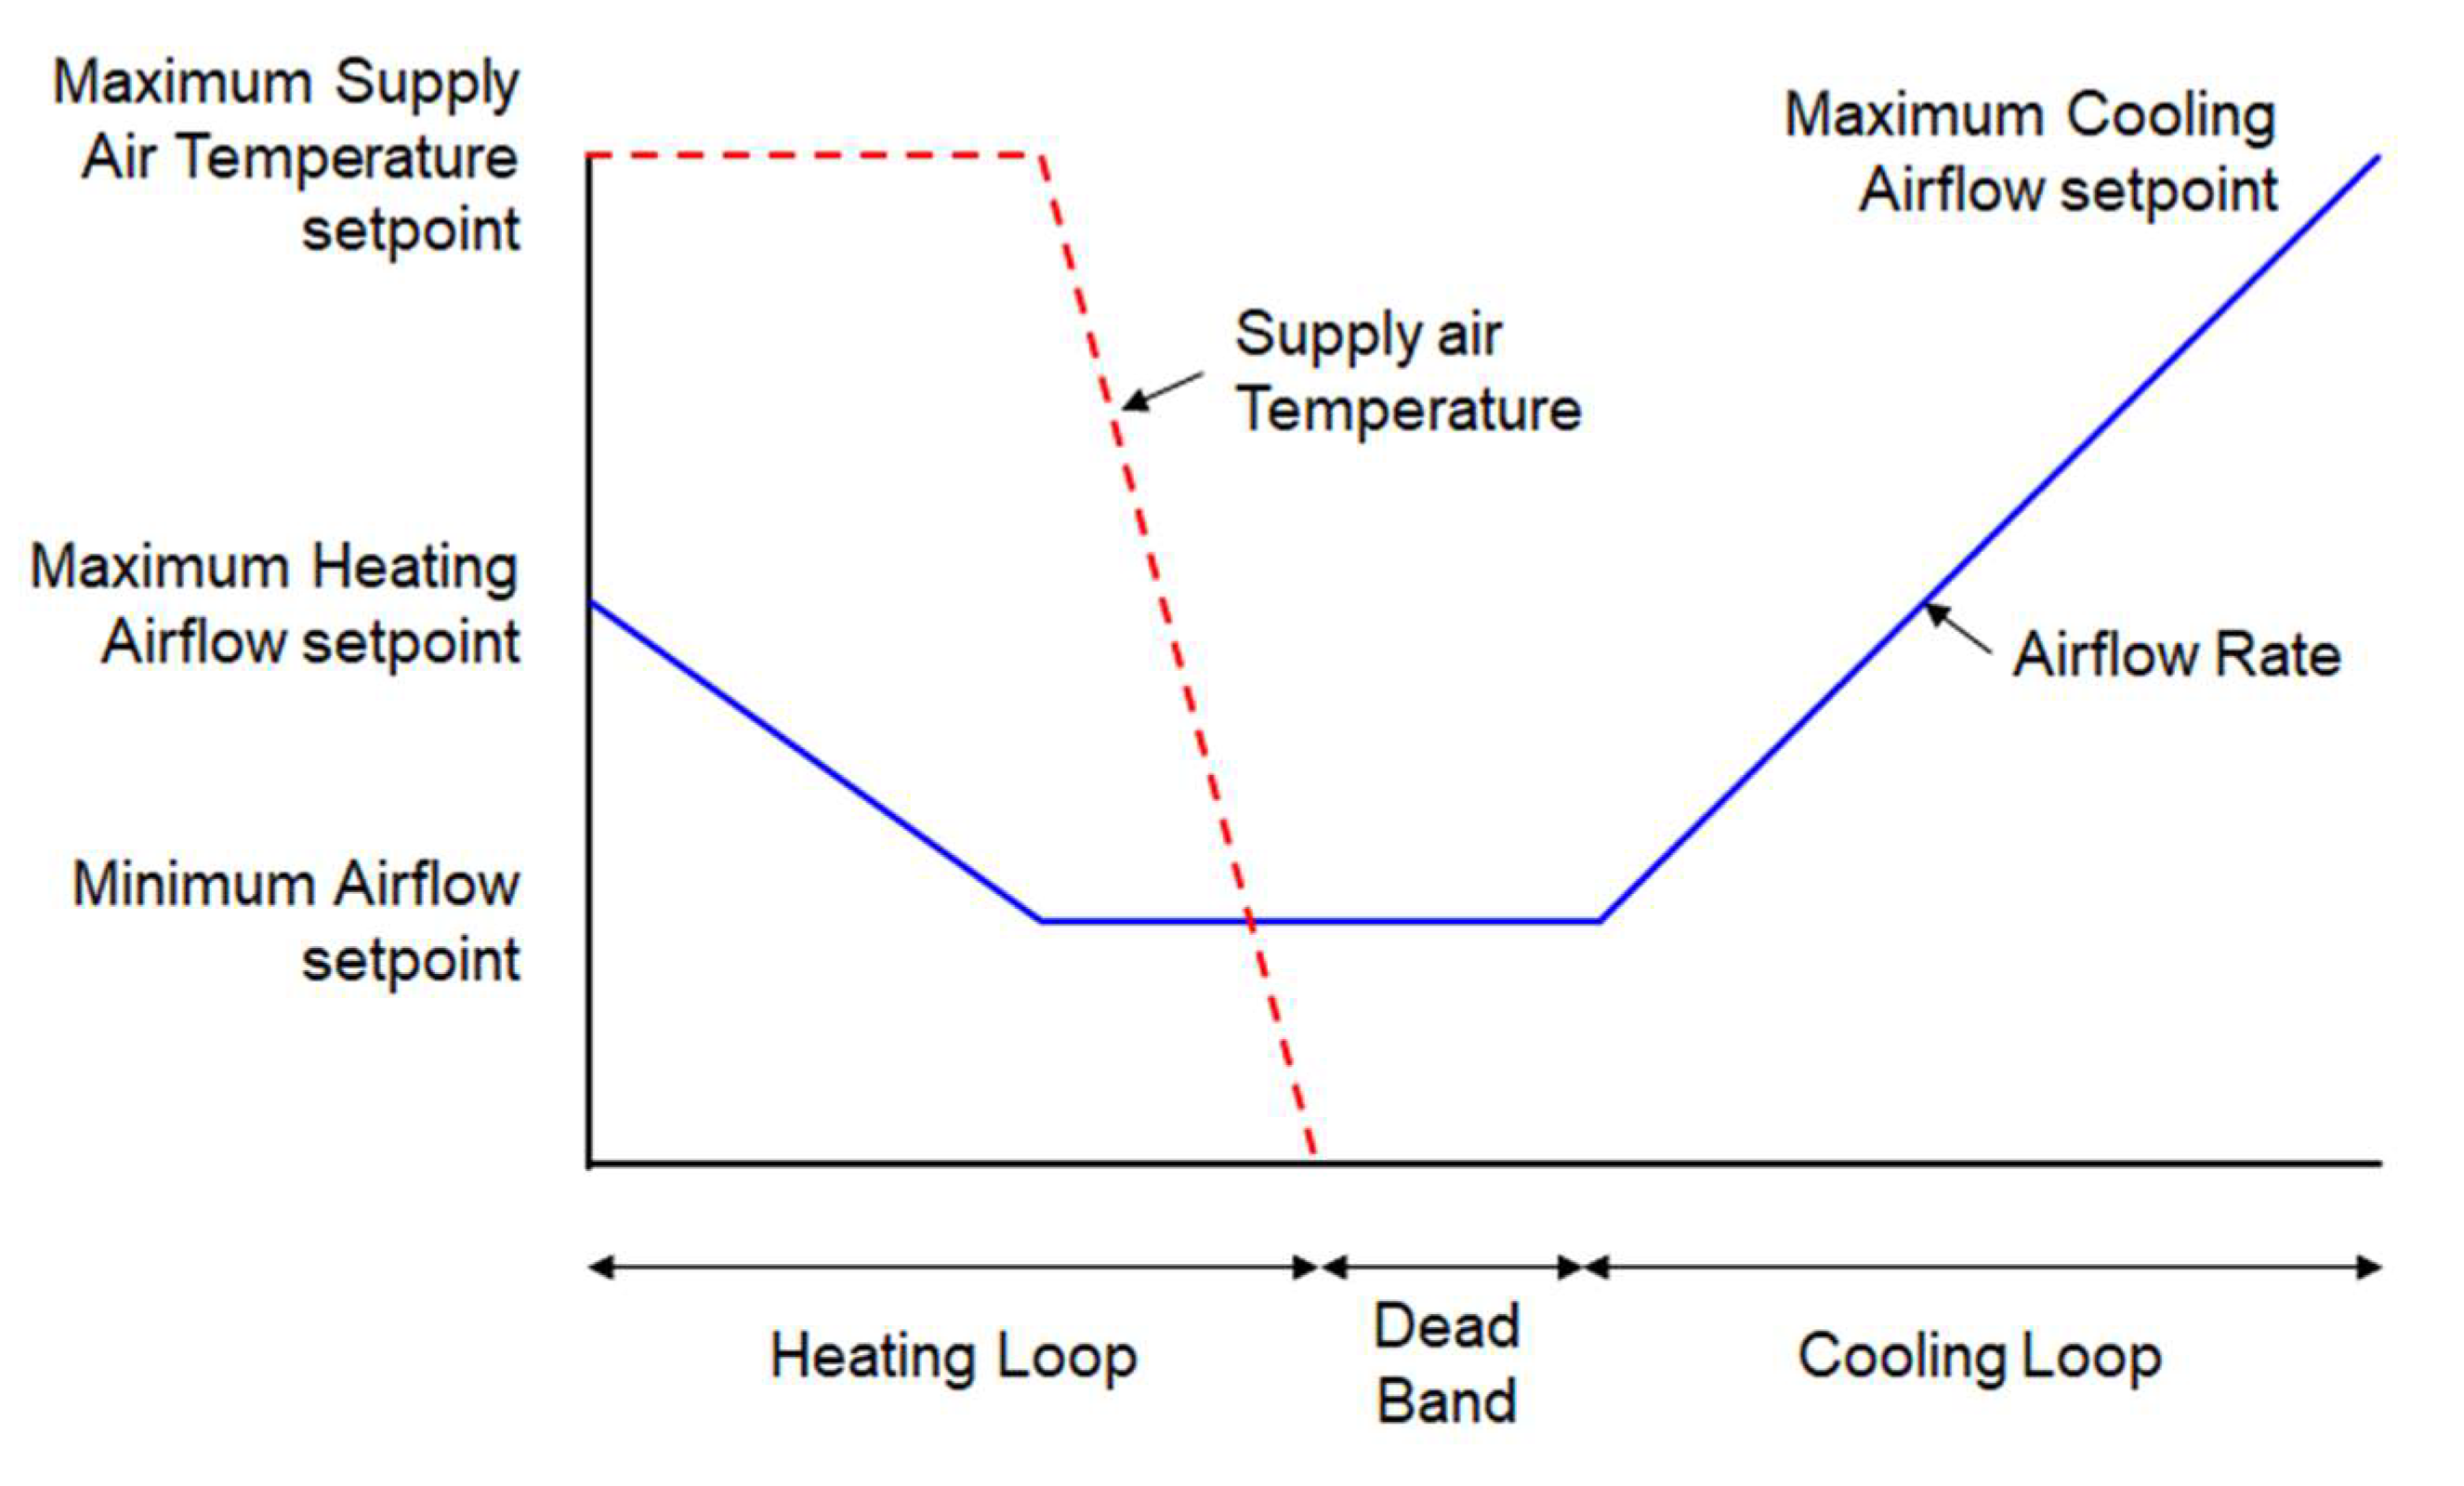
3. Operation and Control Method

Since the VAV system was first applied to buildings in the 1970s, the study of VAV terminal unit control developed rapidly with air flow rate sensors in the 1980s and DDC in the 1990s [17].
Stein [18] presented the maximum cooling airflow and the maximum heating airflow. During heating, the maximum air flow rate was determined based on the heating load requirement. The minimum air flow rate must be greater than the minimum ventilation requirement and the minimum performance of the controller, and must not exceed 20% of the maximum cooling air flow rate. On the other hand, due to the fixed supply air flow rate and supply temperature set points, it is impossible to reflect the dynamic indoor situation, and energy may be wasted if the heating load is large. Cho and Liu [19] confirmed the relationship between the supply temperature and the terminal unit minimum air flow rate through mathematical models and simulations. In addition, the relationship between the air flow rate and supply temperature that can minimize energy consumption was presented through the appropriate supply temperature according to the load, stratification analysis, and energy analysis and was verified by laboratory application. Liu [20] proposed a method for controlling the demand ventilation using the occupancy sensor for the existing demand ventilation amount-based control technology using the carbon dioxide concentration sensor in the VAV terminal unit system. This reduced the system cost and energy cost. Kang et al. [21] studied the relationship between supply temperature, air flow rate, and energy according to various floor heights. They suggested a method of controlling the air flow rate and supply temperature of the terminal unit considering the indoor load, stratification, and indoor air quality. Kim et al. [22] reset the air flow rate and supply temperature considering the ventilation volume in the multi-zone and performed performance evaluation through energy simulation. Zhu [23] proposed a control method to improve the indoor monitoring performance by increasing the number of indoor temperature sensors to control the VAV terminal units using a computational fluid dynamics program and dynamic energy simulation and reset the supply temperature based on the data obtained. The Air Diffusion Performance Index (ADPI) and indoor thermal comfort were improved. On the other hand, as a control method based on a mathematical model, considerable expertise is required, and there is a limit to verifying the field applicability because it is evaluated through simulation. Table 1 shows the results of existing studies related to the VAV terminal unit control.

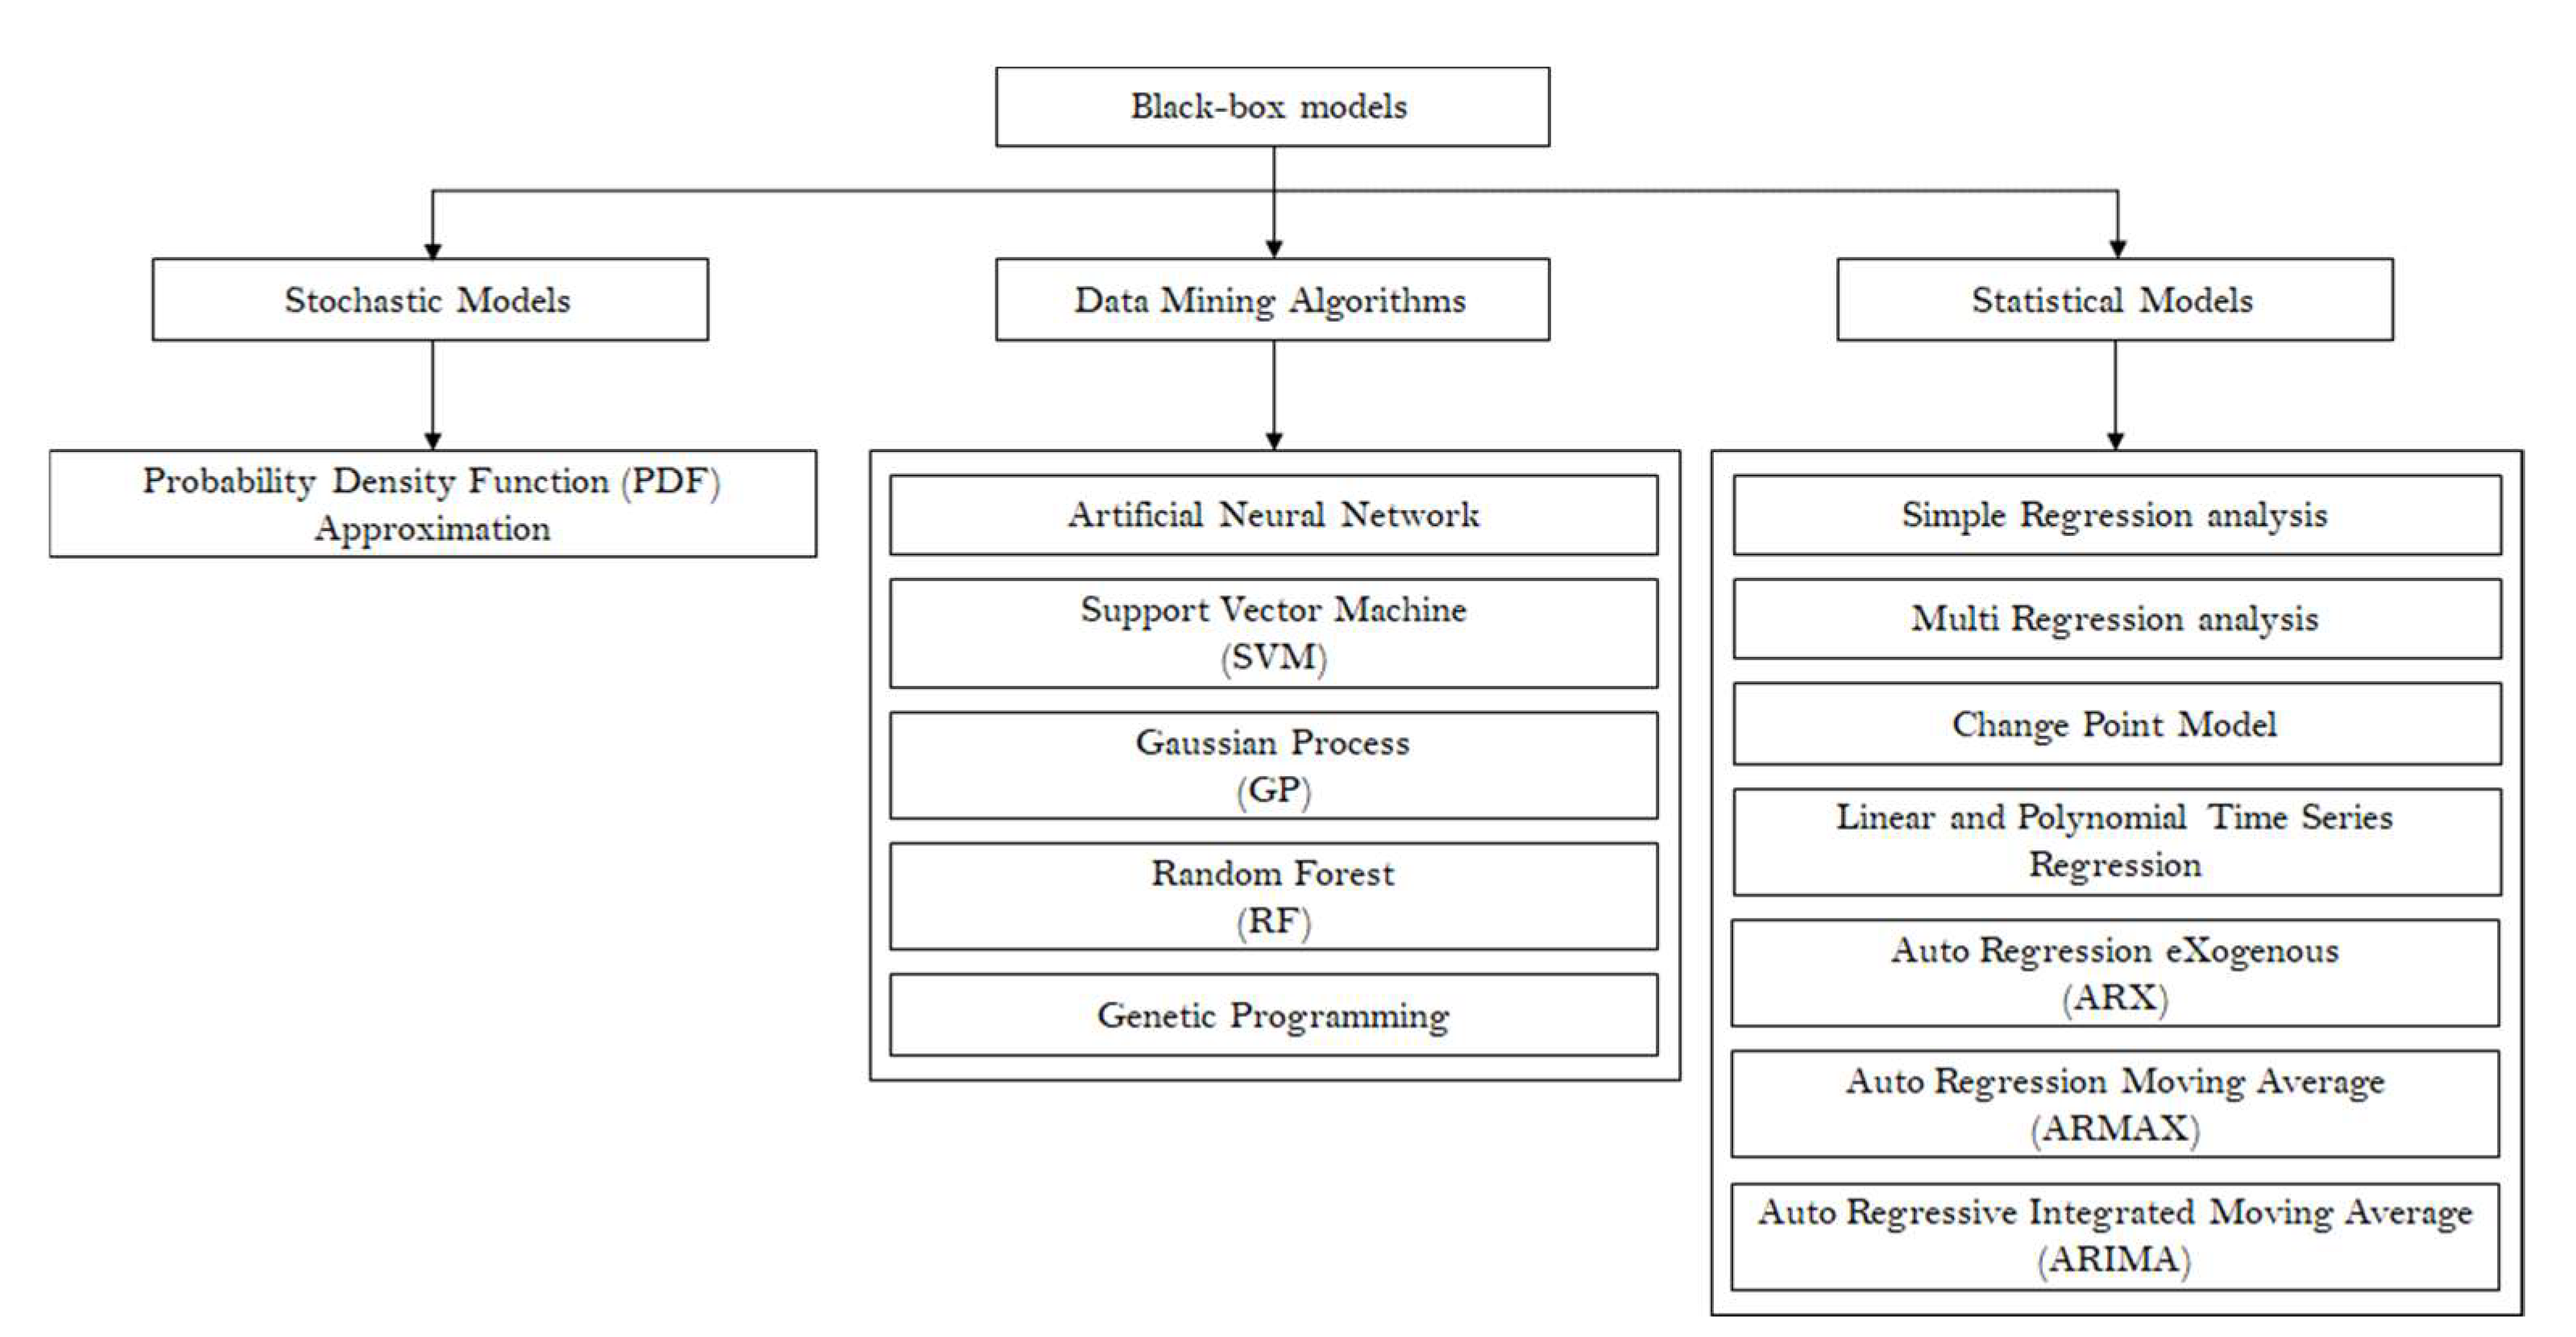
4. Prediction Model for VAV Terminal Unit Control

There are limitations in whether the existing facility system operates normally, status check, simple energy monitoring, and simple control of the set point by the manager because of the necessity of processing vast amounts of information according to the automation of buildings [24]. Research related to the prediction, operation, and optimization control of building systems using data-based models is being conducted to solve this problem. The approach to predictive model development can be divided into a mathematical model-based white-box model and a data-based black-box model [25]. The indoor load is one of the most complex factors to predict in a building environment. Hence, it is necessary to collect and calculate a large amount of information to predict it through a white-box model. In this case, if the necessary information is omitted, the model performance deteriorates rapidly, or its reliability cannot be secured. On the other hand, a black-box model approach expresses the dynamic behavior of a system using data measured with measurement equipment, such as Building Automation Systems (BAS), and a higher level of expertise than the white-box model is needed. This approach does not work, and selection is unnecessary for several variables [26].
The white-box model simplifies an actual physical phenomenon and expresses it in the form of a mathematical model. As the complexity of the building shape expressed by the white-box model increases, the modeling effort for the mechanical system that expresses it increases exponentially. The computation time required to perform the simulation also increases significantly, resulting in real-time model-based control (Model Predictive Control, MPC). MPC may not be applied easily. On the other hand, a white-box model can be used when only shape information exists in a building or when developing a model without additional data because no measuring equipment is installed, and many studies are being conducted continuously. Thosar et al. [27] estimated the steady-state by the energy balance for the zone model installed with the VAV system. Ma et al. [28] developed a white-box model for the cooling storage tank and used it for model-based predictive control.
To compensate for the shortcomings of the white-box model described above, a data-driven (data-driven) black-box model, particularly a machine learning model, has attracted attention as a predictive model development tool in buildings, and research is being actively conducted. The black-box model is a model that describes the relationship between the input and output data probabilistically and statistically rather than using a physical law of the dynamic behavior of a building [29]. Therefore, the black-box model does not require expert knowledge to explain physical phenomena, nor does it require an estimation process for unknown input variables. For this reason, the black-box model can be used effectively for existing buildings that collect data through BAS in the operation stage. Several methods have been used for the black-box model, as shown in Figure 6, such as simple regression analysis, which explains the relationship between one dependent variable and one independent variable, and one dependent variable and multiple independent variables. Multiple regression analysis can describe the relationship between variables: Artificial Neural Network (ANN) model, Support Vector Machine (SVM), Random Forest (RF), K-Recent, and machine learning models, such as K-Nearest Neighbor [30]. Although there are differences in the structure of these various black-box models, the relationship between the input and output variables is commonly described through parameters. In addition, the parameters have a structure that minimizes the difference between the output and the actual measured value.
Among the various black-box models, the machine learning model is not limited by the number of independent variables for the dependent variable and is suitable for predicting the characteristics of buildings and systems because it can predict the nonlinear relationship between an independent variable and the dependent variable. Therefore, considerable research has been undertaken recently. Huang et al. [31] developed an artificial neural network (ANN) that predicts the indoor temperature using the BAS data (exhaust water temperature of the refrigerator and state information) and weather information data (outside temperature) of the actual commercial building, and the optimal operation of the refrigerator starts and stopping time points was determined. Kim et al. [32] produced an artificial neural network (ANN) model, a support vector machine (SVM) model, and a Gaussian process (GP) model to predict the energy consumption of an actual office building and compared the performance of the three models.
Because the black-box model outputs the predicted values based on the matrix operation of the data, the operation speed is faster than the white-box model [33]. Therefore, MPC research using the black-box model is also being actively conducted. Garnier et al. [34] developed an artificial neural network (ANN) that was developed for the MPC of a heating, ventilation, and air conditioning (HVAC) system in an office building located in France. In this study, the MPC was implemented to predict and minimize the power consumption of the HVAC system using the environmental information (indoor temperature and radiant temperature) of each zone and the indoor set temperature as a control variable. The system was set to the PMV (Predictive Mean Vote) to optimize energy while maintaining indoor thermal comfort. Platon et al. [35] developed an hourly cooling energy usage prediction model for a building using artificial neural networks and case-based reasoning, and compared and analyzed the performance of the two prediction models. Pedro A. Gonzalez. et al. [36] developed a short-term building energy prediction model for each hour using an artificial neural network and compared and evaluated the actual building energy and the predicted value.
Each model approach was compared and analyzed to develop a predictive model using an artificial neural network, one of the black-box models, for optimal control of the VAV system. F. A Ansari et al. [37] predicted the cooling load using four input values, including the room temperature based on the white-box model. Zhou et al. [38] predicted the heating and cooling load using nine input values, including relative humidity. Li et al. [39] reported a support vector machine. Simon [40] reported a cooling load prediction using a Probabilistic Entropy-Based Neural network. Edwards R. E. et al. [41] used eight inputs, including user data. Sholahudin S. et al. [42] predicted the heating load using five input values, including the wind speed. Sala-Cardoso E et al. [43] predicted the load using seven input values, including the user based on recurrent neural networks. Ahmad M.W et al. [44] conducted load prediction through an RF model using six input values, such as humidity. Table 2 shows the results of existing studies related to the indoor load prediction.

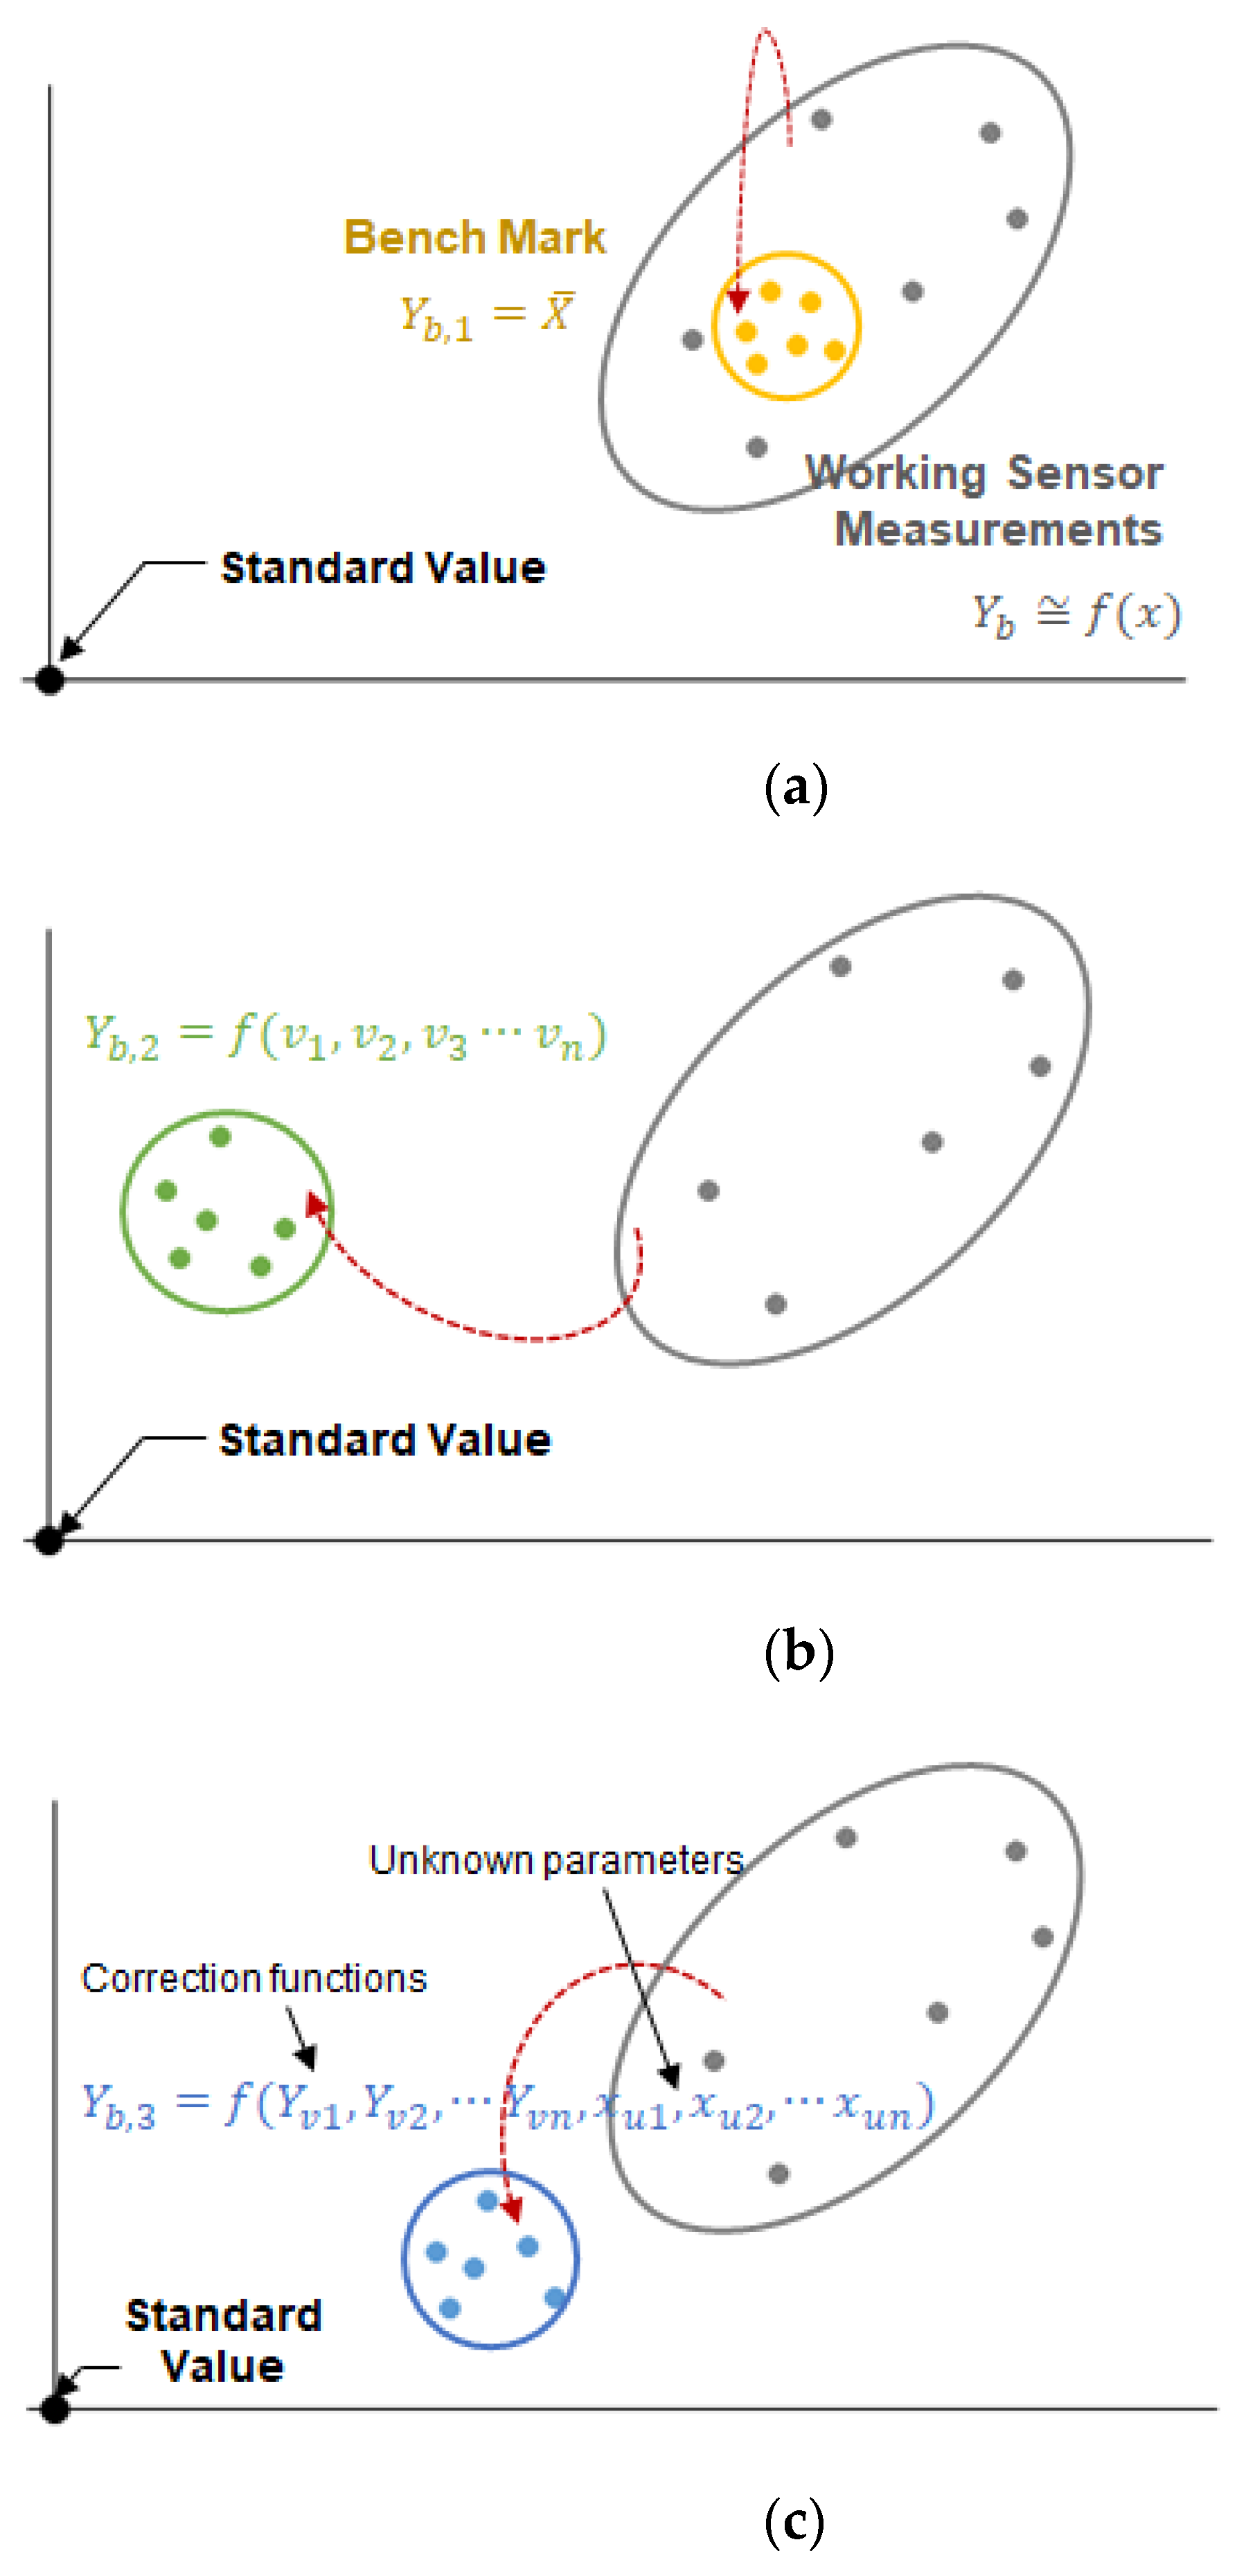
5. Sensor Calibration Method

The VAV terminal unit system uses a room-temperature sensor, air flow rate sensor, and supply temperature sensor for control. These sensors monitor the operating status of the air conditioning system and serve as control signals for controllers and actuators. Random errors and system failures can occur when sensors are installed. Random error is expressed as the difference between the measured value and the average value and is caused by external factors. Failures in the system are detected as discrepancies between the measurement mean and the measured, and it is difficult to find them. In particular, system failures caused by different environments in system operating conditions are difficult to solve even after correction. System failure is caused by the physical condition of the sensor, working environment, and other factors [45].
Sensor failure can harm the building energy, indoor air quality, and system performance analysis, and many studies have evaluated the impact of sensor failure on buildings. Zhang et al. [46] used a building energy simulation to confirm the effects of an outside temperature sensor and thermostat failure on energy consumption and thermal comfort and confirmed that cooling energy increased. Verhelst [47] analyzed the impact of sensor and actuator failure on the HVAC performance and cost aspects. Roth et al. [48] confirmed the energy impact of several faults, including sensor failure, in commercial buildings. Therefore, the failure of the sensor greatly affects the energy performance of the building, and calibration of the sensor is required to reduce energy consumption due to sensor failure and improve the indoor comfort.
Figure 7 shows the sensor calibration methods based on statistical theory, mathematical model, and Bayesian statistics. Figure 7a presents the sensor calibration method based on statistical theory, which determines the reference value by calculating the average of the measured values. This requires multiple sensors capable of measuring the point to measure the same phenomenon, which is used to detect random errors of individual monitoring sensors in this case. The mathematical model-based method (Figure 7b) can reduce both the system error and the random error without redundant sensors. This method uses the mathematical equations of the system model and the relative variables of the model to predict the reference value of the sensor. A correction function was determined to minimize the difference between the measured and reference values of the sensor. Yu [49] proposed a virtual in-situ calibration method. This method utilized statistically or mathematically modeled reference values without eliminating the built-in monitoring sensors of the system or installing additional reference sensors. Figure 7c presents sensor calibration using Bayesian statistics, and the reference value was estimated using Bayesian inference by equations and relative variables without additional sensors or standards [50]. In this case, the relative variable can be defined by other actuating sensors or unknown model parameters. The measured values of all actuating sensors were calibrated to reduce system and random errors.
A typical sensor calibration method is calibrated by an objective function. The objective function is derived as a distance function of sensor calibration using residual sum of squares (Equation (1)). The sensor calibration method is calculated using Bayesian inference and the Metropolis Hastings algorithm so that the distance function is minimized (Equation (2)).
D ( x ) = i = 1 N ( Y b i Y c i ) 2
P ( Y b | x ) = 1 σ 2 π e x p [ 1 2 σ 2 D ( x ) ]
where, i : counter for each working sensor; D ( x ) : Distance function; N : Number of distance fuction; P ( x | Y b ) : Posterior distribution of the variables; P ( Y b | x ) : Likelihood function; P ( Y b ) : Normalizing constant; Y b : Reference value; x : Variables; σ : Standard deviation.
Relative or independent variables used to calibrate a specific monitoring sensor for a system in operation are defined by the values of other sensors measured in the system or parameters of the system model [51]. Both pieces of information have uncertainty. Moreover, the relative variables of the reference value are defined as measurements from other sensors, which can have higher reliability than the target monitoring sensor, but the measurements are not always accurate [52]. The accuracy is affected by the physical environment in the measurement and may include unexplained uncertainties, such as heat transfer coefficient or heat capacity, when the parameters are determined. Existing sensor calibration methods have limitations in calibrating multiple monitoring sensors in operating building systems because of these potential inaccuracies. Moreover, it is more advantageous to consider important sensors and unknown parameters of the system to increase their applicability [53,54,55].

6. Conclusions

This study reviewed the existing research trends through literature research on VAV terminal unit systems, predictive models in buildings, artificial neural networks, and sensor calibration methods. The type of VAV terminal unit is divided into pressure dependent type and pressure independent type. The pressure independent VAV terminal unit has a throttling type, an induction type, and a fan-powered type. It controls the maximum and minimum air flow rate for VAV control, and controls the supply temperature in case of VAV terminal unit with reheat coil. The operation and control method of the VAV terminal unit was studied on the resetting of the minimum air volume and supply temperature for energy saving. Resetting methods have been developed in consideration of energy, ventilation, and stratification of the existing fixed minimum air volume. Energy savings of about 10–30% were confirmed through optimal control. The VAV terminal unit operates to satisfy indoor thermal comfort and indoor air quality. For this, it is necessary to estimate the indoor load and CO2 concentration. In previous studies, indoor load and carbon dioxide concentration were developed through mathematical models and data-based models. A data-based prediction model was developed based on various architectural factors. A sensor calibration methods were developed using a statistical model, a mathematical model, and a Bayesian statistical model to analyze the theory and existing research trends on the sensor calibration method. The Bayesian statistics-based calibration method is a probabilistic calibration method using operational data, and sensor calibration studies in refrigerators and air conditioners were conducted. The possibility of developing a VAV terminal unit sensor calibration method using a predictive model was confirmed. In conclusion, the VAV terminal unit system is one of the most energy efficient systems. The energy saving potential of current VAV systems can still be improved through control methods, the use of predictive models, and sensor calibration methods.

Author Contributions

H.-J.K. wrote the majority of this article. Y.-H.C. was responsible for this article and revised this article. All authors have read and agreed to the published version of the manuscript.

Funding

This work was supported by the National Research Foundation of Korea (NRF) grant funded by the Korea government (NRF-2019R1A2C1009445).

Institutional Review Board Statement

Not applicable.

Informed Consent Statement

Not applicable.

Data Availability Statement

No new data were created or analyzed in this study. Data sharing is not applicable to this article.

Conflicts of Interest

The authors declare no conflict of interest.

References

  1. United Nations. United Nations Framework Convention on Climate Change; UN: New York, NY, USA, 1992. [Google Scholar]
  2. United Nations. Adoption of the Paris Agreement; UN: New York, NY, USA, 2015. [Google Scholar]
  3. World Green Building Council. 2019 Global Status Report for Buildings and Construction; World Green Building Council: London, UK, 2019. [Google Scholar]
  4. Kim, D.; Cox, S.J.; Cho, H.; Im, P. Evaluation of energy savings potential of variable refrigerant flow (VRF) from variable air volume (VAV) in the U.S. climate locations. Energy Rep. 2017, 3, 85–93. [Google Scholar] [CrossRef]
  5. Rismanchi, B.; Zambrano, J.M.; Saxby, B.; Tuck, R.; Stenning, M. Control Strategies in Multi-Zone Air Conditioning Systems. Energies 2019, 12, 347. [Google Scholar] [CrossRef] [Green Version]
  6. Kim, C.-H.; Lee, S.-E.; Lee, K.-H.; Kim, K.-S. Detailed Comparison of the Operational Characteristics of Energy-Conserving HVAC Systems during the Cooling Season. Energies 2019, 12, 4160. [Google Scholar] [CrossRef] [Green Version]
  7. Awbi, H.B. Ventilation for Good Indoor Air Quality and Energy Efficiency. Energy Procedia 2017, 112, 277–286. [Google Scholar] [CrossRef]
  8. American Society of Heating, Refrigerating and Air-Conditioning Engineers (ASHRAE). ASHRAE Standard 90.1-2010: Energy Standard for Buildings Except Low-Rise Residential Buildings; ASHEAE: Atlanta, GA, USA, 2010. [Google Scholar]
  9. Seyedzadeh, S.; Rahimian, F.; Glesk, I.; Roper, M. Machine learning for estimation of building energy consumption and performance: A review. Vis. Eng. 2018, 6, 5. [Google Scholar] [CrossRef]
  10. Brambley, M.R.; Haves, P.; McDonald, S.C.; Torcellini, P.; Hansen, D.; Holmberg, D.R.; Roth, K.W. Advanced Sensors and Controls for Building Applications: Market Assessment and Potential R&D Pathways; PNNL-15149; Pacific Northwest National Laboratory: Washington, DC, USA, 2005.
  11. Rahmani, A.M.; Azhir, E.; Ali, S.; Mohammadi, M.; Ahmed, O.H.; Ghafour, M.Y.; Ahmed, S.H.; Hosseinzadeh, M. Artificial intelligence approaches and mechanisms for big data analytics: A systematic study. PeerJ Comput. Sci. 2021, 7, e488. [Google Scholar] [CrossRef]
  12. Lee, S.; Yik, F. A study on the energy penalty of various air-side system faults in buildings. Energy Build. 2010, 42, 2–10. [Google Scholar] [CrossRef]
  13. Kim, H.-J.; Kang, S.-H.; Cho, Y.-H. A Study on the Control Method without Stratification of Single Duct VAV Terminal Units. J. Asian Arch. Build. Eng. 2015, 14, 467–474. [Google Scholar] [CrossRef] [Green Version]
  14. Pang, X.; Piette, M.A.; Zhou, N. Characterizing variations in variable air volume system controls. Energy Build. 2017, 135, 166–175. [Google Scholar] [CrossRef] [Green Version]
  15. Liu, G.; Dasu, A.R.; Zhang, J. Review of Literature on Terminal Box Control, Occupancy Sensing Technology and Multi-zone Demand Control Ventilation (DCV); PNNL-21281; Pacific Northwest National Laboratory: Washington, DC, USA, 2012.
  16. ASHRAE. ASHRAE Handbook HVAC Application, Design and Application of Controls; ASHRAE: Atlanta, GA, USA, 2015; Chapter 47. [Google Scholar]
  17. Int-Hout, D.; Faris, G. VAV terminal units: Looking Back, Ahead. ASHRAE J. 2015, 57, 40–49. [Google Scholar]
  18. Stein, J. VAV boxes, HPAC Heating, Piping, Air Conditioning Engineering. 2005, 77, 40–44.
  19. Cho, Y.; Liu, M.M. Minimum air flow reset of single duct VAV terminal boxes. Build. Environ. 2009, 44, 1876–1885. [Google Scholar] [CrossRef]
  20. Liu, G.; Brambley, M. Occupancy Based Control Strategy for Variable-Air-Volume (VAV) Terminal Box Systems. ASHRAE Trans. 2011, 117, 244–252. [Google Scholar]
  21. Kang, S.-H.; Kim, H.-J.; Cho, Y.-H. A study on the control method of single duct VAV terminal unit through the determination of proper minimum air flow. Energy Build. 2014, 69, 464–472. [Google Scholar] [CrossRef]
  22. Kim, H.-J.; Cho, Y.-H. A Study on a Control Method with a Ventilation Requirement of a VAV System in Multi-Zone. Sustainability 2017, 9, 2066. [Google Scholar] [CrossRef] [Green Version]
  23. Zhu, X.; Shi, T.; Jin, X.; Du, Z. Multi-sensor information fusion based control for VAV systems using thermal comfort constraints. Build. Simul. 2020, 14, 1047–1062. [Google Scholar] [CrossRef]
  24. Luskay, L.; Brambley, M.; Katipamula, S. Methods for Automated and Continuous Commissioning of Building Systems (Final Report); Air-Conditioning and Refrigeration Technology Institute: Arlington, VA, USA, 2003. [Google Scholar] [CrossRef] [Green Version]
  25. Li, X.; Wen, J. Review of building energy modeling for control and operation. Renew. Sustain. Energy Rev. 2014, 37, 517–537. [Google Scholar] [CrossRef]
  26. Serale, G.; Fiorentini, M.; Capozzoli, A.; Bernardini, D.; Bemporad, A. Model Predictive Control (MPC) for Enhancing Building and HVAC System Energy Efficiency: Problem Formulation, Applications and Opportunities. Energies 2018, 11, 631. [Google Scholar] [CrossRef] [Green Version]
  27. Thosar, A.; Patra, A.; Bhattacharyya, S. Feedback linearization based control of a variable air volume air conditioning system for cooling applications. ISA Trans. 2008, 47, 339–349. [Google Scholar] [CrossRef]
  28. Ma, Z.; Wang, S. An optimal control strategy for complex building central chilled water systems for practical and real-time applications. Build. Environ. 2009, 44, 1188–1198. [Google Scholar] [CrossRef]
  29. Solomatine, D.P.; Ostfeld, A. Data-driven modelling: Some past experiences and new approaches. J. Hydroinform. 2008, 10, 3–22. [Google Scholar] [CrossRef] [Green Version]
  30. Afram, A.; Janabi-Sharifi, F. Theory and applications of HVAC control systems—A review of model predictive control (MPC). Build. Environ. 2014, 72, 343–355. [Google Scholar] [CrossRef]
  31. Huang, H.; Chen, L.; Hu, E. A neural network-based multi-zone modelling approach for predictive control system design in commercial buildings. Energy Build. 2015, 97, 86–97. [Google Scholar] [CrossRef]
  32. Kim, Y.M.; Ahn, K.U.; Park, C.S. Issues of Application of Machine Learning Models for Virtual and Real-Life Buildings. Sustainability 2016, 8, 543. [Google Scholar] [CrossRef] [Green Version]
  33. Loyola-Gonzalez, O. Black-Box vs. White-Box: Understanding Their Advantages and Weaknesses from a Practical Point of View. IEEE Access 2019, 7, 154096–154113. [Google Scholar] [CrossRef]
  34. Garnier, A.; Eynard, J.; Caussanel, M.; Grieu, S. Predictive control of multizone heating, ventilation and air-conditioning systems in non-residential buildings. Appl. Soft Comput. 2015, 37, 847–862. [Google Scholar] [CrossRef]
  35. Platon, R.; Dehkordi, V.R.; Martel, J. Hourly Prediction of a Building’s Electricity Consumption using Case-based Reasoning, Artificial Neural Networks and Principal Component Analysis. Energy Build. 2015, 92, 10–18. [Google Scholar] [CrossRef]
  36. González, P.A.; Zamarreño, J. Prediction of hourly energy consumption in buildings based on a feedback artificial neural network. Energy Build. 2005, 37, 595–601. [Google Scholar] [CrossRef]
  37. Ansari, F.A.; Mokhtar, A.S.; Abbas, K.A.; Adam, N.M. A Simple Approach for Building Cooling Load Estimation. Am. J. Environ. Sci. 2005, 1, 209–212. [Google Scholar] [CrossRef] [Green Version]
  38. Zhou, Q.; Wang, S.; Xu, X.; Xiao, F. A grey-box model of next-day building thermal load prediction for energy-efficient control. Int. J. Energy Res. 2008, 32, 1418–1431. [Google Scholar] [CrossRef]
  39. Li, Q.; Meng, Q.; Cai, J.; Yoshino, H.; Mochida, A. Applying support vector machine to predict hourly cooling load in the building. Appl. Energy 2009, 86, 2249–2256. [Google Scholar] [CrossRef]
  40. Kwok, S.S.; Lee, W.E. A study of the importance of occupancy to building cooling load in prediction by intelligent approach. Energy Convers. Manag. 2011, 52, 2555–2564. [Google Scholar] [CrossRef]
  41. Edwards, R.E.; New, J.; Parker, L.E. Predicting future hourly residential electrical consumption: A machine learning case study. Energy Build. 2012, 49, 591–603. [Google Scholar] [CrossRef]
  42. Sholahudin, S.; Han, H. Simplified dynamic neural network model to predict heating load of a building using Taguchi method. Energy 2016, 115, 1672–1678. [Google Scholar] [CrossRef]
  43. Sala-Cardoso, E.; Delgado-Prieto, M.; Kampouropoulos, K.; Romeral, L. Activity-aware HVAC power demand forecasting. Energy Build. 2018, 170, 15–24. [Google Scholar] [CrossRef]
  44. Ahmad, M.W.; Mourshed, M.; Rezgui, Y. Trees vs Neurons: Comparison between random forest and ANN for high-resolution prediction of building energy consumption. Energy Build. 2017, 147, 77–89. [Google Scholar] [CrossRef]
  45. Yoon, S.; Yu, Y.; Wang, J.; Wang, P. Impacts of HVACR temperature sensor offsets on building energy performance and occupant thermal comfort. Build. Simul. 2018, 12, 259–271. [Google Scholar] [CrossRef]
  46. Zhang, R.; Hong, T. Modeling of HVAC operational faults in building performance simulation. Appl. Energy 2017, 202, 178–188. [Google Scholar] [CrossRef]
  47. Verhelst, J.; Van Ham, G.; Saelens, D.; Helsen, L. Economic impact of persistent sensor and actuator faults in concrete core activated office buildings. Energy Build. 2017, 142, 111–127. [Google Scholar] [CrossRef]
  48. Roth, K.W.; Westphalen, D.; Llana, P.; Feng, M. The energy impact of faults in U.S. commercial buildings. In Proceedings of the International Refrigeration and Air Conditioning Conference, Milan, Italy, 12–13 June 2009. [Google Scholar]
  49. Yu, Y.; Li, H. Virtual in-situ calibration method in building systems. Autom. Constr. 2015, 59, 59–67. [Google Scholar] [CrossRef] [Green Version]
  50. Yoon, S.; Yu, Y. Extended virtual in-situ calibration method in building systems using Bayesian inference. Autom. Constr. 2017, 73, 20–30. [Google Scholar] [CrossRef] [Green Version]
  51. Badura, M.; Batog, P.; Drzeniecka-Osiadacz, A.; Modzel, P. Regression methods in the calibration of low-cost sensors for ambient particulate matter measurements. SN Appl. Sci. 2019, 1, 622. [Google Scholar] [CrossRef] [Green Version]
  52. Ruiter, S.; Kuijpers, E.; Saunders, J.; Snawder, J.; Warren, N.; Gorce, J.-P.; Blom, M.; Krone, T.; Bard, D.; Pronk, A.; et al. Exploring Evaluation Variables for Low-Cost Particulate Matter Monitors to Assess Occupational Exposure. Int. J. Environ. Res. Public Health 2020, 17, 8602. [Google Scholar] [CrossRef] [PubMed]
  53. Yoon, S.; Yu, Y. Hidden factors and handling strategy for accuracy of virtual in-situ sensor calibration in building energy systems: Sensitivity effect and reviving calibration. Energy Build. 2018, 170, 217–228. [Google Scholar] [CrossRef]
  54. Yoon, S.; Yu, Y. Hidden factors and handling strategies on virtual in-situ sensor calibration in building energy systems: Prior information and cancellation effect. Appl. Energy 2018, 212, 1069–1082. [Google Scholar] [CrossRef]
  55. Yoon, S.; Yu, Y. Strategies for virtual in-situ sensor calibration in building energy systems. Energy Build. 2018, 172, 22–34. [Google Scholar] [CrossRef]
Figure 1. Throttling VAV terminal unit [16].
Energies 14 07527 g001
Figure 2. Control Sequence of throttling VAV terminal unit [16].
Energies 14 07527 g002
Figure 3. Induction VAV terminal unit and control sequence [16].
Energies 14 07527 g003
Figure 4. Series fan-powered VAV terminal unit and control sequence [16].
Energies 14 07527 g004
Figure 5. Parallel fan-powered VAV terminal unit and control sequence [16].
Energies 14 07527 g005
Figure 6. Classification of Black-box Model [30].
Energies 14 07527 g006
Figure 7. Sensor calibration method. (a) Statistics model based. (b) Mathmatical model based sensor calibration. (c) Bayesian statistic model based.
Energies 14 07527 g007
Table 1. Existing study of VAV terminal unit control.
AuthorYearContentsCons
Stein [18]2005
  • Air flow rate set point selection according to design load and ventilation volume
  • Selection of maximum air flow rate under heating load
  • Impossible to reflect the dynamic indoor situation
  • Energy wastage when the heating load is large
Cho and Liu [19]2009
  • Resetting the minimum air flow rate considering heating load and indoor ventilation
  • Reset supply temperature according to room load
  • Evaluate the use of mathematical models, simulations and field applications
  • Requires a variety of information and expertise to construct a mathematical model
  • Requires installation of additional sensor (CO2 concentration)
Liu and Brambley [20]2011
  • Resetting the minimum air flow rate using the occupancy sensor
  • Requires installation of additional sensors
Kang et al. [21]2014
  • Reset minimum air flow rate and supply temperature considering indoor load, stratification, and indoor air quality
  • Analyze the relationship between supply temperature, air flow rate, and energy according to floor height
  • Validation of mathematical models and dynamic energy simulations
  • Requires a variety of information and expertise to construct a mathematical model
  • Field application evaluation required
Kim et al. [22]2017
  • Consider ventilation in multi-zone and reset minimum air flow rate
  • Reset supply temperature according to supply air flow rate
  • Using mathematical models, verifying dynamic energy simulations
  • Requires a variety of information and expertise to construct a mathematical model
  • Field application evaluation required
Zhu et al. [23]2021
  • Reset the supply temperature by increasing the location of the indoor temperature sensor
  • ADPI performance improvement, CFD + dynamic energy simulation validation
  • Requires installation of additional sensors
  • Field application evaluation required
Table 2. Existing study of indoor load prediction model.
CategoryMethodPredictionInputAuthor
Indoor LoadWhite-boxCooling loadTotal 4 point (Indoor temperature, etc.)F.A. Ansari et al. [37]
Grey-boxHeating/Cooling loadTotal 9 point (Relative humidity, etc.)Zhou et al. [38]
Black -boxSupport vector machineCooling loadTotal 5 point (solar radiation, etc.)Li et al. [39]
Probabilistic Entropy-Based NeuralCooling loadTotal 4 point (Building form factor, etc.)Simon S.K. et al. [40]
Support Vector MachineHeating loadTotal 8 point (Residential data, etc.)Edwards R.E. et al. [41]
Artificial Neural NetworkHeating loadTotal 5 point (Wind speed, etc.)Sholahudin S. et al. [42]
Recurrent Neural NetworksHeating/Cooling loadTotal 7 point (Occupancy, etc.)Sala-Cardoso E. et al. [43]
Random ForestHeating/Cooling loadTotal 6 point (Humidity, etc.)Ahmad M.W. et al. [44]
Publisher’s Note: MDPI stays neutral with regard to jurisdictional claims in published maps and institutional affiliations.

