Article

Factors of Renewable Energy Consumption in the European Countries—The Bayesian Averaging Classical Estimates Approach

1
Department of Economics, Faculty of Economic Sciences and Management, Nicolaus Copernicus University in Torun, Gagarina 13 A, 87-100 Torun, Poland
2
University Centre of Excellence IMSErt-Interacting Minds, Societies, Environments, Nicolaus Copernicus University in Torun, Gagarina 11, 87-100 Torun, Poland
3
Department of Econometrics and Statistics, Faculty of Economic Sciences and Management, Nicolaus Copernicus University in Torun, Gagarina 13 A, 87-100 Torun, Poland
4
Faculty of Finance and Management, WSB University in Torun, Młodzieżowa 31a, 87-100 Torun, Poland
*
Author to whom correspondence should be addressed.
Energies 2021, 14(22), 7526; https://doi.org/10.3390/en14227526
Submission received: 20 September 2021 / Revised: 4 November 2021 / Accepted: 6 November 2021 / Published: 11 November 2021

Abstract

:
The paper aims to identify the most likely factors that determine the demand for energy consumption from renewable sources (renewable energy consumption—REC) in European countries. Although in Europe, a high environmental awareness is omnipresent, countries differ in scope and share of REC due to historical energetic policies and dependencies, investments into renewable and traditional energetic sectors, R&D development, structural changes required by energetic policy change, and many other factors. The study refers to a set of macroeconomic, institutional, and social factors affecting energetic renewable policy and REC in selected European countries in two points of time: i.e., before and after the Paris Agreement. The Bayesian Average Classical Estimates (BACE) is applied to indicate the most likely factors affecting REC in 2015 and 2018. The comparison of the results reveals that the Gross Domestic Product (GDP) level, nuclear and hydro energy consumption were the determinants significant in both analyzed years. Furthermore, it became clear that in 2015, the REC depended strongly on the energy consumption structure, while in 2018, the foreign direct investment and trade openness played their role in increasing renewable energy consumption. The direction of changes is gradual and positive. It complies with the Sustainable Development Goals (SDGs).

1. Introduction

Since the last decade of the 20th century, energy from renewable sources (RE) has received attention across the globe among the different parts of society. The main reason for this popularity is environmental damage, biodiversity change, land loss, global warming, rapid increase in population, higher fuel prices, geopolitical and military conflicts, ultimately affecting all other sectors of the economy. Consumption of energy from renewable sources (renewable energy consumption—REC, hereafter) has climbed by 16.1% in Europe and Euro-Asia, 19.9% in Middle Eastern countries, 26.8% in Africa, 27.7% in North America, 35.1% in Asia-Pacific, and 50.5% in South and Central America in the last two decades. On the other hand, global use of energy from non-renewable sources climbed by only 1.25%. It indicated small rises in regions such as Africa (2.9%) and the Middle East (3.6%), as well as negative growth in the European Union (EU), Europe, and Euro-Asian countries (−1.7%, −0.9%, and −0.6%, respectively) [1].
Identifying the REC determinants and understanding which factors drive new energy sources are critical for policymakers and government authorities. The appropriate selection of determinants for the REC plays a crucial role in mechanizing suitable policies to find an efficient alternative solution to tackle the increasing energy demand. Moreover, it helps to control carbon emissions and further achieve the climate change targets. It also assists them in shifting their energy demand from fossil fuel to renewable energy to achieve Sustainable Development Goals in the long run.
The current study examines economic, social, and institutional determinants of renewable energy consumption in selected European countries. The energy consumption structure according to its sources is included in the analysis. All European countries were taken into account initially, but the data availability limited the selection. Finally, 28 countries were considered, including 25 EU members, Norway, Switzerland, and the United Kingdom. It is worth mentioning that countries in Europe are fairly diversified concerning the exploitation of renewable energy sources. Particularly, Central and Eastern European countries are under-invested in that area. Therefore, the outcomes of this study are crucial in defining and implementing appropriate energy policies to increase the share of renewable energy sources in total energy consumption. As a result, this research can significantly impact policy recommendations and practice in Europe. Finally, this study contributes to the existing empirical literature by identifying the factors driving renewable and non-renewable energy demand in European countries.
The methodology is based on the BACE method. The main advantage of the BACE is to rank the factors according to the probability when the number of potential variables is fairly large. Furthermore, it ensures comparativeness results and suggests the most likely model specifications among a vast range of competing ones [2,3]. The current study is based on an encompassing approach by incorporating the different sets of determinants of REC.
In this research, we concentrated on the newest data, which seems to be the most reliable. This is due to the huge increase in the use of energy from renewable sources in recent years. From the energetic policy perspective, the Paris Agreement prepared in 2015 and signed in 2016 was the milestone to prevent climate change and limit global warming. What is essential is that 194 countries and the EU ratified the document, which means a strong interest of different parties in climate resilience. The goals of the Paris Agreement are strongly related to the low greenhouse gas emissions development, which can be done by changing the structure of energy production and consumption. Consequently, our analysis was prepared in two separate years, i.e., 2015 and 2018, conducted separately for cross-sectional data. The approach considered in the current study is strongly supported by The Intergovernmental Panel on Climate Change (IPCC) report issued on 9 August 2021 (https://www.ipcc.ch/assessment-report/ar6 accessed on 20 September 2021), which confirmed the role of humans in climate change affecting many kinds of weather and climate extremes.
The research questions were whether implementing more restricted policies for environment protection and against climate change could help to increase the impact of renewable energy sources on total energy consumption, which covers electricity, heating/cooling, and transportation. The answer to such a question is provided using descriptive statistical analysis with the coefficient of variation and a more advanced BACE approach.
The novelty of the current research lies in a direct comparison of the renewable energy consumption factors in two years and finding the incentives for the REC in the European countries. Furthermore, a few causal models useful for implementing appropriate energy policy in terms of energy usage patterns are suggested. As a result, this research can significantly impact policy recommendations and practice in the European countries, taking into account their current development and the scale of REC. Finally, this study adds to the existing empirical literature by identifying the factors driving renewable energy demand in Europe. To the best of our knowledge, no empirical research incorporates and investigates a large set of REC determinants using the BACE approach at the regional level.
The rest of the paper is organized as follows. Section 2 reports the relevant literature review. Section 3 provides materials and methods. Section 4 presents the empirical results and checks their robustness. Section 5 provides a discussion of the results, conclusions, and future research plans.

2. Literature Review

In the literature, several studies analyzed the relationship between economic growth and deployment of renewables [4,5,6,7], and there is some agreement on how they interact. It seems evident that the factors such as GDP or GDP per capita reflect the country’s wealth and play a considerable effect in deciding the use of renewables. Moreover, a surplus revenue implies a greater possibility for RE growth or more resources to support it. Increased income allows countries to cover developing RE technologies while also supporting the costs of government policies promoting and regulating RE. Several studies have focused on the determinants of REC in the economic literature [8,9,10].
According to a study [11], RE technologies are relatively expensive and cannot compete with traditional energy technologies without government support. Several studies [12,13,14] emphasized how public policies are one of the primary motivators of RE growth in this context. Subsidies, quota rules, direct investment, research and development (R&D), feed-in tariffs, and green certificates are some of the most frequent public policy initiatives to boost renewables. Ref. [15] investigated the relationship between RE, terrorism, fossil fuels, commerce, and economic growth for France. Their findings suggested that trade openness and REC are linked in both directions (bidirectional causality).
Some authors (e.g., [11,12,16,17]) explicitly consider the effects of political factors on REC. On the other hand, other studies focus exclusively on the factors that influence RE use without separating the impact of various policy instruments [5,18,19,20,21]. Political, socioeconomic, and country-specific issues are all included in the models of these studies [11,16]. Most studies have revealed that real income is one of the key drivers of REC [5,18,21,22]. Furthermore, because high-income countries can readily fund costly RE investments and give incentives due to abundant sources, countries may use more renewables as their GDP rises [11,16,17].
Some studies found that carbon emissions increase REC [5,11,18,19,20,21,22]; others found that carbon emissions negatively impact [11,12,17]. Concerns about the environment, particularly global warming, are highlighted as key factors in reducing fossil fuel consumption and increasing REC [5,11,21,22]. As the main cause of global warming and climate change is the release of large amounts of greenhouse gases into the atmosphere [16], emissions are used in models to account for environmental concerns. Increases in emissions may be associated with increased use of renewables to meet emissions targets set by international agreements [17,19,20]. Other important factors influencing REC include energy prices, which have been found to have statistically significant effects in some studies [5,17,18,20,21,22]. Other energy sources, particularly fossil fuels, might be considered alternatives for renewables. As fossil fuel prices rise, it will increase the consumption of RE [5,16,17,18,20,21,22,23].
Furthermore, because there is a close relationship between energy prices and inflation, and inflation and economic growth, the use of RE can reduce the cost-push inflationary pressures caused by price increases in fossil fuels and the risk of stagflation, according to [20]. Furthermore, other studies [12,17] stressed the importance of policy consistency and clarity for RE investments. The relevance of institutions, such as EU membership, is highlighted by [16]. Common targets and EU energy policy may boost renewable deployment in the case of EU membership.
According to Ref. [11], if a country has serious energy security issues, it may be compelled to rely extensively on fossil fuels, lowering its RE share. Changes in energy consumption, especially electricity consumption, may negatively or positively impact REC [11,12,16]. Previous research has found that trade openness [21], international trade [22], and economic growth [24] have statistically significant and positive effects on REC.
In recent debates around the world, the importance of RE in economic development and its environmental benefits in climate risk management has piqued interest. Increasing RE production and consumption investment could be more cost-effective and practical than using non-renewable energy [25,26]. According to Ref. [27], RE can be a crucial tool in climate change adaptation and mitigation. It is commonly known that CO2 emissions from RE sources are lower than those from traditional energy sources.
In Ref. [5], there was discovered that in the G7 countries, higher real GDP per capita leads to higher REC per capita. While CO2 emissions have a positive effect, increasing oil prices has a smaller but negative impact. In another study, authors discovered a similar beneficial influence of real GDP per capita on REC per capita for 18 emerging economies [24]. Ref. [21] found the same effect of real GDP per capita on REC per capita for a panel of 64 countries. The study also discovered that trade openness influences REC per capita.
From 1995 to 2011, Ref. [28] utilized a panel data model to investigate the determinants of RE investment in the EU-27 in solar and wind scenarios. Their findings imply that a robust regulatory perception negatively impacts solar energy investment, with decreased sunshine hours catalyzing increased investment in wind energy in the EU-27. Between 1990 and 2014, Ref. [29] investigated the impact of macroeconomic and social variables on RE usage in the G7 countries. The study shows that research spending (as a percentage of GDP), the human development index, and energy imports positively impact RE use.
Between 2003 and 2014, Ref. [30] investigated if RE stimulates economic growth in (EU-28) countries. The findings show that RE (biomass, hydropower, geothermal, wind, and solar) contributes favorably to energy growth in EU-28 countries, with biomass having the most significant impact. There is also a unidirectional causal relationship between sustainable energy growth and primary RE output in the medium and long run. It was claimed that a 1% increase in primary RE output results in a 0.05 to 0.06 percent rise in GDP per capita.
The study [31] analyzed the determinants for 53 countries by using the WDI data set from 1990–2017. The study used the variables (e.g., REC (hydroelectricity terawatt-hour) and non-renewable energy consumption (daily consumption of barrels of oil) as dependent variables and human capital (average years of schooling population), and non-renewable energy price (barrel price of oil constant 2016 USD) as independent variables. The selection of this study is consistent with the previous studies (e.g., [32,33,34,35]). The study found a positive and statistically significant relationship between the non-renewable energy price and the two types of energy consumption.
Similarly, Ref. [36] examined variables relating to RE production and the financial sector using panel data for 119 non- Organisation for Economic Co-operation and Development (OECD) countries. The study discovered that the Kyoto Protocol and commercial banking have a positive effect on RE. On the other hand, Ref. [37] examined the RE capacity, global knowledge stock, GDP per capita, electricity consumption growth rate, Kyoto Protocol, and alternative energy source production in 26 OECD countries. The study discovered that while ratification of the Kyoto Protocol and the deployment of nuclear and hydroelectric energy technologies improves RE, energy security, fossil fuel production, future electricity demand, and national RE policies have no effect. In conclusion, the relationship between different variables (e.g., economic growth, carbon emissions, and RE generation) is not consistent across nations or estimating methods, as evidenced by the above review. Table 1 includes a summary of previous studies on determinants of renewable energy consumption.

3. Materials and Methods

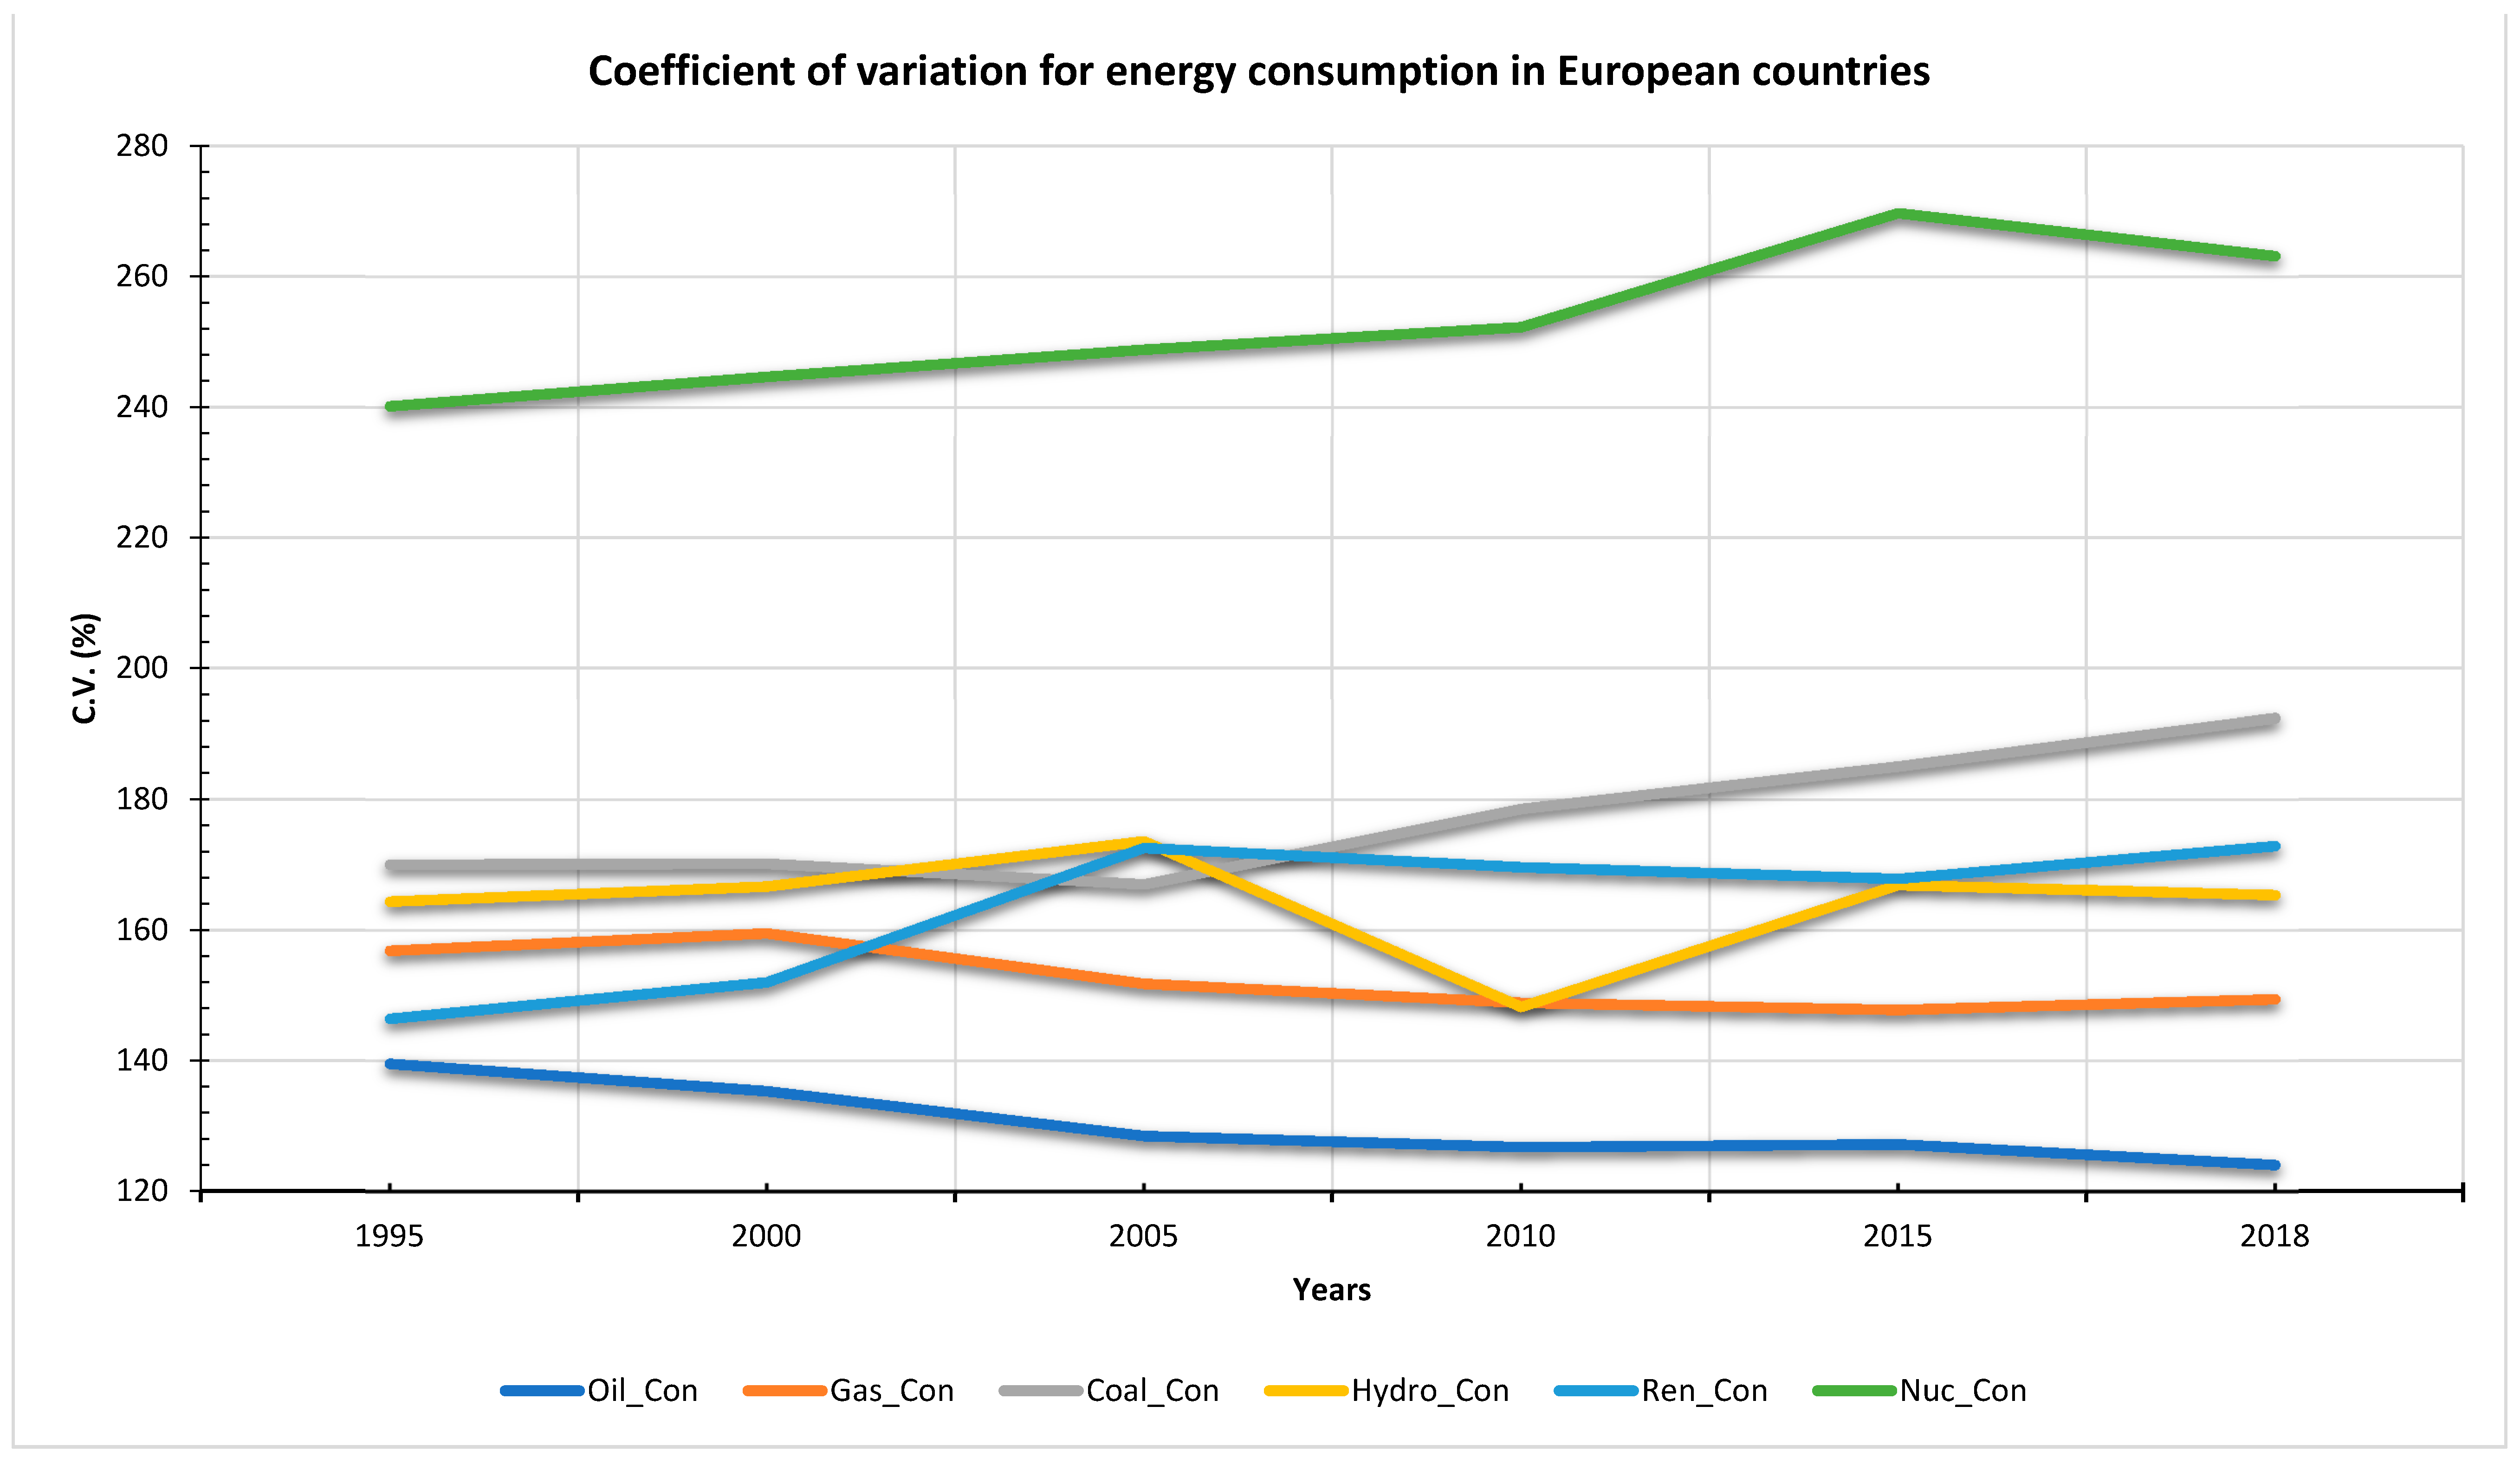
3.1. Data Sources and Descriptive Statistics

The current study uses cross-sectional data on the REC and its determinants in selected European countries in 2015 and 2018. The years 2015 and 2018 were selected for two reasons. Firstly, analysis for the years earlier than 2014 (such as 2007) gave no economically reasonable results. The explanation comes from the fact that in Europe, some countries are very advanced in consuming energy from renewable sources. Still, there exists a number of countries that are rather underdeveloped in that area. A significant group of countries entered the European Union only in 2004 (ten countries), 2007 (Bulgaria and Romania), and 2013 (Croatia). These years can be treated as structural breaks in the countries’ economic and energetic policies, particularly from the post-Soviet Bloc. Furthermore, the financial crisis and post coming recession harmed these countries by limiting investment in the newest energetic technologies. It seems that after the Paris Agreement and stronger policy on CO2 emissions, the state of the art has begun to change. Secondly, the data for 2018 was complete for almost all European countries. Newer data were incomplete, and starting from 2020 may be affected by the COVID-19 pandemic and other structural breaks such as the US presidential election. In this study, we tried to avoid the impact of new structural breaks, which creates new areas of analysis.
The further explanation comes directly from the Eurostat data. It shows that the target for the overall share of energy consumption from renewable sources for the EU in 2020 is 20%. In 2018, this share equaled 18.01%. The overall energy consumption comprises electricity, heating and cooling, and transport. Figure 1 compares the actual shares of overall energy consumption in 2015, 2018, and 2020 target values in EU27 and individual countries. Similar to Iceland and Norway, leading countries exceeded as much as three times the European target value for overall energy consumption from renewable sources. In contrast, Finland, Sweden, and Latvia exceeded twice as much. However, there are substantial differences between 2015 and 2018. In general, the share achieved in 2018 is higher than in 2015. There are also some cases that indicate the opposite direction, although it can result from local policies and investments. The increase in the share of energy consumption from renewable sources can be perceived as gradual, caused by growing awareness of adverse global warming effects, but the determinants that influence that rise change over time and should be identified.
As the situation is dynamically developing, the study answers the question of if there is any difference in the number and strength of factors determining REC in selected European countries in 2015 and 2018.
The study is based on secondary data sources, including World Development Indicators (WDI-2019); Statistical Review of World Energy (BP-2019); International Monetary Fund (IMF); Energy Information Administration (EIA); Worldwide Governance Indicators (WGI); International Renewable Energy Agency (IRENA), and the International Energy Agency (IEA) consisting of annual observations on selected European countries. The list of countries used in the study, due to the data accessibility, is given in Table 2.
Taking into account the literature review, many economic, institutional, and energy variables were specified as potential determinants of REC. They can be divided into the following subgroups, while symbols used in the study are given in parentheses:
(1)
Economic: Gross Domestic Product (GDP), FDI net inflow (FDI_BOP), unemployment (UNEMP), trade openness (TO).
(2)
Disaggregate energy consumption from the following sources: oil (OC), coal (CC), gas (GC), nuclear (NC), and hydro (HC).
(3)
Social: Education index (EI), Life expectancy index (LEI), School enrollment, tertiary (% gross) (SET).
(4)
Institutional: political stability absence and absence of violation (PSA), control of corruption (CCUR), the rule of law (RL).
(5)
Demographic: Surface area (SURF).
(6)
Dummies: Top developed countries’ group of world’s advanced economies and wealthiest liberal democracies, and G7 countries (TDC), and former members of the Eastern Bloc countries (FEBC).
A remarkable disparity between highly developed European and developing economies justifies a dummy variable corresponding to the division in (6). The selection of variables is based on both the environmental economics fundamentals [45] and empirical literature review. The selected variables, GDP, oil price, and oil consumption, were used by [22]; Foreign direct investment, net inflows (% of GDP) by [34]; Rule of law, Control of corruption, Political stability and Absence of violence/terrorism by [46]; Education index by [47]. The description of all variables and their units is given in Table A1 in Appendix A.
Table A2 presents descriptive statistics for the population of selected European countries in the years 1995, 2000, 2005, 2010, 2015, and 2018. It confirms the general change in the structure of the energy consumption from different sources. On average, the consumption of oil, gas, nuclear, and, particularly coal, in Europe decreases gradually while hydro and renewable energy use increases substantially. The most substantial reduction is observed in coal energy consumption, which amounts to almost 39% between 1995 and 2018. On the other hand, the increase in renewable energy consumption was over 2200% from the average 0.2409 in 1995 to 5.7405 in 2018. Values of standard deviation (SD) show that dispersion is quite huge, and coefficients of variation exceed 100 percent. In Figure A1, the coefficients of variation for energy consumption from different sources are shown. They inform about the general tendency towards convergence among the countries in energy consumption [48]. The convergence is observed for oil and gas energy consumption. The remaining energy sources reveal rather a divergence, which confirms huge variability among the countries. The empirical distributions are positively skewed and leptokurtic.

3.2. Methodology

One potential problem in the linear model selection procedure is finding a significant set of explanatory variables among all potential determinants. The problem is not trivial if we imagine that, for the sake of this analysis, we have 18 potential variables with 262,144 linear combinations; some of them are equally likely with similar explanatory power. To overcome this problem, we decided to use BACE—Bayesian Averaging of Classical Estimates introduced in [2], which is essential for the credibility and conclusiveness of presented results. Briefly speaking, BACE parameter estimates are obtained by applying Ordinary Least Squares (OLS) and then averaged across all possible combinations of models, given their explanatory power. Therefore, we do not only make inferences on the “best” single model, but we take into account the uncertainty of all models. Consequently, we can easily identify significant determinants of a dependent variable based on a whole model space without specific knowledge [3]. The latest review of model averaging techniques and their implementation is presented in [49].
The construction of the BACE model methodology is explained by Equations (1)–(6). Let us consider the following linear regression model for a cross-sectional dataset:
M j : y = α ι N + X j β j + ϵ , j = 1 , , 2 K          
where K denotes the total number of potential explanatory variables, 2 k is a total number of possible linear combinations, ı N is a ( N × 1 ) vector of ones, y is a vector of observations (in our case, renewable consumption index), X j is ( N × k j ) matrix containing the set of regressors included in the model M j , k j is number of regressors included in the model M j , β j is ( k j × 1 ) vector of unknown parameters, and ϵ is ( N × 1 ) vector of errors, normally distributed, ϵ N ( 0 N , σ 2 I N ) . Notation N ( μ , Σ ) denotes a normal distribution with location μ and covariance Σ .
Based on Ref. [2], we can use OLS estimates to calculate the approximation of the posterior probability of every model M j S using the following formula:
Pr ( M j   |   y ) Pr ( M j ) N k j 2 S S E j N 2 Σ i = 1 2 K Pr ( M i ) N k i 2 S S E i N 2
where S S S j and S S S j are the OLS sum of squared errors, k j and k i s are the number of regression parameters β j and β i , P r ( M j ) , and P r ( M i ) are prior probabilities of models M j and M i .
In our case, we use the popular binomial model prior [50]:
Pr ( M j ) = θ k i ( 1 θ ) K k i , θ [ 0 , 1 ]  
We know that we only need to specify a prior expected model size E ( Ξ ) = K θ to set the prior probability for all competitive models from binomial distribution properties. For example, if θ = 0.5 , then the prior expected model size equals the average number of potential regressors, and all models have an equal prior probability.
In the BACE approach, we can also obtain the averages of parameter estimates β based on the whole model space [2,51]:
E ( β   |   y ) i = 1 2 K Pr ( M i   |   y ) β ^ i
Var ( β   |   y ) i = 1 2 K Pr ( M i   |   y ) Var ( β i ) + i = 1 2 K Pr ( M i | y ) ( β ^ i E ( β | y ) ) 2
where β ^ i and V a r ( β i ) are the OLS estimates of β i from model M i .
Another useful and popular characteristic in model averaging is so-called posterior inclusion probability (PIP), which is defined as the posterior probability that the independent variable x i   is relevant in explaining the dependent variable [38,52]. In our case, the PIP is calculated as the sum of the posterior model probabilities for all of the models that include a specific variable:
Pr ( β i 0   |   y ) = i = 1 2 K Pr ( M r   |   β i 0 , y )
Thus, PIP can be understood as the importance of each variable for explaining the dependent variable.

4. Results

4.1. Empirical Results

The study takes into account a group of independent variables that represent potential factors responsible for renewable energy consumption (REC) in 28 European economies. The variables and their symbols are presented in Section 3.1 and Table A1. Referring to the environmental policy adopted in Europe after the Paris Agreement in 2015, we considered two points of time:
(a)
the year 2015, just before the Paris Agreement ratification;
(b)
the year 2018, after the Paris Agreement ratification.
It should be mentioned that the EU and all its members individually ratified the Paris Agreement in 2016.
The research question was whether implementing a more restricted policy for environment protection and against climate change could cause a substantial change in the determinants of REC in European countries.
In order to identify determinants of REC, we used the BACE selection procedure, which enables searching all possible combinations of potential variables and selecting the most probable candidates. The BACE also enables calculations of the averages of the coefficient means and standard deviations of parameters, and the explanatory power of competitive models. We used the BACE 1.1 package (the BACE 1.1 package is available at http://ricardo.ecn.wfu.edu/gretl/cgi-bin/gretldata.cgi?opt=SHOW_FUNCS (accessed on 1 August 2021) and was developed by [53]), which is available in the gretl program as open-source software. Gretl is free program and it may be redistributed and/or modified under the terms of the GNU General Public License (GPL) as published by the Free Software Foundation, originally developed in North Carolina, USA and and Ancona, Italy.
The whole model space in the regression model (excluding intercept) was equal to 2 18 = 262 , 144 . The total number of Monte Carlo iterations was 1,000,000 (including 10% burn-in draws). The correlation coefficient between the analytical and numerical probabilities of the top models was above 0.99, which means that convergence of simulation was confirmed. Model prior was set to uniform, which means that all possible specifications were equally likely.
The posterior results are given in Table 3. It shows posterior inclusion probabilities, the average value of the coefficient (parameter estimate overall considered models), and the corresponding average standard error. The posterior inclusion probability (PIP) equalled at least 0.7, and shows a high probability of being included in the model. Although there is no formal requirement for high posterior probability, it is reasonable to assume that it is at least higher than 0.5 and treats the results higher than 0.7 as reliable.
The results in Table 3 exhibited a substantial difference between factors of REC in European countries in 2015 and 2018. The results for 2015 indicated nuclear and hydro energy consumption, oil and gas energy consumption, and the value of GDP. The signs of parameters for NC, HC, and GS were negative, which means that there was a competition between specified energy sources in Europe depending on hitherto resources, infrastructure, and long-term contracts. The GDP denotes the country’s economic position and readiness for renewable infrastructure investments. The average coefficient of 0.0099 shows that increasing GDP by USD 1000 will increase renewable energy consumption by 11.9 Mtoe, keeping all other factors unchanged.
The results for the year 2018 revealed that the following factors are the most likely: nuclear and hydro energy consumption, GDP, FDI net inflow, and trade openness. What is more interesting is that the signs of the mean parameters are in line with the knowledge and intuition. GDP and FDI_BOP have positive parameter estimate signs, while nuclear and hydro energy consumption have negative signs. Additionally, the parameter estimate for the GDP is higher than in 2015 and is supported by the positive value of FDI_BOP. The trade openness has a negative parameter estimate. Such variables focus on the economic and energy factors that mostly influence renewable energy consumption in European countries. The GDP and FDI support investments in the renewable energy sector; thus, their positive impact aligns with economic logic.
On the other hand, nuclear and hydro energy consumption compete with the renewable energy sector (https://energypost.eu/renewable-energy-versus-nuclear-dispelling-myths/ (accessed on 24 July 2021)). However, the recent findings support renewable energy as much faster in building the infrastructure as compared with the nuclear one (2019 World Nuclear Industry Status Report, available at https://www.worldnuclearreport.org/-World-Nuclear-Industry-Status-Report-2019-.html (accessed on 24 July 2021)). The trade openness, measured as the sum of a country’s exports and imports as a share of that country’s GDP (in %), shows a negative sign, which is in line with the findings presented in the literature [31,54].
Three important issues need to be clarified. Firstly, European countries gradually introduced renewable energy sources, and after ratifying the Paris Agreement, they were ready to fight against climate change. Secondly, countries in Europe are diversified concerning the infrastructure in the energy sector. Thirdly, the European countries are quite homogenous as concerning social and institutional environments; therefore, the variables included in social and institutional groups did not impact renewable energy consumption.
Table A3 and Table A4 include the top three models according to their posterior probabilities for 2015 and 2018, respectively. The total probability of the presented models is 0.0270 (2015) and 0.0258 (2018), so it is easy to see that the best models have a very low posterior probability. This means that there is no one dominant specification, and inferences based on only one model can be very misleading because each of them has very low explanatory power. The top three models consist of 7–12 variables, and some of them are significant in a single regression. Still, due to the small explanatory power of the model, they have low PIP values and thus do not significantly impact the dependent variable. This means our results justify the necessity of using the model averaging (BACE) approach instead of a single model selection procedure. There is one more important remark on the example models. In 2015, the division into top developed countries and the former Eastern Bloc was significant across all models, while in 2018, the dummies are less likely or insignificant.

4.2. Robustness Check

In order to confirm the empirical findings for variable and model selection obtained by BACE, we performed robustness analysis using different prior model assumptions. We applied the idea proposed in [55] and set different variants of the prior average model size to check the sensitivity of variable selection results. In Section 4.1, the prior average model size is set to E(Ξ) = K/2 (where K represents the number of all available independent variables considered in the model). It means that the prior model distribution is uniform, i.e., each model has an equal prior probability, and we do not prefer any specification. To explore the robustness in more detail, we use two additional prior model sizes, namely: E(Ξ) = K/3 and E(Ξ = K/4 (the most restrictive case). Table 4 presents the BACE estimates for renewable consumption determinants in 2015 with different average prior model sizes, while Table 5 shows the results for the 2018 year. The results contain values of PIP, average coefficients, and average standard errors.
The comparison of the results revealed that there are no substantial differences in the output between E(Ξ) = K/2, E(Ξ) = K/3, and E(Ξ) = K/4. Any observed differences are negligible; therefore, the empirical results are robust.
The results for posterior estimates of the top 3 models for renewable consumption determinants in 2015 and 2018 are presented in Table A3 and Table A4, respectively.

5. Discussion and Conclusions

Application of the BACE procedure provides a reliable result since it allows to search the entire model space to find the most likely determinants of renewable energy consumption. Furthermore, it gives robust results against more restrictive models. The most important advantages of the model averaging were indicated in [2,56]. The first one is including the model uncertainty into the model selection procedure, which reduces overconfidence in a single model. Furthermore, it avoids the all-or-nothing mentality that is associated with classical hypothesis testing, where a model is either accepted or rejected wholesale. BACE gracefully updates its estimates as the data accumulate and the resulting model weights are continually adjusted. Finally, BACE is relatively robust to model misspecification. The successful application of BACE is possible for different databases as cross-sectional data, time-series data, and panel data [57,58,59].
The study focuses on European countries because Europe, although quite keen on promoting renewable energy sources, is still diversified in using energy from different sources. Mainly, Central and Eastern European countries are mostly underdeveloped in investments in the renewable energy sector. European countries tend to realize sustainable energy plans. Although, between 2015 and 2018, the total primary energy consumption in Europe has increased by 2.7% from 1996.8 to 2050.7 (Mtoe) but the production of fossil fuels was reduced. The total oil production was reduced by 2.16%, and gas production decreased by 4.22% from 2015 to 2018. The most significant reduction was observed in coal production (reduction by 9.19%) and consumption (reduced by 9.46%). Europe is in one of the top positions in renewable energy consumption, fluctuating from 141.5 to 172.2 Mtoe from 2015 to 2018, which indicates a 21.70% change [60].
In the current study, we put the research question on determinants of renewable energy consumption in European countries. Using the BACE approach, substantial differences between factors observed in 2015 and 2018 were found. In 2015, GDP was the only economic variable that supported energy consumption from renewable sources. The other factors comprised the alternative energy sources competing with REC. In 2018, GDP supported by the FDI and Trade Openness are responsible for the country’s investments in the renewable energy sector. The alternative energy sources such as nuclear energy and hydro energy remained reasonably likely. Considering the technological and environmental viewpoints, it is clear that nuclear energy, due to its enormous efficiency, must support “purely” renewable energy sources. There is a discussion of whether nuclear energy can be thought of as a renewable one (https://world-nuclear.org/information-library/energy-and-the-environment/renewable-energy-and-electricity.aspx, accessed 25 October 2021).
When comparing the results with the findings presented in the literature, Ref. [61] indicated that income is significant as a factor of renewable energy consumption. She focused on financial variables that can be omitted in developed economies but cannot be excluded in developing ones because RE technologies require a high upfront investment.
The question arises whether a qualitative change resulting from the study comes directly from the Paris Agreement ratified in 2016. On one side, the strong warnings on the effects of climate change resulted in the energy policy change in European countries, particularly, the energy based on fossil fuels was remarkably reduced. The difference can be visible in both household and industry sectors. On the other side, there is no evidence in the literature that over five years after the Paris Agreement, a rapid limitation in gas emissions could be observed. Ref. [62] indicated signs of progress, such as several nations that strengthen their initial pledges by promising to cut their net climate emissions to zero by 2050. These are the European Union, Canada, South Korea, Japan, South Africa, the United Kingdom, and recently, the USA. Furthermore, China declared cutting climate pollution faster than initially promised, aiming for carbon neutrality by 2060. There are also signs that the temperature spikes predicted for later this century are easing slightly. The changes are relatively slow, and the COVID-19 pandemic changes its direction. There are some adverse examples such as USA climate policy under the Trump presidency and deforestation in the Amazon (Brazil), which enabled global emissions of warming gases to continue climbing to a record high in 2019. The pandemic year 2020 has stopped the emissions in the short run.
What is worth noting, is that the Paris Agreement increased global awareness of climate change and its consequences. It is in line with the results obtained by [11]. They suggested that environmental concern is an essential factor in explaining participation of renewables in different countries.
As comes from the results of this study, there is a divergence concerning REC in Europe. Although renewable energy requires both new investments in infrastructure and social acceptance, the increase of the REC in Europe is visible. As it was mentioned, the renewable energy plans require new investment as well as changing the structure of the energy sector by replacing old energy infrastructure with a new one. It is related to closing traditional industries, local environment changes, and construction of new energetic complexes. Increasing GDP and FDI inflow can help activate the changes, particularly in less advanced countries such as Croatia, Cyprus, Latvia, Lithuania, Poland, Romania, Slovakia, and Slovenia. The presence of trade openness in 2018 as the factor influencing renewable energy consumption aligns with the results presented in [15].
However, there remains a social context of the aforementioned changes. Ref. [63] prepared a literature review on the social acceptance of renewable energy projects (REP) in European countries. They found that social acceptance is a significant barrier in the implementation of REP. They argued that governments must consider the general trends in local acceptance and create a framework that will increase the probability of local acceptance, and reduce the chances of an opposition network that will hinder the development of an REP Trust in principal actors which remains a significant driver in local acceptance. It has been demonstrated that to foster acceptance of renewable energy projects, the public must gain trust in local authorities and developers. To achieve the goal, full transparency of the project is recommended.
The study confirmed that the global awareness of climate change increased after the Paris Agreement creating room for changing the energy policy in both developed and developing countries in Europe. Although the change is gradual and divergence tendencies are quite strong, the investments in the RE sector and GDP redistribution allow achieving climate neutrality goals.
The limitation of the study is that it covers cross-sectional data from two years: 2015 and 2018. It seems too short of catching the changes that resulted from the Paris Agreement, with soundness being fairly high. Based on the experience of the current study, further research plans are fostered. The next attempt is to consider determinants of the REC from a worldwide perspective. Both developed and developing countries should be taken into account. The panel data approach is also planned. The final step of the research is to combine renewable energy consumption and production with the green economic growth indicator. It will also be interesting to measure the impact of the COVID-19 pandemic on the REC in different countries.

Author Contributions

Conceptualization, A.M.K., J.K. and M.O.; methodology, J.K. and M.O.; software, J.K. and M.B.; validation, J.K. and M.B.; formal analysis, A.M.K., J.K. and M.O.; investigation, A.M.K. and J.K.; resources, A.M.K.; data curation, A.M.K.; writing—original draft preparation, A.M.K., J.K. and M.O.; writing—review and editing, A.M.K., J.K. and M.O.; visualization, A.M.K., J.K. and M.O. All authors have read and agreed to the published version of the manuscript.

Funding

This research received no external funding.

Institutional Review Board Statement

Not applicable.

Informed Consent Statement

Not applicable.

Data Availability Statement

Not applicable.

Conflicts of Interest

The authors declare no conflict of interest.

Appendix A

Table A1. Descriptions of variables.
No.Abbreviation of VariableVariable NameProxy/Scale of MeasurementData Source
Energy-based Variables
1RECRenewable consumptionmillion tons of oil equivalent to exajoules (Mtoe)BP-2019
2OCOil consumptionmillion tons of oil equivalent to exajoules (Mtoe)BP-2019
3GCGas consumptionmillion tons of oil equivalent to exajoules (Mtoe)BP-2019
4CCCoal consumptionmillion tons of oil equivalent to exajoules (Mtoe)BP-2019
5HCHydro consumptionmillion tons of oil equivalent to exajoules (Mtoe)BP-2019
6NCNuclear consumptionmillion tons of oil equivalent to exajoules (Mtoe)BP-2019
Economic Variables
7GDPGross Domestic ProductData are in constant 2010 US dollars.WDI-2019
8TOTrade opennessTrade openness = Exports of goods and services (% of GDP) + Imports of goods and services (% of GDP).WDI-2019
9FDI_BOPForeign direct investment, net inflows (BOP)Foreign direct investment refers to direct investment equity flows in the reporting economy. It is the sum of equity capital, reinvestment of earnings, and other capital. Data are in current US dollars.WDI-2019
10UNEMPUnemployment, totalUnemployment refers to the share of the labor force that is without work but available for and seeking employment. Measured in % of the total labor force.WDI-2019
Social Variables
11PSA.Political stability and absence of violencePolitical stability and Absence of violence/terrorism measures perceptions of the likelihood of political instability and/or politically-motivated violence, including terrorism.WGI-2020
12RLRule of lawReflects perceptions of the extent to which agents have confidence in and abide by the rules of society, and, in particular, the quality of contract enforcement, property rights, the police, and the courts, as well as the likelihood of crime and violence.WGI-2020
13CCURControl of corruptionReflects perceptions of the extent to which public power is exercised for private gain, including both petty and grand forms of corruption, as well as “capture” of the state by elites and private interests.WGI-2020
14EIEducation indexEducation index is an average of mean years of schooling (of adults) and expected years of schooling (of children), both expressed as an index obtained by scaling with the corresponding maxima.http://hdr.undp.org/en/indicators/103706 (accessed on 25 June 2021)
15LEILife expectancy indexLife expectancy at birth expressed as an index using a minimum value of 20 years and a maximum value of 85 years.http://hdr.undp.org/en/indicators/103206103706 (accessed on 25 June 2021)
16SETSchool enrollment, tertiaryThe gross enrollment ratio is the ratio of total enrollment, regardless of age, to the population of the age group that officially corresponds to the level of education shown. measured in (% gross).WDI-2019
Other Variables
17SURFSurface areaSurface area is a country’s total area, including areas under inland bodies of water and some coastal waterways. measured in (sq. km).WDI-2019
Dummy Variables
18TDCTop developed countriesDummy variable if a country is a member of the G-7, group of world’s advanced economies and wealthiest liberal democracies.Authors elaboration
19FEBCFormer Eastern BlocDummy variable if a country was a member of the Eastern Bloc.Authors elaboration
Table A2. Descriptive statistics for energy consumption according to different sources in European countries.
SourceOil ConsumptionGas ConsumptionCoal Consumption
Years199520002005201020152018199520002005201020152018199520002005201020152018
Mean25.586826.424627.225425.122122.858523.567111.939114.239616.035916.148612.995714.203312.734311.238411.08279.79959.13207.7798
S.E.6.74716.75886.61166.01955.49555.52433.53954.29284.60064.54353.62954.01084.09223.61483.49813.30703.19432.8294
Med11.219410.889711.013210.722010.099910.57583.00194.01494.11464.58133.87854.27574.89503.91993.85063.79083.25143.0665
S.D.35.702535.764434.985231.852029.079429.231718.729422.715524.343924.042119.205321.223221.653919.127518.510317.499016.902814.9718
Kurt3.36062.50401.67581.88922.68492.29793.35394.18082.96182.64422.59192.95657.05338.65807.94188.948211.342110.6100
Skew2.00381.83801.66561.67371.81071.72902.04332.20531.98771.91351.90061.96482.69522.85832.75122.96043.24933.2712
Range138.9582134.1266126.1889118.0561112.6862111.691666.842187.138285.457184.688666.168275.917690.515585.268981.244777.042378.677366.3859
Min1.32991.16551.43941.43361.48481.50260000000.10700.03600.04400.01470.00330.0133
Max140.2881135.2921127.6283119.4897114.1710113.194166.842187.138285.457184.688666.168275.917690.622585.304981.288777.056978.680666.3992
Obs282828282828282828282828282828282828
SourceHydro ConsumptionRenewable ConsumptionNuclear Consumption
Years199520002005201020152018199520002005201020152018199520002005201020152018
Mean3.92754.34183.83804.23644.11944.14560.24090.51161.20682.45824.83555.74057.18577.70398.10387.49656.99246.7636
S.E.1.22031.36791.25931.18681.29951.29580.06670.14700.39360.78821.53401.87563.26123.56243.81113.57403.56443.3637
Med0.92560.95591.04661.08801.15001.15140.07000.10950.34330.70462.07282.26790.45460.98211.08070.44910.46140.3953
S.D.6.45727.23846.66366.28026.87636.85670.35280.77782.08294.17078.11709.924817.256718.850220.166618.911718.861117.7989
Kurt6.09427.50199.61984.76638.33248.64334.92834.546610.27839.795110.753011.562416.464917.253718.752319.955622.841622.7416
Skew2.38382.55962.87972.08012.67032.68692.04452.03162.97722.98853.04973.18393.84873.95924.13214.27274.61724.5977
Range27.499232.089930.702826.417631.068031.33821.49793.23669.699119.042138.348547.229885.358093.9408102.169896.963698.979093.4905
Min000000000.00020.01650.07500.1049000000
Max27.499232.089930.702826.417631.068031.33821.49793.23669.699319.058638.423547.334785.358093.9408102.169896.963698.979093.4905
Obs282828282828282828282828282828282828
Note: Med: Median; S.E. = Standard error; S.D. = Standard deviation; Kurt = Kurtosis; Skew = Skewness; Min = Minimum; Max = Maximum; Obs = Observations.
Table A3. Posterior estimates of top 3 models for renewable consumption determinants in 2015.
VariablesCoefficientStd. Errort-Statp-Value
Model 1. Posterior probability: 0.010350
Const9.24293.53992.61100.0090
NC−0.37980.0381−9.9660<0.0001
TO−0.02050.0077−2.64900.0081
HC−0.35400.0979−3.61700.0003
GC−0.66120.1026−6.4430<0.0001
OC0.35740.10193.50900.0005
TDC14.53255.06252.87100.0041
SURF0.000010.0000043.11900.0018
FEBC−2.36011.6237−1.45400.1461
UNEMP−0.35200.1299−2.70900.0067
CCUR−2.68471.0634−2.52500.0116
GDP0.00830.00342.46300.0138
Model 2. Posterior probability: 0.009376
Const4.54621.49223.04700.0023
NC−0.36430.0378−9.6470<0.0001
TO−0.01470.0069−2.14800.0317
HC−0.28070.0866−3.24200.0012
GC−0.63160.1038−6.08300.0000
OC0.36250.10513.45000.0006
TDC13.27975.14922.57900.0099
SURF0.000010.0000042.67400.0075
UNEMP−0.20830.0870−2.39400.0167
CCUR−1.33700.5374−2.48800.0129
GDP0.00820.00352.37400.0176
Model 3. Posterior probability: 0.007232
Const8.25073.57682.30700.0211
NC−0.39500.0395−10.0000<0.0001
TO−0.02380.0081−2.94600.0032
HC−0.34670.0965−3.59200.0003
GC−0.67470.1016−6.6390<0.0001
OC0.38620.10303.75100.0002
TDC17.34835.48433.16300.0016
SURF0.000010.0000043.27100.0011
FEBC−2.25881.6005−1.41100.1581
UNEMP−0.32350.1300−2.48900.0128
CCUR−4.58521.8667−2.45600.0140
RL2.65482.15891.23000.2188
GDP0.00690.00351.97100.0487
Table A4. Posterior estimates of top 3 models for renewable consumption determinants in 2018.
VariablesCoefficientStd. Errort-Statp-Value
Model 1. Posterior probability: 0.011631
Const2.19361.03442.12100.0340
GC−0.22020.0944−2.33200.0197
NC−0.28640.0370−7.7330<0.0001
HC−0.16980.0637−2.66700.0077
TO−0.02070.0072−2.86400.0042
OC0.12260.05722.14400.0320
GDP0.01260.00255.0630<0.0001
FDI_BOP0.01880.00503.72800.0002
Model 2. Posterior probability: 0.009196
Const1.78751.23681.44500.1484
NC−0.20870.0323−6.4680<0.0001
HC−0.14990.0603−2.48500.0130
TO−0.01840.0080−2.30600.0211
TDC−7.75593.4780−2.23000.0257
GDP0.01310.001012.5300<0.0001
FDI_BOP0.02390.00504.8050<0.0001
Model 3. Posterior probability: 0.004942
Const1.85341.15681.60200.1091
GC−0.21450.0977−2.19600.0281
NC−0.29600.0392−7.5540<0.0001
HC−0.33340.1055−3.15900.0016
TO−0.01870.0077−2.43600.0148
SURF0.000010.0000041.74600.0809
GDP0.01560.00236.9230<0.0001
FDI_BOP0.01370.00562.43800.0148
Figure A1. Energy consumption coefficient of variation 1995–2018.
Energies 14 07526 g0a1

References

  1. Statistics Review World Energy. 2018. Available online: https://www.bp.com/content/dam/bp/business-sites/en/global/corporate/pdfs/energy-economics/statistical-review/bp-stats-review-2018-full-report.pdf (accessed on 10 August 2021).
  2. Sala-i-Martin, X.; Doppelhofer, G.; Miller, R.I. Determinants of long-term growth: A Bayesian averaging of classical estimates (BACE) approach. Am. Econ. Rev. 2004, 94, 813–835. [Google Scholar] [CrossRef] [Green Version]
  3. Błażejowski, M.; Kufel, P.; Kwiatkowski, J. Model simplification and variable selection: A Replication of the UK inflation model by Hendry (2001). J. Appl. Econom. 2020, 35, 645–652. [Google Scholar] [CrossRef] [Green Version]
  4. Apergis, N.; Payne, J.E. Renewable energy consumption and economic growth: Evidence from a panel of OECD countries. Energy Policy 2010, 38, 656–660. [Google Scholar] [CrossRef]
  5. Sadorsky, P. Renewable energy consumption, CO2 emissions and oil prices in the G7 countries. Energy Econ. 2009, 31, 456–462. [Google Scholar] [CrossRef]
  6. Menegaki, A.N. Growth and renewable energy in Europe: A random effect model with evidence for neutrality hypothesis. Energy Econ. 2011, 33, 257–263. [Google Scholar] [CrossRef]
  7. Ohler, A.; Fetters, I. The causal relationship between renewable electricity generation and GDP growth: A study of energy sources. Energy Econ. 2014, 43, 125–139. [Google Scholar] [CrossRef]
  8. Borozan, D.; Borozan, L. Examining the industrial energy consumption determinants: A panel bayesian model averaging approach. Energies 2020, 13, 70. [Google Scholar] [CrossRef] [Green Version]
  9. Nguyen, K.H.; Kakinaka, M. Renewable energy consumption, carbon emissions, and development stages: Some evidence from panel cointegration analysis. Renew. Energy 2019, 132, 1049–1057. [Google Scholar] [CrossRef]
  10. Wang, Q.; Wang, L. Renewable energy consumption and economic growth in OECD countries: A nonlinear panel data analysis. Energy 2020, 207, 118200. [Google Scholar] [CrossRef]
  11. Aguirre, M.; Ibikunle, G. Determinants of renewable energy growth: A global sample analysis. Energy Policy 2014, 69, 374–384. [Google Scholar] [CrossRef] [Green Version]
  12. Marques, A.C.; Fuinhas, J.A. Are public policies towards renewables successful? Evidence from European countries. Renew. Energy 2012, 44, 109–118. [Google Scholar] [CrossRef]
  13. Schaffer, L.M.; Bernauer, T. Explaining government choices for promoting renewable energy. Energy Policy 2014, 68, 15–27. [Google Scholar] [CrossRef]
  14. Kilinc-Ata, N. The evaluation of renewable energy policies across EU countries and US states: An econometric approach. Energy Sustain. Dev. 2016, 31, 83–90. [Google Scholar] [CrossRef]
  15. Mohamed, H.; Jebli, M.B.; Youssef, S.B. Renewable and fossil energy, terrorism, economic growth, and trade: Evidence from France. Renew. Energy 2019, 139, 459–467. [Google Scholar] [CrossRef]
  16. Marques, A.C.; Fuinhas, J.A.; Manso, J.P. Motivations driving renewable energy in European countries: A panel data approach. Energy Policy 2010, 38, 6877–6885. [Google Scholar] [CrossRef]
  17. Marques, A.C.; Fuinhas, J.A. Drivers promoting renewable energy: A dynamic panel approach. Renew. Sust. Energ. Rev 2011, 15, 1601–1608. [Google Scholar] [CrossRef]
  18. Apergis, N.; Payne, J.E. The causal dynamics between renewable energy, real GDP, emissions and oil prices: Evidence from OECD countries. Appl. Econ. 2014, 46, 4519–4525. [Google Scholar] [CrossRef]
  19. Bengochea, A.; Faet, O. Renewable energies and CO2 emissions in the European Union. Energy Sources Part B Econ. Plan. Policy 2012, 7, 121–130. [Google Scholar] [CrossRef]
  20. Chang, T.H.; Huang, C.M.; Lee, M.C. Threshold effect of the economic growth rate on the renewable energy development from a change in energy price: Evidence from OECD countries. Energy Policy 2009, 37, 5796–5802. [Google Scholar] [CrossRef]
  21. Omri, A.; Daly, S.; Nguyen, D.K. A robust analysis of the relationship between renewable energy consumption and its main drivers. Appl. Econ. 2015, 47, 2913–2923. [Google Scholar] [CrossRef]
  22. Omri, A.; Nguyen, D.K. On the determinants of renewable energy consumption: International evidence. Energy 2014, 72, 554–560. [Google Scholar] [CrossRef]
  23. Gan, J.B.; Smith, C.T. Drivers for renewable energy: A comparison among OECD countries. Biomass Bioenergy 2011, 35, 4497–4503. [Google Scholar] [CrossRef]
  24. Sadorsky, P. Renewable energy consumption and income in emerging economies. Energy Policy 2009, 37, 4021–4028. [Google Scholar] [CrossRef]
  25. Frangou, M.; Aryblia, M.; Tournaki, S.; Tsoutsos, T. Renewable energy performance contracting in the tertiary sector standardization to overcome barriers in Greece. Renew. Energy 2018, 125, 829–839. [Google Scholar] [CrossRef]
  26. Rafindadi, A.A.; Ozturk, I. Impacts of renewable energy consumption on German economic growth: Evidence from combined cointegration test. Renew. Sustain. Energy Rev. 2017, 75, 1130–1141. [Google Scholar] [CrossRef]
  27. Heidari, N.; Pearce, J.M. A review of greenhouse gas emissions liabilities as the value of renewable energy for mitigating lawsuits for climate change related damages. Renew. Sustain. Energy Rev. 2016, 55, 899–908. [Google Scholar] [CrossRef] [Green Version]
  28. Sisodia, G.S.; Soares, I. Panel data analysis for renewable energy investment determinants in Europe. Appl. Econ. Lett. 2015, 22, 397–401. [Google Scholar] [CrossRef]
  29. Sonmez, F.; Manso, J.R. Impact of Macroeconomic and Social Variables on Renewable Energy Consumption for the G7 Countries: A Panel Data Approach. EconWorld2018@Lisbon. Available online: http://lisbon2018.econworld.org/papers/Sonmez_Manso_Impact.pdf (accessed on 11 September 2021).
  30. Armeanu, D.Ş.; Vintilă, G.; Gherghina, Ş.C. Empirical study towards the drivers of sustainable economic growth in EU-28 countries. Sustainability 2017, 10, 4. [Google Scholar] [CrossRef] [Green Version]
  31. Ponce, P.; López-Sánchez, M.; Guerrero-Riofrío, P.; Flores-Chamba, J. Determinants of renewable and non-renewable energy consumption in hydroelectric countries. Environ. Sci. Pollut. Res. 2020, 27, 29554–29566. [Google Scholar] [CrossRef]
  32. Dutta, A. Oil price uncertainty and clean energy stock returns: New evidence from crude oil volatility index. J. Clean. Prod. 2017, 164, 1157–1166. [Google Scholar] [CrossRef]
  33. Guillouzouic-Le Corff, A. Did oil prices trigger an innovation burst in biofuels? Energy Econ. 2018, 75, 547–559. [Google Scholar] [CrossRef]
  34. Eder, L.V.; Provornaya, I.V.; Filimonova, I.V.; Kozhevin, V.D.; Komarova, A. World energy market in the conditions of low oil prices, the role of renewable energy sources. Energy Procedia 2018, 153, 112–117. [Google Scholar] [CrossRef]
  35. Shah, I.H.; Hiles, C.; Morley, B. How do oil prices, macroeconomic factors and policies affect the market for renewable energy? Appl. Energy 2018, 215, 87–97. [Google Scholar] [CrossRef] [Green Version]
  36. Brunnschweiler, C.N. Finance for renewable energy: An empirical analysis of developing and transition economies. Environ. Dev. Econ. 2010, 15, 241–274. [Google Scholar] [CrossRef] [Green Version]
  37. Popp, D.; Hascic, I.; Medhi, N. Technology and the diffusion of renewable energy. Energy Econ. 2011, 33, 648–662. [Google Scholar] [CrossRef]
  38. Akarsu, G.; Gümüşoğlu, N.K. What are the Main Determinants of Renewable Energy Consumption? A Panel Threshold Regression Approach. Anadolu Üniversitesi Sos. Bilimler Derg. 2019, 19, 1–22. [Google Scholar] [CrossRef]
  39. Dogan, E.; Inglesi-Lotz, R.; Altinoz, B. Examining the determinants of renewable energy deployment: Does the choice of indicator matter? Int. J. Energy Res. 2021, 45, 8780–8793. [Google Scholar] [CrossRef]
  40. Bersalli, G.; Menanteau, P.; El-Methni, J. Renewable energy policy effectiveness: A panel data analysis across Europe and Latin America. Renew. Sustain. Energy Rev. 2020, 133, 110351. [Google Scholar] [CrossRef]
  41. Apergis, N.; Payne, J.E. Renewable and non-renewable energy consumption growth nexus: Evidence from a panel error correction model. Energy Econ. 2012, 34, 733–738. [Google Scholar] [CrossRef]
  42. Tugcu, C.T.; Ozturk, I.; Aslan, A. Renewable and non-renewable energy consumption and economic growth relationship revisited: Evidence from G7 countries. Energy Econ. 2012, 34, 1942–1950. [Google Scholar] [CrossRef]
  43. Al-mulali, U.; Fereidounia, H.G.; Lee, J.Y.; Che, N.B.; Sab, C. Examining the bidirectional long run relationship between renewable energy consumption and GDP growth. Renew. Sustain. Energy Rev. 2013, 22, 209–222. [Google Scholar] [CrossRef]
  44. Pfeiffer, B.; Mulder, P. Explaining the diffusion of renewable energy technology in developing countries. Energy Econ. 2013, 40, 285–296. [Google Scholar] [CrossRef] [Green Version]
  45. Ostrom, E. Governing the Commons: The Evolution of Institutions for Collective Action. Nat. Resour. J. 1992, 32. Available online: https://digitalrepository.unm.edu/nrj/vol32/iss2/6/ (accessed on 1 November 2021).
  46. Akintande, O.J.; Olubusoye, O.E.; Adenikinju, A.F.; Olanrewaju, B.T. Modeling the determinants of renewable energy consumption: Evidence from the five most populous nations in Africa. Energy 2020, 206, 117–992. [Google Scholar] [CrossRef]
  47. Oluoch, S.; Lal, P.; Susaeta, A. Investigating factors affecting renewable energy consumption: A panel data analysis in Sub Saharan Africa. Environ. Chall. 2021, 4, 100092. [Google Scholar] [CrossRef]
  48. Monfort, P. Convergence of EU Regions Measures and Evolution. European Union Regional Policy 2008, Working Paper 1/2008. Available online: https://ec.europa.eu/regional_policy/sources/docgener/work/200801_convergence.pdf (accessed on 1 November 2021).
  49. Steel, M.F.J. Model averaging and its use in economics. J. Econ. Lit. 2020, 58, 644–719. [Google Scholar] [CrossRef]
  50. Koop, G. Bayesian Econometrics; John Wiley & Sons Ltd: Chichester, UK, 2003. [Google Scholar]
  51. Leamer, E.E.; Leamer, E.E. Specification Searches: Ad Hoc Inference with Nonexperimental Data, Vol 48; John Wiley & Sons Incorporated: Hoboken, NJ, USA, 24 April 1978. [Google Scholar]
  52. Beauchamp, J.J.; Mitchell, T.J. Bayesian Variable Selection in Linear Regression. J. Am. Stat. Assoc. 1988, 83, 1023–1032. Available online: https://www.jstor.org/stable/pdf/2290129.pdf (accessed on 5 August 2021).
  53. Błażejowski, M.; Kwiatkowski, J. Bayesian Averaging of Classical Estimates (BACE) for gretl. In Gretl Working Papers 6; Universita Politecnica delle Marche (I), Dipartimento di Scienze Economiche e Sociali: Ancona, Italy, 2018. [Google Scholar]
  54. Yassin, J. Macroeconomic Factors and Renewable Energy Consumption in ASEAN Countries: A Dynamic Heterogeneous Panel Approach. Int. J. Acad. Res. Bus. Soc. Sci. 2021, 11, 800–813. [Google Scholar] [CrossRef]
  55. Osiewalski, J.; Steel, M.F.J. Una perspectiva bayesiana en selección de modelos. Cuad. Económicos De ICE 1993, 55, 327–351. [Google Scholar]
  56. Hinne, M.; Gronau, Q.F.; van den Bergh, D.; Wagenmakers, E.J. A conceptual introduction to Bayesian model averaging. Adv. Methods Pract. Psychol. Sci. 2020, 3, 200–215. [Google Scholar] [CrossRef]
  57. Balázs, É.; Kózluk, T.; Sutherland, D. Infrastructure and growth: Empirical evidence. In OECD Economics Department Working Papers; OECD Publishing: Paris, France, 2009; Volume 685. [Google Scholar] [CrossRef]
  58. Moral-Benito, E. Determinants of economic growth: A Bayesian panel data approach. Rev. Econ. Stat. Rev. Econ. Stat. 2012, 94, 566–579. [Google Scholar] [CrossRef] [Green Version]
  59. Albis, M.L.F.; Mapa, D.S. Bayesian averaging of classical estimates in asymmetric vector autoregressive models. Commun. Stat. -Simul. Comput. 2017, 46, 1760–1770. [Google Scholar] [CrossRef]
  60. Statistics Review World Energy. 2019. Available online: https://www.bp.com/content/dam/bp/business-sites/en/global/corporate/pdfs/energy-economics/statistical-review/bp-stats-review-2019-full-report.pdf (accessed on 10 August 2021).
  61. Bourcet, C. Empirical determinants of renewable energy deployment: A systematic literature review. Energy Econ. 2020, 85, 104563. [Google Scholar] [CrossRef]
  62. Cornwall, W. The Paris Climate Pact Is 5 Years Old. Is It Working? Available online: https://www.science.org/content/article/paris-climate-pact-5-years-old-it-working (accessed on 15 October 2021).
  63. Segreto, M.; Principe, L.; Desormeaux, A.; Torre, M.; Tomassetti, L.; Tratzi, P.; Paolini, V.; Petracchini, F. Trends in social acceptance of renewable energy across Europe—A literature review. Int. J. Environ. Res. Public Health 2020, 17, 9161. [Google Scholar] [CrossRef] [PubMed]
Figure 1. Overall energy consumption from renewable sources in Europe in 2015, 2018, and 2020 (target value). Source: Based on https://ec.europa.eu/eurostat/web/energy/data/shares (accessed on 25 October 2021).
Energies 14 07526 g001
Table 1. Summary of previous studies on determinants of renewable energy consumption.
S. No.Reference No.SampleCountry(s)Target Variable(s)MethodologyEmpirical Findings
1[4]1985–200522 OECD countriesY, REC, GCF, LFGranger causality R E C Y
2[5]1980–2005G7 countriesREC, Y, P, CO2, OPPanel CointegrationIncreases in real GDPpc and CO2pc are proven to be important drivers of RECpc usage in the LR. These findings hold true when using two alternative Panel Cointegration estimators. OP has a smaller, but nevertheless negative impact on the REC.
3[11]1990–201038 countriesREC, CO2, GDPpc, Pg, Enuse, OP, CP, NGP, Deregulations, Kyoto, EI, EPOS, EPCS, EPNGS, EPNS, ERIFEVD,
PCSE Estimator
[+,S] effect of CO2, [−] effect of Fiscal, Financial, and Voluntary policy measures, Enuse, [NS] effect of EI, energy prices, GDPpc, Pg, and deregulation on REC.
4[12]1990–200723 EU
countries
REC, CO2pc, CRES, ECpc, IDE, IGEG, ICEG, INEGPCSE EstimatorPolicies promoting renewables, ECpc affect [+,S] to renewable energy share. [−,NS] effects of EI, lobby, and CO2pc.
5[15]1980–2015FranceREC, T, fossil EC, EG, TO, GDPpcARDL, GCAll variables and REC have LR bidirectional causalities and SR unidirectional causalities.
6[16]1990–200624 European countriesCRES, CO2pc, ECpc, IDE, IGEG, ICEG, INEG, SURF, CP, NGP, OP, EU’s member in 2001, YOLS, RE, FE, FEVD[−,NS] lobby effect, [−] effect of CO2pc, and [+] effect of Enuse per capita.
The effects of income, fossil fuel prices, and EI were found to be [NS].
7[17]1990–200624 European countriesCRES, CO2pc, ECpc, IDE, ICEG,
IOEG, IGEG, INEG, Y, OP, NGP, CP
FE, (difference and system GMM), Least Squares Dummy Variable Corrected (LSDVC)(Coal, oil, gas, and nuclear) the energy source is [S] and consistent effect.
Per capita energy effect on RE use is [+,S].
8[18]1980–201125 OECD
countries
RECpc, GDPpc, CO2pc, OPPECMIn LR and SR [+,S] effects of GDPpc, CO2pc, and OP on RECpc. All variables have bidirectional causalities in LR and SR.
9[20]1997–2006OECD
countries
contribution of RE to energy supply, GDP, CPI for energyPanel Threshold
Regression model
Energy prices have [+,S] effect in a high growth regime, whereas in a low growth regime, [−,NS] effects are found.
10[21]1990–201164 countriesREC, CO2, OP, GDPpc, TOPooled OLS, FE, R, Dynamic (difference and system GMM)CO2pc growth and GDPpc growth had [S] effects on RECpc growth for all subsamples (HIC, MIC, LIC, and all countries). Except in HIC, TO also raises REC. For the entire sample of countries, OP growth has a [+,S] effect.
11[22]1990–201164 countriesREC, CO2pc, OP, GDPpc, TODynamic system-GMM panel modelCO2pc growth was observed to cause an increase in REC growth. For MIC and LIC, and the entire sample, the results revealed a [+,S] effect of TO. HIC and MIC were found to have a positive impact on GDPpc growth. The OP growth had a negative impact in MIC and the entire sample.
12[24]1994–200318 Emerging economicsREC, NREC, HC, OPPECM R e a l   G D P p c R E C p c
13[31]1990–201753 countriesREC, NREC, HC, OPGeneralized Least Squares (GLS), FMOLSHC has an [S] effect on REC at the global level, in MIC, HIC, and LMIC. On NREC and REC, OP has a [+,NS] impact.
14[38]1990–201258 countriesAE, GDP, GDPpc, FDI, Enuse, EI, EPNS, EPCS, EPNGS, EPOS, EPRS, CPI, trade, REC, UP, GHGs, LF, CR, OR, NGR, GCF, TP, REO, ASEDLinear model (FE), nonlinear model (Panel Threshold Regression)The coefficients on AE, CPI, UP, Enuse, and EI are [S] effects for both regimes with the same signs. GDPpc, EPNS, trade, OR, and ASED. [S] effects on the REC in both regimes with varied signs and sizes.
15[39]1980–201472 countries (24 developed and 48 developing)REP, REPpc, REC, RECpc,
SREP, SREC, REPpc, SRECpc, EG (as GDP, GDPpc), CO2, CO2pc, OP
Panel unit root tests, OLS1% increase in GDP or GDPpc leads to an increase in RE between 0.05% and 1.01%, and a 1% increase in energy price causes an increase in RE between 0.07% and 0.99% concerning various proxies.
16[40]Quarterly data from 1984–200420 Latin American and 30 European countriesRE capacity, CPR, GPR, CO2pc,
GDPpc, energy dependence, auctions, portfolio standard, feed-in tariffs, fiscal incentives
FE, RE, PCSE models[+,S] effects of feed-in tariffs, portfolio standard, auctions, CPR per capita, GDP per capita, [+,NS] effects of fiscal incentive, [−,S] effects of electricity demand growth, CO2pc.
17[41]1990–200780 countriesREC, NREC, LF, GCF, YPECM LR :   R E C Y
SR :   R E C Y
18[42]1980–2009G7 countriesREC, LF, GCF, Y, NRECHatemi-J causality tests France ,   Italy ,   Canada ,   and   U.S.A. :   R E C Y
England   and   Japan :   R E C Y
Germany :   Y R E C
19[43]1980–2009108 countriesGDP, ELC used as a proxy of RECFMOLS 79 %   of   the   countries :   R E C Y
19 %   of   the   countries :   R E C Y
2 %   of   the   countries :   Y R E C
20[44]1985–2005108 developing countriesGDP, FEDI, Kyoto, CPR, GPR, TO, hydro share, RE policy, FDTwo-step selection models[−,S] effects of TO, FDI, policy support programs, growth of ELC, and production from fossil fuels. FD and Kyoto Protocol was [NS] effects.
Abbreviations of Variables: Access to electricity (% of population) (AE); Adjusted savings: energy depletion (current USD) (ASED); Carbon dioxide emissions (CO2); Carbon dioxide emission per capita (CO2pc); Consumer price index (2010 = 100) (CPI); Coal rents (CR); Coal production (CPR); Coal price (CP); Contribution of Renewables to total Energy Supply (CRES); Energy consumption (EC); Economic growth (EG); Energy imports (EI); Energy use (Enuse); Electricity consumption (ELC); Electricity production from coal sources (% of total) (EPCS); Electricity production from natural gas sources (% of total) (EPNGS); Electricity production from oil sources (% of total) (EPOS); Electricity rates for industry (ERI); Electricity production from renewable sources, excluding hydroelectric (% of total) (EPRS); Electricity production from nuclear sources (% of the total) (EPNS); Financial development (FD); Foreign direct investment (FDI); Gross Domestic Product (GDP); GDP per capita (GDPpc); Gas production (GPR); Greenhouse gases (GHGs); Gross capital formation (GCF); Human capital (HC); Income production (IP); Import dependency of energy (%) (IDE); Importance of gas to electricity generation (%) (IGEG); Importance of oil to electricity generation (%) (IOEG); Importance of coal to electricity generation (%) (ICEG); Importance of nuclear to electricity generation (%) (INEG); Labor force (LF); Natural gas rents (NGR); Non-renewable energy consumption (NREC); Natural gas price (NGP); Oil price (OP); Oil rents (OR); Population growth (Pg); Per capita energy consumption (ECpc); Per capita renewable energy consumption (RECpc); Per capita renewable energy production (REPpc); Real GDP (Y); Renewable electricity output (% of total electricity output) (REO); Renewable energy (RE); Renewable energy production (REP); Renewable energy consumption (REC); Share of RE production in total energy production (SREP); Share of RE consumption in total energy consumption (SREC); Share of per capita RE production in per capita total energy production (SREPpc); Share of per capita RE consumption in per capita total energy consumption (SRECpc); Surface area (SURF); Terrorism (T); Total population (P); Trade openness (TO); Urban population (UP). Abbreviations of Methods: Fixed Effects Vector Decomposition (FEVD); Fixed Effect (FE); Fully Modified Ordinary Least Squares (FMOLS); Ordinary Least Squares (OLS); Panel Corrected Standards Error (PCSE); Panel Error Correction Model (PECM); Random Effect (RE). Abbreviations of Results: Positive and significant results: [+,S]; Negative and significant results: [−,S]; Negative and insignificant results: [−,NS]; [Positive and insignificant results: [+,NS]); REC Energies 14 07526 i001Y indicates a bidirectional causality between REC and EG; Y→REC indicates a unidirectional causality from EG to REC; REC→Y indicates a unidirectional causality from REC to EG; Neutral indicates no causal relationship; Long-run (LR); Short-run (SR); Low-income countries (LIC); Low-middle-income countries (LMIC); Middle-income countries (MIC); High-income countries (HIC).
Table 2. The list of selected countries.
CountriesCodesCountriesCodesCountriesCodesCountriesCodes
AustriaAUTFinlandFINLatviaLVARomaniaROU
BelgiumBELFranceFRALithuaniaLTUSlovak RepublicSVK
CroatiaHRVGermanyDEULuxembourgLUXSloveniaSVN
CyprusCYPGreeceGRCNetherlandsNLDSpainESP
Czech RepublicCZEHungaryHUNNorwayNORSwedenSWE
DenmarkDNKIrelandIRLPolandPOLSwitzerlandCHE
EstoniaESTItalyITAPortugalPRTUnited KingdomGBR
Table 3. Posterior estimates of renewable consumption determinants in 2015 and 2018.
Variable20152018
PIPAvg. CoefficientAvg. Std. ErrorPIPAvg. CoefficientAvg. Std. Error
Const1.000010.920215.57131.00006.398914.5596
NC1.0000−0.31410.06340.9992−0.25030.0767
GDP0.88340.00990.00560.98080.01190.0042
FDI_BOP0.3705−0.00280.00550.91860.01840.0088
TO0.4940−0.00770.01100.8550−0.02030.0126
HC0.7368−0.18450.16070.7770−0.14810.1294
GC0.9933−0.51050.16460.4701−0.12470.2003
OC0.91960.28590.17280.44430.06730.1206
CC0.24800.00580.03050.40360.02580.0452
TDC0.58947.17659.10390.3741−0.59016.9248
SURF0.63610.0000060.0000060.32740.0000010.000004
SET0.3528−0.01080.02240.30480.00820.0208
PSA0.19800.05860.88350.29940.61161.5392
LEI0.4445−10.169716.42920.2966−5.881815.5512
FEBC0.3009−0.07411.40990.2430−0.25631.0624
UNEMP0.3690−0.06280.14050.22910.00910.1133
CCUR0.4248−0.96991.80460.2136−0.13810.8091
RL0.29330.47301.71390.20830.16801.0496
EI0.23260.46007.82760.19010.02025.8023
Note: Bold font indicates PIP values greater than 0.7. Abbreviations of Variables: (NC) Nuclear consumption; (GDP) Gross Domestic Product; (FDI_BOP) FDI net inflow; (TO) Trade openness; (HC) Hydro consumption; (GC) Gas consumption; (OC) Oil consumption; (CC) Coal consumption; (TDC) Top developed countries; (SURF) Surface area; (SET) School enrollment, tertiary; (PSA) Political stability absence; (LEI) Life expectancy index; (FEBC) Former members of the Eastern Bloc countries; (UNEMP) Unemployment; (CCUR) Control of corruption; (RL) The Rule of law; (EI) Education index.
Table 4. Posterior estimates of renewable consumption determinants in 2015 for different average prior model sizes.
E ( Ξ ) = K / 2 E ( Ξ ) = K / 3 E ( Ξ ) = K / 4
VariablePIPAvg. CoefficientAvg. Std. ErrorPIPAvg. CoefficientAvg. Std. ErrorPIPAvg. CoefficientAvg. Std. Error
const1.000010.920215.57131.000010.755015.47401.000010.804415.4340
NC1.0000−0.31410.06340.9999−0.31500.06351.0000−0.31440.0627
GDP0.88340.00990.00560.88290.00990.00560.88200.00990.0056
FDI_BOP0.3705−0.00280.00550.3645−0.00280.00550.3656−0.00280.0055
TO0.4940−0.00770.01100.5033−0.00780.01100.4945−0.00770.0110
HC0.7368−0.18450.16070.7398−0.18660.16070.7384−0.18550.1606
GC0.9933−0.51050.16460.9930−0.51180.16480.9957−0.51090.1622
OC0.91960.28590.17280.91810.28700.17320.91980.28590.1725
CC0.24800.00580.03050.23750.00550.03000.23920.00550.0297
TDC0.58947.17659.10390.59607.30179.12890.58677.20009.0915
SURF0.63610.0000060.0000060.64370.0000060.0000060.63520.0000060.000006
SET0.3528−0.01080.02240.3500−0.01070.02230.3453−0.01050.0220
PSA0.19800.05860.88350.20250.06160.88370.19950.06060.8749
LEI0.4445−10.169716.42920.4384−9.956016.30190.4369−10.004416.3088
FEBC0.3009−0.07411.40990.2978−0.07691.40740.3002−0.05701.3982
UNEMP0.3690−0.06280.14050.3741−0.06430.14060.3639−0.06290.1389
CCUR0.4248−0.96991.80460.4266−0.98181.81080.4193−0.95191.7880
RL0.29330.47301.71390.29330.47491.71280.28720.45761.6893
EI0.23260.46007.82760.23350.47407.86250.22890.38917.6372
Table 5. Posterior estimates of renewable consumption determinants in 2018 for different average prior model sizes.
Variable E ( Ξ ) = K / 2 E ( Ξ ) = K / 3 E ( Ξ ) = K / 4
PIPAvg. CoefficientAvg. Std. ErrorPIPAvg. CoefficientAvg. Std. ErrorPIPAvg.CoefficientAvg. Std. Error
const1.00006.398914.55961.00006.321214.32761.00006.204114.1475
NC0.9992−0.25030.07670.9992−0.25040.07640.9996−0.24990.0755
GDP0.98080.01190.00420.98420.01190.00410.98680.01190.0041
FDI_BOP0.91860.01840.00880.91870.01840.00880.92170.01850.0087
TO0.8550−0.02030.01260.8548−0.02010.01250.8570−0.02020.0125
HC0.7770−0.14810.12940.7804−0.14770.12810.7856−0.14860.1276
GC0.4701−0.12470.20030.4695−0.12490.19940.4641−0.12330.1971
OC0.44430.06730.12060.43810.06610.11910.43610.06500.1168
CC0.40360.02580.04520.40080.02570.04490.40220.02560.0447
TDC0.3741−0.59016.92480.3769−0.68036.88240.3741−0.72856.7650
SURF0.32740.0000010.0000040.31600.0000010.0000040.31830.0000010.000004
SET0.30480.00820.02080.29850.00790.02030.30470.00820.0204
PSA0.29940.61161.53920.28730.57481.48950.29350.58811.4970
LEI0.2966−5.881815.55120.2934−5.742415.32030.2903−5.628815.1293
FEBC0.2430−0.25631.06240.2412−0.24751.03880.2328−0.24371.0167
UNEMP0.22910.00910.11330.22370.00890.11110.22170.00880.1095
CCUR0.2136−0.13810.80910.2109−0.13090.78410.2086−0.13150.7773
RL0.20830.16801.04960.20380.16351.02310.20490.16121.0141
EI0.19010.02025.80230.18390.00095.56510.1789−0.00505.4166
Publisher’s Note: MDPI stays neutral with regard to jurisdictional claims in published maps and institutional affiliations.

