Article

Voltage Rise Regulation with a Grid Connected Solar Photovoltaic System

by
Akinyemi Ayodeji Stephen
*,
Kabeya Musasa
and
Innocent Ewean Davidson
Department of Electrical Power Engineering, Faculty of Engineering and the Built Environment, Durban University of Technology, Durban 4000, South Africa
*
Author to whom correspondence should be addressed.
Energies 2021, 14(22), 7510; https://doi.org/10.3390/en14227510
Submission received: 21 September 2021 / Revised: 21 October 2021 / Accepted: 25 October 2021 / Published: 10 November 2021

Abstract

:
Renewable Distributed Generation (RDG), when connected to a Distribution Network (DN), suffers from power quality issues because of the distorted currents drawn from the loads connected to the network over generation of active power injection at the Point of Common Coupling (PCC). This research paper presents the voltage rise regulation strategy at the PCC to enhance power quality and continuous operation of RDG, such as Photovoltaic Arrays (PVAs) connected to a DN. If the PCC voltage is not regulated, the penetration levels of the renewable energy integration to a DN will be limited or may be ultimately disconnected in the case of a voltage rise issue. The network is maintained in both unity power factor and voltage regulation mode, depending on the condition of the voltage fluctuation occurrences at the PCC. The research investigation shows that variation in the consumer’s loads (reduction) causes an increase in the power generated from the PVA, resulting in an increase in the grid current amplitude, reduction in the voltage of the feeder impedance and an increase in the phase voltage amplitude at the PCC. When the system is undergoing unity power factor mode, PCC voltage amplitude tends to rises with the loads. Its phase voltage amplitude rises above an acceptable range with no-loads which are not in agreement, as specified in the IEEE-1547 and Southern Africa grid code prerequisite. Incremental Conduction with Integral Regulator bases (IC + PI) are employed to access and regulate PVA generation, while the unwanted grid current distortions are attenuated from the network using an in-loop second order integral filtering circuit algorithm. Hence, the voltage rise at the PCC is mitigated through the generation of positive reactive power to the grid from the Distribution Static Compensator (DSTATCOM), thereby regulating the phase voltage. The simulation study is carried out in a MATLAB/Simulink environment for PVA performance.

1. Introduction

Most remote communities in African countries require sustainable electrical energy for everyday life. The extension of the central energy production system, transmission and distribution cannot reach these areas because of massive energy losses and huge energy cost. Isolated electrical power generation, such as microgrids, would be a possible solution. Microgrid systems located in a remote area could have fewer prerequisites due to the nature of the loads, such as streetlight and domestic needs, as compared to the massive electrical network or macro network. The latest trend of power generation is by the use of renewable energy sources due to the fact that they are clean, friendly and naturally replenish on the human time scale [1,2,3,4]. Countries across the globe are exploring their ecological approaches to power sharing to reduce total dependence on the conventional method of power generation. Another option by which electrical power can be supplied to the remote area where there is no opportunity for grid connection is by making use of generating sets; this alternative is not encouraged because of the potential release of harmful and poisonous gases to the surrounding area, which can contribute to global warming [3]. Scientists, researchers and industrialists have shown a great interest in microgrids with RDG development due to the advantages it can offer in terms of sustainability, power quality and simple design implementation [4]. Any microgrid is an active network that connects renewable energy resource and loads. The common characteristic of a microgrid is the flexible nature of operation, reliability of energy supply and power loss minimization when connected to the main grid and in standalone mode, due to the fact that the consumers are located around the area for easy accessibility. Renewable energy sources such as solar power systems and wind power systems with battery storage integration have received attention in recent years because of their easy design, simple installation and energy management strategy [5].
There is a need for energy generation and power quality management strategy in a DN with renewable energy resource integration because of their integration issues at PCC, such as voltage rise, current distortion and their intermittent nature in generating output. Winds do not blow for 24 h every day, and the same thing applies to the sun; their outputs are dependent on climatic conditions. The intermittent nature of the system, distortion occurrence at PCC, power quality issues, protection challenges because of voltage rise at PCC, and the network load variations would definitely have a great impact on the voltage output of RDG and network stability. Therefore, these issues could cause less reliability of the microgrid/Distribution Network (DN) resulting in a reduction in the RDG’s penetration level [6,7,8,9,10]. Hence, these constraints with RDG integration can be strategically managed and regulated at PCC if they are to stay connected at PCC, as specified in Southern Africa grid code requirements, IEEE-1547 and IEEE-519, respectively.
PVAs’ integration with DN has grown speedily in recent years, now appearing as one of the most renowned power sources to meet consumer loads, especially in remote areas. The trend will continue for the next few years due to the reduction in price and relative simplicity of the technology. However, the nonlinear electrical features of PVAs are common setbacks for the technology, thus, extracting maximum energy from it constitutes a challenge. Nevertheless, tracking algorithm control is an alternative means by which the peak power from PVAs can be accessed. In this paper, modelling, simulations, and control of PVAs are presented, and Integral Regulator (PI) with perturb and observation strategy is employed to access the peak power from the PVAs system. The Peak Power Point of PVAs is accessed by using Peak Power Point Tracking (PPPT) strategic control, which tracks and regulates the maximum power generated. The boost converter is used to boost the solar output voltage to a desired voltage and used as a modulating reference for voltage signals. The network impacts during unity power factor and voltage regulation mode are analyzed, along with loads and PVA generation capacity variation. To limit the effect of nonlinear loads at PCC, an in-loop filtering circuit that possesses a higher harmonic rejection ability is incorporated at the PCC. The outcomes show that there is a reduction in the line losses when the system operates in unity power factor mode during normal operation while the voltage rise is reduced to an acceptable range, which agrees with IEEE-1547, IEEE-519 and southern Africa grid code requirements without disconnecting PVAs at PCC. During the maximum PVA output, and low load demands, the system changes to voltage regulation mode and a balanced grid current is achieved even with the nonlinear load connection to the network. The system thus exhibits the DSTATCOM’s features during no PVA output, thereby enhancing the system’s reliability.
This research paper presents the modelling, simulations and control of PVA power generation to track its Peak Power Point. Perturb and observation with PI and in-loop second order integral filtering circuit algorithms are used to access the peak power from the PVA system, reduce error generated and regulate unwanted grid distortions at PCC. The boost converter is also employed to boost the solar output voltage to a desired voltage level, which is used as the modulating reference voltage signal. The purpose is to access PPPT from the PVAs and regulate the maximum power generated at PCC to minimize voltage rise. The simulation study is carried out in a MATLAB/Simulink environment. The network impacts with DSTATCOM connection during unity power factor, and voltage regulation mode is analyzed with loads and PVA generation capacity variations. The outcomes show that there is a reduction in the line losses when the system operates in unity power factor mode during normal operation, while the occurrence of voltage rise due to active power generated by the PVAs is being controlled to an acceptable range, which agrees with IEEE-1547, IEEE-519 and southern Africa grid code requirements without disconnecting PVAs at PCC. During the maximum PVA output, and low load demands, the system changes to voltage regulation mode, and a balanced grid current is achieved even with the nonlinear load connection to the network. The system exhibits the DSTATCOM’s features during no PVA output, thereby enhancing the system’s reliability. The contributions of this study are the integration of solar PVAs at PCC to continue operation even during a voltage rise issue and without disconnection, PPPT error reduction by addition of an PI, strategic generation of positive reactive power at PPC to control voltage rise, tactical positioning of in-loop second order integral filtering circuit algorithm to attenuate distortions and system enhancement during load and PVA variations. The contributions of the paper are summarized as follows:
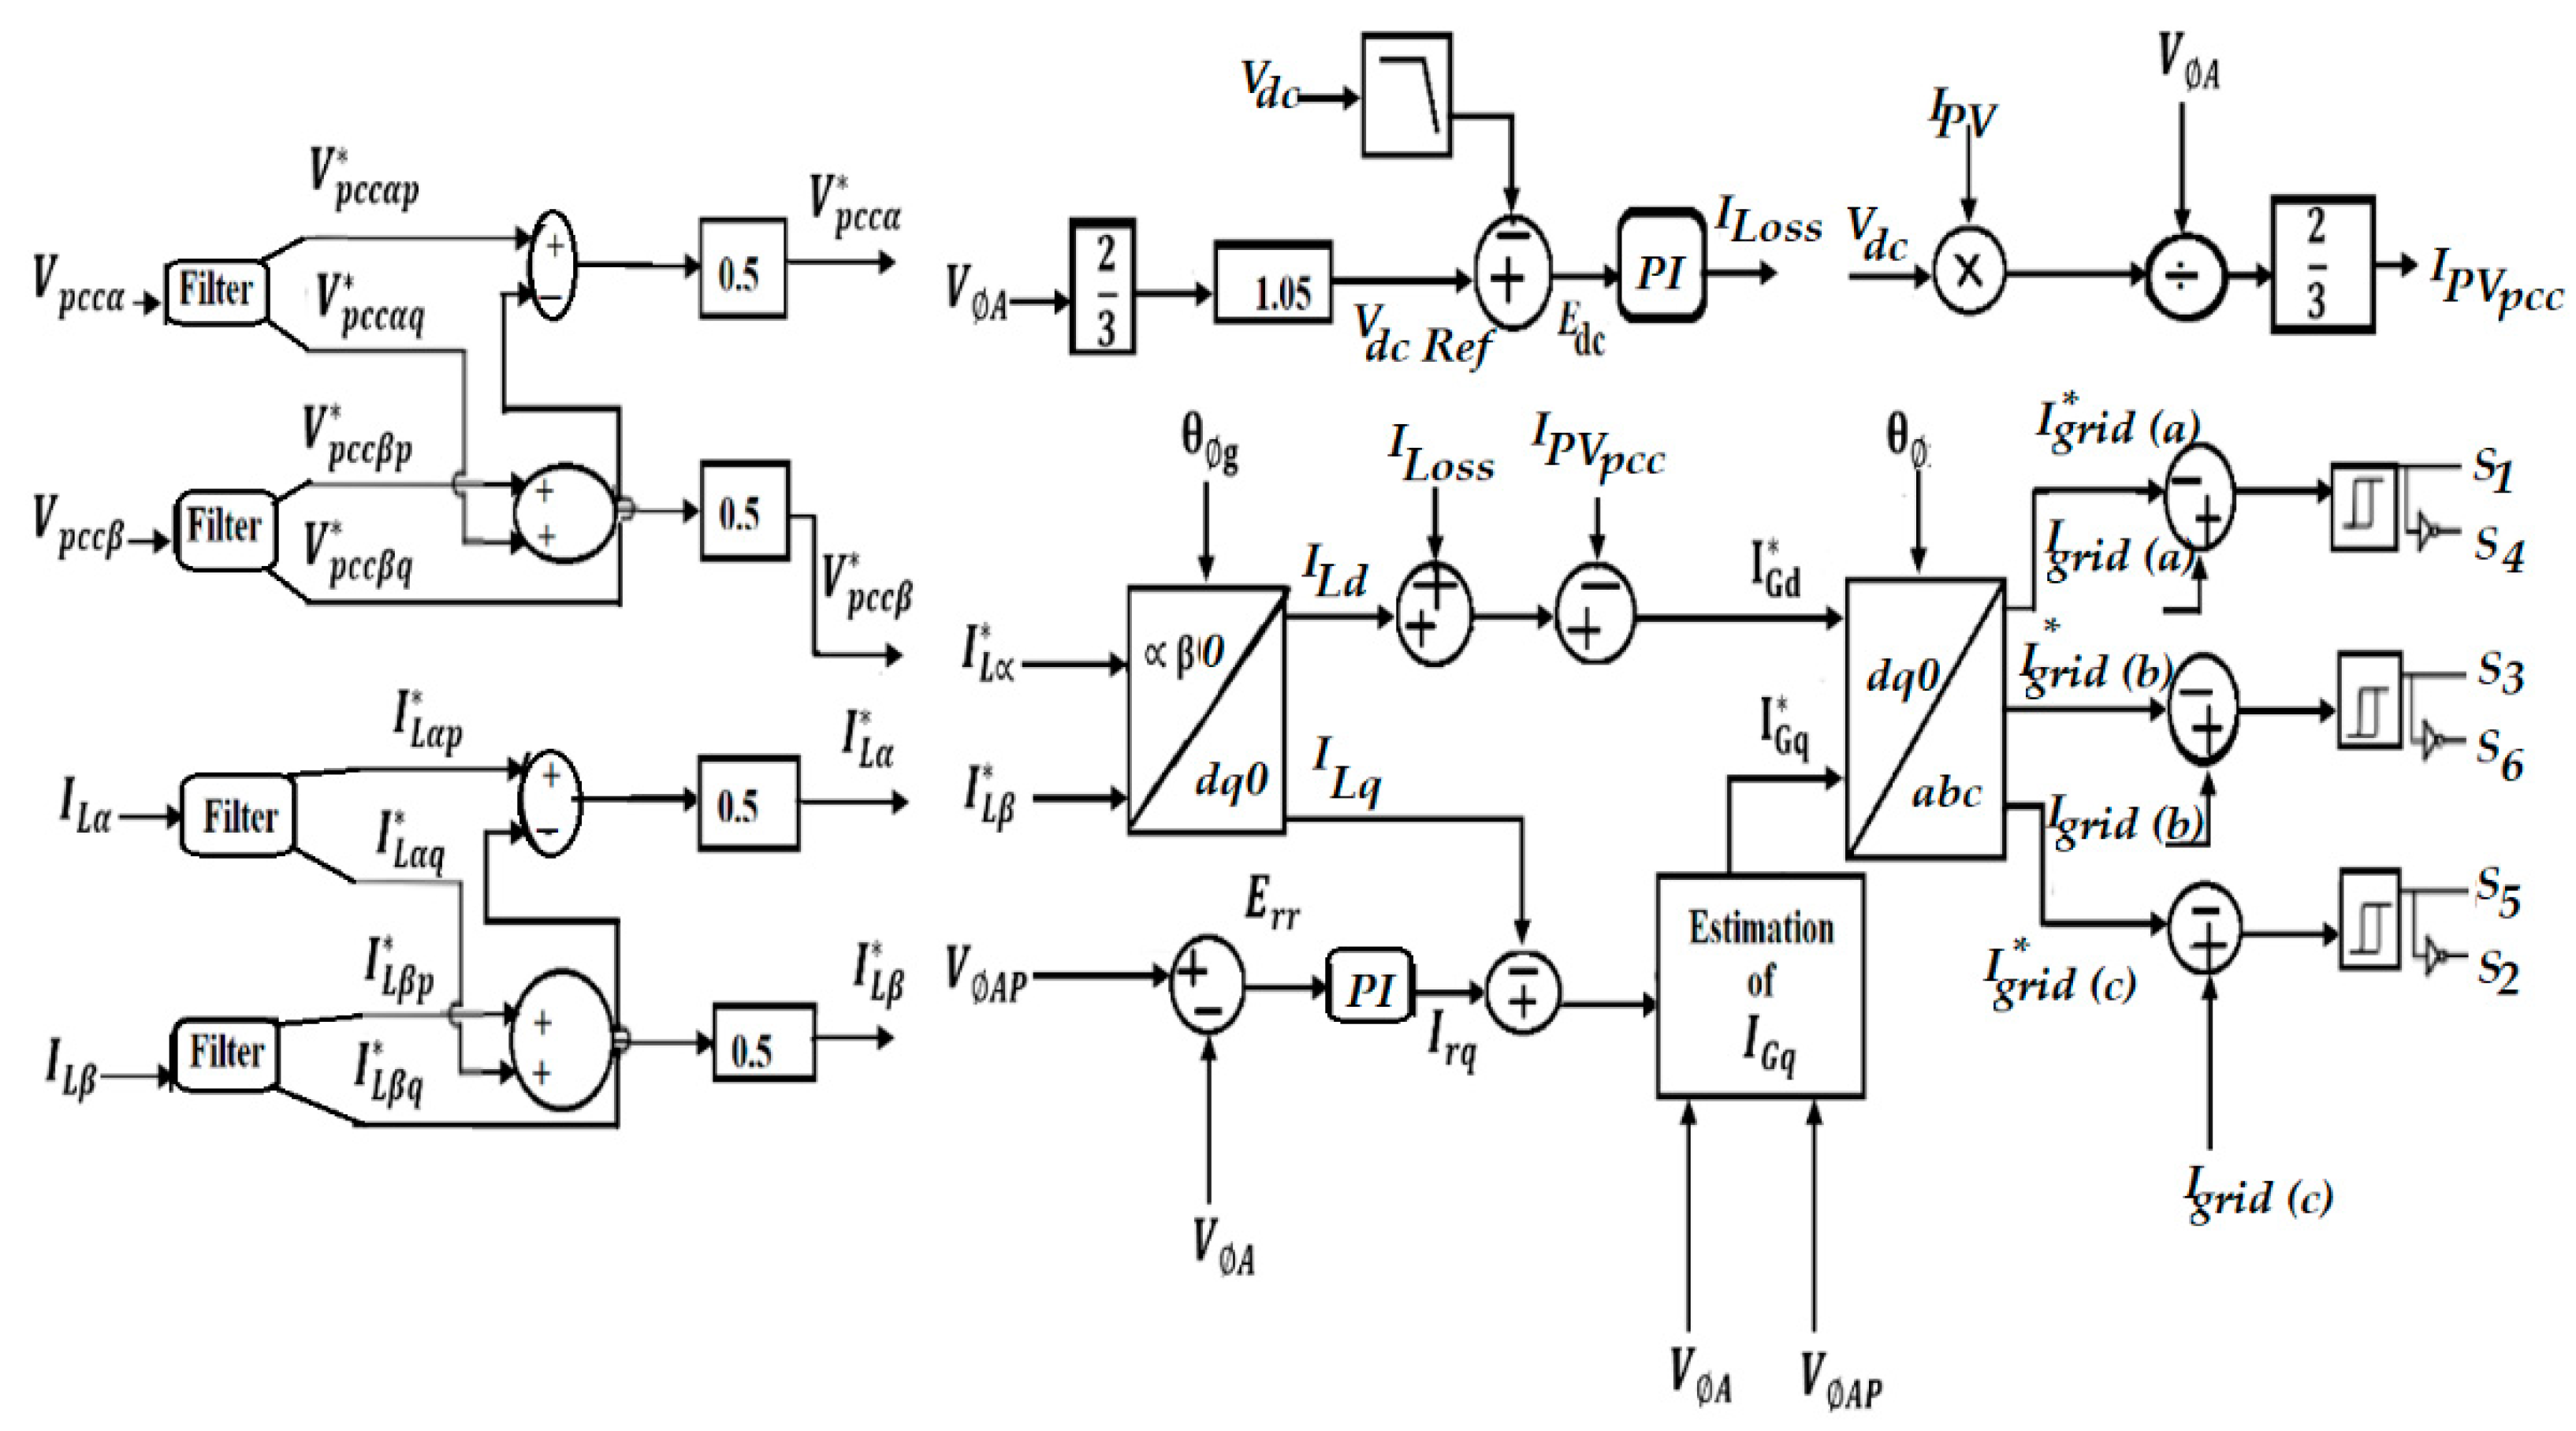
  • Strategic regulation of PCC voltage rise issue through the generation of positive reactive power without disconnecting RDG integration with higher penetration levels.
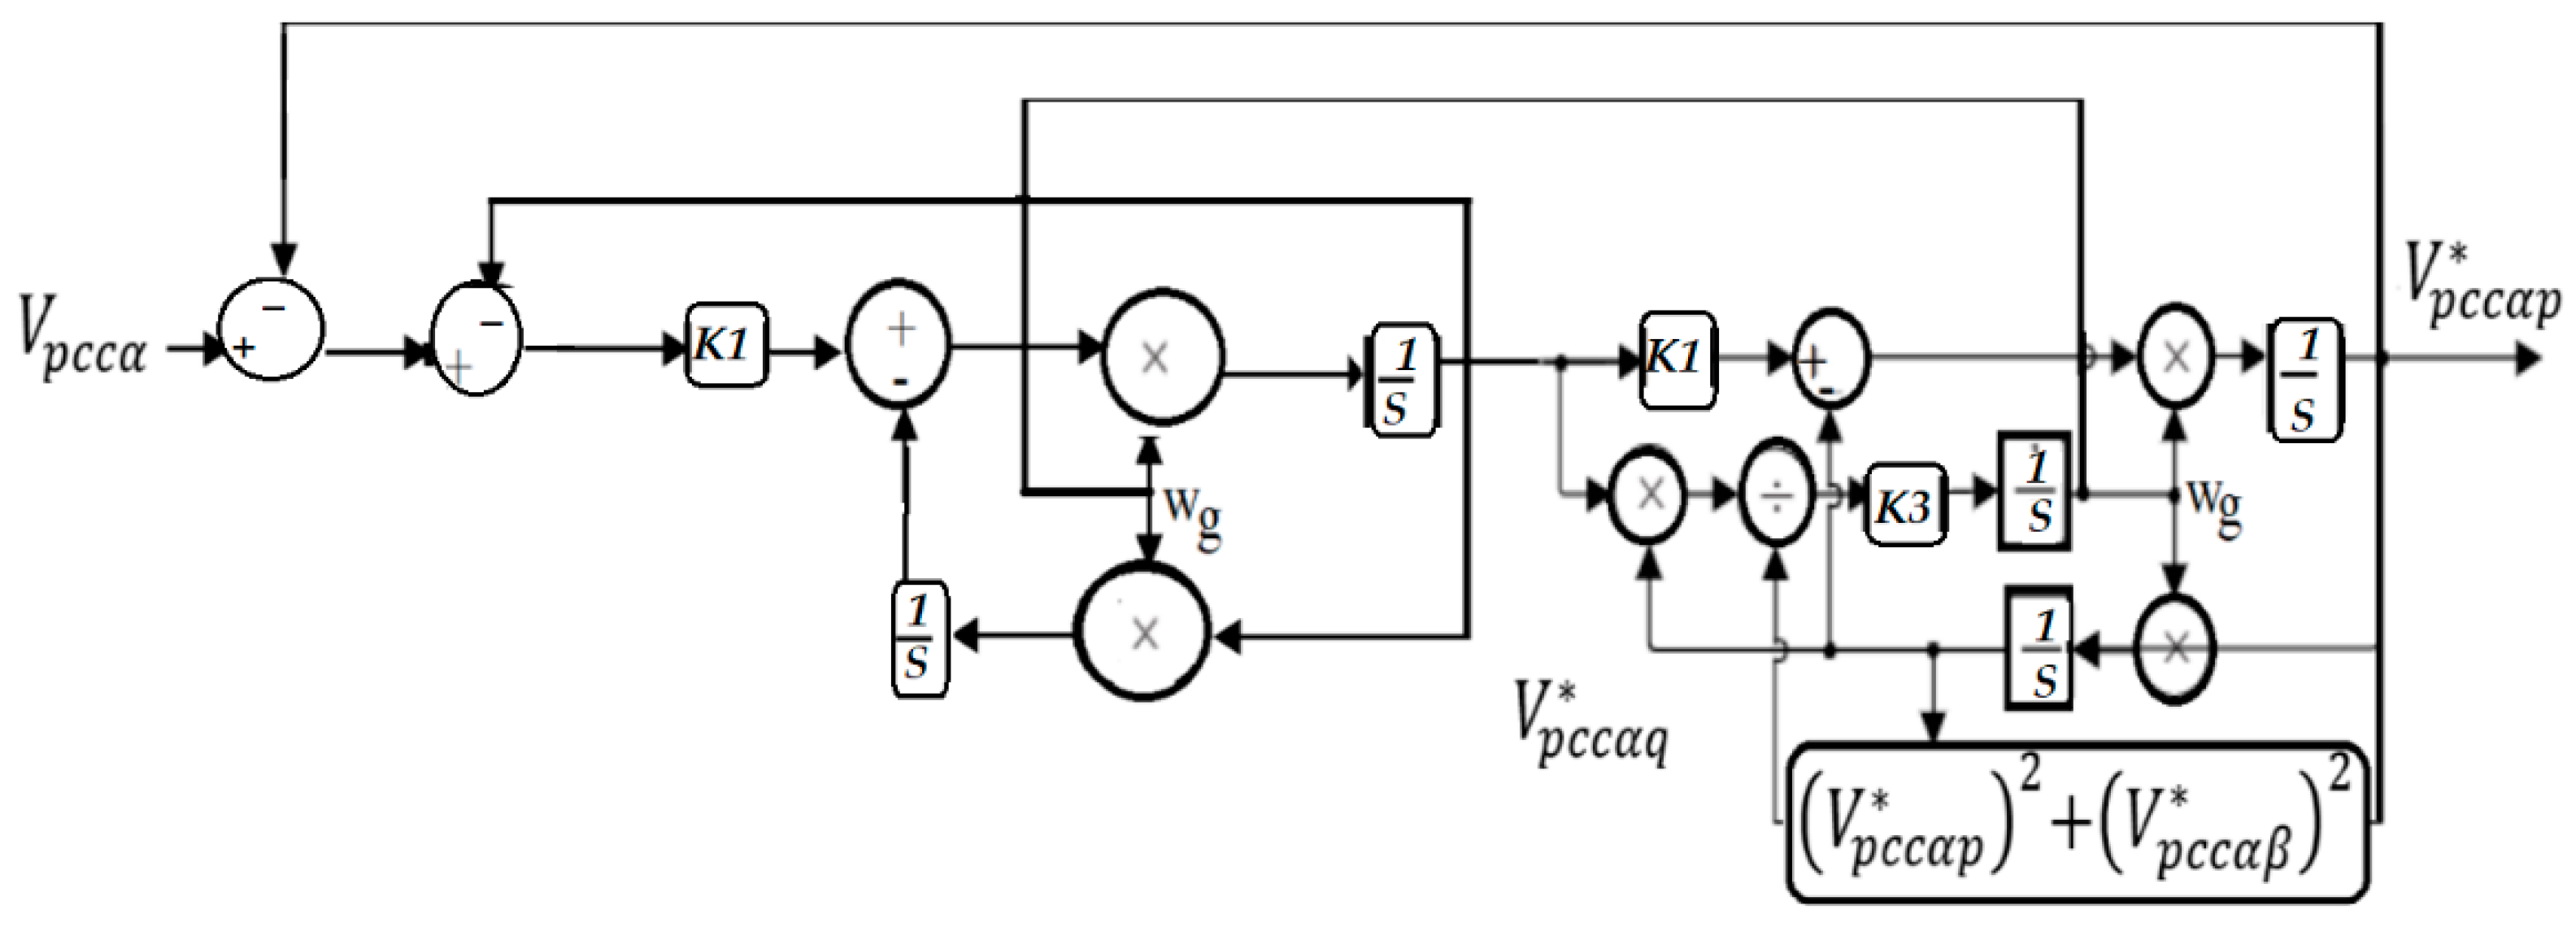
  • In-loop second order integral filtering algorithm is designed to filter grid current distortions generated from the non-linear loads.
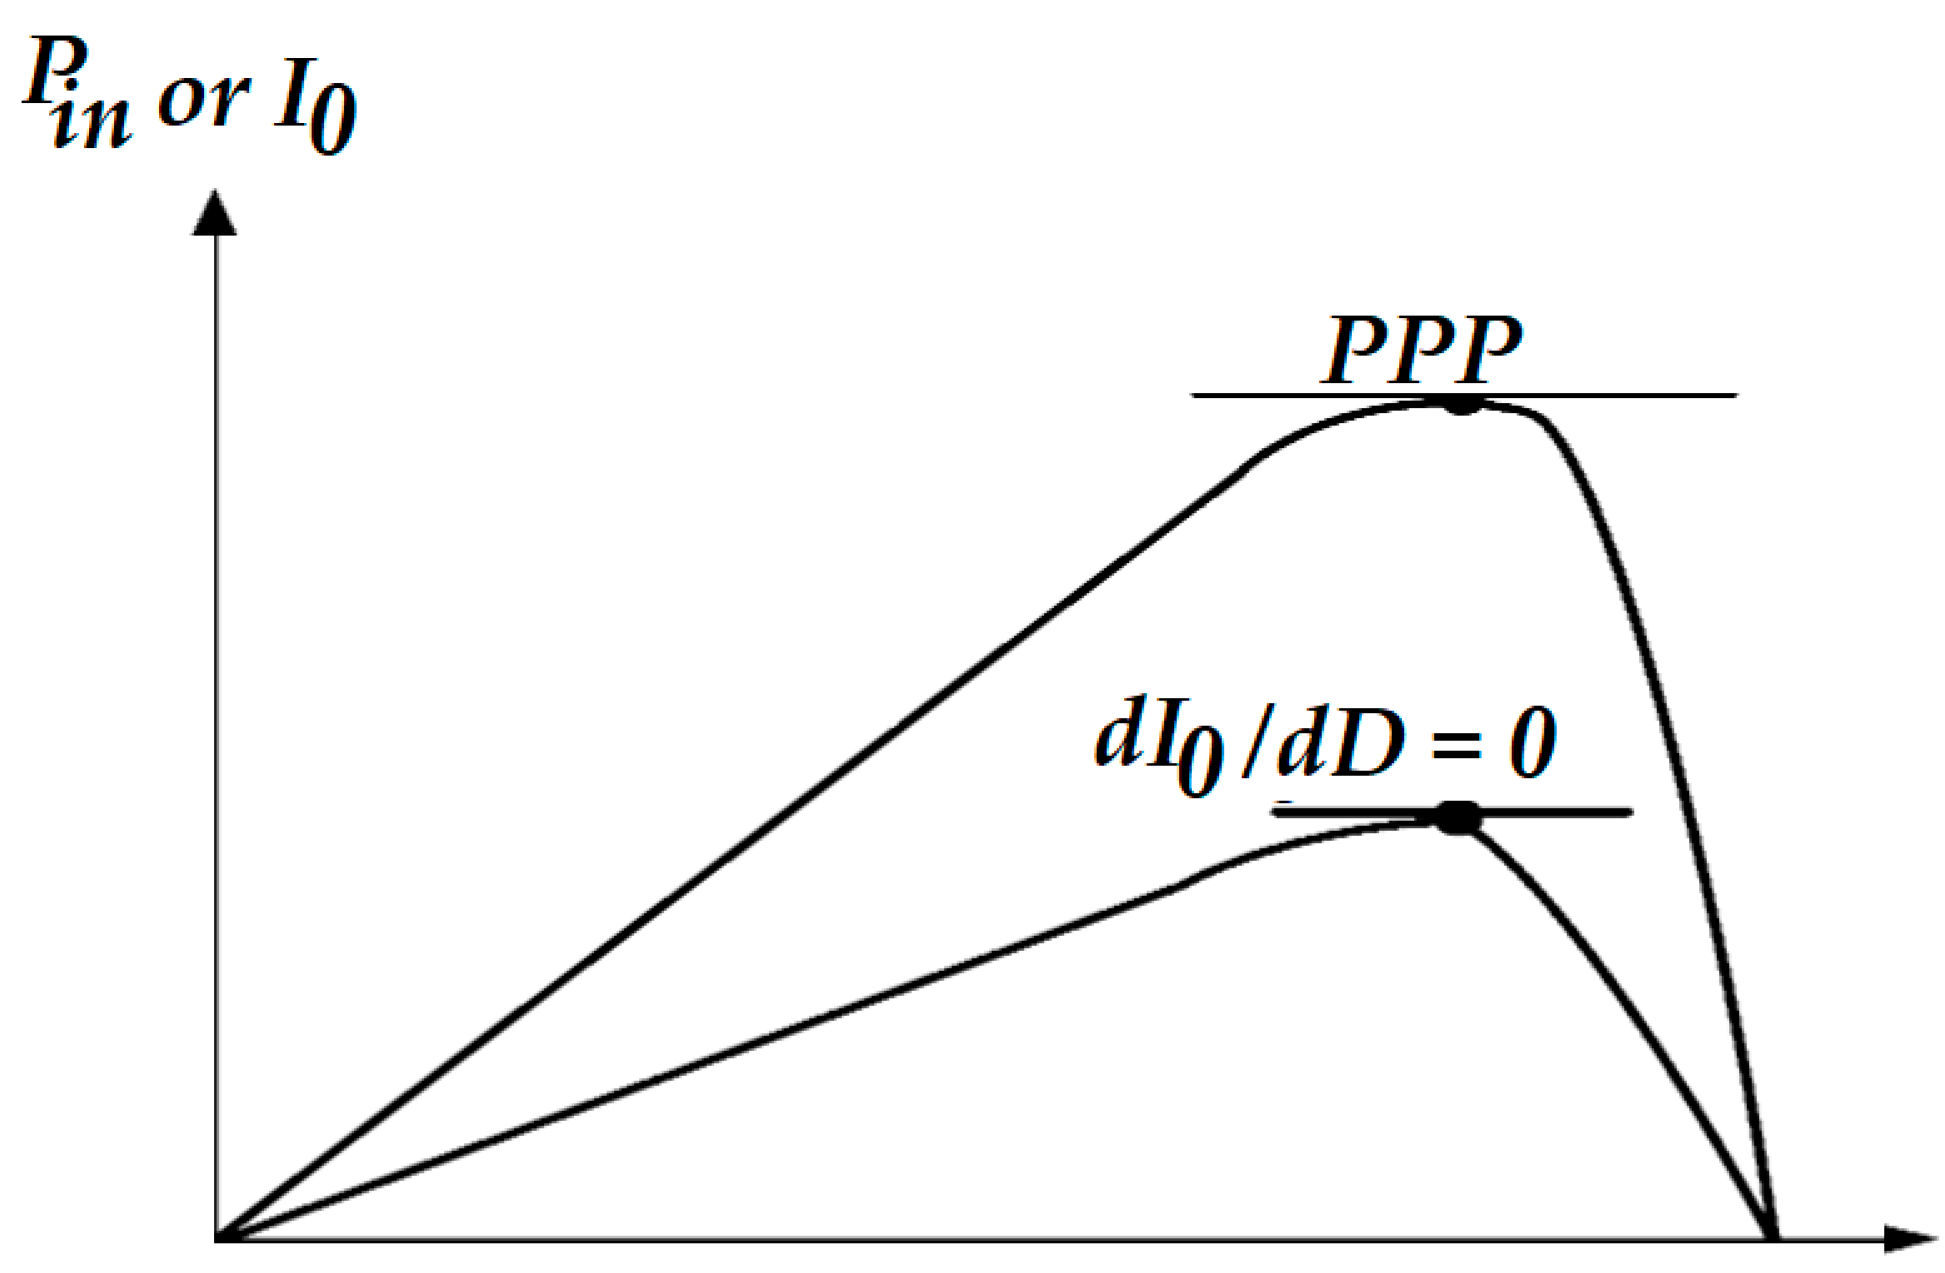
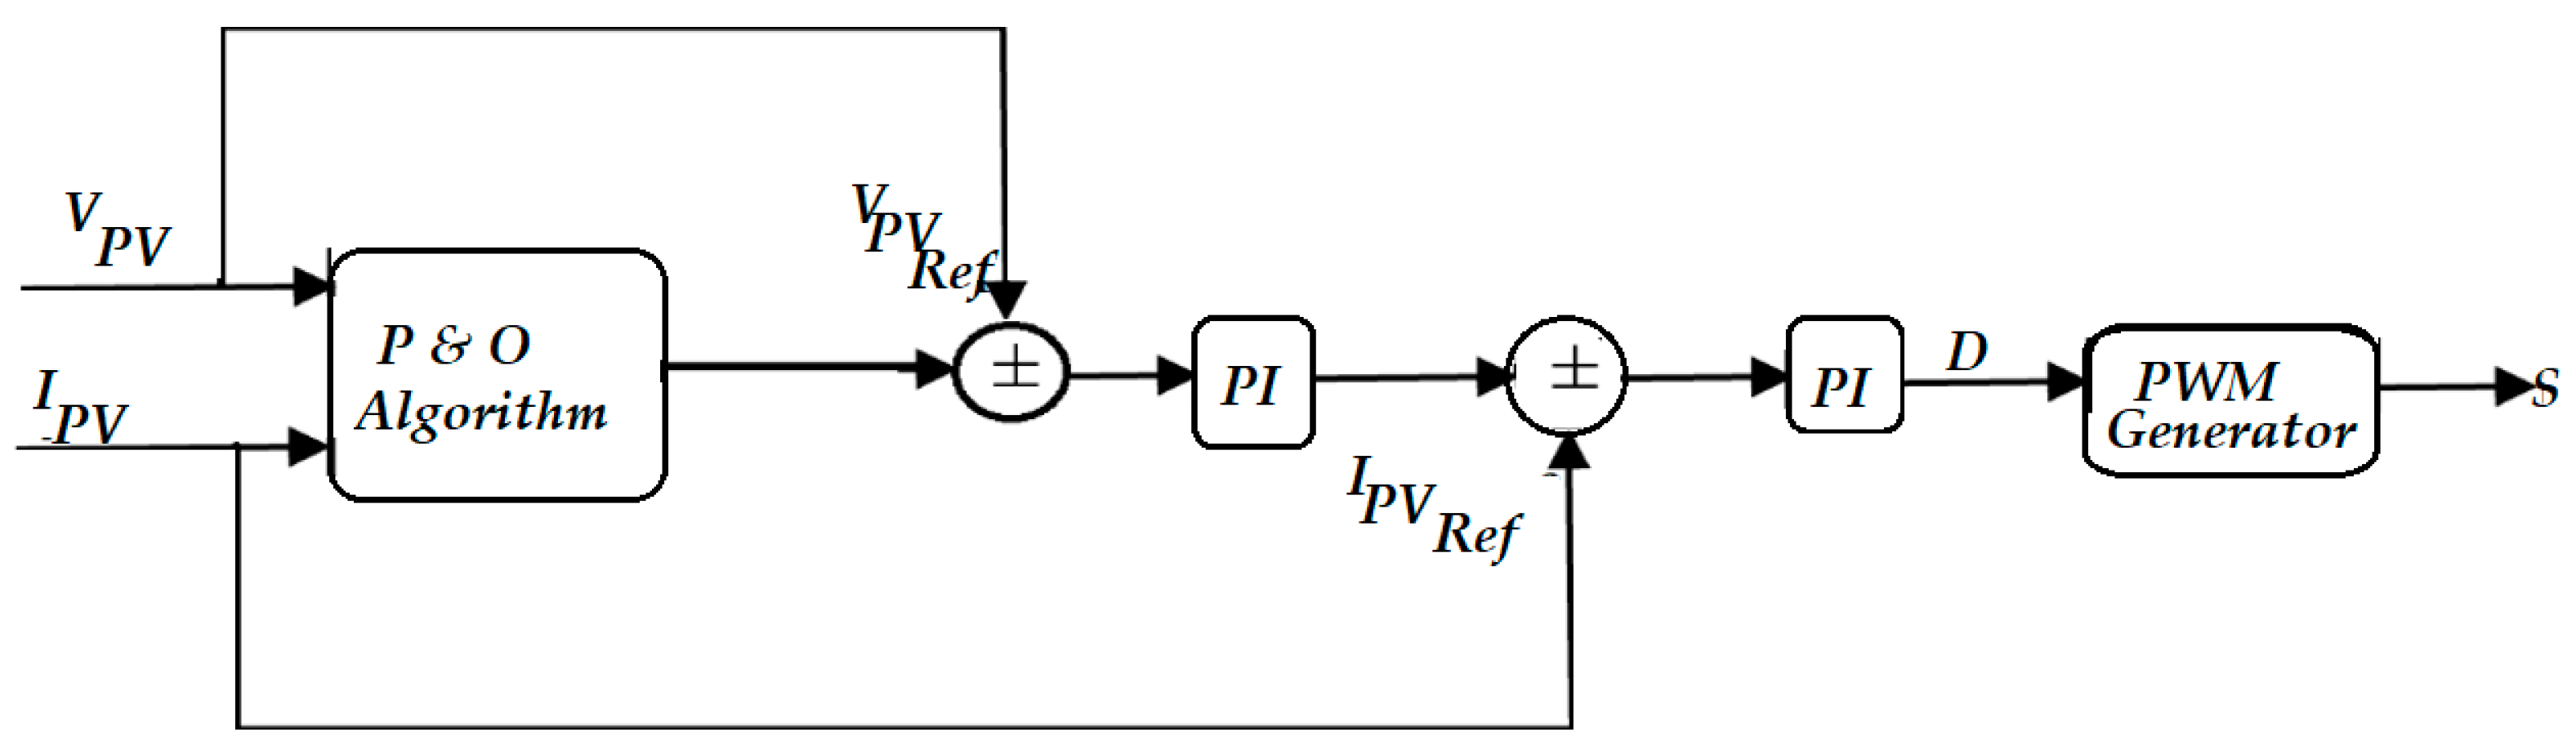
  • Peak Power Point Tracking error is minimized from the solar power tracking system by the addition of an integral regulation algorithm.
  • The output voltage and power of the PVAs is made reinforced and stable with fluctuation in loads and the sun’s irradiation.
The paper is structured in six sections. In the second section, a review of the power system structure and details of the microgrid system are discussed. Section three presents the modelling of the solar system, battery system and the solar power tracking strategy, while section four describes the method adopted in the research and the description of the test system employed. Finally, simulation results and discussion are presented in the fifth section, while section six summarizes the conclusion.
The research question that guided the study is as follow:
  • Can solar PVAs continue operation with a voltage rise issue at PCC without disconnection?
  • What is the impact of load and solar PVA variations at the PCC?

2. Power System and Microgrid

2.1. Microgrid

For many years, the power system has been structured as a centralized system, and the nations of the world depend on this conventional centralized utility power grid for their heat and electricity demands. However, many communities, districts and regions still are unable to connect to the central electricity grid. The extension of electrical power does not even reach some areas, while some can view the grid from afar, but without having access to the connection. Furthermore, with the daily increase in the world’s population, there will be an increase in electricity demanded for basic need. If there is no expansion of the existing grid, without a doubt, the rate of congestion on the grid will result in many unusual occurrences on the grid, therefore, affecting consumer loads. If another means of electricity generation is not considered, communities that are very far from the grid connection will not have access to electricity for life. Thinking of this challenge, several methods of local energy generation come into play. Formerly centralized energy generation becomes decentralized technologies with the aid of a different kind of generation unit, otherwise known as the microgrid [11]. The electricity grid system is definitely not based on the size or name given to it, but by the function under which they operate. Macro-grid or mega-grid systems, also referred to as the conventional grid, involve centralized methods of power generation, while the microgrid is a single grid system and a fragment of the macro-grid, usually featuring distributed generation with smart management. A microgrid can be structured with a combination of renewable sources, storage system and conventional means of energy generation. Renewable options may include wind, solar, geothermal, tidal, biomass and small hydro, while the storage system may be a connection of batteries in series/parallel and conventional methods, such as a generator powered by fuel or diesel. The microgrid can be integrated into the national grid at a low voltage level or medium voltage level (grid tied) with the aid of a converter/inverter system, and it can be operated in isolated mode. An Energy Management Scheme (EMS) can be incorporated into the modern microgrid for optimal performance, fast response, self-healing from grid disturbance and optimization. The types of power structure and the loads with which they adapt and derive their electrical energy from govern the microgrid [12]. The microgrid can supply power to industries, communities or district facilities due to its reliability and competitiveness as compared to the centralized power method of generation.
The purpose of the microgrid should be considered from a reliability standpoint, that a community, organization, industry or data farm can enjoy a reliable energy supply, and that, where outages may be exceedingly costly, these groups can continue to make profits, sustain economic activities, reduce environmental pollution produced by conventional energy methods of power generation and enjoy unlimited energy generation from renewable energy sources. A microgrid consists of renewable energy sources, combined heat and power generation and fuel cell and energy storage systems integrated to supply loads. The capacity can be between 200 kW and 900 kW. Microgrids, mini-grids, nano-grids and pico-grids are interrelated, and the source of energy generation for all of them is from locally produced, renewable energy. Mini-grid: The mini-grid can be described as locally generated renewable energy such as solar or wind, which can be independently operated or/and exchanged with power from the main grid (it can be between 5 kW and 200 kW), which can be significant where access to the national grid does not exist. The mini-grid can provide electricity to shops, houses, community health centers, streetlights and boreholes. Nano-grid: The nano-grid describes a source of locally generated renewable energy that is typically less productive than a mini-grid, and which can be a standalone wind or solar system that supplies power at a limited capacity, or where a home, small building or shop is powered by an independent wind or photovoltaic system. It can also be referred to as a building level circuit. It exists where there is no microgrid or mini-grid system and locals cannot afford major grid connection fees. It helps to keep day to day home activities, such as a dishwasher, drier and vacuum cleaner, running. The capacity can be between 10 W and 500 W. Pico-grid: The pico-grid refers to a method of local power generation from renewable source to power a very small load, such as telemetry or charging a phone set. It is a self-sufficient and small power supply system capable of providing adequate electricity for a minimal load. It is a simple technology, affordable and easier to implement. It makes daily household routine tasks run without connection to the nano-grid or microgrid system. The capacity can be less 20 W. Examples of non-linear loads that can be connected at PCC and microgrid are arcing devices, electric arc furnaces, induction furnaces, variable speed drives, frequency speed drives, etc. They produce higher order harmonics such as second, third, fourth, fifth, sixth and seventh [13], and commercial/residential loads such as office equipment (PCs, photocopy machines, fax machines, etc.) and household appliances (television sets, microwave ovens, fluorescent lighting, UPSs, etc.) can also generate third harmonics.

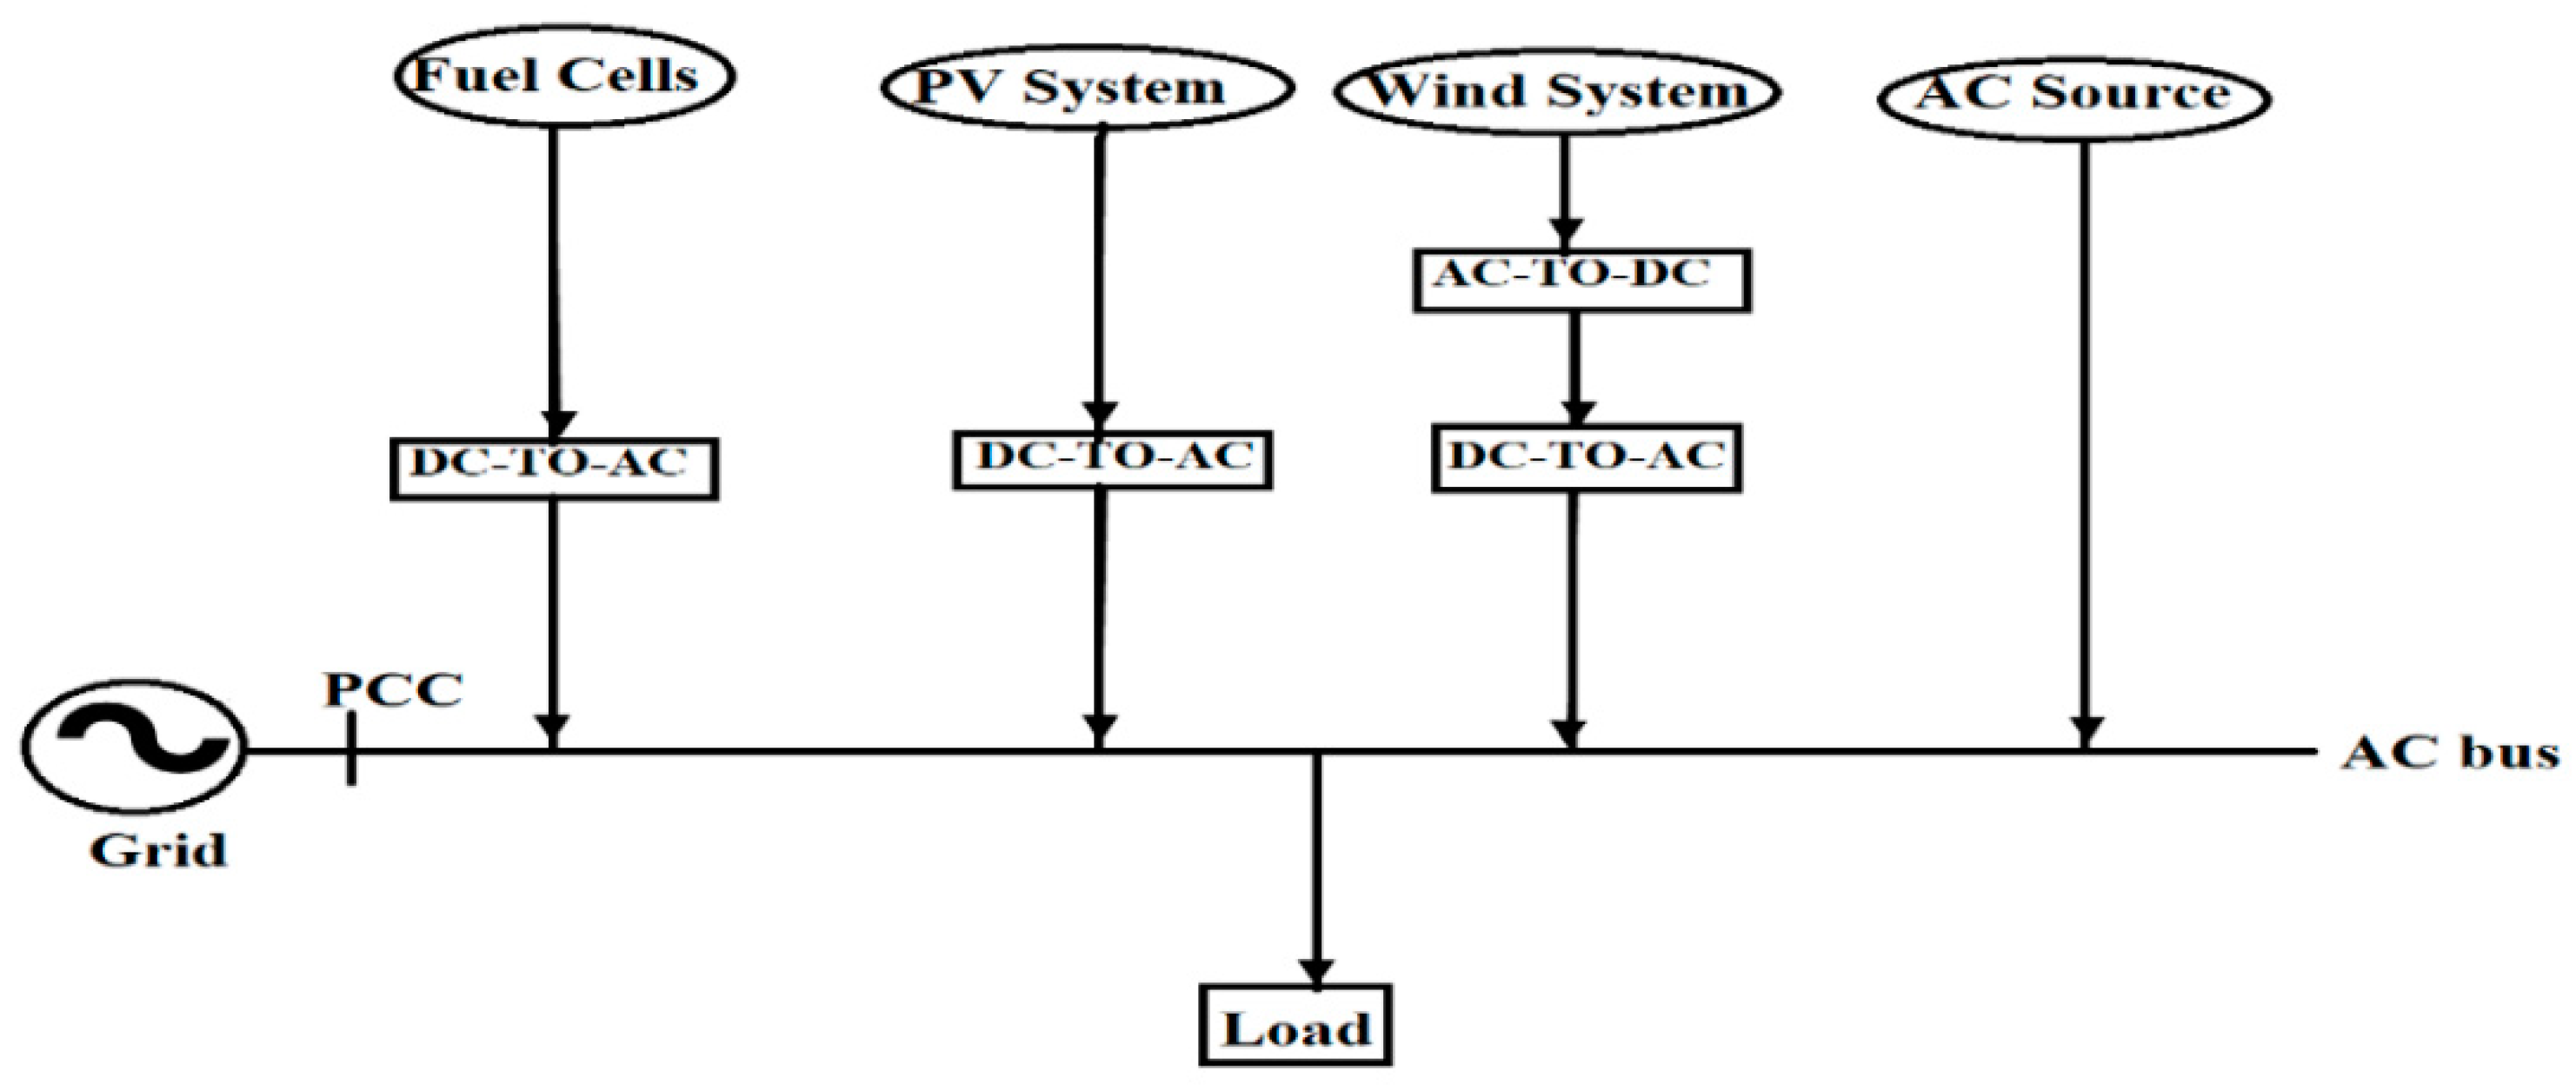
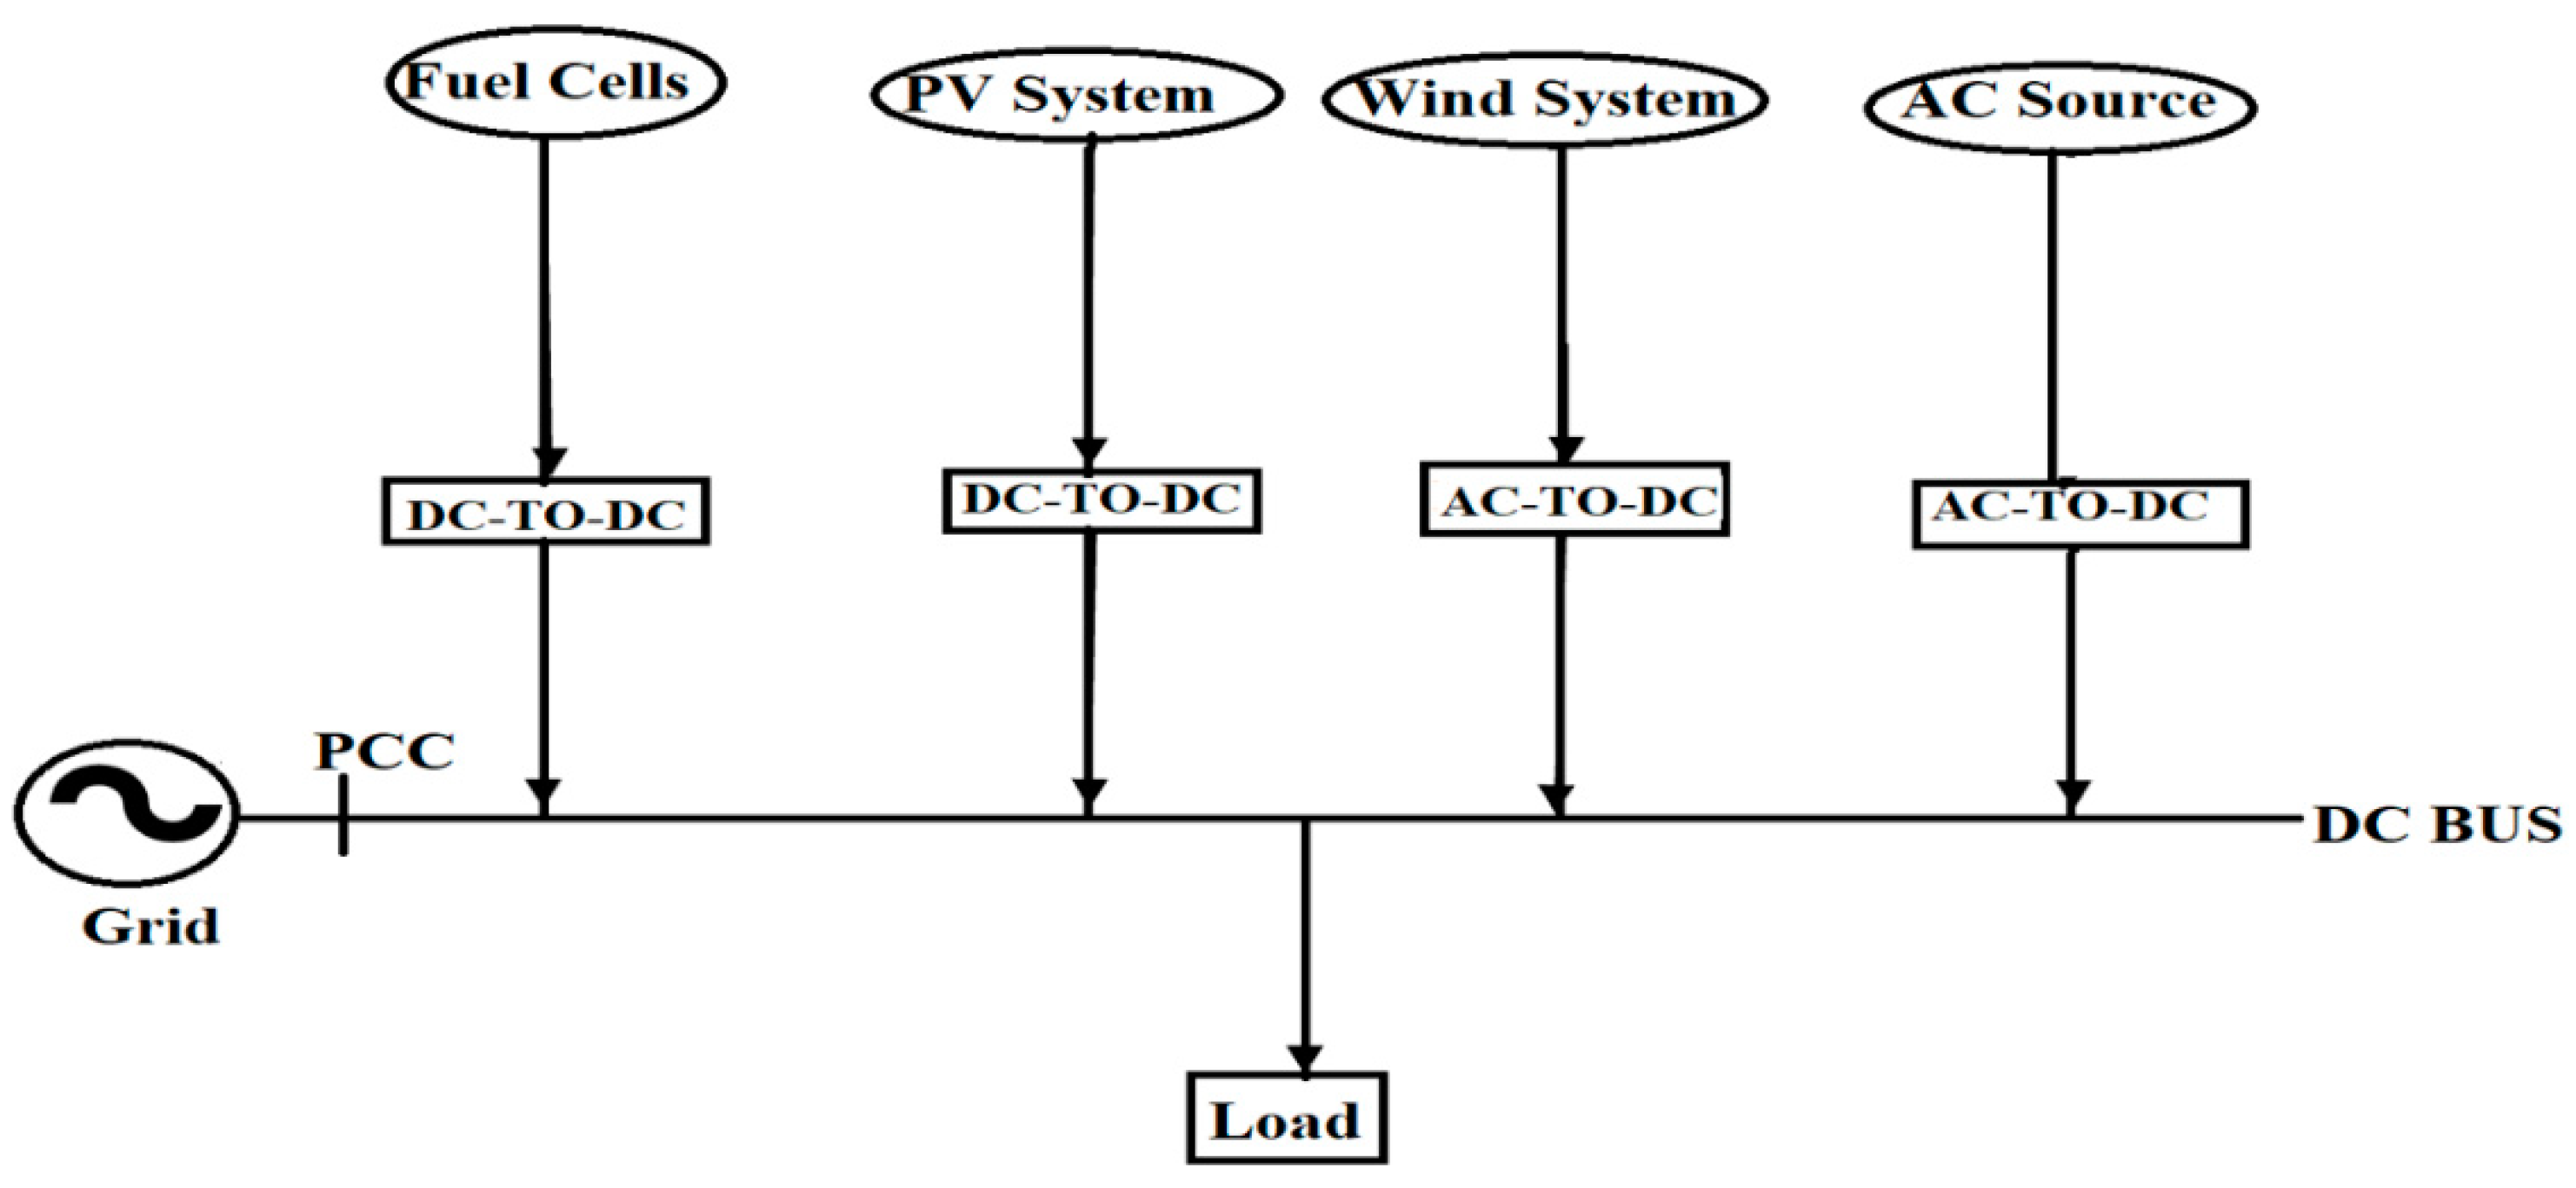
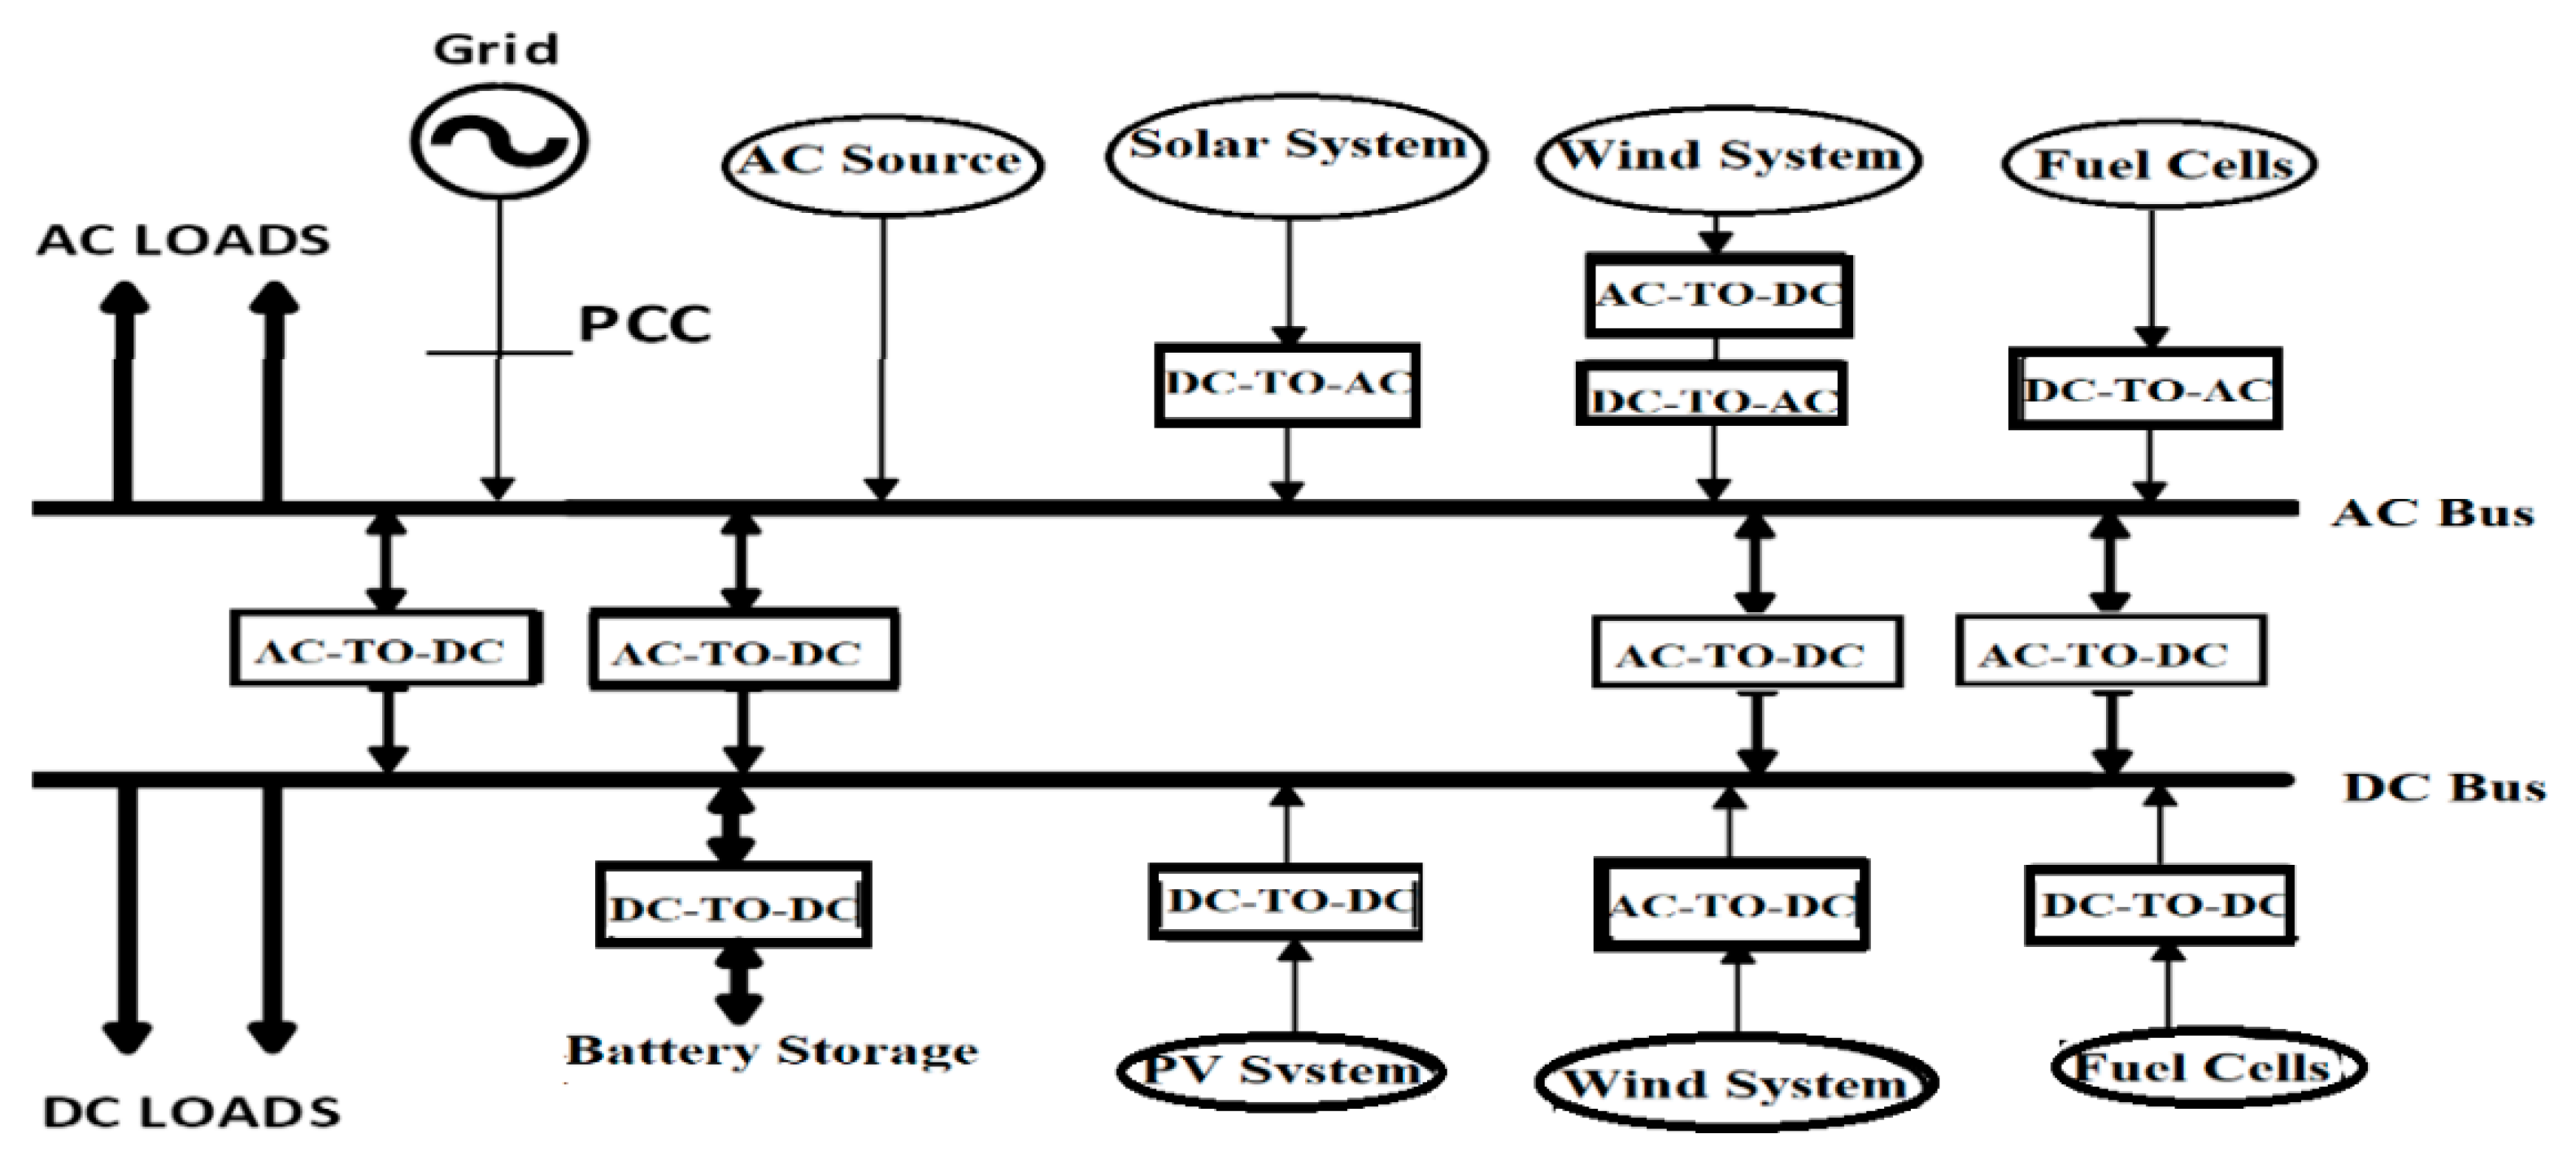
2.2. Microgrid Types

Different types of microgrids include the alternating current (AC) type, direct current (DC) type and hybrid type.
AC Type: the microgrid connects the load either directly to the AC bus bar or by means of a converter depending on the types of electrical energy they produce or consume, as shown in Figure 1. The operating voltage, the frequency, and the phase/phases, either single, double or three-phase, are considered in the AC type microgrid.
DC Type: the microgrid connects the load directly to the DC bus bar or by means of a converter (DC-DC converter). Since there are different levels of DC voltage output in renewable energy sources and battery storage systems, power electronic converters are needed to integrate all the renewable energy sources depending on the types of electrical energy they produce or consume, as depicted in Figure 2. DC microgrids possess the advantage of unidirectional power flow with a converter connected in the system; thus, power flow control is easier. The direction of voltage, current and power are closely interrelated and there is a higher possibility of network reliability and less losses generated in the system. The DC type microgrid system can be made up of a renewable energy source (PV, wind, fuel cell), load and battery storage system.
Hybrid Type: this microgrid/advance microgrid exhibits the features of both the AC and DC microgrid. Conversion to electrical energy is easier due to the presence of power electronic converters in the AC and DC buses of the system, as depicted in Figure 3. Hybrid microgrids consist of different kind of loads, and the battery storage depends on the type of energy they draw or generate [14]. The composition of this microgrid can be grouped into renewable energy sources (such as wind, solar, small hydro, etc.), energy storage system (such as lead acid battery or lithium battery), fuel generating set (such as a gasoline or diesel generator), loads (such residential or industrial load) and the power grid (such as off grid or on the grid). It is expected that microgrids should be safe, more reliable and the energy generated should be affordable.

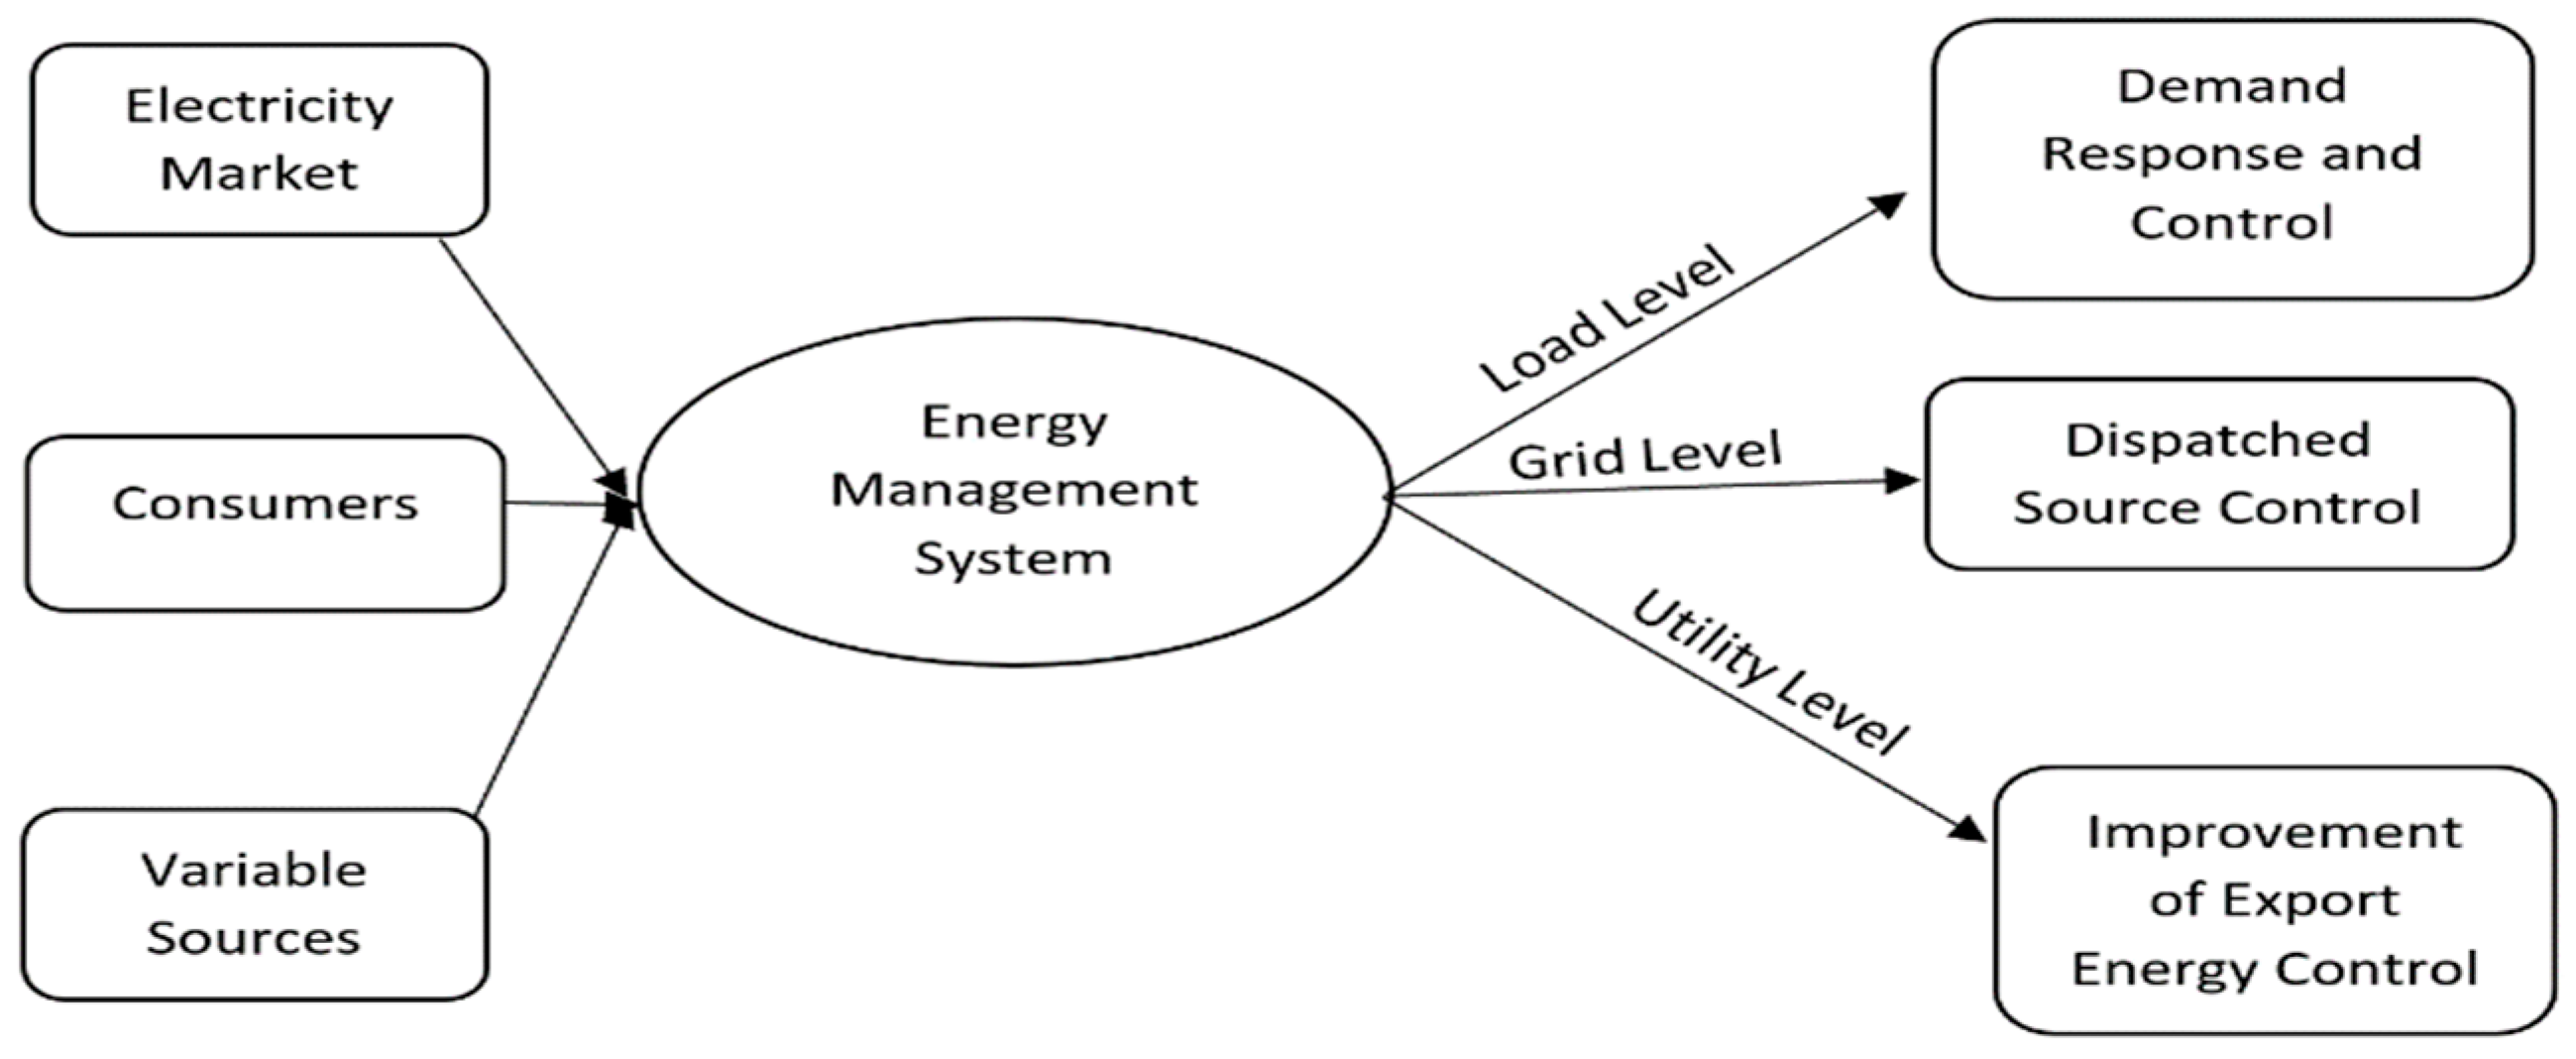
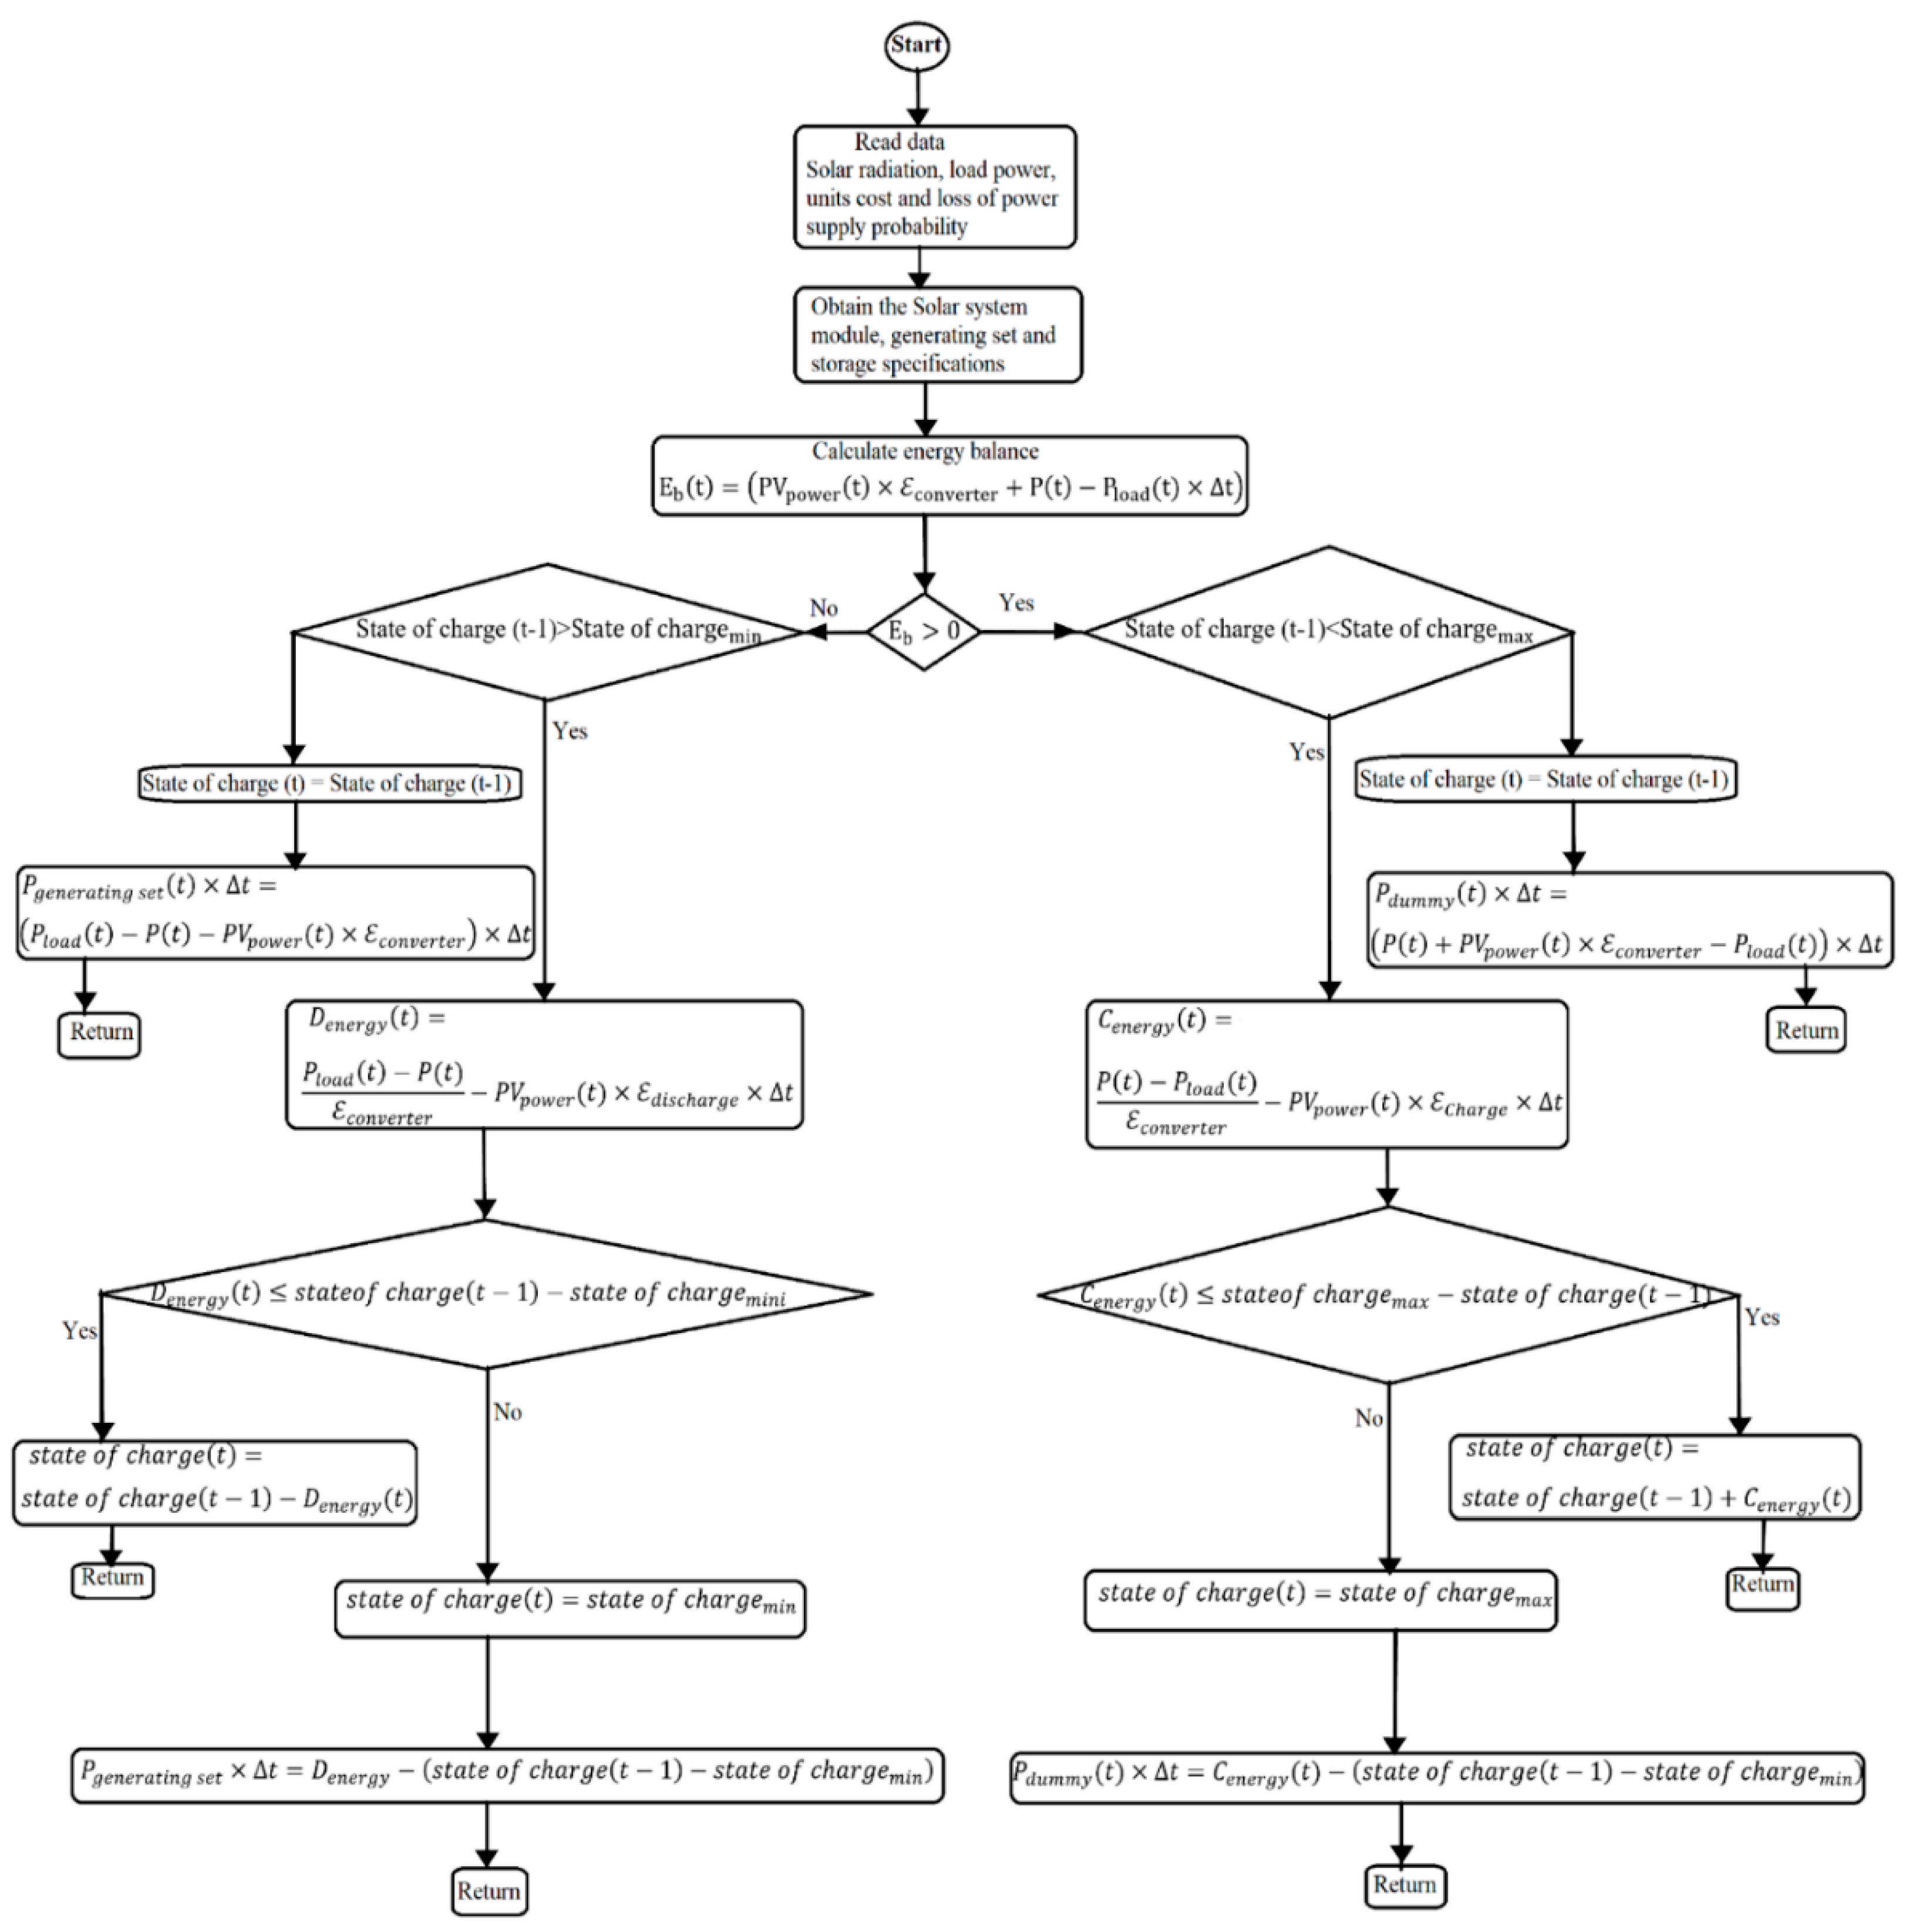
2.3. Energy Management Scheme for Microgrid

The EMS within the microgrid system provides the rate at which the system is smart and reliable. For a system to be smart, the measurement capability should be present, a communication strategy should be in place, the rate of load-energy consumption prioritization should be assured and the flow of power across load buses should be easily monitored. EMS will play a critical role in the modern micro-smart grid system [15]. The EMS is critical, especially when the microgrid is not connected to the main grid system, due to the fact that there will be more than a source of energy generation with a different power capacity integrated together and the system may not have a dominant infinite bus. Some microgrid systems may not possess power electronic converters for an extremely fast response for voltage and power angle stability. Therefore, the EMS is of great importance in the microgrid system. As shown in Figure 4, the EMS accesses the latest forecasted data from the generating source, the consumers and the market information to manage the consumption level of the national grid system, distributed source and the consumers.
EMS provides a real and active power allocation strategy between renewable and non-renewable energy sources, to manage microgrid disturbances, discover the energy set point of the distributed sources and allow the microgrid to synchronize to the national grid system if need be. The national grid is supposed to adapt to variations in the active and reactive power supply and to consumers of the microgrid by controlling each power generated from distributed sources: real, active power buses, real power and voltage buses. However, when the microgrid is not integrated into the national grid, the overall energy generated should take care of the consumer load demand; otherwise, shedding of the demanded consumer loads in order to match energy production will be inevitable. To reduce the effect of dynamic behaviours of the microgrid, such as oscillation, harmonic and transient, a simple but active control strategy may be essential. Microgrid EMS should be capable of controlling the load profile of its consumers, synchronizing with the national grid, operating within an acceptable power quality requirement and maintaining stability during grid disturbance.

2.4. Microgrid Power Management Approach

The microgrid’s management with battery storage and solar system integration involves a sound control strategy to enhance power quality operations in agreement with IEEE-519, especially when no linear loads are connected to the network [16,17]. In a microgrid system, when the system is in stand-alone mode, i.e., when the consumption charges require more energy than the energy produced by the solar system, the storage of the microgrid would be in its discharge mode. Equation (1) can be used to access the energy flow into the system. If the combination of the microgrid storage and the solar system cannot meet up with the power demanded, the shortfall in power may be compensated for by the small generating set connected to the system. The generating set’s connection to the microgrid can be obtained from Equation (2). By charging the battery storage to the highest level, the solar power generated would be dumped and the dummy load power consumed can be obtained in Equation (3), while the flow chart of the microgrid system is presented in Figure 5.
P l o a d ( t ) × Δ t = P ( t ) × Δ t + ( P V p o w e r ( t ) × Δ t + D e n e r g y ( t ) ) × 𝓔 c o n v e r t e r  
P g e n e r a t i n g   s e t × Δ t = P ( t ) × Δ t + ( P V p o w e r ( t ) × Δ t C e n e r g y ( t ) × 𝓔 c o n v e r t e r )  
P d u m m y   l o a d ( t ) × Δ t = ( P ( t ) P l o a d ( t ) ) × Δ t + ( P V p o w e r ( t ) × Δ t C e n e r g y ( t ) ) × 𝓔 c o n v e r t e r  

2.5. Grid Code Management

The grid code provides the technical requirements for RDG’s integration to DN to ensure monitoring and control of power quality challenges at PCC. Since the power flows are bidirectional with integration of RDG, the code specifies the RDG parameters that must be met when connecting to national grid. It usually differs significantly from country to country, because they each understand the nature of their own power generation characteristics and network. These parameters are usually concerning voltage levels, normal/critical frequency variation with intervals and requirements to generate units, and sometimes, the national regulatory frameworks are subject to continuous changes and revisions. Southern Africa’s grid code requirement for RDG connection at PCC is in the range of −15% to +10% around the nominal voltage [18]; IEEE-1547-2013 gives compulsory obligations for the interconnection of RDG with electric power systems, that RDG should be disconnected with higher/lower variation in voltage at PCC, while IEEE-2018 provides an option for voltage regulation capacity at PCC ± 5% [16].

3. Modeling of Solar, Battery and Solar Power Tracking

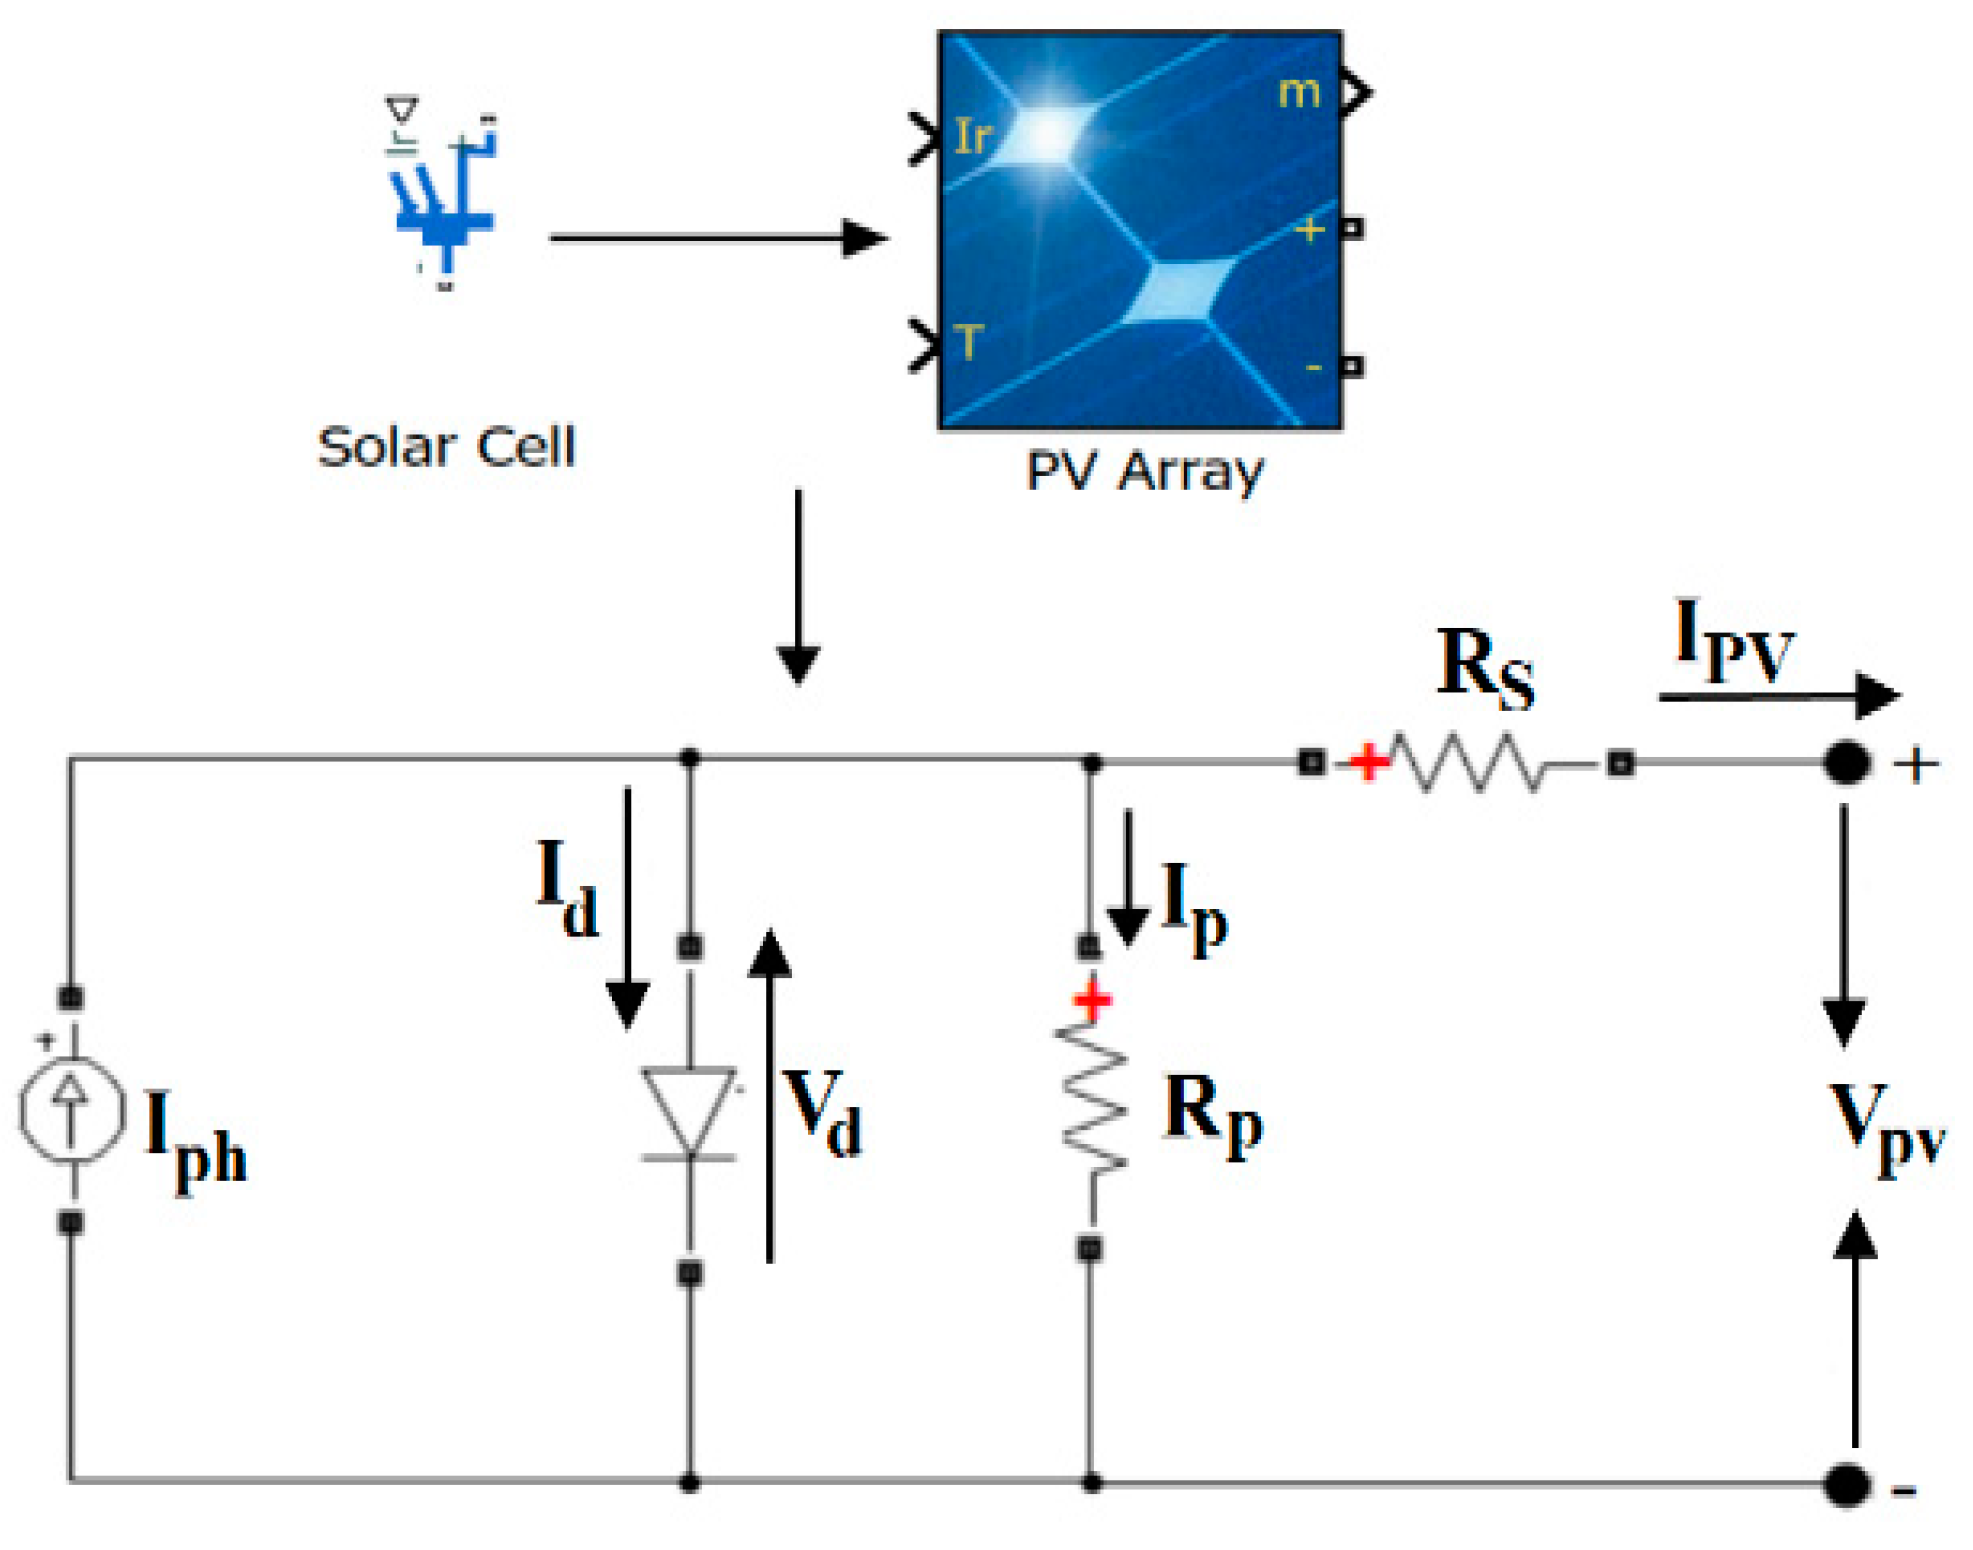
3.1. Solar System Modelling

A typical solar cell is made of semiconductor materials, usually p–n semiconductor diodes having a negative side facing the sun and a positive back side. Solar cell representation in MATLAB/Simulink, solar array and equivalent circuit are shown in Figure 6 The solar photovoltaic system involves the conversion of photonic energy to electrical energy, but with changing temperatures and climatic factors, the solar output voltage may vary [19].
Irrespective of the electrical analysis, the solar panels are modelled as a constant current source. Two or more solar cells connected together in series/parallel and arranged in a frame form a solar panel or module, while groups of solar panels make a solar array. Considering the equivalent solar cell diagram in Figure 6, the solar cell current is represented by ( I P V ) , solar cell voltage ( V P V ) , the photo current ( I p h ) , a series resistor ( R s ) and shunt resistor ( R p ) . The current across the diode ( I d ) , ( I p ) is the current across the shunt resistor and ( V d ) is for diode voltage. The solar current expression can be obtained in Equation (4). From Equation (5), (q) is the quantity of electron charge ( 1.6 × 10 19 C ), (A) is the ideality factor of the diode, (K) is the Boltzmann’s constant ( 1.38 × 10 23 J K ) , (T) is the operating temperature and ( I S ) is the diode saturation current, or dark current. The increase in the irradiation of the solar system will result in the increase in the solar voltage and power. The temperature increase can, consequently, have a negative impact on the output voltage and power [20].
( I P V ) = I p h I d I p  
I p v = { I p h I S ( e q [ V P V + R S I P V ] A K T N S E ) 1 } ( R S I P V + V P V ) R P N S E  

3.2. Battery Modelling

Solar system irradiations are not stable due to climate factors [21,22,23,24]; thus, battery banks are vital in maintaining a continuous power delivery to the consumers. It is relevant to note that the state of charge of any battery storage in a microgrid system will determine the limit of such battery storage. To determine how massive the microgrid system’s battery storage will be, the depth of discharge, ambient temperature, battery storage life and the capacity are critical determining factors [25,26,27,28,29]. When the microgrid battery storage is in the charging mode, the Equation (6) can be obtained. Therefore, the rate of charge RC(t) can be defined in Equation (7), while Equation (8) describes microgrid battery storage when discharging. Rate of discharge ( R D ( t ) ) can be obtained in Equation (9).
C e n e r g y ( t ) = ( P ( t ) P l o a d ( t ) 𝓔 c o n v e r t e r + P V p o w e r ( t ) ) × Δ t × 𝓔 c h a r g i n g  
R C ( t ) = R C ( t 1 ) ( 1 ) + C e n e r g y ( t )  
D e n e r g y = ( P l o a d ( t ) P ( t ) 𝓔 c o n v e r t e r P V p o w e r ( t ) ) × Δ t × 𝓔 d i s c h a r g i n g  
R D ( t ) = R D ( t 1 ) ( 1 ) D e n e r g y  

3.3. Solar Power Tracking

When the efficiency of solar cells is low and the power output must be at the maximum possible level, regardless of any other factors, there is a need for the highest solar power tracking. PPPT of a solar system is the method by which devices connected to the microgrid, such as the microgrid inverter system, solar charger controller, etc., track peak power at the point where solar cells deliver the highest electrical energy [30] PPPT systems analyse the solar cells’ output power and determine when load should be connected to achieve maximum power in respect of environmental factors such as change in load impedance and weather condition. PPPT quickly and accurately tracks power and reduces oscillations, and the control strategy depends on the voltage, current and the duty cycle [31,32,33,34,35]. Each solar panel possesses an operating point that is constant at some point from where peak power is delivered. Three methods are concentrated here, by which the PPPT of solar system can be achieved: perturb and observe strategy, incremental conductance and fuzzy logic method. The relationship between output current ( I 0 ) and input power ( P i n ) with duty circle (D) is depicted in Figure 7. Let the efficiency of the proposed microgrid be ( ) and the derivative of power to the voltage of the solar system be ( d P d V ) , which is used as tracking consideration. The power input is ( P i n ) , voltage input is ( V i n )   ( I 0 ) and ( V L ) are the load current and load voltage while (D) is the duty cycle. PPPT will be at the highest point in the Equation (11). When the proposed circuit efficiency is considered, the power from the solar panel can be obtained in Equation (12) while the input voltage can be obtained in Equation (13), by substituting Equation (13) into Equation (11) to obtain Equation (16). Therefore, at PPPT in Equation (17), when peak power point is obtained in Equation (11), then Equation (16) is valid. By considering Equation (17), when ( d I 0 d D ) is tracked, the solar system peak power point can also be tracked. When the loads connected to the network are resistive in nature, input power can be obtained in Equation (19). At PPP, Equation (22) will be zero, which will also produce Equation (23) at D = D P P P . For the resistive load connected to the system, tracking of zero slope at PPP is also valid.
s i n 0 0 = 0
( d P i n d V i n ) = s i n 0 0 = 0  
P i n = I 0 V L 𝓔 r
V i n = V L D  
d P i n d V i n = V L 𝓔 d I 0 d V i n  
= V L 𝓔 d I 0 d D . d D d V i n = V L 𝓔 d I 0 d D . ( V L V i n 2 )  
= V L 2 V i n 2 . 𝓔 . d I 0 d D
V = V P P P
d I 0 d V i n = 0   a t   D = D P P P = V L V P P P  
P i n = I 0 2 . R 𝓔  
d P i n d V i n = 2 I 0 R 𝓔 . d I 0 d V i n  
= 2 I 0 . R 𝓔 . V i n 2 d I 0 d D  
d I o u t d V i n = 0  
PPP is highest when
( d P i n d V i n ) = s i n 0 0 = 0

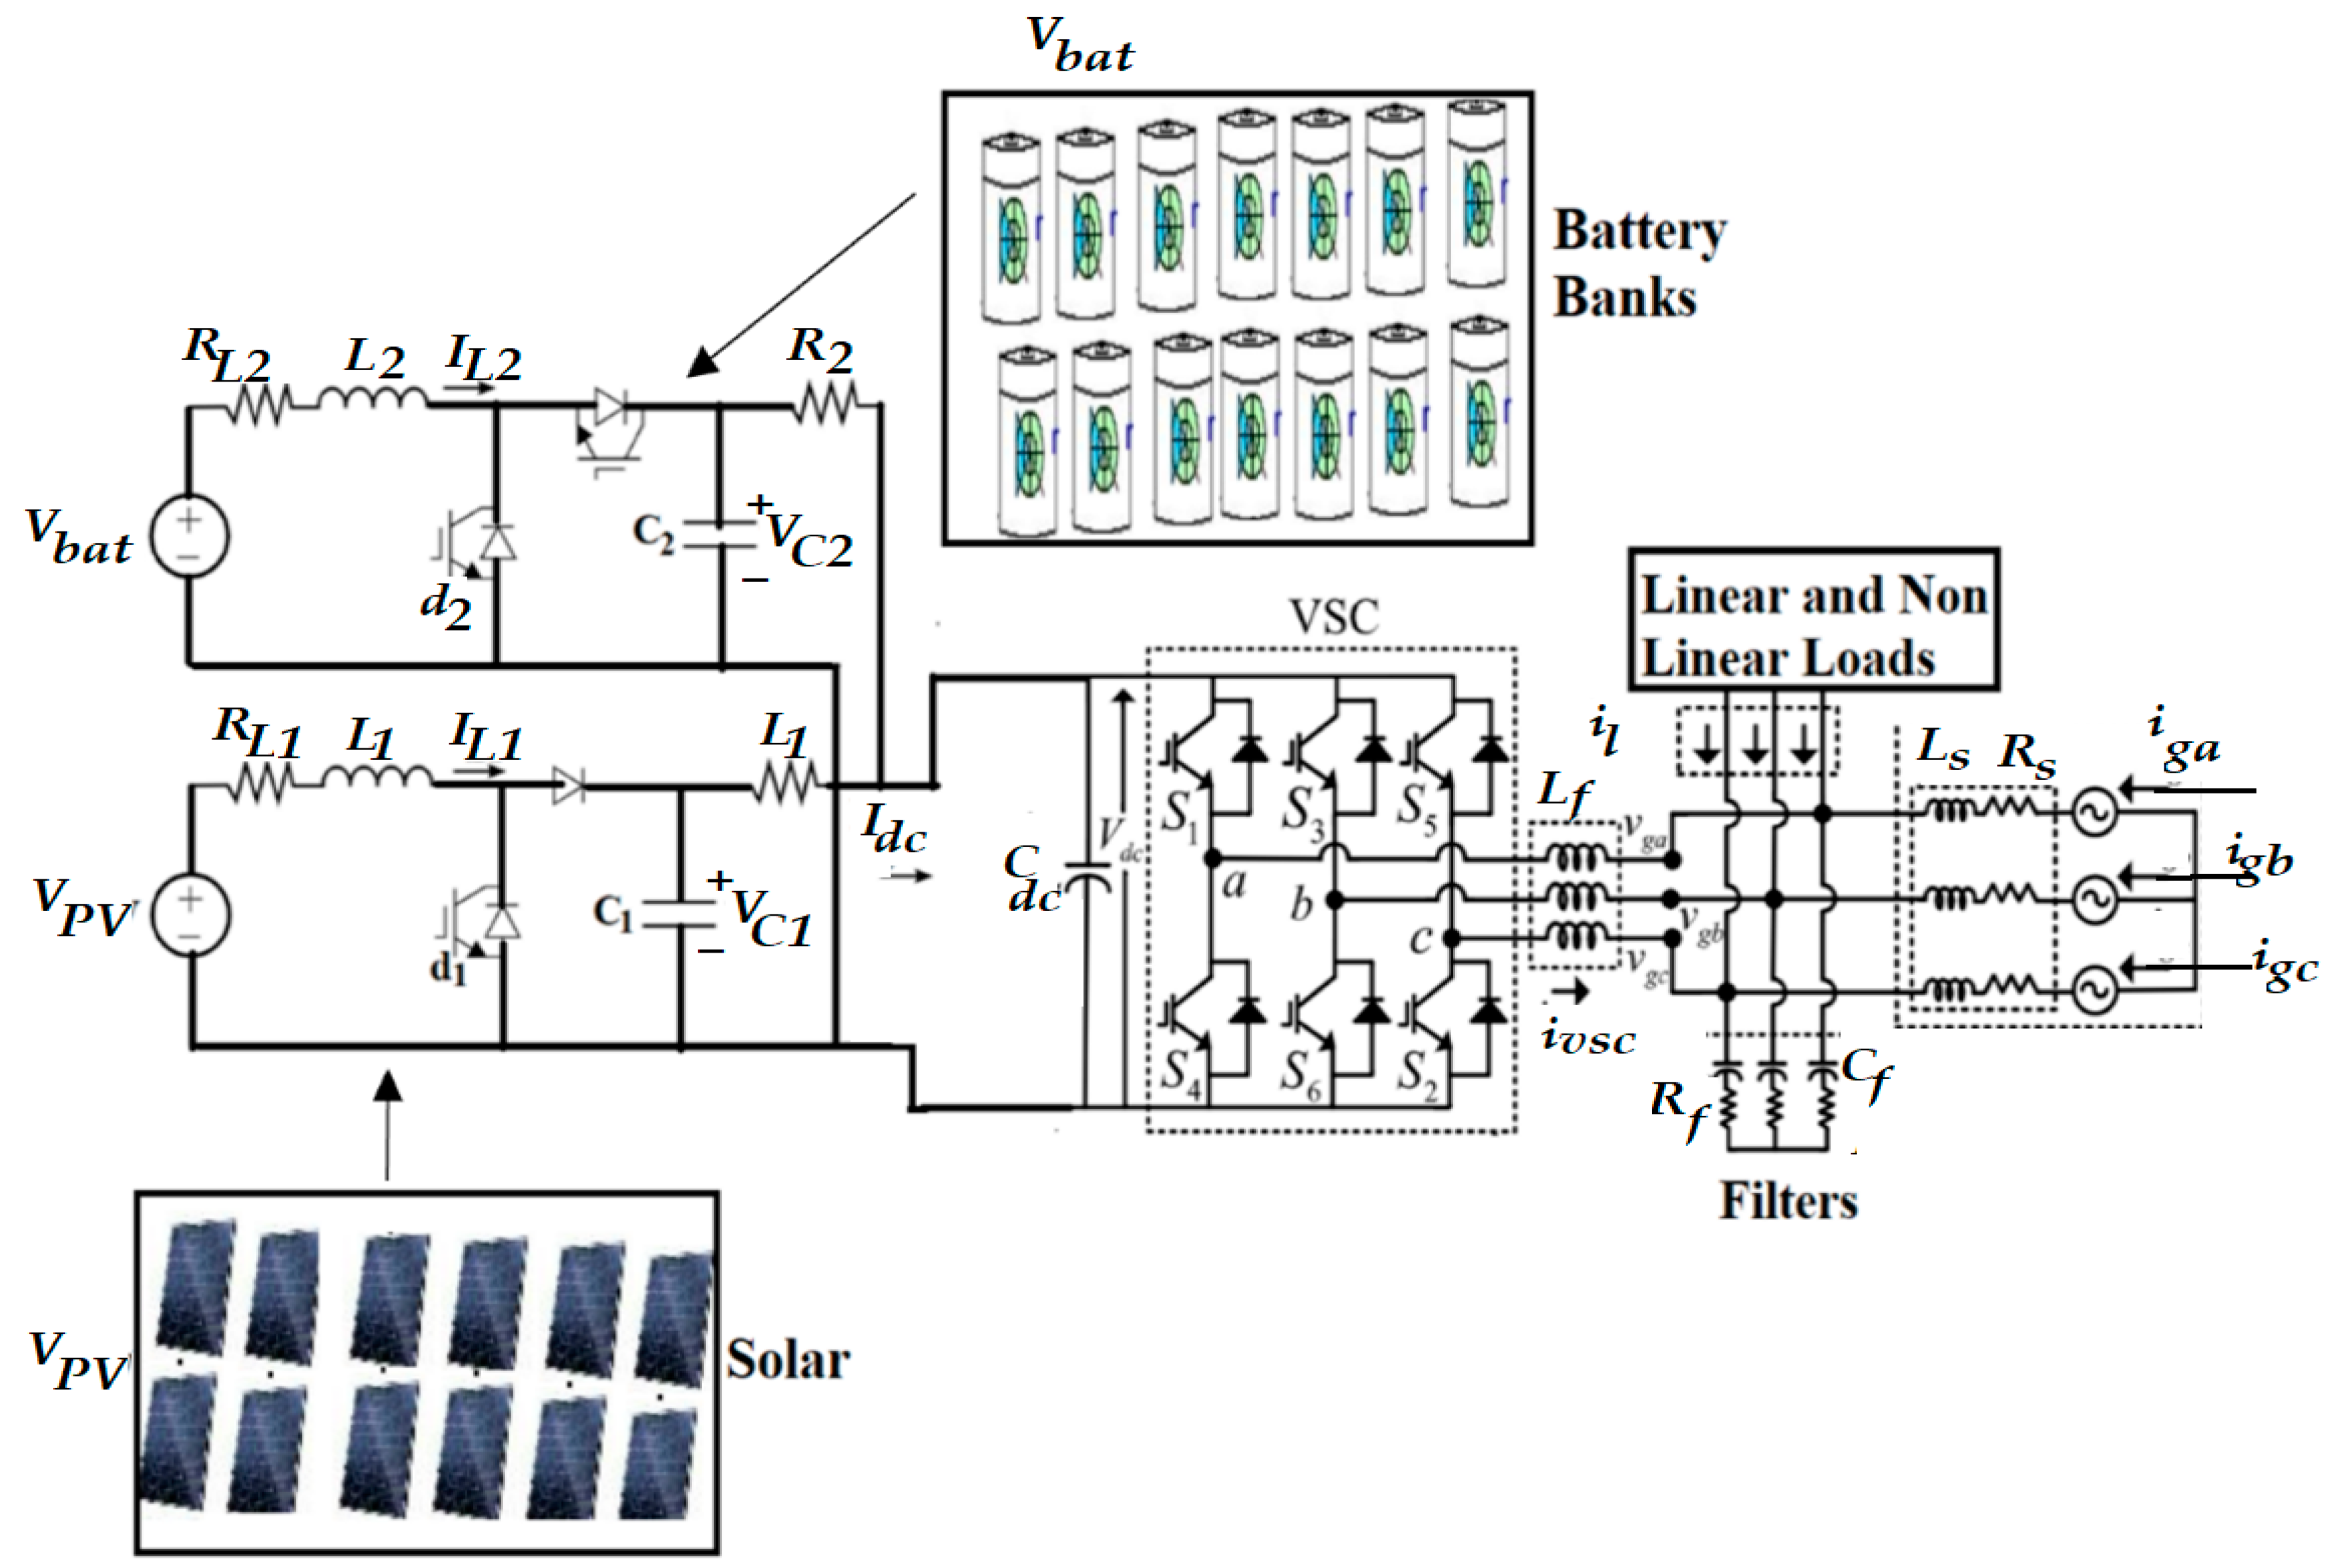
4. Method and Test System Description

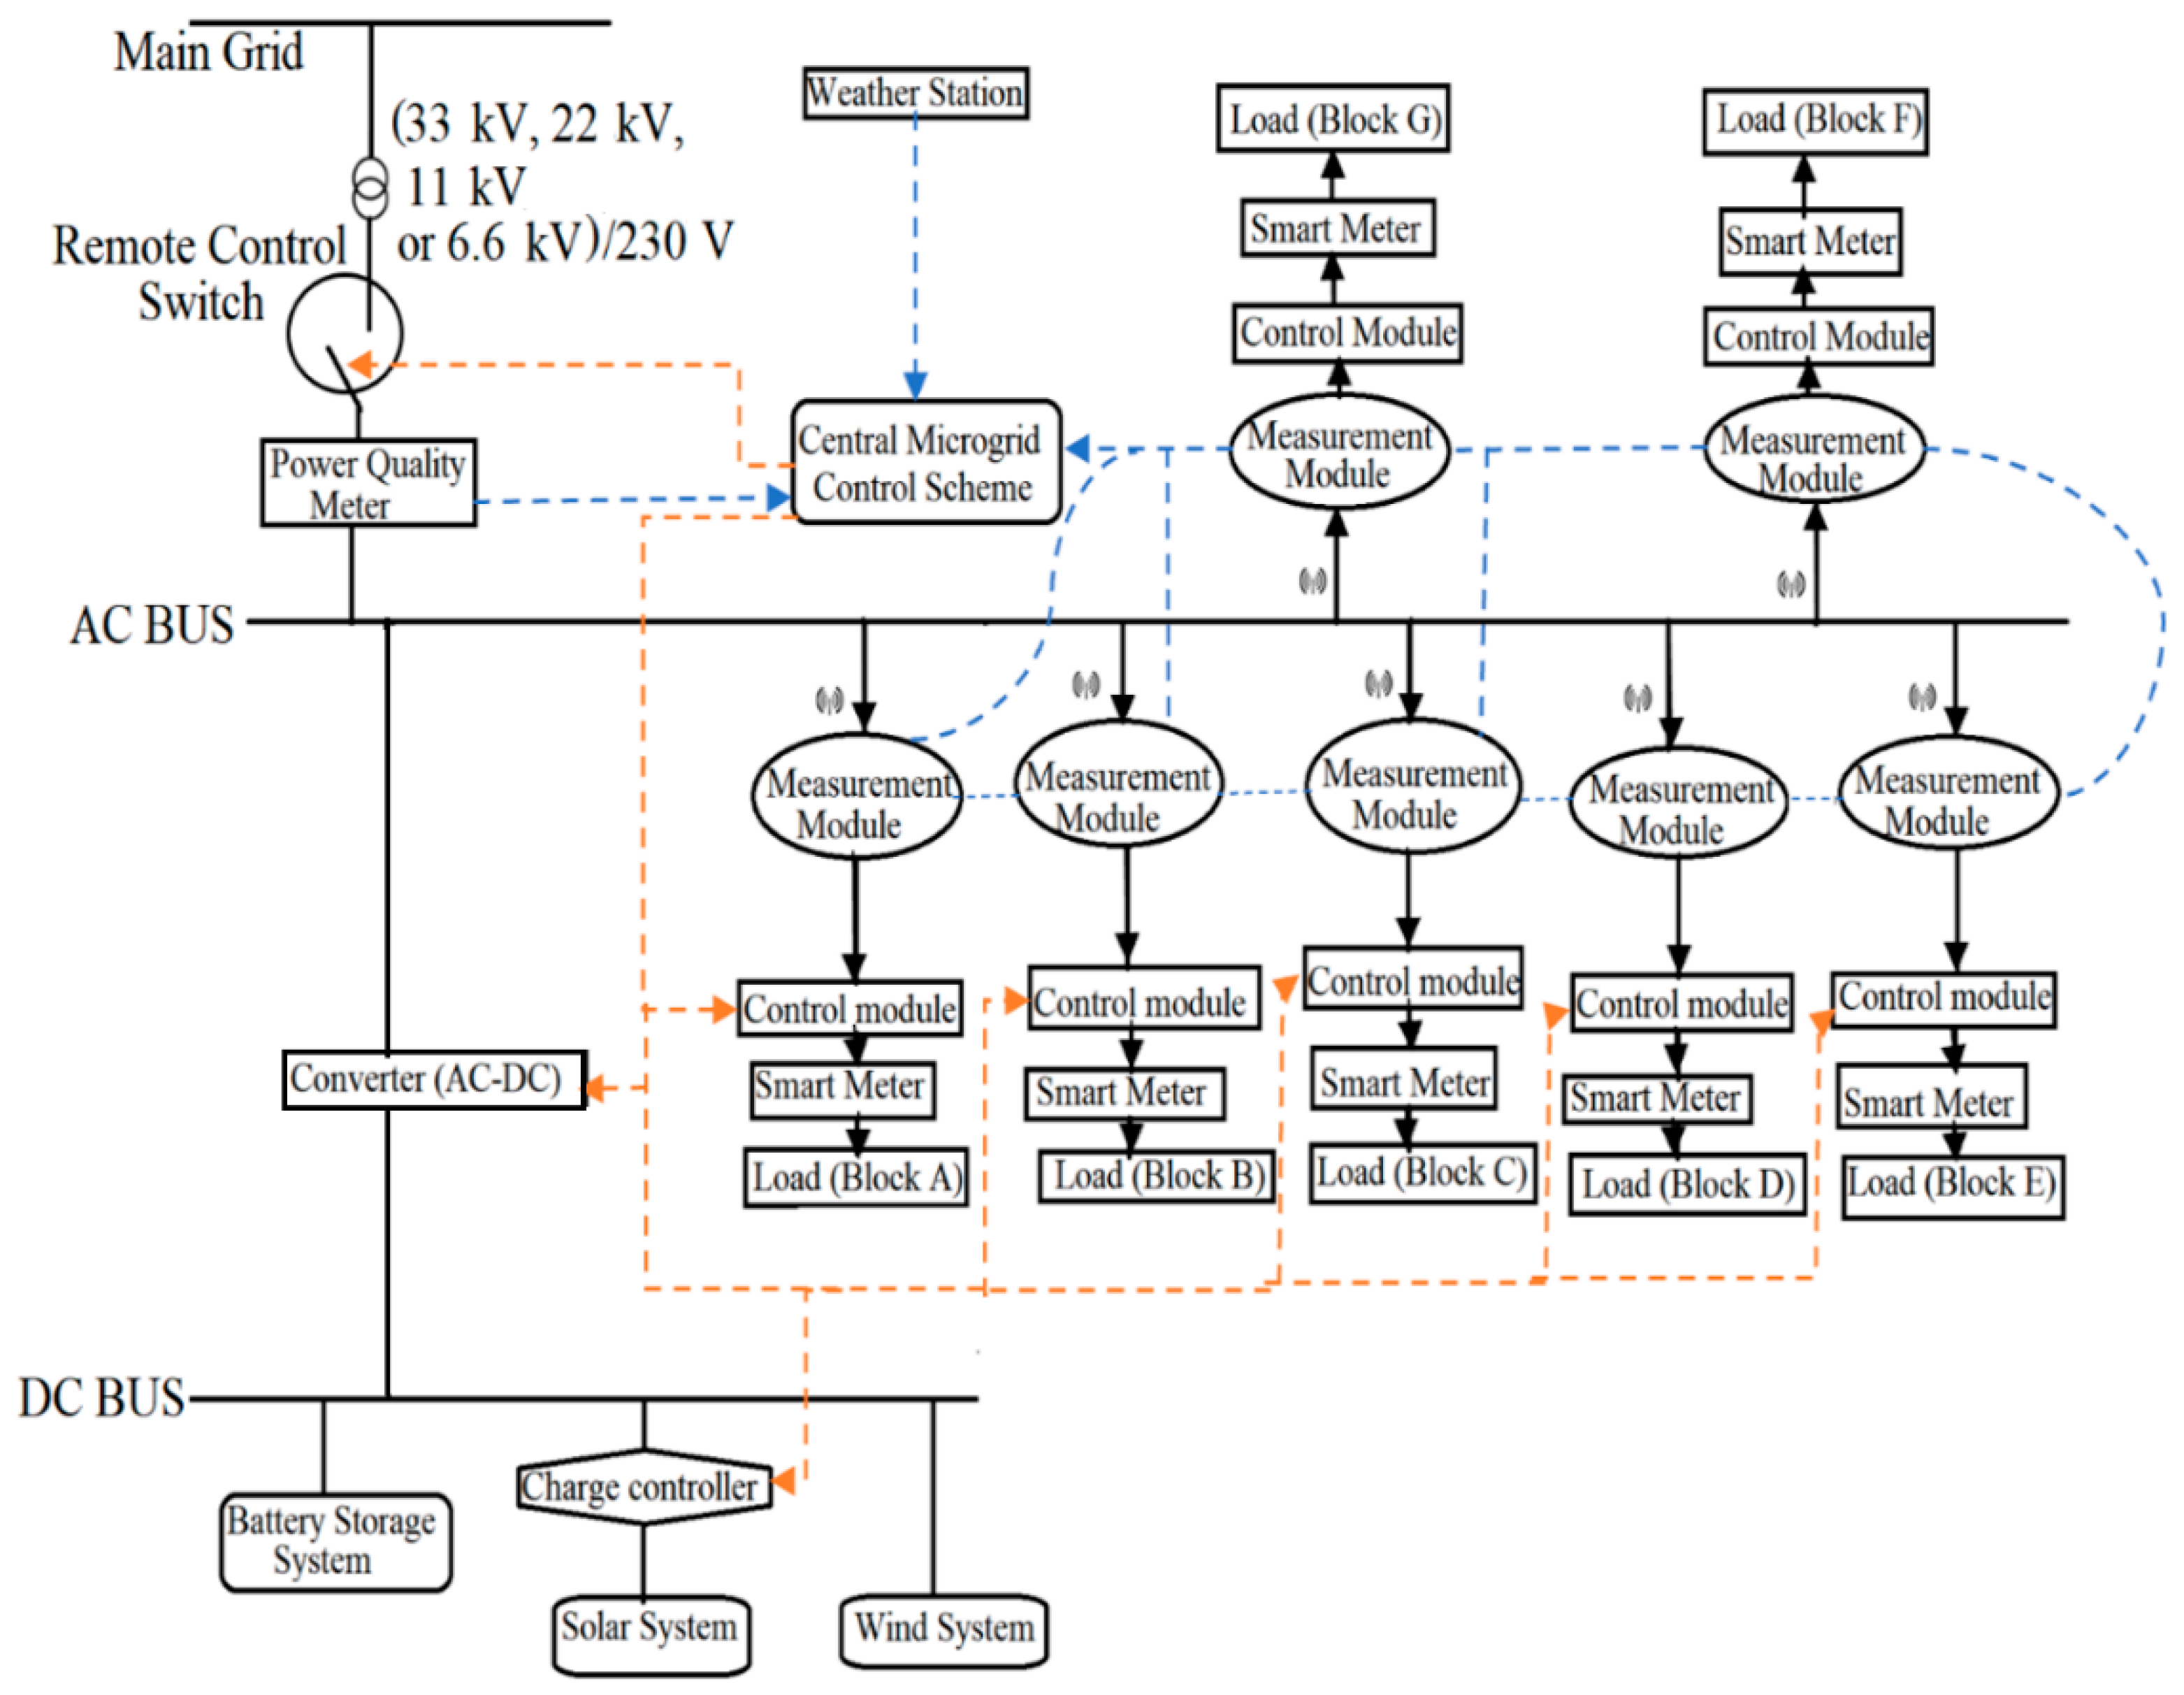
4.1. Proposed Microgrid System for Durban University of Technology Steve Biko Campus

Durban University Technology (DUT) consists of approximately 33,000 students located in the beautiful cities of Durban and Pietermaritzburg (PMB) of KwaZulu-Natal (KZN) province. The DUT is divided into seven campuses spread across Durban. The seven campuses are ML Sultan, Steve Biko, Brickfield, Ritson, City Campus, Riverside and Indumiso Campus. This proposed microgrid system is limited to the Steve Biko campus and it is part of a Research and Development (R&D) project for the institution. The Steve Biko campus shall be grouped into seven blocks where they act as consumers or loads. Block A will comprise A1–A6, Block B shall be S2–S11, Block C shall be Alan Pittendrigh Library and lecture venue, Block D is D1–D4, Block E is Residence (D5, E, J, K, L, N, O, and Q), Block F is (F1, G1, G2, H, M, P) and Block G shall be a Health Clinic. The alphabets A, B, …., G mentioned here are assumed to be loads. The proposed project consists of solar systems integrated together with the aid of a converter such as a Voltage Source Converter (VSC) in a DN as depicted in Figure 8. The solar is counted as a non-controllable element while the battery storage system shall be regulated with respect to the algorithm optimization across the remote-control switch and power electronic converter. The proposed microgrid shall be integration of solar (PVAs), which is why the storage system is not considered in this paper and a smart meter is connected to the loads. Real time remote monitoring of electrical signal shall be part of the control strategy with a telecommunication facility, and forecasting will be carried out by weather station for proper control and monitoring. The purpose of the project is to consistently provide uninterrupted power supply to the Steve Biko campus, improving the power quality supply to the campus, power factor improvement, reactive power control and voltage rise regulation at PCC.

4.2. Description of the Proposed System

The circuit in Figure 9 depicts the proposed schematic microgrid for the DUT. The power conversion of the circuit is divided into two stages of conversion, such that the first stage is direct current to direct current (DC-DC) while the other stage is direct current to alternating current (DC-AC). The orange arrows represent the microgrid controller signals, the signal from the substation to the microg srid and vice versa in case there is no power supply from the substation, while the green arrows represent the power quality measurement signal that compare microgrid measured parameters to that of the substation for improvement and reading. The small antenna shape represents wireless signal communication between the measuring devices. In the DC-DC stage of the system, a boost converter is employed to boost the PVA’s voltage output while the incremental conductance plus PI controller extracts the highest power from the solar array. Hence, the general power and voltage are strengthened and regulated at the PCC as specified by IEEE-1547 and by the Southern Africa grid code requirement to ensure continuous operation of the PVAs, which is the second stage of the conversion (DC-AC). The harmonics produced by the Pulse Width Modulation (PWM) of the (VSC) are attenuated by the inductor ( L f ) , and the installed in-loop filtering circuit eliminates high frequency distortions at the PCC before power flows to the grid. The solar system is connected to the direct current (DC) bus through the power electronic converter. The equivalent circuit of the proposed microgrid is depicted in Figure 10, where:
The mathematical representations of the solar system and the battery storage system are given from Equations (24) to (27), while Equations (28) through (29) express the integration of solar and storage systems using a power electronic converter device. The equation parameters are defined thus:
d I L 1 d t = V p v L 1 R L 1 L 1 I L 1 V c 1 L 1 ( 1 d 1 )  
d V C 1 d t = V d c R 1 C 1 V C 1 R 1 C 1 I L 1 I L 1 C 1 ( 1 d 1 )  
d I L 2 d t = V b a t L 2 R L 2 L 2 I L 2 V c 2 L 2 ( 1 d 2 )  
d V C 2 d t = V d c R 2 C 2 V C 2 R 2 C 2 I L 2 I L 2 C 2 ( 1 d 2 )  
d I d d t R L L L I d + ω I q + V C 17 2 L L m d V d L L  
d I q d t = R L L L I q ω I d + V C 17 2 L L m q V q L L  
d V d c d t = 2 C d c [ 1 R 1 ( V c 1 V d c ) + 1 R 2 ( V c 2 V d c ) 3 ( V d I d + V q I q ) 2 V d c ]  
Therefore, ( I L 1 ) , ( V c 1 ) , ( I L 2 ) , ( V c 2 ) , ( I d ) , ( I q ) and ( V d c ) are the state variables of the system, ( d 1 ) , ( d 2 ) , ( m q ) and ( m d ) are the control input while ( V q ) , ( V d ) , ( V b a t ) and ( V p v ) are the disturbances. In microgrid hierarchical control, the secondary control scheme provides the highest limit power reference ( I L 1 * ) for the solar system to perform. The highest power point is obtained by the maximum power point tracking (DC-DC converter) which is the point where the solar array and the battery storage or grid are optimized while the amount of power absorbed or injected into the network from the battery is being control by current reference ( I L 2 * ) . This can work in different modes, such as reactive power supply mode, shaving mode or voltage regulation mode. The references ( I d * ) and ( I L 2 * ) generated from the secondary control side feed the consumer loads properly and control the active and the reactive power of the system. The direct current coupling voltage ( V d c ) controls the voltage at DC coupling to keep the microgrid power at equilibrium. When the control variable is defined by (y), the (x) represents the state and ( x e ) is the equilibrium point. Thus, the system error can be obtained by the Equations (31)–(35), where (d) is the disturbance of the system. The Equation (36) shows the similarity of the solar system and the battery control with a control output and input. A control strategy can be therefore derived which can stabilize the dynamic of the proposed microgrid subsystem. To linearize the dynamic ( I L 1 ) in Equation (1) above, the control input ( d 1 ) can be obtained in Equation (37). Where the proportional PI and ( v 1 ) can be expressed properly in Equations (38) and (39). zero steady state and convergence of the system can be guaranteed to meet the required performance if the integral and proportionate ( K i 1 )   and   ( K p i ) are obtained. As ( d 1 ) is calculated in (37), ( d 2 ) can also be obtained for the battery system in (40), while PI is added in Equations (41) and (42). To enhance the solar system performance, ( K i 2 ) is the integral gain while ( K p 2 ) is the proportional gain.
The integration of the solar system and the battery bank into the network are achieved by a converter; the converter’s active and reactive power can be controlled by the direct current ( I d ) and the quadrature current ( I q ) . To linearize the converter’s dynamic behaviours, the modulation indices of the direct and quadrature axes ( m d ) and ( m q ) can be obtained in Equations (43) and (44), respectively. The (PI) inserts ( v d , q ) into the system; thus, by similarity to Equations (41) and (42), Equations (45) and (46) can be obtained where ( K i d , q ) is the integra gain and ( K P d , q ) is the proportionate gain. To determine the dynamic mathematical derivation of the DC coupling voltage in Equation (47), considering the hierarchical control strategy from the proposed model, secondary control injects reference current ( I L 2 * ) to the battery storage system; therefore, all available power can be injected into the DC coupling by the converter. To obtain the reasonable quantity of power into the system, the reference current ( I d * ) must be known, such that direct current coupling voltage transforms to its reference ( V D C * ) . The perturbation analysis can be obtained by adding an external control loop that is connected in series to the ( V d c ) voltage and making the current dynamic ( I d , q ) much faster than the voltage dynamics. Therefore, ( I d ) can be made to attain an equilibrium position ( I d * ) in the direct current bus voltage dynamic evaluation due to the separation of the time scale. To secure the difference in the time scale of voltage and current, the controller gains should therefore be allotted. From (47), ( I d ) can be obtained for linearization of ( V D C ) in Equation (48), and by applying a controller (PI) to ( v d c ) in Equations (49) and (50), direct current link can be balanced through the reference current, thereby, ( V D C ) is controlled with respect to ( V D C * ) . The active and the reactive power can be autonomously controlled while reference current ( I q * ) controls current ( I q ) to inject a quantity of reactive power to the network; thus, the reference ( I q * ) is obtained in (51) and the ( Q * ) is the network reactive power. When control strategy is planned and provided, there is a need to make the rest of the dynamic of the network stable. With the uncontrolled variable ( V C 1 ) and ( V C 2 ) , the equilibrium point of the dynamic can be derived in Equations (52) and (53), and by linearizing the variable ( V C 1 ) and ( V C 2 ) toward the equilibrium position, the variable stability can be further established by the Jacobian sign in the Equations (54) and (55). By assumption in Equation (54), if current ( I L 1 ) is positive then the Jacobian ( J 1 ) is negative; because the voltage losses in the inductor ( R L 1 I L 1 ) are less than the solar system voltage, this is the physical limitation of the system. Similarly, by assumption in Equation (55), if ( I L 2 ) is positive, the negative values vary depending on the battery charge and discharge value. Therefore, a derivation can be found for ( V C 2 ) stability zone in Equation (56) due to the negativity of the Jacobian ( J 2 ) . Conclusively, the non-controlled dynamics have a stable point of balance within the limitations mentioned.
x ˜ = x x e  
x = [ V c 1 ,   V c 2 , V c 3 ] T  
x e = [ I L 1 * ,   V C 1 e ,   I L 2 * ,   V c 2 e ,   I d * , I q * ,   V d c * ] T  
y = [ I L 1 ,   I L 2 ,   I d ,   I q ] T  
d = [ V P V ,   V b a t ,   V d ,   V d ] T  
{ x ˙ = f ( x , d ) = g ( x ) u y = I L 1 , 2  
d 1 = 1 V c 1 ( L 1 v 1 P p v + R L 1 I L 1 + V C 1 )  
v 1 = K P 1 ( I L 1 I L 1 * ) α 1  
α ˙ 1 = K i 1 ( I L 1 I L 1 * )  
d 2 = 1 V c 2 ( L 2 v 2 V b a t + R L 2 I L 2 + C V 2 )  
v 2 = K p 2 ( I L 1 I L 2 * ) α 2  
α ˙ 2 = K i 2 ( I L 2 I L 2 * )  
m d = 2 V D C ( L l v d + R l I d ω L 1 I q + V d )  
m q = 2 V D C ( L l v q + R l I q ω L 1 I d + V q )  
v d , q = K P d , q ( I d , q I d , q * ) α d , q  
α ˙ d , q = K i d , q ( I d , q I d , q * )  
V ˙ D C = { 1 R 1 ( V C 1 V D C ) + 1 R 2 ( V C 2 V D C ) 3 ( V d I d * V q I q * ) 2 V D C }  
I d * = 2 V D C 3 V d { C d c 2 v d c + 1 R 1 ( V C 1 V D C ) + 1 R 2 ( V C 2 V D C ) + V q I q * 2 V D C }  
v d c = K P d c ( V D C V D C * ) α d c  
α ˙ d c = K i d c ( V D C V D C * )  
I q * = 2 Q * 3  
V C 1 e = V D C 2 ± V D C 2 + 4 R 1 I L 1 ( V P V + R L 1 I L 1 )  
V C 2 e = V D C 2 ± V D C 2 + 4 R 2 I L 2 ( V b a t + R L 2 I L 2 )  
J 1 = 1 R 1 C 1 1 C 1 I L 1 * V C 1 e 2 ( V V P V R L 1 I L 1 )  
J 2 = 1 R 2 C 2 1 C 2 I L 1 * V C 2 e 2 ( V b a t R L 2 I L 2 )  
V b a l 2 R L 2 1 R L 2 ( V b a l 2 + 4 R L 2 R 2 ) < I L 2 < V b a l 2 R L 2 + 1 R L 2 ( V b a l 2 + 4 R L 2 R 2 )  

4.3. Control Strategy of the Circuit

Consider the pulse generator control circuit in Figure 10; when strategically controlling the pulse (S) of the PWM-VSC output using the (IC + PI) strategy, energy is extracted from the solar system through the first stage of the power conversion phases. The solar reference voltage ( V p V r e f ) and pulse (S) are estimated by the (IC + PI) algorithm. The generated solar voltage ( V p v ) is compared with the solar reference voltage ( V p V r e f ) to produce solar reference current ( I p V r e f ) through the outer loop PI. The generated solar current ( I p v ) and the solar reference current ( I p V r e f ) are compared to produce the duty ratio (D) through the inner loop PI. Therefore, the duty ratio (D) produces high frequency pulse (S) through the (PWM) for DC-DC conversion stage. The second power conversion stage, which is the (PWM-VSC) stage, maintains the active and reactive, and transfers the extracted power output from the solar system at the PCC. The (PWM-VSC) operates in unitary power factor and voltage regulation mode, which also control the voltage rise at the PCC to the minimum. When solar system output power generation is at the maximum and the load demanded is low, (PWM-VSC) will be in voltage regulation mode, where it will generate reactive power to the grid to control the voltage rise at PCC and minimize the voltage to an acceptable level.
Figure 11 depicts the gating pulse generated from ( S 1 ,   S 2 ,   S 3 , ,   S 6 ) to control PWM-VSC where the device is current controlled. ( I G r * ) can be approximated by detecting ( I L A ,   I L B ) , ( V p c c A B ,   V p c c B C ) and ( V d c ) while ( V p c c A ,   V p c c B ,   V p c c C ) can be approximated from the PCC line voltage. Where:
The filtering circuits in Figure 12 filter the unwanted disturbance/distortion or unbalance signals from the load current and phase voltage at the PCC, where their components are approximated before the approximation of the reference grid current. The filtering stage ofF the control is of an in-loop type, which has a super harmonic rejection capability [36,37,38,39,40]. The current that flows across the loads and the phase voltage at the PCC is transformed to a stationary reference frame control known as αβ—control. It regulates control signals in stationary two-phase frame, ( I L α ) , ( I L β ) and ( V p c c α ) , ( V p c c β ) . Any unwanted signals generated from the PCC are suppressed by the filtering circuit, while the approximated quadrature components and undistorted in-phase signal are ( I L α p * ) , ( I L β p * ) , ( V p c c α p * ) and ( V p c c β p * ) of ( I L α ) , ( I L β ) and ( V p c c α * ) , ( V p c c β * ) . In the same way, ( I L α q * ) , ( I L β q * ) and ( V p c c α q * ) , ( V p c c β q * ) are undistorted quadrature of ( I L α ) , ( I L β ) and ( V p c c α ) , ( V p c c β ) . The undistorted components generated can be distorted, provided that the detected current that flows across the loads, the approximated in-phase/quadrature signals are used to approximate the positive sequence of the fundamental components of the detected current that flow across the loads and the phase voltage at the PCC ( I L α * ) , ( I L β * ) and ( V p c c α * ) , ( V p c c β * ) , such that they can be expressed in Equations (57)–(60). The PWM-VSC has voltage regulation mode and unified power factor mode of operation [41], the amplitude of the phase angle at the Point of Common Coupling and the grid phase angle are vital to synchronize and control the device mode of operation, as expressed in Equations (61) and (62).
V p c c α * = 0.5 ( V p c c α p * V p c c β q * )
V p c c β * = 0.5 ( V p c c α q * V p c c β p * )
I L α * = 0.5 ( I L α p * I L q * )
I L β * = 0.5 ( I L α p * I L β q * )
V A = ( V p c c α * ) 2 + ( V p c c β * ) 2
θ g = t a n 1 ( V p c c β * V p c c α * )
where ( I G d * ) denotes the active power across the grid and is the d-axis component of the grid current. The value of ( I G d * ) can be negative or positive. Negative value of the component means that the grid is drawing active power while the positive value shows that the load is drawing active power from the grid, which is dependent on the solar power generation, load demanded and VSC losses in that particular period as expressed in Equation (63). ( I L d * ) can be obtained through the transformation of ( I L α * ) and ( I L β * ) to dq-axis reference frame. ( V d c ) is the sustained and established reference value of the voltage ( V d c R e f ) when ( I l o s s ) absorbs active power from the grid and represents VSC losses. The component is obtained through the processed error between the ( V d c ) and ( V d c R e f ) by the approximation of the (PI) controller. To avoid overmodulation in the system, the approximated amplitude voltage at the PCC adjusts the direct current link voltage [42,43,44,45]. The expression for ( V d c R e f ) , DC link error and the solar power output at the PCC can be obtained in Equations (64)–(67). The DC link integral controller’s stress minimizes when ( I P V p c c ) is off; it provides the feed forward capability for VSC control and provides ideal power generation ahead of VSC synchronism [46]. It also provides such capability that when there is a quick change of solar power output, best dynamic performance is enhanced.   ( I G q * ) denotes reactive power across the grid and is the q-axis component of the grid current. The operation depends on the device mode. When the device is in unified power factor mode and ( I G q * ) is maintained at zero position, VSC generates reactive power to the load while there is less or no reactive power across the grid [47,48]. When there is a maximum power output generated from the solar power, and the load demanded is low, the voltage at the PCC will rise above the maximum allowable limit. In such a scenario, the device will switch to its voltage regulation mode, whereby the load and the grid absorb reactive power from the VSC. Hence, the power factor of the grid is less than the unity. ( I G q * ) is defined in Equation (68). ( I L q * ) is the approximated current that controls the voltage amplitude at the Point of Common Coupling to avoid voltage rise. It can also be obtained by the error differential between the peak voltage amplitude at the Point of Common Coupling and the phase voltage amplitude through the integral controller. Through the transformation of the d–q axis ( I G d * ) , ( I G q * ) to the a–b–c reference frame with inverse park transformation analysis, the approximated ( I G R e f * ) can be obtained. The differential between the detected grid current and approximated grid current will result in the gating pulses S 1 , S 2 , S 3 ,   S 6 .
I G d * = I L d * + I l o s s I P V p c c
V d c R e f = 1.05 × 2 × V A
I l o s s   k + 1 = I l o s s   k + K p d c × ( e d c   k + 1 e d c   k ) + K i   d c × e d c   k + 1
e d c = V d c R e f V d c
I P V p c c = 2 × P p v 3 × V A
( I G q * ) = ( 0   i f   V A V A m a x I L q * + I V R q   o t h e r w i s e )
I V R q   k + 1 = I V R q k + K p V R × ( e V R   k + 1 e V R   k ) + K i   V R × e V R   k + 1
e V R = V A m a x V A

5. Results and Discussion

A Simulink model of the Peak Power Point Tracking is designed and comprised of 1.008 MW at 1000   W / m 2 PVAs. The system consists of 64 parallel strings, and each of the strings consists of five modules SPR-315E connected in series ( 10 × 64 × 315 × 5 = 1.008   MW ) . The Temperature is measured in degree centigrade and the irradiance of the sun in ( W / m 2 ) . The PV array block has two inputs that allow for variation in the sun’s irradiance and the temperature across the two inputs of the solar array block. Direct current to direct current (DC-DC) boost converters of 5-kHz inputs are connected to the PVA’s output while the outputs are connected to the DC bus of three phase 3-level Pulse Width Modulation Voltage Source Converter (PWM-VSC). The desired voltage is produced by the tracking system by varying the duty cycle while peak power is being accessed from the PVA terminals by means of (IC + IR), otherwise known as the Peak power point tracking strategy. The VSC possesses internal and external control capabilities. The quadrature current components ( I d ) , ( I q ) , representing the active and reactive current, are being controlled by the internal part of the PWM-VSC; while the external aspect of the PWM-VSC controls the DC link voltage, PWM-VSC is kept at 20% more than the rating of the solar farm. The boost converter improves the PVA’s voltage output from 295 VDC to 500 VDC. The PWM-VSC makes use of converted modulating reference voltage signals ( V a b c   R e f ) from output voltage ( V d ) and ( V q ) of the current controller, usually from 500 VDC to 260 VAC at the PCC. A filtering circuitry is connected to the network to eliminate any distortion generated by the PWM-VSC. The designed network in MATLAB/Simulink is simulated, the grid voltage and that of phase one current are in phase between 0 s and 0.05 s, which means that the system is undergoing unity power factor mode operation, as shown in Figure 13a, such that the angle between the grid voltage and the current is zero. The unity power factor exists because there is no phase difference (during the period of 0–0.05 s) in the grid voltage and the current; the whole part of the main power supply is doing the useful work. Hence, there is no voltage fluctuation, no power wasting, no transient voltage problem, and very low loss occurs at unity power factor. The PVA’s output power generated is 840 kW between 0.15 s and 0.4 s, which is not its full rated power as depicted in Figure 13b, and the duty cycle is fixed at 0.6 s, as shown in Figure 13c. During this period, the PPPT controller is not yet enabled (it has not started regulating PV voltage by varying duty cycle in order to extract peak power) and the voltage at that point is therefore calculated using Equation (71) and 200 V is obtained. However, the rated power of the PVA is 1.008 MW at 1000   W / m 2 . Moreover, at 0.4 s, the Peak Power Point Tracking (PPPT) algorithm control is turned on, as shown in Figure 13d, and the PVA’s voltage output regulation (IC + IR) starts operation by varying the duty cycle in Figure 13e to extract the peak power. The peak power tracked by the PPPT is about 1.005 MW at the duty cycle of 0.45, while the rated value is 1.008 MW by estimation, which means that about 0.003 kW is lost in the boost converter. By calculation, using Equation (72), the simulated result in Figure 13f, which is 295 V, is slightly higher than the calculated result (273.5 V). It shows that the boost converter efficiency is about 83%. The solar voltage output is about 1005 V between 0 s and 0.61 s, it reaches 295 V at 0.55 s and maintains its stability. The boost converter boosts the PVA’s voltage at 0.61 s from 295 V to 500 V and the system reaches its steady state at 0.62 s, while the duty cycle of the boost converter is maintained at 0.41, as shown in Figure 13g. The 3- -3-level PWM-VSC converts the 500 V DC link voltage to 260 V AC, as shown in Figure 13h. The PVAs and the grid (PCC) parameters are 5000 kVA 260 V/22 kV three-phase coupling transformers. Further simulation investigations are carried out to evaluate the network performance during load variation with constant PVA generation to PCC. The network impact when undergoing unity power factor (UPF) and voltage regulation (VR) mode with the network behaves like DSTATCOM and the grid when there is no generation from PVAs at PCC.
V P V = ( 1 D ) × V d c = ( 1 0.6 ) × 500 = 200   V  
P V   M o d u l e   S p e c i f i c a t i o n = N s e r × V m p = 5 × 54.7 = 273.5   V    

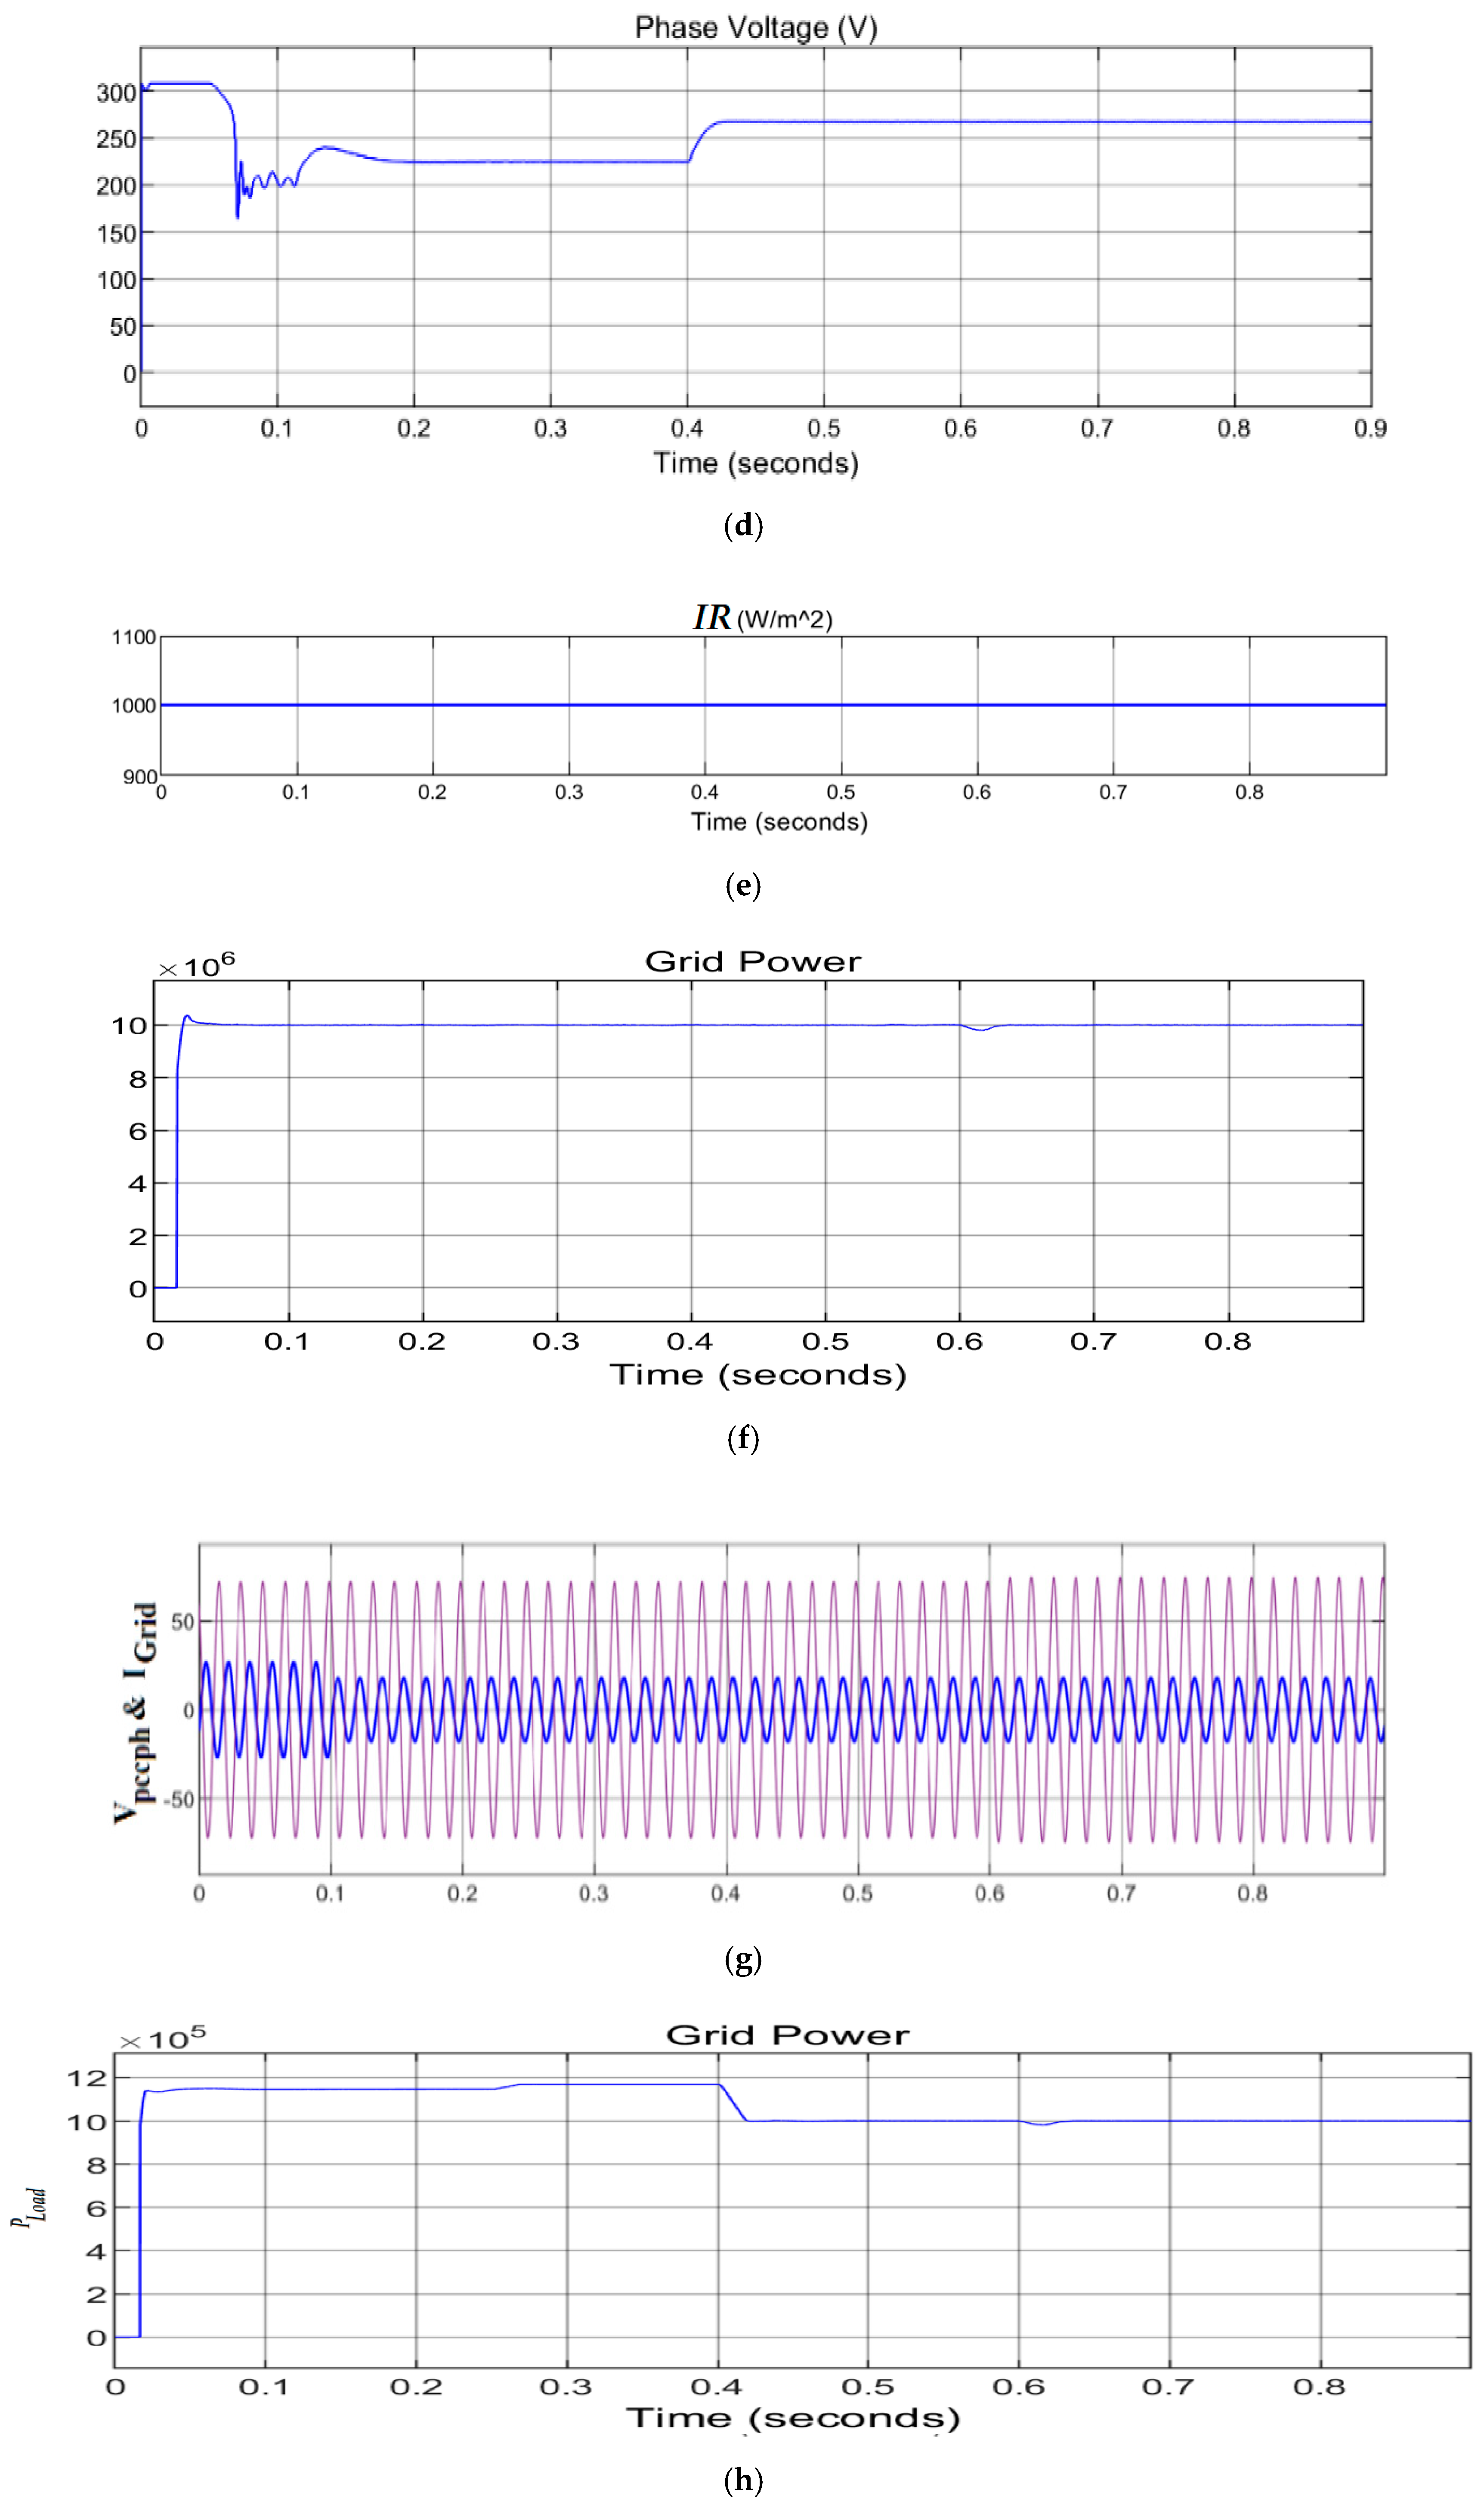
5.1. Loads Variation with Constant PVA Generation

This session discusses the investigation carried out to determine the effect of load fluctuation on the rated solar farm performance while the power of the PVAs is kept constant at a rated capacity. The system performance is also evaluated when the network operation is in voltage regulation or unity power factor mode and when undergoing unity power factor operation alone, depending on the amount of voltage rise at the PCC. When loads demanded are varied by switching off the loads on the phase two at 0.4 s and phase three loads at 0.6 s, this is depicted in Figure 14a. The power generated to the AC grid increases ( P G r i d ) as shown in Figure 14b when there is a reduction in the loads demanded ( P L o a d ) across the network, while the PVA’s output remains within its rated capacity, whereas the grid current amplitude ( I G r i d ) also increases, resulting in a further drop in voltage in the feeder impedance of the AC grid. Similarly, the decrease in the loads demanded also causes the amplitude of the phase voltage ( V A ) at the PCC to increase. Figure 14d–e show the network simulation outcomes when the network is undergoing UPF operation from the STATCOM, such that the grid’s reactive power is zero, i.e., Q G r i d = 0 . The PCC phase voltage amplitude rises above the acceptable range, even with the load demanded from the system, which is not in agreement with the IEEE-1547-2018 and Southern Africa grid code regulation at PCC publication in [16], [18] that established uniform criteria and requirements for interconnection of distributed energy resources (DER) with electric power systems (EPS) and associated interfaces. It is observed that during no-load conditions between 0.6 s and 0.9 s, the PCC phase voltage amplitude ( V A ) rises above 330 V as shown in Figure 14e and is unacceptable because it is more than 10% of the rated value of the PCC. The South Africa Grid Code Act accepts ±15% to +10% RDG voltage variation connection at the PCC for large RDG above 100 kW, while IEEE-1547 stipulated ±6% variation for PVA connection at the PCC of alternating current/voltage.

5.2. Proposed Method with UPF and VR Mode
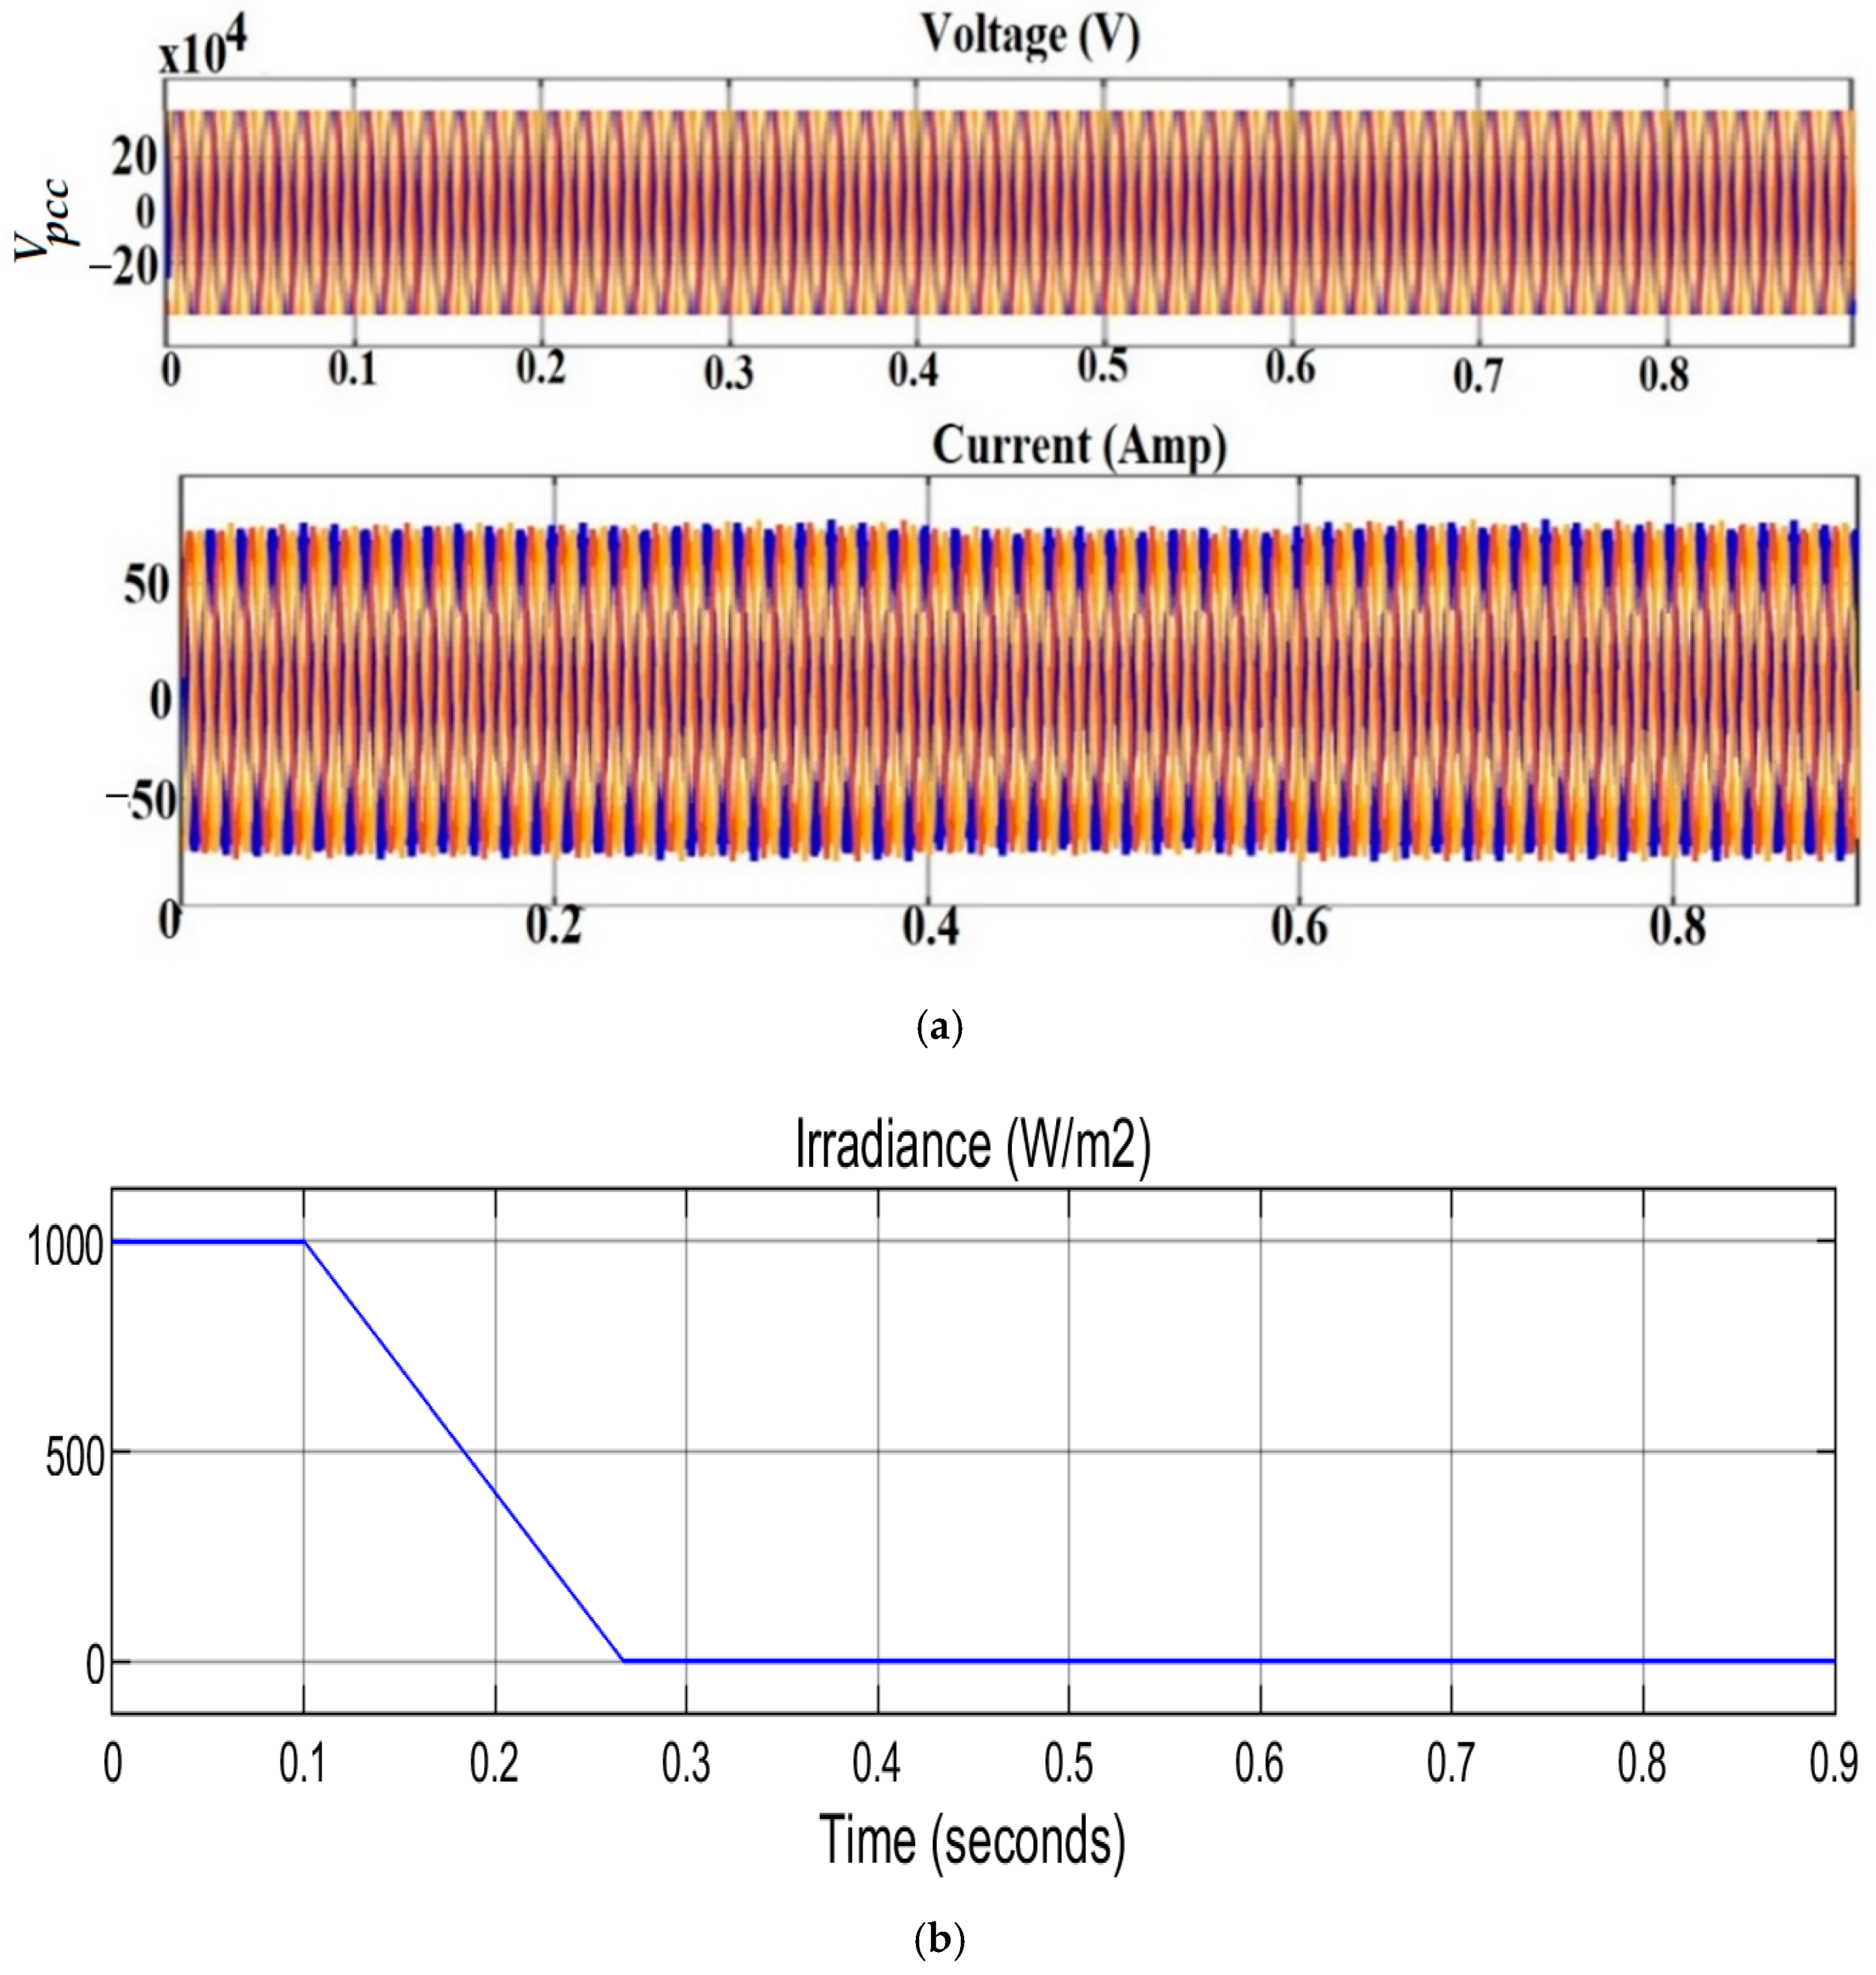
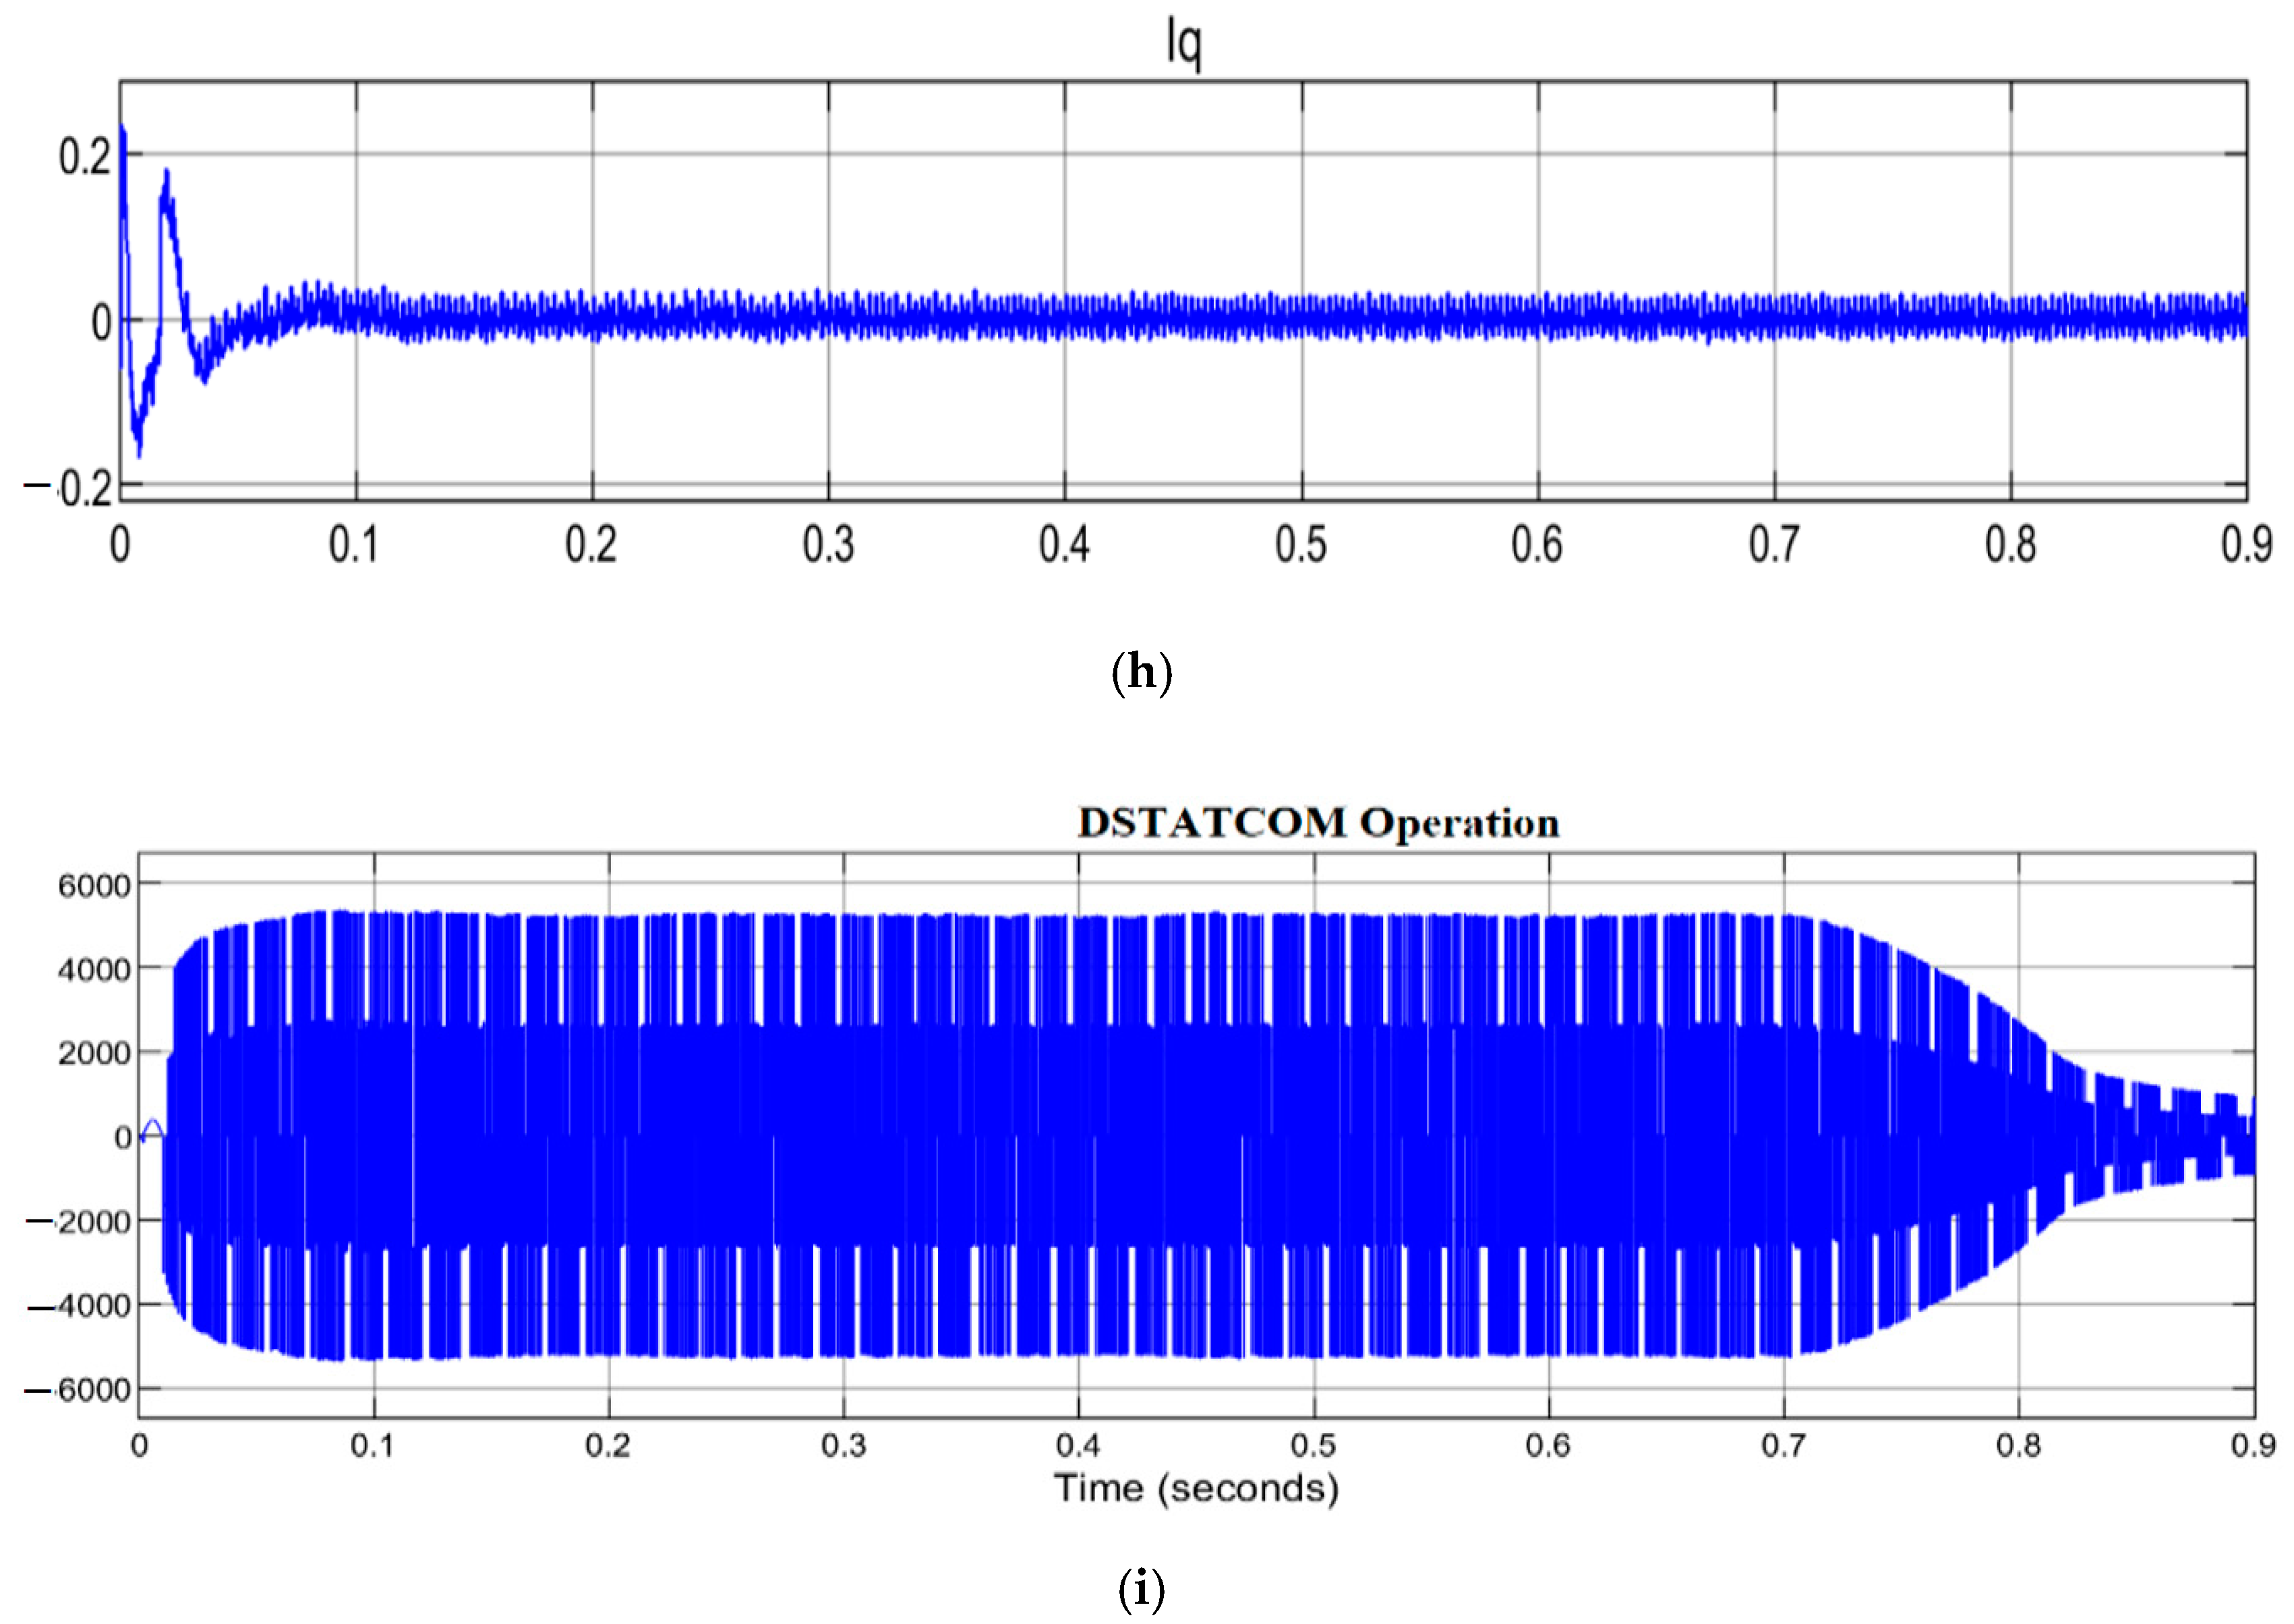
The results of the proposed method are depicted in Figure 15a–j where the network is operating normally such that the system is in its unity power factor mode at rated loads demand and PVA. However, at 0.4 s, the phase voltage amplitude ( V A ) at the PCC rises because of the reduction in the loads demanded within the system. Consequently, the operating mode of the network changes from the unity power factor to a voltage regulation mode to minimize the voltage rise at the PCC to an acceptable range, in relation to IEEE 1547 and Southern Africa grid code requirement. It is observed during the voltage regulation mode that the network’s reactive power increases from zero ( Q G r i d = 0 ) to 1.15 kVAR. Also at 0.4 s, when the loads demanded reduces to zero, ( Q G r i d ) increases from 1.15 kVAR to 5 kVAR. This causes more power to be transported to the AC grid, resulting in a greater drop in the impedance of the feeder and, therefore, more reactive power being generated to the grid to limit the voltage rise at the PCC. The phase voltage amplitude ( V A ) is within an acceptable range, in agreement with IEEE 1547 and Southern Africa grid code requirement. It can be observed that phase voltage increases up to 250 V, which is less than the maximum allowable range. However, there is no reflection of power quality challenges noticed due to an unbalanced or non-linear load in the system, because the network currents are balanced during the operation. The network measured parameters such grid RMS value of voltage/current, grid current ( I g ) harmonics, during the experiment are depicted in Table 1, which are withing an acceptable range during grid compensation.

5.3. PVAs Variation

The Figure 16a–i show the impact of the network when the ( P P V ) varies from rated to zero. The solar power ( P P V ) varies rapidly when solar irradiance fluctuates from 1000   W / m 2 to 0   W / m 2 . There is nothing to be tracked by PPPT after 0.4 s, as the power generated by the solar farm is zero and ( V d c ) reduces to less than 400 V. The grid power and the grid current ( I G r i d ) and ( P G r i d ) vary with load power, while the rated value of the load power ( P L ) remains unchanged. Originally, the voltage rise at the PCC is because of the drop at the feeder impedance (negative, which means it produces energy) when power is fed to the AC grid. However, the drop in the feeder impedance reduces due to the decrease in the power transported to the AC grid with ( P P V ) , hence, the phase voltage amplitude ( V A ) reduces. Moreover, when solar power generated is equal to zero, power is being absorbed from the AC grid and the drop in the feeder impedance is positive (the energy is being consumed); therefore, the phase voltage amplitude is less than the rated voltage (249 V) and the regulating operation is carried out in the system, such that the system behaves like DSTATCOM by active filtering characteristics. The grid reactive power maintains a zero position when ( V A ) at the PCC is less than the maximum voltage amplitude while the network operation is in unity power factor mode, such that ( I q = 0 ) .

6. Conclusions

The research investigation in this paper shows that variation in the consumer’s loads (reduction) can cause an increase in the power generated from PVAs to the grid, increase in current amplitude, reduction in voltage of the feeder impedance and increase in phase voltage amplitude at the PCC. When the system is undergoing unity power factor mode, PCC voltage amplitude tends to rise with loads, and PCC phase voltage amplitude rises above an acceptable range with no-load. Similarly, load reduction causes voltage rise at PCC during UPF mode, which can be regulated by changing to voltage regulation mode. Generation of positive reactive power to the grid by the DSTATCOM reduces voltage rise at PCC, which also regulates the phase voltage while solar PVAs are in continuous operation, which justified the first research question mentioned in the introduction. Furthermore, fluctuation in the sun’s irradiation causes a decrease in PVA power generation, resulting in variation of the grid current and power. The impact of zero PVA generation causes power to be absorbed from the grid, which causes a positive in the feeder impedance, leading to the reduction in the voltage amplitude. This satisfies the second research question but is corrected when the system operates in its voltage regulation mode. If the active power generated by the PVAs is higher than that of the local consumers, excess power is delivered to the grid. The operation of PVAs has been presented in this paper to solve power quality issues, such as a voltage rise at the PCC. It is therefore recommended that the PCC of PVAs should be strategically monitored and regulated to avoid power quality challenges whenever there is load variation and no generation from PVAs.
To further improve the power quality of RDG integration at PCC, as a future research direction, online monitoring of power quality parameters can be achieved by considering continuous measurement of voltages, currents and phase shifts using power quality analyzers to set alarms for when these parameters are out of limit. An automations system can be developed, such that it depends on the imbalance of electrical consumers at different phases or introduces or removes larger units of electrical consumers from one phase to another. The impact of the battery bank’s installation with PPPT optimization on the system is not put into consideration in this study but shall be investigated in the near future. Also, the comparison of the impacts of PWM and PPPT for solar PVA’s charge control for efficient power quality management at PCC shall be investigated, and economic considerations shall be taken into account.

Author Contributions

A.A.S.: Conceptualization; Methodology; Software; Validation. Formal analysis; Investigation, Writing-original draft. Formal analysis; Investigation, Writing-original draft. K.M.; Formal analysis; Investigation; Writing-review, Supervision; Project administration. I.E.D.: Conceptualization, Methodology, Resources; Writing, Editing; Co-Supervision; Funding/APF. All authors have read and agreed to the published version of the manuscript.

Funding

This research received no external funding.

Data Availability Statement

No data collected.

Conflicts of Interest

I declared that there is not conflict of interest with anybody/institution on this paper during and after the investigation work carried out.

Nomenclature

P l o a d ( t ) Load power of time (t)
tChange in time (t)
P(t)Actual power generated
P V p o w e r ( t ) Power generated by the PV
D e n e r g y Discharging energy
𝓔 c o n v e r t e r Converter efficiency
P g e n e r a t i n g   s e t Power of the generator
P d u m m y   l o a d ( t ) Power of the dummy load
Self-discharge rate
𝓔 c h a r g i n g Charging efficiency of the battery storage
𝓔 d i s c h a r g i n g Discharging efficiency of the battery storage
C e n e r g y Charging energy
V p v     Solar system output voltage
V c 1 Capacitor voltage
I l 1 Inductor current
C 1 The capacitor
d 1 Converter duty cycle
V b a t Battery voltage
I l 2 Inductor current of the battery
V c 2 Capacitor voltage of the battery
d 2 Converter duty cycle of the battery
I d Direct axis current such as active power injected into the system
I q Quadrature current such as reactive power injected to the system with respect to the reference ( dq )
V d c Direct current coupling voltage
m d   a n d   m q Converter modulation indices
ωFundamental frequency
V d   a n d   V q Synchronous AC voltage.
( I G r * ) Grid reference current
( I L A ,   I L B ) Load current
( V p c c A B ,   V p c c B C ) PCC line voltage
( V d c ) DC link voltage
( V p c c A ,   V p c c B ,   V p c c C ) PCC phase voltage
I G d * d-axis grid current
I L d * d-axis load current
I l o s s VSC losses
I P V p c c Solar power output at PCC
I V R q Approximated current component that controls PCC voltage
I L q * q-axis load current
V A Amplitude of the phase voltage
e V R Error

References

  1. Tazi, K.; Abbou, M.F.; Abdi, F. Performance Analysis of Micro-Grid Designs with Local PMSG Wind Turbines; Springer: Berlin, Germany, 2019. [Google Scholar]
  2. Bhagavathy, S.M.; Pillai, G. PV Microgrid Design for Rural Electrification. Designs 2018, 2, 33. [Google Scholar] [CrossRef] [Green Version]
  3. Kim, S.H.; Saeed, M.A.; Lee, S.Y.; Shim, J.W. Investigating the Indoor Performance of Planar Heterojunction Based Organic Photovoltaics. IEEE J. Photovolt. 2021, 11, 997–1003. [Google Scholar] [CrossRef]
  4. You, Y.J.; Saeed, M.A.; Shafian, S.; Kim, J.; Kim, S.H.; Kim, S.H.; Kim, K.; Shim, J.W. Energy recycling under ambient illumination for internet-of-things using metal/oxide/metal-based colourful organic photovoltaics. Nanotechnology 2021, 32, 401–465. [Google Scholar] [CrossRef] [PubMed]
  5. Elavarasan, R.M.; Shafiullah, G.; Padmanaban, S.; Kumar, N.M.; Annam, A.; Vetrichelvan, A.M.; Mihet-Popa, L.; Holm-Nielsen, J.B. A Comprehensive Review on Renewable Energy Development, Challenges, and Policies of Leading Indian States with an International Perspective. IEEE Access 2020, 8, 74432–74457. [Google Scholar] [CrossRef]
  6. Zia, M.F.; Benbouzid, M.; Elbouchikhi, E.; Muyeen, S.M.; Techato, K.; Guerrero, J.M. Microgrid Transactive Energy: Re-view, Architectures, Distributed Ledger Technologies, Market Analysis. IEEE Access 2020, 8, 19410–19432. [Google Scholar] [CrossRef]
  7. Kim, Y.S.; Kim, E.S.; Moon, S.I. Frequency, Voltage Control strategy of Standalone Microgrids with High Penetration of Intermittent Renewable Generation Systems. IEEE Trans. Power Syst. 2016, 31, 718–728. [Google Scholar] [CrossRef]
  8. Khan, K.A.; Khalid, M. A Reactive Power Compensation Strategy in Radial Distribution Network with High PV Penetration. In Proceedings of the 2019 8th International Conference on Renewable Energy Research and Applications (ICRERA), Brasov, Romania, 3–6 November 2019. [Google Scholar]
  9. Dreidy, M.; Mokhlis, H.; Mekhilef, S. Inertia response and frequency control techniques for renewable energy sources: A review. Renew. Sustain. Energy Rev. 2017, 69, 144–155. [Google Scholar] [CrossRef]
  10. Petrone, G.; Spagnuolo, G.; Teodorescu, R.; Veerachary, M.; Vitelli, M. Reliability Issues in Photovoltaic Power Processing Systems. IEEE Trans. Ind. Electron. 2008, 55, 2569–2580. [Google Scholar] [CrossRef]
  11. Khan, K.A.; Shafiq, S.; Khalid, M. A Strategy for Utilization of Reactive Power Capability of PV Inverters. In Proceedings of the 2019 9th International Conference on Power and Energy Systems (ICPES), Perth, WA, Australia, 10–12 December 2019; pp. 1–6. [Google Scholar]
  12. Zerrahn, A.; Schill, W.-P. Long-run power storage requirements for high shares of renewables: Review and a new model. Renew. Sustain. Energy Rev. 2017, 79, 1518–1534. [Google Scholar] [CrossRef]
  13. Priyadharshini, A.; Devarajan, N.; Saranya, A.R.; Anitt, R. Survey of Harmonics in Non-linear Loads. Inter. J. Recent Techn. Eng. (IJRTE) 2012, 1, 92–97. [Google Scholar]
  14. Fahad, S.A. DC Microgrid Planning, Operation, and Control: A Comprehensive Review. IEEE Access 2021, 9, 36154–36172. [Google Scholar]
  15. Yuchen, J.; Wen, W.P.; Yongsheng, Y.; Limin, H. Joint Operation and Transaction Mode of Rural Multi Microgrid and Distribution Network. IEEE Access 2021, 9, 14409–14421. [Google Scholar]
  16. Driesen, J.; Katiraei, F. Design for Distributed Energy Resources. IEEE Power and Energy Mag. 2008, 6, 30–40. [Google Scholar]
  17. Bo, F.; Xiongfei, W. Distributed Privacy-Preserving Active Power Sharing and Frequency Regulation in Microgrids. IEEE Trans. Smart Grid 2021, 12, 3665–3668. [Google Scholar]
  18. Diego, A.; Julio, P.; Francesc, G.; Luis, M.; Gabriel, G.; Rodolfo, G.; Jacqueline, L.; Pablo, S.; Motoasca, M. An Energy Man-agement System Design Using Fuzzy Logic Control: Smoothing the Grid Power Profile of a Residential Electro-Thermal Mi-crogrid. IEEE Access 2021, 9, 25172–25188. [Google Scholar]
  19. IEEE Standard. IEEE Recommended Practice and Requirements for Harmonic Control in Electric Power Systems; IEEE Standard: Las Vegas, NV, USA, 2014. [Google Scholar]
  20. Abhishek, R.; Seema, K.; Bhim, S. DSOGI-PLL with In-Loop Filter Based Solar Grid Interfaced System for Alleviating Power Quality Problems. IEEE Trans. Ind. Appl. 2021, 57, 730–740. [Google Scholar]
  21. NERSA. Grid Connection Code for Renewable Power Plants (RPPs) Connected to the Electricity Transmission System (TS) or the Distribution System (DS) in South Africa; RSA Grid Code Secretariat: Johannesburg, South Africa, 2014. [Google Scholar]
  22. Muhammad, U.K.; Khan, W.; Karimov, K.S.; Muhammad, A.S. A New Proposed Hierarchy for Renewable Energy Generation to Distribution Grid Integration. In Proceedings of the 2015 International Conference on Emerging Technologies (ICET), Peshawar, Pakistan, 19–20 December 2015. [Google Scholar]
  23. Podder, A.K.; Roy, N.K.; Pota, H.R. MPPT Methods for Solar PV system; A Critical Review Based on Tracking Nature. IET Rev. Power Gene. 2019, 13, 1615–1632. [Google Scholar] [CrossRef]
  24. Anjan, D.; Imtiaz, P.; Dastgir, M.G.; Asim, N.; Temitayo, O.O.; Hugo, R.; Arif, S. Voltage Regulation of Photovoltaic System with Varying Loads. In Proceedings of the Southeast Con, Raleigh, NC, USA, 28–29 March 2020. [Google Scholar]
  25. Prabhu, H.U.; Babu, M.R. Performance Study of MPPT Algorithms of DC-DC Boost Converters for PV Cell Applica-tions. In Proceedings of the 2021 7th International Conference on Electrical Energy Systems (ICEES), Chennai, India, 11–13 February 2021. [Google Scholar]
  26. Ekren, O.; Ekren, B.Y. Size Optimization of a PV/Wind Hybrid Energy Conversion System with Battery Storage using Response Surface Methodology. Appl. Energy 2008, 85, 1086–1101. [Google Scholar] [CrossRef]
  27. Anowar, M.H.; Roy, P. A Modified Incremental Conductance Based Photovoltaic MPPT Charge Controller. In Proceedings of the 2019 International Conference on Electrical, Computer and Communication Engineering (ECCE), Cox’sBazar, Bangladesh, 7–9 February 2019. [Google Scholar]
  28. Saibal, M.; Ashok, K.A. Comparative Analysis of Various P & O MPPT Algorithm for PV System under Varying Radi-ation Condition. In Proceedings of the 2021 1st International Conference on Power Electronics and Energy (ICPEE), Bhubaneswar, India, 2–3 January 2021. [Google Scholar]
  29. Collin, J.D.; David, L.M.; Rami, J.H.; Aaron, S.; Shaina, N. PicoGrid Smart Home Energy Management System. In Proceedings of the IEEE Southeast Con, Petersburg, FL, USA, 19–22 April 2018. [Google Scholar]
  30. Adam, G.P.; Anaya-Lara, O.; Burt, G.M.; Telford, B.W.; Williams, D.; McDonald, J.R. Modular Multilevel Inverter: Pulse Width Modulation and Capacitor Balancing Technique. IET Power Electron. 2010, 3, 702–715. [Google Scholar] [CrossRef]
  31. Giddani, O.A.; Adam, G.P.; Anaya-Lara, O.; Burt, G.; Lo, K.L. Control Strategies of VSC-HVDC Transmission System for Wind Power Integration to Meet GB Grid Code Requirements. In Proceedings of the Power Electronics, Electrical Drives, Automation and Motion (SPEEDAM), Pisa, Italy, 14–16 June 2010; pp. 385–390. [Google Scholar]
  32. Du, S.; Liu, J.; Liu, T. Modulation and Close-loop Based DC Capacitor Voltage Control for MMC with Fundamental Switching Frequency. Power Elect. IEEE Trans. 2014, 30, 327–338. [Google Scholar] [CrossRef]
  33. Hagiwara, M.; Akagi, H. Control and Experiment of Pulse Width-Modulated Modular Multilevel Converters. Power Elect. IEEE Trans. 2009, 24, 1737–1746. [Google Scholar] [CrossRef]
  34. Parvin, K.; Lipu, M.S.H.; Hannan, M.A.; Abdullah, M.A.; Jern, K.P.; Begum, R.A.; Mansur, M.; Kashem, M.; Mahlia, T.M.I.; Dong, Z.Y. Intelligent Controllers and Optimization Algorithms for Building Energy Management Towards Achieving Sustainable Development: Challenges and Prospects. IEEE Access 2021, 9, 41577–41602. [Google Scholar] [CrossRef]
  35. Sajjad, H.; Milad, Z.M.; Behrooz, B. Optimal Allocation and Sizing of Synchronous Condensers in Weak Grids with In-creased Penetration of Wind and Solar Farms. IEEE J. Emer. Sel. Top. Circuits Sys. 2021, 11, 199–209. [Google Scholar]
  36. Tenti, P.; Paredes, H.K.; Mattavelli, P. Conservative Power Theory, a Framework to Approach Control and Accountabil-ity Issues in Smart Microgrids. IEEE Trans. Power Elect. 2011, 26, 664–673. [Google Scholar] [CrossRef]
  37. Tenti, P.; Mattavelli, P.; Morales-Paredes, H.K. Conservative Power Theory, Sequence Components and Accountability in Smart Grids. Przeglad Elektrotechn. 2010, 6, 30–37. [Google Scholar]
  38. Souza, W.A.; Liberado, E.V.; Silva, L.C.; Marafão, F.P.; Morales-Paredes, H.K. Load Analyzer Using Conservative Power Theory. Przeglad Elektrotechn. 2013, 89, 1–6. [Google Scholar]
  39. Jun, L.; Chencong, Z.; Zhouhua, X. Power and Current Limiting Control of Wind Turbines Based on PMSG Under Un-balanced Grid Voltage. IEEE Access 2021, 9, 9873–9883. [Google Scholar]
  40. Oscar, C.Z.; Jose, B.D.; Fernando, M.D.; Francisco, A.S.; Rafael, C.N. Control of Photovoltaic Inverters for Transient and Voltage Stability Enhancement. IEEE Access 2021, 9, 44363–44373. [Google Scholar]
  41. Gyu, S.L.; Pyeong-Ik, H.; Seung, M. Reactive Power Control of Hybrid Multi-Terminal HVDC Systems Considering the Interaction Between the AC Network and Multiple LCCs. IEEE Trans. Power Sys. 2021, 36, 4562–4574. [Google Scholar]
  42. Peng, L.; Grain, P.A.; Derrick, H.; Barry, W. Controlled Transition Full-Bridge Hybrid Multilevel Converter with Chain-Links of Full-Bridge Cells. IEEE Trans. Power Elect. 2021, 36, 23–38. [Google Scholar]
  43. Miodrag, B.; Dražen, D. Hybrid Modular Multilevel Converter for Variable DC Link Voltage Operation. CPSS Trans. Power Elect. Appl. 2021, 6, 178–190. [Google Scholar]
  44. Yaqian, Z.; Jianzhong, Z.; Fujin, D.; Zheng, X.; Jin, Z. Hybrid Modular Multilevel Converter with Self-Balancing Structure. IEEE Trans Ind. Appl. 2021, 57, 5039–5051. [Google Scholar]
  45. Chen, Y.; Pan, S.; Huang, M.; Zhu, Z.; Liu, Y.; Zha, X. MMC-MTDC Transmission System with Par-tially Hybrid Branches. CES Trans. Elect. Mach. Syst. 2021, 5, 124–132. [Google Scholar] [CrossRef]
  46. Mohamed, A.; Yousef, N.; Fahad, A.; Khaled, H.; Ayman, S.; Abdel, K.; Yusuf, A.T. A New Hybrid Dual Active Bridge Modular Multilevel Based DC-DC Converter for HVDC Networks. IEEE Access 2021, 9, 62055–62073. [Google Scholar]
  47. IEEE. IEEE Standard for Interconnection and Interoperability of Distributed Energy Resources with Associated Electric Power Systems Interfaces—Amendment 1; IEEE: Las Vegas, NV, USA, 2020. [Google Scholar]
  48. IEEE. IEEE Standard for Interconnection and Interoperability of Distributed Energy Resources with Associated Electric Power Systems Interfaces; IEEE: Las Vegas, NV, USA, 2018. [Google Scholar]
Figure 1. AC Type Microgrid.
Energies 14 07510 g001
Figure 2. DC Type Microgrid.
Energies 14 07510 g002
Figure 3. Hybrid/Advance Microgrid structure.
Energies 14 07510 g003
Figure 4. Microgrid Energy Management System.
Energies 14 07510 g004
Figure 5. Microgrid Flow Chart Energy Management.
Energies 14 07510 g005
Figure 6. Solar cell, array and equivalent circuit.
Energies 14 07510 g006
Figure 7. Input power and output current.
Energies 14 07510 g007
Figure 8. Proposed Microgrid System for DUT.
Energies 14 07510 g008
Figure 9. Proposed Equivalent Circuit for DUT Microgrid.
Energies 14 07510 g009
Figure 10. Pulse generator.
Energies 14 07510 g010
Figure 11. Generated Pulse for VSC.
Energies 14 07510 g011
Figure 12. In-Loop Filtering Algorithm.
Energies 14 07510 g012
Figure 13. (a) UPF Mode Operation, (b) PV Output Power, (c) Boost Converter Duty cycle, (d) PPPT Tracking, the blue is the tracking sequence while the green line is the error regulator (e) Boost Converter Duty Cycle, (f) PV Output Voltage, (g) Boosted Voltage, (h) PWM-VSC Converting 500 V to 260 VAC.
Energies 14 07510 g013aEnergies 14 07510 g013bEnergies 14 07510 g013c
Figure 14. Voltage rise with Zero Grid Reactive Power (a) load varies at 0.4 s to 0.6 s, and switched off at 0.6 s to 0.9 s, grid current increases. (b) Reduction in the load power between 0.4 s to 0.9 s (c) Increase in power to the grid due to reduction in the load between 0.6 s to 0.9 s. (d) Reactive power during unity power factor mode of the STATCOM. (e) Increase in the phase voltage.
Energies 14 07510 g014aEnergies 14 07510 g014b
Figure 15. (a) PCC Voltage, Grid Current, Load Current, and PV Current, (b) Grid Reactive Power (0–1.15 kVAR), (c) Grid Reactive Power (1.15–5 kVAR), (d) Phase Voltage, (e) Solar Irradiance, (f) Normal Rated Power, (g) Flow of PCC Voltage and Grid Current, (h) Grid Power, (i) Load Power and (j) Reactive Power.
Energies 14 07510 g015aEnergies 14 07510 g015bEnergies 14 07510 g015c
Figure 16. (a) PCC Line Voltage and Current, (b) Solar Irradiance, (c) Peak Power Point Tracking, the blue is the tracking sequence while the green line is the error regulator (d) PCC Phase Voltage, (e) PV Power Output, (f) DC Voltage, (g) Solar Voltage, (h) Grid Reactive Power and (i) DSTATCOM Voltage.
Energies 14 07510 g016aEnergies 14 07510 g016bEnergies 14 07510 g016c
Table 1. Grid RMS Value of Various Voltage/Current.
Voltage/Current Grid RMS % THD Value
V G r i d a b   = 14.14   kV ,   b c   = 14.14   kV ,   c a = 14.15 kV2.01%, 2.01%, 2.0%
Rated Load PVAs and Loads I G r i d   = I g Ig = 55.10 A, 0.99 pf, Ig = 55.10 A, 0.99 pf, Ig = 55.12 A, 0.99 pf.3.3%, 3.3%, 3.4%
I L o a d I a   = 59.10   A ,   0.99   pf ,   I b   = 59.22   A ,   0.99   pf ,   I c = 59.59 A, 0.99 pf.26.6%, 26.8%, 26.9%
P V C u r r e n t I s p v a   = 55.5   A ,   0.99   pf ,   I s p v b   = 55.5   A ,   0.99   pf ,   I s p v c = 55.56 A, 0.99 pf.16.01%, 16.01%, 16.21%
V G r i d a b   = 14.34   kV ,   b c   = 14.34   kV ,   c a = 14.34 kV5.3%, 6.3%, 5.4%
Unbalance Loads and PVAs I G r i d   = I g I g a   = 60.10   A ,   0.99   pf ,   I g b   = 60.10   A ,   0.99   pf ,   I g c = 60.12 A, 0.99 pf.4.3%, 4.3%, 5.4%
I L o a d I a   = 0   A ,   0.99   pf .   I b   = 15.1   A ,   0.99   pf   I c = 15.4 A, 0.99 pf.0%, 4.3%, 5.4%
P V C u r r e n t I s p v a   = 55.5   A ,   0.99   pf ,   I s p v b   = 70.5   A ,   0.99   pf ,   I s p v c = 69.56 A, 0.99 pf.18.3%, 25.3%, 22.4%
V G r i d a b   = 14.50   kV ,   b c   = 14.50   kV ,   c a = 14.54 kV0.6%, 0.6%, 0.45%
No-loads and PVAs I G r i d   = I g I g a   = 69.20   A ,   I g b   = 69.6   A ,   I g c = 69.9 A0.3%, 0.7%, 0.4%
I L o a d I a =   0   A ,   I b = 0   A ,   I c = 0 A0.0%, 0.0%, 0.0%
PV currents I s p v a =   69.20   A ,   I s p v b =   69.6   A ,   I s p v c = 69.9 A0.9%, 0.8%, 0.85%
Publisher’s Note: MDPI stays neutral with regard to jurisdictional claims in published maps and institutional affiliations.

