Article

Indoor Comfort, Thermal Indices, and Energy Assessment of Multi-Family Colonial Revival Style Buildings

by
Timothy O. Adekunle
Department of Architecture, College of Engineering, Technology, and Architecture (CETA), University of Hartford, West Hartford, CT 06117, USA
Energies 2021, 14(22), 7468; https://doi.org/10.3390/en14227468
Submission received: 15 August 2021 / Revised: 30 October 2021 / Accepted: 1 November 2021 / Published: 9 November 2021
(This article belongs to the Special Issue Buildings Energy Efficiency and Innovative Energy Systems)

Abstract

:
Colonial Revival style residences have unique architectural features amongst others. They are common multi-family residences in the United States with no or limited information about their performance. The research purpose is to assess indoor comfort, energy performance, and thermal indices in multi-family Colonial Revival style residences. The research questions include (i) Do Colonial Revival style buildings perform better than other old buildings? (ii) Do the buildings consume additional electricity than typical and other old buildings? The research examined four case studies in Hartford County, Connecticut. The investigation explored comfort surveys, monitoring, collection of actual electricity usage, and assessed thermal indices using mathematical models. The average indoor temperature of 25.4 °C and relative humidity (RH) of 61.3% are reported. About 67% of the residents are thermally comfortable. The research noted significance between thermal sensation and other variables, excluding how occupants feel about the air movement. The average number of hours of temperature exceeds 28.0 °C and 30.0 °C marks for over 11.4% and 2.5% of the time, respectively, except in one of the buildings. The mean indoor temperatures are within the applicable bands of the adaptive comfort models. The averages of actual thermal sensation vote (TSV) ranged from 3.32 to 4.37 on a 7-point sensation scale. The mean neutral temperatures varied from 24.2–25.6 °C. The average monthly electricity bill is within the national average for residences in summer, excluding in August. The mean wet-bulb globe temperature (WBGT) of 21.1–22.3 °C and summer simmer index (SSI) of 30.1–32.4 °C are calculated as feasible bands for thermal indices in the buildings. The basements are more comfortable than other spaces within the case studies. The research outcomes can be used for future developments of Colonial Revival style and other similar buildings. The study recommends interventions such as retrofit to improve the performance of some existing Colonial Revival style buildings, especially the older ones that are less insulated with outdated equipment and appliances.

1. Introduction

Colonial Revival style residential buildings have distinctive architectural features, forms, and significance in many parts of the United States (US) [1]. They are popular multi-family residences in the country [1,2], with no or limited information relating to their performance and the thermal comfort of occupants. The specific purpose of the research is to examine indoor comfort, energy performance, and thermal indices in multi-family Colonial Revival style residences. The research intends to address the following questions —(i) Do Colonial Revival style buildings perform better than typical buildings? (ii) Do the buildings use additional electricity than typical and other old buildings within and outside the region? The study is the first reported work that captures field data and presents the findings on indoor comfort, overheating, energy assessment, and thermal indices concurrently in multi-family residences. The objectives of the study include to:
(a)
Assess indoor thermal comfort of residents through field surveys of the buildings.
(b)
Evaluate energy performance, overheating, and understand the indices at which occupants may be prone to heat stress in summer.
(c)
Identify and discuss factors that could influence the thermal comfort of occupants in the residences.
(d)
Discuss possible approaches that could enhance occupants’ comfort within the thermal environment.
The study also intends to add to the body of knowledge by providing a set of data on thermal comfort in multi-family Colonial Revival style residences.
For decades, different studies have assessed occupants’ comfort in residential buildings in different climates [3,4,5,6]. To date, investigations have maintained that evaluation of thermal comfort of people is crucial to understand occupants’ perceptions of comfort [4,7], adaptation [7,8], thermal performance including overheating [9,10,11,12,13], energy performance [5], satisfaction [8], preference for air movement [8,11], occupancy patterns [14], personal control influence [8,15], daylight [16], sound, visual, and indoor environmental quality [4], as well as the overall well-being of users [4,5,11] within the thermal environment.
Existing research discussed the importance of the assessments of indoor comfort [4] and evaluated increasing temperatures in various buildings [9,10,11,12]. In these studies, different research approaches and techniques were applied [11,12], including computer simulation [9,11,13]. These investigations revealed that overheating is noted in many residences, especially in summer [9,11]. The studies recommended various strategies to improve the indoor thermal environment [9,11,13], and energy performance of buildings [5]. Previous investigations also recommended different adaptive measures to adjust the thermal environment during the occupied hours [12]. However, none of these investigations captured and assessed energy performance, occupants’ comfort, and thermal indices concurrently in multi-family Colonial Revival style residences built with timber.
Generally, historical timber structures including Colonial Revival buildings are constructed with timber-framed materials. A study examined the possibilities of improving thermal insulation of historical timber buildings to enhance the thermal environment [17]. Occupants’ comfort and summertime temperatures were investigated in residences constructed with prefabricated engineered timber materials such as glued-laminated timber [18], laminated veneer lumber, oriented strand board, structural insulated panels, and cross-laminated timber [11]. Existing research noted that thermal mass and insulation are critical parameters for enhancing the performance of lightweight or timber buildings [11,17].
In the New England part of the US, Colonial Revival style timber-frame residences (multi-family) are popular. According to the Historic Preservation Design Guidelines [19], the main features of Colonial Revival style buildings include side-gable or gambrel roof, double-hung multi-pane windows, dominant entrance in the façade with an enhanced pediment supported by slender columns or pilasters, as well as sidelights and fanlight surround at a front entrance. Also, a study discussed the architectural patterns of a classic Colonial Revival style building [1]. The patterns include an arched portico with classical columns, dormer windows, soldier course, and a prominent front entrance. These features showcase the significance of Colonial Revival style buildings.
A report on the Hartford region’s building stock stated that over 40% of the existing buildings in the county are completed prior to 1950 [20]. The report highlights the significance of multi-family Colonial Revival style residences in the study area [20]. The current study examined timber-frame dwellings because over 90% of the US residences are built with timber products [21]. As a result, this study evaluates the performance and occupants’ comfort in multi-family Colonial Revival style timber-frame buildings.
A study by the US Energy Information Administration [22] explained that in 2020, the residential and commercial segments account for approximately 22% and 18% in that order of the total energy used in the country within the same year. According to Connecticut Comprehensive Energy Strategy (CCES), the residential sector accounts for almost 50% of the total energy consumption in the sector within the state of Connecticut [23]. The report [23] also mentioned that many older residences in the region are not properly insulated, utilize old and less efficient appliances and equipment than newer buildings. Moreover, older houses used more fuel oils for space heating than newer houses in the state. Likewise, the percentage of residences that used fuel oil for space heating in the state of Connecticut exceed the regional and national averages for the Northeastern region and the United States; while the percentage of houses that considered natural gas for heating in the Northeast and US exceeded the average for Connecticut [24,25]. The reports revealed the energy profile for the country and region. However, existing research did not provide any information regarding the energy performance of Colonial Revival residences in the region.
Concerning the computation of thermal indices, existing research has outlined different models for calculating thermal indices in various thermal environments [26,27,28]. Some of the indices include the apparent temperature (AT), wet-bulb globe temperature (WBGT), standard effective temperature (SET), universal thermal climate index (UTCI), predicted mean vote (PMV), predicted percentage of dissatisfied (PPD), physiological equivalent temperature (PET), predicted heat strain (PHS), and summer simmer index (SSI). The current study considered the WBGT and SSI models for the computation of thermal indices. Future research will consider other indices.
The WBGT is the combined effect of natural wet bulb temperature (Tnwb °C) and black globe temperature (Tg °C). In Equation (1), WBGTind stands for indoor WBGT. The WBGT has been extensively explored in many studies using Equation (1) outlined in this study [26,28]. The SSI is a recent thermal index, propounded by Pepi and presented at the 2000 American Meteorological Society (AMS) Annual Meeting [27]. The index (SSI) defines the bioclimatic stress caused by overheating, and it is originated from physiological tests and human experiments carried out for over seven and half decades [27]. Equation (2) can be applied to determine the SSI in different locations and warm seasons including summer. In Equation (2), Tf stands for air temperature in degrees Fahrenheit (°F) and RH stands for relative humidity (%), on condition that air temperature values vary from +22.0 °C to +53.0 °C. The SSI formula can also be expressed in SI units. In a situation where air-temperature (Tf) values have to be converted from Fahrenheit (°F) into Celsius (°C) degrees, Equation (3) applies. In Equation (3), Ta stands for air temperature in degrees Celsius (°C).
WBGTind = 0.7Tnwb + 0.3Tg
SSI = 1.98(Tf − (0.55 − 0.0055 (RH)) (Tf − 58)) − 56.83
Ta (°F) = (9/5) × Ta (°C) + 32
Furthermore, internal temperatures exceeding the 28 °C thresholds are considered for assessing occupants’ comfort within the thermal environment [29]. The benchmark is crucial for the assessment of occupants’ comfort across various categories of age and gender [8]. In this study, internal temperatures that exceed the benchmark for over 1% of the time are considered as an indicator for the possibility of overheating or excessive temperatures within the buildings [30]. Moreover, the study also considered the ASHRAE-55 and EN 16798-1 adaptive thermal comfort standards and thermal comfort surveys, including actual thermal sensation votes (TSV) to assess occupants’ comfort within the thermal environment [29,31,32]. The approaches enhanced the study to capture occupants’ comfort, perception, thermal indices, and performance of the case study buildings.

2. Materials and Methods

2.1. Case Study

The case studies (multi-family Colonial Revival style buildings) are built with timber (timber-frame). They are in Hartford County (41.7658° N, 72.6734° W), Connecticut, US (Figure 1a). According to Koppen’s Climate Classification, the study area can be classified as mild temperate, fully humid, hot summertime, and cold in winter. The location falls between latitudes of 30° and 45°. Each of the case buildings has two family units with an average plot area of about 689 m2. The mean floor area of the case studies is 144 m2. In each of the units, the spaces include a living area, dining/kitchen zone, and a half-bath on the lower floor. On the upper floor, each unit has two bedrooms and a full bath. The unit also has a basement, and it is primarily utilized for laundry and other activities such as playing zone in cold seasons. The field measurements were considered in the living rooms, bedrooms, and basement zones. Typically, between three and four occupants are residing in each of the family units. The buildings are naturally ventilated in summer. According to the information gathered during the field investigation, the average U-values of the exterior walls ranged from 0.30–0.50 W/m2K. The average U-value of 0.35 W/m2K is estimated for windows and doors. In existing research that investigated buildings built with engineered timber products [8,11], the U-values of the walls varied from 0.12–0.16 W/m2K, roofs ranged from 0.12–0.20 W/m2K, windows varied from 1.37–1.98 W/m2K. The U-values of the walls and roofs of the case studies are higher than the values reported in the previous investigations and vice-versa for the windows. This study discussed the field measurements carried out in the four (HMLTLL, HMLTBS, HMLTBB, and HMLTFR) case studies examined during the summer surveys. Figure 1b shows the views of one of the case studies.

2.2. Field Surveys

The investigation utilized field surveys to gather data for analysis. The research techniques include physical measurements of environmental variables (such as temperature, relative humidity, dew point, and air velocity), comfort surveys of the residents as the research approaches. Some of the existing investigations in the field of thermal comfort have utilized the research techniques considered in the current study [8,9,12,28]. The environmental variables were recorded at every 60 min using HOBO sensors placed on the internal walls at 1.7 m above the floor. A height of 1.7 m is a mean height of a person in a non-sedentary position [29]. Additionally, a hand-held sensor was considered for on-spot measurements of air velocity in the case study buildings. Measurements of air velocity were not carried out at 60 min intervals throughout the field surveys due to some limitations such as the conditions given for monitoring the case studies.
During the field surveys, the study also considered measurements of environmental variables at 1.1 m above the floor in some of the case study buildings. The current study considered the measurements of variables at 1.7 m above the floor level for different reasons. Firstly, the measurements at 1.7 m were captured and provided more data for analysis. Moreover, the residents of the case studies preferred that the sensors should be installed at a higher level than 1.1 m to avoid or minimize disruptions of activities during the field surveys. ANSI/ASHRAE Addendum stated that environmental variables such as air temperature, average air speed, etc., can be measured at the 0.1 m, 0.6 m, and 1.1 m levels for seated occupants while measurements for standing occupants can be carried out at the 0.1 m, 1.1 m, and 1.7 m above the floor levels [29,33]. Existing research has also carried out measurements of environmental parameters within indoor spaces at all the heights (0.1 m, 0.6 m. 1.1 m, 1.7 m) [34], at 1.7 m above the floor level [35], and other heights than the ones specified by the ASHRAE standards [36]. Additionally, there is a limited number of data loggers to measure variables at different heights implied that measurements can be taken only at one or two heights within the case studies. Therefore, it was considered necessary to install the data loggers at a person’s head/neck region of the residents as they move from one space to another. This approach will help to better observe the thermal conditions at the region of a person’s face and neck, which, because of being persistently exposed, could be most susceptible to the thermal environment [35]. As a result, the variables were measurement at the height of 1.7 m above the floor level.
The field surveys were carried out for three months in the summer of 2017 (July–September). The outdoor weather data observed at a meteorological station near the study location were explored for analysis. The meteorological station is one of the approved national weather stations in the US. The station utilizes measuring devices and equipment that meet the requirements stipulated by the US National Weather Service Agency. The data from the environmental monitoring of the case studies were used to calculate the thermal indices. As previously stated, the number of hours of temperatures that exceed the applicable benchmarks, and the applicable thermal comfort models are utilized [29,31].
The comfort surveys were administered to the occupants of the case studies. The occupants were asked to complete the comfort surveys (questionnaire) three times a day (that is, morning, afternoon, and evening). The comfort surveys captured questions on thermal sensation, acceptability, satisfaction, lighting level (visual comfort), preference for fresh air movement into the spaces, sound level, level of control, and other important questions. The questionnaire can be completed within 5 min. In terms of the duration of the comfort surveys, the timeline runs concurrently with the field measurements. Eight (8) people participated in the comfort surveys with an average of two (2) participants per the thermal environment analyzed in this study. In this paper, 110 out of 112 questionnaires completed and retrieved from the residents were analyzed. The data were checked and analyzed by utilizing statistical software (such as Statistical Package for the Social Sciences- SPSS and Excel) to develop graphs and establish associations between the various parameters. While using the SPSS, the sensation scale of −3 to +3 (cold to hot) was modified to 1 to 7 with 4 representing “neutral” to simplify the analysis. Likewise, the scales for other variables such as thermal comfort, thermal preference, etc. were modified accordingly. Regression analyses, relevant charts, and statistical tests are explored to establish relationships between the variables. The current study discussed the outcomes on thermal sensation, thermal preference, comfortability, thermal acceptability, and level of control satisfaction. Other variables assessed during the comfort surveys will be discussed in a separate study.
Additionally, the study also considered the calculation of thermal indices (WBGT and SSI) to determine the temperatures at which the residents are vulnerable to overheating in summer. The environmental parameters measured during the field surveys were considered for the computation. In addition, the research collected the actual energy data (electricity) for more than a year to understand the energy performance of the case study buildings. The appliances that utilize electricity in the case studies include ranges, refrigerators, microwave ovens, dishwashers, freezers, clothes dryers, washing machines, etc. The study compared the actual electricity usage in the case study buildings with the mean data for conventional (baseline) residential buildings in the state of Connecticut, New England, and US averages. The research techniques employed in the study helped to capture occupants’ comfort, thermal indices, and energy performance of the case study buildings.

2.3. Analysis of Data

The analysis showed that over 67% of the comfort surveys were completed by female residents while the remaining 33% of the questionnaires were done by male participants. In terms of age, the survey participants are over 18 years. More than 80% of the participants are between ages 31 and 45. The comfort surveys revealed that the residents are either young adults or adults. They are capable and can perceive and rate the thermal environment of the case studies. Table 1 presents the distribution of the mean, standard deviation, variance of gender, thermal sensation, thermal acceptability, comfort, and preference of the residents during the field surveys.
The average outdoor temperature of 21.7 °C was recorded for the duration of the field surveys. The maximum of 34.0 °C and minimum temperatures of 8.0 °C in were reported during the investigation. The average maximum temperature of 32.7 °C and the average minimum temperature of 10.7 °C were recorded for the study location. The average outdoor dew point was 15.7 °C. A mean RH of 68.7% was also noted. The mean outdoor WBGT 19.1 °C and SSI of 26.3 °C were computed for the location. The months captured for the field surveys are the warmest months of the year (Figure 2). Table 2 highlights the summary of the outdoor data for the duration of the field surveys. The study also revealed an average of 7 cooling degree days per month for the duration of the surveys.
The historical data for the study location were sourced from CT Weather History [37]. By comparing the outdoor temperatures for the warm period (May–September) between 2016 and 2017, Figure 3 showed that the mean values for the duration of the field surveys in 2017 were slightly lower than the mean values reported in 2016 (the summer months before the period of the surveys). The analysis revealed the possibility of overheating in the case study buildings when heat waves happen for successive days. Additionally, the cooling degree days are noted during the field surveys with the highest cooling days reported in July. Moreover, the outdoor temperatures exceed 30 °C for many hours for some days in each of the months during the field investigation.

3. Results

The estimation of the average number of hours spent indoors daily revealed that about 88% of the time was spent indoors per day. More than two-thirds of the respondents are female. During the surveys, most of the participants were either working from home, working night shifts, or on summer vacation. These findings may contribute to the estimated higher number of hours spent indoors per day in the case studies. The result conforms to the finding from existing research in the field that on average, people in the developed nation, particularly in the United States (the location of the field surveys) spent close to 90% of their time indoors daily [38]. The average sensation value of 3.25 (where 1 signifies cold, 0 stands for neutral, and 7 stands for hot) was computed during the comfort surveys. Only 10% of the residents noted that they feel “warm” or “hot” within the thermal environment. Approximately 79% of the respondents prefer to be “cooler” or “no change” within the thermal environment. Additionally, about 67% of the occupants are thermally comfortable within the indoor spaces of the case study buildings (Table 3).
The results on further statistical tests (including, one-way ANOVA, Pearson correlation) at the 95% level of confidence to establish relationships between the variables assessed during the comfort surveys revealed that significance is reported between thermal sensation and thermal comfort (<0.001). The occupants that feel less warm are thermally comfortable within the case studies. Significance is also noted between thermal sensation and thermal acceptability (<0.001). The residents that indicated that the thermal environment is acceptable to them feel less warm. However, significance is not reported between thermal sensation and how occupants feel about air movement (0.008). The group of residents that feel less warm indicated they needed more air movement into the buildings. Additionally, a weak correlation is found between thermal sensation and thermal acceptability. Table 4 and Table 5 summarize the results of the statistical tests between the variables assessed in this study.
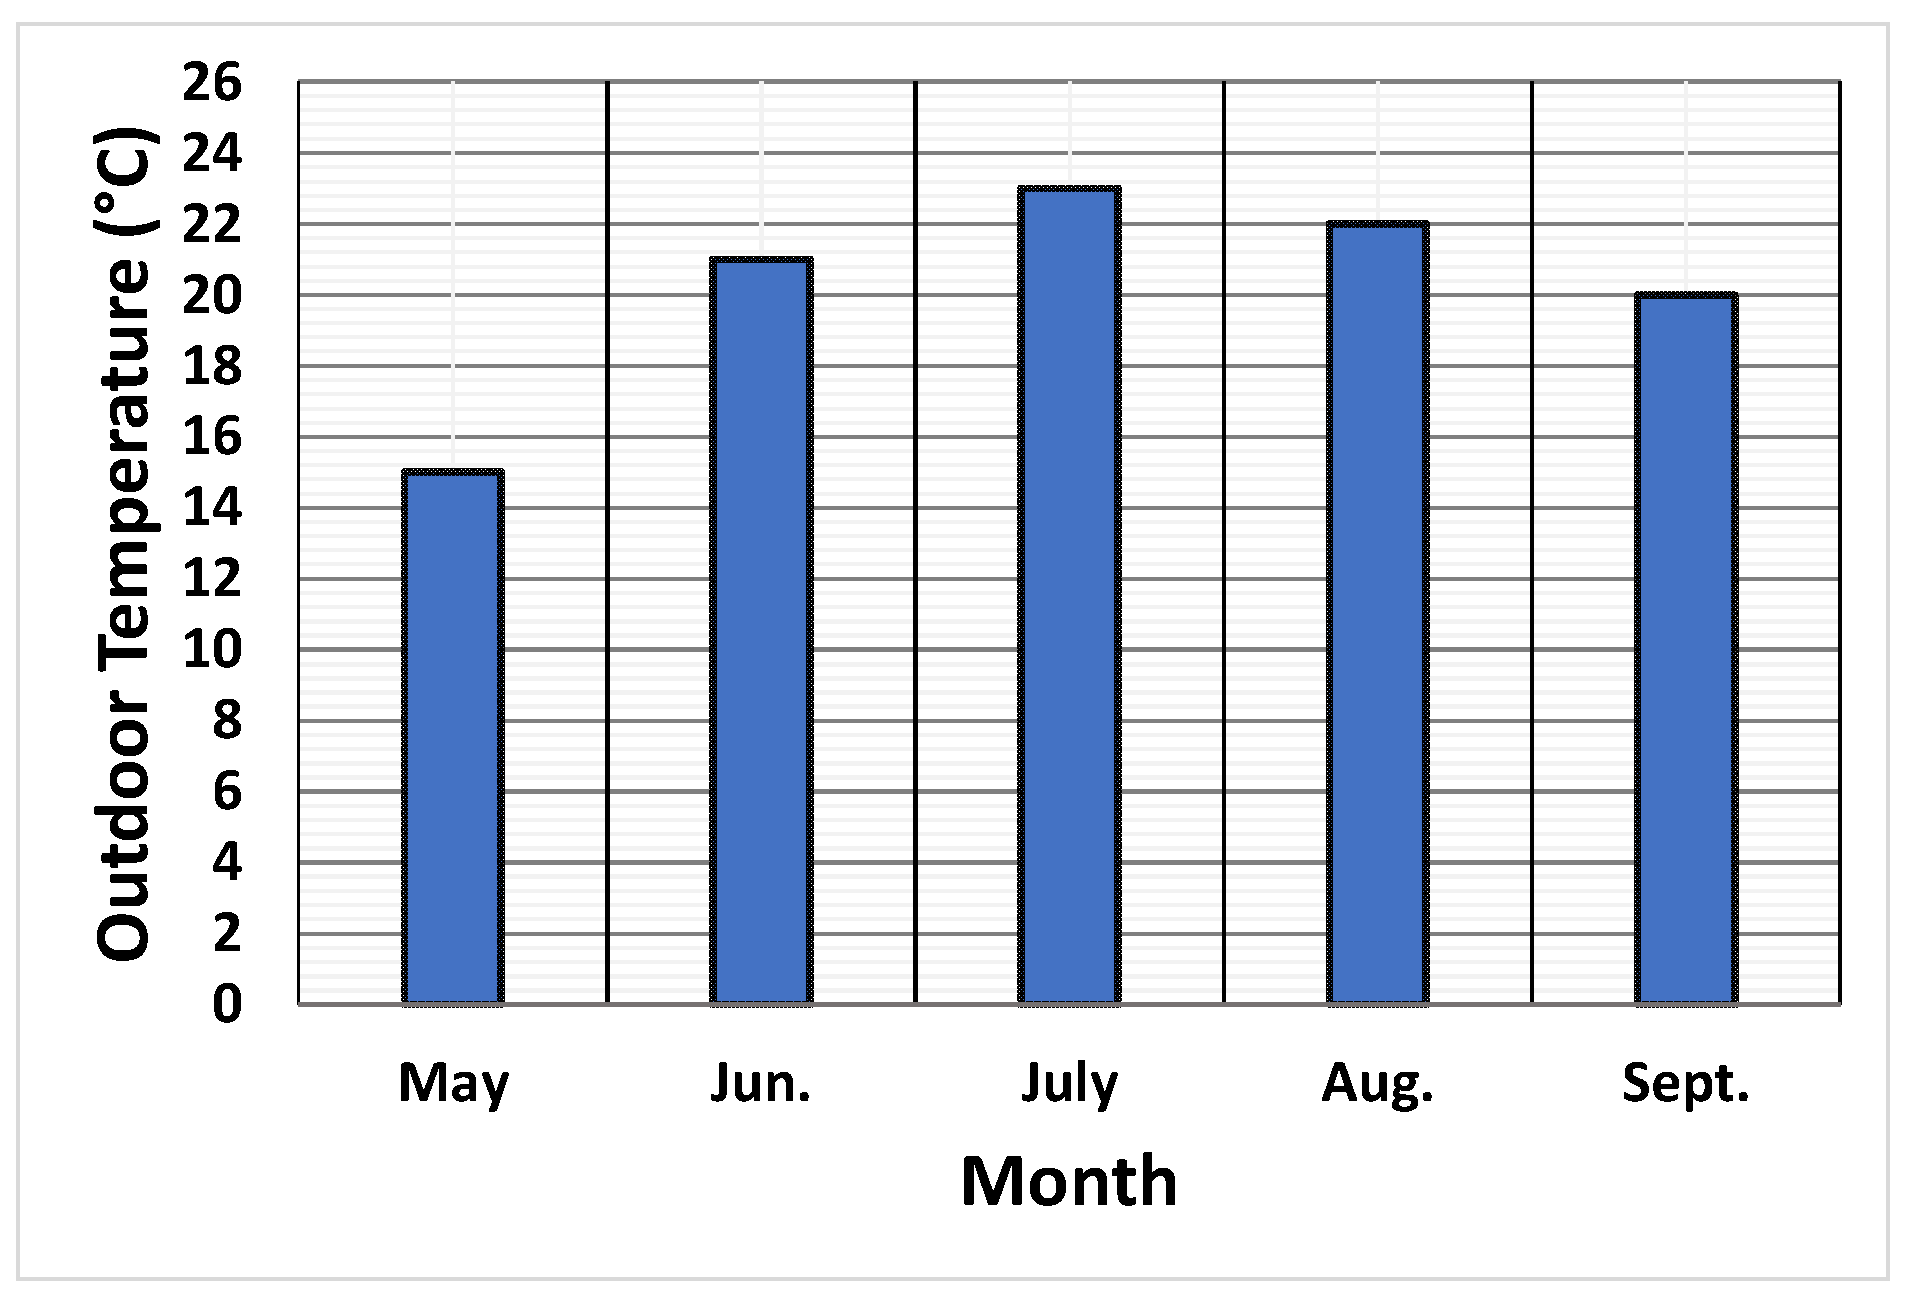
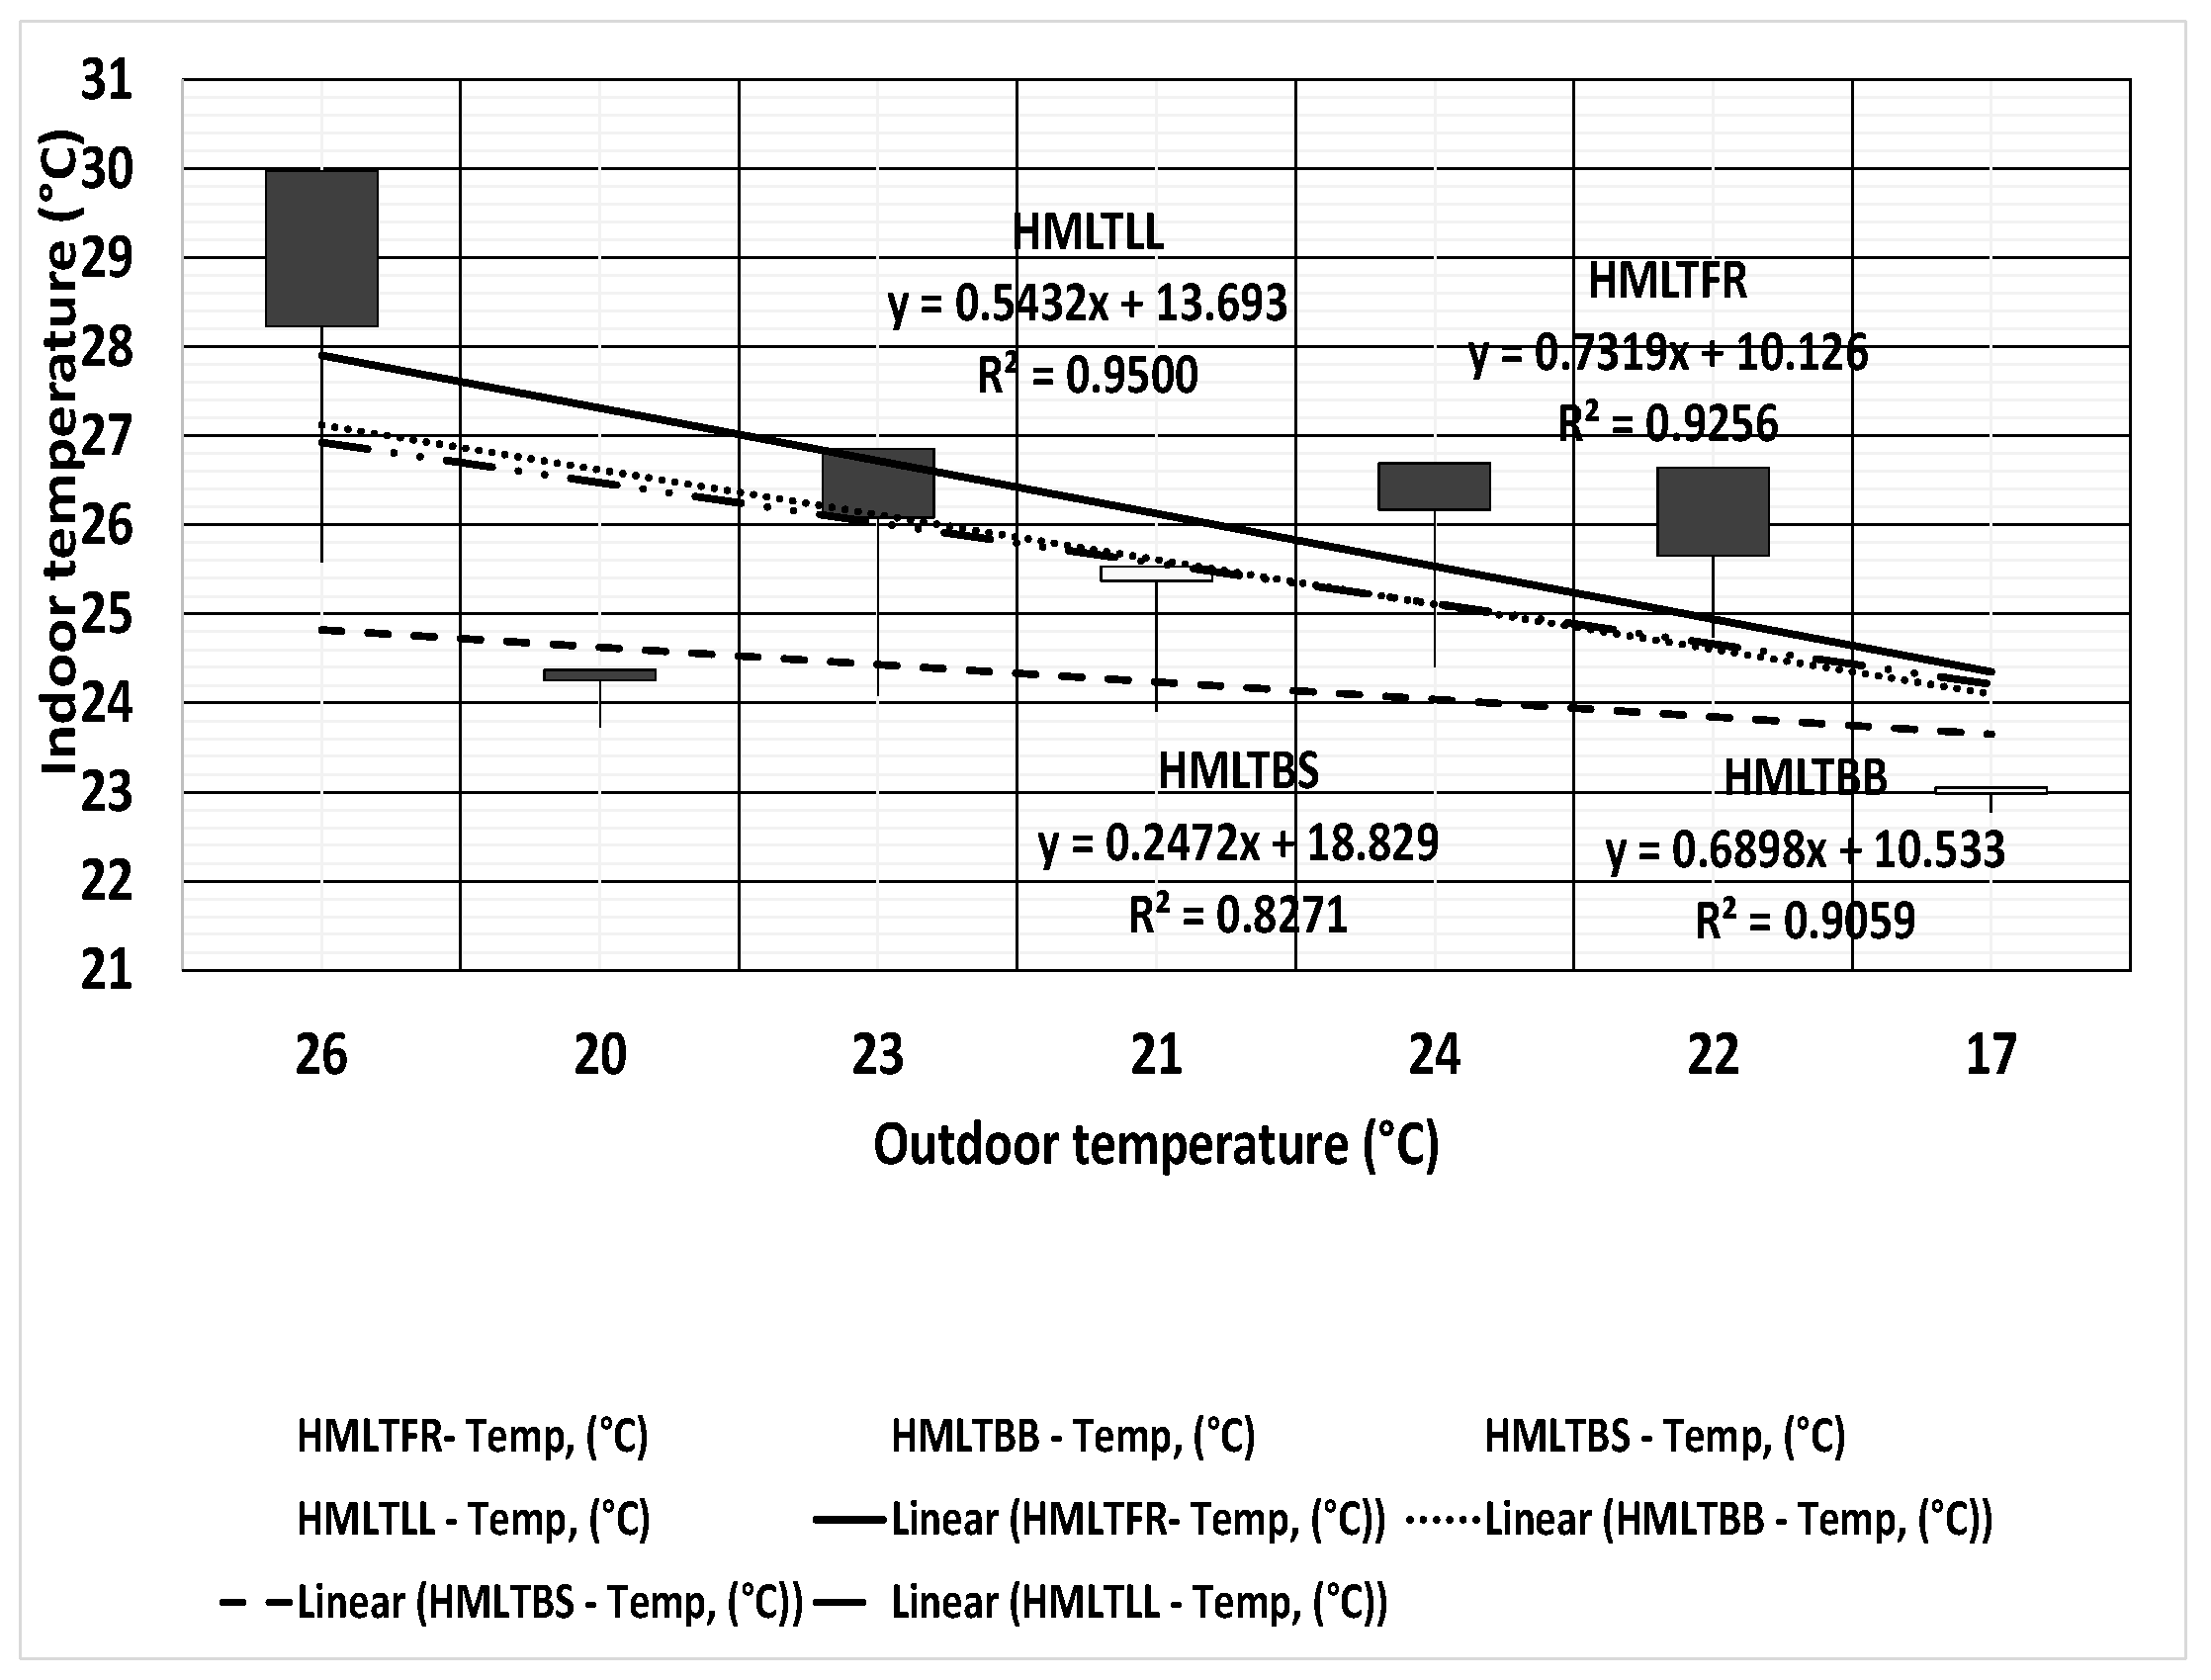
The average indoor temperatures within the case studies varied from 24.2 °C to 26.1 °C. The mean RH ranged from 59.0% to 65.2%. The average dew point varied from 17.0 °C to 17.5 °C. The outcomes revealed that the average temperatures were below the 28.0 °C mark. Across the case studies, higher temperatures are noted within the spaces on the upper floors than those on the lower floors during the field surveys. The votes on the sensation revealed higher responses on the less warm portion of the sensation scale in August and September than in July. For the on-spot measurements of air velocity, an average of 0.2 m/s was measured across the case study buildings.
As previously noted, most of the Colonial Revival style houses in the study location are older buildings with less insulation, and sometimes require updates of building envelopes, interior spaces, equipment, and appliances, as well as other components. Moreover, these houses usually have low thermal mass, and these issues may be influencing factors to the increasing temperatures observed in the case study buildings. The outcome aligns with existing research that thermal mass is a critical variable affecting the thermal performance of buildings that are built with timber materials [11]. The findings showed the internal temperatures are within a range of approximately 2.2 °C to 6.5 °C (Figure 4).
On the one hand, HMLTFR with a southeast orientation is the warmest building. On the other hand, the lowest temperatures are reported in HMLTBS. The larger portion of HMLTBS is below the ground level. The configurations (such as floor arrangement, design, area, orientation, layout of spaces, arrangement of openings, etc.) of HMLTBS may be influencing factors causing the decreasing temperatures reported in the case study building. The study noted that the ground cooling approach which involves incorporating basements may be one of the strategies to minimize increasing temperatures in buildings. However, this strategy would require further assessments to determine the costs of initial installation and maintenance.
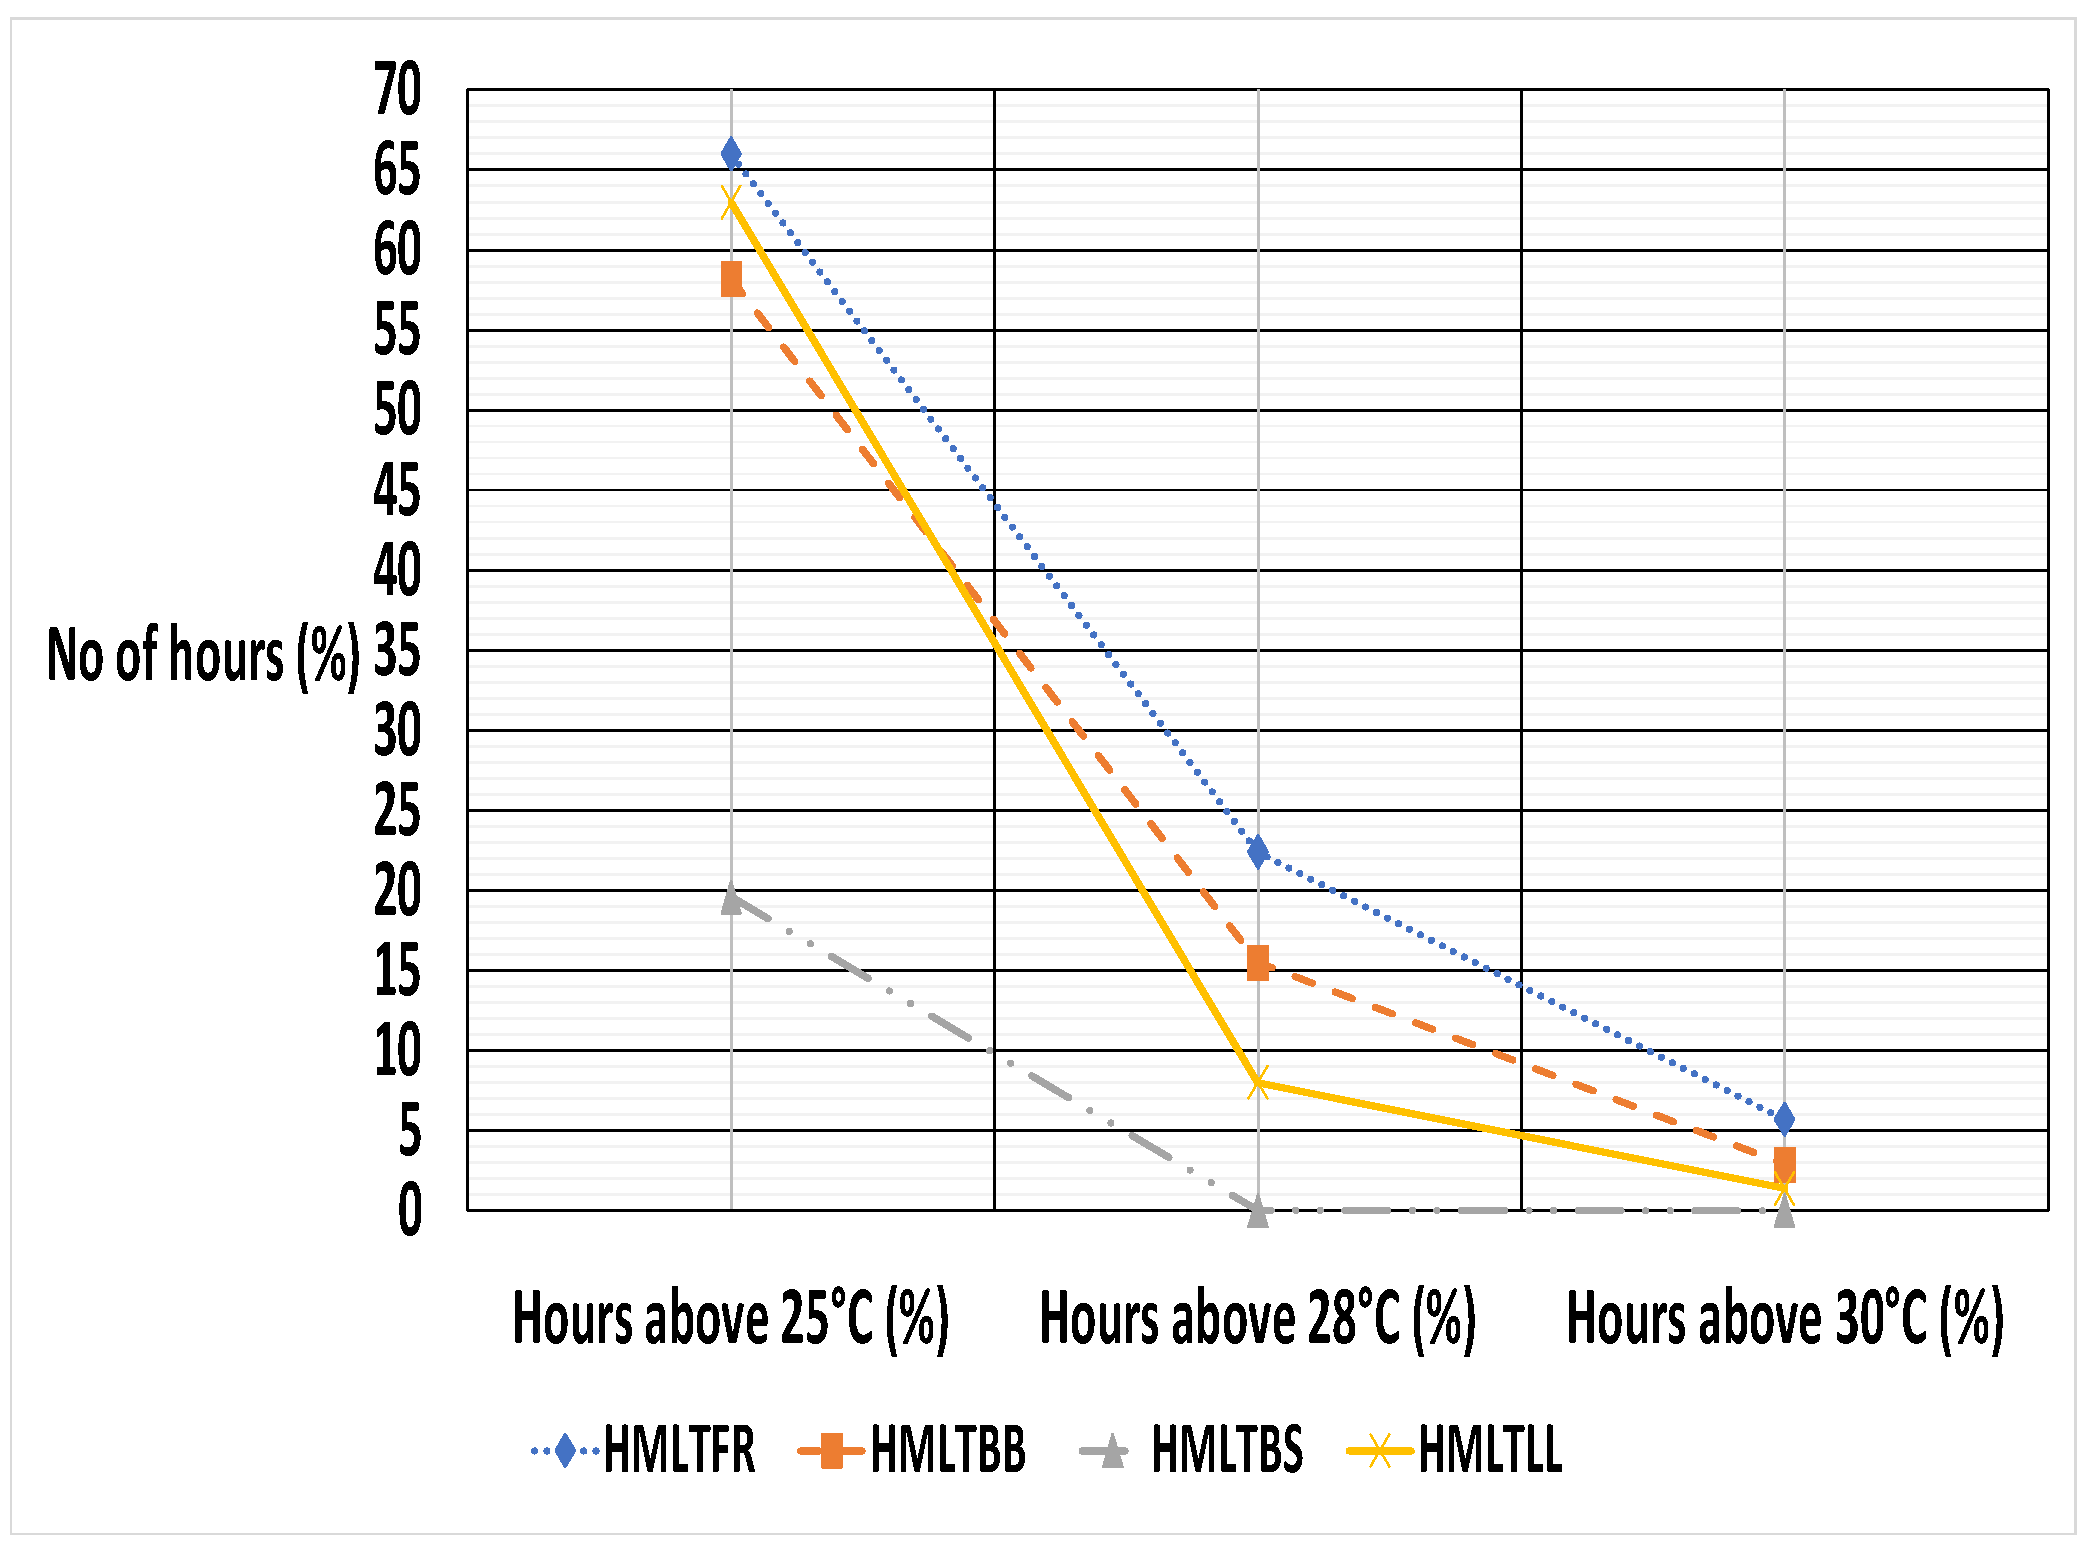
The study also considered the number of hours of temperatures that exceed the 28 °C mark. The indoor temperatures exceed the 28 °C and 30 °C benchmarks for over 11.4% and 2.5% of the time in that order in the case studies except for HMLTBS (Figure 5). The findings revealed the frequency of excessive temperatures during summer in the buildings which may affect occupants’ comfort and well-being.
Across the case studies, 53% of the residents are satisfied with the level of control provided in the residences. The study revealed that the WBGT and SSI ranged from 21.1 °C to 22.3 °C and 30.1 °C to 32.4 °C, respectively in the case studies (Table 6). The investigation highlighted higher WBGT and SSI values are computed for HMLTFR than other case study buildings discussed in this study. The combined average WBGT of 21.9 °C is computed for the case studies. For the SSI, the combined mean value of 31.5 °C is computed for the case studies. The investigation revealed the possibility of moderate thermal stress within the case studies. By applying the adaptive thermal comfort models of ASHRAE-55 and EN 16798-1 [29,31], the findings showed the mean temperatures are within the acceptable limits of different categories for most duration of the surveys (Table 7). However, the hourly temperatures exceed the applicable limits of the adaptive comfort models. The findings suggest that the residents are susceptible to the risk of overheating during extreme summer.
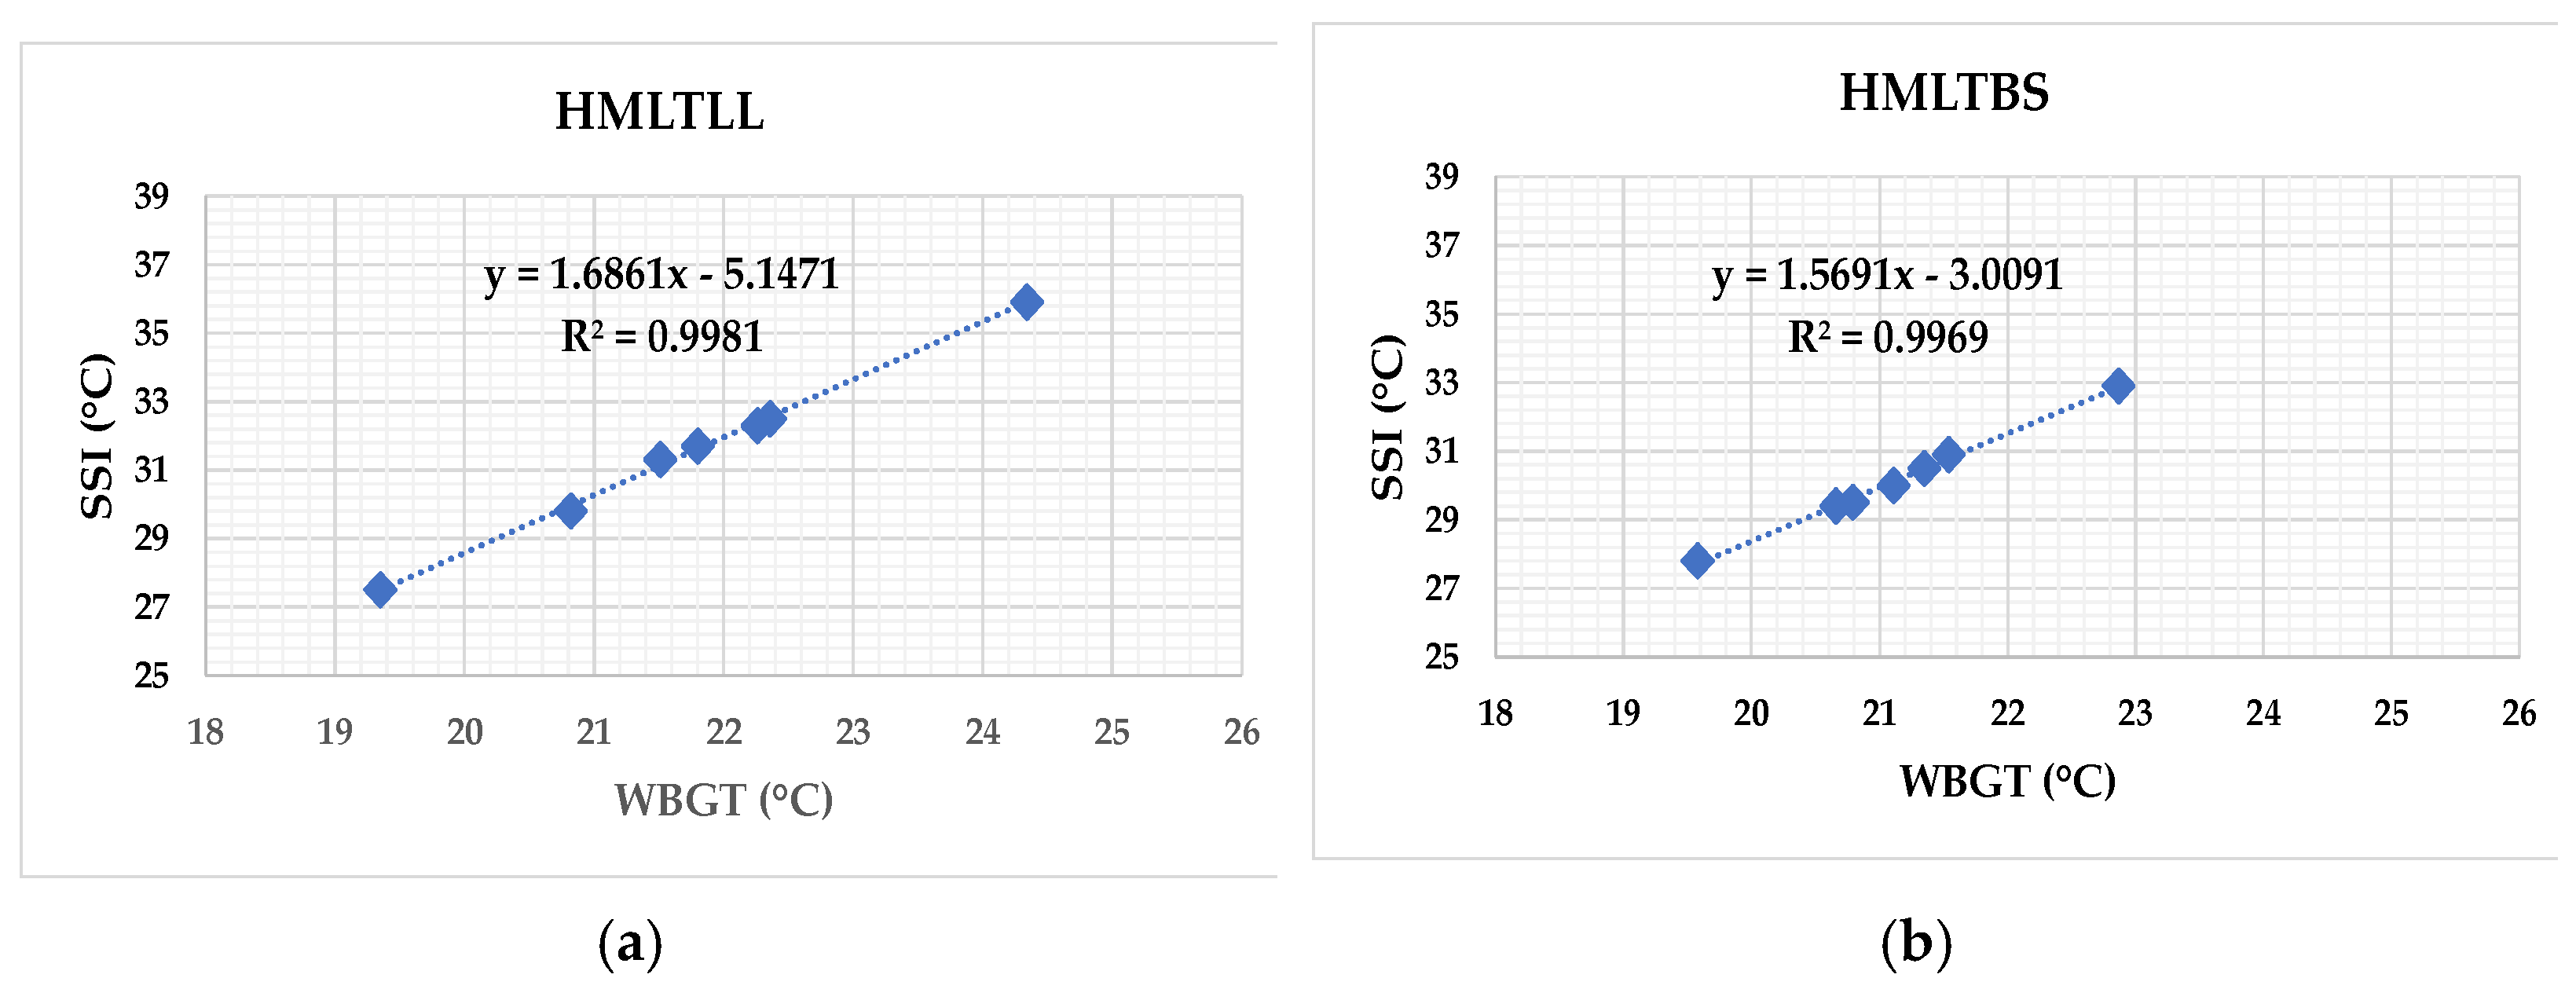
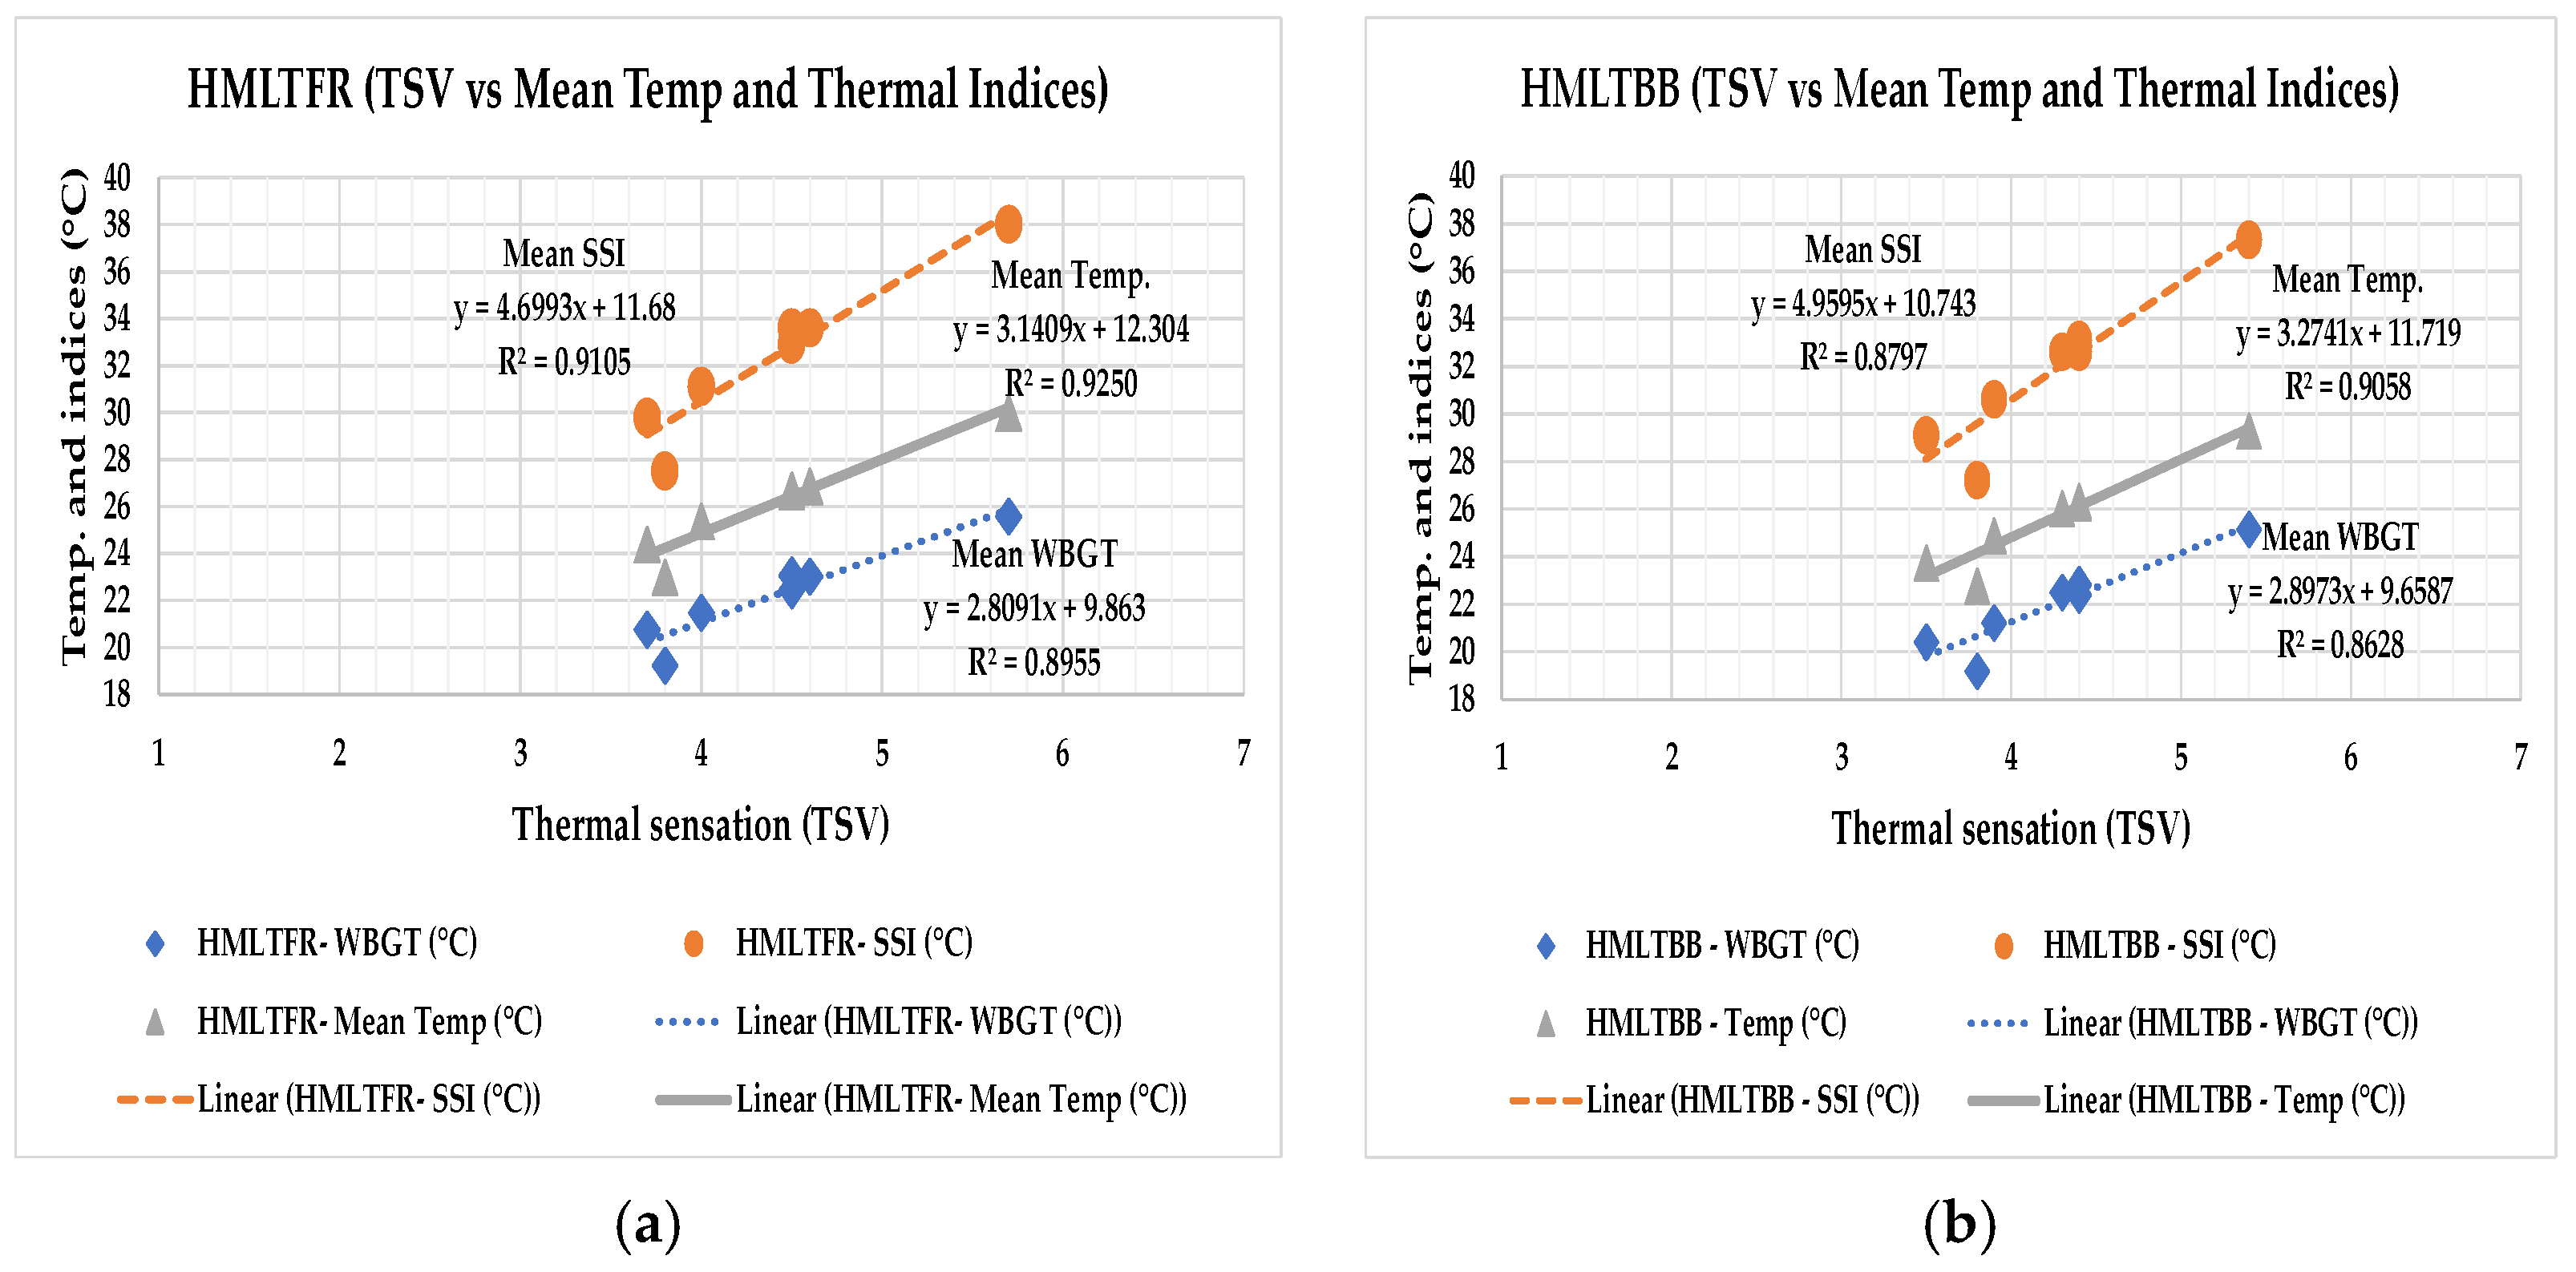
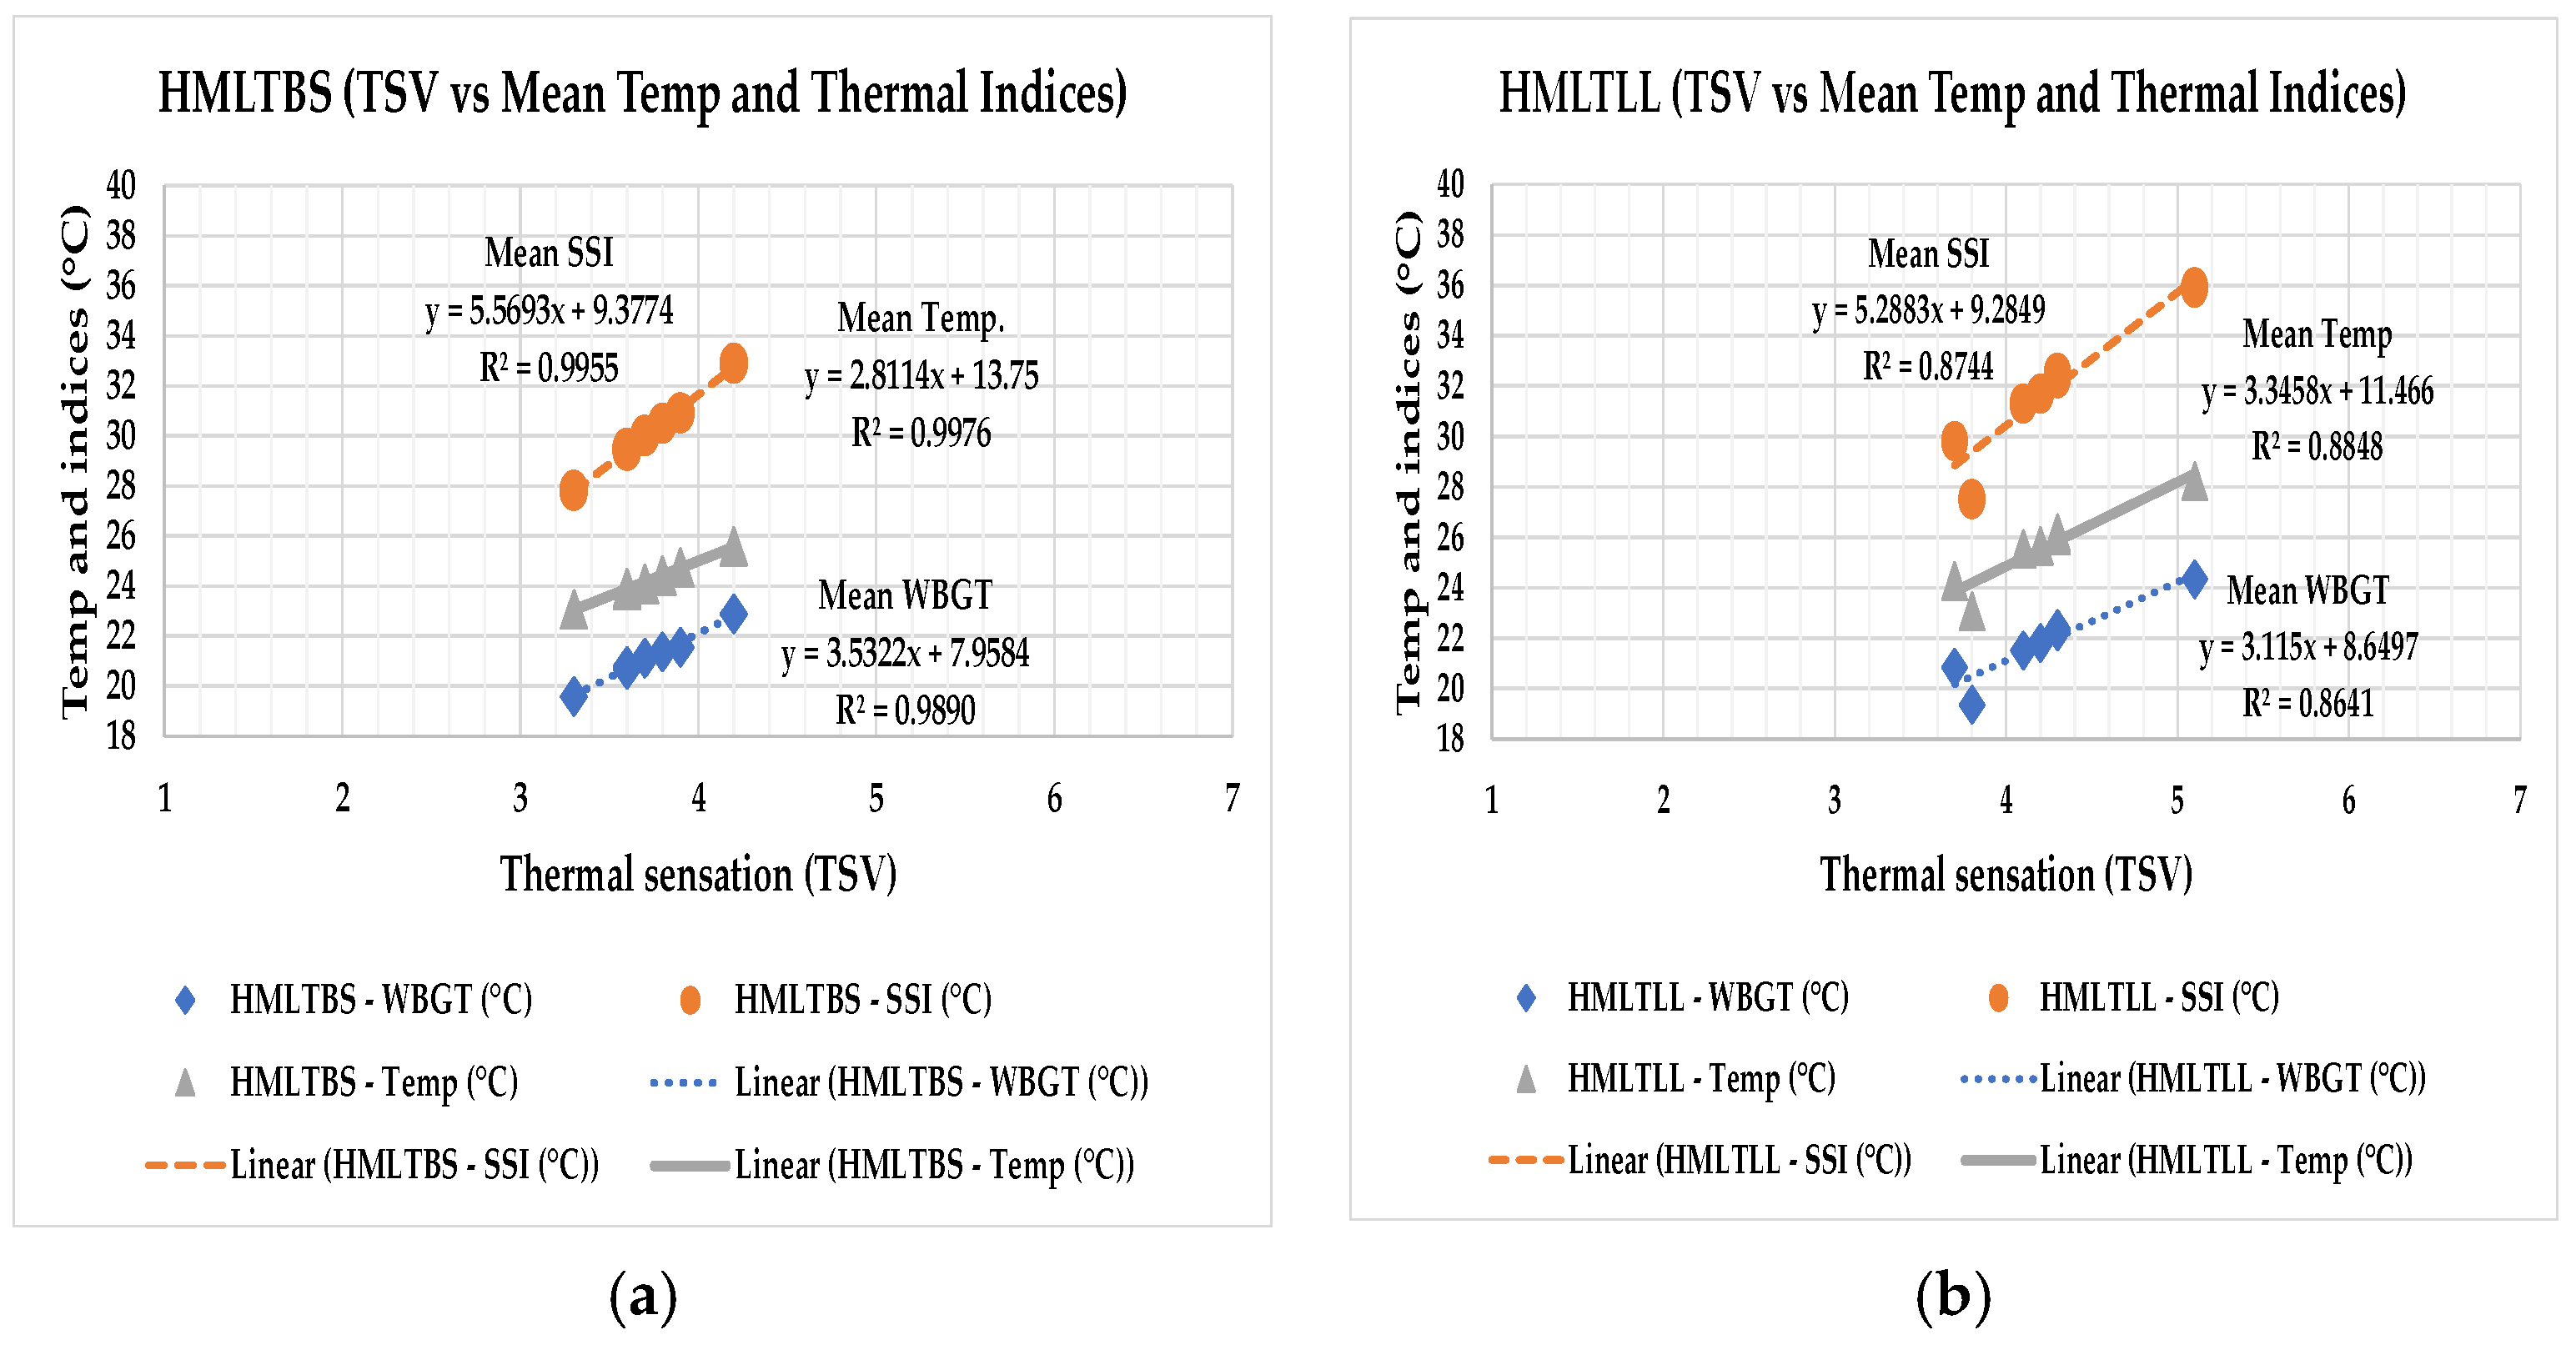
The regression analyses established associations between the WBGT and the SSI values. The study showed strong associations are found between the thermal indices (Figure 6 and Figure 7). The investigation revealed that more than 99% of the data gathered during the field surveys point that a rise in WBGT values leads to an increase in SSI values. The findings also highlighted that higher heat thermal indices are noted in this investigation than existing research [28]. The study considered correlations between the mean thermal indices and actual thermal sensation—TSV (Figure 8 and Figure 9). Strong correlations are found between the mean thermal indices and TSV. The results revealed the mean neutral temperatures ranged from 24.2 °C to 25.6 °C within the case studies. The correlations showed that lower neutral temperatures for WBGT than those values computed for SSI in the buildings.
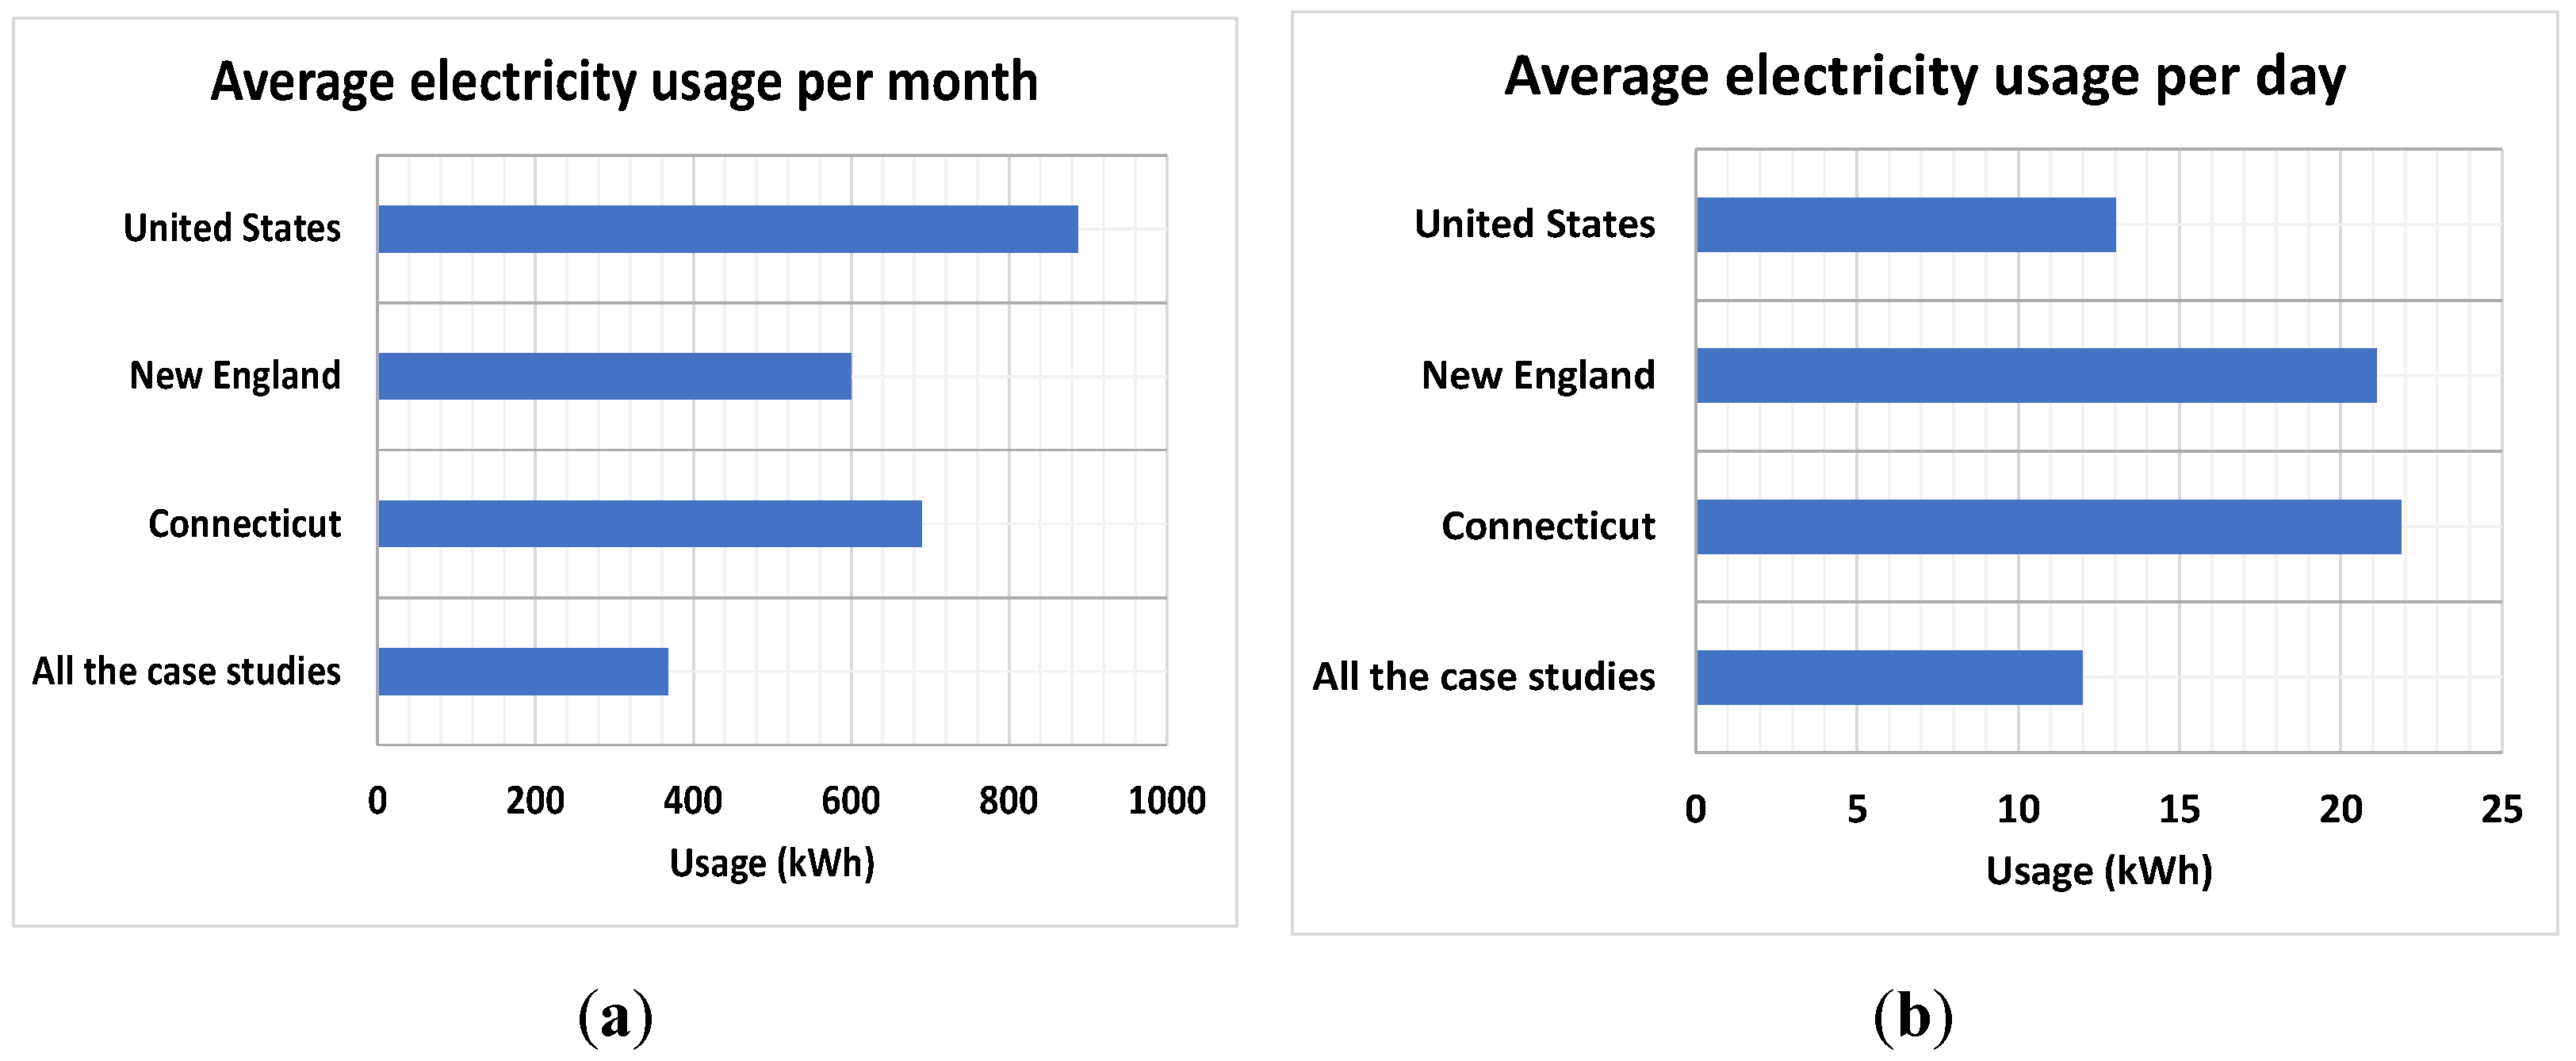
The study considered the energy assessment of the case studies to understand their energy efficiency level. The results of the energy assessment of the case study buildings are presented in Table 8. Moreover, the monthly averages of the energy consumption are compared to the averages of monthly energy usage for a similar size of buildings in the state of Connecticut, New England, and the US (Figure 10 and Figure 11). According to US Energy Information Administration [39], the average monthly electricity bill for US residences declined between 2018 and 2019 due to a decrease in average energy consumption. Comparing the mean energy data from the case studies with the averages of the state, New England, and the United States, the findings revealed the mean monthly energy usage in the case studies is below the state, regional and national averages. Moreover, the mean monthly residential electricity bill in the case studies is significantly less than the mean value for the state of Connecticut and slightly less than the mean average for New England homes [40]. However, the mean monthly residential electricity bill during the summer months especially in August in the case studies exceeds the national average ($115.49).
The average energy usage per day in the case studies is within the same range as the national average but less than the mean energy usage per day for the state and region. In one of the case studies, the monthly electricity bill exceeds the mean values for the state of Connecticut, New England, and the United States. The case studies considered gas for space heating in winter. This factor causes lower electricity usage reported in winter than summer. Even though the mean values of electricity usage in the case studies may be lower than the values obtained for the state, region, and the United States, the case studies are not energy efficient. In the literature, the comparable data are for residences that are bigger including floor areas than the case studies considered in this study. The study suggests retrofitting to improve the energy performance of some Colonial Revival style buildings, especially the older ones with less insulation and outdated equipment and appliances.

4. Discussion

The occupants’ responses on the sensation during the field surveys revealed that some of the residents feel “warm” or “hot” in summer. The result on the sensation aligns with the findings from existing research on occupants’ sensation in buildings [8,28]. The percentage of the respondents that feel warm in the current study is significantly less than the percentage of the residents that feel warm in previous research [8,11]. The research outcome on thermal preference also agrees with the results from other studies on the performance, occupants’ perception, and adaptation of comfort and in buildings [8,11]. A higher rate regarding the overall indoor thermal comfort is noted in this study than in previous research [8]. Since most of the occupants of the case studies in the current research are renters, the outcome on higher rate regarding the percentage of those that are thermally comfortable with the thermal environment did not align with existing research. In the existing research, it has been found that property owners are likely to be more thermally comfortable or satisfied and willing to adjust to the thermal environment of their buildings than tenants [8,41]. However, the current study noted that people, including tenants, can also be thermally comfortable and satisfied with the thermal environment if they have access to control to regulate the environment.
Concerning the indoor temperature, higher mean indoor temperatures were reported in this study than the mean values reported in some of the previous investigations on indoor comfort in buildings built with timber materials [8,11,18,28,42]. However, lower mean temperatures were noted in this study than the average temperatures recorded or predicted in existing research [9,12], especially in some of the buildings in the tropics [43]. The mean RH in the current study is within a similar range to the values obtained from previous investigations [11,28,42]. On the one hand, the neutral temperatures reported in this study are higher than those reported in some studies [11]. On the other hand, the neutral temperatures were lower than the values computed in existing research [43]. The current study showed the occupants of the case studies can adapt to higher indoor temperatures than the residents of other timber buildings within the same region.
On the assessment of the risk of summertime overheating in the case studies, the percentages of hours of temperature that exceed the applicable thresholds of the thermal comforts are lower in the current study than the values noted in existing research [11]. The research showed that a higher frequency of overheating is reported in previous investigations than in the current study [10,11,12]. Considering the TSV, the study showed the mean sensation ranged from “slightly cool” to “slightly warm” with many votes around the neutrality. In some of the case studies (such as HMLTFR), the residents are predicted to be slightly warm in summer. The study noted that thermal sensation can be influenced by various factors, including design parameters.
The annual energy assessment of the case studies revealed the amount of electricity usage is within the acceptable limits for non-passive residences in the US. A closer look at the mean electricity usage per month revealed the case studies use additional electricity in August. Across the case studies, higher mean, and maximum temperatures, as well as thermal indices are reported in August than the rest of the summer months. The increasing temperatures noted in summer with increasing demands to use some electric functions such as fans and other portable cooling devices may contribute to higher electricity usage in the buildings in August than other months. Comparing the mean annual and monthly electricity consumption with the amount reported for other buildings in the US [39,40], the case studies considered in the current study still perform better than some older buildings in the study area or country. The research noted that additional investigations should be considered on how to make these buildings more energy efficient. Future work will expand on analyses of more variables from the comfort surveys. Future work will also expand on energy assessments of the buildings to include other sources of energy used in the case studies.

5. Conclusions

The research examined overheating, comfort, thermal indices, and energy performance of multi-family Colonial Revival style buildings. The field study was conducted in the summer of 2017, but the energy data were collected for more than one year. The investigation considered environmental monitoring, thermal comfort surveys, and collection of the actual electricity usage to gather data for analyses. The findings highlighted a mean temperature of 25.4 °C, an average RH of 61.3%, and an average dew point of 17.1 °C. The responses on thermal sensation showed about 90% of the residents feel less warm in summer. Almost 79% of the survey participants prefer to be “cooler” or “no change”, and about 95% of the residents mentioned that the thermal environment was acceptable to them.
Regarding the relationships between the variables assessed during the comfort surveys, the study noted significance between some of the variables. The residents that did not feel warm are thermally comfortable. The occupants that feel less warm also responded that the thermal environment is acceptable to them. The residents that feel less warm still want more air movement into the buildings. In addition, correlations are observed between thermal sensation and other variables.
On the field measurements, the study could not measure environmental parameters such as radiant temperature because of the conditions given by the residents before monitoring their houses. The residents noted that small sensors with no camera must be installed. As a result, sensors that can capture additional environmental variables but would take space could not be used. However, the study still captured various environmental parameters and diverse data during the surveys.
Across the case studies, HMLTFR appears to be the warmest building, while HMLTBS is the coolest thermal environment. Some variables such as orientation, control, etc., are contributing factors to these outcomes. Furthermore, thermal acceptability responses are higher in HMLTBS than in other thermal environments. The impact of the mean group in the case studies will be considered in future work. The study showed that the mean number of hours of temperatures exceed 28 °C for 11.4% of the time. Additionally, the mean number of hours of temperatures exceeds 30.0 °C for 2.5% of the time. The research revealed the occupants of the building may be prone to overheating in summer. Lack of thermal mass and less insulation in timber-frame buildings may be determining factors to high temperatures recorded in the buildings.
High temperatures reported in this study can contribute to the thermal discomfort of the residents in summer. The buildings with sizeable portions beneath the ground level tend to be cooler in summer than those with substantial portions above the ground level. Generally, the ground is a good example of thermal storage and can help regulate the thermal environment of spaces below the surface. The thermal environment of the sizeable portions of the buildings below the ground level will be well-regulated as the ground surrounding the perimeter of the buildings acts as a thermal sink and minimizes temperature swings in spaces below the ground level in summer. Moreover, basements are constructed with building materials that have high thermal mass (such as concrete or brick). They are also well insulated which can help the basements perform better than other spaces above the ground level that are built with lightweight materials. The study suggests that ground cooling may be a dependable strategy for lowering excessive temperatures in buildings. The intervention needs to incorporate the basement zones of buildings. This intervention should be evaluated to determine the costs of installation and maintenance before the strategy is considered.
Addressing the first research question, do Colonial Revival style buildings perform better than other old buildings? The study found that case studies perform relatively better than some of the typical buildings examined in existing research. For the second research question, do the buildings use additional electricity than typical and other old buildings within and outside the region? The research showed that the annual electricity usage in the case studies is lower than the national and regional averages for typical and old buildings except in August. The mean monthly electricity usage in the case study buildings is slightly higher in August than in July, September, and other months of the year.
Concerning the thermal indices, the mean WBGT of 21.1–22.3 °C and mean SSI of 30.1 –32.4 °C are computed as probable bands for thermal indices in the case study buildings. Although the SSI is regarded as one of the humidity indices [44], and it may not be as internationally standardized as WBGT and PHS [45,46], the thermal index (SSI) applies to the study location. Additionally, some variables such as mean radiant temperature are not measured during the field measurements; therefore, the thermal indices used in this study are suitable for the research. Existing research in the field has also utilized SSI and other humidity indices to evaluate thermal stress in different locations and buildings [44]. This development implies that a combination of WBGT and SSI explored in this study provides a broad range of indices to assess the thermal environment and understand if the residents are vulnerable to thermal stress within the buildings.
The study revealed higher thermal indices are reported in the current study than existing research on heat stress in buildings. The mean monthly electricity bill in the buildings exceeds the national average for residential buildings in the summer months, especially in August. The practical applications and implications of the research include the findings from the current study can be integrated and used for future developments of Colonial Revival style and other similar buildings. The findings from the current study can propel more investigations on older buildings to understand and improve their performance. Moreover, the finding can provide useful information on the months with the highest demand for electricity in older buildings and how these surges in energy demand can be addressed. Additionally, the findings from this study can encourage further work on energy assessments of older buildings in cold seasons. Even though the annual electricity usage of the buildings tends to be within the average limits for non-passive houses in the US, the study suggests additional interventions such as retrofitting to enhance the performance of some existing Colonial Revival style buildings, especially the older buildings that are less insulated with outdated equipment and appliances.

Funding

This research received no external funding.

Institutional Review Board Statement

Not applicable.

Informed Consent Statement

Not applicable.

Acknowledgments

Many thanks to the residents of the case studies for permitting the field surveys to be conducted in their houses. Additionally, thank you to the respondents for taking part in the surveys and their support during the field surveys.

Conflicts of Interest

The author declares no conflict of interest.

References

  1. Colonial Revival (1880–1950). Available online: https://www.roanokeva.gov/DocumentCenter/View/1472/Architectural-Patterns---Colonial-Revival-PDF (accessed on 22 May 2018).
  2. National Park Service. Colonial Revival Style 1880s–1940s. Available online: https://www.nps.gov/articles/colonial-revival-architecture.htm (accessed on 10 September 2021).
  3. Peeters, L.; de Dear, R.; Hensen, J.; D’haeseleer, W. Thermal comfort in residential buildings: Comfort values and scales for building energy simulation. Appl. Energy 2009, 86, 772–780. [Google Scholar] [CrossRef] [Green Version]
  4. Al horr, Y.; Arif, M.; Katafygiotou, M.; Mazroei, A.; Kaushik, A.; Elsarrag, E. Impact of indoor environmental quality on occupant well-being and comfort: A review of the literature. Int. J. Sustain. Built Environ. 2016, 5, 1–11. [Google Scholar] [CrossRef]
  5. Ortiz, M.A.; Kurvers, S.R.; Bluyssen, P.M. A review of comfort, health, and energy use: Understanding daily energy use and wellbeing for the development of a new approach to study comfort. Energy Build. 2017, 152, 323–335. [Google Scholar] [CrossRef]
  6. Sansaniwal, S.K.; Mathur, J.; Garg, V.; Gupta, R. Review of studies on thermal comfort in Indian residential buildings. Sci. Technol. Built Environ. 2020, 26, 727–748. [Google Scholar] [CrossRef]
  7. Zhao, Z.; Amasyali, K.; Chamoun, R.; El-Gohary, N. Occupants’ Perceptions about Indoor Environment Comfort and Energy Related Values in Commercial and Residential Buildings. Procedia Environ. Sci. 2016, 34, 631–640. [Google Scholar] [CrossRef] [Green Version]
  8. Adekunle, T.O.; Nikolopoulou, M. Post-occupancy evaluation on people’s perception of comfort, adaptation and seasonal performance of sustainable housing: A case study of three prefabricated structural timber housing developments. Intell. Build. Int. 2020, 12, 71–99. [Google Scholar] [CrossRef]
  9. Gupta, R.; Gregg, M. Using UK climate change projections to adapt existing English homes for a warming climate. Build. Environ. 2012, 55, 20–42. [Google Scholar] [CrossRef]
  10. Tillson, A.-A.; Oreszczyn, T.; Palmer, J. Assessing impacts of summertime overheating: Some adaptation strategies. Build. Res. Inf. 2013, 41, 652–661. [Google Scholar] [CrossRef] [Green Version]
  11. Adekunle, T.O.; Nikolopoulou, M. Thermal comfort, summertime temperatures and overheating in prefabricated timber housing. Build. Environ. 2016, 103, 21–35. [Google Scholar] [CrossRef]
  12. Morgan, C.; Foster, J.A.; Poston, A.; Sharpe, T.R. Overheating in Scotland: Contributing factors in occupied homes. Build. Res. Inf. 2017, 45, 143–156. [Google Scholar] [CrossRef]
  13. Porritt, S.; Shao, S.; Cropper, P.; Goodier, C. Adapting dwellings for heat waves. Sustain. Cities Soc. 2011, 1, 81–90. [Google Scholar] [CrossRef]
  14. Mavrogianni, A.; Davies, M.; Taylor, J.; Chalabi, Z.; Biddulph, P.; Oikonomou, E.; Das, P.; Jones, B. The impact of occupancy patterns, occupant-controlled ventilation and shading on indoor overheating risk in domestic environments. Build. Environ. 2014, 78, 183–198. [Google Scholar] [CrossRef]
  15. Luo, M.; Cao, B.; Zhou, X.; Li, M.; Zhang, J.; Ouyang, Q.; Zhu, Y. Can personal control influence human thermal comfort? A field study in residential buildings in China in winter. Energy Build. 2014, 72, 411–418. [Google Scholar] [CrossRef]
  16. Chinazzo, G.; Wienold, J.; Andersen, M. Daylight affects human thermal perception. Sci. Rep. 2019, 9, 13690. [Google Scholar] [CrossRef] [PubMed]
  17. Hoła, A.; Czarnota, M. Analysis of the Possibilities of Improving Timber-framed Wall Thermal Insulation with Regards to Historical Buildings. Procedia Eng. 2015, 111, 311–316. [Google Scholar] [CrossRef] [Green Version]
  18. Adekunle, T.O. Occupants’ comfort and stress indices in a structural timber school building in the Northeast US in different seasons. Build. Res. Inf. 2020, 48, 331–348. [Google Scholar] [CrossRef]
  19. Historic Preservation Design Guidelines. Residential Architectural Styles. CH. 6-63. City of Independence. 2018. Available online: http://www.ci.independence.mo.us/userdocs/comdev/historicpreservation/06%20Architectural%20Styles%20-%20Residential.pdf (accessed on 13 April 2018).
  20. Connecticut Economic Resource Center (CERC). CERC Town Profile for West Hartford. 2017. Available online: https://www.westhartfordct.gov/civicax/filebank/blobdload.aspx?BlobID=32923 (accessed on 10 April 2018).
  21. CEI-Bois. Tackle Climate Change: Use Wood. 2010. Available online: www.cei-bois.org/files/b03500-p01-84-ENG.pdf (accessed on 13 April 2018).
  22. US Energy Information Administration. July 2021 Monthly Energy Review. Independent Statistics & Analysis. US Energy Information Administration. 2021. Available online: https://www.eia.gov/totalenergy/data/monthly/pdf/mer.pdf (accessed on 9 August 2021).
  23. Connecticut Comprehensive Energy Strategy. Building Sector. 2018. Available online: https://portal.ct.gov/-/media/DEEP/energy/CES/BuildingsSectorpdf.pdf (accessed on 9 August 2021).
  24. US Census Bureau, American Community Survey. 2016. Available online: https://www.census.gov/acs/www/data/data-tables-and-tools/data-profiles/2016/ (accessed on 9 August 2021).
  25. US Energy Information Administration, 2015 Residential Energy Consumption Survey. 2015. Available online: https://www.eia.gov/consumption/residential/reports/2015/overview/index.php (accessed on 6 August 2021).
  26. Lemke, B.; Kjellstrom, T. Calculating workplace WBGT from meteorological data: A tool for climate change assessment. Ind. Health 2012, 50, 267–278. [Google Scholar] [CrossRef] [Green Version]
  27. Pepi, W.J. The New Summer Simmer Index. In Proceedings of the 80th Annual Meeting of the AMS, Long Beach, CA, USA, 11 January 2000. [Google Scholar]
  28. Adekunle, T.O. Thermal performance and apparent temperature in school buildings: A case of cross-laminated timber (CLT) school development. J. Build. Eng. 2021, 33, 101731. [Google Scholar] [CrossRef]
  29. ANSI/ASHRAE Standard 55. Thermal Environmental Conditions for Human Occupancy; American Society of Heating, Refrigerating and Air-conditioning Eng.: Atlanta, GA, USA, 2020. [Google Scholar]
  30. CIBSE. CIBSE Guide A: Environmental Design; The Chartered Institute of Building Service Engineers (CIBSE): London, UK, 2015. [Google Scholar]
  31. EN 16798-1. Energy Performance of Buildings. Ventilation for Buildings. Indoor Environmental Input Parameters for Design and Assessment of Energy Performance of Buildings Addressing Indoor Air Quality, Thermal Environment, Lighting and Acoustics. Module M1-6; European Standard prEN 16798-1: Brussels, Belgium, 2019. [Google Scholar]
  32. ISO 7730. Ergonomics of the Thermal Environment—Analytical Determination and Interpretation of Thermal Comfort Using Calculation of the PMV and PPD Indices and Local Thermal Comfort Criteria; Technical Committee: ISO/TC 159/SC 5 Ergonomics of the Physical Environment; International Organization for Standardization: Geneva, Switzerland, 2005. [Google Scholar]
  33. ISO 7726. Ergonomics of the Thermal Environment— Instruments for Measuring Physical Quantities (ISO 7726:1998); Technical Committee: ISO/TC 159/SC 5 Ergonomics of the physical environment; International Organization for Standardization: Geneva, Switzerland, 2021. [Google Scholar]
  34. Khare, V.R.; Garg, R.; Mathur, I.; Garg, V. Thermal Comfort Analysis of Personalized Conditioning System and Performance Assessment with Different Radiant Cooling Systems. Energy Built Environ. 2021. [Google Scholar] [CrossRef]
  35. Kramer, R.; Schellen, L.; Schellen, H.; Kingma, B. Improving rational thermal comfort prediction by using subpopulation characteristics: A case study at Hermitage Amsterdam. Temperature 2017, 4, 187–197. [Google Scholar] [CrossRef] [Green Version]
  36. Hopkins, C. Sound Insulation; Routledge: London, UK, 2007. [Google Scholar]
  37. CT Weather History. 2020. Available online: https://www.wunderground.com/history/daily/KBDL/date/2020-6-4 (accessed on 24 August 2020).
  38. US Environmental Protection Agency. Indoor Air Quality. 2017. Available online: https://cfpub.epa.gov/roe/chapter/air/indoorair.cfm (accessed on 29 January 2018).
  39. US Energy Information Administration. Average Monthly Electricity Bill for US Residential Customers Declined in 2019. 2019. Available online: https://www.eia.gov/todayinenergy/detail.php?id=46276 (accessed on 12 August 2021).
  40. US Energy Information Administration (EIA-861, 2019). 2019 Average Monthly Bill—Residential. 2019. Available online: https://www.eia.gov/electricity/sales_revenue_price/pdf/table5_a.pdf (accessed on 12 August 2021).
  41. Mohit, M.A.; Azim, M. Assessment of Residential Satisfaction with Public Housing in Hulhumale, Maldives. Procedia-Soc. Behav. Sci. 2012, 50, 756–770. [Google Scholar] [CrossRef] [Green Version]
  42. Fernandes, J.; Mateus, R.; Gervásio, H.; Silva, S.M.; Branco, J.; Almeida, M. Thermal Performance and Comfort Conditions Analysis of a Vernacular Palafitic Timber Building in Portuguese Coastline Context. Sustainability 2020, 12, 10484. [Google Scholar] [CrossRef]
  43. Leo Samuel, D.G.; Dharmasastha, K.; Shiva Nagendra, S.M.; Prakash Maiya, M. Thermal comfort in traditional buildings composed of local and modern construction materials. Int. J. Sustain. Built Environ. 2017, 6, 463–475. [Google Scholar] [CrossRef]
  44. D’Ambrosio Alfano, F.R.; Palella, B.I.; Riccio, G. Thermal environment assessment reliability using temperature—Humidity indices. Ind. Health 2011, 49, 95–106. [Google Scholar] [CrossRef] [PubMed] [Green Version]
  45. ISO 7933. Ergonomics of the Thermal Environment—Analytical Determination and Interpretation of Heat Stress Using Calculation of the Predicted Heat Strain; ISO/TC 159/SC 5, Ergonomics of the physical environment; International Organization for Standardization: Geneva, Switzerland, 2004; Volume 5. [Google Scholar]
  46. ISO 7243. Ergonomics of the Thermal Environment—Assessment of Heat Stress Using the WBGT (Wet Bulb Globe Temperature) Index; ISO/TC 159/SC 5, Ergonomics of the physical environment; International Organization for Standardization: Geneva, Switzerland, 2017; Volume 5. [Google Scholar]
Figure 1. (a) Map of New England in the US; (b) views of one of the case study buildings (HMLTFR).
Energies 14 07468 g001
Figure 2. Averages of the outdoor temperatures (monthly) from May to September 2017.
Energies 14 07468 g002
Figure 3. Comparison of the averages of maximum, minimum, and mean temperatures for the outdoor weather conditions during the warmest months between 2016 and 2017.
Energies 14 07468 g003
Figure 4. Range of the mean indoor temperatures compared with the mean outdoor temperatures.
Energies 14 07468 g004
Figure 5. Number of hours of temperatures that exceed the temperatures in the case studies.
Energies 14 07468 g005
Figure 6. Associations between the WBGT and SSI values in (a) HMLTFR and (b) HMLTBB.
Energies 14 07468 g006
Figure 7. Associations between the WBGT and SSI values in (a) HMLTLL and (b) HMLTBS.
Energies 14 07468 g007
Figure 8. Correlations between the mean temperatures, thermal indices, and TSV in (a) HMLTLL and (b) HMLTBB.
Energies 14 07468 g008
Figure 9. Correlations between the mean temperatures, thermal indices, and TSV in (a) HMLTBS and (b) HMLTLL.
Energies 14 07468 g009
Figure 10. Comparative charts of the mean values of electricity usage per (a) month and (b) day.
Energies 14 07468 g010
Figure 11. Links between the mean values of electricity usage per (a) month and (b) day in the case studies and other locations.
Energies 14 07468 g011
Table 1. Summary of the mean, standard deviation, variance of gender, thermal sensation, thermal acceptability, comfort, and preference in the case study buildings 1 (N = 110) *.
Variables/StatisticsGender 2Thermal Comfort 3Thermal Preference 4Thermal Acceptability 5Thermal Sensation 6
Mean1.675.052.111.053.25
Median2.005.002.001.003.00
Standard deviation0.4711.2400.5480.2281.200
Variance0.2221.5380.3000.0521.439
Percentile (25%)1.004.002.001.002.00
Percentile (75%)2.006.002.001.004.00
1 Case study buildings include HMLTLL, HMLTBS, HMLTBB, and HMLTFR. * Number of valid questionnaires = 110. Number of missing data = 0. 2 Gender: 1—male, 2—female. 3 Thermal comfort: 1—very uncomfortable to 7—very comfortable. 4 Thermal preference: 1—cooler to 3—warmer. 5 Thermal acceptability: 1—acceptable, 2—not acceptable. 6 Thermal sensation: 1—cold to 7—hot.
Table 2. Summary of the outdoor weather data for the location of the case study buildings.
Month/VariablesMean Temp. (°C)Max. Temp. (°C)Min. Temp. (°C)Mean RH (%)Mean Dew Point (°C)Cooling Degree DaysMean Sea Level Pressure (mbar)Mean Wind Speed (km/h)Mean WBGT (°C)Mean SSI (°C)
July23.034.012.068.917.091008.510.220.428.5
August22.032.012.068.816.071010.49.519.426.8
September20.032.08.068.414.051010.310.617.523.5
Averages *21.732.710.768.715.771009.710.119.126.3
* Averages of the duration of the surveys (July to September).
Table 3. Rating and cumulative percentage of thermal sensation, thermal acceptability, comfort, and preference in the case study buildings * (N = 110).
VariablesThermal Sensation 1 Thermal Comfort 2Thermal Preference 3Thermal Acceptability 4
RatingCumulative Percentage (%)RatingCumulative Percentage (%)RatingCumulative Percentage (%)RatingCumulative Percentage (%)
Cold3.6Very uncomfortable1.8Cooler10.0Acceptable94.5
Cool29.1Uncomfortable2.7No change79.1Not acceptable100.0
Slightly cool58.2Slightly uncomfortable10.0Warmer100.0
Neutral90.0Neutral32.7
Slightly warm96.4Slightly comfortable52.7
Warm97.3Comfortable94.5
Hot100.0Very comfortable100.0
* Case study buildings include HMLTLL, HMLTBS, HMLTBB, and HMLTFR. 1 Thermal sensation: 1—cold to 7—hot. 2 Thermal comfort: 1—very uncomfortable to 7—very comfortable. 3 Thermal preference: 1—cooler to 3—warmer. 4 Thermal acceptability: 1—acceptable, 2—not acceptable.
Table 4. Summary of the statistical tests between the variables assessed during the surveys (N = 110).
VariablesThermal Sensation
Test ConditionMean SquareF *Sig
Thermal comfortBetween groups11.70812.378<0.001
Within groups0.946NDP **NDP **
Thermal preference Between groups2.55615.170<0.001
Within groups0.168NDP **NDP **
Thermal acceptabilityBetween groups0.61832.140<0.001
Within groups0.019NDP **NDP **
Sensation of air movementBetween groups5.6493.0940.08
Within groups1.826NDP **NDP **
Preference for air movementBetween groups2.36610.124<0.001
Within groups0.234NDP **NDP **
* F is the variance of the group means. NDP ** = No data provided.
Table 5. Summary of the Pearson correlations between the variables assessed during the surveys (N = 110).
VariablesThermal ComfortThermal PreferenceThermal AcceptabilitySensation of Air MovementPreference for Air
Movement
Thermal sensation−0.361−0.6570.183−0.318−0.572
Sig (1-tailed)<0.001<0.0010.028<0.001<0.001
Table 6. Summary of the average variables and thermal indices in the case studies.
Case Study/VariablesMean Temp. (°C)Max. Temp. (°C)Min. Temp. (°C)Mean RH (%)Mean Dew Point (°C)Mean WBGT (°C)Mean SSI (°C)** Level of Control Satisfaction
HMLTFR26.132.320.659.817.522.332.43.49
HMLTBB25.631.820.061.317.422.131.84.59
HMLTBS24.228.422.365.217.221.130.13.50
HMLTLL25.632.621.359.017.021.831.63.85
Combined *25.431.321.161.317.121.931.53.86
* Averages of the case studies. ** The level of control satisfaction ratings: 1 stands “very dissatisfied”; 7 stands “very satisfied”.
Table 7. Summary of the adaptive approaches for ASHRAE-55 and EN 16798-1 comfort models.
Case StudyMean Indoor Temp. (°C)Mean Outdoor Temp. (°C)ASHRAE-55 (Adaptive Model) [29]Outdoor Running Temp. (°C) EN 16798-1 (Adaptive Model) [31]
80% Acceptability Bands90% Acceptability BandsClass I Acceptability BandsClass II Acceptability BandsClass III Acceptability Bands
HMLTFR26.121.7Operative temperature range 21.0–28.0 °COperative temperature range 22.0–27.0 °C18.1Operative temperature range 19.8–28.8 °COperative temperature range 20.8–27.8 °COperative temperature range 19.8–28.8 °C
ComfortableComfortableComfortableComfortableComfortable
HMLTBB25.6* Ditto* Ditto* Ditto* Ditto* Ditto
ComfortableComfortableComfortableComfortableComfortable
HMLTBS24.2* Ditto* Ditto* Ditto* Ditto* Ditto
ComfortableComfortableComfortableComfortableComfortable
HMLTLL25.6* Ditto* Ditto* Ditto* Ditto* Ditto
ComfortableComfortableComfortableComfortableComfortable
Combined 125.4* Ditto* Ditto* Ditto* Ditto* Ditto
ComfortableComfortableComfortableComfortableComfortable
1 Averages of the case studies. * The information is the same for the ASHRAE-55 [29] and EN 16798-1 [31] thermal comfort models.
Table 8. Summary of the averages of the monthly electricity usage in the case study buildings.
MonthUsage (kWh)Number of Days (n)Usage per Day (kWh)Cost per Day (USD)Mean Total Charge USD
August 20185793218.13.8120.1
July 20183682912.72.984.3
June 20183333011.12.780.1
May 2018320349.42.376.6
April 2018260299.02.263.5
March 2018288299.92.469.4
February 20183513111.32.782.6
January 20183213110.42.372.7
December 20173203210.02.270.5
November 2017260299.02.059.0
October 20172912910.02.364.9
September 20174843016.13.4101.9
August 20176103219.13.9126.0
Publisher’s Note: MDPI stays neutral with regard to jurisdictional claims in published maps and institutional affiliations.

