1. Introduction
HTGRs are loaded with TRISO fuel, which is characterized by tolerance to high temperature (up to about 1600 °C); however, considering the high operating temperature of the fuel (up to about 1200 °C), there is a risk of local overheating of the fuel to the temperature at which the migration of radionuclides through ceramic coatings of fuel microspheres increases. In adverse cases, the temperature can also potentially exceed the integrity limit and damage TRISO ceramic coatings. The postulated safety concept of the HTGR reactor core assumes its resistance to core degradation even in the event of loss of active cooling of the reactor core. While it is not physically possible to melt the ceramic fuel, the degradation of the fuel after exceeding the limit of maintaining integrity is associated with large releases of gaseous radioactive fission products. The risk and scale of this phenomenon depend on the temperature and density of the energy deposited in the fuel. In this respect, local quantities are important, and large deviations from medium sizes increase the risk of releases of radioactive nuclides. Therefore, great importance should be placed on ensuring the best possible equalization of the spatial distribution of reactor power and limiting neutron flux disturbance processes during operation that can lead to spatial oscillations of xenon concentration and power density [
1]. This type of disturbance can be induced by the work of the control rods. As HTGRs are being developed for various applications, a few core concepts were proposed depending on the major purpose of the particular application. A technological heat source for chemical processes is one of the most promising applications with a substantial potential market. Due to the compromises between their economy, on the one hand, and the understanding of industry needs, on the other, the concept of a high but slim reactor core was proposed as a result of international collaboration on HTGRs [
2].
During the irradiation cycle in an HTGR with a prismatic core, the loss of reactivity due to the fuel burnup needs to be compensated. Compensation is achieved by extending the compensating rods, by means of burnable poisons, or both. Although burnable poisons can effectively compensate for reactivity, the limit here is a moderate level of fuel burnup. In a situation in which we want to increase fuel burnup to use it economically, which is important in the case of expensive production of TRISO fuel, it is necessary to use compensation rods. The movement of the compensating rods during the operation of the reactor is associated with a disturbance in the distribution of the generated reactor power, especially in the axial direction. In the simplest variant, when all compensation rods made from a solid material (graphite matrix with B4C microspheres) are extended at the same time, the disturbance of the distribution of power is the greatest. Improvement can be achieved by dividing the rods into groups and withdrawing them into groups and properly adjusting the CR withdrawal strategy. On the other hand, an innovative method currently being studied by us is the use of tungsten-made compensation rods with a structural design. To quantitatively assess the effects of the CR designs studied on the characteristics of the reactor core, a spatial distribution parameter is introduced as a measure of the deviations in power and concentration of Xe135 from uniform distributions. Due to the high temperatures in the HTGR reactor core, the use of materials commonly used in light-water reactors such as boron steel is excluded. In HTGR reactors, the control rods are usually made on the basis of graphite or ceramic materials, and the neutron-absorbing material contains boron, whose isotope B10 has a very high cross section of neutron capture—especially in thermal energies. However, while high absorption cross sections are useful in safety rods or startup rods, for the sections of rods used to compensate for reactivity loss in the deeply moderated neutron spectrum characterizing HTGR reactors, strong absorption of thermal neutrons strongly disturbs the spatial distribution of neutrons. The use of tungsten as a metallic material resistant to high temperatures, characterized by moderate neutron absorption but sufficient to compensate for reactivity, will make it possible to reduce the adverse disturbance of the spatial neutron flux. Moderate active cross sections of the absorbent, if they are sufficient to ensure effective compensation, translate into greater durability because they are much slower to burn.
2. Materials and Methods
Analysis was performed using the internal coupling of the Monte Carlo burnup (MCB) code [
3,
4] with the upgraded thermal–hydraulic code POKE [
5]. This Monte Carlo burnup calculation system has been developed and applied to Gen-IV reactors, including HTGRs [
6,
7,
8]. The model is based on the HTGR design, referred to as Go_HTR [
9], that was developed in the Polish national research program on HTR industrial applications as a heat source. The core design used in current studies is based on the fuel rod and block structure designed by the Japan Atomic Energy Research Institute (JAERI) [
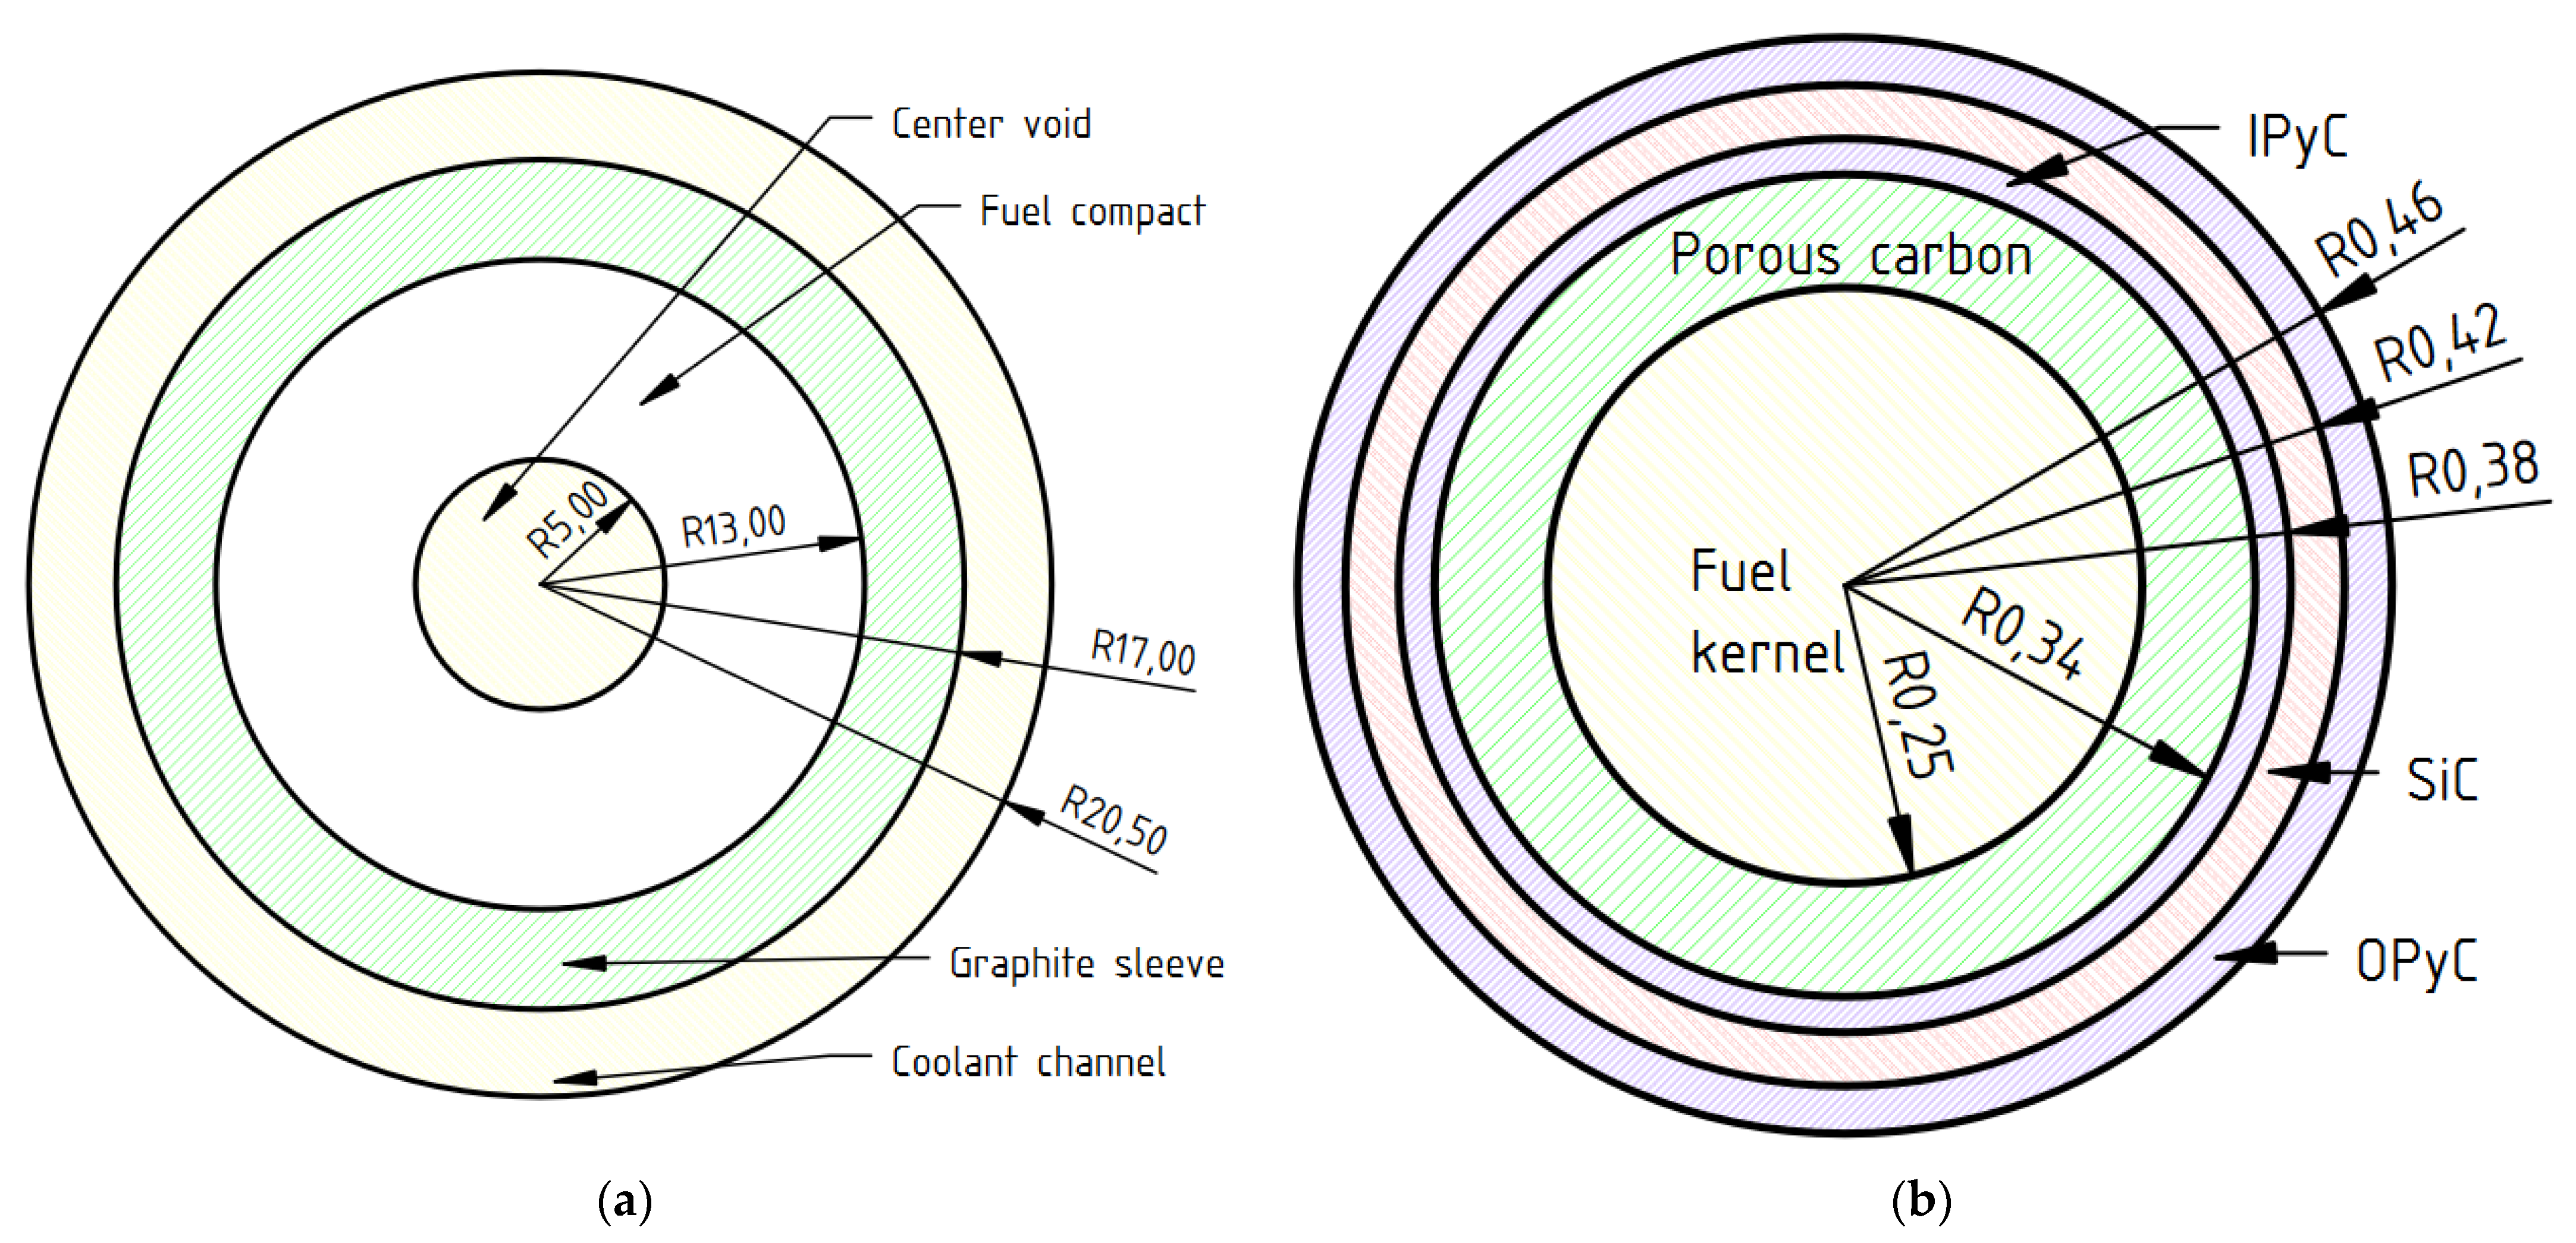
10], where fuel rods are surrounded by a graphite sleeve and inserted into a cooling channel. A special feature of the Go_HTR design is the implementation of half-fuel blocks. Those blocks contain CR holes and four rows of fuel compacts instead of seven. They are located in the outermost ring of fuel blocks and serve to make the shape of the active core more cylindrical. Helium is used as the coolant. The detailed structures of fuel rods and TRISO particles are shown in
Figure 1. In the current article, we did not address the mechanical design of innovative control rods but the nuclear analysis of their work and the impact on the characteristics of the core of a high-temperature reactor. In the mechanical design, mechanisms and configuration will have to be carried out to ensure the insertion of the telescopic structure of the control rods.
Any mechanical problems related to the stiffness of the system should be solved during the mechanical analysis of the system, but because of the mechanical properties of tungsten as an elastic metallic material, they should not pose any difficulties here.
Specifications of the modeled reactor core is presented in
Table 1. Fuel rods were grouped into 240 burnable zones: 10 radial zones according to their radial position, each divided into 24 axial zones. Every axial burnable zone covers one-third of the height of a graphite block.
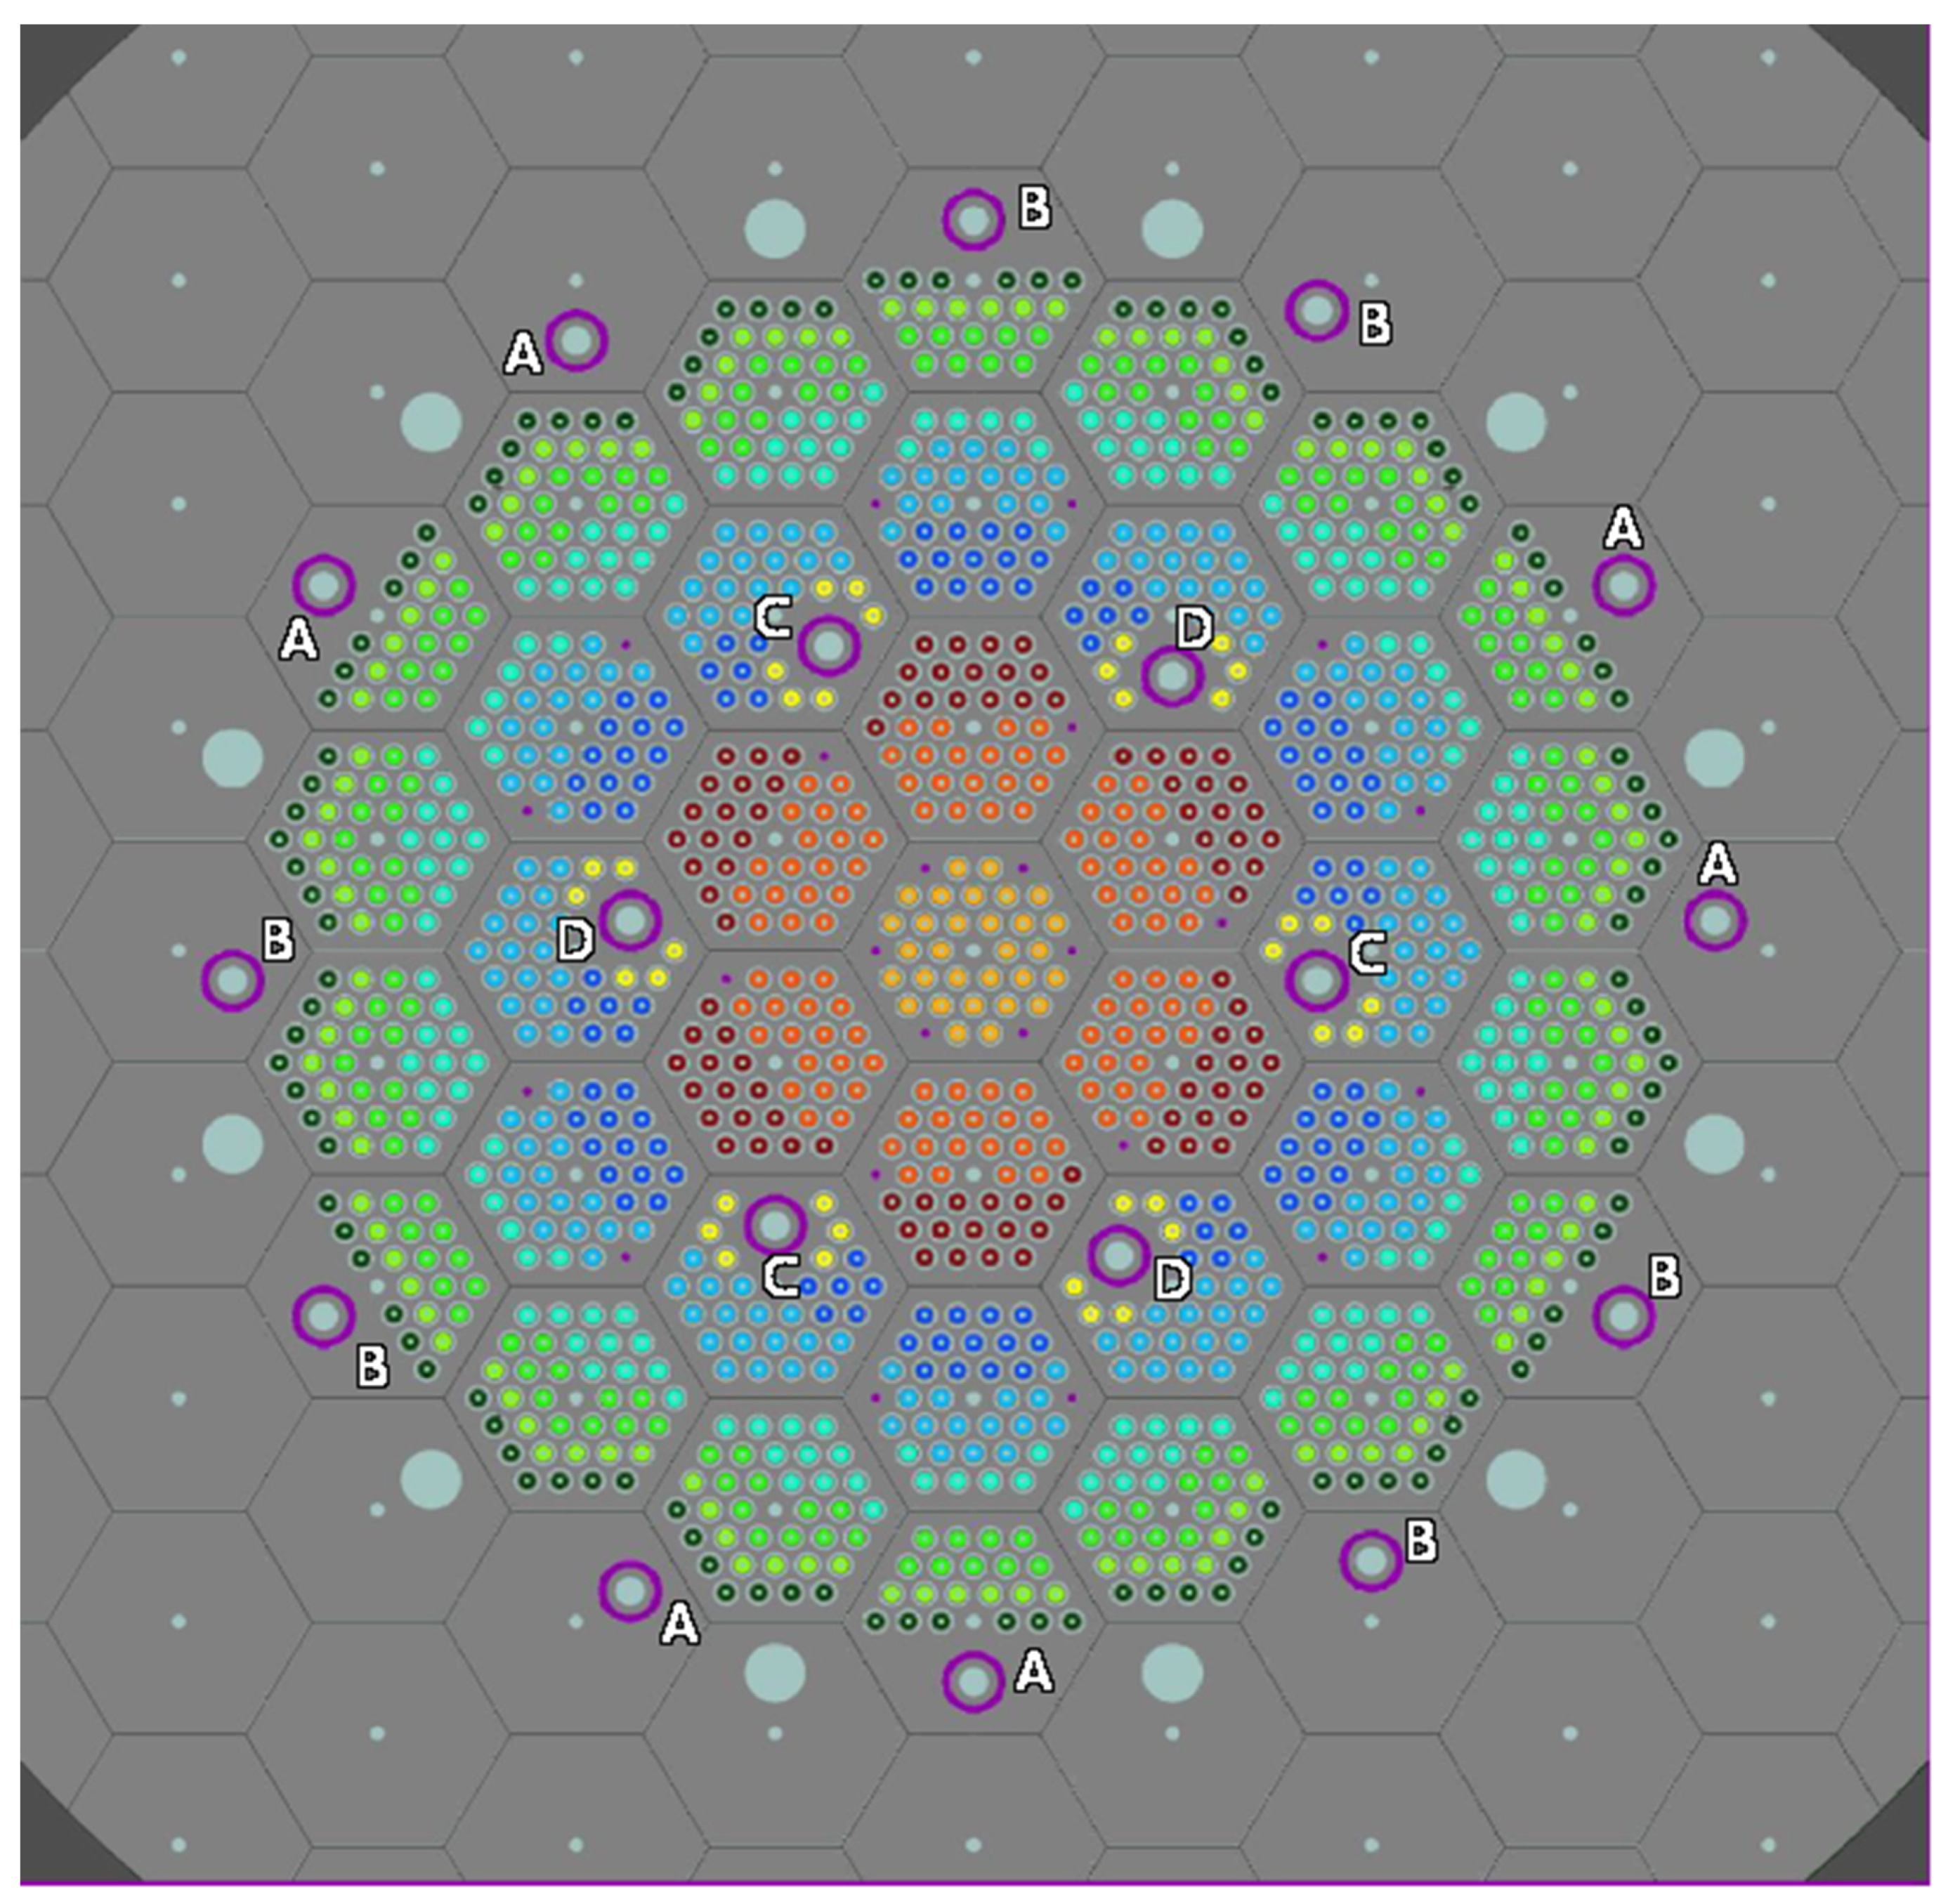
The radial configuration of the reactor core is presented in
Figure 2. The letters A, B, C, and D visible in the figure refer to the control rod groups. The numbering of the radial zones starts from the innermost zone 1 (dark yellow rods) and ends with the outermost zone 9 (dark green rods). The exception is a special zone consisting of rods (light yellow) surrounding inner control rods.
In order to improve the safety characteristics of the HTGR reactor, we proposed an innovative CR design through an application of tungsten and boron carbide (B4C), dispersed in graphite matrix as absorbers in control rods. Due to the deep moderation of neutrons in HTGR reactors, the use of a strong absorber such as B4C is not necessary to compensate for the reactivity, and moderate absorption cross sections for tungsten are sufficient to ensure adequate control of the reactivity. An additional advantage of tungsten is the negligible loss of its absorption properties during reactor operation.
In this concept, the rod section with B4C serves as the reactivity margin during reactor shutdown, and it works independently from the compensation section made of tungsten. This enables us to use control rods as both startup and compensation rods. This is possible due to the radial division of the control rods into the central B4C section in the graphite matrix, which acts as the starter rods, and the outer radial section made of tungsten, which serves to compensate for reactivity during the fuel irradiation cycle. In this paper, we do not propose any mechanical design of such rods, nor its driving mechanism; therefore, appropriate solutions need to be found yet. The purpose of this research is to assess the potential benefits of the proposed nuclear design of CRs for improving HTGR safety characteristics. Several designs of the radial division of CRs, along with the strategy of their withdrawal procedure, were tested in the search for an adequate reactivity compensation process.
The first strategy is the simplest and is referred to as St_solid. The control rods have their radial structure divided into just two sections: the inner made of B
4C in a graphite matrix and the outer made of tungsten. Detailed data on the geometry and composition of the rod are presented in
Table 1. The control rods were grouped into four groups of A, B, C, and D. Two groups outside of the active core, A and B, contain six rods each, alternating three in half-fuel blocks and three in moderator blocks. In the active core, two groups, C and D, consist of three alternating control rods each.
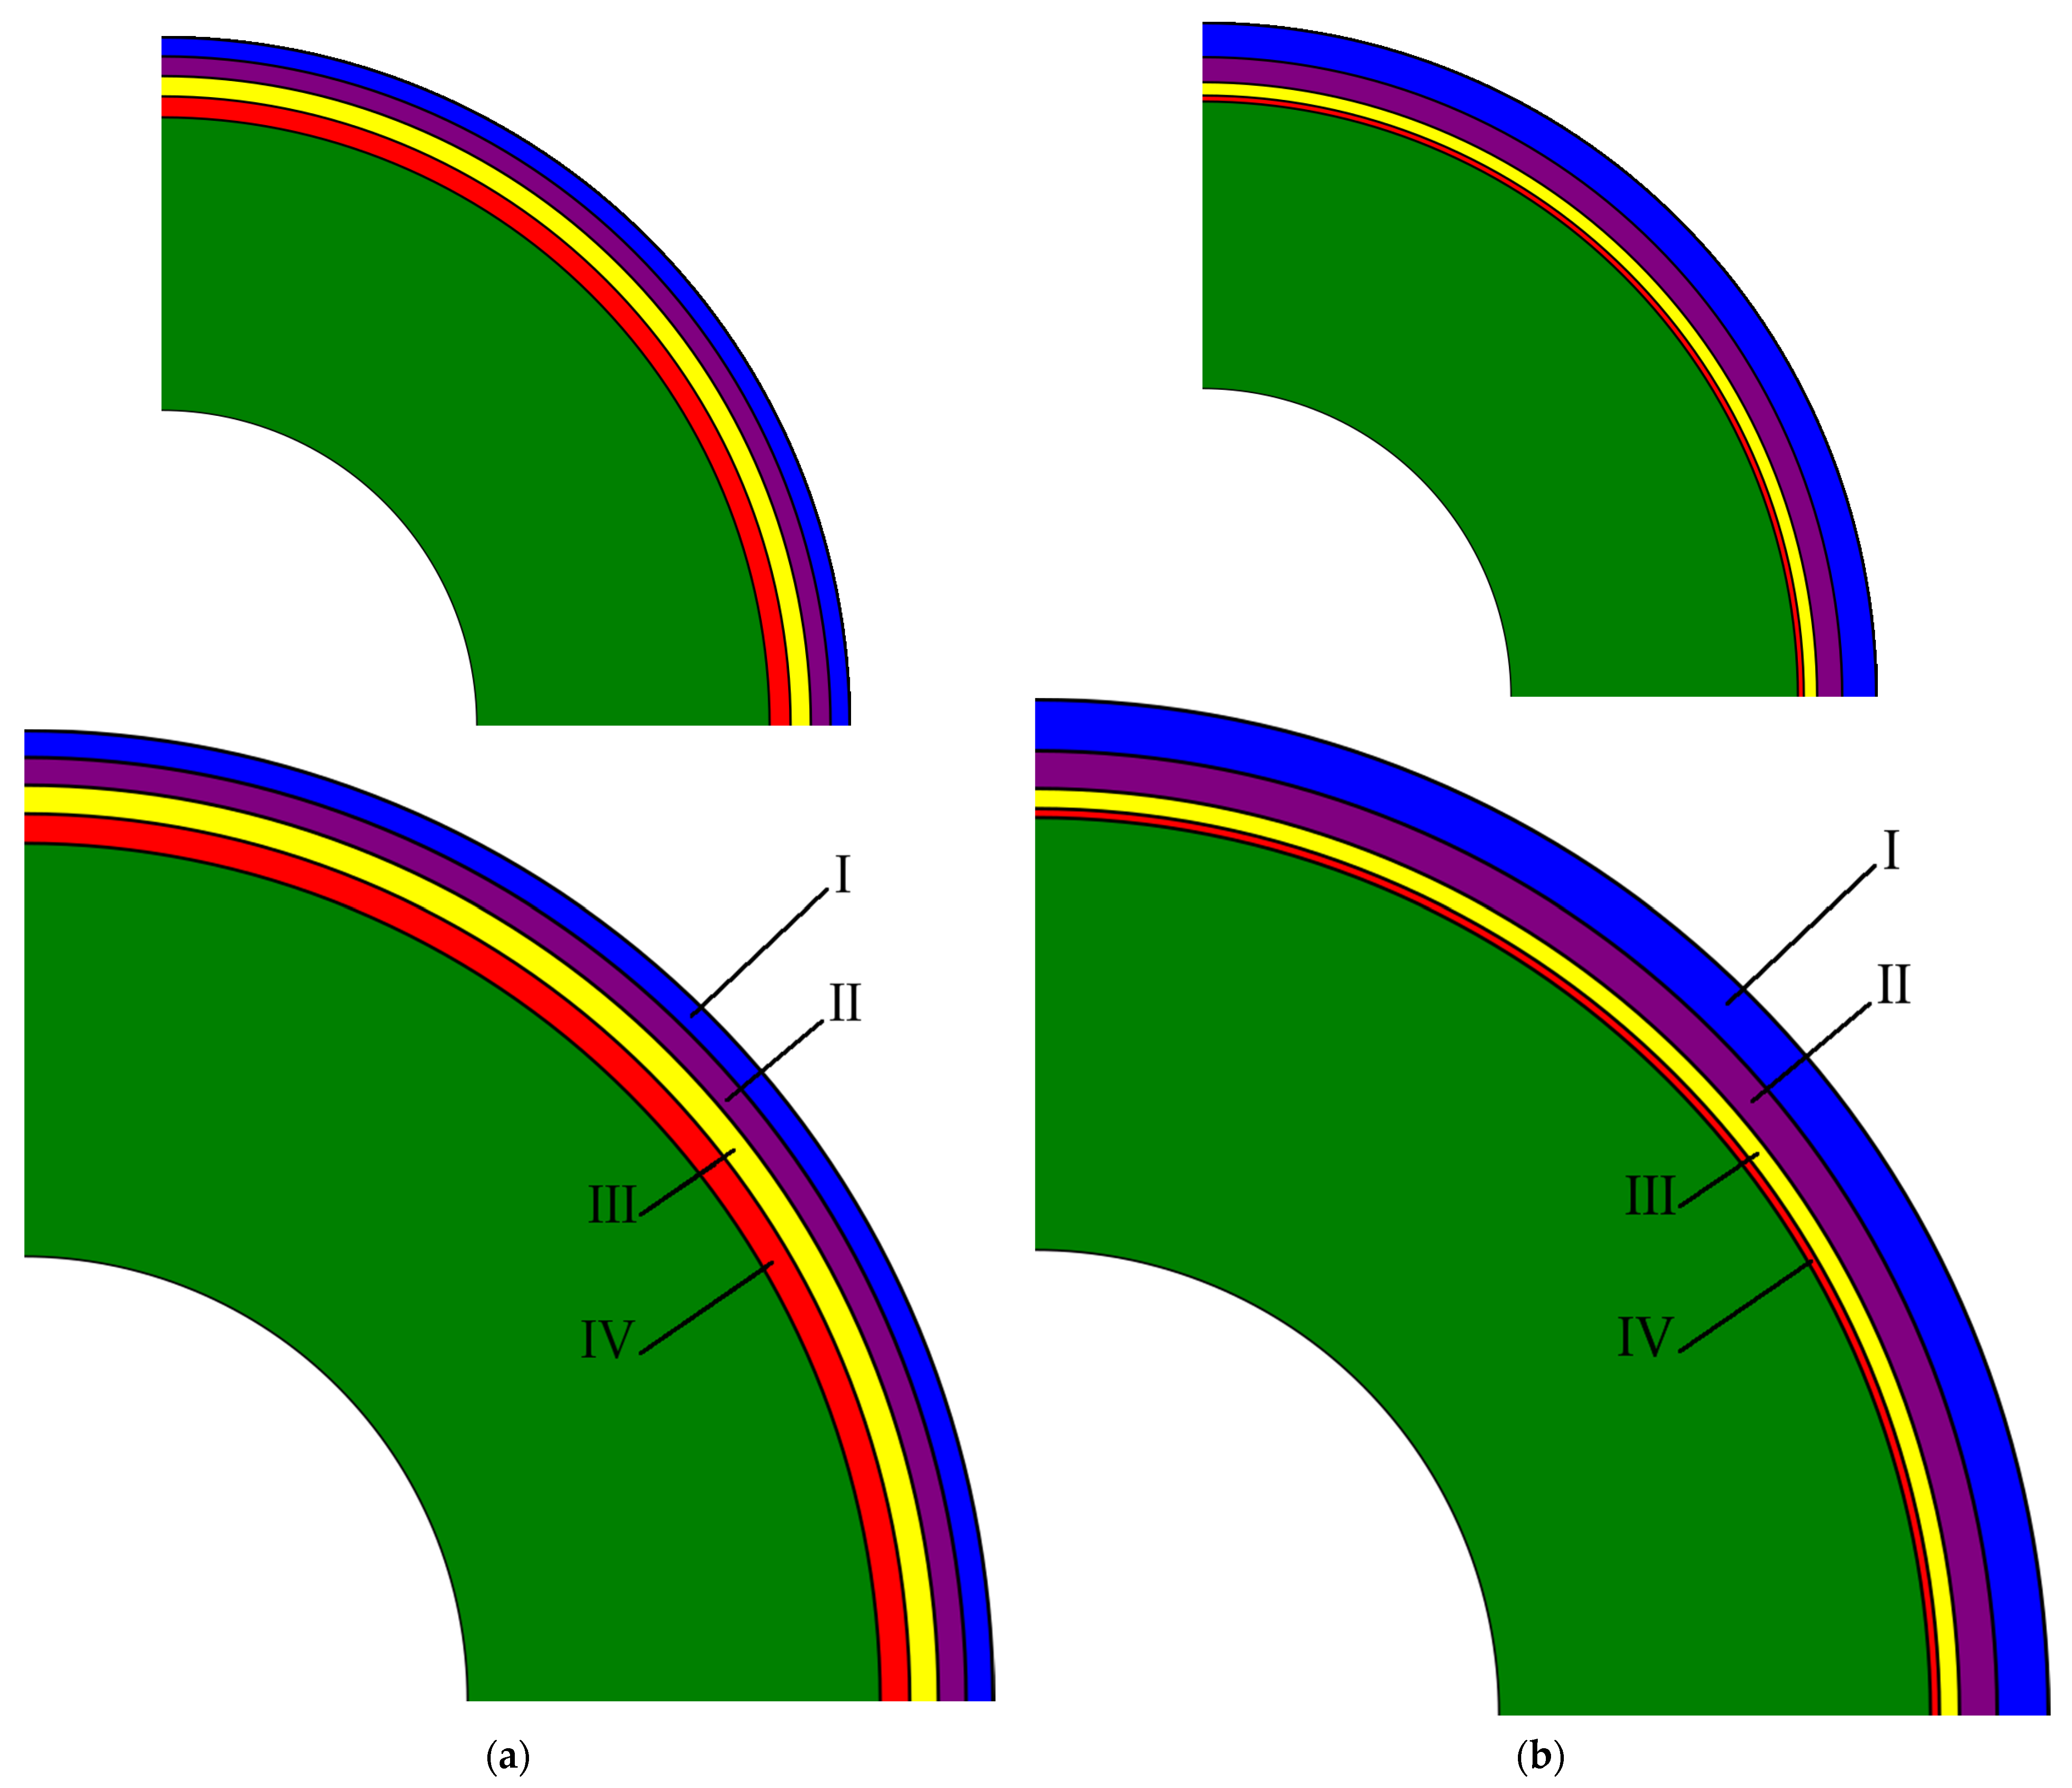
The second design introduces a radial structure in the tungsten section. It is a structure of cylindrical layers where each layer can be withdrawn independently of the other. Again, the innermost central section is solid and made of B
4C and graphite. The solid sections combined from all rods play the role of the startup rod. Regarding the tungsten section, we started from their equal divisions. This strategy is called St_struc. Later in the core of our investigation, we optimized the tungsten section divisions and refined the timestep structure in order to simulate the criticality evolution close to reality. The last strategy is termed St_opt. For better visualization of the structure, the actual proportions and radii of the radial layers are presented in
Figure 3.
For investigation of the power profile behavior after control rod operation, two types of rods and the corresponding operation strategies, St_solid and St_struc, were simulated, which are presented in
Table 2. In both strategies, the same times of operation were applied, and the same amounts of absorber material were withdrawn. In both, B4C was removed at the beginning of the simulation. Further operations were performed every 25 days, removing 25% of the tungsten absorber from the single control rod group from the core, starting with group A, then groups B, C, and D. The St_struc strategy is different from the St_solid strategy in only one aspect—namely, the implementation of radial layers of control rods. Each rod was divided into four radial layers with an equal volumetric share in the St_struc strategy. A single radial layer was totally withdrawn from all rods of a single group at every operation, starting with the outermost tungsten radial layer in group A. The layers are referenced by the Roman numbers I (outermost), II, III, and IV (innermost). In St_solid, radial division of control rods was not applied; thus, the absorber was removed vertically by a quarter of the control rod height in a single group at each operation.
For convenient investigation of the power profile, the axial power distribution parameter was defined with the following formula:
where
Oaxial—the axial distribution parameter [-];
Paxial,i—the average power density in the i-th axial burnable zone [Wcm−3];
hi—the average height of the i-th axial burnable zone [cm];
—the average power density in the core [Wcm−3].
The average height of the axial zone is defined as the distance between the top of the core and the axial center of the burnable zone, as shown in
Table 3.
In other words, the power distribution parameter is the normalized sum of the power momenta in the burnable zones in the considered direction. The parameter value lower than one means that the power profile is concentrated in the upper half of the core; otherwise, the power profile is concentrated in the upper half of the core.
Similarly, the radial power distribution parameter was defined.
where
Oradial—the radial distribution parameter [-];
Pradial,i—the average power density in the i-th radial burnable zone [Wcm−3];
ri—the average position of the i-th radial burnable zone [cm];
—the average power density in the core [Wcm−3].
The positions of the burnable radial zones were assumed as the average distance between the center radial of the core and each fuel rod in the zone and are presented in
Table 4.
The radial power distribution parameter lower than one means that the power profile is shifted toward the center of the core, whereas higher shows that the power profile is tilted toward the outer region of the core. In the same way, the Xe-135 concentration was analyzed.
3. Results
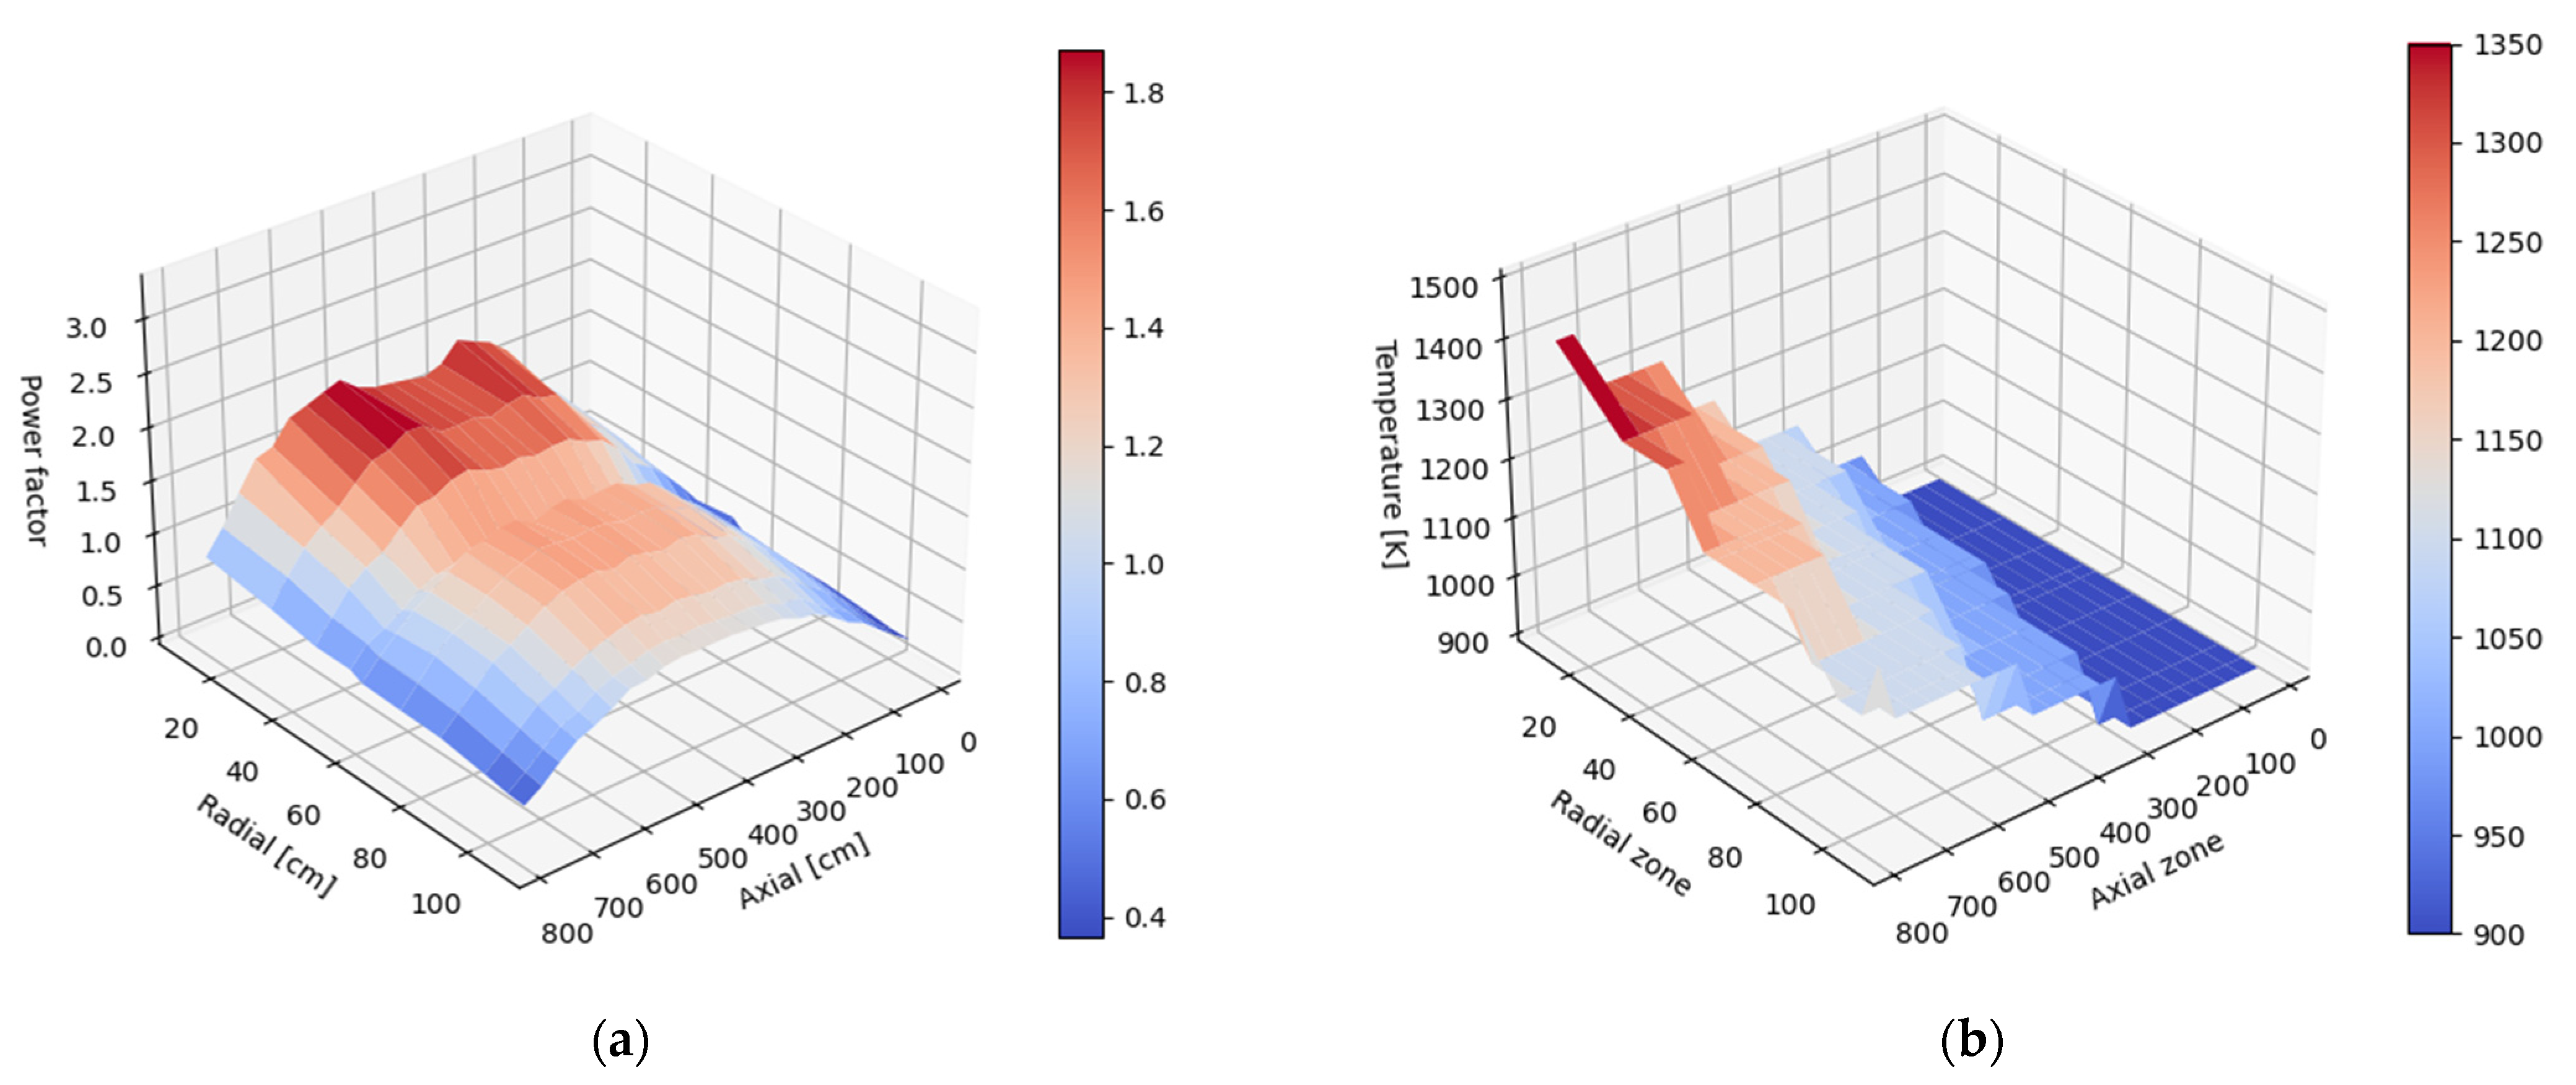
It should be noted that the power and temperature distributions obtained with MCB coupled with POKE are tilted inward and downward, respectively, as shown in
Figure 4, where the power factor is the ratio of the local power density in a burnable zone and the mean power density of the entire distribution. Results are presented for burnable zones and their average positions, as was described in the previous section. It is observed that the power distribution is significantly shifted toward the center of the core.
It is confirmed by the radial distribution parameter calculated according to Equation (2), which in this case is 0.92, and the axial parameter is 1.02, which means that the distribution is slightly tilted downward. One can observe a decrease in the power density in the radius of 55 cm, which is a result of the presence of control rods in the active core. Further effort was put into flattening the power distribution by operating the radial layers of the control rods.
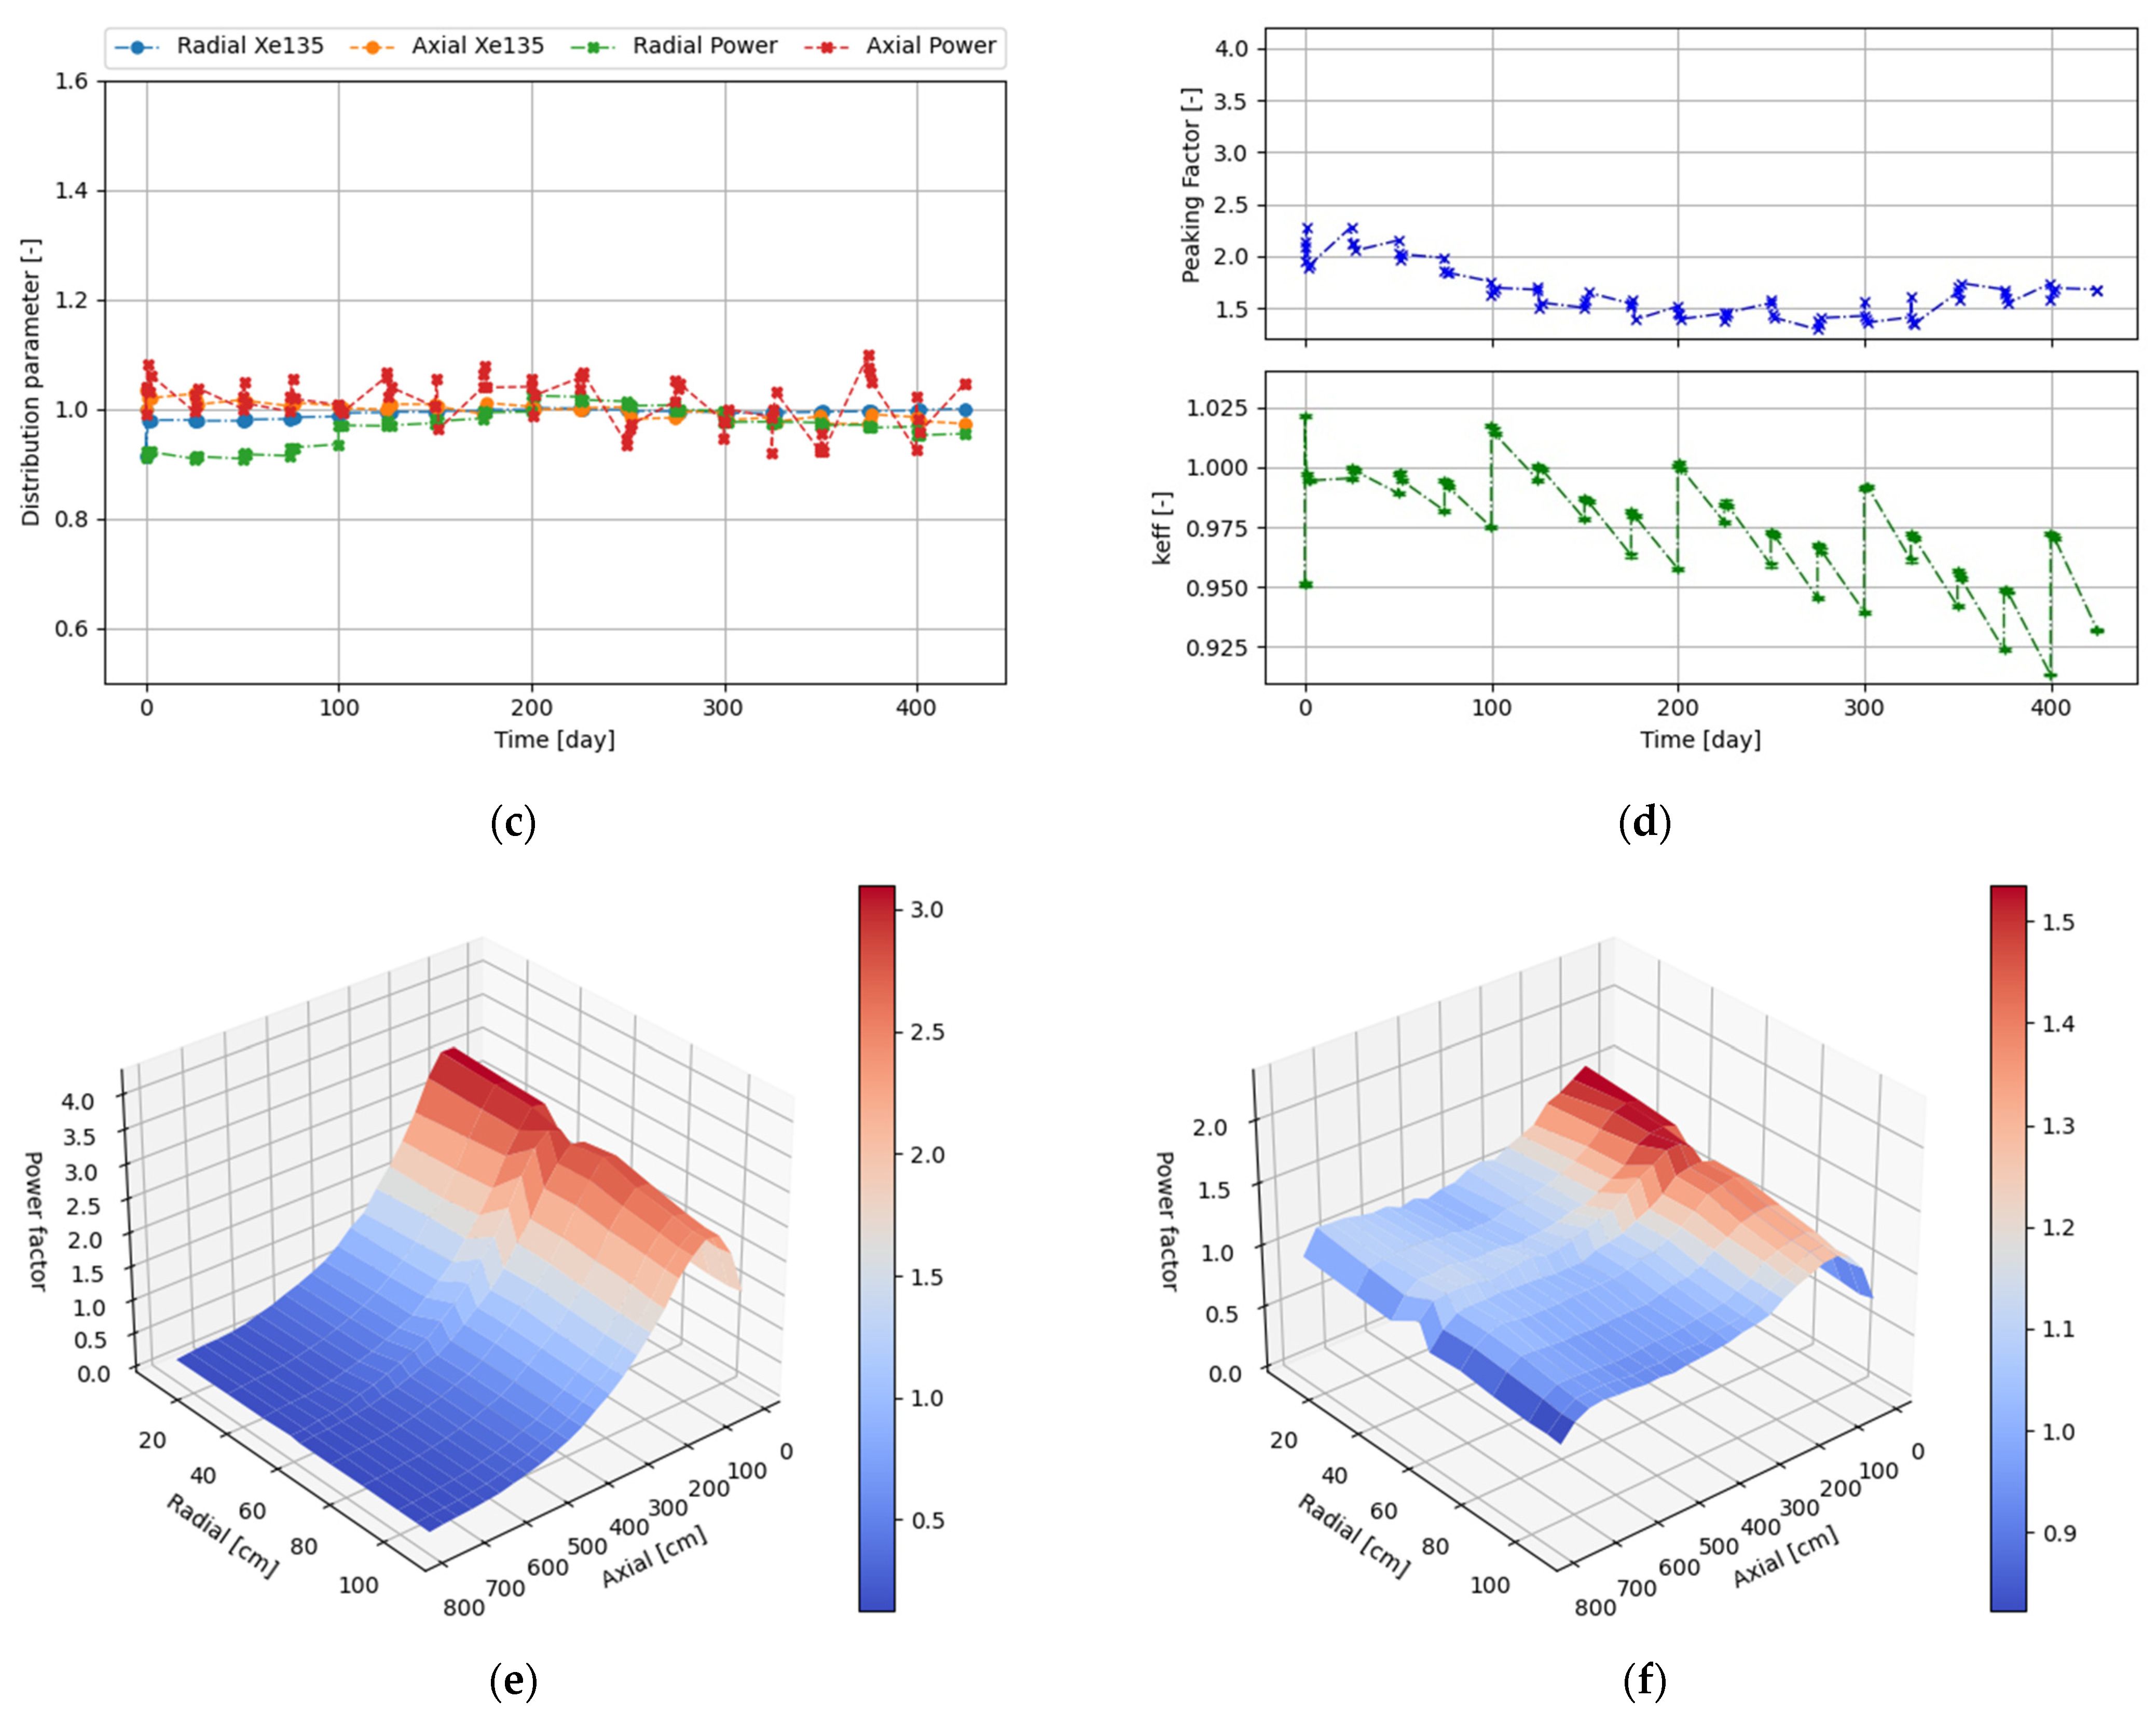
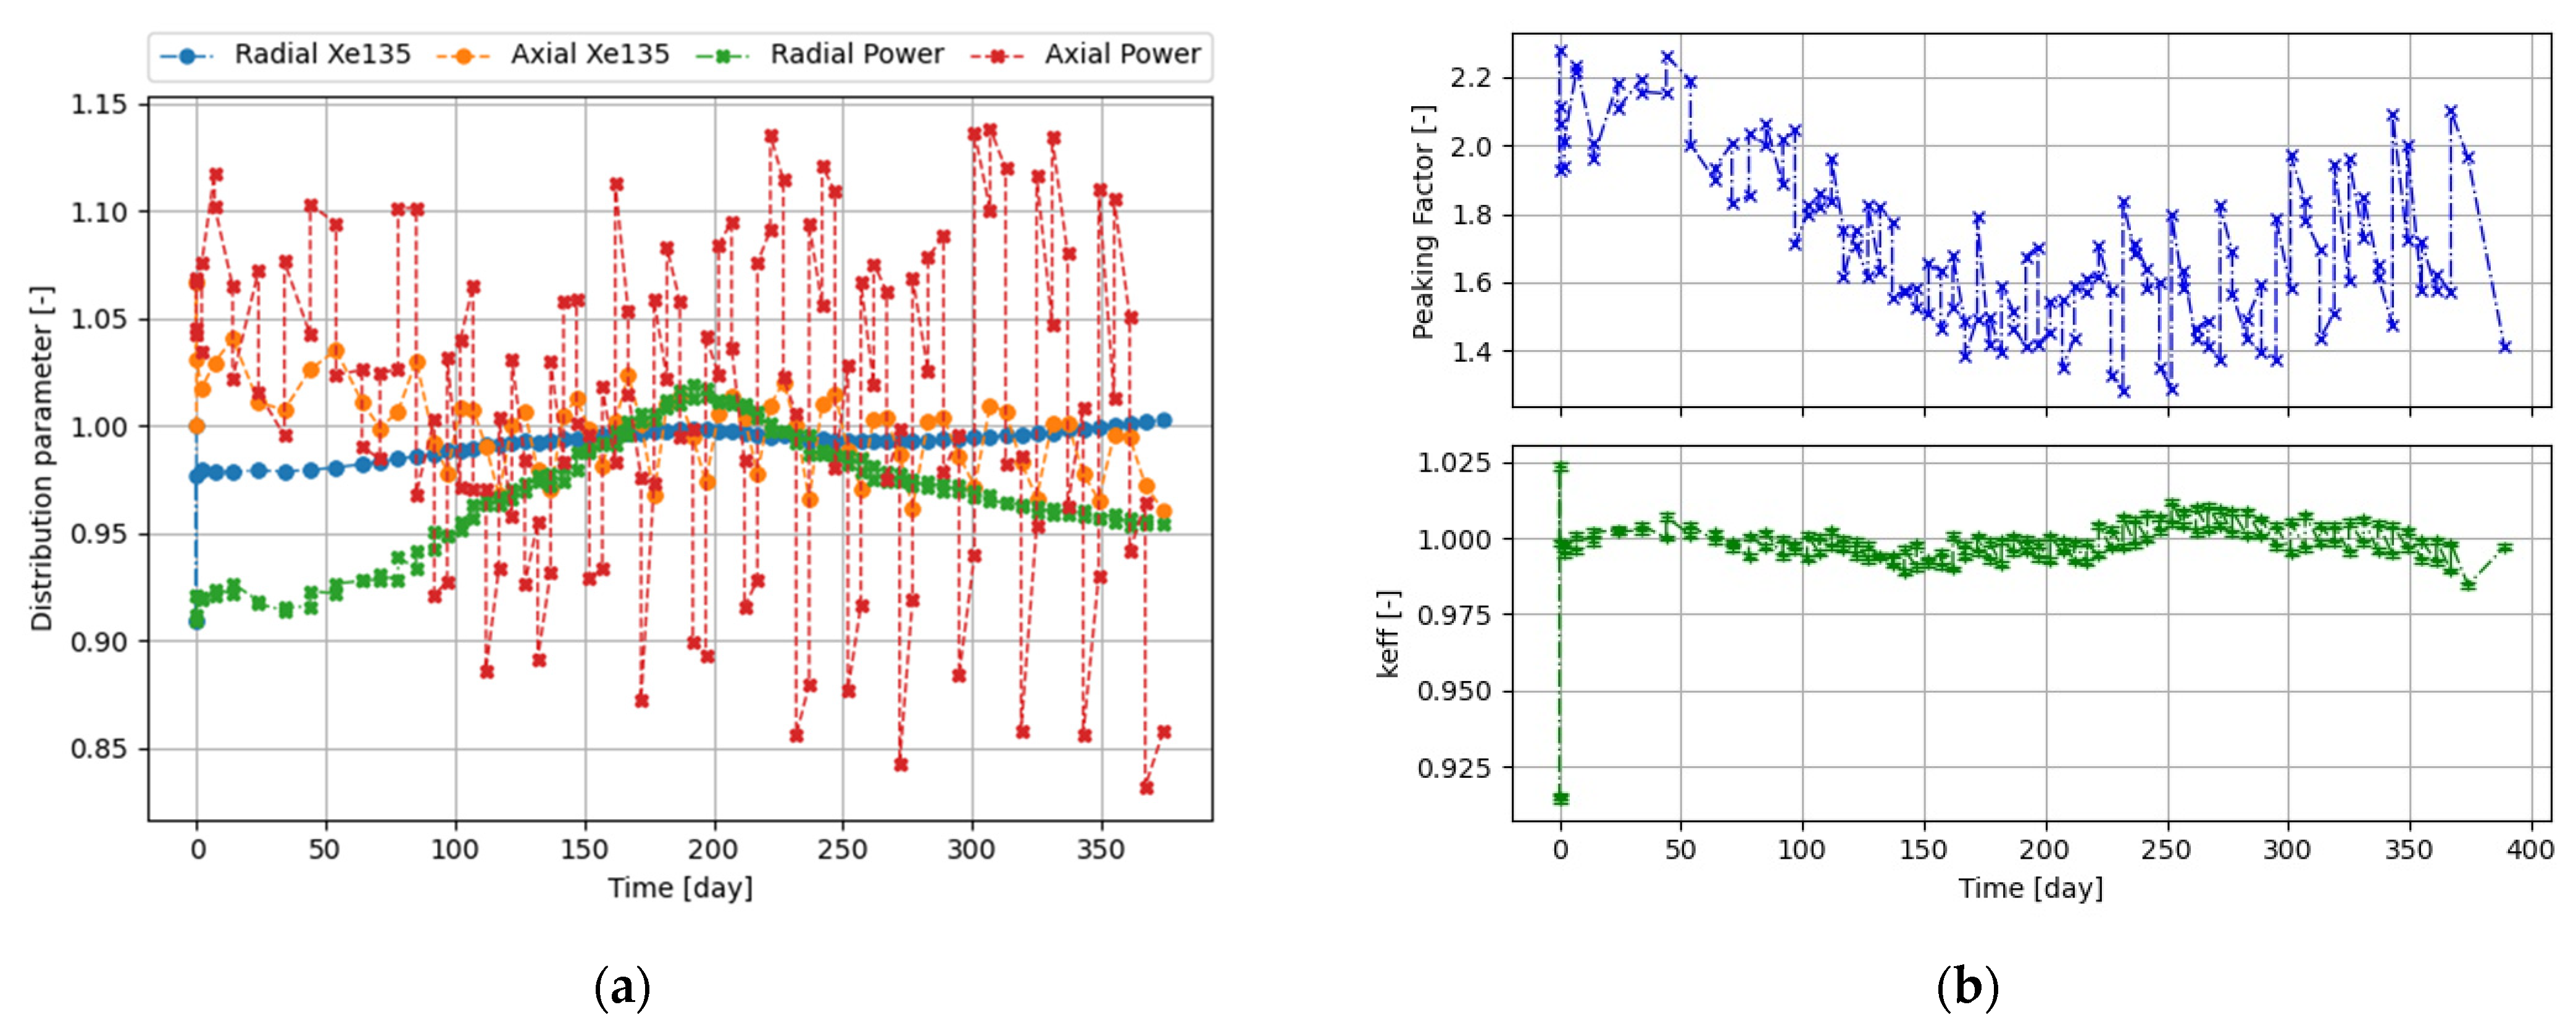
The results of the simulations for the St_solid and St_struc strategies are presented in
Figure 5. One of the most common problems that occur during Monte Carlo burnup analyses is xenon numerical oscillations, and one way to reduce them is to shorten timesteps; thus, two additional one-day burnup timesteps were applied after every operation.
In
Figure 5a, it can be seen that the removal of the absorber from the bottom part of the core causes a tilt of the power distribution and a concentration of Xe135 in the bottom part. As the withdrawal of the control rods proceeds, the power profile tilts in the opposite way, and with each control rod group, the tilt is enhanced. When comparing
Figure 4a and
Figure 5b, it can be derived that the more tilted the power profile is, the higher is the peaking factor. The application of the structured control rods significantly reduced the change in the power and xenon profiles in the axial direction, as well as peaking factors, as seen in
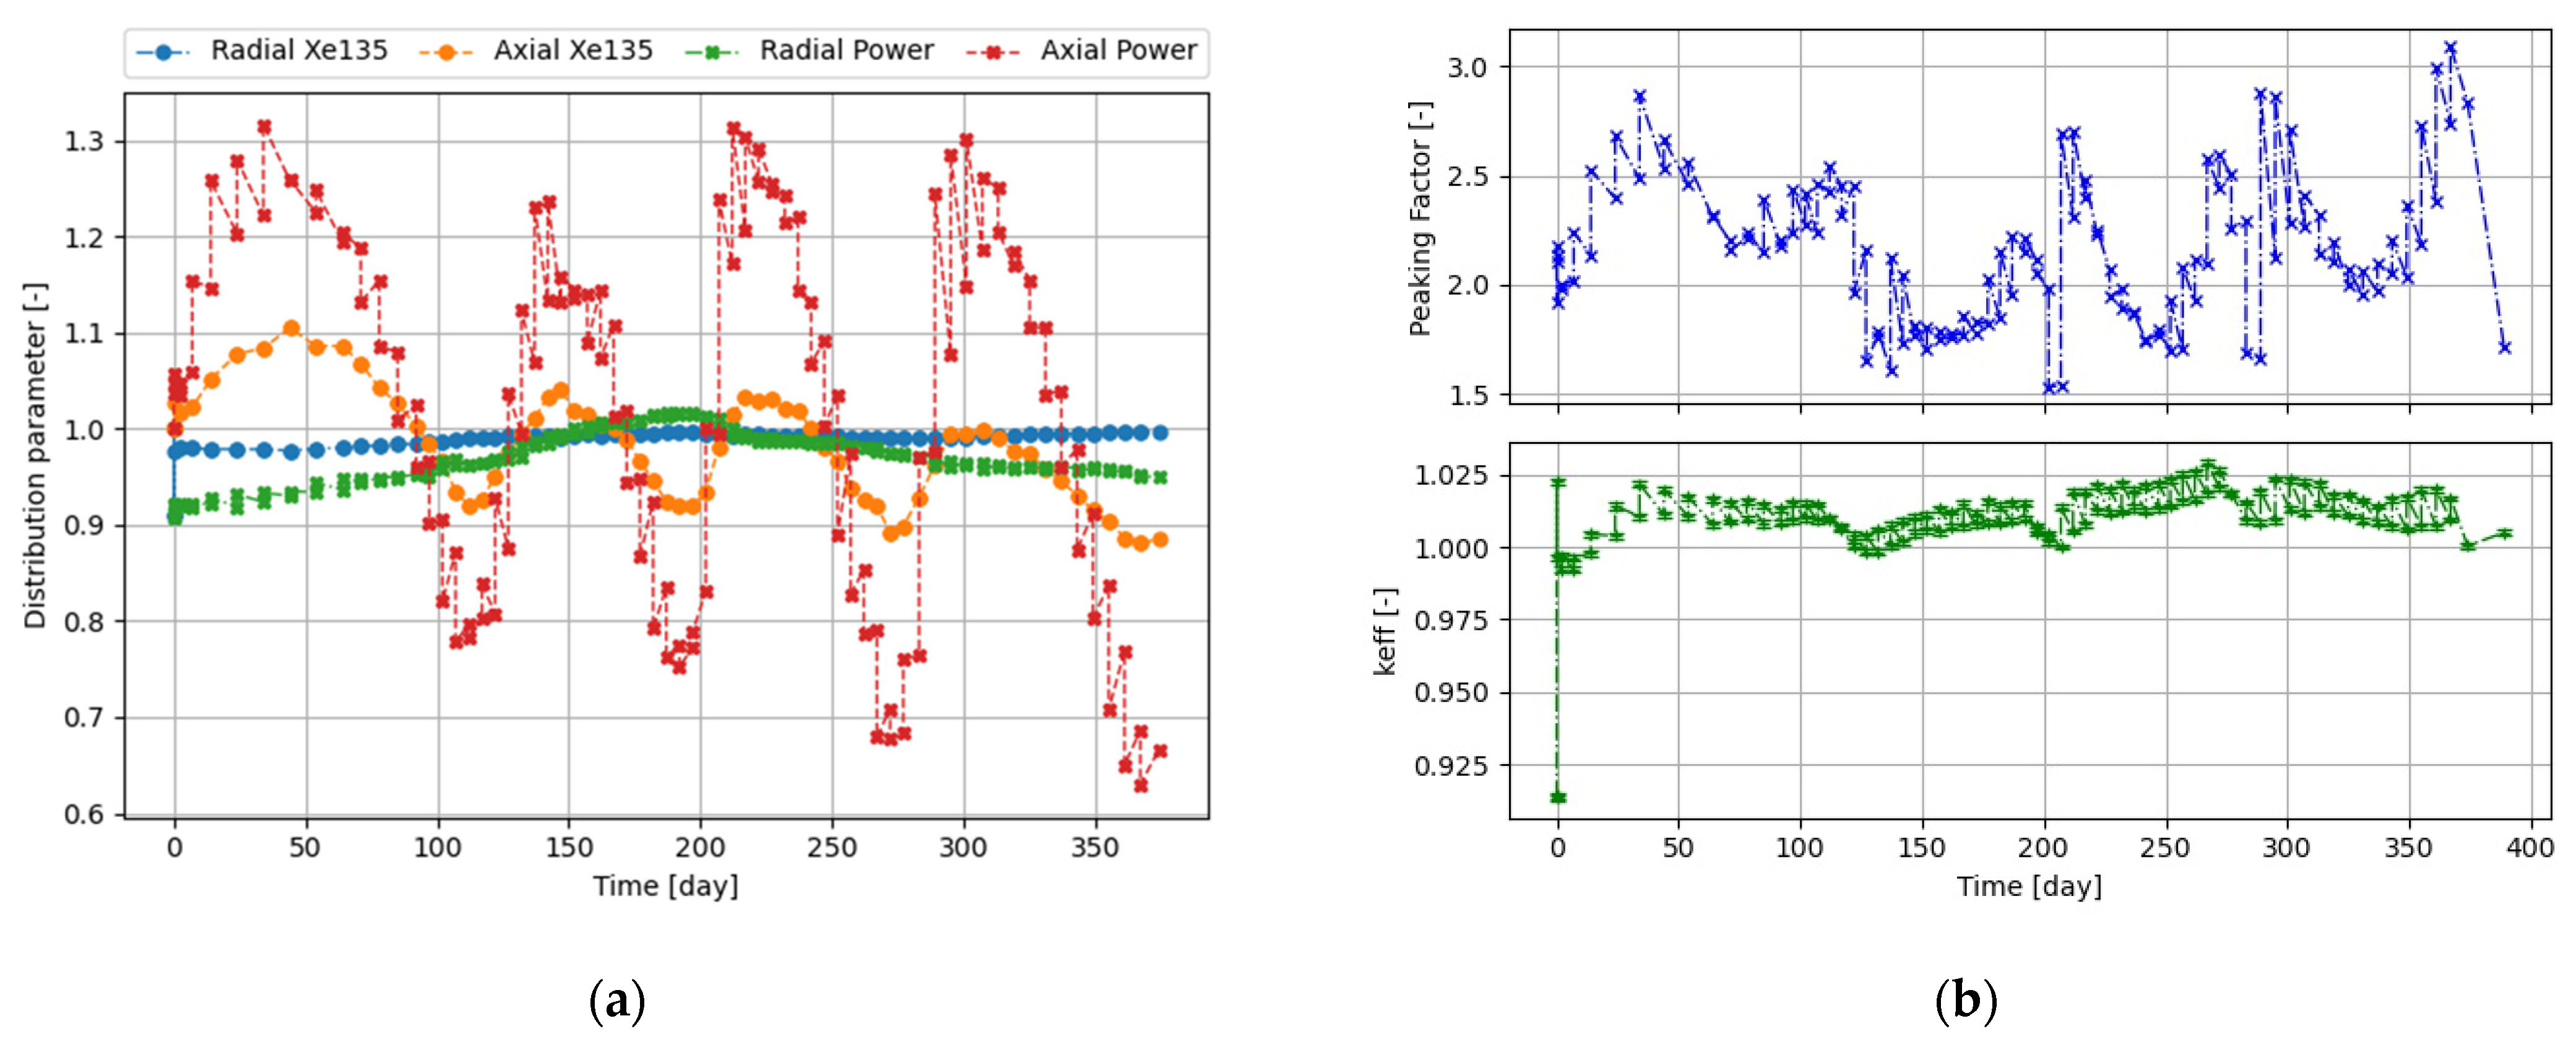
Figure 5c,d. It can be inferred that the radial power profile flattens as the outer control rods are removed, but later it becomes tilted again toward the core center as the inner control rods are withdrawn. This seems to be also confirmed by the behavior of the total peaking factor, as it keeps a minimal level, and the radial power oscillation is closest to value 1. However, it should be noted that closer to the end of the cycle, the withdrawal of the last CR sections caused larger changes in reactivity and distribution parameters than at the beginning of the cycle. This applies to both strategies, but for the simpler St_solid, the effect is that the power distribution axial swing is much stronger.
Figure 5e,f provide a visualization of the significance of the distribution parameter, where the axial distribution parameters are 0.55 and 0.95, respectively. The maximum power factor in the St_solid strategy oscillates, increasing along burnup, and reaches a level of 4.0, whereas in the St_struc strategy, it floats below 2.3 after peaking at beginning of live (BOL). However, the above results were obtained in some way too simplified timestep scheme, which generates some biases. A better timestep scheme is needed—first in order to narrow the margin of calculated criticality level, and second, to increase the number of steps for the case of structure rods in order to calculate distribution parameters also in the time point when CR sections are partially withdrawn.
More effort was put into establishing an optimal control rod operation strategy in terms of reducing the power peak factor (defined as the maximum form factor) and possibly keeping the reactor critical. Due to the high number of parameters to set and their dependencies (volumetric fractions of control rod radial layers, times of operations), the search was carried out with a trial-and-error method. It was found that starting the operation from the outermost radial layer, the more inner layer of the control rod had a greater impact on the reactivity; thus, the volumes of inner layers were significantly reduced in favor of outer layers. Thus far, the structure of the radial layers of the control rod is most promising in terms of volumetric fraction, which is, starting from the outermost layer, 45%, 33.6%, 14.3%, and 7.1%. Later layers are referenced by Roman numbers I, II, III, and IV, respectively. This structure was tested for the St_opt strategy, as described in
Table 5. The timesteps were refined to better represent the evolution of the system. This process was also adopted for the St_solid strategy.
Table 6 presents the worth of each radial layer of control rods in each group corresponding to control rod parts operated in the St_opt strategy and the reactivity swings thus obtained. Every reactivity worth value is calculated as the difference in reactivity of the fresh core with all rods completely withdrawn and reactivity of the core with single specific rod parts inserted. The reactivity worth of the B
4C radial layer is much higher than the corresponding reactivity swing in St_opt; however, it should be noted that the method of determining the worth influences the results [
11]. The worth of tungsten radial layers decreases as the volumetric fraction of the radial layer decreases. Nevertheless, there is an almost opposite tendency in the case of reactivity swings.
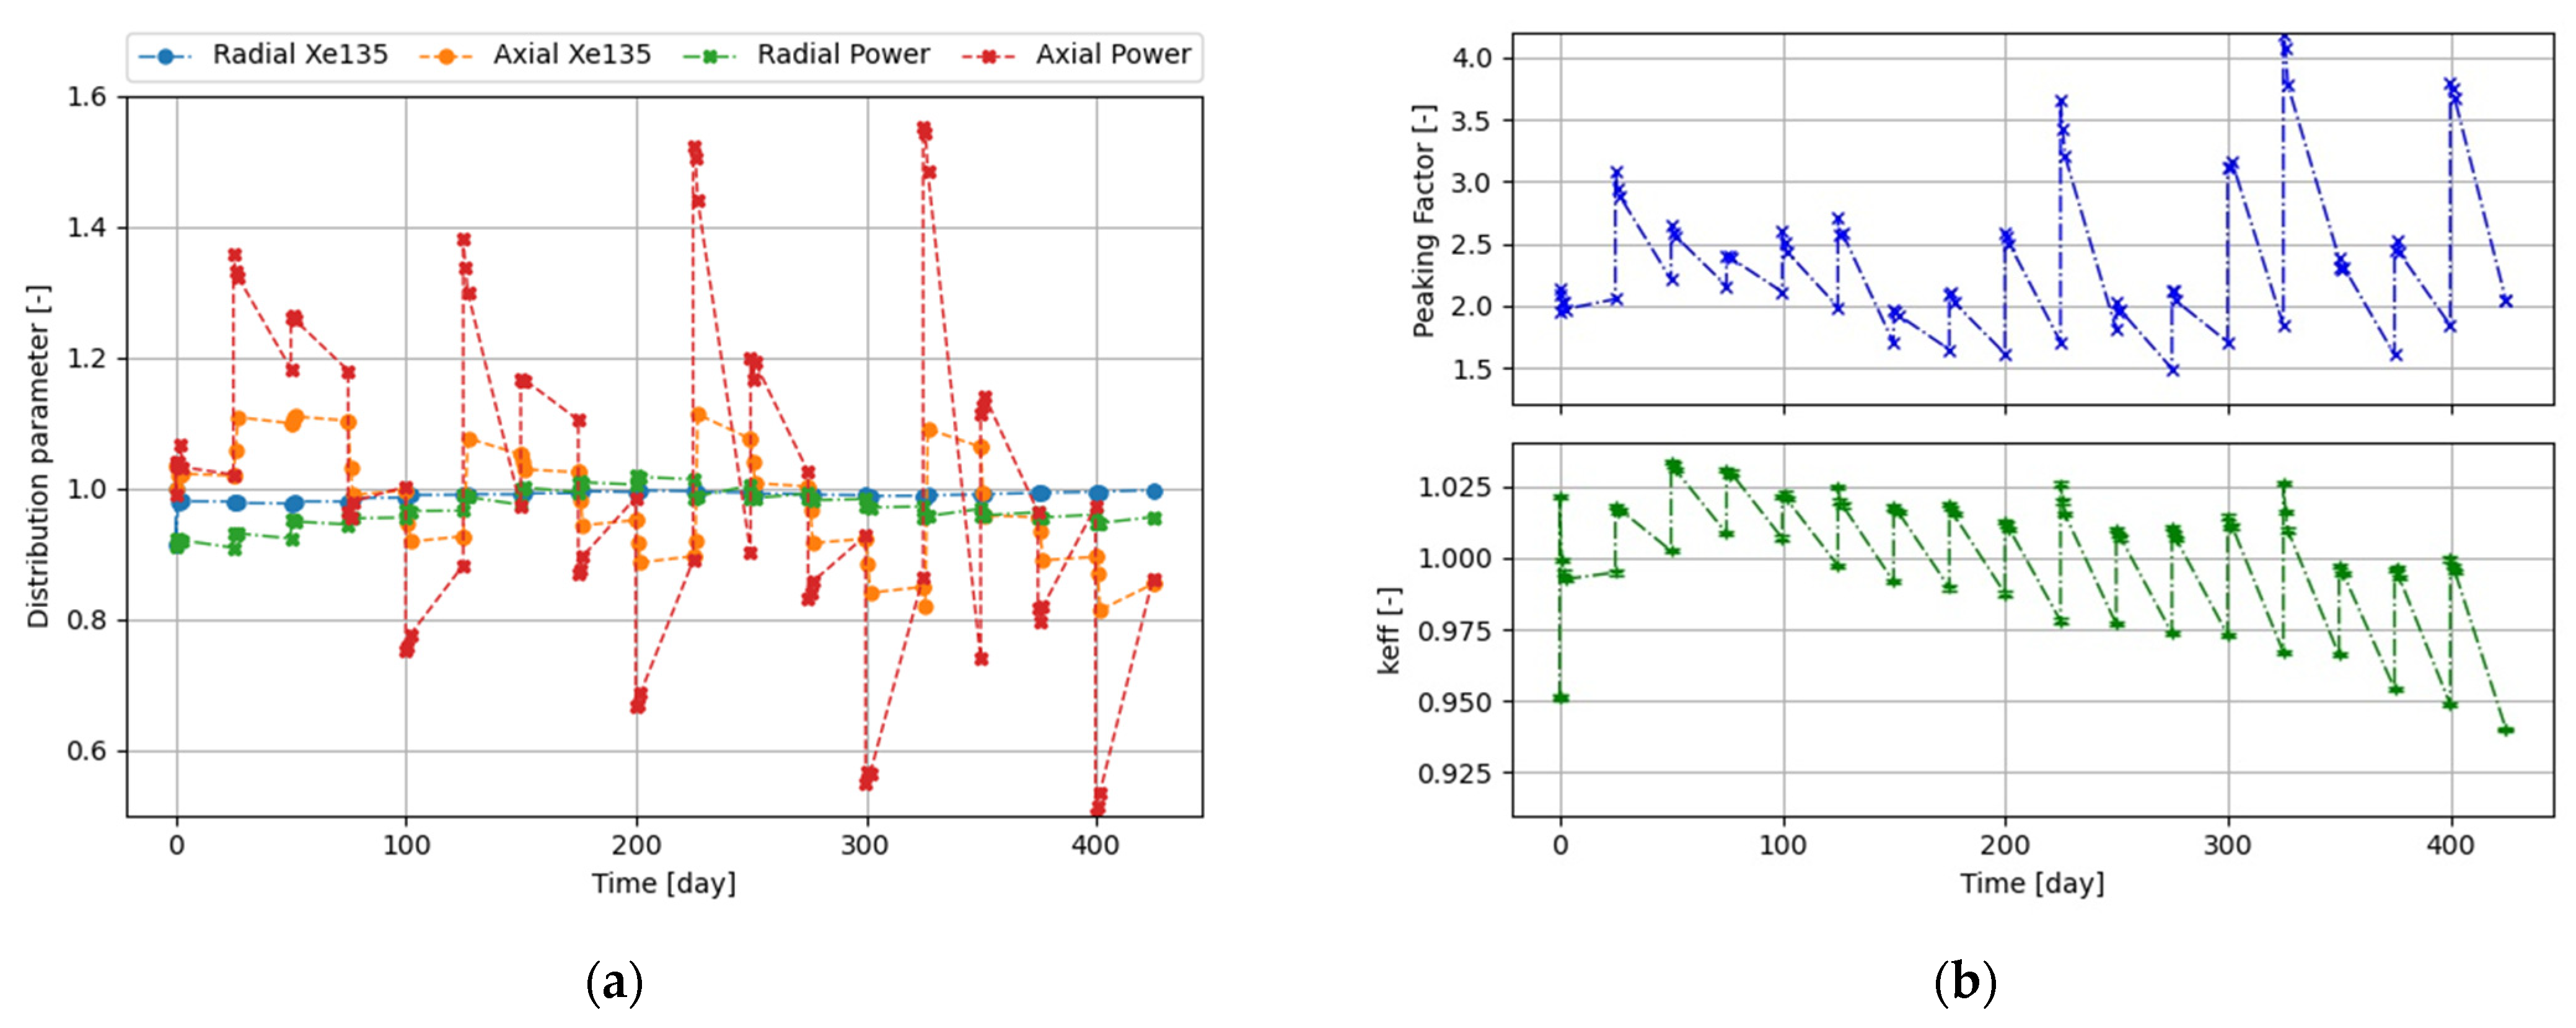
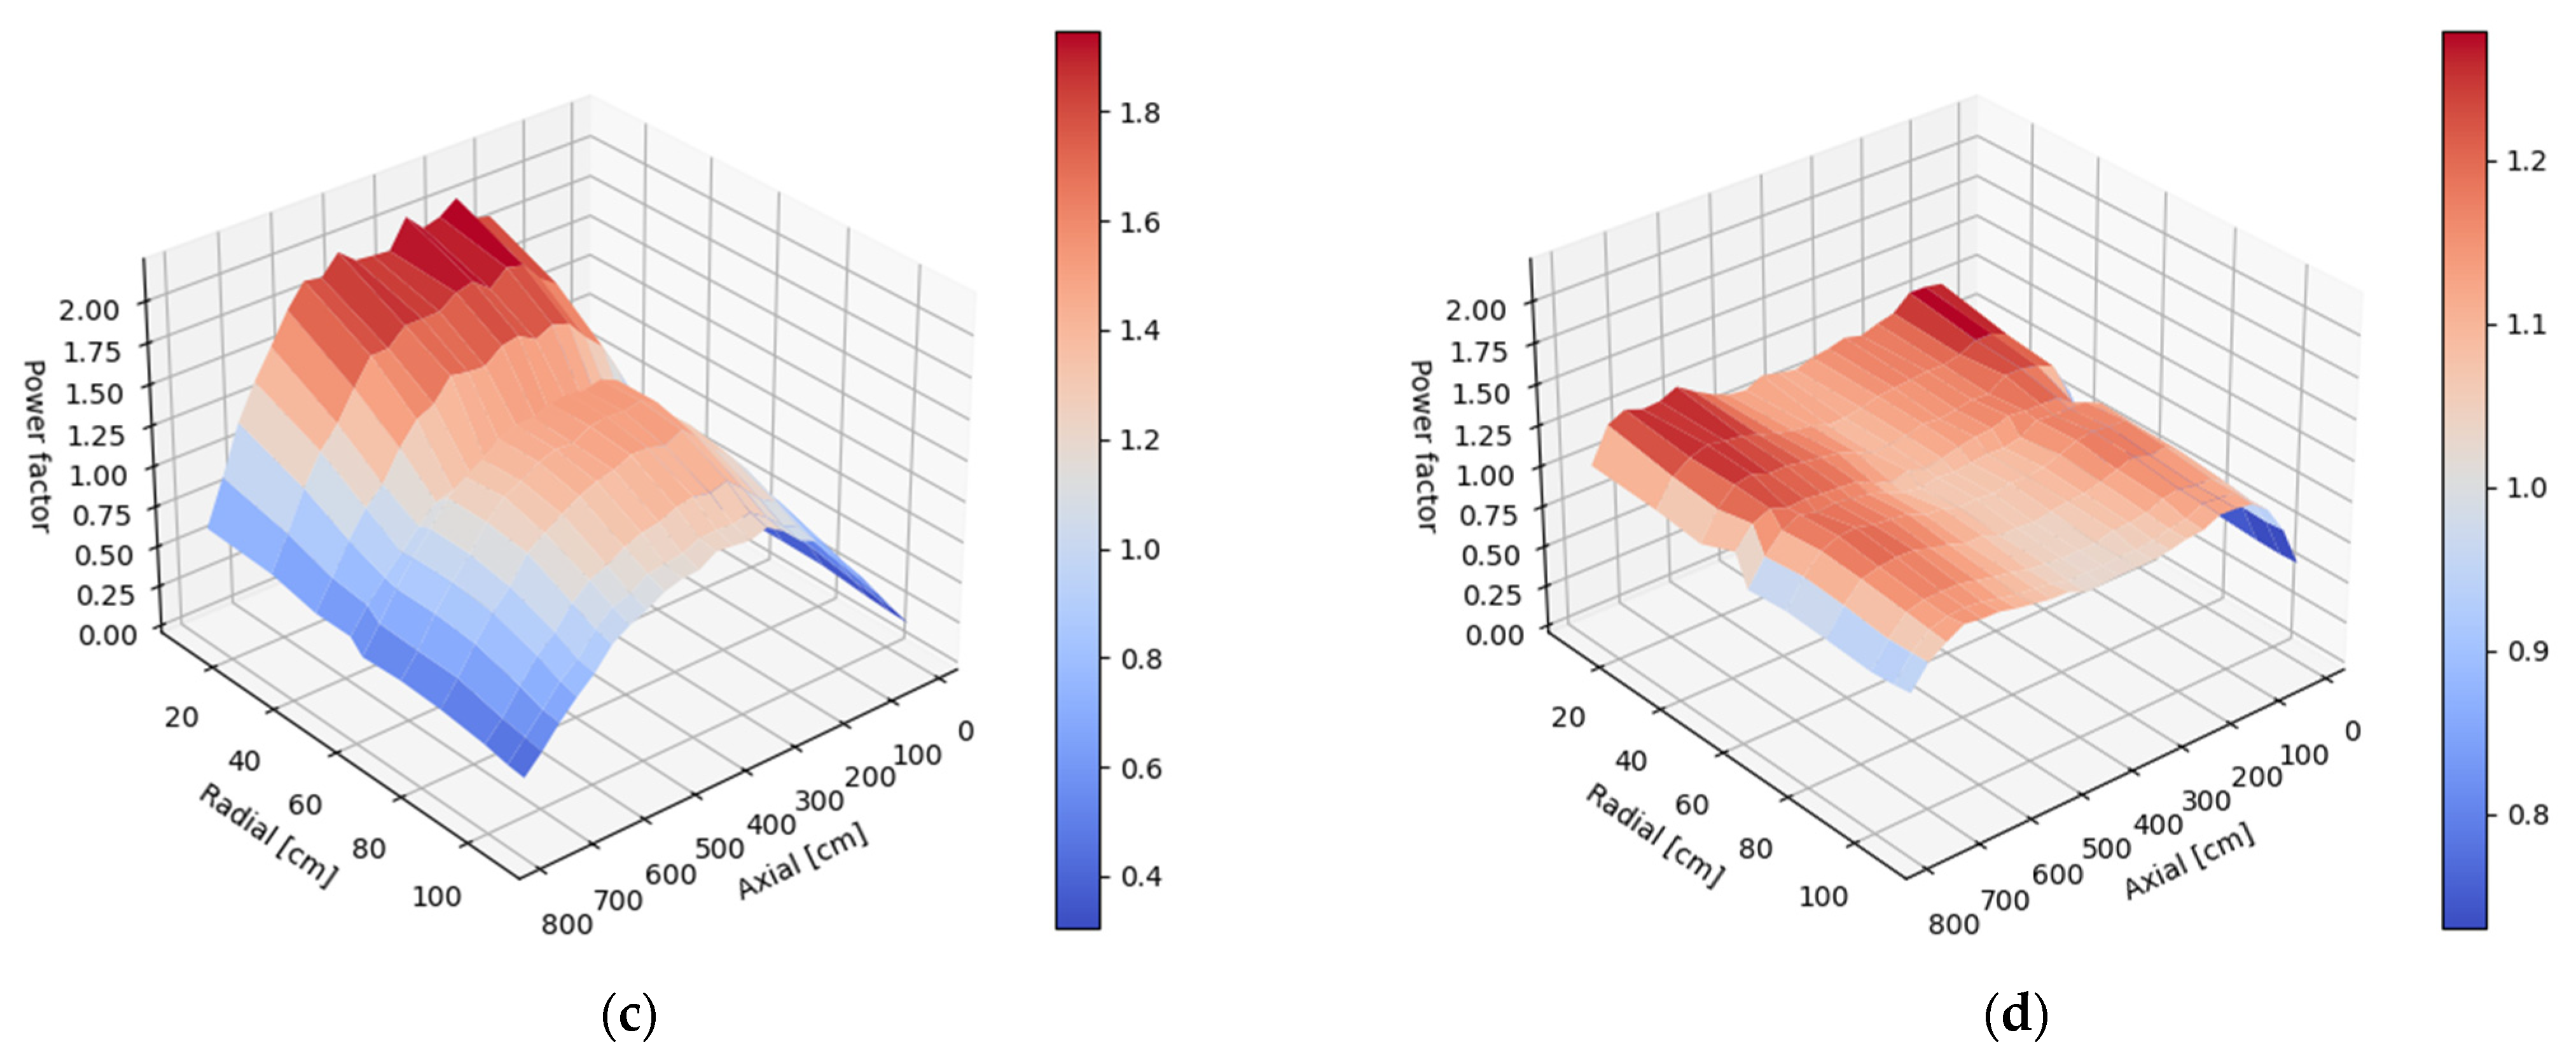
The results of the optimal strategy with structured rods are shown in
Figure 6. With a given control rod structure and operation strategy, axial power oscillations were not eliminated but significantly reduced. The visualization of the St_opt strategy and division of control rods into the effectiveness of the radial layer, as well as power profiles with maximum and minimum peaking factors, were presented directly after operation; it is for days 20 and 260 in
Figure 6c,d, respectively.
5. Conclusions
In this paper, the concept of radial division of control rods and its possible applicability to flattening power distribution were shown. Control rods are neutron absorbers; thus, they play important roles in shaping the neutron flux and, with it, power profile, especially in HTGRs, which take into account their specific neutronic properties. Due to deep neutron moderation in the graphite, control rods locally have a very significant impact on reactor performance. Withdrawal of a control rod leaves a region of the core significantly changed due to lack of absorber, leading to increased fission rate and later to Xe135 buildup.
Implementation of a radial division of control rods enables an operator to reduce this effect in terms of axial power because the absorber is not completely removed from a reactor region, but its amount is reduced. Thus, the fission rate cannot increase rapidly, and the change in the power profile is smoother. Furthermore, analyses showed that even a small amount of absorber matter, and it can be seen by the fact that the removal of the last innermost layers significantly changed the keff, and thus, its volumetric share was greatly reduced. However, this aspect of the work requires more analyses in the future, since studying the radial structure of control rods was not the subject of this work. Another important aspect that may require additional work is the numerical xenon oscillation.
However, the presented concept should not replace other aspects of control rod operation strategies, as it did not seem to affect the power profile in the radial direction.


