Article

Deployment and Optimisation of a Pilot-Scale IASBR System for Treatment of Dairy Processing Wastewater

1
Civil Engineering, School of Engineering, College of Science and Engineering, National University of Ireland, H91 HX31 Galway, Ireland
2
Ryan Institute for Environmental, Marine and Energy Research, National University of Ireland, H91 TK33 Galway, Ireland
3
SFI MaREI Research Centre for Energy, Climate and Marine, National University of Ireland, H91 TK33 Galway, Ireland
4
School of Natural Science, College of Science and Engineering, National University of Ireland, H91 TK33 Galway, Ireland
*
Author to whom correspondence should be addressed.
Energies 2021, 14(21), 7365; https://doi.org/10.3390/en14217365
Submission received: 12 August 2021 / Revised: 31 October 2021 / Accepted: 2 November 2021 / Published: 5 November 2021
(This article belongs to the Special Issue Sustainable, Resilient Built Environment and Communities)

Abstract

:
Increased pressure is being applied to industrial wastewater treatment facilities to adhere to more stringent regulations for the discharge of treated wastewater and to improve energy efficiency of the process. Nitrogen and phosphorous removal can be challenging to achieve efficiently, and in the case of phosphorous removal, can often necessitate the use of chemicals. There is a major drive globally to improve wastewater treatment infrastructure, whilst simultaneously reducing the carbon footprint of the process. The intermittently aerated sequencing batch reactor offers a modification of the well-known sequencing batch reactor process that can enable lower energy requirements than conventional sequencing batch reactor processes and can facilitate enhanced nutrient removal capacities. However, to date much of the previous literature has focused on relatively short laboratory-scale trials (often with synthetic wastewater) which may not be representative of larger scale system performance. This study explored the intermittently aerated sequencing batch reactor technology via a case-study deployment at a dairy production facility, in terms of treatment efficiency and energy efficiency with a focus on optimisation between phases. High treatment capacity and operational flexibility was achieved with NH4-N removals averaging >89%, PO4-P removal averaging >90% and total suspended solids removal averaging >97%. This research demonstrates the characteristics of intermittently aerated sequencing batch reactor technology at scale to effectively achieve biological nutrient removal. In addition, this study demonstrated that when effectively managed, energy savings and reductions in carbon emissions in the region of 36–68% are achievable through optimisation of reactor operation.

1. Introduction

The abolishment of European Union (EU) milk production quotas in 2015 has resulted in the rapid growth of the dairy production and processing industries, which has seen domestic milk production in the Republic of Ireland grow by approximately 30% (from 6395 million L in 2015 to 8293 million L in 2020 [1,2]). Dairy processing is a water-intensive activity, with up to 10 m3 of wastewater produced per m3 of manufactured product [3,4]. There is a major drive globally to improve wastewater treatment quality, whilst simultaneously reducing the carbon footprint of the process [5]. Such wastewaters contain high, but variable, levels of phosphorus and nitrogen [6], with total Kjeldahl nitrogen (TKN) concentrations of up to 1462 mg/L and total phosphorus (TP) concentrations of 640 mg/L reported in dairy processing wastewater [7]. These levels must be significantly reduced (>80% removal would be typically recommended) prior to discharge, with typical discharge limits of 15–40 mg/L total nitrogen (TN) and 2–5 mg/L TP for slaughterhouse wastewater [8] and 5–25 mg/L TN and 2–5 mg/L TP for dairy processing wastewater [9]. Failure to achieve these limits poses an environmental health risk. For example, eutrophication, which can be caused by the above pollutants, is comprehensively documented as a major threat to freshwater ecosystems [10] and is one of the most challenging environmental problems faced in the world today [11].
Treatment of dairy processing wastewaters typically occurs using a mixture of physical, chemical and biological approaches. Screens are used to remove gross solids, dissolved air flotation is used to remove fats, oils and greases [12], while flocculation with chemicals such as ferric chloride or aluminium chloride is used for TP removal [13] and biological processes facilitate TN removal. However, dairy wastewater typically contains 5–20-times greater TP concentrations than municipal wastewater, making chemical amendments alone uneconomical and unfeasible [14]. As there is a significant cost and energy requirement [3] of physicochemical amendments, and an increased volume and toxicity of the resulting sludge, significant efforts are being made to develop novel, low-cost, low-energy, scalable solutions for the treatment of dairy wastewater to below the required discharge limits. As dairy wastewaters are characterised by a high organic content [6], an elevated temperature and a wide pH range, biological treatment is considered to be a promising approach [3] for nutrient removal, if limitations around P removal capacity can be overcome.
According to the European Commission’s Best Available Techniques guidelines, activated sludge systems, specifically sequencing batch reactors (SBRs), are suited to the treatment of dairy wastewater [9]. In particular, SBR systems have the capacity to simultaneously remove the high levels of chemical oxygen demand (COD), nitrogen and phosphorus that are characteristic of this wastewater stream [9,15]. In an SBR, a batch operation process follows the order of fill, react, settle and draw/decant, with the “react” stage incorporating a single non-aeration period, followed by a single aeration period. During the non-aeration period, anaerobic denitrifying bacteria reduce oxidised nitrogen to nitrogen gas, and phosphate accumulating organisms (PAOs) release PO4-P contained within their cells [16]. In the subsequent aeration period, aerobic nitrifying bacteria convert ammonium-nitrogen (NH4-N) to nitrite (NO2-N) and nitrate (NO3-N) [17]. Concurrently, PAOs uptake PO4-P [16]. Due to the increased number of PAOs in the system resulting from rapid replication under aerobic conditions, PAOs uptake a greater mass of PO4-P than they release during the non-aeration period. The PAOs can then be removed from the system by sludge wastage resulting in a net phosphorus reduction in the effluent [18].
An intermittently aerated sequencing batch reactor (IASBR) is a modified SBR configuration that incorporates cycles of non-aeration and aeration. This cyclic operation has been observed to be more effective than conventional SBRs in nutrient removal [19]. Given that NO2-N is an intermediate form of nitrogen in both nitrification and denitrification, partial nitrification denitrification (PND) can be seen as a mechanism to convert NO2-N directly to N2 gas rather than via NO3-N [20]. In an IASBR, the aim is to achieve nitrogen removal via the nitrite pathway, and/or by achieving PND by careful manipulation of the cyclic operational process [21]. Removal of nitrogen by PND is associated with a 25% reduction in aeration requirements compared to the nitrite pathway. Furthermore, with the PND pathway, the electron donor requirement in the anoxic period is reduced by up to 40% with increased nitrification rates, lower CO2 emissions and lower sludge production [22,23]. This reduction in carbon requirement for nitrogen removal can often be beneficial as TN removal can in some cases be limited by the available carbon for removal of NOx-N from wastewater after generation of these nitrogen forms during oxidation of NH4-N [24,25]. The cyclic operation of an IASBR also promotes phosphorus removal, with PAO cell growth during multiple aerobic periods facilitating increased uptake of PO4-P. IASBR technology has previously been demonstrated to be an efficient technology for treatment of dairy processing wastewater at laboratory scale [17]; however, significant knowledge gaps still exist regarding the scale up of this biological system to pilot or full scale operation. During the aerobic period in particular, the oxygen transfer rate (OTR) and substrate availability are key criteria that must be optimised to ensure continued efficient nutrient removal efficiencies [26]. In particular, careful management of dissolved oxygen levels are required to optimise TP removal, as over-aeration can result in P release due to cell lysis [27]. Conventional activated sludge treatment and trickling filters may not be optimal for dairy wastewater treatment as the high soluble COD content encourages high-rate filamentous bacterial growth [3]. SBRs have however been observed to be an apt choice for the treatment of dairy wastewater and more appropriate than conventional activated sludge systems for such wastewater [28], due to their high flexibility in loading and design effluent quality; when operated effectively they can treat wastewaters which can be challenging to treat due to varying composition by arranging the cycle to appropriately deliver anaerobic, anoxic and aerobic treatment [29]. IASBR systems may offer a more energy-efficient alternative to enhance performance at such facilities. SBRs have been described as one of the most promising types of activated sludge treatment options available for dairy wastewater treatment, due to their flexibility of operation and “all-in-one” design, in which anoxic, anaerobic, aerobic treatment and clarification can all be carried out in a single reactor. These advantages highlight the importance of research into enhancing the conventional SBR process, to equip operators of these facilities with a treatment solution that can remove organics, solids, nitrogen and phosphorus all in a single step [29,30,31]. It has been documented that the SBR technology is seen as one of the most appropriate biological aerobic treatment solutions for dairy wastewater treatment with the capacity to remove organics, nitrogen and phosphorus, and although performance can be impacted when the flow rate is high, if managed correctly it can deal with high ammonium concentrations [31].
Combined aerobic and anaerobic approaches can also be applied to dairy wastewater treatment. This can allow for both energy production from organic carbon but also subsequent nutrient removal. However, such processes will inevitably be more complex and require greater process control and capital investment [3]. The low carbon requirement of the IASBR technology for nitrogen removal could make it a viable solution to be paired with anaerobic treatment systems in the future. This study reports on the successful scale up of an IASBR system from laboratory-scale demonstrators (8 L) to pilot scale (3000 L). The pilot-scale system was installed at a dairy processing facility in the Republic of Ireland and used to treat a dairy wastewater stream at the dairy processing facility. The operational methodology and system performance were monitored over a period extending past a year, with daily sampling. Assessment of NH4-N, PO4-P and total suspended solids (TSS) removal efficiencies were carried out under different operational conditions to identify optimal process parameters for energy-efficient treatment of dairy wastewater to within the required discharge limits. There is a need for further research into treatment technologies for dairy wastewater at a larger scale, to assess the feasibility and performance of novel technologies under real world conditions [32]. An evaluation of this nature has never been conducted at this scale before with an IASBR system. The technology has been tested on dairy wastewater at laboratory scale with success, exhibiting the potential of the technology for application within the dairy sector. Operation of the reactor at an active site will facilitate the generation of quantitative data for evaluation of its efficiency and identify any potential operational issues that could be encountered when scaling a system of this type to full scale. System optimisation of operation with a focus on energy efficiency has not been conducted with an IASBR and particularly not at a scale of that larger than a laboratory-scale system.
This study demonstrates, for the first time, the novel use of a pilot-scale IASBR system for cost-effective dairy wastewater treatment with efficient biological nutrient removal, which, to the knowledge of the authors, has not been implemented before at this scale.

2. Materials and Methods

2.1. Aim and Objectives

The aim of this study was to evaluate the performance of a pilot-scale IASBR system within the dairy sector and optimise its operation. In order to achieve this aim, the following objectives must be completed:
  • Provide a thorough evaluation of the technology’s applicability to treating dairy wastewater at a larger scale under real world conditions;
  • Quantitatively evaluate the removal capabilities of the system for nitrogen and phosphorus;
  • Optimise reactor operation to maximise throughput, maintain high removal rates and improve energy efficiency.

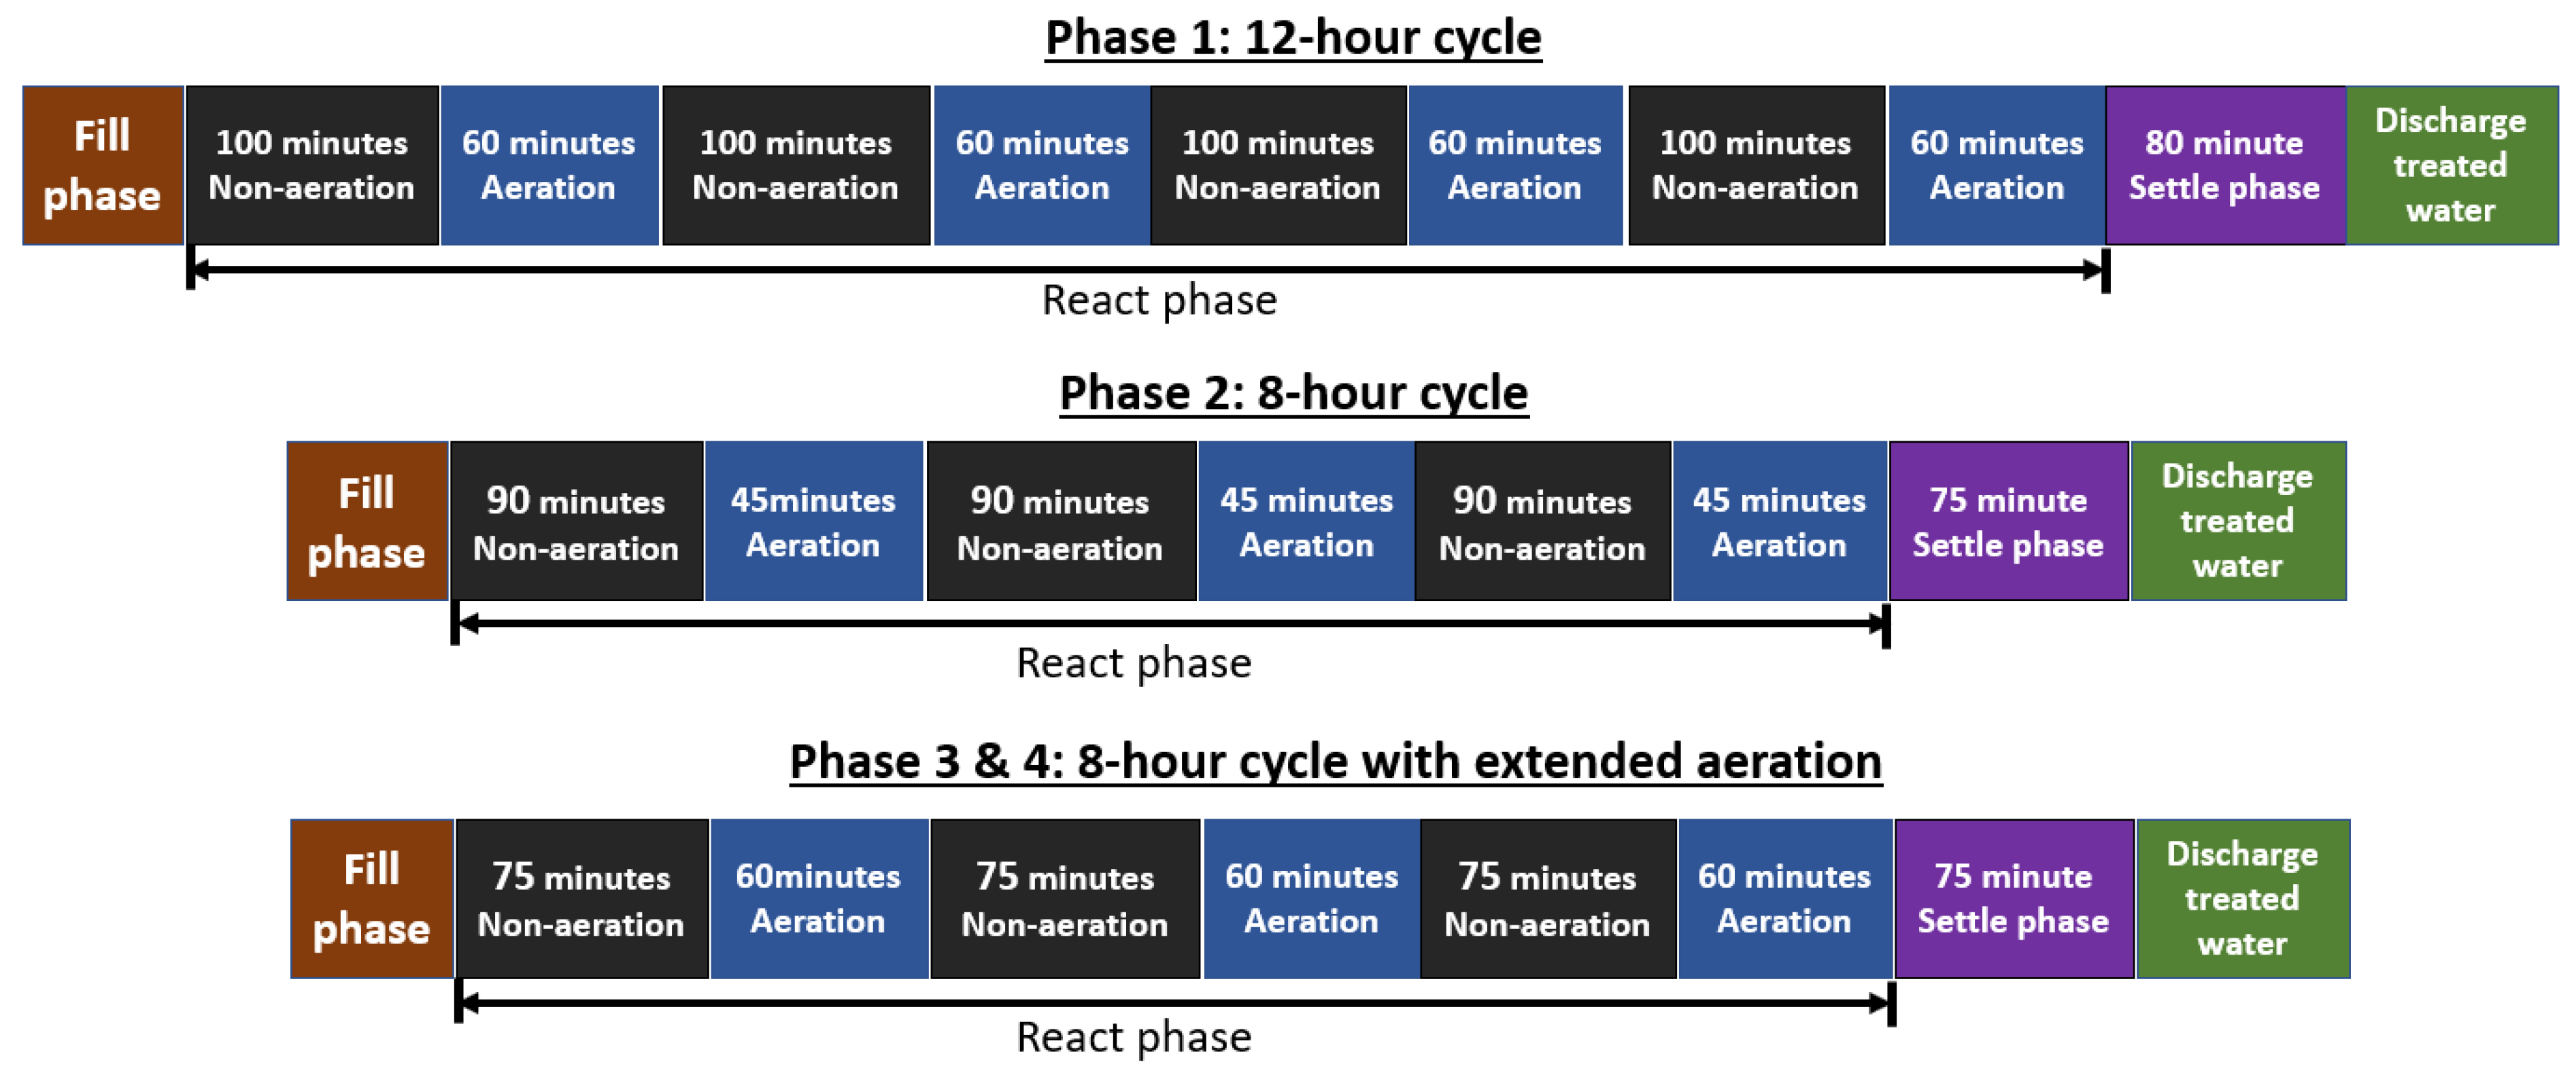
2.2. IASBR Design and Operation

A pilot-scale IASBR (working volume 3 m3/3000 L) was designed based on the operational parameters of a previously reported laboratory-scale system [17], and was installed at an Irish dairy processing facility as pictured in Figure 1. The pilot-scale reactor was a 2.1 m high and 1.72 m wide precast concrete tank with a total volume of 3.5 m3. Three pumps were installed for fluid conveyance: one feed pump for filling the reactor (Lowara Domo 7vx), which was installed in a sump that fed the site’s aeration tank, one for sludge removal (Lowara Doc 3) and one for effluent discharge after treatment (Lowara Doc 3). Air was supplied to the unit via a blower (EL-S-300) connected to coarse bubble air diffusers located at the bottom of the reactor (2 × 750 mm and 2 × 500 mm). Mixing was provided by a circulator (DAB Novair 200 with blocked air intake) installed in the middle of the reactor. A programmable logic controller (PLC; Siemens LOGO! 8) operated the blower, mixer and pumps at scheduled intervals to tightly regulate aeration regime, cycle length, hydraulic retention time (HRT) and sludge retention time (SRT). Sludge was wasted whilst the reactor was mixed, to maintain a constant SRT irrespective of the mixed liquor suspended solids (MLSS) concentration (or sludge volume index). Two bidirectional float switches closely regulated liquid volumes. An energy meter recorded energy consumption of the IASBR system throughout the operational period. Due to the scale of the motors in this system, wire-to-water efficiency is not representative of a full-scale system, when equipment sizes are available to match relevant energy densities for mixing and aeration. However, energy efficiency can be deduced in a qualitative fashion at this scale, by considering reduction in aeration on times between different optimisation phases and when compared with traditional full-scale systems.
At system start up, activated sludge was taken from the on-site aeration tank (operational concentration ca. 6000 mg/L) to seed the IASBR reactor. The system was operated to maintain a SRT of 16 days (yielding an average MLSS concentration of ca. 3000 mg/L) and HRTs ranging from 2.67–4 days. During operation, raw wastewater, diverted from the dairy processing facility waste stream, was pumped into the IASBR at the start of a cycle, controlled by the PLC. This wastewater was diverted from the main treatment plant’s stream, taken from a sump after DAF treatment and directly before being pumped to the site’s aeration tank for treatment; average concentrations of this wastewater stream throughout the investigation are presented in the Results (Section 3.1). Once the reactor had reached its working volume (ca. 5 min), the intermittent aeration treatment strategy commenced, beginning with a non-aeration period. The reactor was operated in four phases (P1–P4), defined by the overall cycle time, and the duration of non-aeration/aeration periods (Figure 2). The parameters of P1 were based on the laboratory-scale IASBR conditions previously described [17], while P2–4 were each defined in response to the operational performance of the preceding phase.
A small number of operational issues were experienced during the trial, which were identified and resolved. The trial took place for a period of over a year with samples from over 430 independent days analysed. There were four high-resolution studies conducted during the trial, during which samples were taken every 15–30 min throughout one full cycle to assess treatment performance and adjust process parameters for optimum efficiency. These results are discussed below. Although there was no designated stabilisation period between each phase, each was made sufficiently long to capture over four SRTs per phase.
For P1 (duration 147 days), a 12 h cycle was divided into four cycles of non-aeration (100 min) and aeration (60 min), followed by an 80 min settle period (Figure 2).
The non-aeration and aeration periods were reduced to 90 min and 45 min, respectively for P2, with a 75 min settle time. Implementation of P2 resulted in a 50% decrease in HRT, but with the same volume being treated per cycle. P2 was maintained for 90 days. In P2, between days 156 and 164, the circulation pump failed, causing a drop in reactor performance. In the absence of circulation, when aeration was inactive, the biomass settled to the bottom of the tank and no treatment took place during periods when the aerator was off.
In P3 (duration 73 days), the 8 h cycle was maintained, but the balance of time between non-aeration and aeration periods was adjusted by 15 min, resulting in non-aeration periods of 75 min followed by aeration for 60 min. Finally, for P4 (duration 123 days), the cycle time and non-aeration/aeration period lengths remained the same as in P3. However, in P4 the operation of the blower during aeration periods was altered to a regime of 5 min duty followed by a 5 min quiescent period, rather than continuously “on” as in P1–3, to reduce the running costs and lower the dissolved oxygen (DO) concentrations during the aeration periods.

2.3. Sampling and Analytical Methods

Influent samples were taken from the sump where the feed pump was located during each visit and effluent samples were taken daily by a refrigerated autosampler. For each of P1–4, a high-resolution study was carried out to assess the performance of the reactor over an entire cycle and determine the impact of the operational changes on the nutrient concentration within the reactor. For each high-resolution study, the first sample was taken at the beginning of the cycle. For P1, subsequent sampling was carried out every 20 min. For P2–4, two samples were collected during each aeration/non-aeration period, with an additional sample collected at the points between aeration/non-aeration periods. During these studies, samples were taken directly from the completely mixed reactor and the mixed liquor samples were immediately filtered using a 0.45 µm filter to remove bacteria and prevent further biological activity in the samples. All samples were filtered on site (using 0.45 μm filter) and filtered samples were stored at 4 °C during immediate transport (1 h 30 min) to the laboratory, where they were analysed for NH4-N, NO3-N, NO2-N and PO4-P concentrations using an Aquakem 250 nutrient analyser (Thermo Scientific). Suspended solids testing was performed following standard methods [33]. Temperature, pH and DO were monitored using a WTW-Multi 3620 IDS handheld probe controller. COD was not analysed periodically during the investigation, as it was not within the scope of this study, but sporadic spot checks were performed to ensure that values were in line with what would be typical for this type of wastewater.

2.4. Energy Optimisation Analysis

Analysis of system energy consumption was conducted using Microsoft Excel during the system operation to determine energy-efficiency measures that could be taken to reduce consumption of the IASBR reactor. The rated (wire) power of each motor was used (shown in Table 1), along with the motor run times (shown in Table 2) to calculate the energy consumption of each cycle.
Once validated by comparing modelled values with measured values, modelling of future operations that would reduce energy consumption and maintain system treatment performance was conducted.

3. Results and Discussion

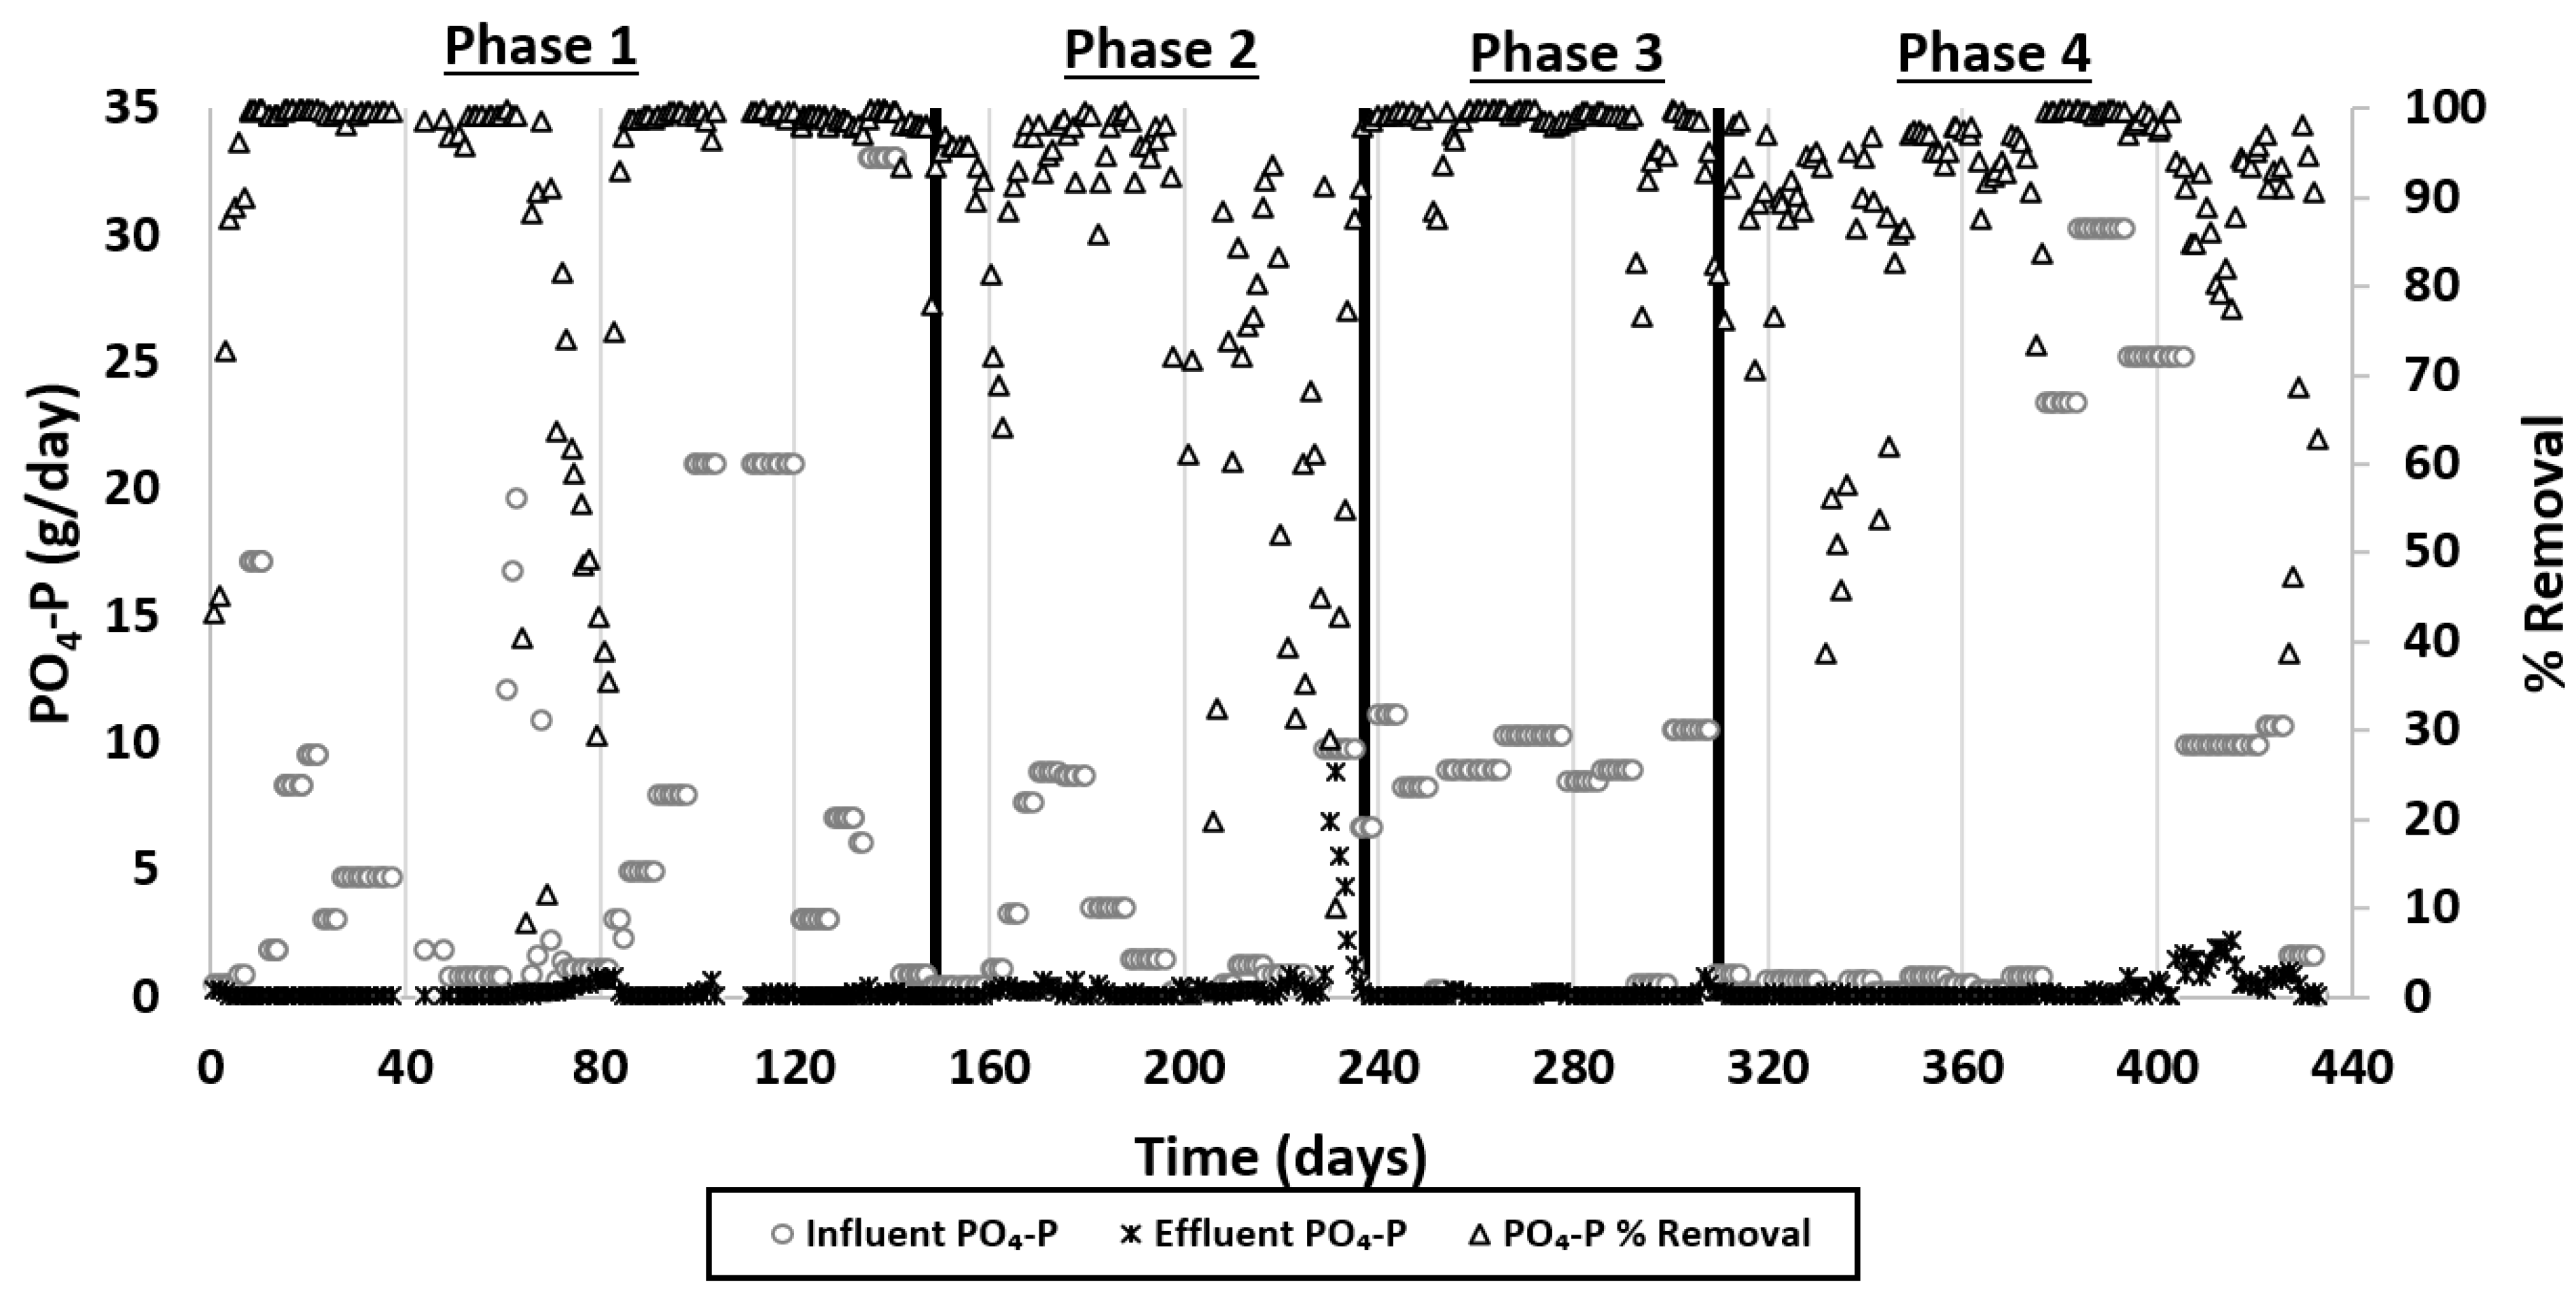
3.1. Overview of Contaminant Removal throughout the Study

The average influent and effluent concentrations to and from the IASBR system during each operational phase are summarised in Table 3.
During operation at the site there was a large variation in the influent concentrations of the contaminants recorded throughout phases (demonstrated by a high standard deviation in influent concentrations) and between different phases (Table 3). For example, variations in influent NH4-N concentrations to the IASBR ranging from 0.59–68.65 mg/L were observed (Table 3). However, it should be noted that the TN:NH4-N ratio in the influent wastewater ranged from 1.6 to 2.5 due to the presence of organic nitrogen. Influent COD concentrations during the study ranged from 505–4560 mg/L (n = 78) with a median concentration of 1593 mg/L. These large fluctuations in concentration were due to the seasonality of the dairy industry resulting in a varying load to the dairy processing facility throughout the year [34]. Hydraulic loading rates to the reactor during different phases is compared with other IASBR studies in Table 4. With high volume dairy product production requiring processing throughout the summer months and a significant reduction in the winter months, similar changes in loading were seen in the WWTP. Such high variation in loading can be problematic for setting consistent operational parameters in batch fed systems. A treatment regime designed for high strength wastewater would result in wasted energy when treating low strength wastewater, highlighting the importance of flexibility during operation. The IASBR system generally exhibited high removal capacity for nitrogen (Figure 3), phosphorus (Figure 4) and TSS (Figure 5). After the initial stabilisation week, the system demonstrated high nitrogen removal (ca. 90%, as per Figure 3), inclusive of times when operational problems were encountered.
The system also exhibited high capacity for biological nitrogen removal with effluent total oxidised nitrogen (NOx-N) averaging 1.45 mg/L, and ammonium discharges consistently below the emission limit value of 0.5 mg N/L during most operation periods at the facility (Figure 3).
The average NH4-N removal rate of 89.5% over the course of the pilot investigation was in line with those that were observed during laboratory-scale research into the use of IASBR technology for the treatment of dairy wastewater, with average removal of 92.3% recorded whilst treating both wastewater from the same facility and synthetic wastewater at a similar loading rate [17]. Furthermore, average nutrient removal rates in this study of 89.5% for NH4-N were similar to, or in one case in excess of, those achieved in IASBR systems applied to slaughterhouse wastewater treatment which recorded average removals of 94%, 44.2% and 97.6% [15,35]. In some of the studies utilising IASBR technology treating slaughterhouse wastewater, the pilot system in this study had a hydraulic loading rate of 2.5–3.8 times larger whilst maintaining comparable NH4-N removal rates [35]. Khalaf et al. (2021) compared the use of conventional activated sludge systems and SBRs for the treatment of dairy wastewater; the findings reported SBRs to be more effective in treatment of dairy wastewater and reported removal efficiencies ranging from 85–90%, the maximum removal reported lower than that in this study of >99% [28]. Dan et al. (2020) tested the performance of an Intermittent Cycle Extended Aeration System (ICEAS) and compared to conventional SBR treatment for treatment of digested swine effluent, the findings of this study found that the intermittent aeration strategy employed facilitated higher treatment performance than that of conventional treatment, with removal rates for NH4-N reported similar to those in this study, i.e., up to 97% reported under certain operational conditions [36].
The IASBR system provided effluent with low phosphorus concentrations over the course of the pilot study, with only 27 instances where the pilot system effluent was non-compliant with the site licence (0.8 mg/L). Variations in percentage removal were mostly related to a decrease in incoming P concentrations. Figure 4 illustrates the orthophosphate mass flows and removal efficiencies (%) during the study.
The capacity of the system to biologically remove phosphorus is of significant benefit to operators, as most systems cannot carry this out and require the use of expensive chemicals such as aluminium sulphate and ferric sulphate that are commonly used to precipitate phosphorus [37]. Use of these chemicals can lead to production of a more toxic sludge bringing increased cost for disposal along with the actual chemical cost. Capacity to biologically remove this nutrient will significantly reduce operational costs as biological phosphorus removal is one of the most cost-effective methods of phosphorus removal [14]. To date there has been limited success on a consistent basis for biological P removal within the dairy industry, with many systems often suffering from inconsistent or inadequate performance, and it is reported that although there has been extensive research into biological P removal in SBRs at lab scale, research into biological P removal at pilot scale is not as well documented, thus highlighting the need to conduct research at pilot scales to demonstrate how stable P removal can be achieved on-site [14,38]. Novel methods of biological phosphorus removal which are more robust will allow operators to reduce chemical use and cost.
During this study, mass removal rates per unit MLSS were routinely recorded to assess the removal capacity of the IASBR system. During the study, the nitrogen removal rate (measured as NH4-N removed) averaged 1.33 mg N/day/g MLSS, with average removal rates for P1, P2, P3 and P4 of 1.57 mg N/day/g MLSS, 1.32 mg N/day/g MLSS, 0.22 mg N/day/g MLSS and 1.66 mg N/day/g MLSS, respectively. Phosphorus removal rates (measured as PO4-P removed) averaged 0.78 mg P/day/g MLSS throughout the study with average removal rates of 0.92 mg P/day/g MLSS, 0.31 mg P/day/g MLSS, 0.87 mg P/day/g MLSS and 0.88 mg P/day/g MLSS for P1, P2, P3 and P4, respectively.
Discharge of TSS was monitored over the course of the investigation and compared to the site’s discharge emission limit value (ELV) of 30 mg TSS/L. The IASBR effluent was non-compliant with the site’s licence permit 28 times during operation at the site. As observed in Table 3 and Figure 5, the IASBR system exhibited high TSS removal rates and organics removal with an effluent concentration average of 11.9 mg TSS/L during operation at the facility.

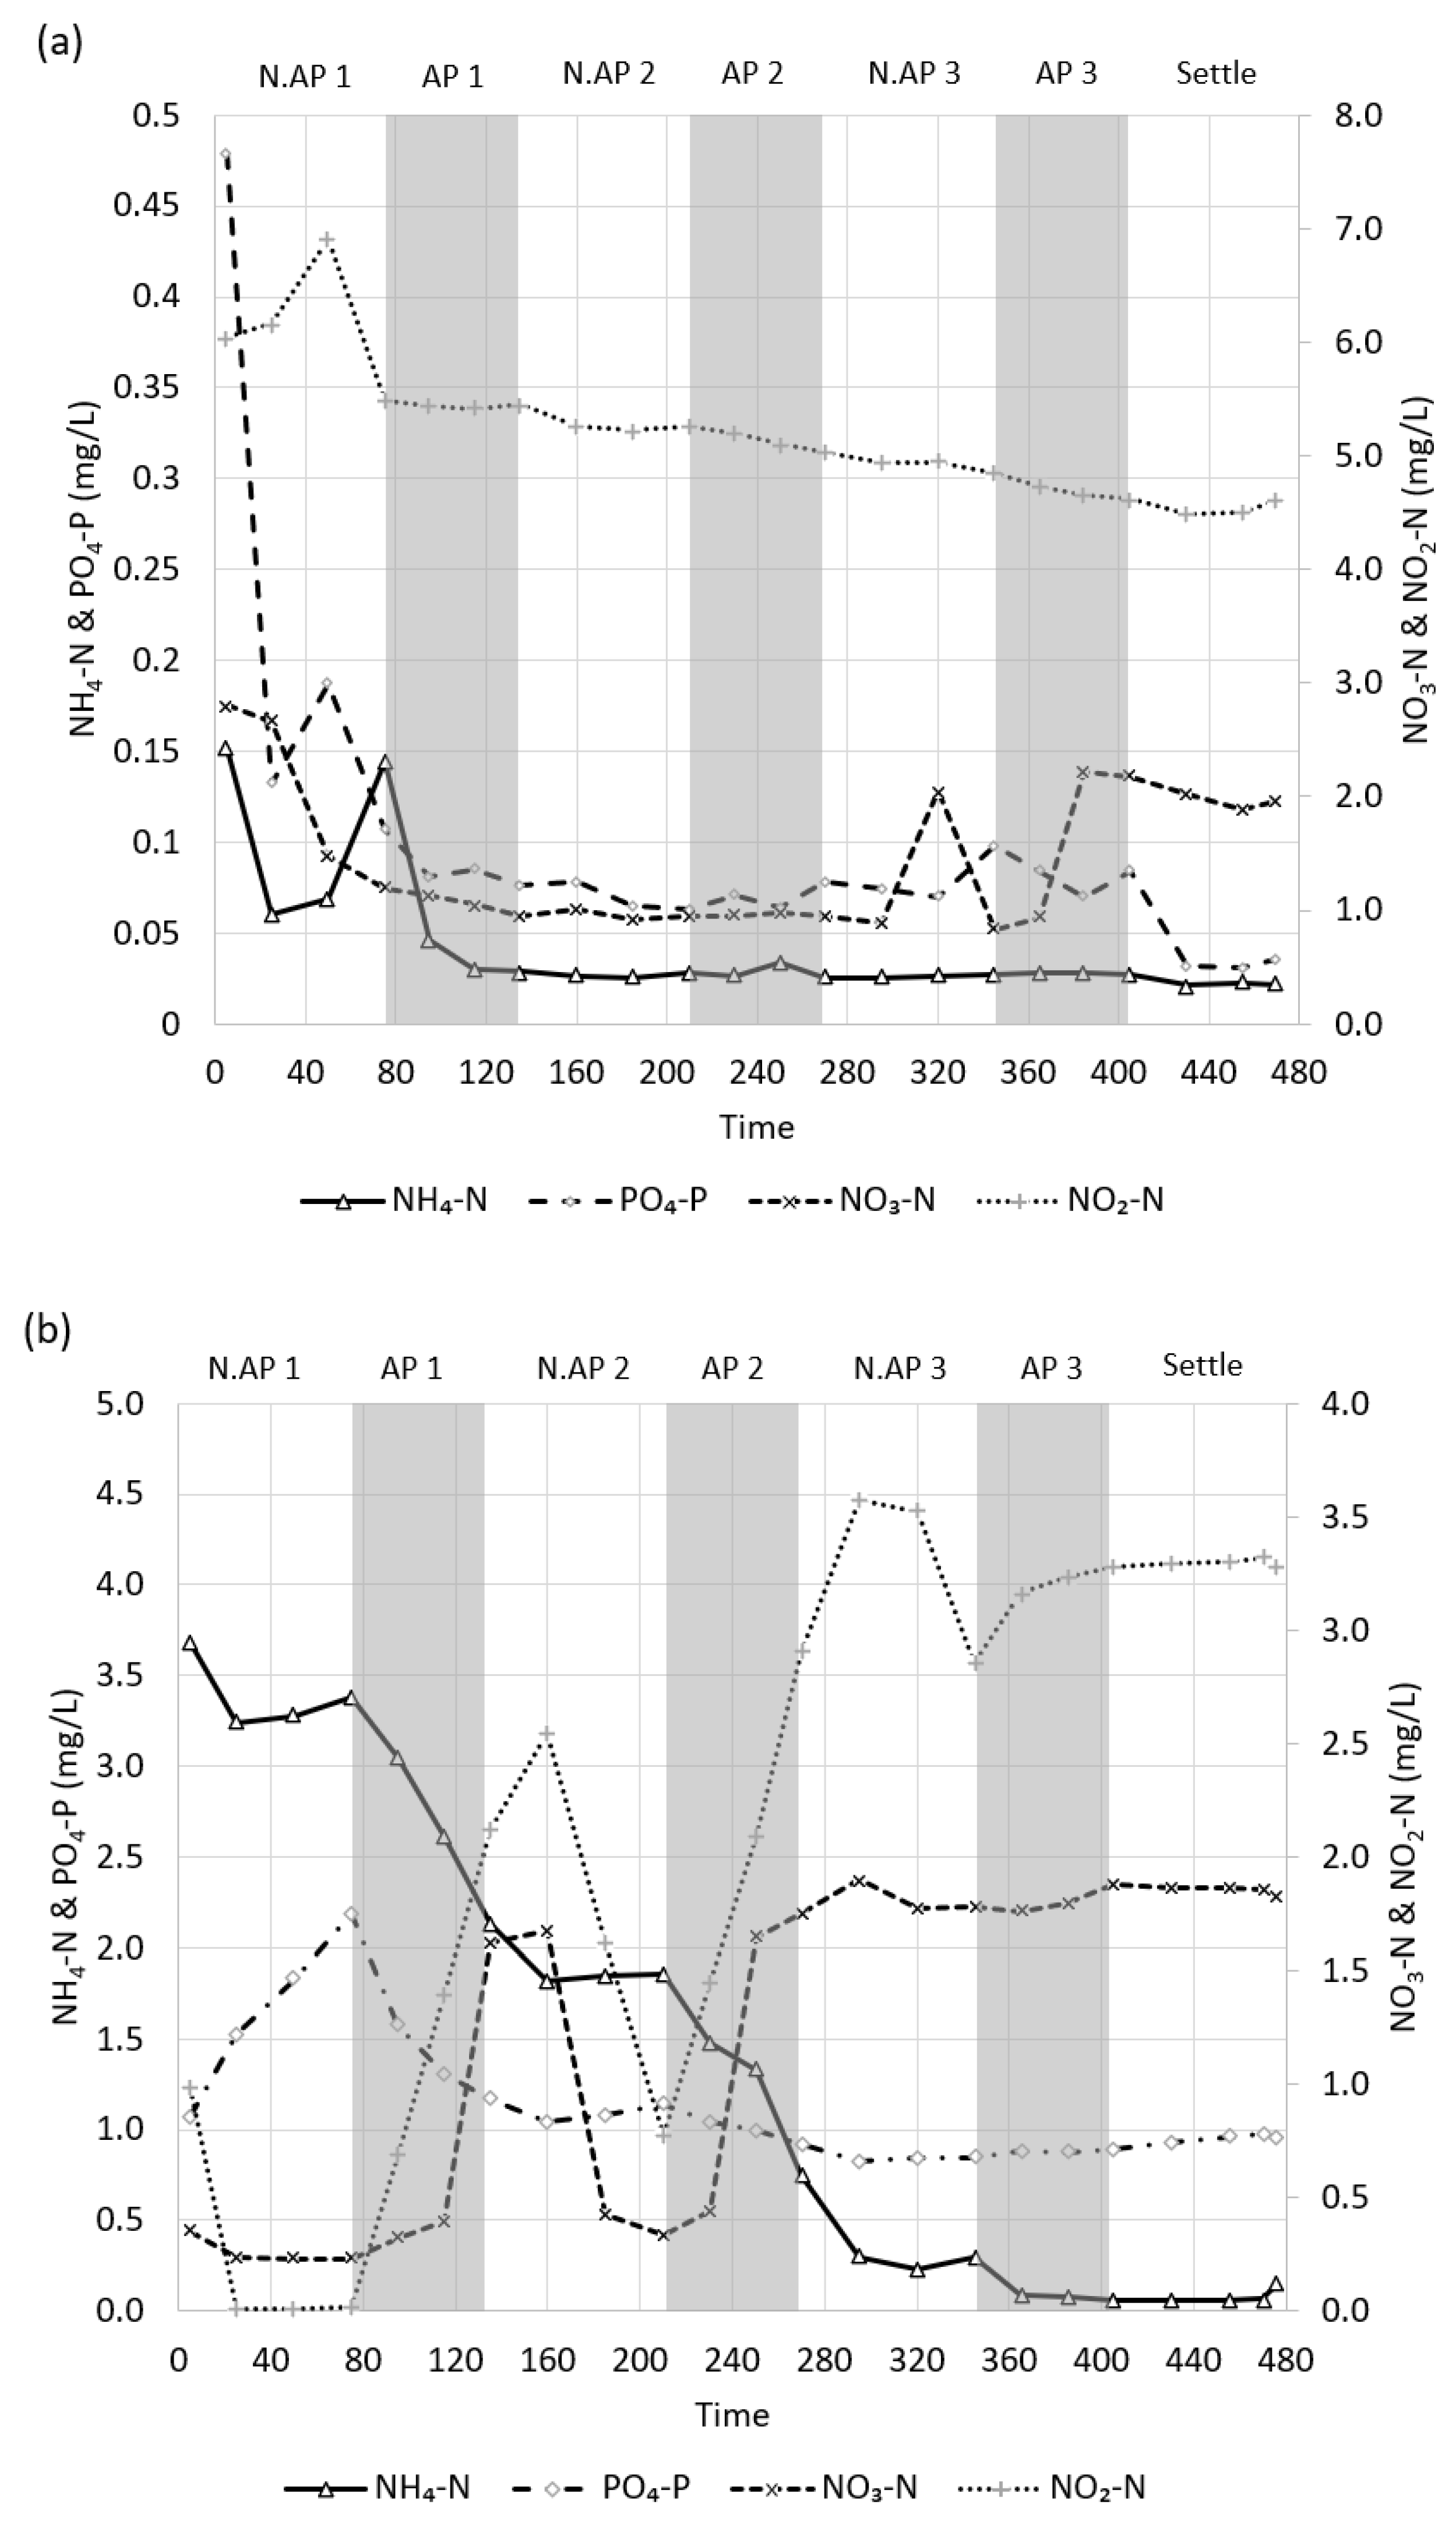
3.2. Phase Performance and High-Resolution Studies

Over the course of operation at the site, the goal was to optimise the treatment of dairy wastewater considering both treatment efficiency (e.g., aeration on times) and effluent quality. As such, process modifications were implemented during the study to improve the performance and energy efficiency of the IASBR reactor. During each phase of operation (P1–P4), a high-resolution study was conducted over the course of one full cycle to monitor the treatment process throughout periods of aeration and non-aeration. The results from the high-resolution studies of phases 1, 2, 3 and 4 are presented in Figure 6 and Figure 7 and summarised in Table 5.

3.2.1. Phase 1

High removal efficiencies of 96.0%, 93.0% and 97.7% were recorded for NH4-N, PO4-P and TSS respectively, and these high removal efficiencies were observed for the majority of operation during P1, aside from a few problems that were encountered leading to reduced performance. P1 yielded an average treatment performance of 11.7 kWh/m3 of wastewater treated (Table 6).
The results of the high-resolution study carried out on day 121 of P1 are presented in Figure 6a. The concentration of NH4-N increased slowly during the first non-aeration period (N.AP). However, once aeration was supplied to the reactor in AP1, NH4-N quickly declined to under 1 mg/L during this aeration period (AP) and continued to slowly decline during the periods that followed (Figure 6a). The PO4-P and NH4-N concentrations were reduced to below ELV limits (0.8 mg/L and 0.5 mg/L respectively) for discharge by N.AP3 and remained below these limits for the remainder of the treatment cycle (Figure 6a).
The P1 high-resolution study highlighted that most ammonium removal occurred in under seven hours into the 12 h cycle. Accordingly, the operational parameters for P2 were modified to facilitate the treatment of a greater volume of wastewater within a 24 h period, by reducing the total cycle length to eight hours whilst maintaining the same fill volume. This was accommodated by removing one non-aeration and one aeration period and amending the remaining timings. The duration of the aeration periods was reduced by 15 min to 45 min. As NOx-N in the effluent was observed to be high at times (maximum of 22.6 mg N/L recorded during P1), whilst the NH4-N was low, the non-aeration periods were shortened by 10 min rather than 15 min, to 90 min. The final settle phase was reduced by 5 min to 75 min to give a total run time of eight hours for P2.

3.2.2. Phase 2

After changes were implemented and P2 commenced, the reactor exhibited high removal rates for the first 51 days of operation, with average removal rates (influent to effluent) of 86.0%, 92.8% and 97.5% for NH4-N, PO4-P and TSS, respectively (Figure 3, Figure 4 and Figure 5, respectively). After this, a decrease in system performance and removal capacity occurred. During this time, effective NH4-N (Figure 3) and PO4-P (Figure 4) removal ceased, and very little nutrient reduction was taking place. P2 yielded a decrease in energy consumption per cubic metre treated of 36.2%, operating at an average of 7.5 kWh/m3 treated (Table 6).
The high-resolution analysis during P2, carried out on day 218, revealed that the pilot-scale IASBR did not remove NH4-N at the same efficiency it had been previously (Figure 6b). Reactor internal NH4-N declined slightly during some periods, but then increased during the same or subsequent period (Figure 6b). This indicated that nitrification was suppressed, with moderate consumption of NH4-N by the nitrifying bacteria offset by the simultaneous generation of NH4-N from organic nitrogen to yield a relatively constant concentration of NH4-N. Upon review of the high-resolution data, with DO in excess of what is typically required for nitrification (2–3 mg/L) during aeration periods and peaks in excess of 9 mg/L at times, it was clear that sufficient DO was available for nitrification to take place. As the aeration periods had been shortened from P1 to P2, the available growth time for the nitrifying bacteria had reduced. This resulted in a reduction in the aerobic SRT, from 5.1 days in P1 to 4.5 days in P2. Concurrently, ambient temperature was slowly declining at the facility towards the end of P1 and into P2 from ~20 °C to ~10 °C, resulting in a reactor temperature decrease of 7.9 °C. Temperature has a significant impact on the kinetics of nitrifiers [40] and the time needed to retain them for effective nitrification to occur [41]. During P2, the IASBR reactor was operating at temperatures close to 10 °C. It is recommended that an SRT safety factor of between 1.5 and 2.5 is utilised if temperature is this low [41]; during P2 the aerobic SRT was no longer within desirable limits once temperatures had reduced. This was further exacerbated by a (likely related) decline in MLSS concentrations from more than 3000 mg/L (average during P1 was 3033 mg/L), to under 2000 mg/L during P2. This likely diminished the nitrifier biomass in the system, reducing the capacity of the IASBR to remove NH4-N.
Accordingly, in P3, the balance between non-aeration and aeration periods was revised by 15 min to extend the aerobic time, lengthening the aerobic periods to 60 min to allow adequate growth of the autotrophic nitrifying bacteria for effective NH4-N removal, with corresponding reduction in the non-aeration phase to 75 min (Figure 2).

3.2.3. Phase 3

After implementing the changes discussed for P3, the system recovered its removal capacity and was once again operating with average removal efficiencies >95% (Table 3). However, it should be noted that the influent NH4-N concentrations in P3 were the lowest recorded during operation at the site. The increased aeration time in P3 resulted in a 5.5% increase in energy consumption over P2, but still a 32.7% reduction in energy when compared to P1. P3 yielded an average treatment consumption of 7.89 kWh/m3 treated (Table 6).
The high-resolution study carried out on day 300 of P3 showed that the changes made in P2 resulted in the recovery of nitrification activity, and the resumption of effective NH4-N removal, with effluent concentrations of NH4-N and PO4-P both <0.1 mg/L (Figure 7a). These values were considerably below what the licence permits (at 0.5 mg N/L and 0.8 mg P/L respectively).
The effluent concentrations during Phase 3 were lower than those measured in other phases and average NH4-N removal efficiencies in Phase 3 were 95.7%, like those measured during Phase 1 which averaged 96.0% NH4-N removal. The main reason for this is that the influent loading concentrations were lower during Phase 3 compared to the other phases (as can be seen on Figure 3). During P3, the internal DO of the reactor was unnecessarily high, reaching near saturation (>9 mg/L) at a point during the P3 high-resolution study. In order to improve process efficiency, the aeration regime was amended for P4 to cycle the aeration on for 5 min and off for 5 min. All other operational parameters from P3 were retained from P4.

3.2.4. Phase 4

The amended aeration regime in P4 optimised DO concentrations (average reduction of 4.7 mg/L during aeration periods with concentrations still in excess of 2 mg/L) to ensure high ammonium removal while reducing excess aeration, with complete nitrification occurring at DO concentrations above 1.0–1.5 mg/L [21]. The aeration energy use was further reduced when compared to P3, with a total reduction of 15.3% in energy consumption observed, yielding a treatment efficiency of 6.68 kWh/m3 treated (Table 6). This was equivalent to a reduction in energy use of 43.0% when compared to P1. Reduced DO in the aeration period also allowed for anoxic conditions to be achieved more readily after the aeration ceased.
P4 exhibited high removal rates and low effluent nutrient concentrations (Figure 3, Figure 4 and Figure 5). This demonstrated that the change in the aeration procedure implemented to reduce the aeration cost of the system did not have an adverse impact on performance of the system. Towards the end of P4, however, a significant decline in removal efficiencies was observed (Figure 3), which occurred in parallel to an increase in the influent NH4-N concentration. During P1, when comparable concentrations were being treated in the reactor, the system was operating on a 12 h cycle. However, during P4, the system was running on an 8 h cycle with decreased overall aeration time, which occasionally led to insufficient treatment. Up-to-date loading data are critical to make informed changes to operation to maintain treatment quality whilst reducing energy consumption.
The various phases and treatment performance highlighted the importance of changing the reactor operation to suit the seasonal load, and this is essential to both maintain high treatment performance and reduce energy consumption. With the large variation in loading seasonally in the dairy industry [3], longer treatment phases could be utilised throughout the high loading season and reduced aeration time when the load is low to reduce energy consumption.

3.2.5. Modelled Operation

To further assess the efficiency improvements that could be achieved, while minimising process change (and thus avoiding the need for further investment), numerical modelling was conducted to analyse the energy consumption of the IASBR reactor and assess the impact that changes would have on energy consumption. During reactor operation, the mixing and aeration devices were both active during the aeration phases, the mixer was known to be a high energy consumer with a rated power of 0.28 kW, and it consumed a large portion of the overall energy of the IASBR system. By switching operation to only utilise the aeration system for mixing during aeration periods, an energy saving of 20–35% would be achievable depending on the cycle time. The approach of 5 min on and 5 min off for the aerator, implemented in P4, successfully reduced energy consumption, but the DO was still recorded to be higher than what is needed to facilitate aerobic treatment. Coupling the system of alternating operation of the aerator and mixer, along with adopting a system of having the aeration blower on for 5 min and off for 10 min, would yield savings in the region of 40–45% over the operation that was trialled at the site. This would yield a treatment efficiency of 3.80 kWh/m3 treated (Table 6), a saving of 43.1% over P4.
The modelled scenarios did not make any changes to the manner in which the reactor operated, maintaining the same parameters and operational conditions whilst optimising motor run times and reducing energy consumption. As alluded to previously, wire power of blowers and mixers in the system at this scale is not representative of what would be expected for a larger scale system in terms of energy efficiency. The actual kWh usage as presented in this paper should not be adopted as values to be expected in practice for both small and large commercial scale IASBRs. Nonetheless, the values presented can be interpreted for indication in efficiency improvements that are achievable when one progresses from a conventional SBR or optimises cycles through a commercial scale IASBR.

3.3. Operational Savings

As the IASBR technology has the capacity to biologically remove phosphorus, the requirement for chemical usage is reduced. For example, reducing chemical usage for P removal from the treatment by doing so biologically makes this solution also very attractive to reduce the need for chemical use.
Due to the small scale of the treatment system, efficiency for pumping (fluid conveyance), mixing and aeration will be limited when compared to a full-scale treatment system. This is largely due to economies of scale and efficiency improvements of larger motors, and the savings observed will be indicative of the potential of the technology and optimisation of operation that can be achieved.

4. Conclusions

A large-scale pilot study was successful in demonstrating the application of the IASBR technology within the dairy sector. The technology exhibited high capacity for nutrient removal during its operation; however, varying strength wastewater influent presented a particular challenge when optimising the system, as an increasing contaminant load caused a decline in effluent quality that would have led to licence non-compliance in a real-world scenario. The availability of real-time nutrient loading data can enable optimisation of treatment processes at regular intervals (almost real-time to daily for example). For example, as evidenced in this study, for facilities with seasonal changes in loading aeration, control and cycle times in an IASBR can be matched to influent load to both reduce operating costs, reduce carbon emissions due to energy and ensure discharge regulations are met. Dynamic monitoring of internal variables and feedforward control to allow the system to adapt to incoming wastewater composition would enhance the efficiency and robustness of a technology like this and future research to evaluate an adaptive system which would maximise treatment performance, efficiency and ensure good effluent quality should be undertaken. The study showed that there is scope for further optimisation of the IASBR technology, with a reduction in energy consumption of 66.4% from P1 observed by a modelled scenario. Changes in the cycle configuration and duration seasonally would offer both energy-efficient and robust treatment. As limits on emissions to water courses increase and with a greater emphasis on operational efficiencies in terms of cost, energy and resource usage, for wastewater treatment plants, technologies such as the IASBR will come to the fore. The use of sustainable technologies in all aspects of life will be essential to ensure the footprint of humanity is limited. Wastes produced during the production of key food items, such as dairy, with high levels of contaminates for our water sources are treated as effectively as possible to preserve our world for future generations.

Author Contributions

Conceptualization, P.L. and X.Z.; methodology, P.L., E.C., W.F. and X.Z.; validation, P.L., W.F. and X.Z.; formal analysis, P.L., E.C., W.F., A.S. and X.Z.; investigation, P.L., E.C., W.F., A.S. and X.Z.; data curation, P.L.; writing—original draft preparation, P.L., W.F. and A.S.; writing—review and editing, E.C. and X.Z.; supervision, E.C., W.F. and X.Z.; project administration, W.F. and X.Z.; funding acquisition, E.C. and X.Z. All authors have read and agreed to the published version of the manuscript.

Funding

The authors would like to acknowledge the funding provided by the Department of Agriculture, Food and the Marine for the DairyWater project (Ref.: 13-F-507) and Energy Systems Integration Partnership Programme (ESIPP) project with the financial support of Science Foundation Ireland under the SFI Strategic Partnership Programme (Grant Number SFI/15/SPP/E3125).

Data Availability Statement

Publicly available testing data available in this publication. The data presented in this study are available on request from the corresponding author.

Acknowledgments

The research team would like to thank the members of the Irish dairy sector for their cooperation and contributions throughout the research project.

Conflicts of Interest

The authors declare no conflict of interest. The funders had no role in the design of the study; in the collection, analyses, or interpretation of data; in the writing of the manuscript, or in the decision to publish the results.

References

  1. Milk Statistics: Intake of Cows Milk by Creameries and Pasteurisers; Central Statics Office (CSO): Cork, Ireland, 2021; Available online: https://www.cso.ie/ (accessed on 15 July 2021).
  2. Yan, M.-J.; Holden, N.M. Water use efficiency of Irish dairy processing. J. Dairy Sci. 2019, 102, 9525–9535. [Google Scholar] [CrossRef]
  3. Slavov, A.K. Dairy Wastewaters—General Characteristics and Treatment Possibilities—A Review. Food Technol. Biotechnol. 2017, 55, 14–28. [Google Scholar] [CrossRef] [PubMed]
  4. Lateef, A.; Chaudhry, M.N.; Ilyas, S. Biological treatment of dairy wastewater using activated sludge. Sci. J. Sci. Soc. Thail. 2013, 39, 179–185. [Google Scholar] [CrossRef] [Green Version]
  5. Zhan, X.; Hu, Z.; Wu, G. Greenhouse Gas Emission and Mitigation in Municipal Wastewater Treatment Plants, 1st ed.; IWA Publishing: London, UK, 2018; p. 160. [Google Scholar] [CrossRef]
  6. Kushwaha, J.P.; Srivastava, V.C.; Mall, I.D. An Overview of Various Technologies for the Treatment of Dairy Wastewaters. Crit. Rev. Food Sci. Nutr. 2011, 51, 442–452. [Google Scholar] [CrossRef] [PubMed]
  7. Britz, T.J.; Schalkwyk, C. Treatment of Dairy Processing Wastewaters; CRC Press: Boca Raton, FL, USA, 2004; pp. 1–28. [Google Scholar] [CrossRef]
  8. Irish Environmental Protection Agency. Draft BAT Guidance Note on Best Available Techniques for the Slaughtering Sector; Irish Environmental Protection Agency: Wexford, Ireland, 2006.
  9. Irish Environmental Protection Agency. BAT Guidance Note on Best Available Techniques for the Dairy Processing Sector; Irish Environmental Protection Agency: Wexford, Ireland, 2008.
  10. Zhang, Y.; Li, M.; Dong, J.; Yang, H.; Van Zwieten, L.; Lu, H.; Alshameri, A.; Zhan, Z.; Chen, X.; Jiang, X.; et al. A Critical Review of Methods for Analyzing Freshwater Eutrophication. Water 2021, 13, 225. [Google Scholar] [CrossRef]
  11. Yang, X.-E.; Wu, X.; Hao, H.-L.; He, Z.-L. Mechanisms and assessment of water eutrophication. J. Zhejiang Univ. Sci. B 2008, 9, 197–209. [Google Scholar] [CrossRef] [PubMed]
  12. Yapıcıoğlu, P.; Yeşilnacar, M.I. Energy cost assessment of a dairy industry wastewater treatment plant. Environ. Monit. Assess. 2020, 192, 536. [Google Scholar] [CrossRef]
  13. Ashekuzzaman, S.M.; Forrestal, P.; Richards, K.; Fenton, O. Dairy industry derived wastewater treatment sludge: Generation, type and characterization of nutrients and metals for agricultural reuse. J. Clean. Prod. 2019, 230, 1266–1275. [Google Scholar] [CrossRef]
  14. Ahn, C.H.; Park, J.K. Critical factors affecting biological phosphorus removal in dairy wastewater treatment plants. KSCE J. Civ. Eng. 2008, 12, 99–107. [Google Scholar] [CrossRef]
  15. Li, J.; Healy, M.G.; Zhan, X.; Norton, D.; Rodgers, M. Effect of Aeration Rate on Nutrient Removal from Slaughterhouse Wastewater in Intermittently Aerated Sequencing Batch Reactors. Water Air Soil Pollut. 2008, 192, 251–261. [Google Scholar] [CrossRef]
  16. Mohamed, A.Y.A.; Welles, L.; Siggins, A.; Healy, M.G.; Brdjanovic, D.; Rada-Ariza, A.M.; Lopez-Vazquez, C.M. Effects of substrate stress and light intensity on enhanced biological phosphorus removal in a photo-activated sludge system. Water Res. 2021, 189, 116606. [Google Scholar] [CrossRef]
  17. Leonard, P.; Tarpey, E.; Finnegan, W.; Zhan, X. Efficient treatment of dairy processing wastewater in a laboratory scale Intermittently Aerated Sequencing Batch Reactor (IASBR). J. Dairy Res. 2018, 85, 379–383. [Google Scholar] [CrossRef] [PubMed]
  18. Tchobanoglous, G.; Burton, F.L.; Stensel, H.D. Wastewater Engineering: Treatment and Reuse, 4th ed.; Metcalf & Eddy: New York, NY, USA, 2003. [Google Scholar]
  19. Song, X.; Liu, R.; Chen, L.; Dong, B.; Kawagishi, T. Advantages of intermittently aerated SBR over conventional SBR on nitrogen removal for the treatment of digested piggery wastewater. Front. Environ. Sci. Eng. 2017, 11, 13. [Google Scholar] [CrossRef]
  20. Pan, M.; Chen, T.; Hu, Z.; Zhan, X. Assessment of nitrogen and phosphorus removal in an intermittently aerated sequencing batch reactor (IASBR) and a sequencing batch reactor (SBR). Water Sci. Technol. 2013, 68, 400–405. [Google Scholar] [CrossRef]
  21. Aslan, S.; Miller, L.; Dahab, M. Ammonium oxidation via nitrite accumulation under limited oxygen concentration in sequencing batch reactors. Bioresour. Technol. 2009, 100, 659–664. [Google Scholar] [CrossRef]
  22. Yan, L.; Liu, S.; Liu, Q.; Zhang, M.; Liu, Y.; Wen, Y.; Chen, Z.; Zhang, Y.; Yang, Q. Improved performance of simultaneous nitrification and denitrification via nitrite in an oxygen-limited SBR by alternating the DO. Bioresour. Technol. 2019, 275, 153–162. [Google Scholar] [CrossRef]
  23. Peng, Y.; Zhu, G. Biological nitrogen removal with nitrification and denitrification via nitrite pathway. Appl. Microbiol. Biotechnol. 2006, 73, 15–26. [Google Scholar] [CrossRef]
  24. Simon-Várhelyi, M.; Tomoiagă, C.; Brehar, M.A.; Cristea, V.M. Dairy wastewater processing and automatic control for waste recovery at the municipal wastewater treatment plant based on modelling investigations. J. Environ. Manag. 2021, 287, 112316. [Google Scholar] [CrossRef] [PubMed]
  25. Gao, X.; Zhang, T.; Wang, B.; Xu, Z.; Zhang, L.; Peng, Y. Advanced nitrogen removal of low C/N ratio sewage in an anaerobic/aerobic/anoxic process through enhanced post-endogenous denitrification. Chemosphere 2020, 252, 126624. [Google Scholar] [CrossRef]
  26. Garcia-Ochoa, F.; Gomez, E. Bioreactor scale-up and oxygen transfer rate in microbial processes: An overview. Biotechnol. Adv. 2009, 27, 153–176. [Google Scholar] [CrossRef] [PubMed]
  27. United States Environmental Protection Agency. Biological Nutrient Removal Processes and Costs; U.S. EPA: Washington, DC, USA, 2007.
  28. Khalaf, A.H.; Ibrahim, W.A.; Fayed, M.; Eloffy, M.G. Comparison between the performance of activated sludge and sequence batch reactor systems for dairy wastewater treatment under different operating conditions. Alex. Eng. J. 2021, 60, 1433–1445. [Google Scholar] [CrossRef]
  29. Ahmad, T.; Aadil, R.M.; Ahmed, H.; ur Rahman, U.; Soares, B.C.V.; Souza, S.L.Q.; Pimentel, T.C.; Scudino, H.; Guimarães, J.T.; Esmerino, E.A.; et al. Treatment and utilization of dairy industrial waste: A review. Trends Food Sci. Technol. 2019, 88, 361–372. [Google Scholar] [CrossRef]
  30. Sinha, S.; Srivastava, A.; Mehrotra, T.; Singh, R.; Jindal, T. A Review on the Dairy Industry Waste Water Characteristics, Its Impact on Environment and Treatment Possibilities. In Emerging Issues in Ecology and Environmental Science, 1st ed.; Springer: Cham, Germany, 2019; pp. 73–84. [Google Scholar] [CrossRef]
  31. Zhao, K.; Wu, Y.W.; Young, S.; Chen, X.J. Biological Treatment of Dairy Wastewater: A Mini Review. J. Environ. Inform. Lett. 2020, 4, 22–31. [Google Scholar] [CrossRef]
  32. Goli, A.; Shamiri, A.; Khosroyar, S.; Talaiekhozani, A.; Sanaye, R.; Azizi, K. A Review on Different Aerobic and Anaerobic Treatment Methods in Dairy Industry Wastewater. J. Environ. Treat. Tech. 2019, 7, 113–141. [Google Scholar]
  33. Federation, W.E.; American Public Health Association. Standard Methods for the Examination of Water and Wastewater; American Public Health Association: Washington, DC, USA, 2012; Volume 22. [Google Scholar]
  34. Janczukowicz, W.; Zieliński, M.; Dębowski, M. Biodegradability evaluation of dairy effluents originated in selected sections of dairy production. Bioresour. Technol. 2008, 99, 4199–4205. [Google Scholar] [CrossRef]
  35. Pan, M.; Henry, L.G.; Liu, R.; Huang, X. Nitrogen removal from slaughterhouse wastewater through partial nitrification followed by denitrification in intermittently aerated sequencing batch reactors at 11 °C. Environ. Technol. 2014, 35, 470–477. [Google Scholar] [CrossRef]
  36. Dan, N.H.; Rene, E.R.; Le Luu, T. Removal of Nutrients from Anaerobically Digested Swine Wastewater Using an Intermittent Cycle Extended Aeration System. Front. Microbiol. 2020, 11, 576438. [Google Scholar] [CrossRef] [PubMed]
  37. Bickers, P.O.; Bhamidimarri, R.; Shepherd, J.; Russell, J. Biological phosphorus removal from a phosphorus-rich dairy processing wastewater. Water Sci. Technol. 2003, 48, 43–51. [Google Scholar] [CrossRef] [PubMed]
  38. Liu, M.; Yao, B.; Cong, S.; Ma, T.; Zou, D. Optimization of Wastewater Phosphorus Removal in Winter Temperatures Using an Anaerobic–Critical Aerobic Strategy in a Pilot-Scale Sequencing Batch Reactor. Water 2019, 12, 110. [Google Scholar] [CrossRef] [Green Version]
  39. Energy in Ireland, 2019 Report; Sustainable Energy Authority of Ireland (SEAI): Dublin, Ireland, 2019.
  40. Clifford, E.; Nielsen, M.; Sørensen, K.; Rodgers, M. Nitrogen dynamics and removal in a horizontal flow biofilm reactor for wastewater treatment. Water Res. 2010, 44, 3819–3828. [Google Scholar] [CrossRef] [PubMed]
  41. Sedlack, R. Phosphorus and Nitrogen Removal from Municipal Wastewater Principles and Practice, 2nd ed.; CRC Press: Boca Raton, FL, USA, 1991. [Google Scholar]
Figure 1. (a) Schematic of the IASBR system and (b) the IASBR system installed at the dairy processing facility.
Energies 14 07365 g001
Figure 2. IASBR operational parameters for Phases 1–4.
Energies 14 07365 g002
Figure 3. Ammonium nitrogen masses and removal during the trial.
Energies 14 07365 g003
Figure 4. Orthophosphate concentrations and removal during the trial.
Energies 14 07365 g004
Figure 5. TSS influent and effluent concentrations during the study.
Energies 14 07365 g005
Figure 6. Physicochemical results of (a) Phase Study 1 and (b) Phase Study 2. NAP: Non-aeration periods; AP: aeration periods.
Energies 14 07365 g006
Figure 7. Physicochemical results of (a) Phase Study 3 and (b) Phase Study 4. NAP: Non-aeration periods; AP: aeration periods.
Energies 14 07365 g007
Table 1. IASBR motor component rated power.
Energy UserRated Power (kW)
Mixer (Novair 200)0.28
Blower (EL-S-300W)0.32
Fill Pump (Domo 7vx)0.79
Discharge Pump (Doc 3)0.31
Sludge Pump (Doc 3)0.31
Table 2. IASBR motor run durations.
Phase 1 (min)Phase 2 (min)Phase 3 (min)Phase 4 (min)Optimised Phase 4 Model (min)
Fill57.57.57.57.5
Mixer On1280121512151215675
Blower On480405540270180
Sludge Removal66666
Discharge57.57.57.57.5
Table 3. Performance of the IASBR during operation at the dairy processing facility. Values are average (mean) of all samples collected for each of P1, P2, P3 and P4 (n = 167, 90, 73, & 123, respectively). Standard deviation shown in parentheses.
Contaminant (mg/L)NH4-NNO3-NPO4-PTSS
Phase 1 (750 L/day)
Influent19.68 (11.91)1.03 (1.99)11.26 (12.68)676.46 (239.13)
Effluent0.64 (1.25)1.34 (3.08)0.14 (0.21)14.40 (14.62)
% Reduction a96.0-93.097.7
Phase 2 (1125 L/day)
Influent13.72 (7.86)3.42 (7.64)2.78 (3.08)558.17 (180.96)
Effluent4.50 (4.51)0.46 (0.62)0.46 (1.21)16.71 (16.18)
% Reduction75.2-81.796.7
Phase 3 (1125 L/day)
Influent1.88 (1.17)4.91 (8.04)7.09 (3.06)417.27 (152.74)
Effluent0.07 (0.16)0.63 (1.52)0.08 (0.10)11.47 (14.33)
% Reduction95.7-97.396.8
Phase 4 (1125 L/day)
Influent16.48 (18.70)4.20 (9.61)7.41 (9.58)792.14 (575.01)
Effluent3.05 (5.64)1.09 (1.97)0.27 (0.43)5.23 (4.64)
% Reduction86.4-89.5798.8
Overall Operation
Influent14.76 (14.02)2.99 (7.14)7.86 (9.85)641.49 (370.33)
Effluent1.97 (4.01)0.98 (2.26)0.23 (0.61)11.90 (13.74)
% Reduction89.5-90.6297.6
a Reduction from influent to effluent.
Table 4. Wastewater type, hydraulic loading and nitrogen removal efficiencies comparison to other studies with IASBR systems.
StudyWastewater TypeScalem3 Treated/Day/m3 ReactorHRT (Days)NH4-N Removal *
Leonard et al., 2018. [17]Real DairyLaboratory0.254.092.3%
Li et al., 2008. [15]Real SlaughterhouseLaboratory0.303.394% (TN)
Pan et al., 2014 (Phase 1). [35]Real SlaughterhouseLaboratory0.156.744.2%
Pan et al., 2014 (Phase 2). [35]Real SlaughterhouseLaboratory0.1010.097.6%
This study Phase 1.Real DairyPilot0.254.096.0%
This study: Phases 2–4.Real DairyPilot0.382.785.8%
* Unless otherwise stated.
Table 5. Influent concentrations before treatment and effluent concentrations at end of treatment cycles (from samples taken before discharge), reactor temperature and pH during phase studies 1, 2, 3 and 4.
Phase StudySampleNH4-N
(mg/L)
NO3-N
(mg/L)
NO2-N
(mg/L)
PO4-P
(mg/L)
Reactor Temperature a (°C)Reactor pH a
1Influent4.863.427.144.1621.7 (0.4)8.7 (0.1)
Effluent0.060.580.010.05
2Influent17.040.010.070.8413.8 (0.2)8.4 (0.1)
Effluent15.020.040.060.05
3Influent2.036.093.019.418.2 (0.1)8.4 (0.2)
Effluent0.021.964.610.04
4Influent13.030.360.531.4420.9 (0.3)8.3 (0.1)
Effluent0.151.833.280.96
a Average values with standard deviation shown in parentheses.
Table 6. Energy optimisation results.
OperationkWh/DaykWh/m3 TreatedSpecific Energy Reduction (from P1)Kg CO2 */DayKg CO2 */m3 Treated
P18.7911.72Baseline3.304.40
P28.417.4836.19%3.152.80
P38.887.8932.69%3.332.96
P47.526.6842.97%2.822.51
Energy optimised P4 (Modelled; +/−5.2% **)4.283.8067.55%1.601.43
* Energy consumption during the study was electrical energy only from the Irish national grid which had a carbon intensity of 375 g CO2/kWh during the study period [39]. ** Difference between physical measurements and modelled data for P1–P4.
Publisher’s Note: MDPI stays neutral with regard to jurisdictional claims in published maps and institutional affiliations.

