Abstract
Key performance indicators (KPIs) are quintessentially useful for performance evaluation, but a set of pragmatic KPIs for holistic evaluation of retrofits for commercial buildings is hitherto unavailable. This study was conducted to address this issue. Built upon the findings of a systematic literature review and a focus group meeting in the earlier stages of the study, a questionnaire survey covering 19 KPIs for environmental (embracing energy), economic, health and safety, and users’ perspective evaluations of building retrofits was developed. Data of the survey, collected from facility management (FM) practitioners in Hong Kong, underwent a series of statistical analyses, including Kruskal–Wallis H test, Mann–Whitney U test, and Spearman Rank Correlation. The analysis results revealed the levels of importance of KPIs perceived by different groups of FM practitioners and the rankings of KPIs. Based upon these results, eight KPIs were shortlisted, which are energy savings, payback period, investment cost, actual-to-target ratio of the number of statutory orders removed, actual-to-target ratio of the number of accidents reduced, target indoor air temperature, target indoor air quality (IAQ) class, and target workplane illuminance. These KPIs serve as keystones for further development of an analytic evaluation scheme for commercial building retrofit performance assessment. The methodology of this study can also serve as a reference for similar KPI studies in other research domains.
1. Introduction
Buildings account for 39% of all carbon emissions in the world [1]. In Hong Kong—a city famous for its dense population and buildings—the volume of aged buildings is large and keeps increasing. As retrofitting those existing buildings is a sustainability goal that the international society endeavours to meet, the building industry and the government of Hong Kong have introduced various incentives that motivate building owners or operators to implement retrofits for the premises they own or manage. However, the retrofit rate of existing buildings remains low [2]. The building sector in the city is facing challenges to retrofitting the existing buildings, especially the aged buildings. One of the key challenges is the estimation of the benefits brought by the building retrofits, which relies on scientific evaluation mechanisms to evaluate the building retrofit performance against the economic input [3,4]. In the evaluation process, human decisions or judgements from owners, operators, occupants, etc. are critical elements.
Facility management (FM) practitioners are building professionals who are involved in multiple disciplines of practice to ensure the functionality, comfort, safety, and efficiency of facilities in the built environment. Their knowledge and work experience are gained through intensive interactions with the operations of the existing buildings they manage. Thus, their opinions on the change in the buildings’ conditions and the best option for building upgrades should be valid and reliable. Although a profusion of studies has been undertaken to help building owners and operators make decisions on building retrofits, there is still limited research on establishing a set of key performance indicators (KPIs) for the development of an analytic method to evaluate the holistic performance of commercial building retrofits [5]. To address this research gap, this multi-stage study was initiated. In the initial stages, a systematic literature review was conducted to identify indicators that are applicable to performance evaluation for building retrofits, followed by a focus group meeting with FM experts, from which the experts’ perceived importance of the indicators were solicited, and the practicability of the indicators in real-world commercial buildings was discussed [6]. The outcome of those preceding stages, i.e., selection of 19 essential KPIs among the 52 applicable performance indicators identified from the literature, was adopted to design a questionnaire survey. Distributed to FM practitioners in Hong Kong, the survey intended to solicit opinions from a large sample of industry professionals on their perceived importance of the 19 KPIs. This paper, reporting on the works undertaken for this survey, is structured as follows: Section 2 and Section 3 show the literature review and the data collection method; Section 4 and Section 5 present the statistical analyses and results of the analysed findings; Section 6 discusses the implications of this study; Section 7 concludes the paper.
2. Building Retrofit
2.1. Definitions, Scope, and Challenges
Building retrofit, a form of technical intrusion in the systems or structure of a building after its initial construction and occupation [7], can improve the building’s performance to optimise energy utilisation and enhance users’ occupation experience. In recent years, building retrofit is increasingly referred to as green retrofitting or sustainable retrofitting, which emphasises the environmental benefits of retrofitting work in the built environment. The US Green Building Council (USGBC) defines green retrofitting as ‘… any upgrade of an existing facility to improve energy and environmental performance, decrease usage of water and enhance existing comfort and quality of interior spaces—All achieved in a manner that provides financial incentives to the investor’ [8]. Common building retrofit projects include energy efficiency retrofits (e.g., upgrading of the building envelope) [9], lighting retrofits [9,10], ventilation system retrofits [10], water efficiency retrofits [11], renewable energy installations [9,10], green roof establishment [12], building automation and control system [13], and space utilisation and reconfiguration.
In general, building retrofit has been facing numerous challenges, including but not limited to, optimisation or fulfilment of priorities of stakeholders, time period, capital investment, cost effectiveness, risk analysis, technology availability, government policies, and building energy performance prediction [7]. From a process management perspective, these challenges are influenced by each other in an interactive manner and some of them incur extra costs, which can become liabilities to the building owners or its occupants. In order to support building retrofit decisions, various evaluation methodologies have been developed to provide an estimation of the associated energy consumption and cost, thereby facilitating the building retrofit process design [14]. The manifestation of such challenges varies with the project or building specificities, such as building types (e.g., public building, residential building, and office building), building design (including both system and structural design), building material, and building technologies [15,16].
2.2. Performance Measurement
In the past decade, a considerable number of studies have been conducted in evaluating the performance of building retrofits. Decision making is a prevailing stream of studies in the field of building retrofits. Economic viability is an indicator frequently used for building retrofit performance measurement. Net present value (NPV), internal rate of return (IRR), overall rate of return (ORR), benefit–cost ratio (BCR), discounted payback period (DPP), and simple payback period (SPP) are often used to assess the economic feasibility of a single retrofit measure [15,17,18,19,20]. Surveys on users’ satisfaction or feedback from stakeholders in the post-occupancy phase were also used to measure building retrofit performances [21,22].
On top of that, the KPI approach is regarded to be one of the most popular and valuable tools for measuring the process or outcome of construction projects. KPIs are a collection of indicators that can comprehensively reflect a project’s goals. They help to define the nature, scope, expected quality, and unique characteristics of the projects and can also provide means for measuring the ‘progress towards those goals for further learning and improvement’ [23]. Energy performance and energy saving are two common KPIs for measuring the financial and environmental benefits of building retrofits [24,25,26,27,28]. As sustainability is one of the key project goals, an increasing volume of studies in the literature have examined KPIs for measuring the level of sustainability in construction and building renovation/retrofit projects. Kylili et al. [23] provided a state-of-the-art review on the KPIs identified for measuring the sustainability of the projects in the built environment, in which they categorised the building performance KPIs into eight groups—namely, economic, environmental, social, technical, time, quality, disputes, and project administration. Al Dakheel et al. [29] conducted a review on features of smart buildings (SBs) and identified 10 KPIs for SBs. The KPIs they identified help to quantify the ‘smart features’ of SBs and reflect the ‘smart capability’ of the building. The validity of KPIs affects the overall measurement results; thus, the selection process of KPIs should engage scientific methodologies to ensure their representativeness of the measurement goals [30]. Industry experts’ involvement is regarded as one of the reliable approaches for identifying representative and valid KPIs. This approach usually entails three steps: (1) interviews with experts to define the measurement goals and identify KPIs that fit those goals; (2) a survey to collect a wider scale of data from various groups of experts; (3) statistical analyses to confirm and verify the identified KPIs from the previous steps. Xu et al. [31] followed these three steps to identify KPIs for the sustainability of building energy efficiency retrofit (BEER) in hotel buildings in China. Lai et al. [32] used the same approach to investigate KPIs for measuring the performance of hospital facilities management. This study, likewise, adopted this approach to identify and verify KPIs for the evaluation of commercial building retrofits.
2.3. The Role of FM Practitioners
A building retrofit project usually comprises five major phases: project set up and pre-retrofit survey, performance assessment, identification of retrofit options, site implementation and commission, and validation and verification [15]. Completion of a retrofitting project requires a team of building experts to assess the existing building conditions, design the retrofitting strategies, monitor the retrofitting process, and review the project outcome [33]. In this process, FM practitioners deal with daily building management activities at the operational level and are involved in developing cost-effective plans to support built asset management at the strategic level. For example, FM managers are engaged in a company’s corporate social responsibility strategy development through evaluating the facility performance of the property portfolio. They are responsible for providing advice to top management on green certification decisions and participate in obtaining green certification. Building retrofit is an inevitable activity that leads to green certification for existing buildings.
Responsible for managing both buildings and the relevant stakeholders (e.g., owners, occupants, tenants), FM practitioners have to communicate with retrofitting decision makers and facility users, modify facilities, upgrade systems for energy use, and develop mechanisms for measuring energy consumption, monitoring energy use process, and assessing energy performance [34,35]. Thus, FM practitioners play critical roles in supporting decision making on building retrofits, and their opinions on KPIs for building retrofit performance are useful.
3. Data Collection
In the preliminary stages of this study, 52 performance indicators for building retrofit performance assessment were identified through the Preferred Reporting Items for Systematic Reviews and Meta-Analyses (PRISMA) process and these indicators were grouped into four categories (‘economic’, ‘environmental’, ‘health and safety’, and ‘users’ perspective’) with their detailed meanings provided [6]. With these indicators identified and in order to establish a method that can evaluate the holistic performance of commercial building retrofits, a focus group study was then conducted. Grounded upon the deliberations and opinions of the focus group study, 19 KPIs were selected as useful for building retrofit performance assessment (Table 1). Since using 19 KPIs entails a considerable effort to collect the associated empirical FM data, and the process for calculating this large number of KPIs is time consuming [36,37,38], a questionnaire survey was designed to shortlist indicators that are useful for reflecting the performance of commercial building retrofits.

Table 1.
Performance indicators selected from the preliminary stages of the study.
The questionnaire consists of three parts. Part 1 collects respondents’ personal information, including gender, years of work experience, job level, nature of their organisation, type of employer, and their academic qualification. These pieces of information served to reflect the backgrounds of the respondents, allowing inter-group comparisons to be made when analysing the survey findings. Part 2 solicits the importance ratings of the 19 KPIs on a five-point scale (1: very low; 2: low; 3: moderate; 4: high; and 5: very high). Part 3 asks the participants to suggest any other KPIs they consider important and any other comments they have based on their experience.
Pilot tests, with the participation of five FM experts, were conducted on the questionnaire. These tests helped to detect and eliminate any potential error or misunderstanding of the questions in the survey. Feedbacks from the tests were taken to finalise the questionnaire before its official distribution. The industry-wide online survey was officially launched in two ways: snowballing and mass email. Using a snowballing approach, FM professionals who participated in the preceding focus group study [6] and pilot tests were invited to complete the survey and also distribute it to their colleagues. As regards the second approach, mass email, a hyperlink to the survey was emailed to the members of the Building Services Operation and Maintenance Executives Society (BSOMES)—the leading professional body in Hong Kong specialised in technical FM works embracing building retrofits. In order to increase the level of representativeness of the samples, FM practitioners with different organisational natures (government, non-governmental organisation (NGO), and private company) and types (e.g., owner/developer, management company, and contractor) working at different levels (strategic (e.g., director, chief engineer), tactical (e.g., manager, engineer)) were invited to participate in the survey. The demographic details of the survey respondents are shown in Table 2.
Table 2.
Demographic details of respondents.
A total of 164 responses to the survey were received. To ensure data quality, the responses were screened manually, and those with incomplete information provided were discarded. This resulted in having 124 responses qualified for the subsequent data analysis. Among these responses, 83.9% were from males. The majority of the respondents were highly experienced; most were employed by private companies. The proportions of those working for owners/developers and management companies were comparable, while those working for contractors amounted to 14.5%. When comparing the strategic and tactical groups, the latter prevails. More than three-quarters of the participants have worked on office buildings; nearly half have worked on retail premises. The respondents were well educated, with most of them possessing a degree at the bachelor level or above.
4. Statistical Analysis
The data collected were analysed using the SPSS version 26.0 software. To investigate any differences between different groups of the responses, the respondents were stratified into six groups. Each of these groups was further categorised into subgroups (‘n’ denotes the number of samples), as shown below:
- G1: Gender: male (G1a; n = 104) and female (G1b; n = 20);
- G2: FM/operation and maintenance (O&M) work experience: 5 years (G2a; n = 22), 5 years to <20 years (G2b; n = 21), 20 to <30 years (G2c; n = 39), and 30 years (G2d; n = 42);
- G3: Nature of organisation that the respondents worked for: government (G3a; n = 11), public (G3b; n = 23) and private (G3c; n = 90);
- G4: Type of employer: owners/developers (G4a; n = 43), management companies (G4b; n = 44), contractors (G4c; n = 18) and others (G4d; n = 19);
- G5: Job level: strategic (G5a; n = 38) and tactical (G5b; n = 86);
- G6: Academic qualification: subdegree (associate degrees/diplomas/certificates), bachelor (G6a; n = 41), and postgraduate (master degrees or doctorate degrees) (G6b; n = 83).
First, group analyses were conducted using Kruskal–Wallis H test (H) and Mann–Whitney U test (U) to analyse whether the respondents perceived the importance levels of the KPIs differently. H test, a non-parametric test that compares more than two independent or unrelated samples [39], was applied to make comparisons between groups G2, G3, and G4. For each of the comparisons, a null hypothesis (Ho) and an alternative hypothesis (Ha) were set (Ho: there is no tendency for ranks of groups of response to rank systematically higher or lower than those of the others; Ha: there is a tendency for ranks of groups of response to rank systematically higher or lower for at least one of the groups). For testing these hypotheses, the Kruskal–Wallis H-test statistic was determined by Equation (1).
where N is the number of values from all combined samples, Ri is the sum of the ranks from a particular sample, and ni is the number of values from the corresponding rank sum. The α value for the H test was set as 0.05. As H test does not identify where and the degree of the differences occurred, the U test, as a type of post hoc test, was used to analyse any significant differences between the sample pairs. Following the Bonferroni procedure which helps to compensate type I error, the adjusted α, αB, was used in the U test to determine any significant difference between samples if H test was found to be significant (e.g., for G2, k = 4) [39]. The adjusted α from the Bonferroni procedure was shown in Equation (2).
where is the adjusted level of risk, is the original level of risk, and k is the number of comparisons.
For the U test, it is a non-parametric test that can be used to compare two unrelated or independent samples [39]. Therefore, it is suitable for use in inter-group comparisons between G1a and G1b, G5a and G5b, and G6a and G6b. The α value for the U test was set as 0.05. For each of the comparisons, a null hypothesis (Ho) and an alternative hypothesis (Ha) were set (Ho: the mean ranks of the groups are the same; Ha: the rank of one group of responses is systematically higher (or lower) than the other). Accordingly, the Mann–Whitney U-test statistic for each of the two samples was determined by Equation (3), and the smaller of the two U statistics was obtained.
where Ui is the test statistic for the sample of interest, ni is the number of values from the sample of interest, n1 is the number of values from the first sample, n2 is the number of values from the second sample, and ΣRi is the sum of the ranks from the sample of interest. The mean and z-score for the Mann–Whitney U test for large samples were found by Equations (4) and (5).
where is the mean, SU is the standard deviation, and z is the z-score for a normal approximation of the data.
Second, Spearman’s rank correlation was applied to examine any significant difference in the KPIs rankings between pairs of the respondent subgroups. Spearman’s rank correlation coefficient (rs) was calculated by Equation (6) [34]:
where n is the number of observations, and Di is the difference between ranks obtained from each pair of responses. For the value of rs, ‘+1’ represents perfect agreement between the rankings; ‘0’ represents no association between the rankings; ‘−1’ represents perfect disagreement between the rankings.
Finally, a mean score was calculated for each of the rated KPIs, based on which the overall ranking of the KPIs was determined to facilitate shortlisting the most essential KPIs.
5. Results
5.1. Perceived Importance Levels of KPIs
Referring to the results of the H and U tests shown in Figure A1, Figure A2, Figure A3, Figure A4, Figure A5, Figure A6, Figure A7, Figure A8, Figure A9, Figure A10, Figure A11 and Figure A12 (see Appendix A), six significant observations are worth noting. First, significant difference (U = 701, p < 0.05) was found between male (mean rank = 59.24) and female (mean rank = 79.45) for KPI-11 (life cycle cost (USD)). It means that the female and male FM practitioners had different perceptions of the importance of life cycle cost for evaluating building retrofit performance. This finding echoes the argument of Rodríguez et al. [40] regarding managerial style: men and women have different managerial styles.
Second, significant difference (H = 10.538, p < 0.05) was found between respondents with different FM/O&M work experience for KPI-2 (normalised energy savings (kWh/m2 year)). The results show that (U = 249, p < 0.0125) respondents with less work experience 5 years; mean rank = 39.18) considered KPI-2 as more important than the experienced practitioners (experience between 20 to 30 years, mean rank = 26.38) did, and similar findings were found between freshmen (≤5 years; mean rank = 41.59) and veterans (30 years; mean rank = 27.74) in ranking KPI-2 (U = 262, p < 0.0125). This may be because the experienced practitioners were aware that after years of building occupation with energy retrofits already undertaken, the room for further energy saving is limited. Yet, no major disagreement was found between the various respondent groups (with different work experiences) on KPI-1 ‘energy savings (%)’. According to Miller and Higgins [41], ‘percentage better and percentage saved’ was mostly referenced in environmental performance evaluation studies [41].
Third, a significant difference (H = 8.726, p < 0.05) was found between freshmen and non-freshman (>5 years) for KPI-13 (ratio of actual to target no. of statutory orders removed (%)). The results (U = 125.5, p < 0.0125) show that respondents with more work experience (mean rank = 27.02) considered KPI-13 as more important than the freshmen (mean rank = 17.20). The possible reason could be the freshmen may have relatively less work experience and may not have come across any retrofit projects with the requirement in statutory orders removal. Therefore, the freshmen were less concerned about this KPI.
The other three significant differences were found between respondents at the tactical level and strategic level for KPI-17 (target IAQ class; U = 1234, p < 0.05); KPI-18 (target workplane illuminance (lux); U = 1159, p < 0.05); KPI 19 (target indoor equivalent continuous weighted sound pressure level (dBA); U = 1239, p < 0.05). Respondents at the tactical level perceived the three KPIs (mean rank of KPI-17 = 67.15; mean rank of KPI-18 = 68.02; and mean rank of KPI-19 = 67.09) as more important than those at the strategic level did (mean rank of KPI-17 = 51.97; mean rank of KPI-18 = 50.00; mean rank of KPI-19 = 52.11). The reason could be that FM practitioners at the tactical level have to handle and resolve complaints from users about IAQ, workplane illuminance, noise, etc. before such problems escalate to the strategic level. Hence, FM practitioners at the tactical level, when compared with the strategic counterpart, are more concerned about the KPIs in the users’ perspective aspect.
5.2. Correlation between Rankings of KPIs
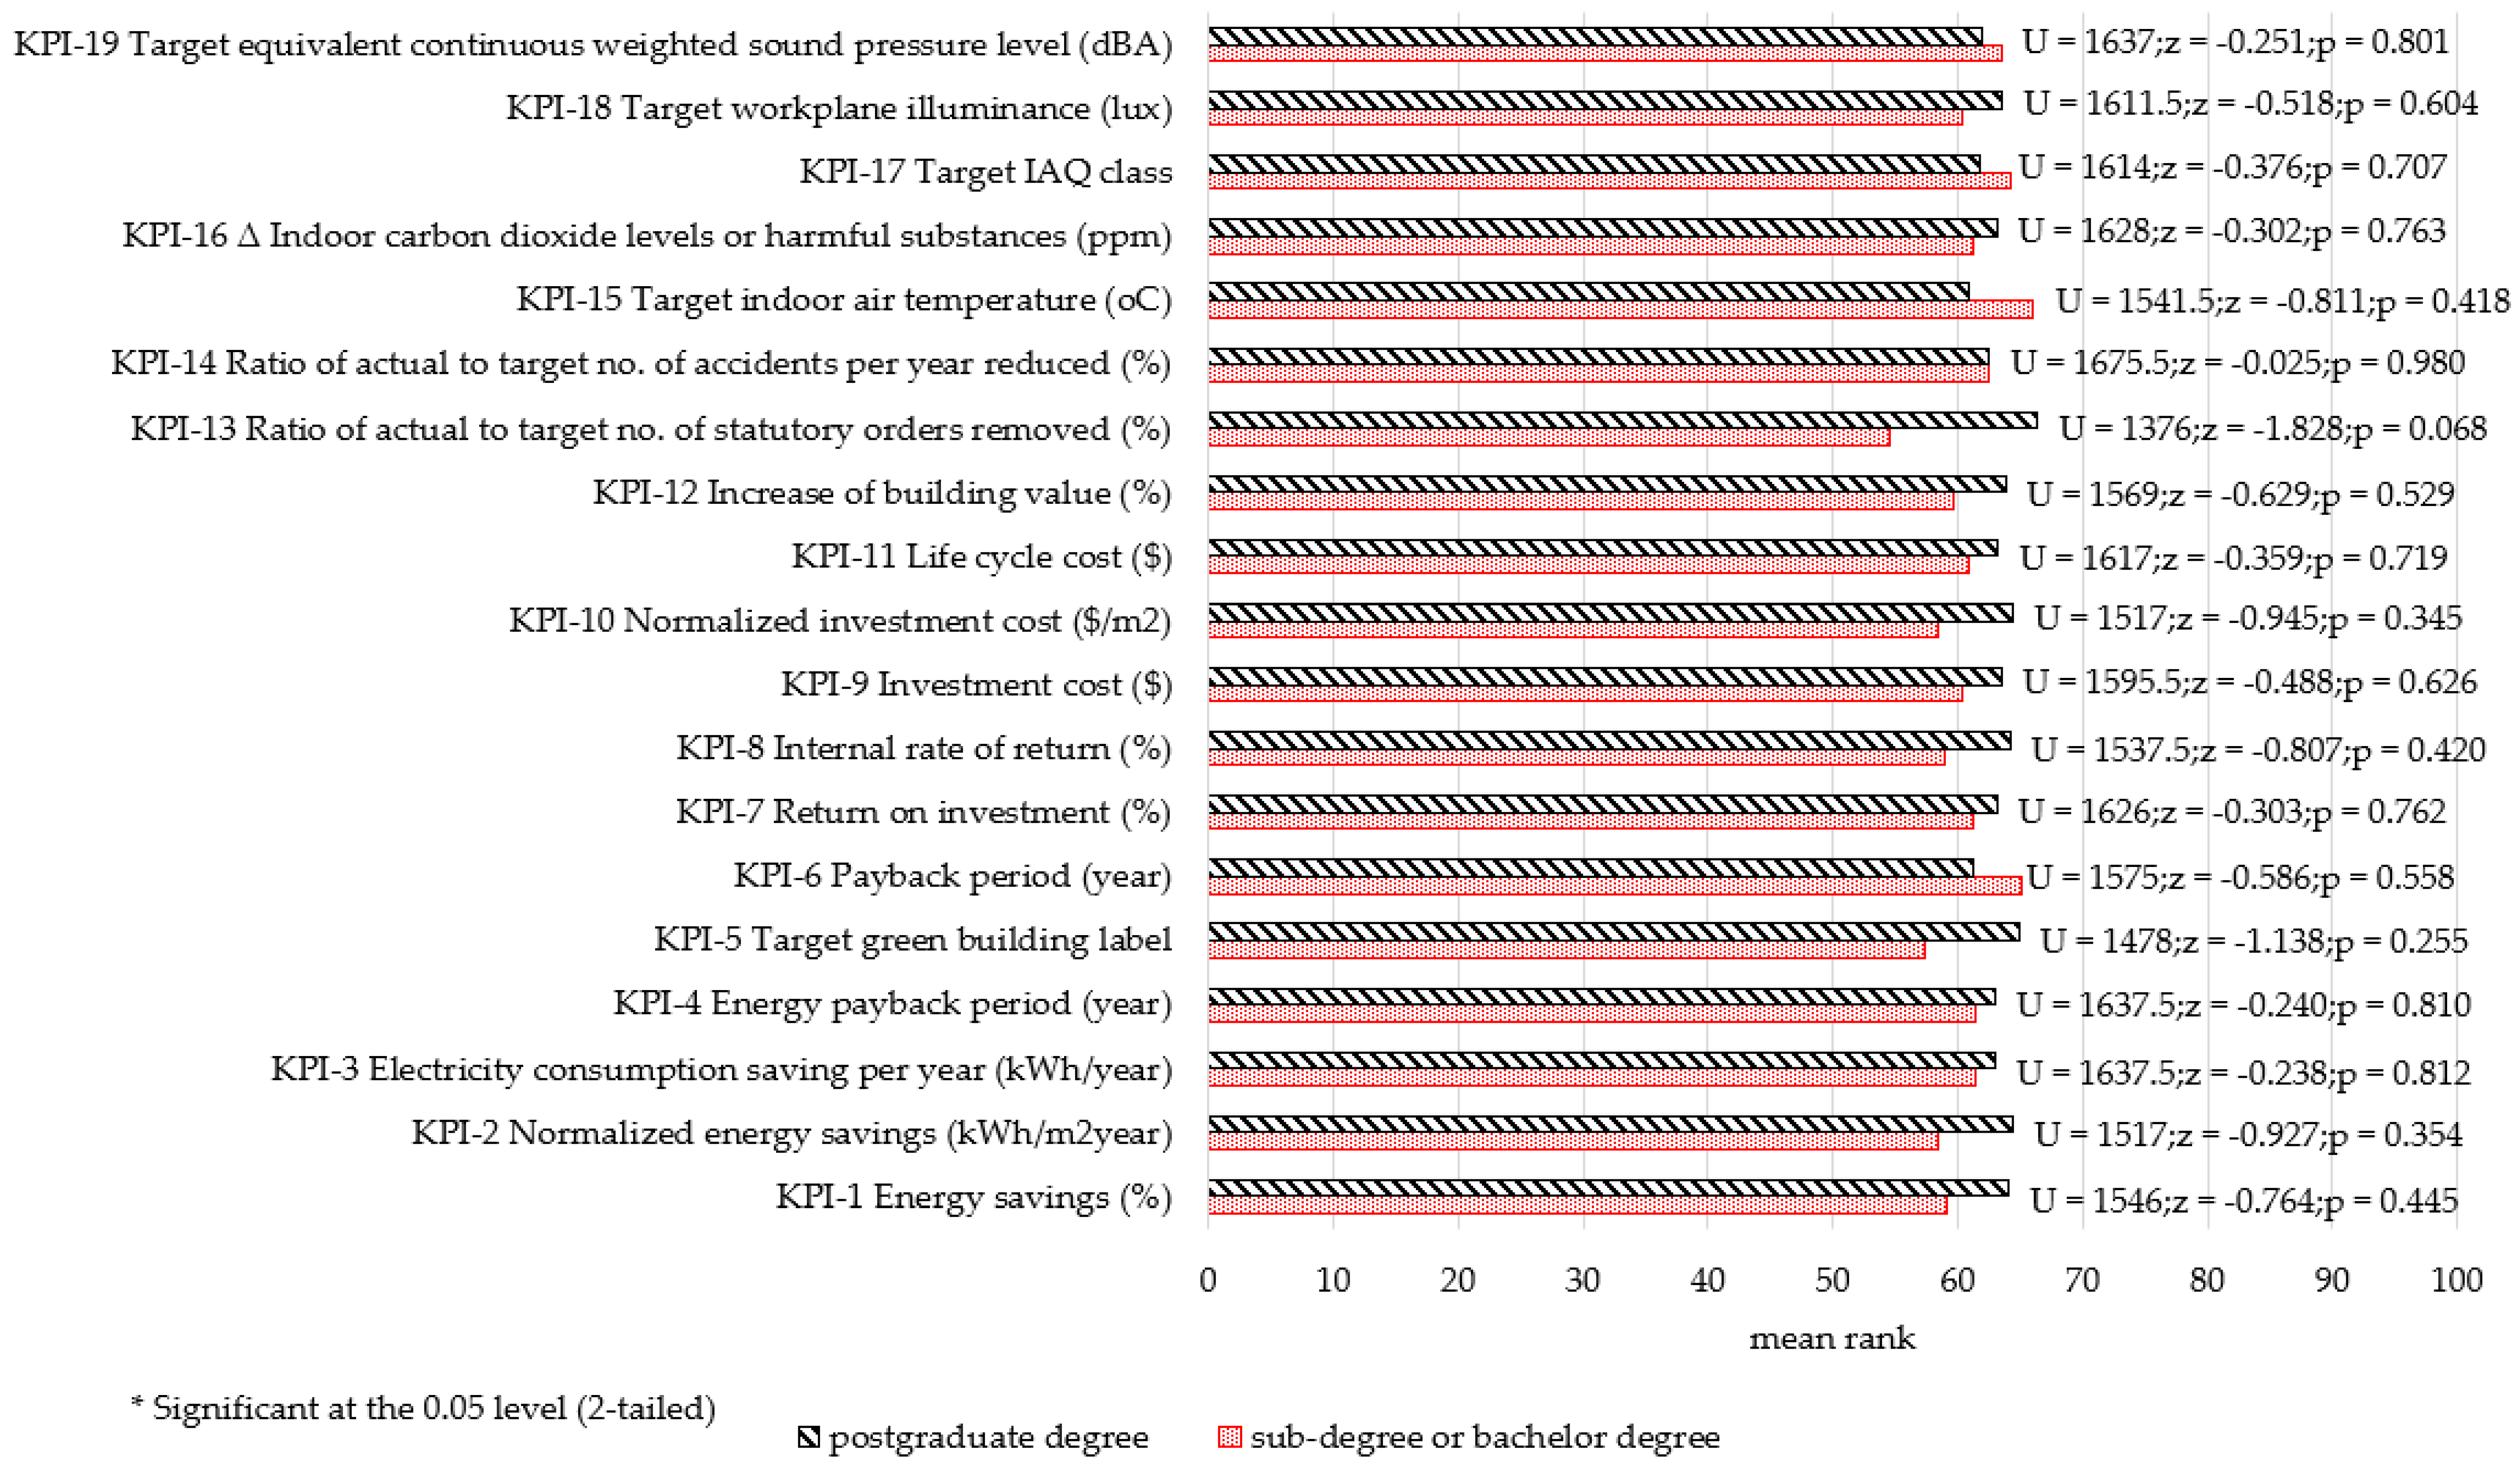
Table 3 displays the values of the Spearman rank correlation coefficients between groups, while the detailed ranking results for different respondent groups are illustrated in Appendix B (Table A1, Table A2 and Table A3). In general, no significant disagreement was found between the rankings of the KPIs pertinent to the various groups. A significant positive correlation (at the 0.01 level) existed in the rankings between some of the respondent groups, including female vs. male; experience (>5 to <20 years) vs. experience (20 to 30 years); experience (>5 to <20 years) vs. experience (>30 years); owner/developer vs. management company; and sub-degree or undergraduate degree vs. postgraduate degree. Significant positive correlations (at the 0.05 level) existed in the rankings between some of the respondent groups, including experience (20 to 30 years) vs. experience (>30 years); owner/developer vs. others; management company vs. contractors; contractors vs. others; strategic level vs. tactical level.
Table 3.
Spearman rank correlations between groups.
5.3. Importance Levels and Ranks of KPIs
Based on all the valid responses, a mean rating was calculated for each of the KPIs, and the calculation results in Table 4 show that the ratings ranged from 3.14 to 3.76.
Table 4.
Mean importance ratings and ranks of KPIs.
To shortlist the most important KPIs for pragmatic use in building retrofit performance evaluation, 3.45 was taken as the cut-off mean rating. This rating, being the mean between 3.14 and 3.76, represents a moderate-to-high importance level. Thus, a total of 13 KPIs, covering all the four performance aspects, were shortlisted (Table 5).
Table 5.
Scenarios of cutoff ratings.
5.4. Finalised KPIs
The extraction of the most representative KPIs was based on two criteria: the rank of the KPI and the grouping category. Among the 13 KPIs, KPI-1, KPI-2, and KPI-3 can be used to indicate the energy-saving performance of a retrofit project. Among these three KPIs, KPI-1 was ranked the highest by the respondents, meaning that the practitioners regarded this KPI to be the most important, while KPI-2 and KPI-3 were only ranked the 12th and the 3rd, respectively. Therefore, KPI-1, which can cover the representations of KPI-2 or KPI-3, was taken for use.
KPI-9, KPI-10, and KPI-11 were related to the cost evaluation of a retrofit project. Thus, they can be grouped under one category. As KPI-9 was ranked the highest among the KPIs in this category, the other two KPIs were removed from the list. Additionally, when compared with KPI-9, KPI-11 (life cycle cost) is less feasible in practice because cost elements such as operating and maintenance costs, in the long run, could hardly be accurately determined at the time when a retrofit project is implemented [42].
KPI-16 and KPI-17 were related to IAQ. Despite their similar rankings (KPI-16: rank = 3 and KPI-17: rank = 5), KPI-17 (target IAQ class) covers 12 parameters for IAQ assessment and hence is more representative than a single parameter (Δ Indoor carbon dioxide levels or harmful substances (ppm) covered by KPI-16. The 12 parameters (with 10 chemical parameters) for IAQ assessment are carbon dioxide (CO2) and other pollutants—namely, carbon monoxide (CO), respirable suspended particulates (PM10), nitrogen dioxide (NO2), formaldehyde (HCHO), total volatile organic compounds (TVOC), mould, radon, and airborne bacteria. The certification of IAQ class (Good Class or Excellent Class), administered by the Environmental Protection Department of the Hong Kong government [43], is also authoritative.
For KPI-15, it was only covered in the assessment of IAQ class for building projects completed before 2019. Thus, it was an independent indicator. Participants ranked KPI-16 (Δ indoor carbon dioxide levels or harmful substances (ppm): rank = 3) over KPI-15 (target indoor air temperature (°C): rank: 6). The reason for this may be that occupants can adjust themselves (e.g., putting on or off their clothes) to suit the indoor thermal comfort condition, while they can hardly notice the concentration of the carbon dioxide or harmful substances, not to mention removing such substances. Participants may, therefore, perceive KPI-16 as more important than KPI-15 for building retrofits.
The rest of the original KPIs, i.e., KPI-6, KPI-13, KPI-14, KPI-15, and KPI-18, are independent indicators without overlaps. Thus, they were retained on the KPIs list. The original 13 KPIs and the final eight KPIs are shown in Table 6.
Table 6.
Original and final KPIs.
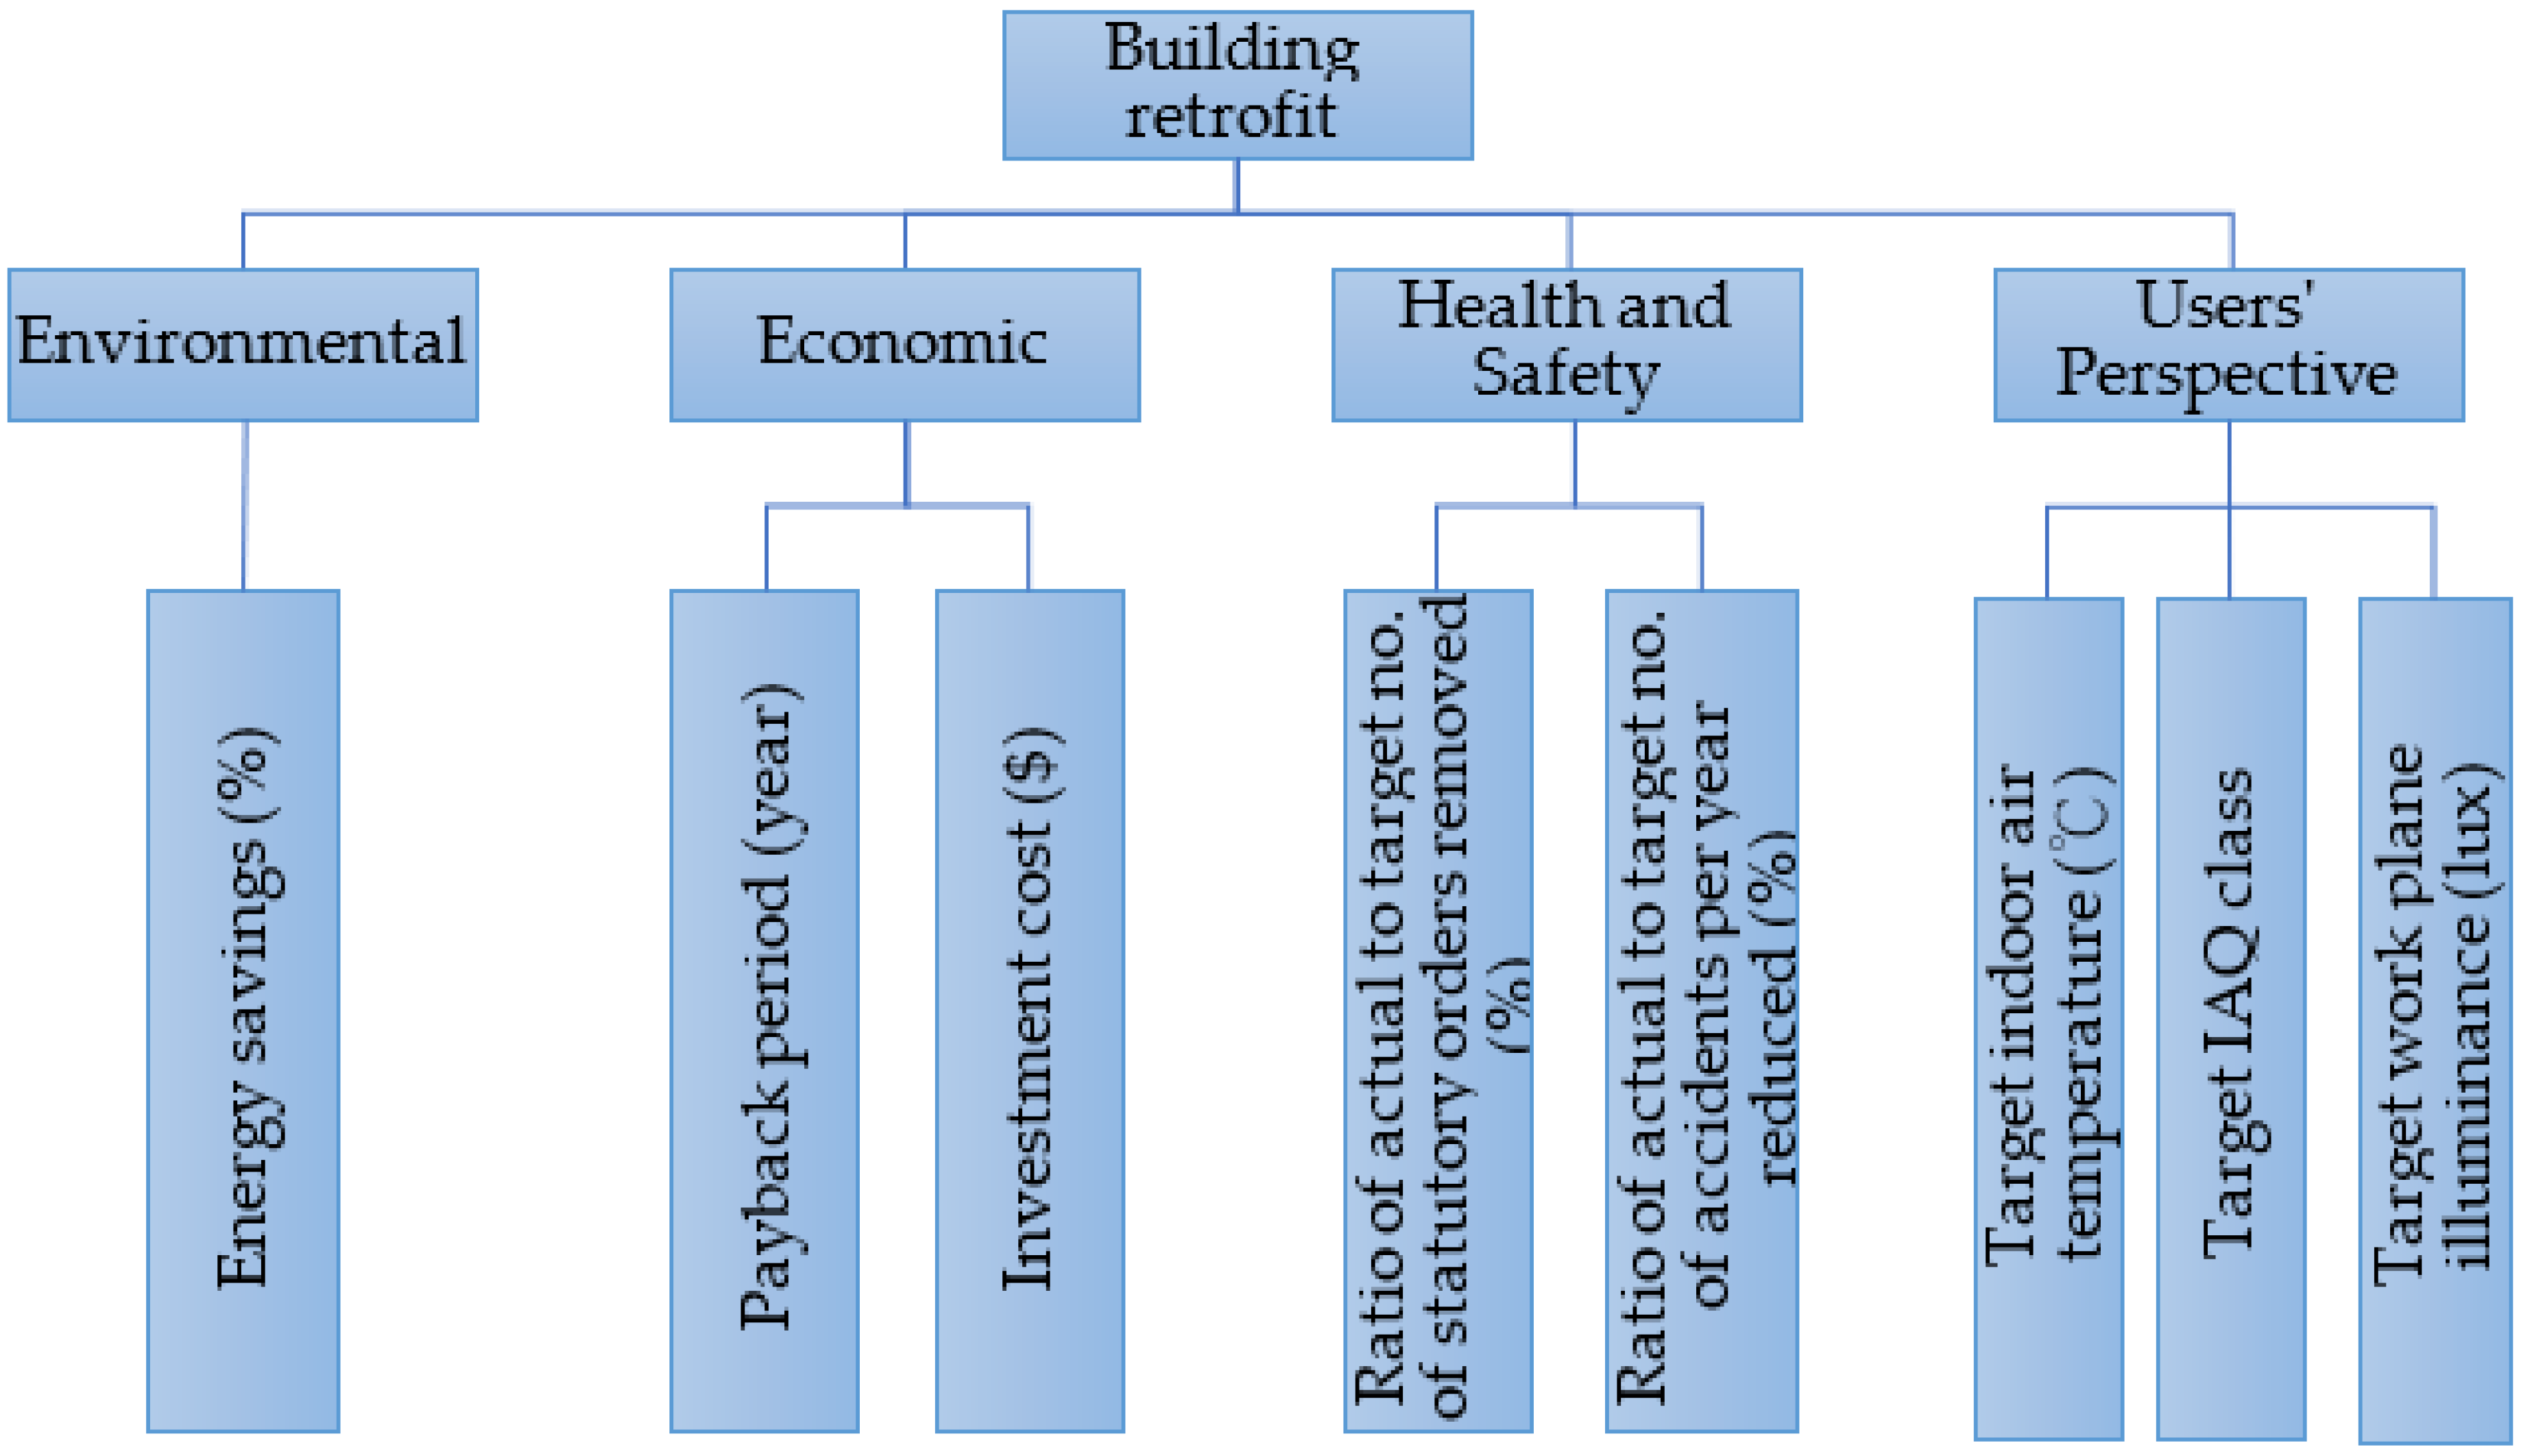
After the foregoing activities (literature review, focus group, and survey), the shortlisted KPIs, belonging to four different aspects (environmental, economic, health and safety, and users’ perspective), were determined. Correspondingly, a hierarchy for the evaluation of building retrofit performance is depicted in Figure 1.

Figure 1.
Building retrofit performance hierarchy.
6. Discussion
Part 3 of the survey, containing an open-ended question, asked the participants to provide any comments in relation to the survey topic. From the responses collected, two types of barriers to building retrofits were identified: (1) high evaluation cost and difficulty of obtaining precise cost estimation; (2) different natures of retrofit projects.
6.1. High Evaluation Cost and Difficulty of Obtaining Precise Cost Estimation
The core information to support building retrofit performance assessment is related to safety and proper working of the built assets, health and comfort, space functionality, and energy. Such information is usually gathered by FM managers who arrange maintenance works or technical inspections, or by users who report complaints and fill in satisfaction questionnaires. The main purpose of this is to help improve performance during the operational phase of a building [44]. However, systematic collection of all necessary data to support building retrofit performance evaluation is costly, as one of the survey respondents stated:
‘…initial cost (for evaluating the building retrofit performance) can be high…’
Although data acquisition can be simple using modern and powerful computerised systems [45,46], data overload can be a problem when a sophisticated data mining algorithm is needed to obtain useful information [47]. Thus, whether collecting the data for performance evaluation is worthwhile is a common decision to make for FM managers [45]. If all the applicable KPIs identified from the literature are used to evaluate the performance of building retrofits, considerable effort and resources will be needed to obtain and process the data [37]. Kumar et al. [45] also considered that having many indicators was impractical, and indicators should be simple to allow performance benchmarking [45].
Moreover, it is difficult to accurately predict the energy consumption of commercial buildings. A survey respondent who worked for a private management company stated:
‘It (building retrofit) cannot give the precise percentage as the change of the weather might cause the energy consumption to increase significantly. For the energy-saving aspect, we do keep at 2% per year depending on electricity side only.’
As submeters are not commonly installed to monitor the energy consumption of different parts of building services systems [6]. The additional cost of installing submeters, for example for a centralised chiller plant being retrofitted, is usually high given the need to modify the relevant part of the existing system [48]. Therefore, measuring the actual energy saving with respect to the retrofitted portion of the centralised system could be difficult.
6.2. Different Natures of Retrofit Projects
It is common to upgrade the existing equipment at the end of the equipment life or when it comes to failure. Traditional retrofits practice focuses on replacing particular equipment such as chillers and lighting, instead of maximising overall building performance [49]. Additionally, the initial physical condition of the substituting equipment is often emphasised. This is consistent with the following opinion collected from the survey:
‘Many retrofit projects initiation was based on the order of equipment or system end of life, no spare part support, change of use/demand, justifiable energy saving whereas functional or environmental enhancement are usually in the lowest priority.’
The following statements from the survey respondents further indicated that the applicability of the KPIs in performance evaluation may vary with the nature and scope of the retrofit projects.
‘The … answers (for KPIs) were generic, in fact, the scores should be depending on the nature of the retrofit project.’
‘Some KPIs may not be commonly used or considered by management, and some may not be applicable when designing the retrofit project, while some may be irrelevant to the reason for carrying out retrofit.’
‘Special attention should be taken in case of the retrofit project carrying out phase by phase as the newly added and the existing system may be connected and worked together at the same time. Final commissioning of the whole system is necessary at the final stage of the project.’
From the managerial perspective, building performance depends on the resources (e.g., financial, technological, and labour) that are available and the quality of service that should be achieved [50]. In any case, facilities must be assessed with an organisation’s goal and mission in place, and the assessment result should inform how well the facilities help the organisation meet its goal and fulfil the mission [51,52].
7. Conclusions
In this study, an industry-wide online survey was conducted to solicit the opinions of FM professionals on the KPIs that are applicable to commercial building retrofit performance evaluation. The results showed that the professionals were generally positive about the importance of the 19 KPIs (with mean ratings being 3 (moderate) or above on a five-point Likert scale). The survey data were analysed through conducting U and H tests, as well as Spearman’s rank correlation; the analysed results revealed the variations in the importance of the KPIs perceived by the different groups of professionals.
To enable an effective performance evaluation of building retrofits, the 19 KPIs were further shortlisted. Aside from rating the importance levels of the KPIs, the survey respondents were also invited to provide any other comments about KPIs for building retrofit performance evaluation. Built upon such comments (qualitative) and the KPIs’ importance levels (quantitative), a final list of eight KPIs was determined. These KPIs are able to critically reflect the performance of building retrofits in the environmental (energy) aspect and also three other aspects (economic, health and safety, and users’ perspective).
Overall, this study contributes to the identification of pragmatic KPIs for commercial building retrofit performance evaluation and serves as a keystone for further development of an analytic evaluation scheme for the assessment of building retrofit performance. Using these KPIs, case studies can be further conducted to examine their applicability in assessing retrofit performance for commercial buildings. To this end, the assessment weighting of each of the KPIs needs to be determined, for example, by an analytic hierarchy process or an analytical network process [53,54], for which the data required can be solicited through interviews with experts working on building retrofits. Furthermore, the methodology of this study can serve as a reference for similar KPI studies in other research domains.
Author Contributions
Conceptualisation, M.Y.H. and J.H.K.L.; methodology, M.Y.H. and J.H.K.L.; validation, M.Y.H., J.H.K.L., H.H. and D.Z.; formal analysis, M.Y.H. and J.H.K.L.; investigation, M.Y.H.; data curation, M.Y.H.; writing—original draft preparation, M.Y.H., J.H.K.L. and H.H.; writing—review and editing, M.Y.H., J.H.K.L., H.H. and D.Z.; visualisation, M.Y.H.; supervision, J.H.K.L.; project administration, M.Y.H. and J.H.K.L. All authors have read and agreed to the published version of the manuscript.
Funding
This research received no external funding.
Institutional Review Board Statement
Not applicable.
Informed Consent Statement
Not applicable.
Acknowledgments
The work reported above is supported by the Department of Building Environment and Energy Engineering of The Hong Kong Polytechnic University.
Conflicts of Interest
The authors declare no conflict of interest.
Appendix A
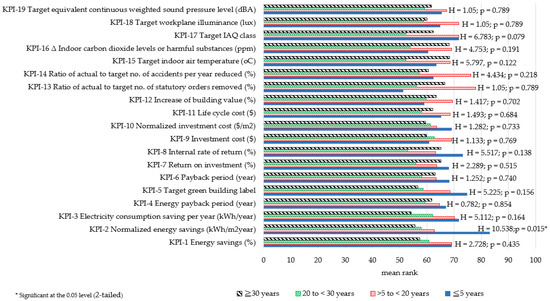
Figure A1.
Kruskal–Wallis H-test results of G2 (work experience).
Figure A1.
Kruskal–Wallis H-test results of G2 (work experience).
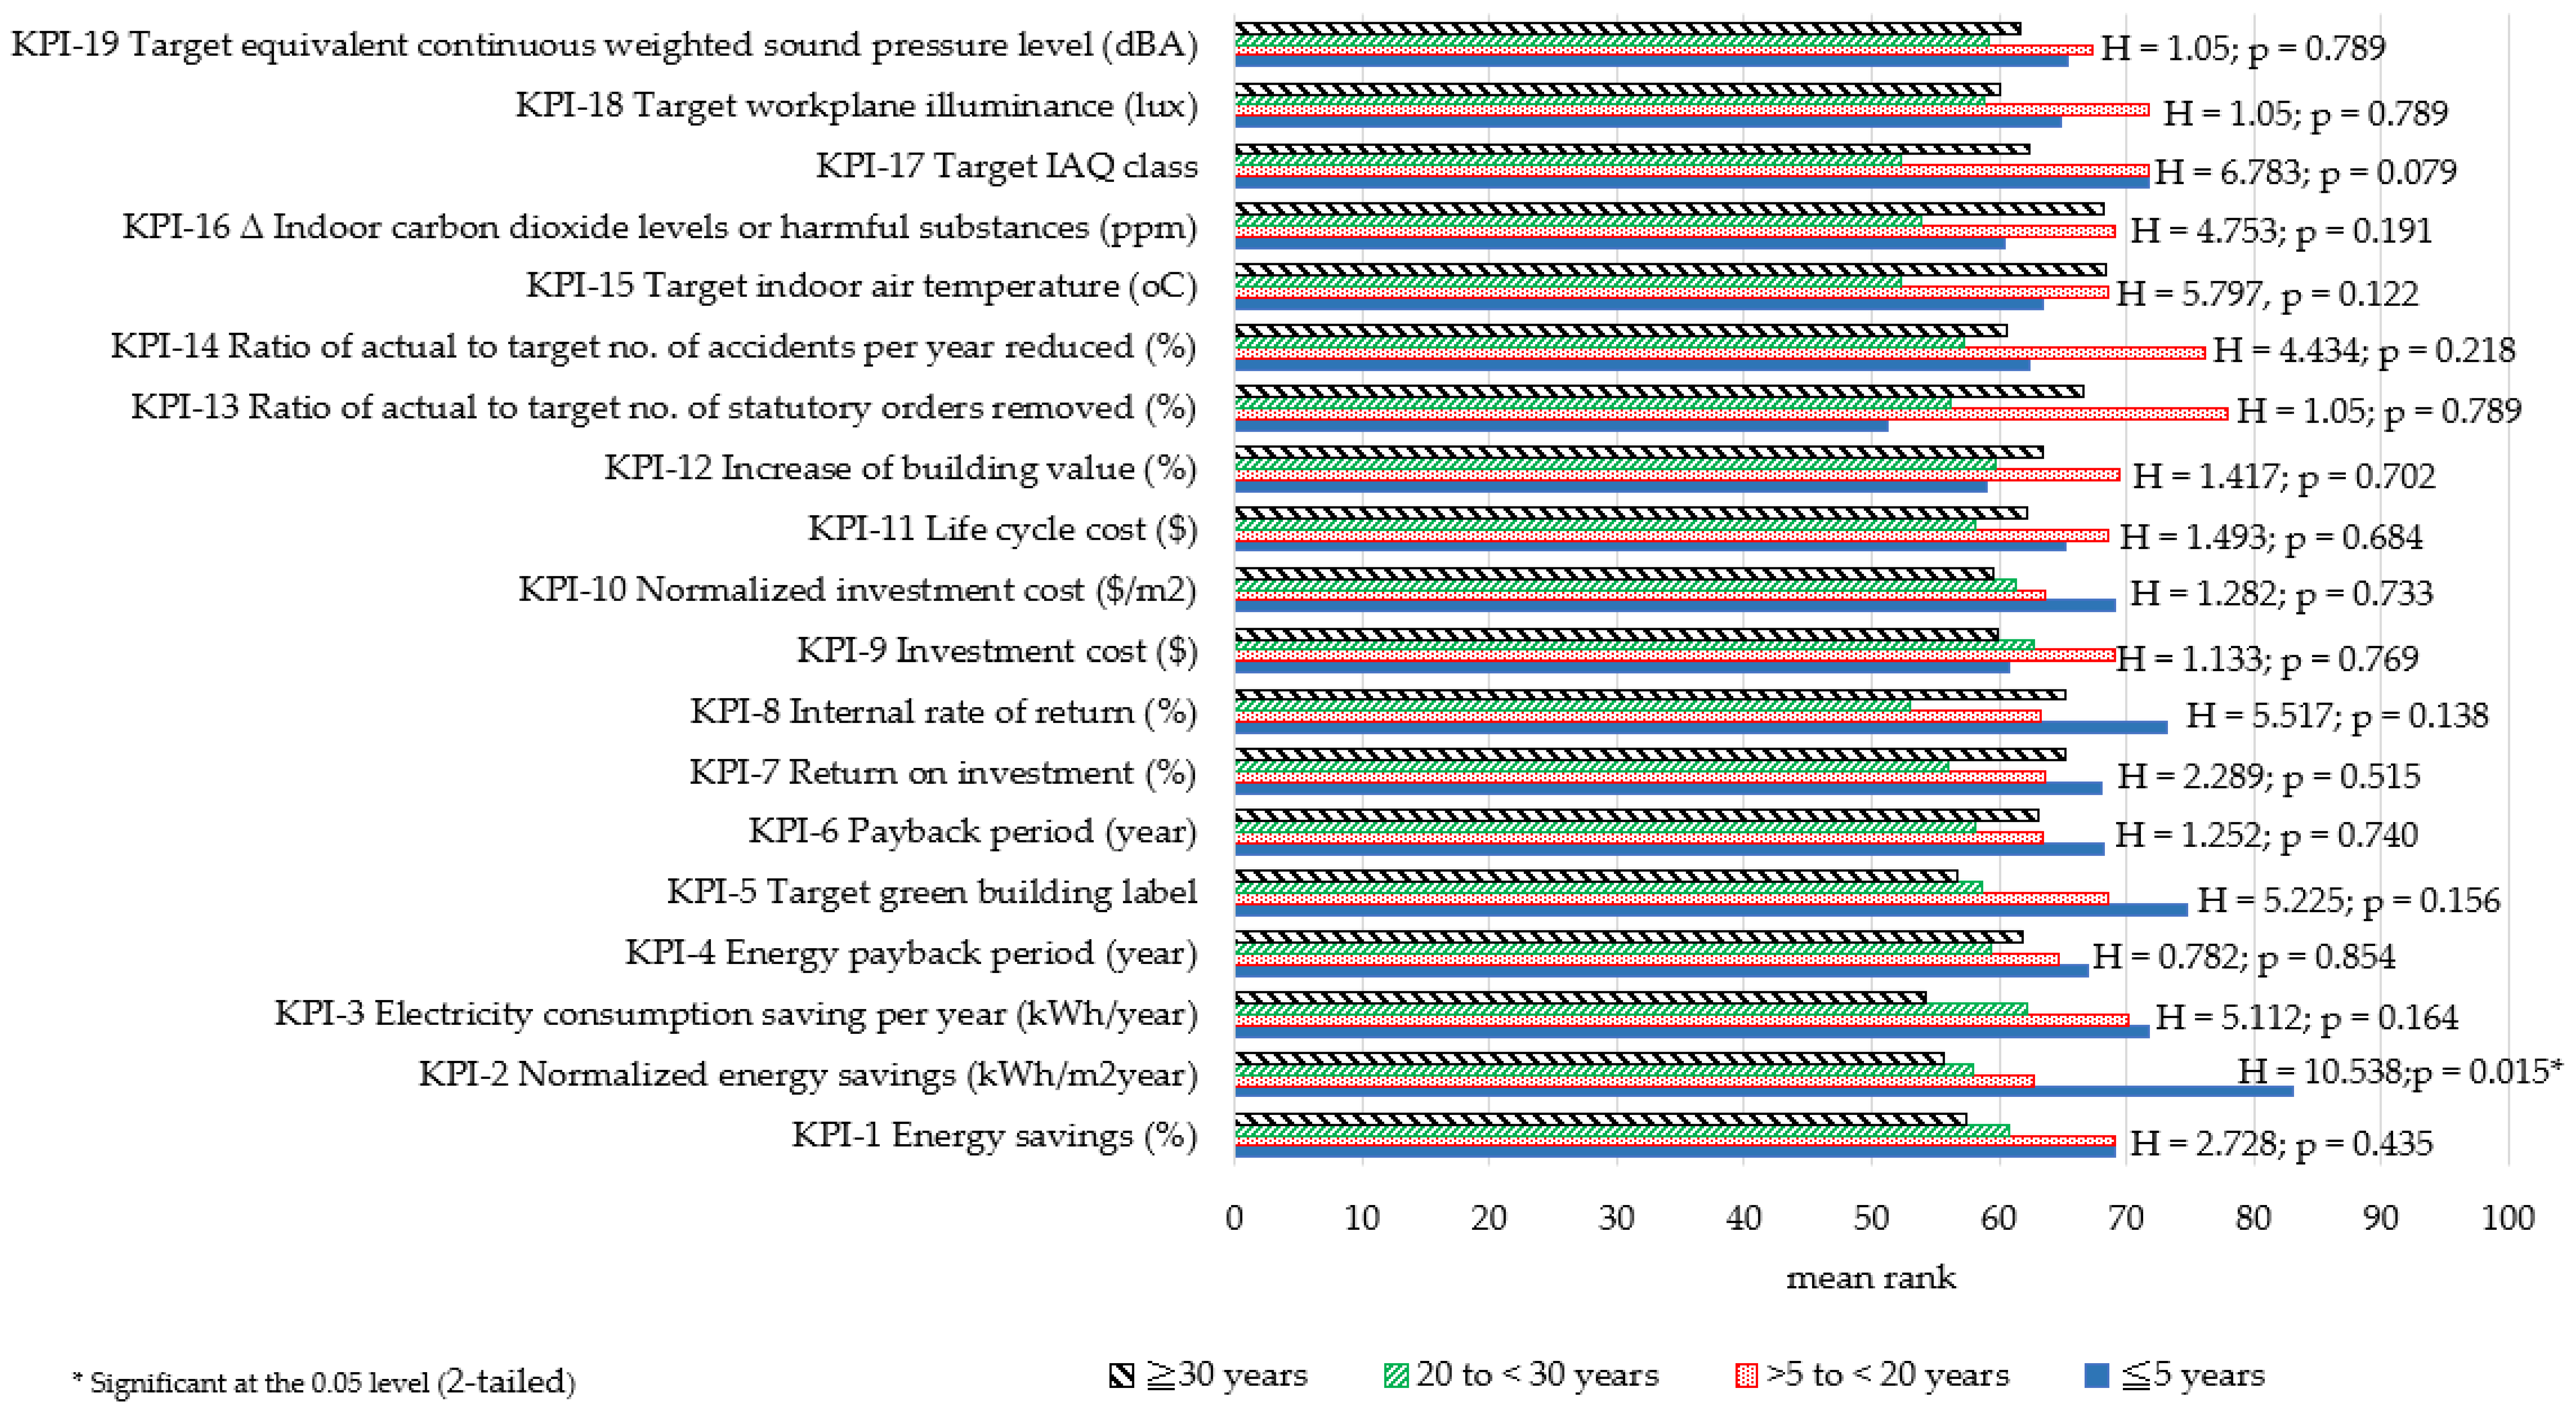
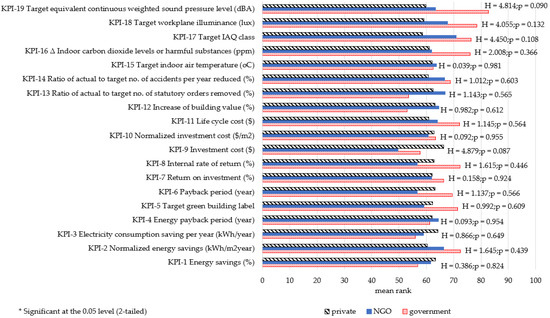
Figure A2.
Kruskal–Wallis H-test results of G3 (nature of organisation).
Figure A2.
Kruskal–Wallis H-test results of G3 (nature of organisation).
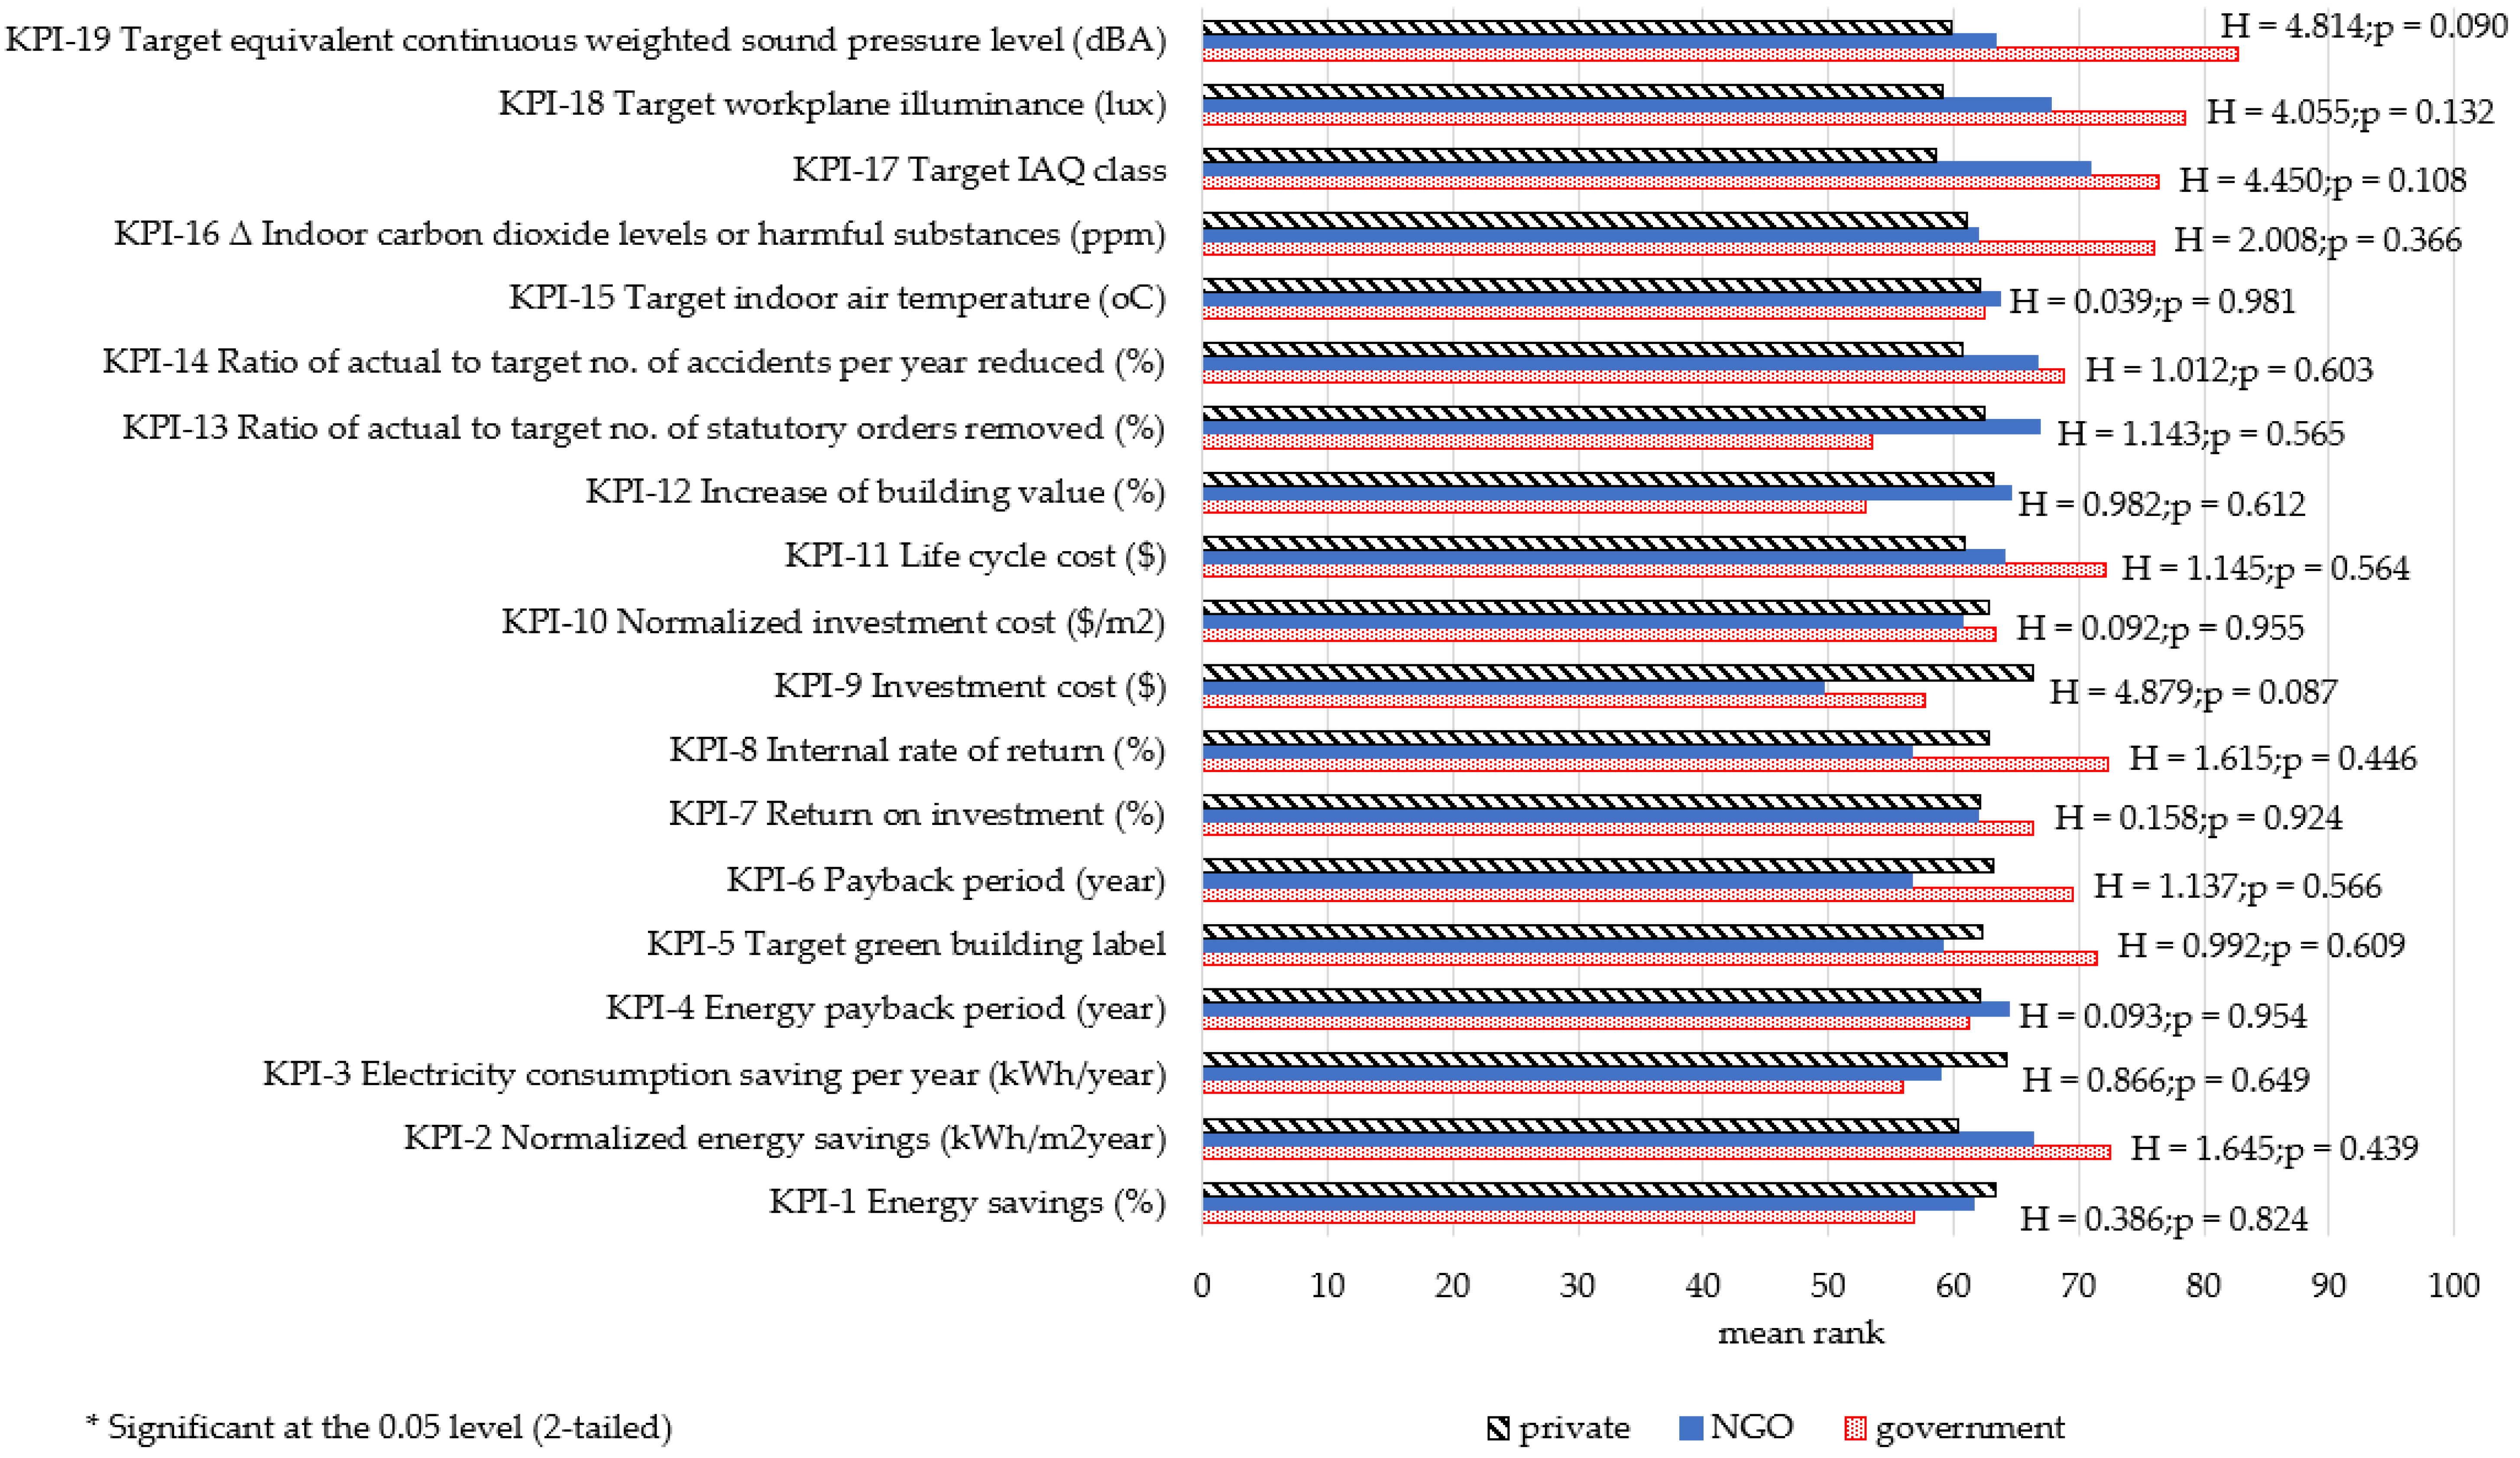
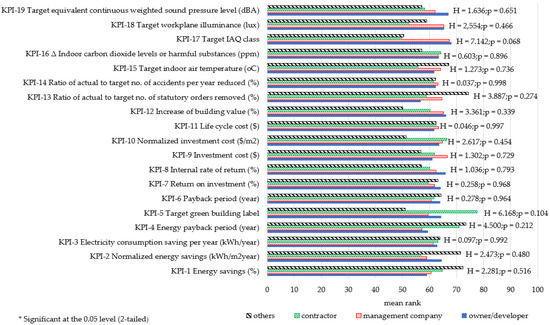
Figure A3.
Kruskal–Wallis H-test results of G4 (type of employer).
Figure A3.
Kruskal–Wallis H-test results of G4 (type of employer).
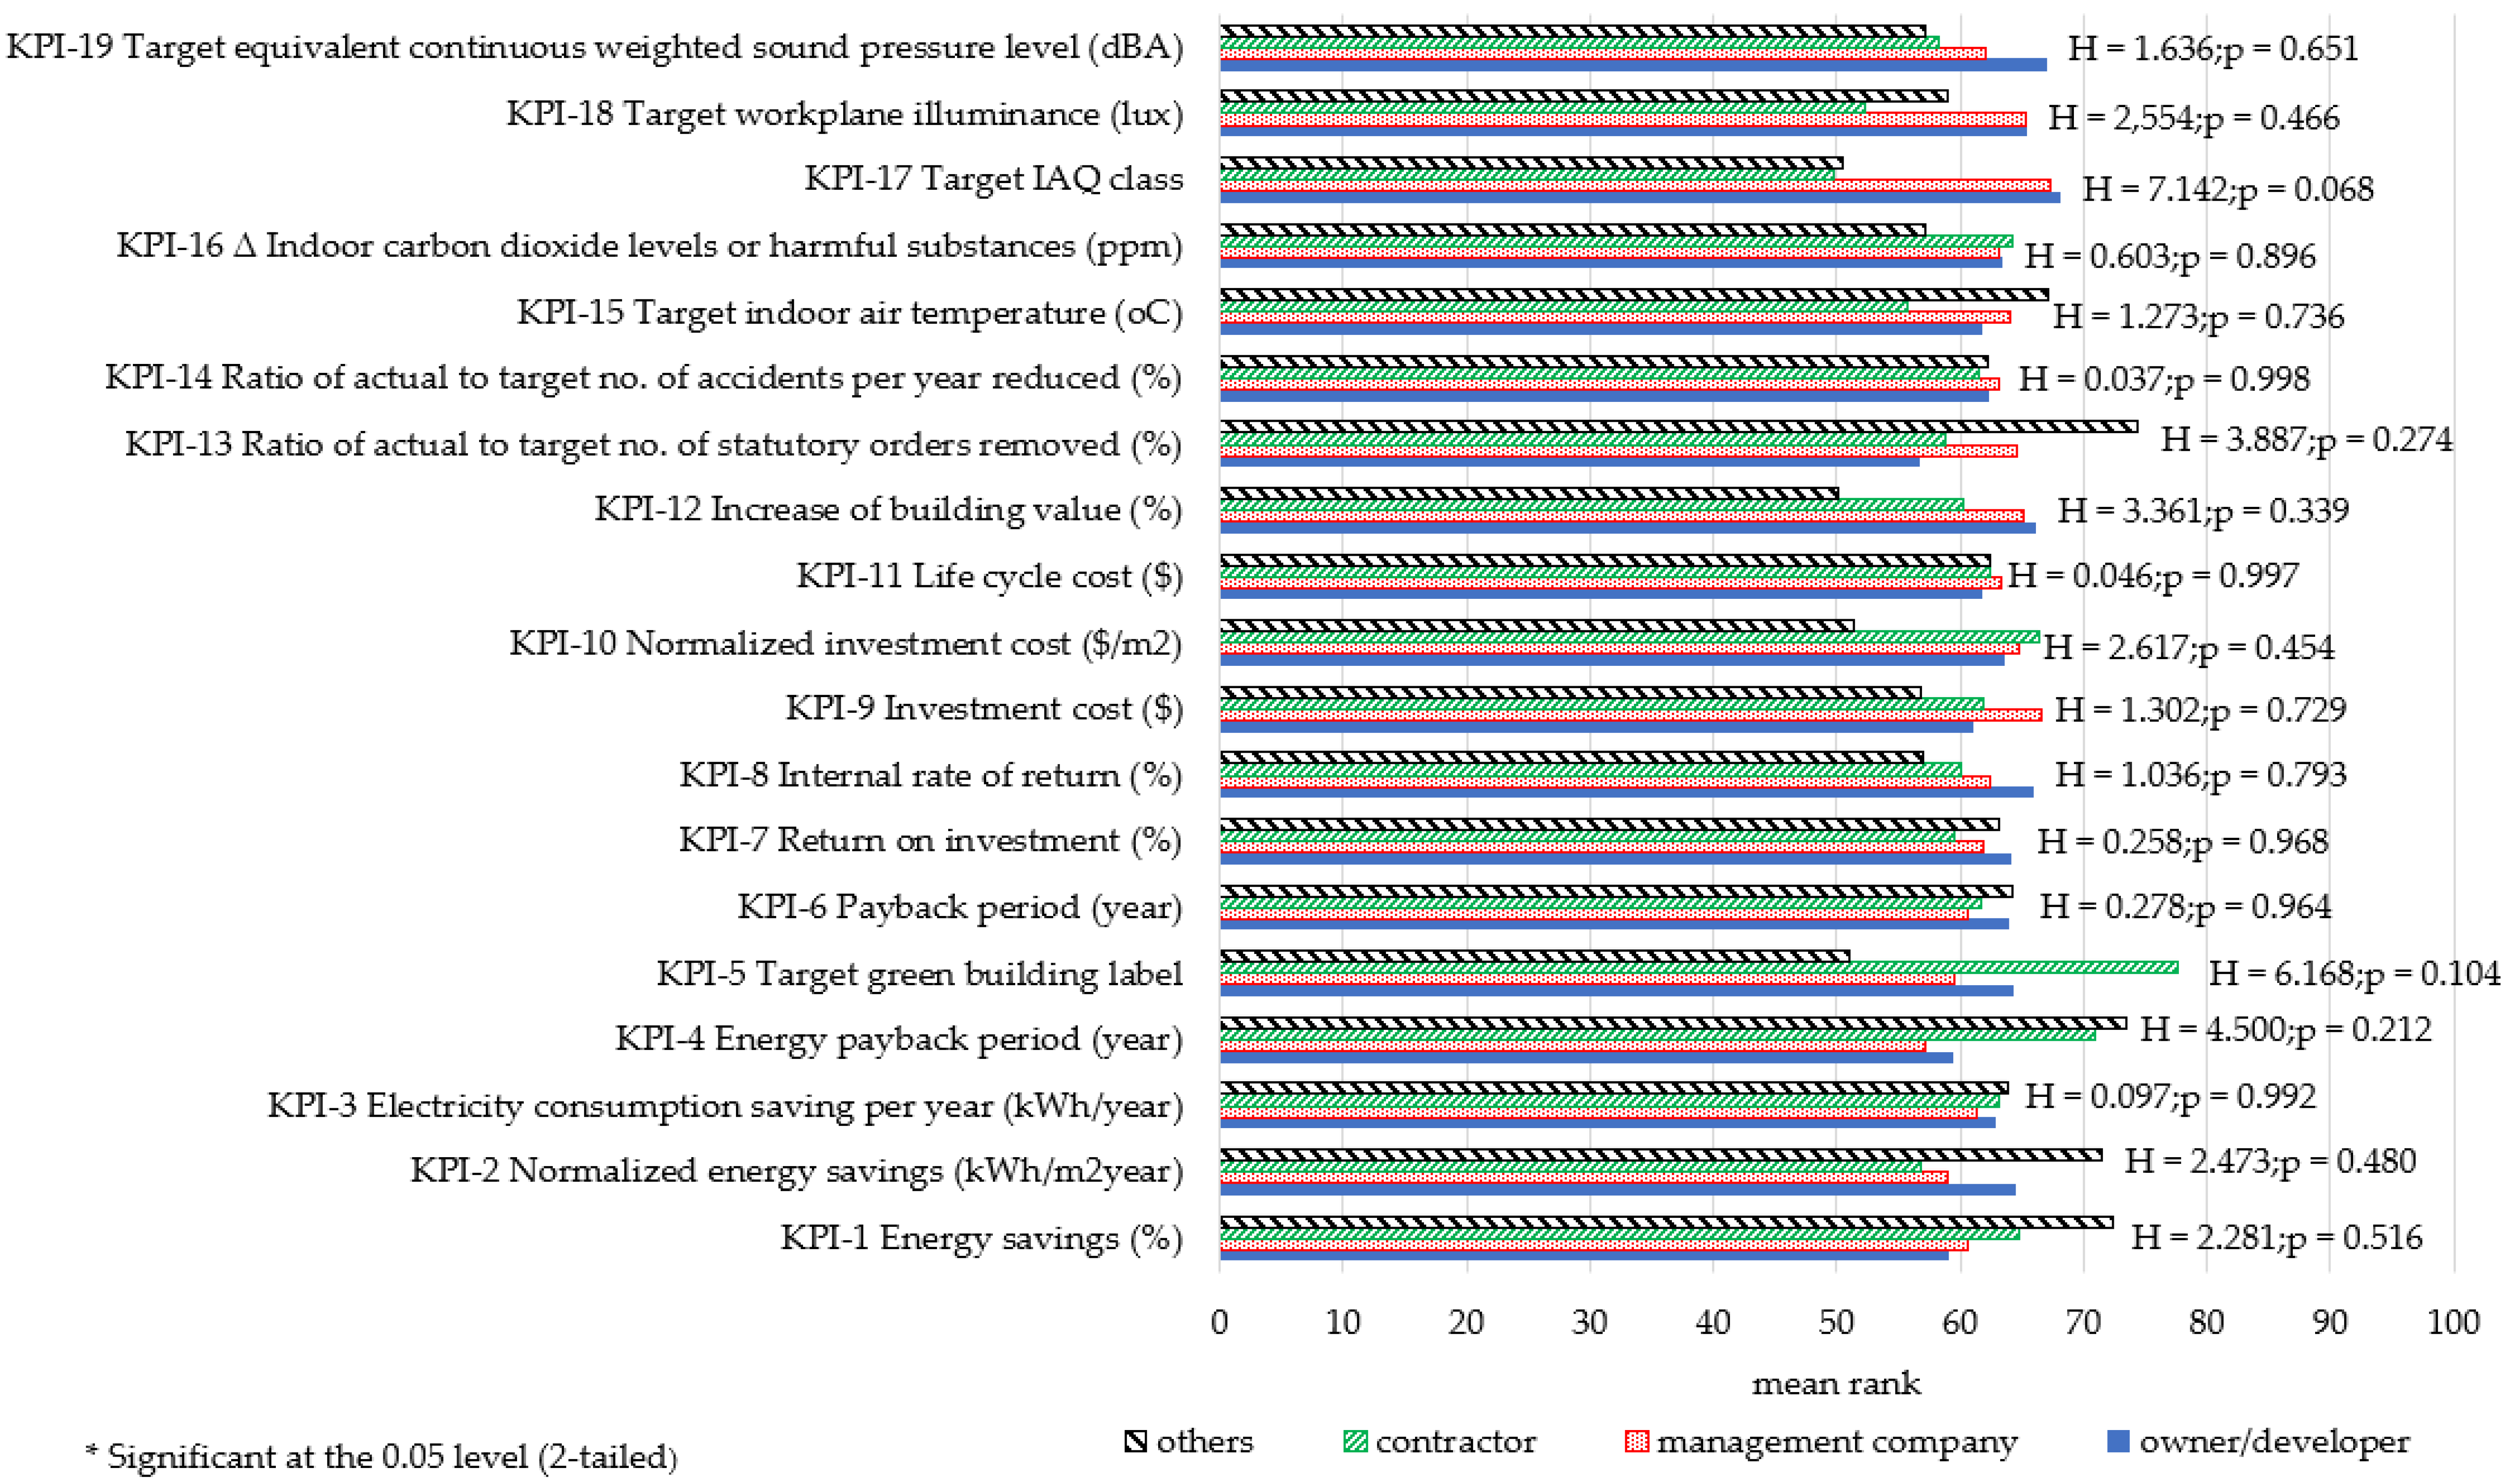
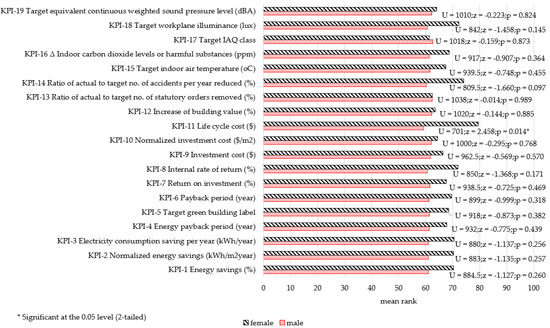
Figure A4.
Mann–Whitney U-test results of G1 (gender).
Figure A4.
Mann–Whitney U-test results of G1 (gender).

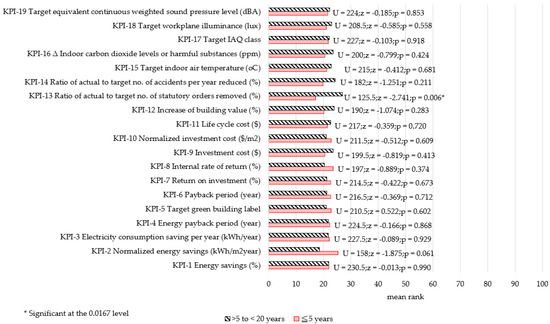
Figure A5.
Mann–Whitney U-test results of G2 (work experience: G2a vs. G2b).
Figure A5.
Mann–Whitney U-test results of G2 (work experience: G2a vs. G2b).

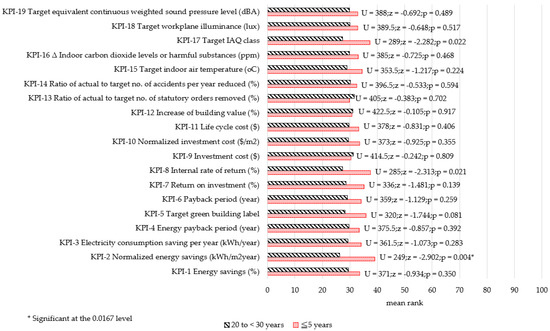
Figure A6.
Mann–Whitney U-test results of G2 (work experience: G2a vs. G2c).
Figure A6.
Mann–Whitney U-test results of G2 (work experience: G2a vs. G2c).

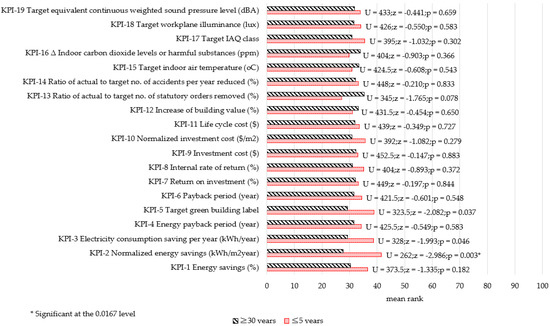
Figure A7.
Mann–Whitney U-test results of G2 (work experience: G2a vs. G2d).
Figure A7.
Mann–Whitney U-test results of G2 (work experience: G2a vs. G2d).
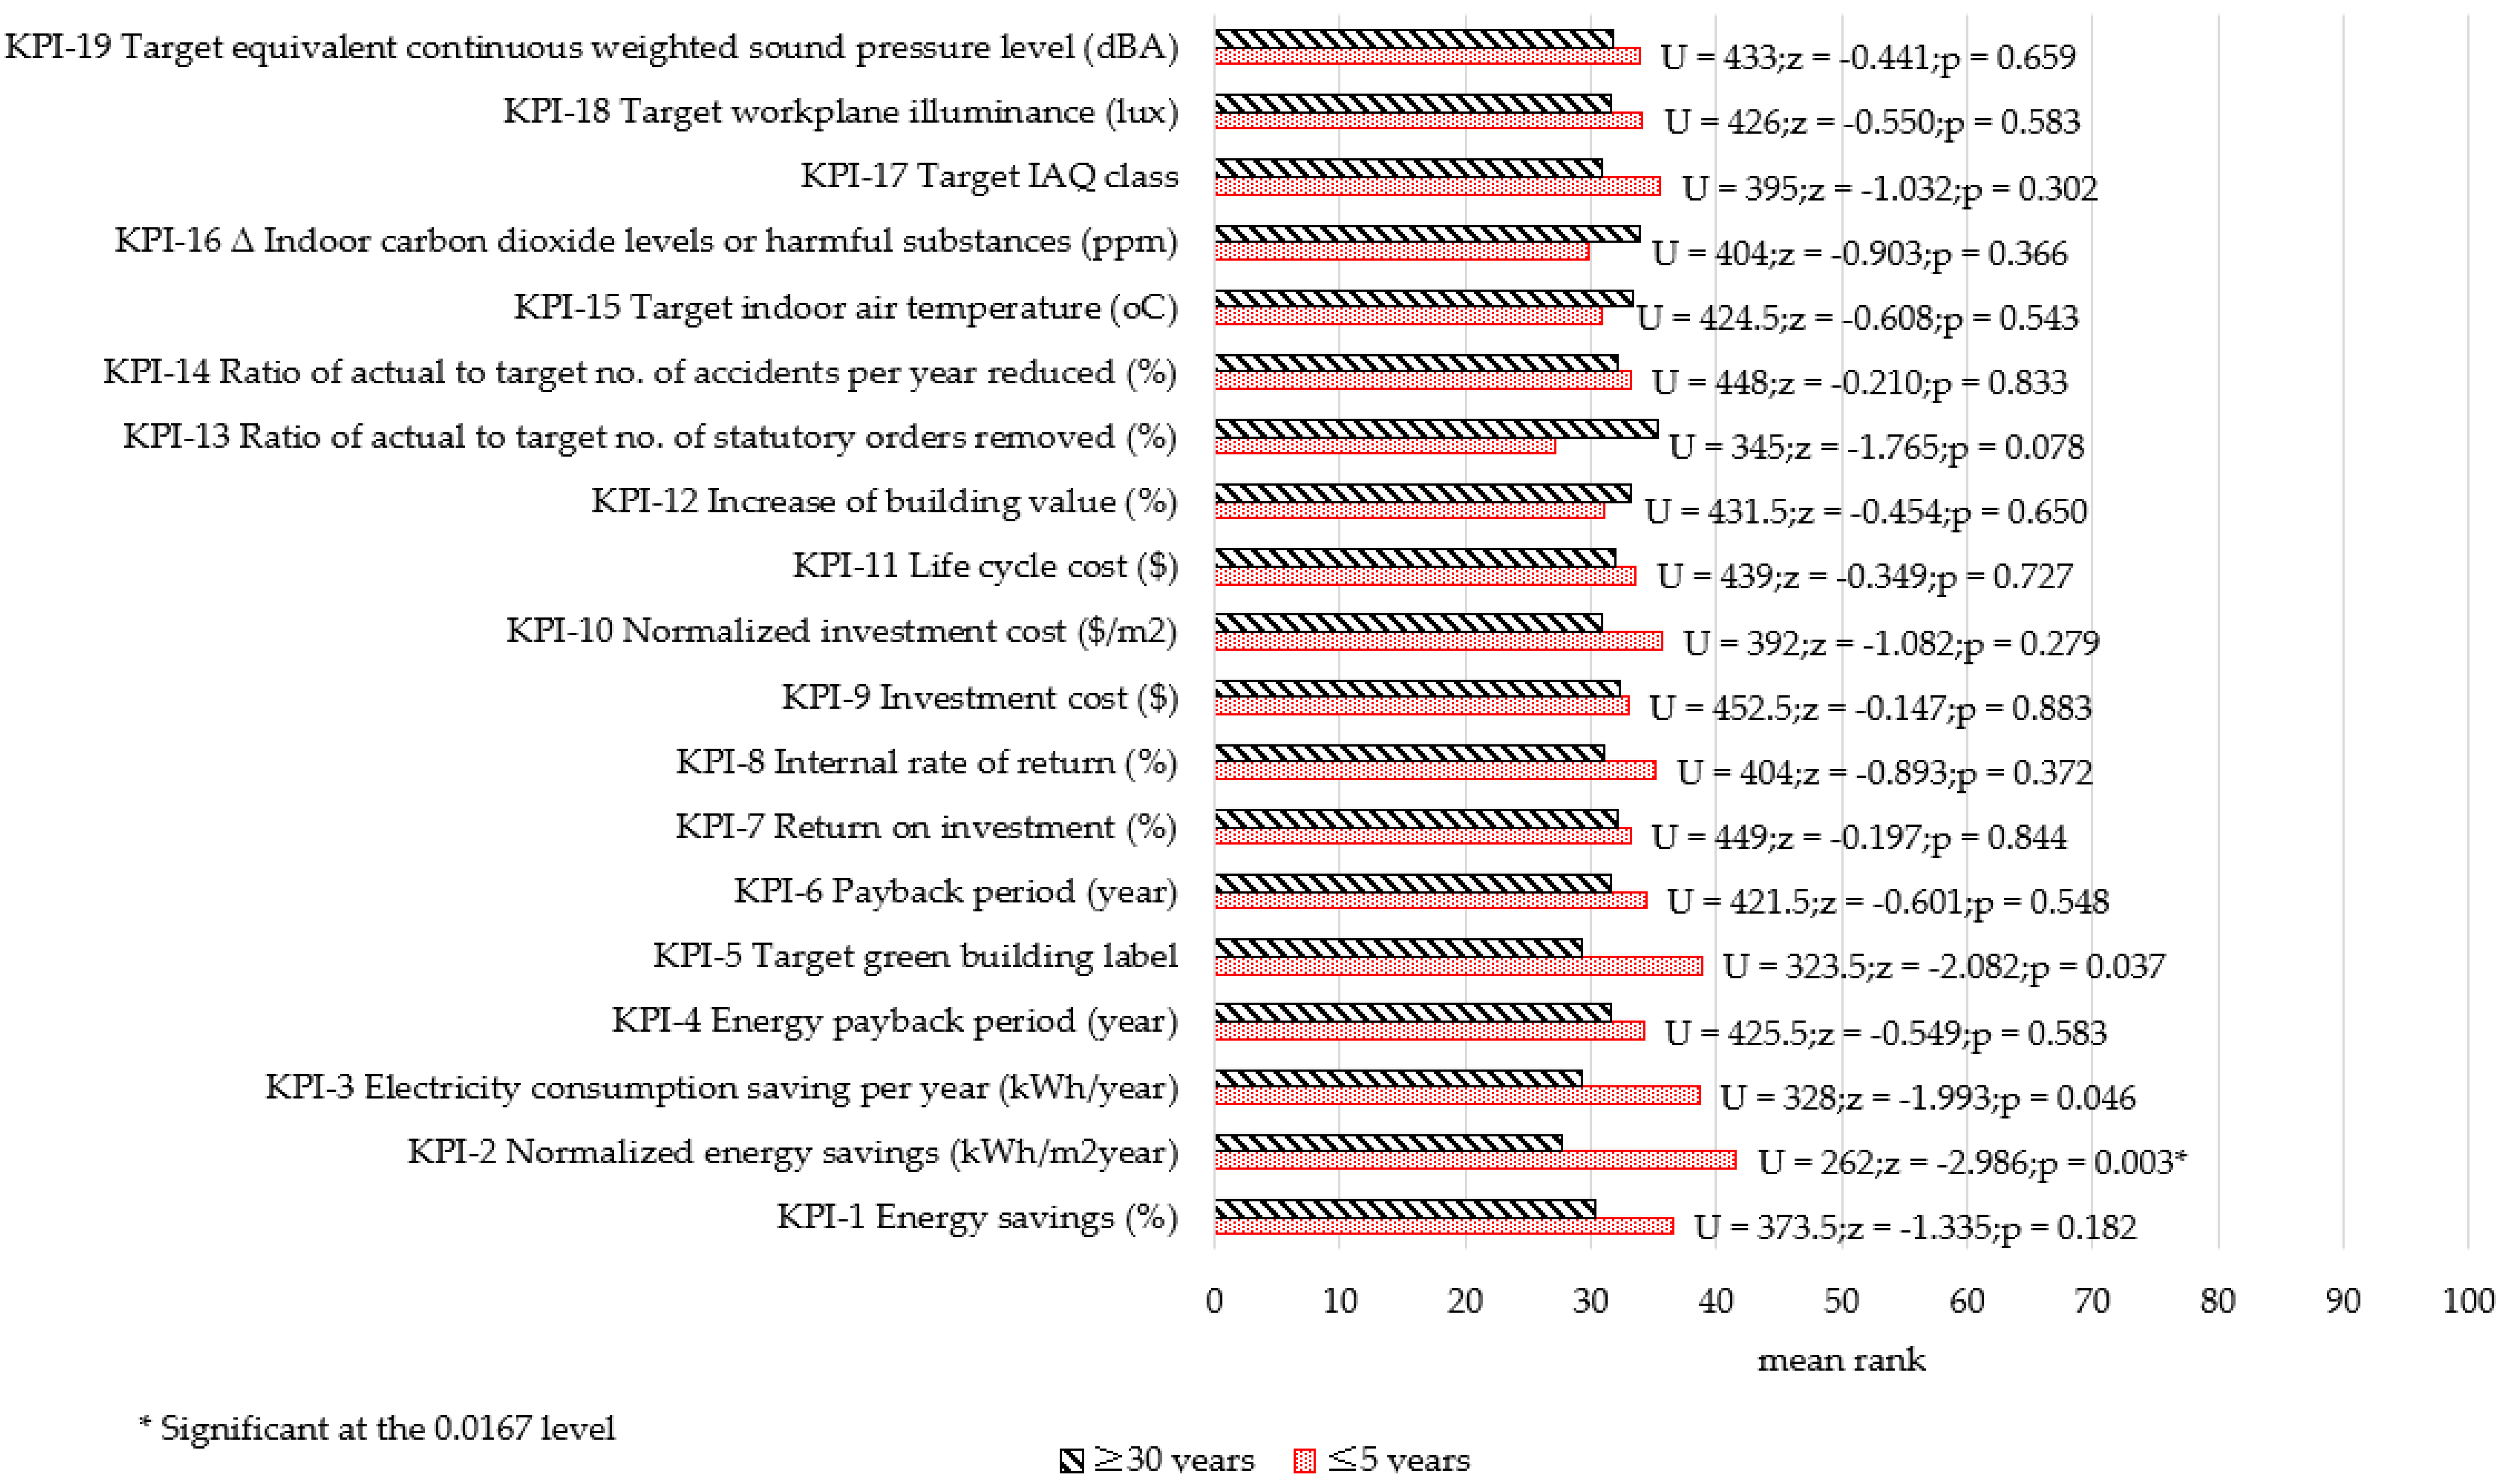

Figure A8.
Mann–Whitney U-test results of G2 (work experience: G2b vs. G2c).
Figure A8.
Mann–Whitney U-test results of G2 (work experience: G2b vs. G2c).
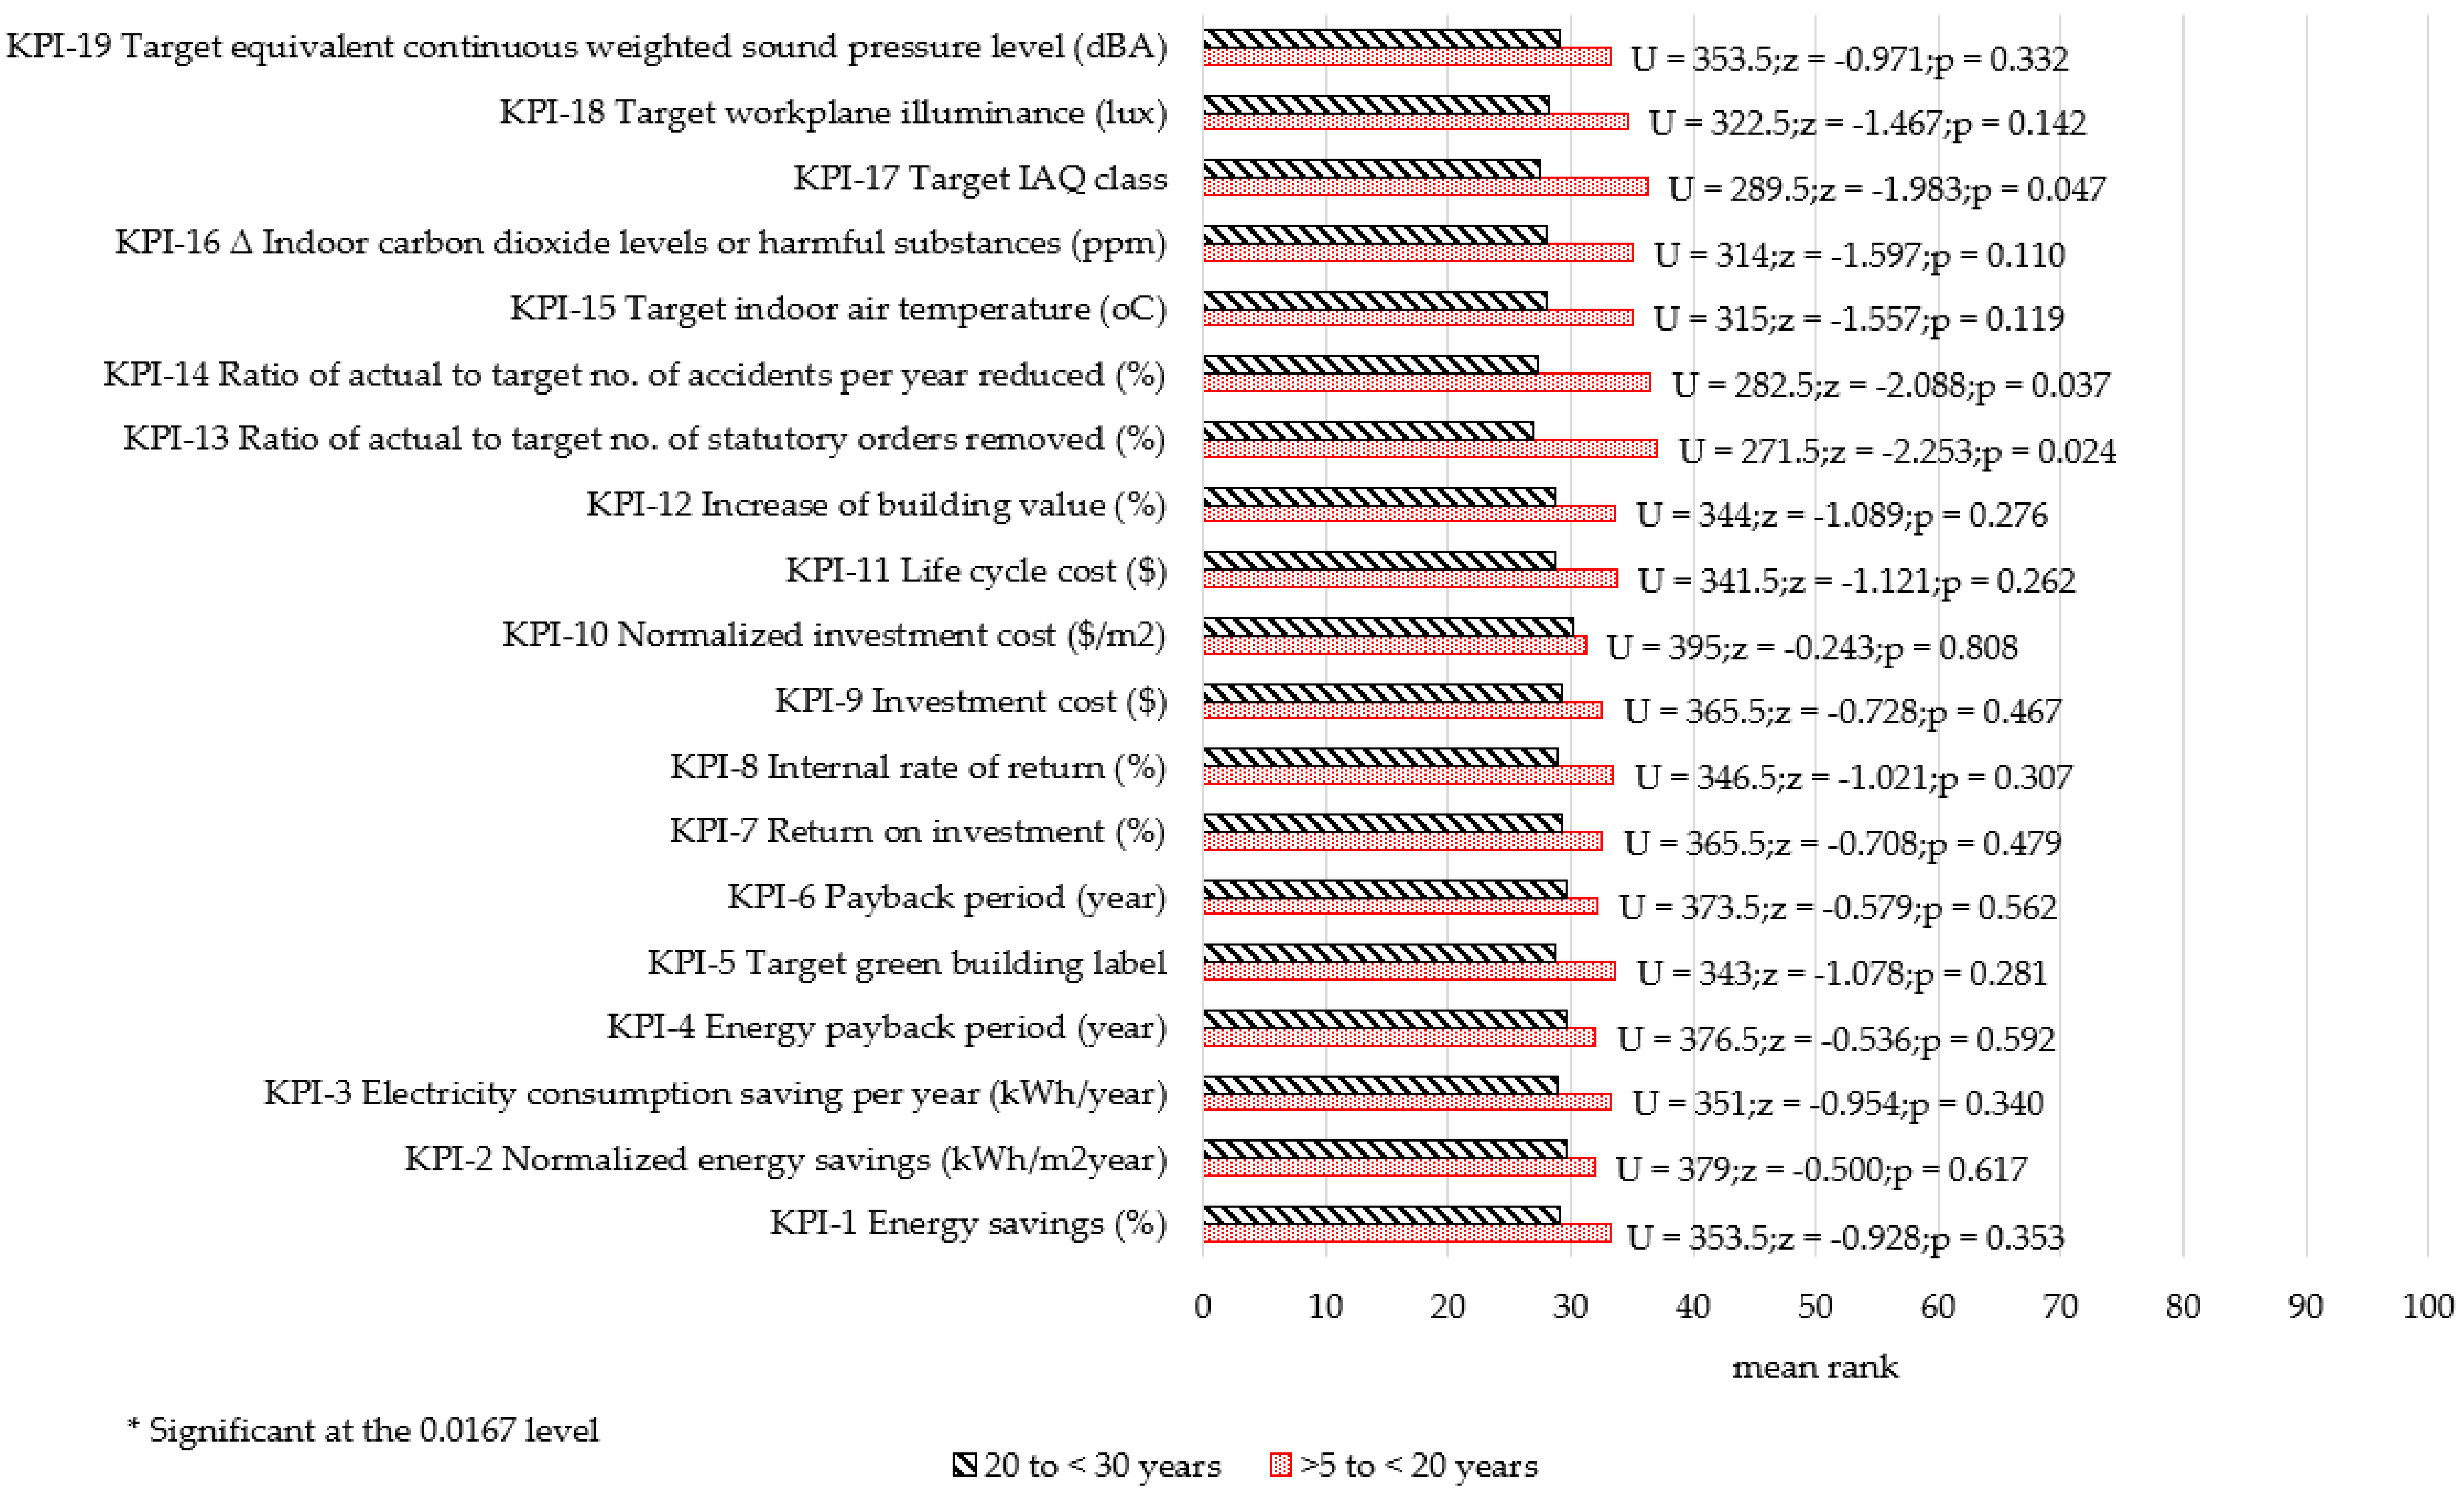
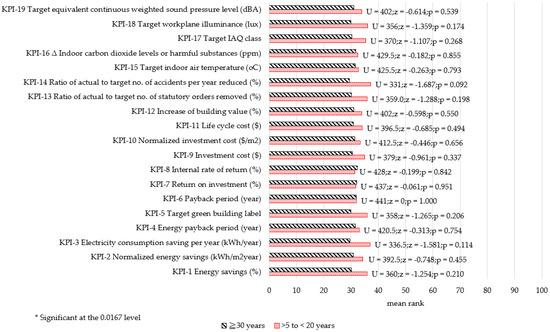
Figure A9.
Mann–Whitney U-test results of G2 (work experience: G2b vs. G2d).
Figure A9.
Mann–Whitney U-test results of G2 (work experience: G2b vs. G2d).

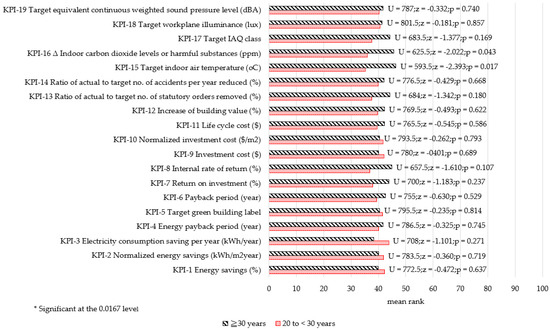
Figure A10.
Mann–Whitney U-test results of G2 (work experience: G2c vs. G2d).
Figure A10.
Mann–Whitney U-test results of G2 (work experience: G2c vs. G2d).

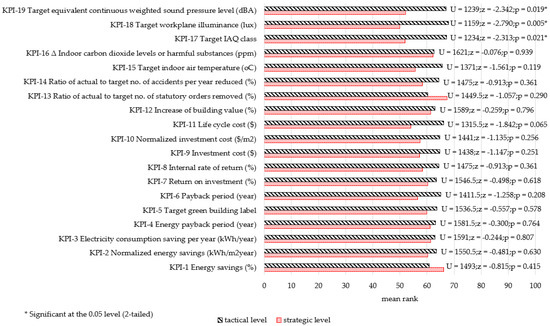
Figure A11.
Mann–Whitney U-test results of G5 (job level).
Figure A11.
Mann–Whitney U-test results of G5 (job level).
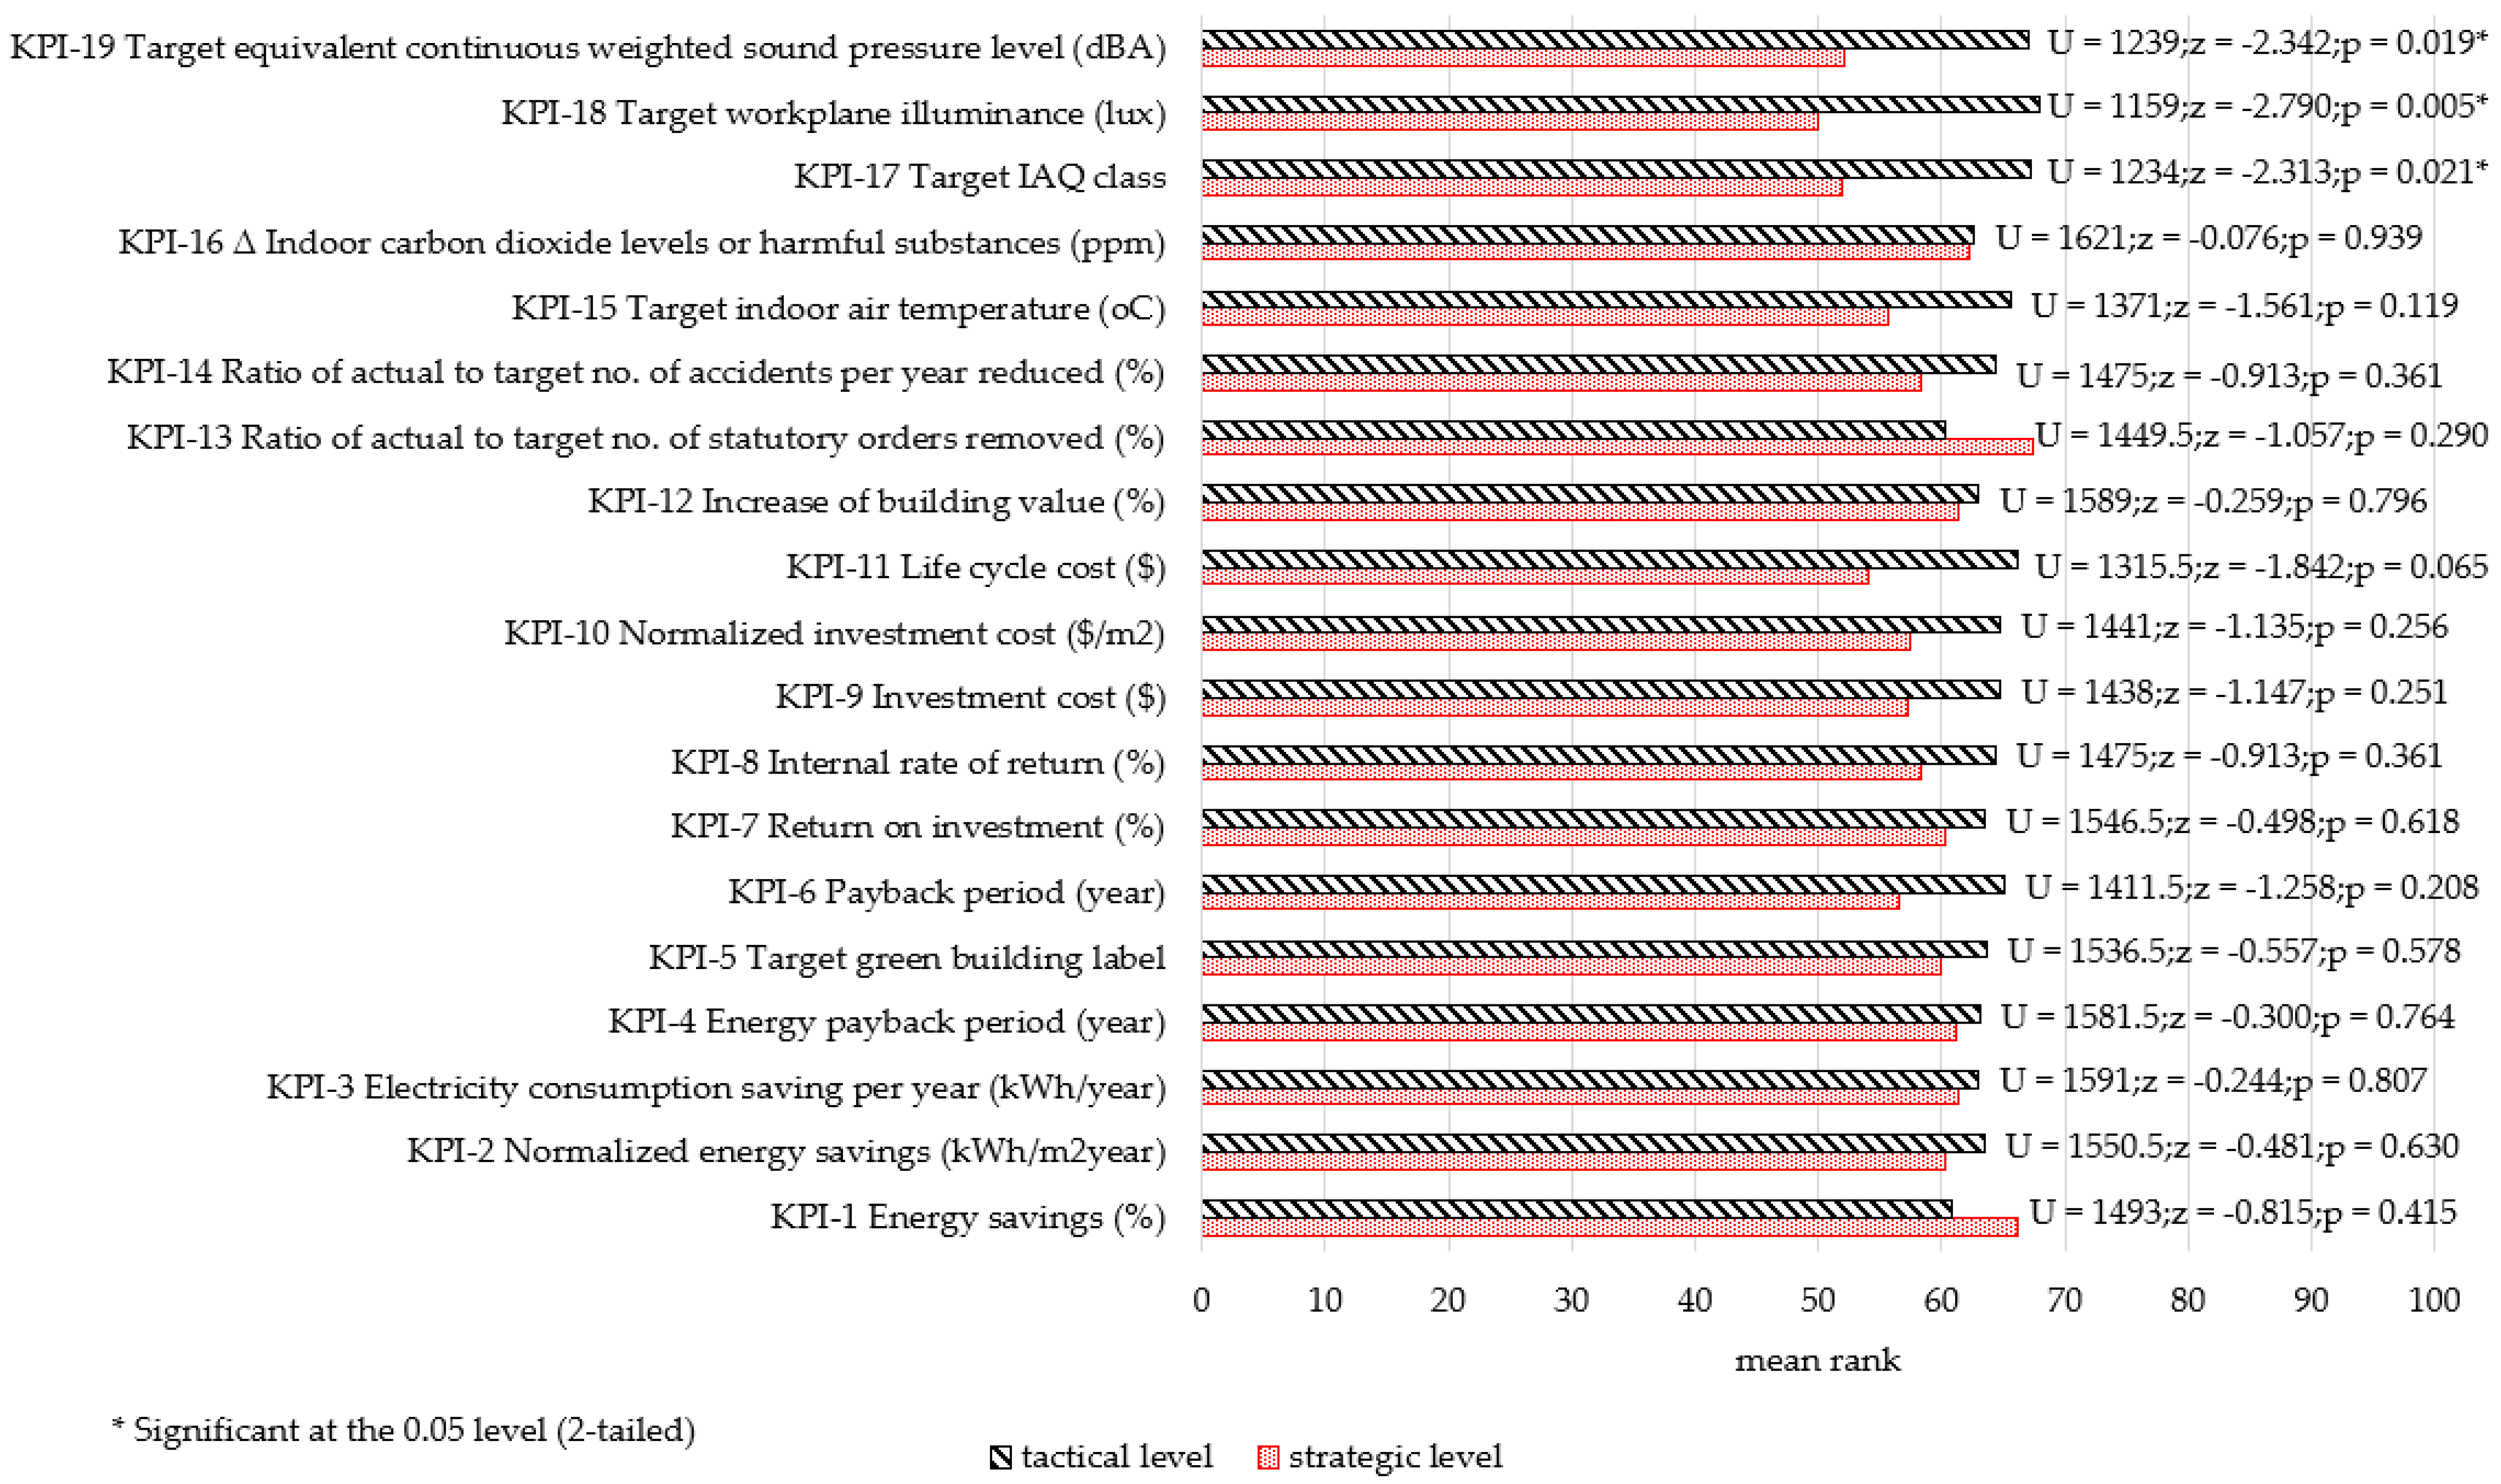
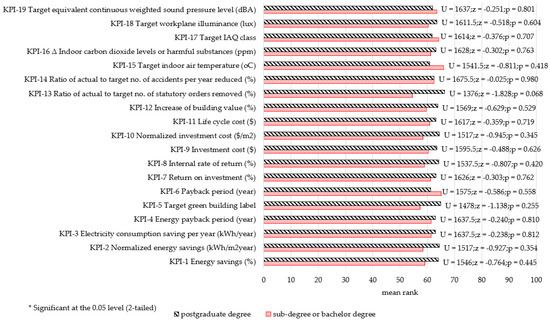
Figure A12.
Mann–Whitney U-test results of G6 (academic qualification).
Figure A12.
Mann–Whitney U-test results of G6 (academic qualification).
Appendix B
Table A1.
Mean importance ratings and ranks of KPIs (G1 and G2).
Table A1.
Mean importance ratings and ranks of KPIs (G1 and G2).
| KPI | G1: Gender | G2: Work Experience | |||||||||||
|---|---|---|---|---|---|---|---|---|---|---|---|---|---|
| a. Male | b. Female | a. ≦5 Years | b. >5 to <20 Years | c. 20 to <30 Years | d. 30 Years | ||||||||
| Mean | Rank | Mean | Rank | Mean | Rank | Mean | Rank | Mean | Rank | Mean | Rank | ||
| 1 | Energy savings (%) | 3.70 | 2 | 3.95 | 1 | 3.95 | 2 | 3.90 | =1 | 3.69 | 2 | 3.64 | =2 |
| 2 | Normalised energy savings (kWh/m2 year) | 3.40 | =12 | 3.65 | 10 | 4.00 | 1 | 3.48 | =12 | 3.33 | 11 | 3.29 | 16 |
| 3 | Electricity consumption saving per year (kWh/year) | 3.50 | 4 | 3.80 | =4 | 3.86 | 3 | 3.76 | =4 | 3.54 | 3 | 3.33 | 15 |
| 4 | Energy payback period (year) | 3.38 | 14 | 3.60 | =11 | 3.59 | =8 | 3.48 | =12 | 3.36 | =9 | 3.40 | =10 |
| 5 | Target green building label | 3.07 | 19 | 3.40 | =17 | 3.59 | =8 | 3.33 | 18 | 2.97 | 18 | 2.95 | 19 |
| 6 | Payback period (year) | 3.40 | =12 | 3.70 | =7 | 3.68 | =6 | 3.48 | =12 | 3.31 | =12 | 3.50 | 5 |
| 7 | Return on investment (%) | 3.30 | 16 | 3.55 | =13 | 3.59 | =8 | 3.38 | =16 | 3.18 | 17 | 3.40 | =10 |
| 8 | Internal rate of return (%) | 3.09 | 18 | 3.40 | =17 | 3.45 | 17 | 3.19 | 19 | 2.87 | 19 | 3.24 | 17 |
| 9 | Investment cost (USD) | 3.72 | 1 | 3.85 | 3 | 3.73 | 5 | 3.90 | =1 | 3.74 | 1 | 3.69 | 1 |
| 10 | Normalised investment cost (USD/m2) | 3.46 | =6 | 3.60 | =11 | 3.68 | =6 | 3.52 | 11 | 3.49 | 4 | 3.36 | =12 |
| 11 | Life cycle cost (USD) | 3.41 | 11 | 3.90 | 2 | 3.55 | =13 | 3.62 | =8 | 3.38 | =6 | 3.48 | =7 |
| 12 | Increase of building value (%) | 3.42 | =9 | 3.50 | 15 | 3.36 | 19 | 3.62 | =8 | 3.36 | =9 | 3.48 | =7 |
| 13 | Ratio of actual to target no. of statutory orders removed (%) | 3.46 | =6 | 3.45 | 16 | 3.49 | 16 | 3.47 | 15 | 3.44 | 5 | 3.49 | 6 |
| 14 | Ratio of actual to target no. of accidents per year reduced (%) | 3.38 | 14 | 3.80 | =4 | 3.55 | =13 | 3.81 | 3 | 3.31 | =12 | 3.36 | =12 |
| 15 | Target indoor air temperature (°C) | 3.44 | 8 | 3.70 | 9 | 3.59 | =8 | 3.57 | 10 | 3.28 | =14 | 3.62 | 4 |
| 16 | Δ Indoor carbon dioxide levels or harmful substances (ppm) | 3.52 | 3 | 3.75 | 6 | 3.55 | =13 | 3.71 | 6 | 3.38 | =6 | 3.64 | =2 |
| 17 | Target IAQ class | 3.48 | 5 | 3.55 | =13 | 3.82 | 4 | 3.76 | =4 | 3.28 | =14 | 3.43 | 9 |
| 18 | Target workplane illuminance (lux) | 3.42 | =9 | 3.70 | =7 | 3.59 | =8 | 3.67 | 7 | 3.38 | =6 | 3.36 | =12 |
| 19 | Target equivalent continuous weighted sound pressure level (dBA) | 3.27 | 17 | 3.35 | 19 | 3.41 | 18 | 3.38 | =16 | 3.21 | 16 | 3.21 | 18 |
Table A2.
Mean importance ratings and ranks of KPIs (G3 and G4).
Table A2.
Mean importance ratings and ranks of KPIs (G3 and G4).
| KPI | G3: Nature of Organisation | G4: Type of Employer | |||||||||||||
|---|---|---|---|---|---|---|---|---|---|---|---|---|---|---|---|
| a. Government | b. NGO | c. Private | a. Owner/ Developer | b. Management Company | c. Contractor | d. Others | |||||||||
| Mean | Rank | Mean | Rank | Mean | Rank | Mean | Rank | Mean | Rank | Mean | Rank | Mean | Rank | ||
| 1 | Energy savings (%) | 3.55 | =9 | 3.78 | 1 | 3.78 | 2 | 3.70 | 2 | 3.70 | 2 | 3.83 | 1 | 3.95 | 1 |
| 2 | Normalised energy savings (kWh/m2 year) | 3.64 | =6 | 3.57 | =4 | 3.41 | =12 | 3.51 | =8 | 3.39 | =13 | 3.33 | 14 | 3.63 | =3 |
| 3 | Electricity consumption saving per year (kWh/year) | 3.36 | =16 | 3.48 | 11 | 3.61 | 3 | 3.58 | =4 | 3.52 | =6 | 3.61 | =3 | 3.58 | 6 |
| 4 | Energy payback period (year) | 3.36 | =16 | 3.57 | =4 | 3.41 | =12 | 3.4 | 16 | 3.27 | =16 | 3.61 | =3 | 3.74 | 2 |
| 5 | Target green building label | 3.45 | =12 | 3.09 | 18 | 3.11 | 19 | 3.23 | =18 | 3.02 | 19 | 3.50 | 8 | 2.84 | 19 |
| 6 | Payback period (year) | 3.64 | =6 | 3.35 | =16 | 3.48 | =5 | 3.53 | =6 | 3.39 | =13 | 3.44 | 11 | 3.53 | 7 |
| 7 | Return on investment (%) | 3.45 | =12 | 3.39 | 15 | 3.34 | 16 | 3.44 | =13 | 3.34 | 15 | 3.22 | 16 | 3.37 | 13 |
| 8 | Internal rate of return (%) | 3.36 | =16 | 3 | 19 | 3.17 | 18 | 3.23 | =18 | 3.16 | 18 | 3.11 | =18 | 3.00 | 18 |
| 9 | Investment cost (USD) | 3.64 | =6 | 3.48 | 11 | 3.83 | 1 | 3.72 | 1 | 3.82 | 1 | 3.78 | 2 | 3.63 | =3 |
| 10 | Normalised investment cost (USD/m2) | 3.55 | =9 | 3.48 | 11 | 3.48 | =5 | 3.47 | =10 | 3.55 | 5 | 3.61 | =3 | 3.26 | 14 |
| 11 | Life cycle cost (USD) | 3.73 | =4 | 3.48 | 11 | 3.46 | 10 | 3.44 | 15 | 3.5 | =8 | 3.56 | =6 | 3.47 | =8 |
| 12 | Increase of building value (%) | 3.27 | 19 | 3.52 | =7 | 3.44 | 11 | 3.53 | =6 | 3.5 | =8 | 3.39 | =12 | 3.16 | 17 |
| 13 | Ratio of actual to target no. of statutory orders removed (%) | 3.47 | =9 | 3.48 | 11 | 3.48 | =5 | 3.46 | 12 | 3.48 | =10 | 3.49 | 9 | 3.46 | 12 |
| 14 | Ratio of actual to target no. of accidents per year reduced (%) | 3.73 | =4 | 3.52 | =7 | 3.40 | 15 | 3.44 | =13 | 3.48 | =10 | 3.39 | =12 | 3.47 | =8 |
| 15 | Target indoor air temperature (°C) | 3.45 | =12 | 3.61 | 3 | 3.48 | =5 | 3.51 | =8 | 3.52 | =6 | 3.28 | 15 | 3.63 | =3 |
| 16 | Δ Indoor carbon dioxide levels or harmful substances (ppm) | 3.91 | 1 | 3.57 | =4 | 3.51 | 4 | 3.58 | =4 | 3.57 | 4 | 3.56 | =6 | 3.47 | =8 |
| 17 | Target IAQ class | 3.82 | =2 | 3.74 | 2 | 3.41 | =12 | 3.65 | 3 | 3.64 | 3 | 3.17 | 17 | 3.21 | =15 |
| 18 | Target workplane illuminance (lux) | 3.46 | =12 | 3.47 | 14 | 3.47 | 9 | 3.47 | =10 | 3.48 | =10 | 3.47 | 10 | 3.47 | =8 |
| 19 | Target equivalent continuous weighted sound pressure level (dBA) | 3.82 | =2 | 3.35 | =16 | 3.19 | 17 | 3.37 | 17 | 3.27 | =16 | 3.11 | =18 | 3.21 | =15 |
Table A3.
Mean importance ratings and ranks of KPIs (G5 and G6).
Table A3.
Mean importance ratings and ranks of KPIs (G5 and G6).
| KPI | G5: Job Level | G6: Academic Qualification | |||||||
|---|---|---|---|---|---|---|---|---|---|
| a. Strategic Level | b. Tactical Level | a. Subdegree or Bachelor | b. Postgraduate Degree | ||||||
| Mean | Rank | Mean | Rank | Mean | Rank | Mean | Rank | ||
| 1 | Energy savings (%) | 3.82 | =2 | 3.73 | 1 | 3.68 | =1 | 3.8 | 1 |
| 2 | Normalised energy savings (kWh/m2 year) | 3.55 | 11 | 3.42 | =8 | 3.35 | =14 | 3.51 | 6 |
| 3 | Electricity consumption saving per year (kWh/year) | 3.82 | =2 | 3.45 | 7 | 3.53 | 5 | 3.58 | =3 |
| 4 | Energy payback period (year) | 3.61 | 8 | 3.36 | 13 | 3.38 | =14 | 3.46 | =12 |
| 5 | Target green building label | 3.29 | 18 | 3.07 | 19 | 3.00 | 19 | 3.2 | 18 |
| 6 | Payback period (year) | 3.74 | 6 | 3.35 | =14 | 3.53 | 5 | 3.44 | 15 |
| 7 | Return on investment (%) | 3.47 | 15 | 3.31 | 16 | 3.3 | 16 | 3.39 | 16 |
| 8 | Internal rate of return (%) | 3.26 | 19 | 3.1 | 18 | 3.08 | 18 | 3.19 | 19 |
| 9 | Investment cost (USD) | 4.11 | 1 | 3.59 | 2 | 3.68 | =1 | 3.79 | 2 |
| 10 | Normalised investment cost (USD/m2) | 3.79 | 4 | 3.35 | =14 | 3.35 | =14 | 3.55 | 5 |
| 11 | Life cycle cost (USD) | 3.53 | =12 | 3.47 | =5 | 3.45 | =10 | 3.5 | =7 |
| 12 | Increase of building value (%) | 3.53 | =12 | 3.41 | 10 | 3.38 | =12 | 3.48 | =9 |
| 13 | Ratio of actual to target no. of statutory orders removed (%) | 3.49 | 14 | 3.46 | 4 | 3.47 | =8 | 3.46 | =12 |
| 14 | Ratio of actual to target no. of accidents per year reduced (%) | 3.58 | =9 | 3.40 | =11 | 3.45 | =10 | 3.45 | 14 |
| 15 | Target indoor air temperature (°C) | 3.68 | 7 | 3.42 | =8 | 3.55 | 3 | 3.48 | =9 |
| 16 | Δ Indoor carbon dioxide levels or harmful substances (ppm) | 3.58 | =9 | 3.55 | 3 | 3.5 | 7 | 3.58 | =3 |
| 17 | Target IAQ class | 3.76 | 5 | 3.40 | =11 | 3.53 | 5 | 3.5 | =7 |
| 18 | Target workplane illuminance (lux) | 3.46 | 16 | 3.47 | =5 | 3.47 | =8 | 3.47 | 11 |
| 19 | Target equivalent continuous weighted sound pressure level (dBA) | 3.37 | 17 | 3.23 | 17 | 3.25 | 17 | 3.29 | 17 |
References
- IEA. World Energy Statistics and Balances (Database). Available online: www.iea.org/statistics (accessed on 31 July 2021).
- Tan, Y.; Liu, G.; Zhang, Y.; Shuai, C.; Shen, G.Q. Green retrofit of aged residential buildings in Hong Kong: A preliminary study. Build. Environ. 2018, 143, 89–98. [Google Scholar] [CrossRef]
- Zheng, L.; Lai, J. Environmental and Economic Evaluations of Building Energy Retrofits: Case Study of a Commercial Building. Build. Environ. 2018, 145, 14–23. [Google Scholar] [CrossRef]
- Sing, M.C.P.; Chan, V.W.C.; Lai, J.H.K.; Matthews, J. Energy-efficient retrofitting of multi-storey residential buildings. Facilities 2021, 39, 722–736. [Google Scholar] [CrossRef]
- Ho, A.; Lai, J. Building retrofit: Review on modelling studies, real applications and barriers. In Proceedings of the 9th Great Pearl River Delta and 2nd Guangdong, Hong Kong and Macao Dawan District Building Operation and Maintenance Conference, Guangzhou, China, 15 December 2018; pp. 54–61. [Google Scholar]
- Ho, A.M.Y.; Lai, J.H.K.; Chiu, B.W.Y. Key performance indicators for holistic evaluation of building retrofits: Systematic literature review and focus group study. J. Build. Eng. 2021, 43, 102926. [Google Scholar] [CrossRef]
- Shaikh, P.H.; Shaikh, F.; Sahito, A.A.; Uqaili, M.A.; Umrani, Z. Chapter 9-An Overview of the Challenges for Cost-Effective and Energy-Efficient Retrofits of the Existing Building Stock. In Cost-Effective Energy-Efficient Building Retrofitting, 1st ed.; Fernando, P., Claes-Göran, G., Bjørn, P.J., Giuseppe, P.V., Nicola, B., Jarek, K., Eds.; Woodhead Publishing: Cambridge, UK, 2017; pp. 257–278. [Google Scholar]
- Jagarajan, R.; Abdullah, M.; Asmoni, M.N.; Mohammed, A.H.; Jaafar, M.N.; Lee, Y.M.J.; Baba, M. Green retrofitting–A review of current status, implementations and challenges. Renew. Sustain. Energy Rev. 2017, 67, 1360–1368. [Google Scholar] [CrossRef]
- Aghamolaei, R. Evaluation of Supply and Demand in Building Energy Performance: Application of Retrofit Scenarios in Residential Building. Energy Eng. 2019, 116, 60–79. [Google Scholar] [CrossRef]
- Ferrari, S.; Beccali, M. Energy-environmental and cost assessment of a set of strategies for retrofitting a public building toward nearly zero-energy building target. Sustain. Cities Soc. 2017, 32, 226–234. [Google Scholar] [CrossRef]
- Wilkinson, S. Analysing sustainable retrofit potential in premium office buildings. Struct. Surv. 2012, 30, 398–410. [Google Scholar] [CrossRef]
- Gagliano, A.; Detommaso, M.; Nocera, F.; Patania, F.; Aneli, S. The Retrofit of Existing Buildings Through the Exploitation of the Green Roofs–A Simulation Study. Energy Procedia 2014, 62, 52–61. [Google Scholar] [CrossRef] [Green Version]
- Tokede, O.; Ahiaga-Dagbui, D. Evaluating the whole-life cost implication of revocability and disruption in office retrofit building projects. In Proceedings of the 32nd ARCOM Conference, Association of Researchers in Construction Management, Manchester, UK, 5–7 September 2016; pp. 321–330. [Google Scholar]
- Jafari, A.; Valentin, V. An optimization framework for building energy retrofits decision-making. Build. Environ. 2017, 115, 118–129. [Google Scholar] [CrossRef]
- Ma, Z.; Cooper, P.; Daly, D.; Ledo, L. Existing building retrofits: Methodology and state-of-the-art. Energy Build. 2012, 55, 889–902. [Google Scholar] [CrossRef]
- Terés-Zubiaga, J.; Martin, K.; Erkoreka, A.; Aparicio, X.; del Portillo, L.A. Chapter 18-Cost-Effective Energy Retrofitting of Buildings in Spain: An Office Building of the University of the Basque Country. In Cost-Effective Energy Efficient Building Retrofitting, 1st ed.; Fernando, P., Claes-Göran, G., Bjørn, P.J., Giuseppe, P.V., Nicola, B., Jarek, K., Eds.; Woodhead Publishing: Cambridge, UK, 2017; pp. 515–551. [Google Scholar]
- Remer, D.S.; Nieto, A.P. A compendium and comparison of 25 project evaluation techniques. Part 1. Net present value and rate of return methods. Int. J. Prod. Econ. 1995, 42, 79–96. [Google Scholar] [CrossRef]
- Verbeeck, G.; Hens, H. Energy savings in retrofitted dwellings: Economically viable. Energy Build. 2005, 37, 747–754. [Google Scholar] [CrossRef]
- Nikolaidis, Y.; Pilavachi, P.A.; Chletsis, A. Economic evaluation of energy saving measures in a common type of Greek building. Appl. Energy 2009, 86, 2550–2559. [Google Scholar] [CrossRef]
- Peterson, S.; Svendsen, S. Method for component-based economical optimisation for use in design of new low–energy buildings. Renew. Energy 2012, 38, 173–180. [Google Scholar] [CrossRef]
- Ornetzeder, M.; Wicher, M.; Suschek-Berger, J. User satisfaction and well-being in energy efficient office buildings: Evidence from cutting-edge projects in Austria. Energy Build. 2016, 118, 18–26. [Google Scholar] [CrossRef]
- Beccali, M.; Bonomolo, M.; Lo Brano, V.; Ciulla, G.; Di Dio, V.; Massaro, F.; Favuzza, S. Energy saving and user satisfaction for a new advanced public lighting system. Energy Convers. 2019, 195, 943–957. [Google Scholar] [CrossRef]
- Kylili, A.; Paris, A. Fokaides, and Petra Amparo Lopez Jimenez. Key Performance Indicators (KPIs) approach in buildings renovation for the sustainability of the built environment: A review. Renew. Sustain. Energy Rev. 2016, 56, 906–915. [Google Scholar] [CrossRef]
- Gourlis, G.; Kovacic, I. A study on building performance analysis for energy retrofit of existing industrial facilities. Appl. Energy 2016, 184, 1389–1399. [Google Scholar] [CrossRef]
- Walter, T.; Sohn, M.D. A regression-based approach to estimating retrofit savings using the Building Performance Database. Appl. Energy 2016, 179, 996–1005. [Google Scholar] [CrossRef] [Green Version]
- Cuerda, E.; Guerra-Santin, O.; Sendra, J.J.; Neila, F.J. Understanding the performance gap in energy retrofitting: Measured input data for adjusting building simulation models. Energy Build. 2020, 209, 109688. [Google Scholar] [CrossRef]
- Pohoryles, D.A.; Maduta, C.; Bournas, D.A.; Kouris, L.A. Energy performance of existing residential buildings in Europe: A novel approach combining energy with seismic retrofitting. Energy Build. 2020, 223, 110024. [Google Scholar] [CrossRef]
- Seyedzadeh, S.; Rahimian, F.P.; Oliver, S.; Rodriguez, S.; Glesk, I. Machine learning modelling for predicting non-domestic buildings energy performance: A model to support deep energy retrofit decision-making. Appl. Energy 2020, 279, 115908. [Google Scholar] [CrossRef]
- Al Dakheel, J.; Del Pero, C.; Aste, N.; Leonforte, F. Smart buildings features and key performance indicators: A review. Sustain. Cities Soc. 2020, 61, 102328. [Google Scholar] [CrossRef]
- Collins, A.J.; Hester, P.; Ezell, B.; Horst, J. An improvement selection methodology for key performance indicators. Environ. Syst. Decis. 2016, 36, 196–208. [Google Scholar] [CrossRef]
- Xu, P.; Chan, E.H.W.; Queena, Q.K. Key performance indicators (KPI) for the sustainability of building energy efficiency retrofit (BEER) in hotel buildings in China. Facilities 2012, 30, 432–448. [Google Scholar]
- Lai, J.H.; Hou, H.C.; Chiu, B.W.; Edwards, D.; Yuen, P.L.; Sing, M.; Wong, P. Importance of hospital facilities management performance indicators: Building practitioners’ perspectives. J. Build. Eng. 2022, 45, 103428. [Google Scholar] [CrossRef]
- Luther, M.B.; Rajagopalan, P. Defining and developing an energy retrofitting approach. J. Green Build. 2014, 9, 151–162. [Google Scholar] [CrossRef] [Green Version]
- Escrivá-Escrivá, G. Basic actions to improve energy efficiency in commercial buildings in operation. Energy Build. 2011, 43, 3106–3111. [Google Scholar] [CrossRef]
- Mawed, M.; Tilani, V.; Hamani, K. The role of facilities management in green retrofit of existing buildings in the United Arab Emirates. J. Facil. Manag. 2020, 18, 36–52. [Google Scholar] [CrossRef]
- Lai, J.H.K.; Man, C.S. Performance indicators for facilities operation and maintenance (Part 1): Systematic classification and mapping. Facilities 2018, 36, 476–494. [Google Scholar] [CrossRef]
- Lai, J.H.K.; Man, C.S. Performance indicators for facilities operation and maintenance (Part 2): Shortlisting through a focus group study. Facilities 2018, 36, 495–509. [Google Scholar] [CrossRef]
- Lai, J.H.K.; Yuen, P.L. Identification, classification and shortlisting of performance indicators for hospital facilities management. Facilities 2021, 39, 4–18. [Google Scholar] [CrossRef]
- Corder, G.W.; Foreman, D.I. Nonparametric Statistics: A Step-by-Step Approach, 2nd ed.; Wiley: Hoboken, NJ, USA, 2014. [Google Scholar]
- Rodríguez, P.; Montequín, V.R.; Morán, H.; de Arriba, L. Gender influence in project management: Analysis of a case study based on master students. Procedia Comput. Sci. 2017, 121, 461–468. [Google Scholar] [CrossRef]
- Miller, A.; Higgins, C. Deep Energy Savings in Existing Buildings. ASHRAE Trans. 2015, 121, 380–394. [Google Scholar]
- Lai, J.H.K. Operation and maintenance budgeting for commercial buildings in Hong Kong. Constr. Manag. Econ. 2010, 28, 415–427. [Google Scholar] [CrossRef]
- Environmental Campaign Committee and Environmental Protection Department. Hong Kong Green Organisation Certification-Guidebook for IAQwi$e Certificate. Available online: https://www.hkgoc.gov.hk/uploads/2021%20IAQ-Guidebook_Eng_Clean.pdf (accessed on 16 August 2021).
- Bortolini, R.; Forcada, N. Facility managers’ perceptions on building performance assessment. Front. Eng. Manag. 2018, 5, 324–333. [Google Scholar]
- Kumar, U.; Galar, D.; Parida, A.; Stenström, C.; Berges, L. Maintenance performance metrics: A state-of-the-art review. J. Qual. Maint. Eng. 2013, 19, 233–277. [Google Scholar] [CrossRef] [Green Version]
- Lai, J.H.K. Maintenance performance: Examination of the computer-aided maintenance data of a large commercial building. J. Perform. Constr. Facil. 2015, 29, 4014118. [Google Scholar] [CrossRef]
- Charnes, A.; Clark, C.T.; Cooper, W.W.; Golany, B. A developmental study of data envelopment analysis in measuring the efficiency of maintenance units in the US air forces. Ann. Oper. Res. 1984, 2, 95–112. [Google Scholar] [CrossRef]
- Lai, J.; Yik, F.; Jones, P. Expenditure on operation and maintenance service and rental income of commercial buildings. Facilities 2008, 26, 242–265. [Google Scholar] [CrossRef]
- Amann, J.T.; Mendelsohn, E. Comprehensive Commercial Retrofit Programs: A Review of Activity and Opportunities; American Council for an Energy-Efficient Economy: Washington, DC, USA, 2005. [Google Scholar]
- Preiser, W.; Nasar, J. Assessing Building Performance: Its Evolution from Post-Occupancy Evaluation. Int. J. Archit. Res. 2008, 2, 84–99. [Google Scholar]
- National Research Council; John, H.C.; Federal Facilities Council Ad Hoc; Committee on Performance Indicators for Federal Real Property Asset Management; Jocelyn, S.D.; Division on Engineering Physical Sciences; Federal Facilities Council. Key Performance Indicators for Federal Facilities Portfolios; National Academies Press Publications Sales Office: Washington, DC, USA, 2005. [Google Scholar]
- Cripps, S. Calgary K-12 district benefits from the facilities management evaluation program. Facil. Manag. 1998, 14, 27,28,31,33. [Google Scholar]
- Saaty, T.L. The Analytic Hierarchy Process; McGraw-Hill: New York, NY, USA, 1980. [Google Scholar]
- Saaty, T.L. Theory and Applications of the Analytic Network Process: Decision Making with Benefits, Opportunities, Costs, and Risks; RWS Publications: Pittsburgh, PA, USA, 2005. [Google Scholar]
Publisher’s Note: MDPI stays neutral with regard to jurisdictional claims in published maps and institutional affiliations. |
© 2021 by the authors. Licensee MDPI, Basel, Switzerland. This article is an open access article distributed under the terms and conditions of the Creative Commons Attribution (CC BY) license (https://creativecommons.org/licenses/by/4.0/).