Abstract
The utilization of air conditioning in public and private buildings is continuously increasing globally and is one of the major factors fueling the growth of the global electricity demand. The higher utilization of renewable energy sources and the transition of the electricity-generating industry to renewable energy sources requires significant energy storage in order to avoid supply–demand mismatches. This storage-regeneration process entails dissipation, which leads to higher energy generation loads. Both the energy generation and the required storage may be reduced using thermal energy storage to provide domestic comfort in buildings. The development and utilization of thermal storage, achieved by chilled water, in a community of two thousand buildings located in the North Texas region are proven to have profound and beneficial effects on the necessary infrastructure to make this community independent of the grid and self-sufficient with renewable energy. The simulations show that both the necessary photovoltaics rating and the capacity of the electric energy storage system are significantly reduced when thermal storage with a chilled water system is used during the air conditioning season.
1. Introduction
Refrigeration cycles were developed in the latter part of the nineteenth century. Since then, engineering systems employing these thermodynamic cycles have proliferated, serving a variety of applications in food refrigeration and freezing, ice production, gas liquefaction, and air conditioning (A-C). In the first part of the twenty-first century, A-C systems have become required fixtures in the buildings of most developed countries and are quickly making inroads in the rest of the world. As a result, heating, ventilation, and air conditioning (HVAC) systems globally consume an increasing fraction of the total primary energy sources (TPES). Currently, in the USA, HVAC systems consume more than 35% of the country’s TPES and are expected to reach high fractions in several developing countries, particularly those in lower geographic latitudes, such as the Peoples Republic of China, India, Indonesia, the Philippines, and Brazil [1,2]. While the global TPES increased by 1.9% annually, the global electricity generation increased by 3.3%. The increased demand for A-C in both developed and developing countries is considered one of the primary contributors to this difference [3]. In the USA, the average demand for electricity for residential space cooling has surpassed the demand for heating and all other domestic uses and averages more than 16% of the total annual residential electricity consumption in the country [4]. The corresponding figure for the southern part of the USA is close to 30% [5].
A glance at the global map proves that most of the earth’s population lives in tropical, subtropical, and temperate regions, where the high temperatures make A-C usage necessary for domestic comfort during the hot seasons and continuously drive the local electricity demand to higher levels [3,5]. The higher A-C use in residential, public, and commercial buildings has two significant effects on electric power demand [2]:
- Peak power demand occurs in the summertime.
- Peak power demand occurs in the afternoon and early evening hours.
High power demand peaks are undesirable for the electricity-generating industry because:
- Less efficient generation units are brought in line, and electricity generation is more costly.
- Grid instabilities may follow.
- The companies that generate electricity (utilities in the USA) must maintain spare capacity to satisfy the peak power demand.
It must be noted that the impending higher temperatures caused by Global Climate Change (GCC) and the increasing reliance of our society on A-C for summertime comfort are expected to accelerate A-C usage both in the USA and globally and to create additional challenges for the electricity-generation industry [6].
The electricity-voracious A-C systems account for a high fraction of the electric energy demand in buildings during the summertime when temperatures are high [7]. At the same time, the solar irradiance also peaks (typically with a short time lag). Hence, a solution to the peak diurnal and seasonal electricity demand is to generate more electricity from solar energy. Generating more electric power locally from the abundant energy of the sun would also alleviate the strain on the central electricity generation and distribution systems in the regions where the A-C usage is growing. Solar power generated with photovoltaic (PV) systems is the most suitable method to locally generate electricity for commercial, public and residential buildings. The decreasing cost of PV systems in combination with manufacturing improvements indicates that, in the future, we will see significantly more electric energy generation from solar irradiance [2,8,9]. The other abundant renewable energy source, wind energy, has already proven to be commercially viable in several states. Wind turbines are increasingly used to generate renewable power for small communities/towns as well as for larger electricity grids [10,11,12,13].
Several national and regional governments have promulgated regulations and directives for the reduction of CO2 emissions in order to mitigate the impending Global Climate Change (GCC). These regulations call for the substitution of coal power plants with renewables, and some go as far as the substitution of all fossil fuel power plants. However, solar irradiance is periodically variable, and the wind velocity is intermittent. As a result, substituting fossil fuel power plants with renewable power generation units makes it necessary to develop significant energy storage infrastructure, which tends to be costly [14,15,16].
The higher penetration of renewables in electricity grids causes a commensurate decrease in the power demand for the non-renewable electricity generating units during the early morning hours—a time period when the A-C energy consumption is low, and the irradiance is very close to its (flat) peak. Figure 1 depicts the electric power demand in the San Antonio, Texas, area on a typical day in the summer. It is apparent that the demand exhibits a flat maximum in the afternoon hours when the temperature and A-C utilization are very high. The electric power demand in this area is currently satisfied by a combination of coal, natural gas, nuclear, solar, and wind power plants. The figure also depicts the power demand from the non-renewable energy sources if there was significant solar capacity addition in the area so that solar installations generated 10%, 20%, and 30% of the annual electric energy. In this case, the non-solar power units would have to reduce or altogether stop supplying power during the morning hours when the irradiance is high, and the A-C energy demand is still low, causing the total electric power demand to also be low. The higher penetration of the renewable PV-generated energy creates the so-called duck curve [17,18], and places severe constraints on the base-load units, and, especially, on the nuclear power plants, which operate with Rankine cycles that are difficult to adjust in short timescales but do not emit CO2, and are essential in the decarbonization of the electricity-generating sector [2,19,20,21].
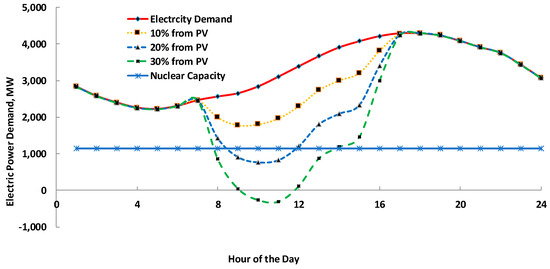
Figure 1.
The development of the duck curve in the supply of electric power, when solar energy supplies an increasing fraction of the total annual energy consumed.
The southern part of the USA, which is inhabited by more than 130 million people and has high A-C demand during the summer, is a prime example of the expected supply–demand mismatch. Zero Energy Buildings (ZEBs) are connected to the electricity grid and act as small, distributed, PV-generating units. The development of large numbers of ZEBs in a region has been proven to lead to a duck-curve-type electric power demand. The problems associated with such trends of demand are alleviated with the adoption and construction of Grid-Independent Buildings (GIBs). GIBs utilize distributed energy storage; they are not connected to the grid and do not affect the operation of the electric grid. A recent study on GIBs determined the solar panel area and the power rating that is needed as well as the energy storage (hydrogen) requirements for two buildings that are energy sufficient, located in Fort Worth TX and Duluth, MN [22]. This and similar studies concluded that a high fraction of the electricity generated by the PV cells in the GIBs is dissipated during the storage-regeneration process. The study also concluded that the improvement of the efficiencies of the systems used for the generation and storage of energy has significant effects on the needed infrastructure.
A high fraction of the stored energy in GIBs is used for the operation of A-C systems during the evening and night-time hours. Mitigation of the high energy dissipation during these hours and significant improvements of the GIB operation may be achieved with the development of systems for thermal storage (in this case, it would be “coolness storage”). Essentially, these systems use the surplus of electricity during the morning hours to chill water, store the water in large, insulated tanks, and pump the chilled water in the GIBs to ensure domestic comfort. It must be noted that such thermal storage for cooling is common for large buildings and groups of buildings in the southern part of the USA and is primarily promoted to flatten the peak electric power demand during the late and hot afternoons in the summertime: several hotel clusters, universities, clusters of office buildings, and airports produce and store chilled water during the night and morning hours. The stored chilled water is made available to the buildings during the peak-demand hours [2,23]. While there is some exergy loss in these thermal (coolness) storage systems during the relatively short time of storage, this exergy loss is significantly lower than the alternative of using stored chemical (or electrochemical) energy for the continuous operation of the A-C systems. It must be noted that chilled water systems for air conditioning have been studied and developed for several years. Recent studies in this area include the use of [24] and the application of nanofluids as the chilled coolant that would circulate in the buildings [25]. The current study does not examine or advocate new chiller technology but determines the energy storage requirements for the use of such chillers in a cluster of two thousand buildings.
In order to facilitate the transition to renewable energy, it is very likely that GIB communities will be developed as clusters of smaller buildings that utilize larger and more efficient systems for energy generation and storage and take advantage of any economies of scale. In addition, larger communities of GIBs will be able to utilize wind turbines and PV arrays (a combination of solar and efficiently generated wind energy) and accordingly optimize their generation and storage facilities [2,14]. This paper aims at the introduction of a hybrid storage system (hydrogen and thermal) that fulfills the electric energy requirements of a community of two thousand (2000) homes in North Texas. This is a prime region for renewable energy source utilization because the annually averaged irradiance is approximately 230 W/m2 and average wind velocities exceed 8.5 m/s. Electricity for this microgrid is generated by arrays of PV cells and a small number of wind turbines. Chilled water is produced when there is electric energy surplus; it is stored in insulated tanks and used to satisfy the cooling needs of the cluster of buildings. Hydrogen storage and fuel cells are utilized for all the other electricity needs of the buildings when the generated electric power is inadequate to satisfy the power demand of the 2000 buildings. The calculations reveal the characteristics of the two energy storage systems that would enable the cluster of the two thousand buildings to function independently of the electricity grid and only use renewable energy sources.
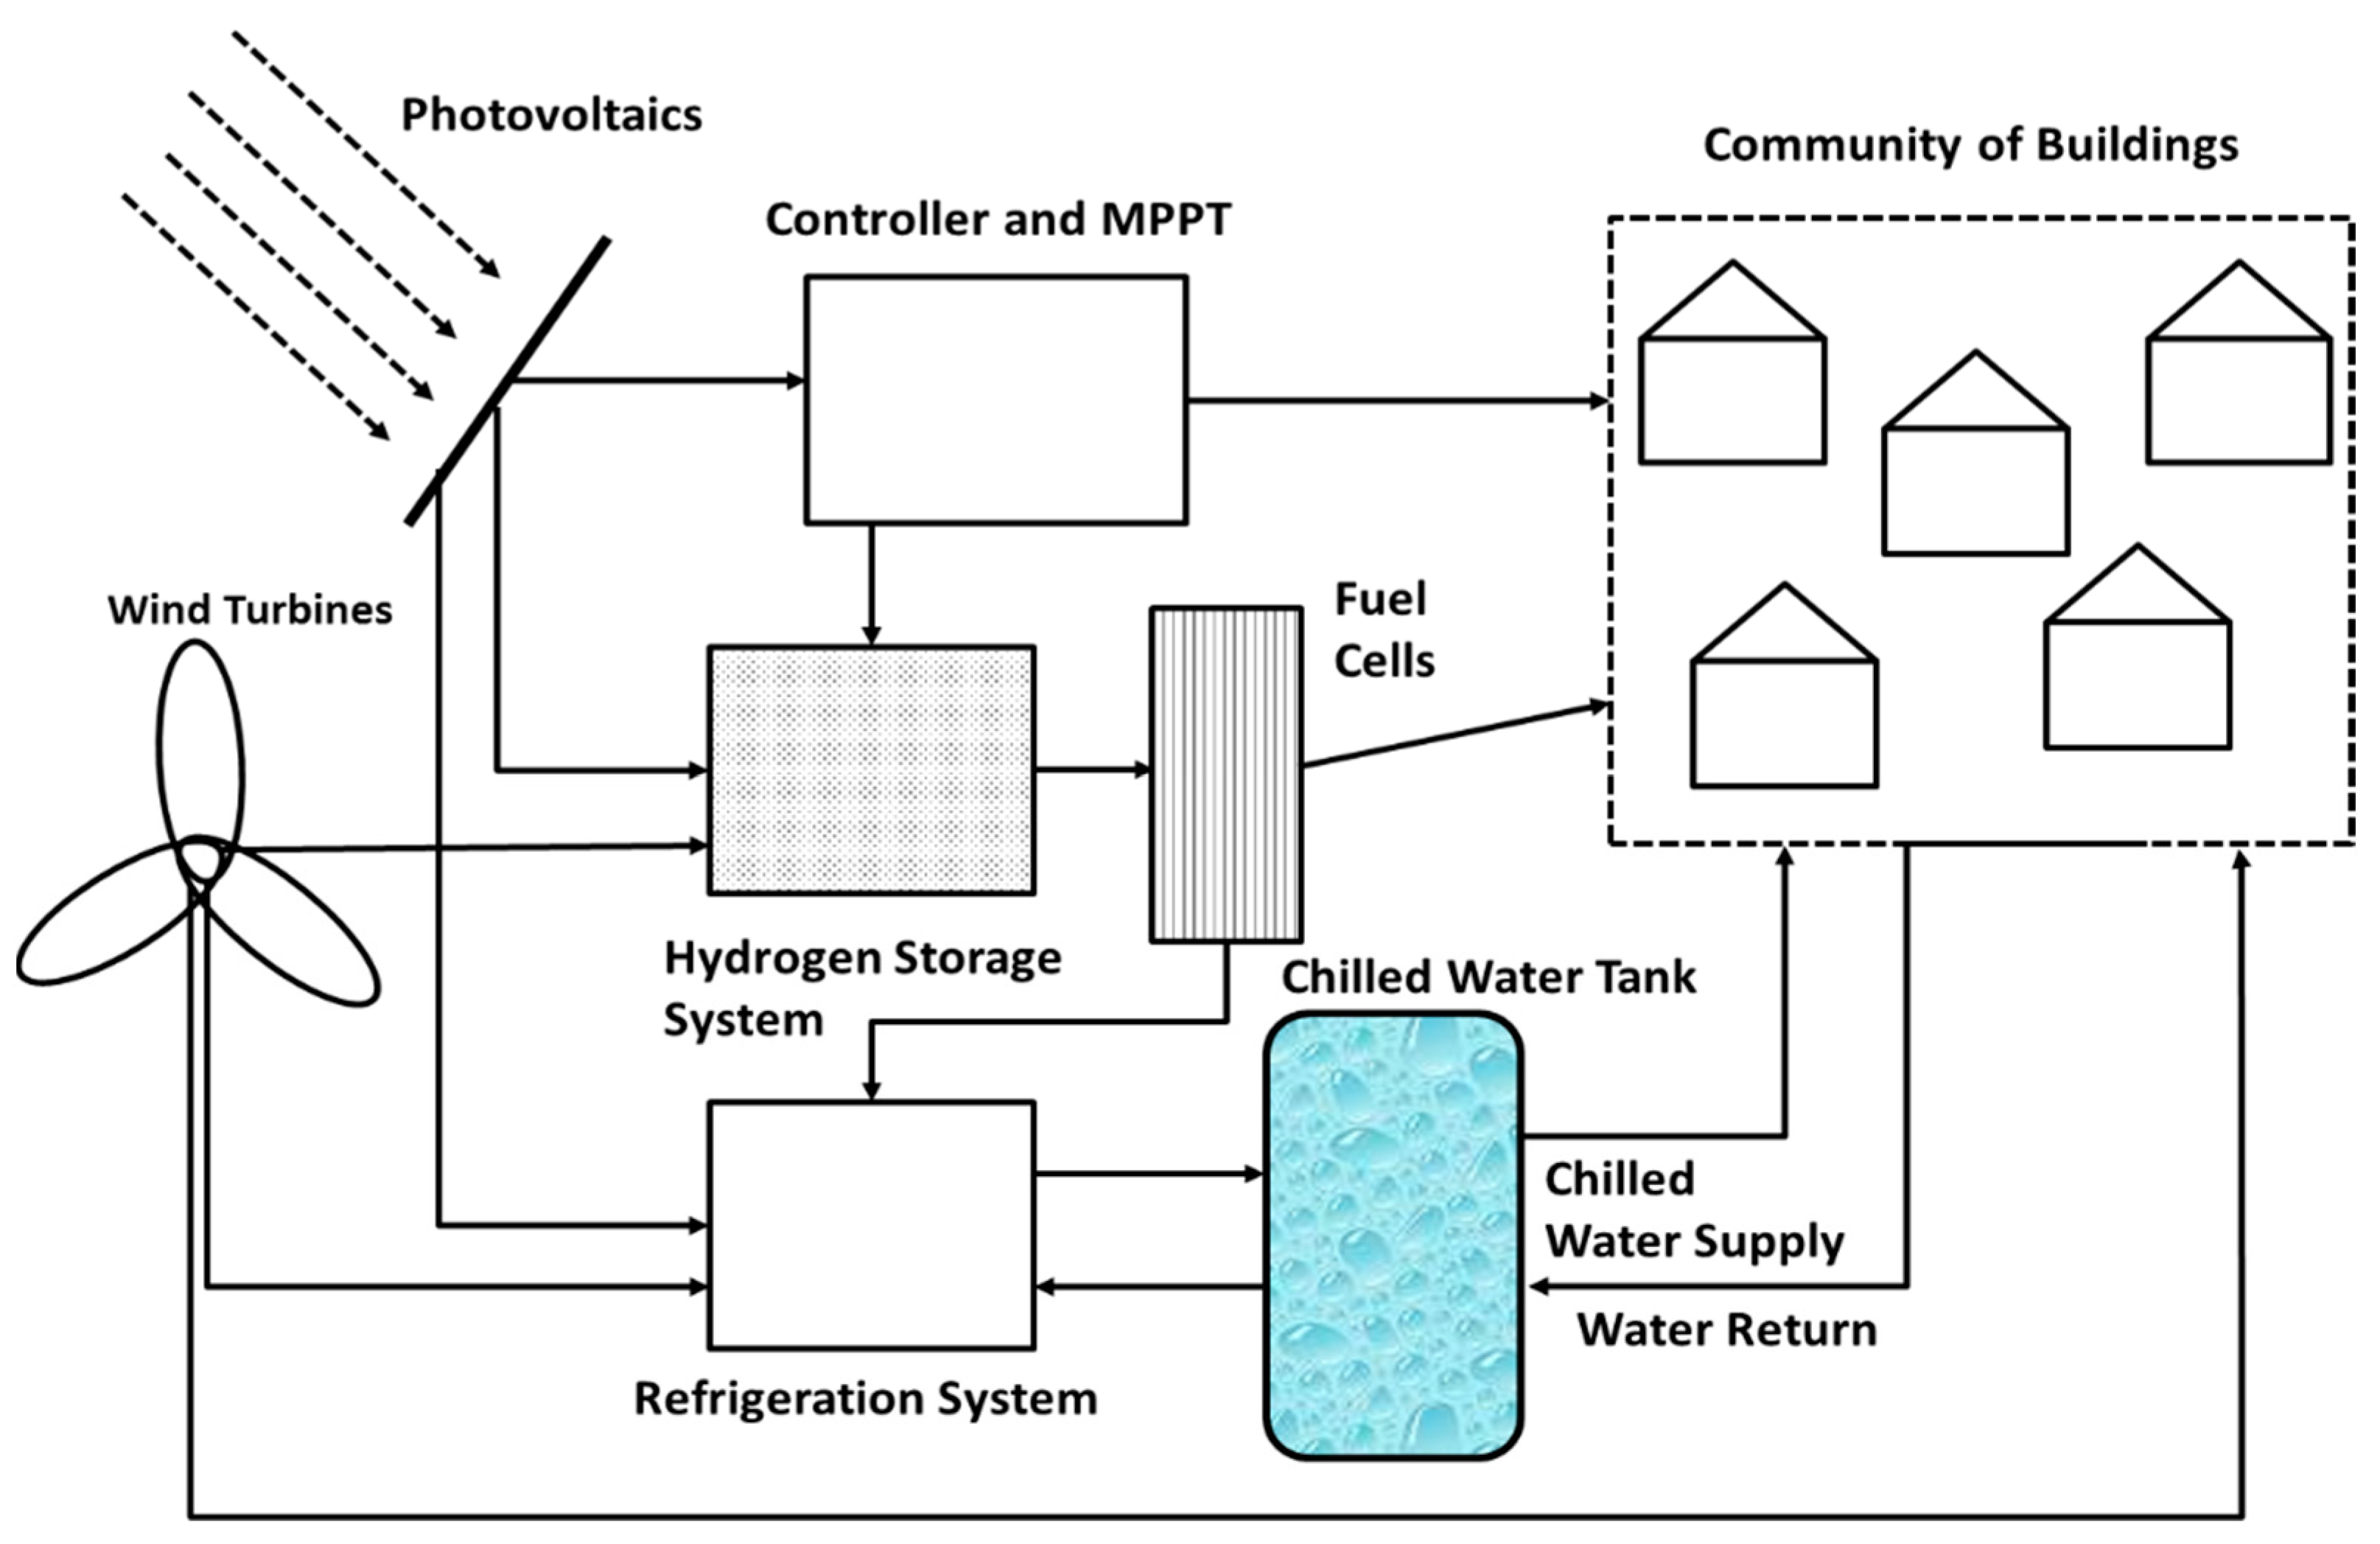
2. System Description
Thermal storage systems are complex and costly. For this reason, thermal storage systems have not been developed for individual households but for large buildings (hotels and commercial buildings) as well as clusters of larger buildings. For this study, a community of 2000 homes (the size of a small town) has been chosen in the North Texas area, an area rich in solar and wind resources. For the energy storage that is converted to electricity, a hydrogen system has been chosen. This choice was made because the region does not have any suitable geological formations for Pumped-Hydro Storage or Compressed-Air Energy Storage [26,27] and because battery storage is not suitable for the seasonal storage of energy—e.g., from winter and spring, when the winds are stronger, and there is a great deal of irradiance to the summertime, when A-C energy is needed. Figure 1 depicts the schematic diagram with the main equipment and systems that would make this community grid-independent: an array of PV cells and a small number of wind turbines supply all the energy needs for the community. Power controllers and a series of Maximum Power Point Trackers (MPPT) are installed to ensure maximum electric power generation by the solar arrays. Depending on the hourly supply and demand for power, the generated power is suitably directed to the community of the buildings, to the refrigeration system (for chilled water production), or to the electrolysis system, which produces the hydrogen and stores it in pressurized tanks. The demand of the cluster of buildings has first priority; the refrigeration system has second priority in the allocation of power. If there is any remainder, the energy is stored in a hydrogen storage system. It must be noted that actual systems to be developed may have a number of chilled water tanks and hydrogen tanks strategically placed among the buildings of the community to optimize the overall operation of the system.
When there is not sufficient energy supply from the PV arrays and the wind turbines, the community’s demand for power is satisfied by a system of fuel cells that convert hydrogen to electricity. It must be noted that there are several types of fuel cells that may be used, including the solid oxide fuel cells that operate at higher temperatures [28]. Information about the types and operation of the available types of fuel cells may be found in [29] and information on their applications in [27].
The refrigerator/chiller system operates and charges the chilled water tank during the hours in the morning, when the PV cells generate close to their maximum daily power and the A-C demand is lower. The water tank and the chilled water distribution system are well-insulated to minimize heat losses (actually “coolness losses”) to the surroundings. With this arrangement and distribution priorities, the refrigeration system almost always operates directly using the generated power of renewable energy sources. Thus, a great deal of the energy dissipation in the generation–storage–regeneration processes is avoided, the duck-curve phenomenon is minimized, and the hybrid storage system (hydrogen, chilled water) operates more efficiently than a single (hydrogen) storage system.
3. Governing Equations of the System
The energy inputs to the overall system of Figure 2 are solar and wind. At any time period (0, t), the electric energy generation from the PV arrays is given by the expression:
where the symbol denotes the total irradiance—the sum of direct and diffuse irradiance—on the PV systems; A is the total area of the PV panels; ηTi is the efficiency of the PV cells during the time period i; Δt is one hour, the timescale of the computations; and n is the time period of the PV array operation, in hours. Since the timescale is one hour, when the insolation is measured in W/m2, the total generated electricity is calculated in Wh.
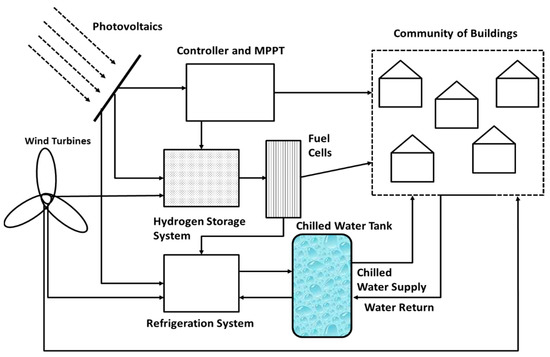
Figure 2.
Schematic diagram of the grid-independent community of buildings with hydrogen storage and thermal energy storage.
The efficiency of the PV cells is not constant and depends (rather weakly) on the ambient temperature. The efficiency of commercial PV cells drops with increasing temperatures, typically by one percentage point (0.01) for every 4–8 °C ambient temperature rise above 25 °C. Thus, the efficiency of the PV cells may be modeled by Equation [30]:
Typical yearly averaged values for the efficiency, η25, are in the range 15–22% and for the sensitivity coefficient, ksc, are in the range 0.001–0.005 °C−1 [26,31]. In this study, the values η25 = 20% and ksc = 0.0020 were adopted for two reasons: (a) the larger number of buildings implies bigger systems and higher availability of capital, which allows the purchase of more efficient PV cells; and (b) the recent technological advances and trends in photovoltaics [31] show that there are several types of PV cells in the market with efficiencies and sensitivity coefficients in these ranges.
Detailed tables on the hourly insolation and hourly temperature data for several locations in the North Texas region are available from the National Solar Radiation Database [32]. The five-year average data were computed from these databases to be used in the study. The averaging avoids the effects of large and weather-related temperature and insolation fluctuations—e.g., summer storms, dry spells, etc. The system of PV panels is stationary (this is typical of all the existing PV farms in the area). The PV panels face the southern direction and are positioned at an angle with the horizontal plane, 32°, which is approximately equal to the geographic latitude of the North Texas region [2]. Thus, the total hourly insolation, which is incident on the PV panels and is generated by both direct and diffuse radiation, is computed from the data in the national database [32].
For the wind energy contribution and the determination of the electric energy generated by the wind, turbines that have characteristics similar to those of the Vestas V120-2.2 turbines are envisioned. The choice of this type of wind turbine was made because of the following reasons:
They are medium-sized turbines and more suitable to supply energy to communities of buildings, where the small number of turbines used (0, 1, 2, or 3) is a parameter in the calculations.
Their rated velocity and other design parameters are a good fit for the wind characteristics in the region.
These turbines have a diameter D = 120 m. Among the available tower heights, a tower with H = 92 m was chosen, and this becomes the nacelle height used in the calculations. The cut-in velocity for the turbines is 3 m/s, the cut-out velocity is 20 m/s, and the rated velocity is 12 m/s, which implies that when the wind velocity is in the range 12 < V < 20 m/s, the turbines generate the rated power of 2.2 MW. When the wind velocity is between the cut-in and the rated velocity, the power produced by the wind turbine is determined by the expression [8,33]:
where is the electric power generated by a single wind turbine at a given hour, i; is the diameter of the wind turbine, is the efficiency of the turbine–generator system, is the air density, and is the average wind velocity at the nacelle/tower height during the hour i. The local wind velocity, V, was determined from hourly data obtained from the databases of the National Oceanic and Atmospheric Administration [34].
The timescale of all the computations is 1 h. During every hour, the electric energy demand of the community of buildings, EDi, is met either directly by the hourly energy generation of the wind and solar units or by the fuel cell system, which utilizes hydrogen storage. The energy demand of the refrigeration system is typically satisfied by the excess power generated by the combination of the PV array and wind turbine(s) during the early morning hours, when the A-C power demand is still low and solar irradiance is high. Thus, the refrigeration system directly utilizes any excess power generated to chill the needed quantity of water that would cool the buildings during the remainder of the 24 h period. Since heat losses are expected from the chilled water tank and the distribution system, the quantity of the chilled water is 10% more than the required amount for the cooling of the buildings. Effectively, it is stipulated for the calculations that the thermal storage system has a 10% heat leakage from the surroundings.
During all the hours of operation, when the hourly electric power generation from both the solar and wind systems is higher than the demand (the latter includes the energy used by the refrigerating system), the difference/surplus is converted by electrolysis to hydrogen energy and a new quantity of hydrogen is added to the hydrogen storage tank. During all hours, when the generation is less than the demand, the fuel cells consume some of the stored hydrogen to generate the deficit in demand–supply:
where EPi is the energy generation during the hour I, EDi is the energy demand by the entire community, and δESi is the change (surplus or deficit) of the quantity of the stored energy. At the end of the ith hourly time period, the hydrogen energy storage level, ES, becomes:
where ηel is the efficiency of the electrolysis and ηfc is the efficiency of the fuel cells. The efficiencies are used as parameters in the computations and are responsible for the energy dissipation in the storage–regeneration process.
The cooling season, which consists of the days when chilled water is produced and utilized to cool the community of the buildings, runs from 1 May to 15 October. To ensure system reliability at all times of the year, it was stipulated that the hydrogen storage tank must contain, at every hour of the year, enough energy to power the cluster of buildings and supply refrigeration power for a minimum of the following 240 h (ten days). This implies that the stored hydrogen energy level does not reach zero but always maintains a minimum quantity of hydrogen (and energy) to ensure the smooth operation of the microgrid. If the power generation systems fail or malfunction—e.g., after an extreme weather event, such as a severe summer storm, a tornado, or a winter polar vortex—the managers would have sufficient time for repairs in the system and/or to purchase additional hydrogen in the marketplace to ensure sufficient energy supply for the cluster [35]. Actually, this is an advantage of using energy storage: bad weather events that cause local or total electricity grid disruptions are significantly mitigated utilizing the stored energy.
Solution Procedure
With the timescale of calculations chosen as 1 h, the governing equations yield a system of 8760 algebraic equations of the type of Equation (5). The solution is achieved by iteration using periodic conditions with a time period of one year. Thus, at the end of the year (hour 8760), the entire system must revert to its original state. Therefore, at hour 8760, the hydrogen storage system contains the same mass of hydrogen it had at the beginning of the year (hour 1 of the calculations). With the number of wind turbines fixed, the iteration yields the nominal rated power of the PV system and the area of the solar cells. The steps of the iteration are as follows:
- A number of wind turbines (0, 1, 2, or 3) is stipulated for the supply of wind power. Based on this, the hourly wind power supply is computed for all the hours of the year.
- An amount of stored energy in hydrogen ES0 at the beginning of the first hour is assumed, and the first trial for area A for the PV system is assumed. The trial values are recorded in a spreadsheet that also includes the following: (a) the hourly A-C demand; (b) the total hourly electric energy demand; (c) the energy supply from wind and solar; (d) the level of energy storage in hydrogen.
- The stored energy in hydrogen at the end of the year, ES8760, is calculated and compared to the originally assumed value ES0. If ES0 < ES8760, additional energy generation is needed, and Aj is increased. If ES0 > ES8760, the PV cell area A is decreased.
- Step 2 is repeated with the new value of Ai until ES0 = ES8760. This determines the PV rating and the PV cell area required, A, for the annual electricity generation.
- With the area, A, determined, the correct value for ES0 is calculated in a second iteration using the minimum storage condition: on the hour when the storage level is at its minimum value, the entire system must have sufficient energy stored to satisfy the entire demand of the next 240 h (ten days), even when the two renewable energy sources generate no power.
The second part of the calculations entails the determination of the size (volume) of the chilled water tank(s). The refrigeration system cools the water—typically in the early morning hours—and the chilled water is stored in the tank(s) and is pumped in the buildings to supply “coolness” until the time when excess power is generated to be used in the chiller. Currently, there are several chilled water systems currently in operation and serve the cooling needs of hotels, office buildings, hospitals, universities, and airport terminals [23,25]. Because of their large scale, these cooling systems operate with more efficient refrigerator cycles (higher COPs) than systems in small buildings. Such systems are designed to reduce the peak electric power demand, they have been proven to be reliable and cost-effective, and they are often subsidized by the electricity-generating industry [36,37,38].
The volume of the chilled water needed is calculated by the following expression:
where Qday is the amount of heat to be removed daily from the cluster of buildings and includes the 10% heat leakage into the storage tank(s); c is the specific heat of water, 4.184 kJ/(kgK); ρ is the density of liquid water, 1000 kg/m3; and ΔT is the temperature difference between the chilled water and the warmer water return from the cluster of buildings. The latter is a system parameter typically in the range 10–15 K. For the calculations, a 12 °C temperature difference was stipulated, and the required capacity of the tank was determined from the maximum value of the daily heat transfer, Qday.
4. Results and Discussion
4.1. The Baseline—The Case without Thermal Storage
At first, a baseline was established with the community of buildings operating without any thermal storage. The system shown in Figure 2 was applied to the cluster of buildings without the option to store and use chilled water. Hydrogen storage and regeneration supplied the electric energy needs of the buildings during hours when the demand exceeded the generated power. The efficiency of the electrolysis system is 75%, and that of the fuel cells is 65%. Table 1 shows some of the important parameters for this base case. The columns correspond to the number of wind turbines that are employed for this cluster of buildings.

Table 1.
Important parameters for the community of 2000 GIBs without thermal storage.
It is apparent from the data in Table 1 that, as the number of wind turbines increases—and, hence, the contribution of solar energy decreases—the hydrogen storage capacity must be augmented. This occurs because solar irradiance is better correlated with higher temperatures and A-C usage. It also appears that there is a minimum in the annually dissipated energy, which appears when the two renewable energy sources contribute approximately equally to the annual electric energy demand, an observation also made in [39].
4.2. Effects of Thermal Storage
One of the significant advantages of the utilization of thermal energy storage in clusters of buildings is the adoption of larger and more efficient systems. The coefficient of performance (COP) of the refrigeration system used for the chilling of water is the parameter that best characterizes how efficient the operation of this system is. The average COP of the smaller systems now used in the region is close to 2.5. With larger and more efficient refrigeration systems, this number may be increased to 5 or even 7 if suitable Ground Source Heat Pump (GSHP) systems are used.
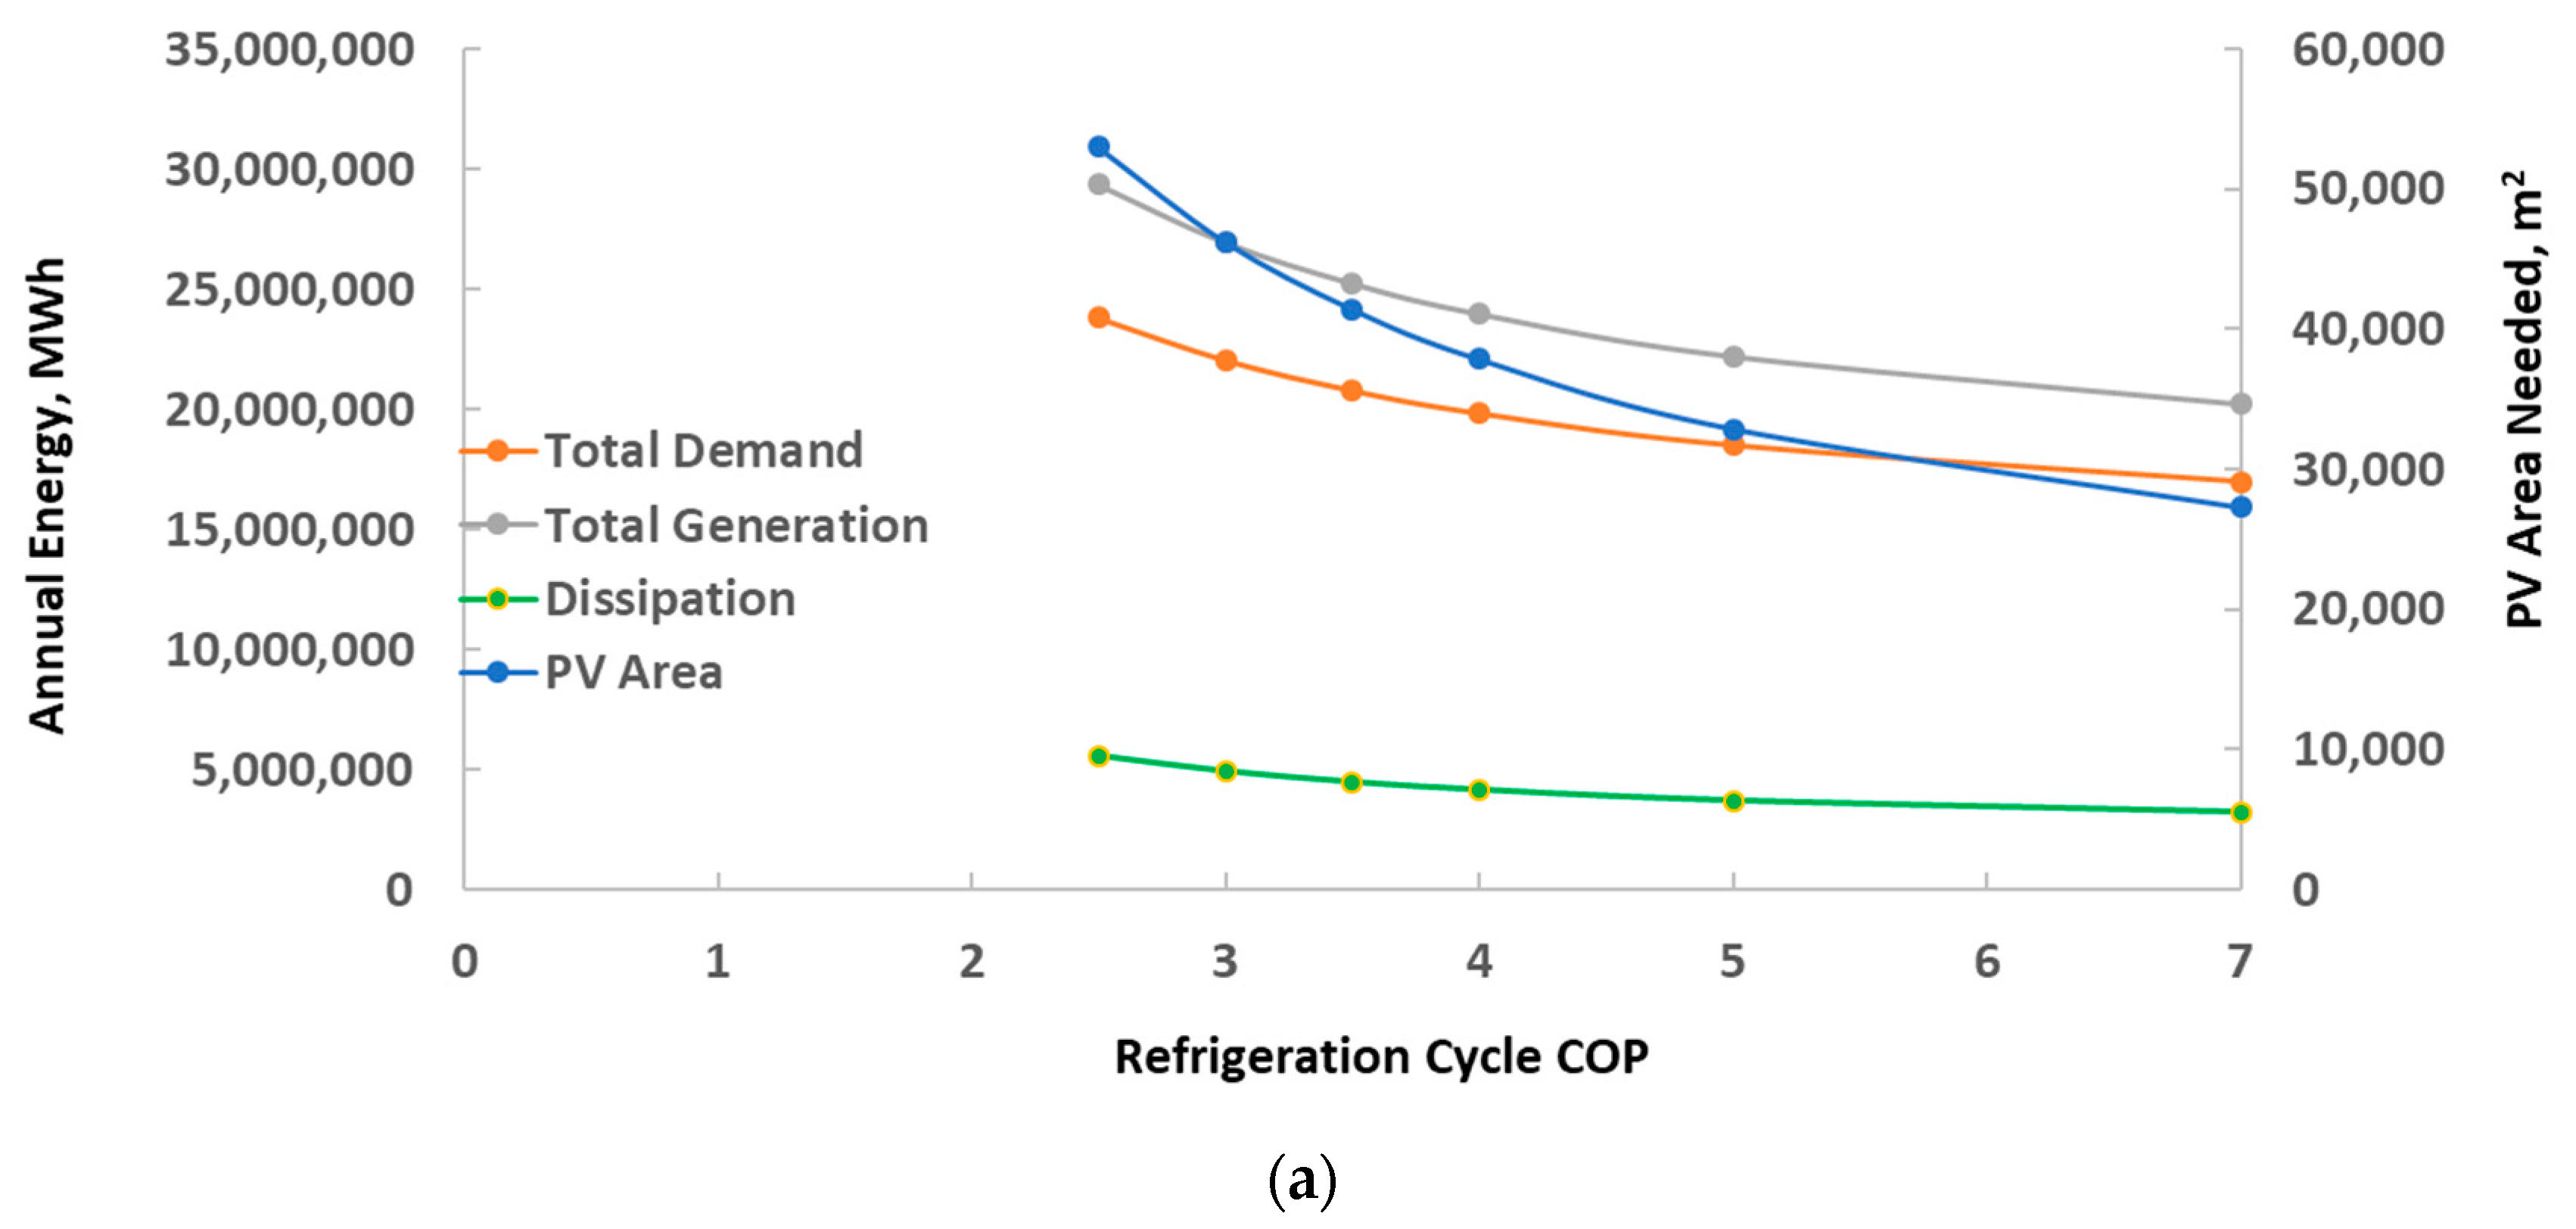
Calculations were performed with the COP of the chilling system as a parameter in the range of 2.5–7. It must be noted that when the average COP increases, the electricity consumption for A-C decreases, and so does the annual electricity demand in the cluster of buildings. Figure 3a,b depict the annual energy demand and supply, the annual energy dissipation, and the PV area needed for the solar part of the energy generation system, when the COP varies in the range 2.5 to 7 and when one or two wind turbines supply the wind part of the generation system. Calculations with the employment of three wind turbines were not conducted because three turbines would cause energy to over-supply at the higher values of the COP. It is observed in the two Figures that higher COP values significantly decrease the total annual demand for electricity, with corresponding decreases in the electric energy that needs to be generated and the annual dissipation of energy. It is also observed that (when the wind generation is constant) the PV requirements for the cluster of buildings significantly drop with the COP of the refrigeration cycle.

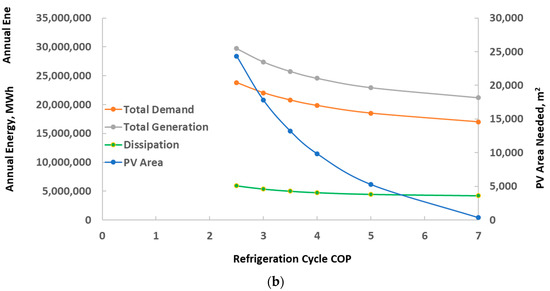
Figure 3.
(a) Photovoltaics area needed, annual energy demand, supply, and dissipation as a function of the COP when one wind turbine is employed. (b) Photovoltaics area needed, annual energy demand, supply, and dissipation as a function of the COP when two wind turbines are employed.
In all the cases, the required volume of the chilled water, as calculated from Equation (6), is 24,350 m3, approximately 12.2 m3 per household.
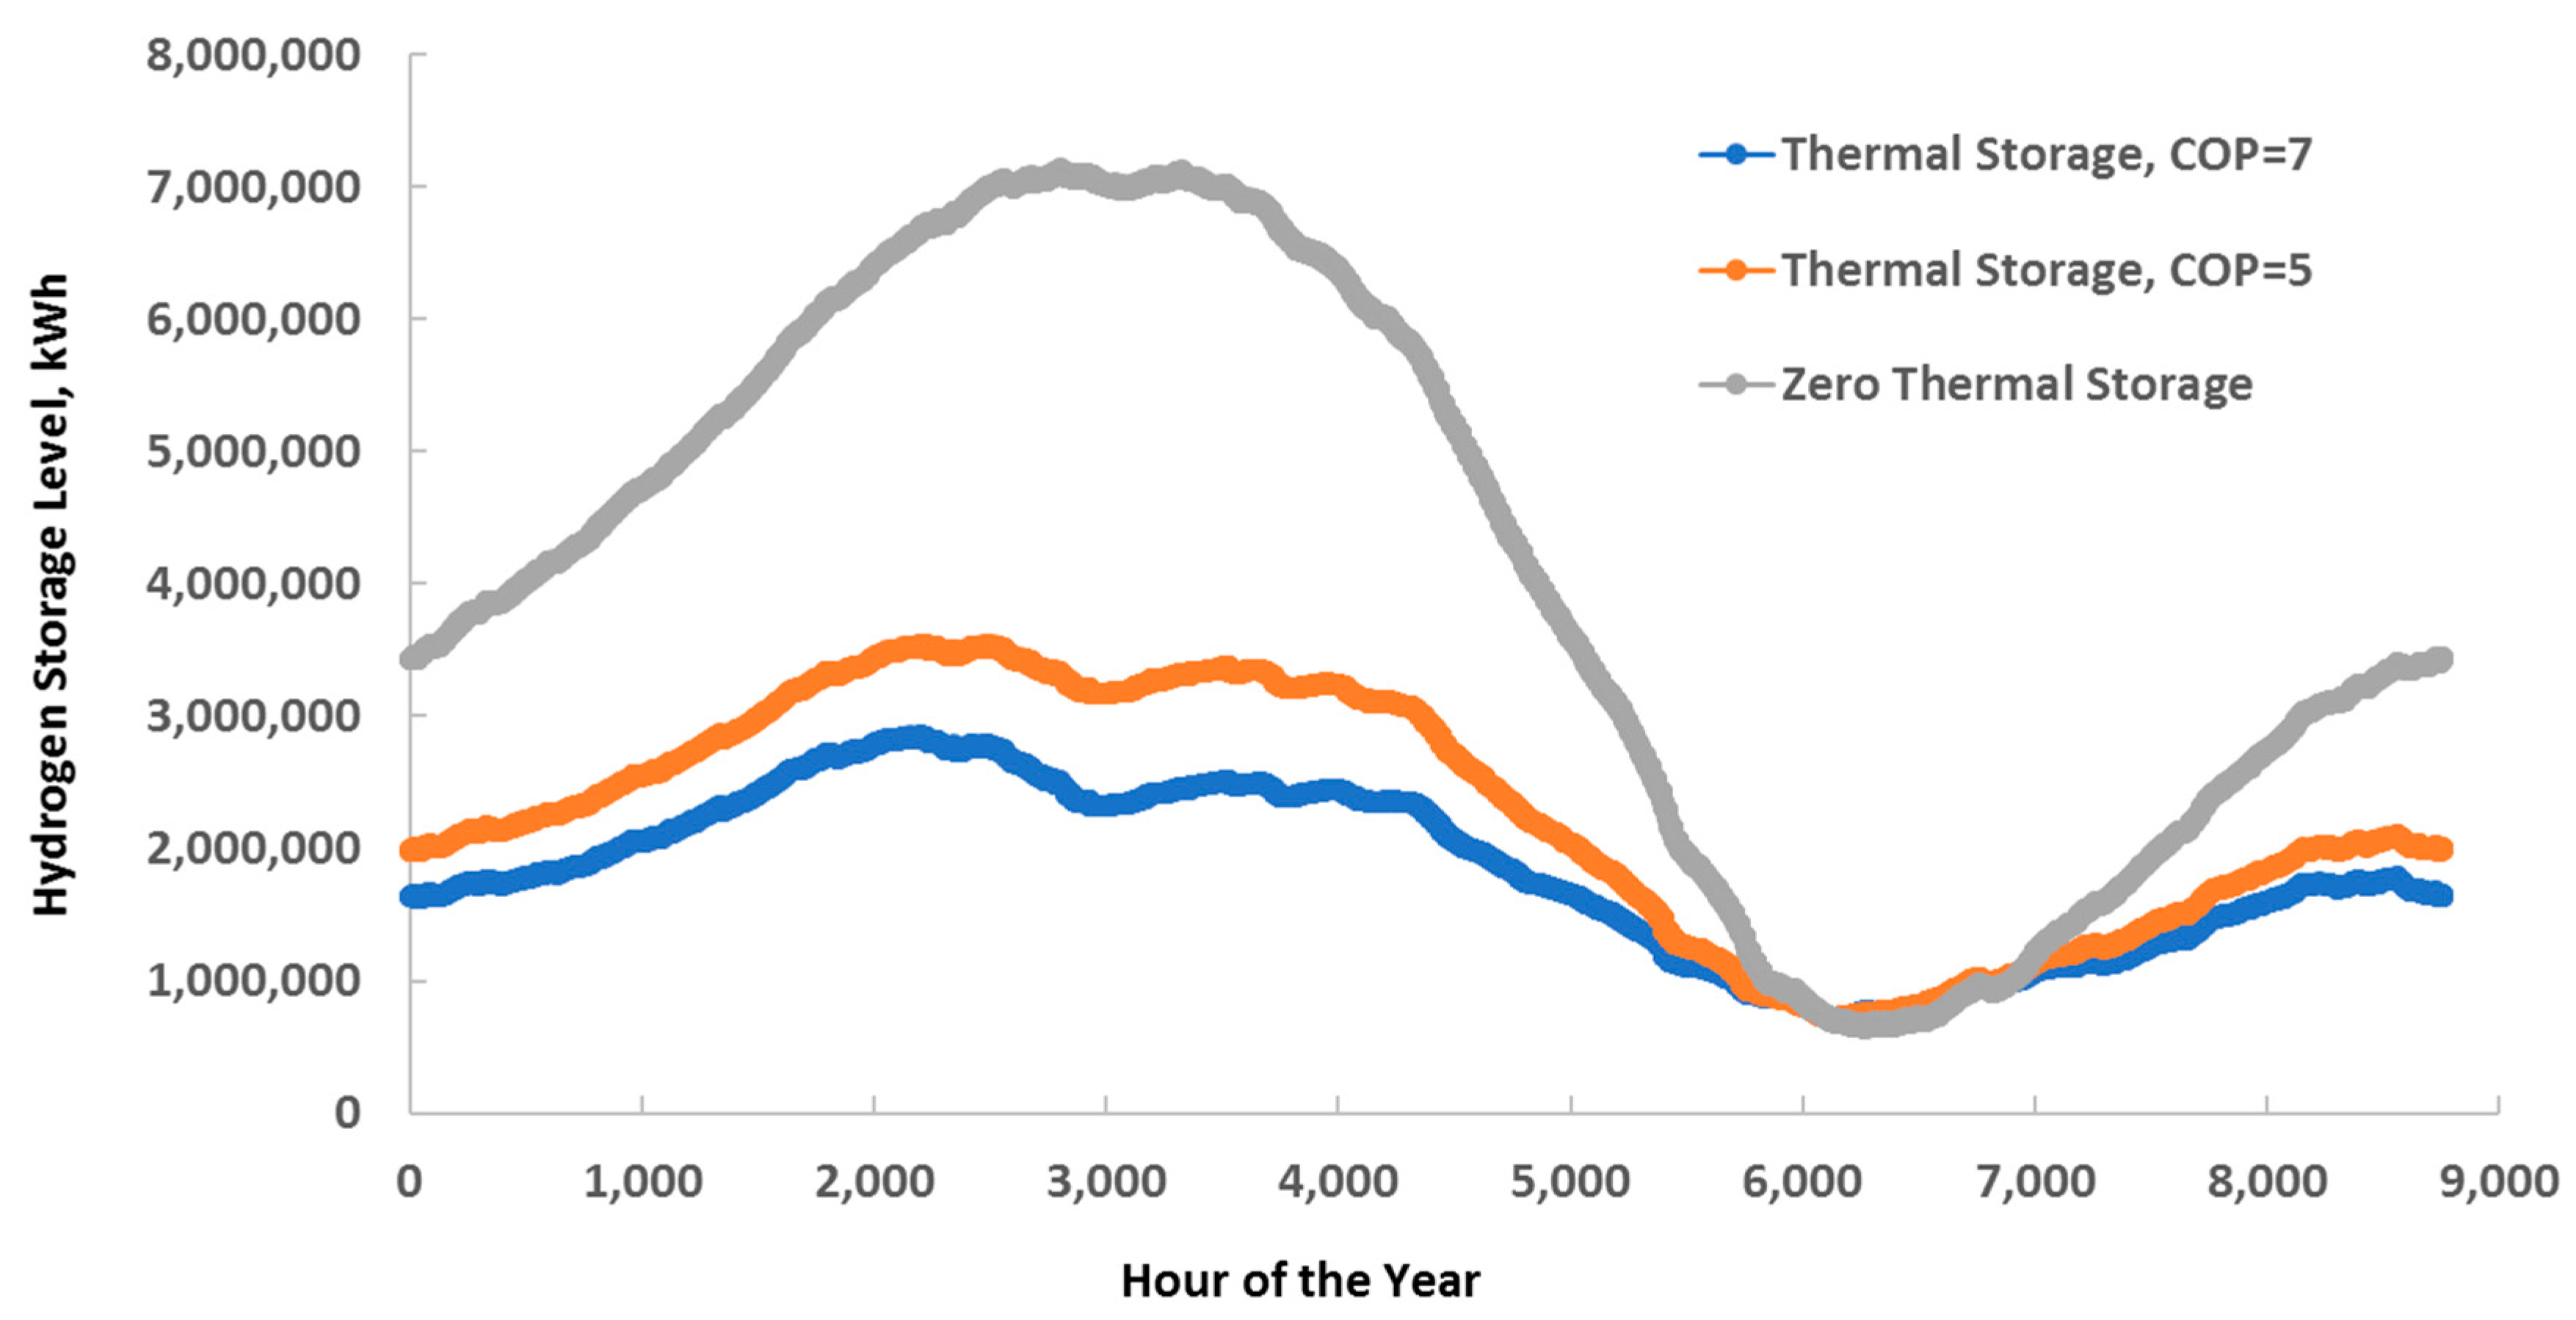
The hydrogen energy storage depends on the generated and consumed energy and is also a function of the COP. Figure 4 shows the effect of this variable on the energy storage required to ensure the cluster of buildings generates and stores sufficient energy to become grid-independent. It is apparent in Figure 4 that the COP of the water chiller has a profound and very positive effect on the overall need to store energy. It must be noted that more energy storage becomes necessary when two wind turbines serve the cluster because less solar energy is generated, and the latter correlates more with the energy demand. At 50 MPa and 300 K, the energy density of hydrogen is 1.03 MWh/m3. Therefore, when one wind turbine is employed, the needed storage tank corresponds to 1.4 m3 per household when COP = 7, and 1.7 m3 per household when COP = 5. The corresponding figure from Table 1 (in the absence of thermal storage) is 3.5 m3. One may conclude that the installation of thermal storage significantly reduces the amount of any other energy storage system needed.
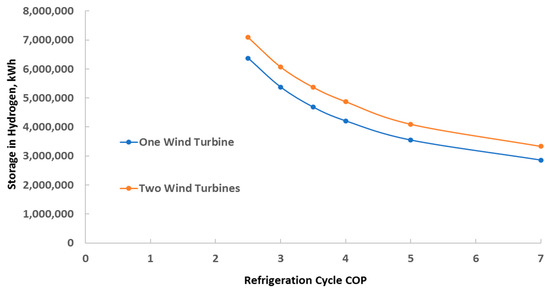
Figure 4.
Energy storage requirements for the cluster of the GIBs.
Figure 5 depicts the energy storage level at all hours of the year with and without thermal energy storage and for two COP values, 5 and 7. It is observed that thermal storage significantly affects the required storage capacity—the maximum in the three curves, which occurs close to the end of April. The minimum storage level is dictated by the constraint that the system always contains enough hydrogen to satisfy the entire electricity demand for the following ten days. This minimum occurs on dates between the middle and the end of September, when the A-C demand wanes.

Figure 5.
The level of hydrogen storage throughout the year with and without thermal energy storage.
It is observed from the last three Figures that centrally administered thermal storage systems, when applied to a community where the A-C usage is very high, have several profound and positive effects for the transition to renewable energy sources. The most important of these effects is energy conservation—the reduction of the annual electricity demand, which implies significantly less needed energy—and the lesser need for other kinds of energy storage, such as hydrogen. Table 2 highlights some of these effects for the case of one wind turbine utilization, and Table 3 highlights the same effects for the case of two wind turbines employed for this cluster of buildings.
Table 2.
The effect of thermal storage on key parameters for the conversion to renewable energy when one wind turbine is employed.
Table 3.
The effect of thermal storage on key parameters for the conversion to renewable energy when two wind turbines are employed.
It is observed from the data in Table 2 and Table 3 that thermal storage has a profound effect on the parameters that make up a large fraction of the cost of the transition of communities to renewable energy and their conversion to become grid-independent: for the case of one wind turbine installed, the area (and power rating) of the PV cells decreases by approximately 50% and the hydrogen storage capacity by 50–60%. For the case of two wind turbines, the area (and power rating) of the PV cells is almost eliminated, and the hydrogen storage is reduced by 45–55%. It must be noted that the construction and operation of suitable thermal energy storage systems (primarily consisting of pipelines, heat exchangers, and pumps) that would supply chilled water to the community of buildings entails known technology and is relatively inexpensive. As a result, the development of thermal energy systems that distribute chilled water to clusters of buildings will significantly reduce the costs for the transition to renewable energy sources.
5. Conclusions
The use of air conditioning systems is proliferating globally, and because it consumes very high amounts of electric power, it is strongly contributing to the significant growth of the global demand for electricity. Transition to solar and wind energy cannot be achieved by simply building more wind turbines and more PV solar cells without arranging for a great deal of the generated energy to be stored. The use of district cooling, thermal energy storage systems—which operate with chilled water, store this water daily, and use the chilled water to cool the buildings—has several significant and very beneficial effects for clusters of grid-independent buildings. Simulations with a cluster of two thousand buildings in the North Texas region—a region with excellent renewable energy resources that heavily utilizes A-C during the summer months and experiences very high peaks in electric power demand—show that the application of chilled water storage systems will have a profound and very beneficial effect on the transition of these buildings to a grid-independent community, entirely served by renewable energy. Among these beneficial effects are:
- The development of district cooling decreases the annual demand for electric energy by up to 27%.
- The total energy dissipation in the storage-regeneration process drops by almost 50%.
- The two parameters that make up a high fraction of the cost of renewable energy, the cost of PV arrays and the cost for electric energy storage (hydrogen storage in this case), are significantly reduced.
- Building clusters allow the employment of larger and more efficient refrigeration/chilling systems with high COPs, the prime parameter that determines energy savings.
Funding
This research received no external funding.
Institutional Review Board Statement
Not applicable.
Informed Consent Statement
Not applicable.
Data Availability Statement
Not applicable.
Acknowledgments
This research was partly supported by the W.A. (Tex) Moncrief Chair of Engineering at TCU.
Conflicts of Interest
The author declares no conflict of interest.
References and Note
- Waite, M.; Cohen, E.; Torbey, H.; Piccirilli, M.; Tian, Y.; Modi, V. Global trends in urban electricity demands for cooling and heating. Energy. 2017, 127, 786–802. [Google Scholar] [CrossRef] [Green Version]
- Michaelides, E.E. Energy, the Environment, and Sustainability; CRC Press: Boca Raton, FL, USA, 2018. [Google Scholar]
- International Energy Agency, Key World Statistics 2020; IEA: Paris, France, 2020.
- Available online: https://www.eia.gov/energyexplained/electricity/use-of-electricity.php (accessed on 1 October 2021).
- Available online: https://www.eia.gov/todayinenergy/detail.php?id=36692 (accessed on 1 October 2011).
- Lundgren-Kownacki, K.; Dalholm Hornyanszky, E.; Anh Chu, T.; Alkan Olsson, J.; Becker, P. Challenges of using air conditioning in an increasingly hot climate. Int. J. Biometeorol. 2018, 62, 401–412. [Google Scholar] [CrossRef] [PubMed] [Green Version]
- US-EIA (US—Energy Information Agency). Residential Energy Consumption Survey (RECS); EIA: Washington, DC, USA, 2011. [Google Scholar]
- Swanson, R.M. Photovoltaics Power Up. Science 2009, 324, 891–892. [Google Scholar] [CrossRef] [PubMed]
- Tapiador, F.J. Assessment of renewable energy potential through satellite data and numerical models. Energy Environ. Sci. 2009, 2, 1142–1161. [Google Scholar] [CrossRef]
- De Castro, C.; Mediavilla, M.; Miguel, L.J.; Frechoso, F. Global wind power potential: Physical and technological limits. Energy Policy. 2011, 33, 6677–6682. [Google Scholar] [CrossRef]
- Sailor, D.J.; Smith, M.; Hart, M. Climate change implications for wind power resources in the Northwest United States. Renew. Energy. 2008, 33, 2393–2406. [Google Scholar] [CrossRef]
- Mai, T.; Lopez, A.; Mowers, M.; Lantz, E. Interactions of wind energy project siting, wind resource potential, and the evolution of the U.S. power system. Energy 2021, 223, 119998. [Google Scholar] [CrossRef]
- Michaelides, E.E. Energy Storage and Installed Wind Capacity Requirements for the Substitution of Fossil Fuels in the Electricity Generation Sector. J. Energy Power Technol. 2021, 3, 18. [Google Scholar] [CrossRef]
- Leonard, M.D.; Michaelides, E.E.; Michaelides, D.N. Substitution of coal power plants with renewable energy sources—Shift of the power demand and energy storage. Energy Conv. Manag. 2018, 164, 27–35. [Google Scholar] [CrossRef]
- Zakeri, B.; Syri, S. Electrical energy storage systems: A comparative life cycle cost analysis. Renew. Sustain. Energy Rev. 2015, 42, 569–596, Corrigendum in 2015, 53, 1634–1635. [Google Scholar] [CrossRef]
- Headley, A.J.; Copp, D. Energy storage sizing for grid compatibility of intermittent renewable resources: A California case study. Energy 2020, 198, 117310. [Google Scholar] [CrossRef]
- Freeman, E.; Occello, D.; Barnes, F. Energy Storage for Electrical Systems in the USA. AIMS Energy. 2016, 4, 856–875. [Google Scholar] [CrossRef]
- Weber, M.E. Making Renewables Work. Mech. Eng. 2016, 138, 12–17. [Google Scholar]
- Ruth, M.F.; Zinaman, O.R.; Antkowiak, M.; Boardman, R.D.; Cherry, R.S.; Bazilian, M.D. Nuclear-renewable hybrid energy systems: Opportunities, interconnections, and needs. Energy Convers. Manag. 2014, 78, 684–694. [Google Scholar] [CrossRef]
- Van der Zwaan, B.C.C. Nuclear energy: Tenfold expansion or phase-out? Technol. Forecast. Soc. Chang. 2002, 69, 287–307. [Google Scholar] [CrossRef]
- Michaelides, E.E.; Michaelides, D.N. Impact of nuclear energy on fossil fuel substitution. Nucl. Eng. Des. 2020, 366, 110742. [Google Scholar] [CrossRef]
- Leonard, M.D.; Michaelides, E.E. Grid-Independent Residential Buildings with Renewable Energy Sources. Energy 2018, 148, 448–460. [Google Scholar] [CrossRef]
- Hodapp, R.T. Dallas/Fort Worth International Airport District Energy Plant Upgrades Project—Making More with Less. In Proceedings of the Sustainable Communities Conference, Dallas, TX, USA, 9–11 March 2009. [Google Scholar]
- Beniwal, R.; Srivastava, P. Energy efficiency analysis of all-variable chilled water based air-conditioning system. In AIP Conference Proceedings; AIP Publishing LLC: Baltimore, MD, USA, 2020; Volume 2259, p. 020021. [Google Scholar] [CrossRef]
- Okonkwo, E.C.; Al-Ansari, T. Parametric investigation of a chilled water district cooling unit using mono and hybrid nanofluids. Sci. Rep. 2021, 11, 19227. [Google Scholar] [CrossRef] [PubMed]
- Poullikkas, A. Optimization analysis for pumped ES systems in small isolated power systems. J. Power Technol. 2013, 93, 78–89. [Google Scholar]
- Michaelides, E.E. Thermodynamics, Energy Dissipation, and Figures of Merit of Energy Storage Systems—A Critical Review. Energies 2021, 14, 6121. [Google Scholar] [CrossRef]
- Corigliano, O.; De Lorenzo, G.; Fragiacomo, P. Techno-energy-economic sensitivity analysis of hybrid system Solid Oxide Fuel Cell/Gas Turbine. AIMS Energy 2021, 9, 934–990. [Google Scholar] [CrossRef]
- Michaelides, E.E. Alternative Energy Systems; Springer: Berlin/Heidelberg, Germany, 2012. [Google Scholar]
- Dubey, S.; Sarvaiya, N.J.; Sheshadri, B. Temperature dependent Photovoltaic (PV) efficiency and its effect on PV production in the world—A review. Energy Procedia 2013, 33, 311–321. [Google Scholar] [CrossRef] [Green Version]
- Cotfas, D.T.; Cotfas, P.A.; Machidon, O.M. Study of Temperature Coefficients for Parameters of Photovoltaic Cells. Int. J. Photoenergy 2018, 2018, 5945602. [Google Scholar] [CrossRef] [Green Version]
- Wilcox, S. National Solar Radiation Database 1991–2010 Update: User’s Manual; Technical Report NREL/TP-5500-54824; 2012. Available online: https://www.nrel.gov/docs/fy12osti/54824.pdf (accessed on 1 October 2011).
- Nelson, V. Introduction to Renewable Energy; CRC Press: Boca Raton, FL, USA, 2011. [Google Scholar]
- National Centers for Environmental Information. Available online: https://www.ncdc.noaa.gov/cdo-web/search (accessed on 21 May 2021).
- By now (2021) most states have established markets for hydrogen purchase.
- Pires-Leite, G.; Weschenfelder, F.; Araújo, A.; Villa-Ochoa, A.; Prestelo-Neto, N.; Andrea, K. An economic analysis of the integration between air-conditioning and solar photovoltaic systems. Energy Convers. Manag. 2019, 185, 836–849. [Google Scholar] [CrossRef]
- Kousksou, T.; Bruel, P.; Jamil, A.; El Rhafiki, T.; Zeraouli, Y. ES: Applications and challenges. Sol. Energy Mater. Sol. Cells 2014, 120, 59–80. [Google Scholar] [CrossRef]
- Zalba, B.; Marín, J.M.; Cabeza, L.F.; Mehling, H. Review on thermal ES with phase change: Materials, heat transfer analysis and applications. Appl. Ther. Eng. 2003, 23, 251–283. [Google Scholar] [CrossRef]
- Leonard, M.D.; Michaelides, E.E.; Michaelides, D.N. Energy storage needs for the substitution of fossil fuel power plants with renewables. Renew. Energy 2019, 145, 951–962. [Google Scholar] [CrossRef]


Publisher’s Note: MDPI stays neutral with regard to jurisdictional claims in published maps and institutional affiliations. |
© 2021 by the author. Licensee MDPI, Basel, Switzerland. This article is an open access article distributed under the terms and conditions of the Creative Commons Attribution (CC BY) license (https://creativecommons.org/licenses/by/4.0/).